Embed Size (px)
Citation preview
DISCOUNTING THE STANDARD MODEL:WHY THE RAMSEY MODEL
DOES NOT ADEQUATELY EXPLAIN CLIMATE CHANGE POLICY
Yangbo Du
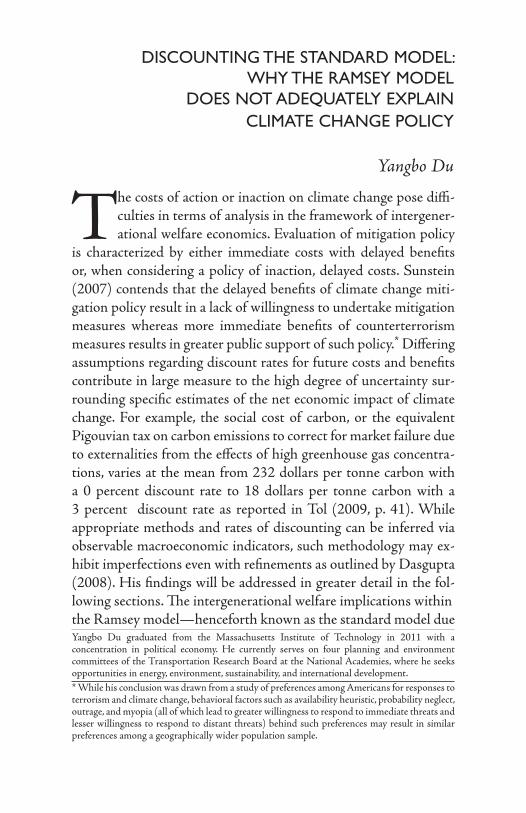
The costs of action or inaction on climate change pose diffi-culties in terms of analysis in the framework of intergener-ational welfare economics. Evaluation of mitigation policy
is characterized by either immediate costs with delayed benefits or, when considering a policy of inaction, delayed costs. Sunstein (2007) contends that the delayed benefits of climate change miti-gation policy result in a lack of willingness to undertake mitigation measures whereas more immediate benefits of counterterrorism measures results in greater public support of such policy.* Differing assumptions regarding discount rates for future costs and benefits contribute in large measure to the high degree of uncertainty sur-rounding specific estimates of the net economic impact of climate change. For example, the social cost of carbon, or the equivalent Pigouvian tax on carbon emissions to correct for market failure due to externalities from the effects of high greenhouse gas concentra-tions, varies at the mean from 232 dollars per tonne carbon with a 0 percent discount rate to 18 dollars per tonne carbon with a 3 percent discount rate as reported in Tol (2009, p. 41). While appropriate methods and rates of discounting can be inferred via observable macroeconomic indicators, such methodology may ex-hibit imperfections even with refinements as outlined by Dasgupta (2008). His findings will be addressed in greater detail in the fol-lowing sections. #e intergenerational welfare implications withinthe Ramsey model—henceforth known as the standard model due
* While his conclusion was drawn from a study of preferences among Americans for responses to terrorism and climate change, behavioral factors such as availability heuristic, probability neglect, outrage, and myopia (all of which lead to greater willingness to respond to immediate threats and lesser willingness to respond to distant threats) behind such preferences may result in similar preferences among a geographically wider population sample.
Yangbo Du graduated from the Massachusetts Institute of Technology in 2011 with a concentration in political economy. He currently serves on four planning and environment committees of the Transportation Research Board at the National Academies, where he seeks opportunities in energy, environment, sustainability, and international development.

105Journal of Politics & Society
to its widespread use in macroeconomic analysis—are tested against empirical evidence from advanced economies. Importantly, this test demonstrates that an alternative explanatory framework may be necessary for better accounting of impacts from climate change and optimal mitigation policies. Alternatives to the stan-dard model have undergone refinement in recent years from ad-vances in psychological economics, from which ‘bounded rational-ity’ and time inconsistency in discounting inferred from controlled laboratory experiments can be applied readily to public policy eval-uation.* While the focus is on the relationships between market indicators and aggregated decision-making in the form of national savings (or investment if equivalence between the two is assumed), realistically, it might be necessary to incorporate non-economic in-dicators into benefit-cost analysis even if internalizing all externali-ties would, in principle, ensure the adequacy of an analysis limited to market observables.
!e most visible impact of differences in choice of discount rates lies in the optimal price of carbon emissions. Higher discount rates lead to lower present values of the benefits of lower green-house gas concentrations in the atmosphere and, in turn, lower op-portunity costs of not emitting carbon; the reverse is true for lower discount rates. Any specific climate policy recommendation—from those promoting a ‘business-as-usual’ trajectory to those promot-ing aggressive mitigation in the immediate future—can be justified via some particular set of values for relevant parameters as demon-strated in Guo et al. (2006), Tol (2009), and Anthoff, Tol, and Yohe (2009a, 2009b), which makes separating climate policy evaluation from value judgements stemming from individual or societal per-spectives impossible. !is paper, which provides a backward-look-ing framework for evaluating future strategies to deal with anthro-pogenic climate change, is not intended to provide any definitive
* In Dasgupta and Maskin (2005), a study of time inconsistency in discounting involving preferences of starlings and pigeons demonstrated that given uncertain outcomes of alternative choices, longer time horizons tend to favor patience and shorter time horizons tend to favor impatience due to evolutionary pressures. It is worth exploring whether having longer time horizons cause decisions favoring strong action against climate change to dominate those favoring inaction or weak action.

106 �(Y������(MWGSYRXMRK�XLI�7XERHEVH�1SHIP
judgment of the means of ensuring intergenerational equity in pol-icy analysis or the optimality of any particular method of discount-ing; rather, its empirical component is geared toward opening up avenues for future research in the welfare aspects of mitigating cli-mate change.* In a similar vein of argument to that of Tóth (2000), there is no presumption that benefit-cost analysis with discounting is necessarily a proper means of evaluating climate change mitiga-tion policy, but rather an extension of theoretical arguments pro-posed by Dasgupta (2000, 2009), who has raised concerns about the efficacy of intergenerational welfare economics in addressing issues to which it is directed: empirical data to test the validity of the standard model and to examine its underpinnings in practice.† "e practical aspects of the findings from our exercise rely on the presumption that the standard model is a valid descriptor of inter-generational welfare economics. "ere is ample evidence from both theory and practice to substantiate claims that the standard model is of limited applicability in questions of intergenerational welfare, and the plausible nature of such claims is highlighted in this paper.‡ Arguably, one can interpret the empirical argument of this paper, while focused on discounting, as justification for finding alternative methods of evaluation.
ANALYTICAL FRAMEWORK: THE STANDARD MODEL
"e Ramsey equations are used in this paper for determining optimal savings decisions according to the standard model in con-tinuous time. "e parameter definitions in this section, originally put forth by Ramsey (1928), are loosely adapted from those by
* Among many sources arriving at similar conclusions, Karp and Tsur (2007), who derived ‘efficient’ discount rates over time via a game-theoretic approach, maintained that quantitative analysis of policy-making could not be expected to resolve policy disagreements given inherent value judgements reflected in the structure of any economic study.† Dasgupta (2008) concludes: “Intergenerational welfare economics raises more questions than it is able to answer satisfactorily” (p. 167). "is assertion served as the main impetus behind the writing of this paper.‡ While challenges to the standard model abound in studies on the economics of climate change and intergenerational welfare from behavioral or other non-neoclassical perspectives, for reasons of scope, here they are not scrutinized to the extent done so for the standard model.

107Journal of Politics & Society
Dasgupta (2008) and Levhari and Srinivasan (2009) to provide a clear basis for our analysis while maintaining relevance to the scope and objective of this paper. !at the economy consists only of ra-tional, maximizing actors with constant elasticity of inter-temporal substitution (CEIS) utility ensures the consistency of this model in principle; deviations from this and related assumptions are dis-cussed later in this paper. Save for some changes in definitions of parameters, the standard model underlying the author’s analyses is fundamentally identical to the model employed in Dasgupta (2008).
Formally, the equation for determining the social discount rate is expressed in its deterministic form in (1),
(1) ρ = δ + ηg in which ɏ is the social discount rate, Ɂ is pure rate of time pref-erence, Ʉ is marginal elasticity of inter-temporal substitution or marginal aversion to inequality, and g is growth in future output or income.* !e pure rate of time preference can be treated as a quantification of consumer impatience, and higher growth leads to higher discount rates to the extent that the elasticity of inter-temporal substitution is positive. !is is typically true since con-sumption smoothing over one’s lifetime causes current consump-tion to rise in response to a permanent increase in expected future disposable income. All rates are expressed in per-capita terms and compounded continuously. In its stochastic form, the equation for social discounting becomes (2),
(2) = δ + η − /2 ρ g η2σ2g
* Ambiguity persists in finding a proper definition of g. Some sources including Dasgupta (2008) define g as growth in consumption. Whether growth of consumption or growth of income is more suitable for use in the Ramsey equations depends on whether preferences are revealed ex post or decisions are formed based on future expectations; consumption lags income if the latter case applies. One might inquire whether households assign greater weight to expected future consumption or expected future income when attempting to smooth consumption, since if the social discount rate represents returns to consumption, per capita consumption growth is more appropriate of a definition of g. Alternatively, there is a plausible case for defining g as per capita income growth when considering that higher expected future income leads to higher discount rates, which in turn heightens propensity toward consumption. It is implied in this paper that consumption changes in response to income, henceforth providing a stronger rationale for defining g as growth in income (normalized for working population and working hours).

108 �(Y������(MWGSYRXMRK�XLI�7XERHEVH�1SHIP
in which g is future growth as an expected value, ρ is the risk-free social discount rate (analogous to the definition of risk-free return on investment in finance literature, and equivalent when perfect in-formation is assumed), and ɐg is the standard deviation of growth. All random variables mentioned in this paper are assumed to be log-normally distributed. !e effect of elasticity of inter-temporal substitution on the discount rate now depends on mean and vari-ance of growth rates. Because households and firms are assumed to be risk-averse and exhibit precautionary saving behavior, volatility in economic output dampens consumption growth, even as higher income growth promotes it. Savings rates follow directly from the social discount rate and its determining variables. When growth is deterministic, the savings-output ratio s can be calculated via (3),
ሻݎߟሻȀሺߜെݎൌሺݏ (3) in which r is interest rate defined as the opportunity cost of capital in equity or debt markets. Higher levels of consumer impatience, as represented by Ɂ, depress savings, and higher opportunity costs of capital raise savings by rendering investment more attractive relative to consumption, albeit in diminishing increments up to an upper limit of 1/Ʉ. It makes no difference whether one uses the market interest rate or the social discount rate as long as capital markets are perfect, but due to imperfections in capital markets, it is reasonable to expect considerable discrepancies between market rates and social discount rates. If growth and market interest rates are stochastic, the savings-output ratio can be determined via (4),
(4) s = ( − δ)/(η ) + (η − 1) /(2 ) r r σ2r r
in which r is the risk-free return on investment and ɐr is the stan-dard deviation of return on investment. !is expression accounts for precautionary saving in response to uncertainty over future states of the economy, explicit in the second term. All analyses pre-sented in this paper are based on the stochastic Ramsey equations.
In this paper, at best, a proxy for social discount rates can be defined since their determinants cannot be as easily quantified as

109Journal of Politics & Society
rates of return in capital markets. Whereas capital compensation relative to built capital stock provides easily an observable indica-tion of market interest rates, returns to consumption would be an analogous indicator of social discount rates. Monetizing the re-turns to consumption is a topic beyond the scope of this paper.* Instead, one can consider social returns as returns to all factors of production as opposed to returns to built capital only.
METHODOLOGY
!e key exogenous parameters in the standard model—the pure rate of time preference and the elasticity of inter-temporal substitution as used in previous economic analyses of climate change by Cline (1992), Stern (2006), and Nordhaus (2007)—are estimated by using long-term trends in savings, growth, interest rates, and returns to capital stock. !e applicability of the stan-dard model used for discounting climate change is then examined by comparing actual savings rates and those implied by discount rates derived from observed market behavior. Growth, interest, and return rates reported in this study should be compounded contin-uously as defined in Section II, and thus differ (albeit slightly in most cases and more so with higher rates) from rates reported on an annual compounding basis. !is adjustment enables simplifying calculations while maintaining accuracy.†
Data on economic indicators used in this study were accessi-ble online via the EU KLEMS Growth and Productivity Accounts, the International Financial Statistics (IFS) database through UN-data, and the EarthTrends—Economics, Business, and the Envi-ronment database. !ese databases were projects of the European Commission, the International Monetary Fund, and the World
* Given the necessity of making value judgments when assigning pecuniary value to non-pecuniary objects (happiness and pleasure for instance), it may not be possible even in theory to monetize utility accurately and impartially.† Section II of this paper contains all symbolic definitions related to the Ramsey equation for discounting. For example, deriving real interest rates using continuously compoundable figures requires only that one subtract inflation from nominal interest; application of log rules demonstrates the equivalence of this calculation to dividing the annual interest (or discount) factor by the annual inflation factor.

110 �(Y������(MWGSYRXMRK�XLI�7XERHEVH�1SHIP
Resources Institute (WRI), respectively.* !e EU KLEMS Basic and Additional files contained data in panel time series arranged according to country and industry; details have been documented by O’Mahony and Timmer (2009). Datasets from IFS and Earth-Trends were presented in panel format by country and year of ob-servation, and in time series format by country or bloc, respectively. To facilitate running the regressions described in this section, all data taken directly from the original datasets or derived from raw measurements were formatted as time series by country and cal-endar year, and reported as annual aggregates, annual averages, or year-on-year indices in the cases of savings, returns, and growth respectively. Only countries listed in the 2009 releases of the EU KLEMS basic and extended datasets were included in the analysis, thus limiting the geographic scope to only the twenty-five Euro-pean Union member states as of 2007—no data were published for Romania and Bulgaria, which joined the EU that year—plus Aus-tralia, Japan, South Korea, and the United States.† Savings, growth, and real interest rate parameters were assumed to be exogenous and were thus estimated via univariate auto-regressive integrated moving average (ARIMA) forecasting models with exact maxi-mum likelihood estimators.‡ !e only exception lies with the dis-aggregated figures for natural, built, and intangible capital, which exist only for the year 2000. Discount rates on consumption were directly calculated from these figures by dividing gross national in-come per capita over total capital per capita, both with and without the inclusion of natural capital stocks. !at future macroeconomic performance is consistent and reflective of past performance was a crucial assumption underlying the choice of ARIMA regres-
* WRI gathered data from the World Bank, the United Nations Statistics Division, and the Organisation for Economic Co-operation and Development when compiling its searchable database. Descriptions of methodology are accessible via web link from the data output page.† Time series data for Canada, while contained in the EU KLEMS database, were not published in the most recently updated version. Canada was omitted from the analysis to maintain consistency within the sample.‡ Successful estimation of the ARIMA models for interest rates and savings rates require that the time series converge, which was the case with the data set used in this paper. !e convergence parameters, which indicate convergence if absolute value is less than one, are listed under ‘Phi’ in the tables along with savings and interest rates produced via the models.

111Journal of Politics & Society
sion. While the long time horizon of data analysis mitigates ef-fects of business cycles and other economic fluctuations on regres-sion output, regression results do not account for developments not observed in the past, with adverse economic consequences of catastrophic climate change being among the most relevant to this study. No seasonal adjustments were deemed necessary due to the annual and year-on-year reportage of data.
Savings rates as used in this study are gross national savings rates as published by the World Bank and the World Resources In-stitute.* !ese time series consist of gross national savings, defined as total saving by households, firms, and governments, reported as a proportion of gross national income (GNI) from 1970 to 2006 or during a shorter period within this date range depending on avail-ability of figures as specified in section IV of the appendix under “Savings-output ratio.” To determine the long-run behavior of sav-ings rates, an ARIMA regression of autoregressive order of one and zero differencing and moving average orders was run for each time series of savings rates, hence an AR1 model.
Model 1. (t) − s(t − 1) = s Φs µs
ARIMA(1,0,0) for savings-output ratio s; µs as mean, Ȱs as auto-regressive coefficient
Labor productivity as expressed in gross value added per hour worked was chosen for representing expected future levels of con-sumption. !is measurement confers the advantage over gross na-tional income measurements of not being augmented or depressed by changes in labor force size or changes in total hours worked. No loss of non-working or leisure time is necessary if an agent ex-pects income to increase at the rate of labor productivity growth. Furthermore, labor productivity is constrained by technology only whereas income per capita and gross income fall under constraints of not only technology but also time and labor force size. !e basis of growth forecasts therefore consisted of logs of labor productivity indices reported in EU KLEMS, which were already normalized to 1995 levels of 100, since 1970 or the earliest available year up * Country-level data is identical in compilations by either entity.

112 �(Y������(MWGSYRXMRK�XLI�7XERHEVH�1SHIP
to and including 2007 or the latest available year. !e number of data points present in each country’s series is listed in section IV of the appendix under “Labor productivity.” ARIMA regressions for labor productivity were then conducted using a differencing order of one and autoregressive and moving average orders of zero, hence a random walk.
Model 2. = (t) − (t − 1) µg YLP YLP
ARIMA(0,1,0) for mean labor productivity growth µg; YLP as index of labor productivity
Risk-free real interest rates were inferred from nominal in-terest rates on long-term (ten- to thirty-year) government bonds and price level indices. Periods of high inflation coupled with high nominal interest rates thus do not skew the data in any way.* Nominal interest rate time series were accessed from the United Nations database of financial indicators, and price level time se-ries were published in the EU KLEMS database for the twenty-nine countries contained therein. !e dataset spanned years 1971 through 2006, and count of data points for each country’s series is displayed in section IV of the appendix under “Real interest rate.” Taking natural logs of annual interest and inflation factors adjusts the published figures for continuous compounding and simplified calculation as described earlier. Long-term trends were forecast us-ing ARIMA regression with autoregressive order of one and differ-encing and moving average orders of zero, hence an autoregressive AR1 model.
Model 3: (t) − r(t − 1) = r Φr µr
ARIMA(1,0,0) for interest rate r; µr as mean, Ȱr as auto-regressive coefficient
!ree different expressions were produced for returns to * It is plausible that households respond to nominal interest rates due to money illusion, in which inflation is not properly taken into account as is done in the case of real interest rates. While it is assumed in this study that real interest rates are the only relevant measure in order to be consistent with the standard model, further study of this phenomenon will be necessary in order to refine models of discounting across very long time horizons. Furthermore, periods of very low or negative real interest rates can be attributed to high inflation in many cases, so the results will still take into account inflationary expectations.

113Journal of Politics & Society
capital: returns to built capital only, returns to all forms of capital, and returns to all forms of capital other than natural capital. !ese figures serve as a guide for expected returns to equities if applied to the aggregate economy rather than to individual sectors or firms. In the first case, one obtains a ratio by dividing total capital compensa-tion by total built capital stock. Data on thirteen of the twenty-nine EU KLEMS countries were available, with count of data points specified in section IV of the appendix under “Returns to built capital.” !is measure indicates only the capital compensation real-ized in a particular year regardless of the exact year during which the initial investment was made. Overestimation of the economy-wide returns to equities is therefore likely, so the rate of returns to built capital was set as an upper bound for actual such rates. !e latter two means of calculating returns to capital attempts to take all capital into account. Assuming that GNI represents the inter-est earned on the gross national capital stock, the rate of return to capital can be derived by dividing GNI per capita over the sum of natural, built, and intangible capital (human capital and other ‘invisible’ forms of capital) per capita. It is assumed that all returns to labor stem from human and all other capital inputs expressed as unit labor productivity. Alternatively, if it is assumed that built and intangible capital already accounts for GNI derived from natural capital, the rate to capital may be expressed as the ratio of GNI to the total built and intangible capital stock. !is assumption, how-ever, is questionable if natural capital is valued by itself and not for the utility of converting it to produced capital; regardless, such figures are still produced under this assumption for purposes of comparison. Data for returns to capital were insufficient for fitting ARIMA models with exact maximum likelihood estimators, so the average rates of return to built capital in the future were assumed to be similar to those from the 1970s to the 2000s, as the data-set provided no substantiation for expecting significantly higher or lower long-term average rates of return. Exact figures for GNI and capital for the year 2000 were used in deriving pure rates of time preference and optimal savings rates from the alternative measure-ments of returns of capital. !at 2000 was a boom year for most of

114 �(Y������(MWGSYRXMRK�XLI�7XERHEVH�1SHIP
the advanced economies in our sample may warrant setting future expected returns to all capital lower, but there are currently no data to justify such an adjustment.*
ANALYSIS AND DISCUSSION
Our parameter estimation exercise has yielded indicators of discount rates that are reasonably strong to the extent that the standard model is applicable. Mean labor productivity growth rates produced via the univariate random walk regression of labor pro-ductivity are identical to the means presented in Table I.2 under “Labor productivity growth.” Output from the AR1 regressions for real risk-free interest rates and savings rates are displayed in Tables II.1 and II.2, respectively. Listed alongside the coefficients and standard errors in Tables II.1 and II.2, statistical significance of the estimates of long-run behavior of savings, interest, produc-tivity, and returns to capital were quite high in general, albeit con-siderably less so for interest rates than for the other measures. Of all twenty-nine countries in the EU KLEMS dataset, seventeen of them exhibited a strong long-term constant trend in real interest rates upon applying a ninety percent confidence interval. With a narrower 95 to 99 percent confidence interval, 15 and 13 percent of those countries, respectively, still retain a statistically significant mean forecast interest rate. Savings rate data exhibited higher sig-nificance of forecast mean and estimated autoregressive coefficient, as shown in Table II.2. "e highest significance occurred within the dataset for labor productivity; no p-critical value exceeded 0.0001 (in the case of Greece – all other p-critical values were negligible).
"eoretical outcomes for savings, pure rate of time prefer-ences, and marginal aversion to inequality proposed in Dasgupta (2008) are compared to outcomes determined via empirical evi-dence. Results do not appear to be consistent with mechanisms in
* To quantify the costs and benefits of mitigating climate change more precisely will require additional gathering of data on natural and intangible capital and the value of goods and services from them as well as existence value (in the case of preserving ecosystems for purposes other than economic benefit); development and refinement of methods for quantifying non-economic value will be necessary for such an endeavour.

115Journal of Politics & Society
the standard model. Note in Table II.1 how discounting accord-ing to risk-free long-term interest rates leads to extremely high and sometimes impossible levels of saving, particularly for countries where average real interest rates on government bonds are negative or very low due to various combinations of high inflation and loose monetary policy.
To test the consistency of the standard model, derived sav-ings rate from returns to capital were regressed against actual (ob-served) or forecasted (via Model 3) savings rate using ordinary least squares with robust estimators as follows, with s representing ac-tual or forecasted savings-output ratio.
= βs smodelˆ!is regression serves as a test of the null hypothesis that there is no correlation between the derived savings-output ratio and the observed or forecast measures. It should be interpreted exclusively as a test of how well savings-output ratios derived via the stan-dard model match with observations and forecasts from empirical evidence, not as an indication of any causal relation between the observed or forecasted values and the derived values. !is test is confined to the three measurements of returns to capital in order to avoid implausible (in some instances impossible) outcomes as produced by deriving optimal savings-output ratios from discount rates based on real risk-free interest rates. !ese savings figures are displayed according to country in the column “Risk-free interest rate” in Table III.1, and mean, forecasted, and derived savings-out-put ratios according to the three measurements of returns to capital are likewise listed in the three subsequent columns. !e estimates of coefficients of sample mean savings with their standard errors are summarized here.
Returns to built capital only: Ⱦmean = 1.02399, error = 0.0812020
Returns to all human capital (built and intangible):

116 �(Y������(MWGSYRXMRK�XLI�7XERHEVH�1SHIP
Ⱦmean = 2.16151, error = 0.202101 Returns to all capital (including natural): Ⱦmean = 2.35495, error = 0.203824
!e Student’s t-test results all suggest p-values extremely close to zero, leading to a rejection of the null hypothesis that there is no relationship between observed savings-output ratios and those de-rived from the standard model. It is plausible that observed sav-ings behavior follows closely with that implied by returns to built capital, as demonstrated graphically in Chart III.1. !e forty-five degree line is shown as a rough approximation of the relationship in the built capital only case since its coefficient is not statistically different from zero according to the regression output. Coefficient estimates from regressing against forecasted savings were very simi-lar and exhibited similarly-low p-values, and inferences similar to those for the regressions against observed savings apply to this case as well, with Chart III.2 serving as graphical demonstration.
Returns to built capital only: Ⱦforecasted = 0.995170, error = 0.0797258
Returns to all human capital: Ⱦforecasted = 2.10703, error = 0.191045
Returns to all capital: Ⱦforecasted = 2.30881, error = 0.194475
While a strong correlation between derived savings and actu-al savings was found regardless of metric for returns to capital, only the relation involving savings derived from returns on built capital tended toward a slope of unity; the other two metrics appear to produce savings twice that of actual savings. !is finding implies a pure rate of time preference from 4 to 12 percent per year given 1.5 as the elasticity of inter-temporal substitution, considerably higher than the 1.5 percent rate adopted by Nordhaus (2007). While the evidence from capital compensation time series imply higher dis-

117Journal of Politics & Society
count rates for benefit-cost analysis of climate change, it should be noted that inter-temporal decision-making related to capital investments may not necessarily carry an intergenerational com-ponent. Major capital investments are comparable to medium and long-term (five- to thirty-year) government bonds in terms of risk, whereas a time horizon of a century or more is necessary to account for the effects of long-lived greenhouse gases in the atmosphere. Mitigation, however, would have to be implemented within a much shorter time frame to account for long delays in climate response to human activity, so the return rate to built capital may serve as a reasonable basis for discounting near-term benefits and costs of near-term mitigation projects. Lower discount rates are appli-cable to longer time horizons since higher cumulative risk reduces certainty-equivalent discount rates relative to those expected over shorter time horizons; a hyperbolic or step-declining discounting schedule may be more realistic than that implied in the stochastic Ramsey model (Weitzman, 2001; Gollier and Weitzman, 2010). "e evidence, viewed in its situational context, lends credence to assertions that discount rates ought to vary according to circum-stance—a standard protocol for discounting leads to lack of con-text sensitivity—and that seeking any single ‘correct’ discount rate is inadequate for addressing the complexity of climate change miti-gation and its ramifications (Price, 2005).
Given the difference in time horizons for climate mitigation investments and most other business decisions, including natural or intangible capital in calculating real rates of capital compen-sation, could potentially result in a more realistic benchmark for discounting costs and benefits of climate policies. Estimates of returns to all capital stock, which are available only for the year 2000 and thus may not be representative of rates of return in the long run, are produced in Table I.1. With the case for Latvia as an exception, excluding natural capital increases the rate of return by no more than 10 percent since natural capital constitutes less than 10 percent of capital stock for each country analysed (11 percent for Latvia); these modified estimates are higher than actual returns if the proportion of total returns attributable to natural capital is

118 �(Y������(MWGSYRXMRK�XLI�7XERHEVH�1SHIP
more than negligible.Parameters for pure rate of time preference are displayed in
Table III.2 based on figures for marginal aversion to inequality produced in Evans and Sezer (2004, 2005). !e values for inequal-ity aversion parameters were determined by the progressiveness of income tax structures in the surveyed countries. Higher values for this parameter are plausible, as demonstrated by Hall (1998) and Dasgupta (2008), based on consumer behavior or, in the context of catastrophic events due to climate change, strong aversion to un-certain risks. Since marginal aversion to inequality and elasticity of inter-temporal substitution are equivalent according to the stan-dard model, it is assumed here that households consider income redistribution among current selves to be no different from income redistribution between current and future selves, in spite of argu-ments to the contrary. Dasgupta (2008) recommended assuming higher levels of marginal aversion to inequality due to very high uncertainty regarding the impact of climate change in the distant future. Even if pure rates of time preference are in fact as high as those implied by returns to built capital, a sufficiently high level of marginal aversion to inequality will raise precautionary saving dramatically, even above unity.
Such results demonstrate an inconsistency in the standard model: addressing inter-generational welfare issues such as global climate change. Apparently, returns on built capital form the basis of aggregate savings decisions according to this author’s tests, whereas using a metric for social returns as the basis for finding an optimal savings-output ratio results in two-fold overestimation of actual savings. Parameter values often cited in the economic evaluation of climate change mitigation imply optimal savings even greater than those derived via the social returns metric. While the predicted val-ues for savings-output ratio overestimated or underestimated the actual figures by wide margins in some cases as indicated in Table III.1 and Charts III.1 and III.2 despite a statistically significant correlation between observed or forecast savings rates and derived savings rates, the exercise suggests that social discount rates for an-alysing climate policy using a descriptive approach are bounded be-

119Journal of Politics & Society
low by interest rates on risk-free government bonds and bounded above by rates of return to built capital. It can also be argued that preferences for future consumption among future consumers are not equivalent to current consumers’ preferences regarding own fu-ture consumption, thus warranting a distinction between intragen-erational and intergenerational welfare when conducting benefit-cost analyses of long-term climate policy alternatives. If one intends to maintain equity across generations, lower discount rates, pos-sibly with zero pure rate of time preference, can be justified for the intergenerational welfare case (Azar, 1998, pp. 306–09). Negative pure rates of time preference as implied by some results in Table III.2, which is based on lower rates of return to investment, ap-pear consistent with high levels of uncertainty over future climate change. Such situations may occur under conditions of sufficiently high marginal aversion to inequality and sufficiently low rate of re-turn given a reasonable rate of long-run productivity growth. On one hand, one may propose that, since the Ramsey equation and its related expressions are used to derive optimal savings-output ratios, the observed figures not be used in such calculations since agents may not be making optimal decisions as reflected by market observables. On the other hand, the consistency of long-term sav-ings trends as suggested by the raw data series can be interpreted as evidence of optimality of savings decisions according to individual preferences; this claim would hold under assumptions of maximiz-ing behavior among agents in the economy. "ere is ample empiri-cal evidence however, that economic agents do not always exhibit maximizing behavior but rather ‘satisfycing’ behavior. Such behav-ior describes decision-making that leaves them at some threshold of utility at which they are ‘satisfied’, perceiving no need or ability to increase their utility further due factors including but not lim-ited to information constraints. "e possibility of sub-optimality of savings based on private returns is open to further investigation.
It is noteworthy to compare our derivations of pure rates of time preference with those calculated according to life expec-tancy trends in Brent (1993), reported in Table III.2. "ese life expectancy discount rates (LEDRs) reflect the long-term annual

120 �(Y������(MWGSYRXMRK�XLI�7XERHEVH�1SHIP
rate of change in life expectancy. More rapid improvement in life expectancy corresponds to a higher LEDR. Since life expectancies have been increasing in all sample countries, LEDRs will always be positive as long as the trend of increasing life continues for the fore-seeable future.* With a few exceptions, the pure rates of time pref-erence derived from market observables were considerably higher than those derived from life expectancy trends. When combined with the marginal rates of aversion to inequality proposed in pre-vious studies, optimal savings rates will likely be far higher than those observed among EU KLEMS data.
!e findings in this analysis corroborate assertions by Tóth (2000) that discounting, at least in its most widely utilized form, leads to internal inconsistencies in the evaluation of intergenera-tional welfare impact of climate change, as well as the conclusion by Dasgupta (2008) that intergenerational welfare economics as a subfield cannot adequately address the questions it poses. Savings rates and pure rates of time preference derived from the standard model diverge from those observed empirically. Lower rates of sav-ings in the returns to built capital is the only case that corresponds to higher implied pure rates of time preference. Lower empirically determined pure rates of time preference and empirically deter-mined marginal aversion to inequality together lead to exaggerated and sometimes implausibly high rates of saving. Hyperbolic dis-counting provides a limited means of reconciling these outcomes, but cannot completely eliminate problems associated with account-ing for intergenerational inequity; a positive discount rate inevita-bly leads to assigning a negligible value to generations beyond some future point in time. It is nevertheless possible to construct a rea-sonably equitable discounting schedule via a descriptive approach based on the gathered data. Being unable to determine a single internally consistent discount rate, one can argue for discounting
* While this assumption is generally true, counterexamples can potentially be found when taking into account recent life expectancy trends in areas of Africa with high incidence of HIV/AIDS, provided sufficient and reliable data. One would expect LEDRs in these regions to decline as life expectancy stagnates, though the overall effect of increased death rate and decreased life expectancy on social discounting needs to be examined comprehensively, which is beyond the scope of this paper.

121Journal of Politics & Society
the near future according to the rate of return to built capital, the intermediate future according to the rate of return to all market and non-market capital, and the far future according to the risk-free real interest rate such that lower discount rates are applied for benefits and costs that extend across longer time horizons. In the spirit of Gollier and Weitzman (2010), the asymptotic decline of the effective discount rate toward the lowest rate inferred from eco-nomic observables permanently reflects the negative shocks from the effects of climate change and greater precautionary savings in response to this climate change. Given the front-loaded costs and back-loaded benefits of implementing aggressive mitigation policy (versus a business-as-usual trajectory), this segmented discounting schedule and other similar models can render costly mitigation in the immediate future economically efficient under the assumption that duration of benefits are sufficiently long and long run discount rate sufficiently low so that the present value of benefits exceeds the present value of costs in the near future.
CONCLUSIONS AND FURTHER STUDY
#is study relied on the premise that the present genera-tion is the generation currently alive, and thus all conclusions from our results should be viewed in the context that generations other than the currently-living one have no standing in policy decisions. Nonetheless, it shall be acknowledged that intergenerational equity concerns will persist as long as benefit-cost analysis of climate pol-icy is confined to the consideration that only the currently-living generation can be considered the present generation. Discounting is not likely to be time-consistent in contexts where the time hori-zon of policy challenges far exceed those experienced by the plan-ners and actors. Since one can argue that assigning any discount rate to intergenerational costs and benefits results in ‘dictatorship’ of the present, it will be worthwhile to conduct a series of calcula-tions treating subsequent future generations as present ones. Fu-ture benefits from mitigating climate change appear greater once future generations are provided sufficient standing. Prior policies

122 �(Y������(MWGSYRXMRK�XLI�7XERHEVH�1SHIP
favoring aggressive mitigation will be perceived as more attractive by future generations since, from their frames of reference, benefits appear closer in time and some of the costs may have already been incurred by prior generations and are therefore sunk.* Providing future generations standing in evaluation of policies with immedi-ate costs and delayed benefits can alleviate the ‘tyranny of the pres-ent’ problem that occurs whenever the impact of policies decided by the present generation spans subsequent generations.
!e pool of countries surveyed are all at relatively advanced stages of economic development, so to offer a truly global perspec-tive on the intergenerational welfare economics of climate change, the analysis presented here needs to be applied to data from less developed countries. Pure rate of time preferences in these coun-tries could be hypothesized to be higher than rates for developed countries as long as it is assumed that income and standards of living in poorer countries converge to those of richer countries and that economic growth tends to slow as countries become wealthi-er.† It follows that convergence leads to slower rates of growth in income and improvement of living standards, which suggests that costs and benefits of climate change in developing countries should be discounted hyperbolically. In fact, life expectancy discount rates produced in Brent (1993) offer strong indication that social dis-counting ought to be steeper in less developed countries, namely those exhibiting rapid or increasing growth in life expectancy and disposable income, and shallower in more developed countries. Demographic transition concomitant with economic transition may also lower discount rates over time. Bishai (2004) indicated that because older generations tend to value future utility more than younger generations do, they should exhibit lower pure rate of time preferences than their younger counterparts. Hyperbolic discounting in such cases, however, demands a time horizon suf-
* Even without sunk costs or more immediate benefits, one can expect future generations to find mitigation more attractive if economic growth occurs at a declining rate due to diminishing marginal returns to capital deepening, assuming that the Solow model is an accurate reflection of long-run macroeconomic tendencies.† !is tendency is characteristic of the Solow growth model, corroborated by empirical evidence in Mankiw, Romer, and Weil (1992).

123Journal of Politics & Society
ficiently long to capture both the diminishing growth rates toward a technology-driven steady state and demographic evolution. To maintain consistency between tendencies toward hyperbolic dis-counting and observed savings behavior, it should be established that households and firms save and invest over time horizons much shorter than the lifetime horizon proposed in the standard model, let alone an intergenerational time horizon.* Comprehensive exam-ination of the interrelationships among discounting, savings, and time horizons should prove relevant not only to economic analysis of climate policy but also any other subject linked to intergenera-tional risk and equity.
Past macroeconomic performance underlying the data in this study, however, is a weak indicator of economic prospects in the distant future, and the potential impact of climate change adds to such uncertainty. While economic growth since the 1970s has oc-curred during a period of steady or falling long-run prices of raw materials, changes in natural resource constraints and availability of substitutes through technological innovation will fundamentally alter growth prospects. If one assumes that total factor productiv-ity is the only source of long-run economic growth, changes in total factor productivity should stand in for consumption growth in the Ramsey equation. Future damages from climate change through increased incidence of extreme weather events will likely mean higher depreciation of capital stock, leading to reduced long-run potential economic output. Discount rates estimated from pres-ently observed savings, growth, and rate of return indicators would thus be overestimated relative to discount rates determined accord-ing to future market observables. Benefit-cost analysis of current mitigation policy will need to account for expectations of future macroeconomic performance under a wide assortment of climate scenarios, even though high degrees of uncertainty imply unreal-
* Howlett, Ramesh, and Perl (2009) presented five styles of decision-making, all five of which are crucial when considering climate policy or other policies involving high levels of uncertainty and complexity: optimization, satisfycing (already mentioned briefly in this paper; spelled ‘satisficing’ in some sources), search, bargaining, and organizational. It may be more accurate to characterize the actors making savings and investment decisions as satisfycing as opposed to optimizing as defined in the standard model.

124 �(Y������(MWGSYRXMRK�XLI�7XERHEVH�1SHIP
istically high savings rates as optimal under the standard model (Dasgupta, 2008). Anthoff, Tol, and Yohe (2009a) added that the uncertainty over catastrophic effects of climate change in the future would render any figure for the social cost of carbon arbi-trary as discount rates become sufficiently low, for which costs and benefits vary more heavily with the state of the economy in the distant future than they would under higher discount rates. #is consequence is one significant drawback, at least from the stand-point of making definitive policy, of providing future generations greater standing. With respect to the series of calculations treating future generations as present, the variation in predicted outcomes for future generations given prior policies may be too large to be of relevance in recommending specific courses of action at the present time.
#e extent to which non-market or non-economic consid-erations affect social discounting compared to economic consider-ations and their definitive impact on social discount rates merit fur-ther investigation. In Desjardins (2006), it has been suggested that the goal of environmental policymaking across long time horizons is to maximize happiness of future generations, which may or may not be quantifiable in a way that benefit-cost analysis can readily handle. Although monetizing natural and intangible capital as the World Bank and the WRI had done to a limited extent enables better reflection on long-term considerations pertinent to policies with extended time horizons, such a refinement fails to account for low elasticities of substitution among natural, built, and intan-gible capital. Non-substitutability among different forms of capital demands special consideration, especially when certain policy al-ternatives carry the possibility of major irreversible losses that are difficult to monetize. In order to apply constraints to screen such alternatives, one can disaggregate total benefits and costs of imple-menting a particular policy into economic, environmental, and so-cial components, each discounted separately using discount rates relevant to its respective categories. Saéz and Requena (2007) pro-posed a method utilizing separate declining discount rates for hu-man and environmental impact, with a slower pace of discounting
125Journal of Politics & Society
for environmental benefits and costs. Such ‘differentiated discount-ing’ according to impact categories in a particular policy package is analogous to hyperbolic discounting as a result of aggregation. Benefits and costs discounted at lower rates carry proportionately greater weight in the longer term; hence the effective discount rate for the entire package declines as time from the present increases. In the context of climate change mitigation, longer time horizons could be expected to raise the profile of distant social and environ-mental benefits discounted at relatively low rates.
Empirical evidence tested and interpreted in this paper illus-trate in practice Dasgupta’s theory-based arguments demonstrat-ing the inherent limitations of formal analyses of the economics of complex problems in environmental sustainability. "e methodol-ogy employed in this paper relies on market observables and is thus inadequate for taking into account benefits and costs not expressed in market signals, let alone those that can at best be monetized on the sole basis of arbitrarily imposed properties. In particular, the neoclassical economic framework is ill-suited for economic analysis of climate change (and sustainability concerns in general) due to its inadequacy in accounting for the interaction of ecological and sociological conditions with economic activities (Kant and Berry, 2005). Moreover, it is possible within the standard model’s neo-classical framework that the path of savings decisions for satisfy-ing sustainability criteria differs from that for maximizing present expected value (Arrow et al., 2004).* Given eventual limits to real global economic output due to energy and environmental resource constraints, a steady-state economic growth rate of zero in the very long run would be reasonable and consistent with zero discount-ing that maintains intergenerational equity in the most egalitarian sense (Dasgupta, Mäler, and Barrett, 2000). To resolve intergen-erational equity issues in developing optimal (or at least sufficient) strategies to mitigate climate change necessitates addressing sus-
* Much of the literature on human behavior and climate change lead to the conclusion that the tools of analysis within the neoclassical rational choice paradigm are insufficient for ensuring sustainability (Gowdy, 2008). Rigorous discourse on shifting away from the neoclassical paradigm is outside the scope of this paper, though such a shift remains in consideration given the exercise demonstrating the limitations of rational choice-based models.

126 �(Y������(MWGSYRXMRK�XLI�7XERHEVH�1SHIP
tainability criteria specifically, not merely improving the method of discounting. It remains to be determined whether some alternative to the neoclassical evaluative framework could enable overcoming the said limitations of formal analyses of the economics of climate change and intergenerational welfare.
To view all charts and tables, visit http://www.helvidius.org/du.
Bibliography
Anthoff, David, Richard S. J. Tol, and Gary W. Yohe. 2009. “Discounting for climate change.” Economics: !e Open-Access, Open Assessment E-Journal 3 (24).
______. 2009. “Risk aversion, time preference, and the social cost of carbon.” Abstract. Environmental Research Letters 4, no. 2:024002.
Arrow, Kenneth, Partha Dasgupta, Lawrence Goulder, Gretchen Daily, Paul Ehrlich, Geoffrey Heal, Simon Levin, et al. 2004. Are we consuming too much?. Vol. 18.
Azar, Christian. 1998. “Are optimal CO2 emissions really optimal?” Environmental and Resource Economics 11 (3): 301-15.
Bishai, David M. 2004. “Does time preference change with age?” Journal of Population Economics 17 (4): 583-602.
Brent, Robert J. 1993. “Country estimates of social discount rates based on changes in life expectancies.” Kyklos 46 (3): 399-409.
Dasgupta, Partha. 2008. “Discounting climate change.” Journal of Risk and Uncertainty 37 (2): 141-69.
Dasgupta, Partha, and Eric Maskin. 2005. Uncertainty and hyperbolic discounting. Vol. 95. Desjardins, Joseph R. 2006. Environmental ethics: An introduction to environmental philosophy.
4th ed. Cengage Learning. European Commission Research Directorate General. EU KLEMS growth and productivity
accounts: November 2009 release. in EU KLEMS Project [database online]. 2009. Available from http://euklems.org/index.html (accessed May 8, 2010).
Evans, David J., and Haluk Sezer. 2005. “Social discount rates for member countries of the European Union.” Journal of Economic Studies 32 (1): 47-59.
______. 2004. “Social discount rates for six major countries.” Applied Economics Letters 11 (9) (09/01; 2011/10): 557-60.
Gollier, Christian, and Martin L. Weitzman. 2010. “How should the distant future be discounted when discount rates are uncertain?” Economics Letters 107 (3) (6): 350-3.
Gowdy, John M. 2008. “Behavioral economics and climate change policy.” Journal of Economic Behavior & Organization 68 (3-4) (12): 632-44.
Guo, Jiehan, Cameron J. Hepburn, Richard S. J. Tol, and David Anthoff. 2006. “Discounting and the social cost of carbon: A closer look at uncertainty.” Environmental Science & Policy 9 (3) (5): 205-16.
Hall, Robert E. 1988. “Intertemporal substitution in consumption.” Journal of Political Economy 96 (2): 339-57.
Howlett, Michael, M. Ramesh, and Anthony Perl. 2009. Studying public policy: Policy cycles and policy subsystems. 3rd ed. Toronto: Oxford University Press.
Kant, Shashi, and R. Albert Berry. 2005. “Economics, sustainability, and forest management.” In Economics, sustainability, and natural resources., eds. Shashi Kant, R. Albert Berry.

127Journal of Politics & Society
Vol. 1, 1-22Springer Netherlands. Karp, Larry, and Yacov Tsur. 2007. Time perspective, discounting and climate change policy.
Hebrew University of Jerusalem. Levhari, Jerusalem D., and T. N. Srinivasan. 1969. “Optimal savings under uncertainty.” !e
Review of Economic Studies 36 (2) (April 01): 153-63. Mankiw, N. Gregory, David Romer, and David N. Weil. 1992. “A contribution to the empirics
of economic growth.” !e Quarterly Journal of Economics 107 (2) (May 01): 407-37. Nordhaus, William D. 2007. “A review of the stern review on the economics of climate change.”
Journal of Economic Literature 45 (3): 686-702. O’Mahony, Mary, and Marcel P. Timmer. 2009. “Output, input and productivity measures at
the industry level: !e EU KLEMS database*.” !e Economic Journal 119 (538): pp. 374-403.
Price, Colin. 2005. “How sustainable is discounting?” In Economics, sustainability, and natural resources., eds. Shashi Kant, R. Albert Berry. Vol. 1, 105-135Springer Netherlands.
Ramsey, F. P. 1928. “A mathematical theory of saving.” !e Economic Journal 38 (152) (Dec.): 543-559.
Sáez, Carmen Almansa, and Javier Calatrava Requena. 2007. “Reconciling sustainability and discounting in Cost–Benefit analysis: A methodological proposal.” Ecological Economics 60 (4) (2/1): 712-25.
Sunstein, Cass R. 2007. “On the divergent American reactions to terrorism and climate change.” Columbia Law Review 107 (2) (Mar.): pp. 503-557.
Tol, Richard S. J. 2009. “!e economic effects of climate change.” !e Journal of Economic Perspectives 23 (2): 29-51.
Tóth, Ferenc. 2000. “Intergenerational equity and discounting.” Integrated Assessment 1 (2): 127-36.
United Nations Statistics Division. “Interest rate, government long-term bond yields, per cent per annum, period average (IMF).” in Key Indicators Database [database online]. 2008. Available from http://data.un.org (accessed May 15, 2010).
Weitzman, Martin L. 2001. “Gamma discounting.” American Economic Review 91 (1): 260-71. ______. 1998. “Why the far-distant future should be discounted at its lowest possible rate.”
Journal of Environmental Economics and Management 36 (3) (11): 201-8. World Resources Institute. Economics, business, and the environment. in Earth Trends
[database online]. Available from http://earthtrends.wri.org (accessed May 15, 2010).