Embed Size (px)
Citation preview

DISCLOSURE OF HOSPITAL FINANCIAL AND
STATISTICAL INFORMATION
FOR HOSPITALS WITH FISCAL YEARS ENDING
June 30, 2011, August 31, 2011
and December 31, 2011
By:
HEALTH SERVICES COST REVIEW COMMISSION
December 5, 2012

Introduction
Historically, the Commission has published an annual comparison of Maryland hospitals’
regulated cost per adjusted admission with the national average cost per adjusted admission in
the Executive Summary of its Disclosure of Financial and Statistical Data (Report). In the past,
the Commission believed that cost per adjusted admission represented the best measure of
hospital costs affected by rate regulation and within a hospital’s control. Beginning with the
2003 report, the Commission shifted its primary attention from cost per adjusted admission to net
revenue per adjusted admission. The Commission did so because net revenue per adjusted
admission better indicates what Maryland citizens pay for hospital care.
The Commission will continue to use cost per adjusted admission as a secondary measure
of hospital performance in the Report. Because of the importance of per capita costs in
determining health care premiums and taxes, the Commission will explore estimates of this
measure, which involve the use of migration, case mix, and population data.
In 2004, the Commission made several additional changes to the Report. The first major
change was the expansion of the Report to include both regulated and unregulated operating
data. Also, the chronology of the data presented in the Report was changed to include all annual
data for the fiscal year ended in that calendar year, e.g., data from hospitals with fiscal years that
end December 31, 2010 are included with data from hospitals with June 30 and August 31, 2010
fiscal year ends. The Commission implemented these changes so that Maryland hospitals’ data
would be consistent with the manner in which national hospital data are published by the
American Hospital Association.

In 2009, the Commission standardized the reporting of non-operating revenue and
expenses to conform to the generally accepted accounting principles utilized in the preparation of
hospital audited financial statements. Non-operating revenue and expenses reported include but
are not limited to: unrestricted contributions, interest and investment income, realized investment
gains and losses, unrealized investment gains and losses, and realized swap agreements’ gains
and losses.
Contents of Report
Under its mandate to cause the public disclosure of the financial operations of all
hospitals, the Commission has prepared comparative statements from information made
available by the respective hospitals.
Gross Patient Revenue, Net Patient Revenue, Other Operating Revenue, Net Operating
Revenue, % Uncollectible Accounts, Total Operating Costs, Operating Profit / Loss, Non-
Operating Income and Expense, and Excess Profit / Loss, as itemized in this Report, were
derived from the Annual Report of Revenue, Expenses and Volumes (Annual Report) submitted
to the Commission. The Annual Report is reconciled with audited financial statements of the
respective institutions.
This year’s Disclosure Statement also includes the following seven Exhibits:
Exhibit I - Change in Cost per EIPA (Regulated Operations)
Exhibit II - Change in Revenue per Admission (Regulated Operations)
Exhibit III - Change in Uncompensated Care (Regulated Operations)
Exhibit IV - Change in Net Patient Revenue per EIPA (Regulated Operations)
Exhibit V - Change in Net Operating Revenue (Regulated Operations)

Exhibit VI - Change in Total Operating Profit / Loss (Regulated and Unregulated
Operations)
Exhibit VII – Change in Excess Profit/Loss (Operating and Non-operating Activities)
The following explanations are submitted in order to facilitate the reader’s understanding
of this report:
Gross Patient Revenue means all regulated and unregulated patient care revenue and
should be accounted for at established rates, regardless of whether the hospital expects to collect
the full amount. Such revenues should also be reported on an accrual basis in the period during
which service is provided; other accounting methods, such as the discharge method, are not
acceptable. For historical consistency, uncollectible accounts (bad debts) and charity care are
included in gross patient revenue.
Net Patient Revenue means all regulated and unregulated patient care revenue realized by
the hospital. Net patient revenue is arrived at by reducing gross patient revenue by contractual
allowances, charity care, bad debts, and payer denials. Such revenues should be reported on an
accrual basis in the period in which the service is provided.
Other Operating Revenue includes regulated and unregulated revenue associated with
normal day-to-day operations from services other than health care provided to patients. These
include sales and services to non-patients, revenue from miscellaneous sources, e.g., rental of
hospital space, sale of cafeteria meals, gift shop sales, research, Part B physician services, etc.
Such revenue is common in the regular operations of a hospital, but should be accounted for
separately from regulated patient revenue.
Net Operating Revenue is the total of net patient revenue and other operating revenue.
Uncompensated Care is composed of charity and bad debts. This is the percentage
difference between billings at established rates and the amount collected from charity patients
and patients who pay less than their total bill, if at all. For historical consistency, uncollectible
accounts are treated as a reduction in revenue.
Total Operating Expenses equal the costs of Commission regulated and unregulated
inpatient and outpatient care, plus costs associated with Other Operating Revenue. Operating
expenses are presented in the Report in accordance with generally accepted accounting principles
with the exception of bad debts. For historical consistency, bad debts are treated as a reduction in
gross patient revenue.
Equivalent Admission (EIPA) is a statistic formulated by the Commission which equals
admissions plus a conversion of outpatient visits into equivalent admissions calculated as
follows:
EIPAs = Admissions x Total Gross Patient Care Revenues
Gross Inpatient Care Revenues
Average Cost per EIPA is operating costs divided by EIPAs.
Operating Profit / Loss is the profit or loss from ordinary, normal recurring regulated and
unregulated operations of the entity during the period. Operating Profit / Loss also includes
restricted donations for specific operating purposes if such funds were expended for the purpose
intended by the donor during the fiscal year being reported upon (i.e., June 30, 2011 and
December 31, 2011).
Non-Operating Profit / Loss includes investment income, extraordinary gains, and other
non-operating gains and losses.

Excess Profit / Loss represents the bottom line figure from the Audited Financial
Statement of the institution. It is the total of the Operating Profit / Loss and Non-Operating Profit
/ Loss. (Provisions for income tax are excluded from the calculation of profit or loss for
proprietary hospitals.)
Financial information contained in the Report provides only an overview of the total
financial status of the institutions. Additional information concerning the hospitals, in the form
of Audited Financial Statements and reports filed pursuant to the regulations of the Health
Services Cost Review Commission, is available at the Commission’s offices for public
inspection between the hours of 8:30 a.m. and 4:30 p.m. and in PDF under Financial Data
Reports/Financial Disclosure on the HSCRC website at HTTP://www.hscrc.state.md.us.
Notes to the Financial and Statistical Data
1. Admissions include infants transferred to Neo-Natal Intensive Care units in the hospital
in which they were born.
2. Revenues and expenses applicable to physician Part B professional services are only
included in regulated hospital data in hospitals which had Commission approved
physician rates on June 30, 1985 and that have not subsequently requested that those rates
be abolished so that the physicians may bill fee-for-service.
3. The Specialty Hospitals in this Report are: Adventist Behavioral Health Care-Rockville,
Adventist Rehabilitation Hospital of Maryland, Brook Lane Health Services, Adventist
Behavioral Health-Eastern Shore, Brook Lane Psychiatric Center, Levindale Hospital,
Mt. Washington Pediatric Hospital, Sheppard Pratt Hospital, St. Luke Institute, and
University Specialty Hospital.
4. Effective November 19, 2009, the Western Maryland Health System closed Braddock
Hospital and Memorial Hospital of Cumberland and opened Western Maryland Regional
Medical Center.
5. In accordance with Health-General Article, Section 19-3A-07, three free-standing
medical facilities, Queen Anne’s Freestanding Medical Center, Germantown Emergency
Center, and Bowie Health Center fall under the rate-setting jurisdiction of the Health
Services Cost Review Commission The Commission set rates for all payers for
emergency services provided at Queen Anne’s Freestanding Medical Center effective
October 1, 2010, and at Germantown Emergency Center and Bowie Health Center
effective July 1, 2011. Partial year data for Queen Anne’s Freestanding Medical Center
and Germantown Emergency Center are included in the FY 2011Disclosure.

HEALTH SERVICES COST REVIEW COMMISSIONDISCLOSURE OF HOSPITAL FINANCIAL AND STATISTICAL DATA
FISCAL YEARS 2011 - 2009
All Acute Hospitals
FISCAL YEAR ENDING Year 2011 Year 2010 Year 2009Gross Patient Revenue:
Regulated Services 14,120,316,777 13,386,874,793 13,053,765,718
Unregulated Services 1,537,916,142 1,465,864,371 1,351,841,962
Total 15,658,232,919 14,852,739,164 14,405,607,680
Net Patient Revenue(NPR):
Regulated Services 11,922,902,382 11,378,307,015 11,171,235,693
Unregulated Services 743,643,359 729,924,431 688,135,797
Total 12,666,545,741 12,108,231,446 11,859,371,490
Other Operating Revenue:
Regulated Services 133,023,987 121,582,218 124,576,383
Unregulated Services 384,295,744 375,591,936 341,341,500
Total 517,319,731 497,174,154 465,917,883
Net Operating Revenue(NOR)
Regulated Services 12,055,926,369 11,499,889,233 11,295,812,076
Unregulated Services 1,127,939,103 1,105,516,367 1,029,477,296
Total 13,183,865,472 12,605,405,600 12,325,289,372
Total Operating Expenses:
Regulated Services 11,158,496,980 10,784,939,280 10,627,077,625
Total 12,719,503,353 12,277,293,119 12,005,981,091
Equivalent Inpatient ADMs (EIPA) :
Regulated Services 1,018,057 1,036,000 1,037,501
Total 1,093,112 1,123,111 1,109,990
NPR per EIPA
Regulated Services 11,711.43 10,982.92 10,767.45
Total 11,587.60 10,780.97 10,684.21
NOR per EIPA
Regulated Services 11,842.09 11,100.28 10,877.52
Total 12,060.86 11,223.65 11,103.96
Operating Expenses per EIPA
Regulated Services 10,960.58 10,410.17 10,242.96
Total 11,636.05 10,931.50 10,816.30
Net Operating Profit (Loss):
Regulated Services 897,429,389 714,949,953 668,734,451
Unregulated Services (433,067,249) (386,837,472) (349,426,169)
Total 464,362,140 328,112,481 319,308,282
Total Non-Operating Profit (Loss): 382,241,866 153,034,059 (321,089,660)
Non-Operating Revenue 396,002,108 173,932,166 (165,193,706)
Non-Operating Expense 13,760,242 20,898,107 155,895,954
Total Excess Profit 846,604,006 481,146,540 (1,781,378)
% Change in NPR per EIPA - Regulated 6.63 2.00 3.11
% Change in NOR per EIPA - Regulated 6.68 2.05 2.75
% Change in Operating Expense per EIPA - Regulated 5.29 1.63 2.11
% Change in Net Operating Profit - Regulated 25.52 6.91 19.19
% Net Operating Profit of Regulated NOR 7.44 6.22 5.92
% Change in Net Operating Profit- Total 41.53 2.76 17.91
% Net Total Operating Proft of Total NOR 3.52 2.60 2.59
% Change in Total Excess Profit 75.96 27,109.79 (101.13)
% Total Excess Profit of Total Revenue 6.23 3.77 (0.01)

HEALTH SERVICES COST REVIEW COMMISSION DISCLOSURE OF HOSPITAL FINANCIAL AND STATISTICAL DATA FISCAL YEAR 2009 TO 2011 Page 1 =======================================================================================================
Anne Arundel Medical Center
FISCAL YEAR ENDING June 2011 June 2010 June 2009 -------------- -------------- -------------- Gross Patient Revenue: Regulated Services 461,358,800 415,890,500 392,507,100 Unregulated Services 10,369,513 32,748,267 27,404,887 TOTAL 471,728,313 448,638,767 419,911,987 Net Patient Revenue(NPR): Regulated Services 395,773,822 358,018,187 344,010,185 Unregulated Services 8,856,470 14,836,859 12,013,871 TOTAL 404,630,292 372,855,046 356,024,056 Other Operating Revenue: Regulated Services 3,407,524 2,812,000 5,114,600 Unregulated Services 16,450,675 15,834,823 15,905,882 TOTAL 19,858,199 18,646,823 21,020,482 Net Operating Revenue(NOR) Regulated Services 399,181,346 360,830,187 349,124,785 Unegulated Services 25,307,145 30,671,682 27,919,753 Total 424,488,491 391,501,869 377,044,538 Total Operating Expenses: Regulated Services 371,871,480 338,052,332 323,481,921 Total 404,474,303 374,073,300 360,110,000 Equivalent Inpatient ADMs(EIPA): Regulated Services 41,134 38,222 37,124 Total 41,651 38,942 37,466 NPR per EIPA : Regulated Services 9,621.57 9,366.81 9,266.41 Total 9,714.83 9,574.70 9,502.58 NOR per EIPA : Regulated Services 9,704.41 9,440.38 9,404.18 Total 10,191.61 10,053.54 10,063.63 Operating Expenses per EIPA : Regulated Services 9,040.48 8,844.44 8,713.45 Total 9,711.08 9,605.98 9,611.63 Net Operating Profit(Loss): Regulated Services 27,309,866 22,777,855 25,642,864 Unegulated Services -7,295,678 -5,349,286 -8,708,326 Total 20,014,188 17,428,569 16,934,538
Total Non-Operating Profit(Loss): 41,077,000 17,237,000 -38,573,000 Non-Operating Revenue 41,077,000 17,237,000 -38,573,000 Non-Operating Expenses 0 0 0
Total Excess Profit 61,091,188 34,665,569 -21,638,462
% Change in NPR per EIPA - Regulated 2.72 1.08 1.37 % Change in NOR per EIPA - Regulated 2.80 0.38 0.54 % Change in Oper. Expense per EIPA- Regulated 2.22 1.50 3.20 % Change in Net Operating Profit- Regulated 19.90 -11.17 -20.03
% Net Operating Profit of Regulated NOR 6.84 6.31 7.34 % Change in Net Operating Profit- Total 14.84 2.92 -22.95 % Net Total Operating Profit of Total NOR 4.71 4.45 4.49 % Change in Total Excess Profit 76.23 260.20 -266.14 % Total Excess Profit of Total Revenue 13.12 8.48 -6.39

HEALTH SERVICES COST REVIEW COMMISSION DISCLOSURE OF HOSPITAL FINANCIAL AND STATISTICAL DATA FISCAL YEAR 2009 TO 2011 Page 2 =======================================================================================================
Atlantic General Hospital
FISCAL YEAR ENDING June 2011 June 2010 June 2009 -------------- -------------- -------------- Gross Patient Revenue: Regulated Services 88,149,000 84,190,900 76,484,900 Unregulated Services 15,969,652 14,410,425 11,979,655 TOTAL 104,118,652 98,601,325 88,464,555 Net Patient Revenue(NPR): Regulated Services 73,273,700 70,677,900 66,120,200 Unregulated Services 9,080,852 8,931,325 7,817,255 TOTAL 82,354,552 79,609,225 73,937,455 Other Operating Revenue: Regulated Services 169,279 315,091 45,500 Unregulated Services 702,293 629,004 395,800 TOTAL 871,572 944,095 441,300 Net Operating Revenue(NOR) Regulated Services 73,442,979 70,992,991 66,165,700 Unegulated Services 9,783,145 9,560,329 8,213,055 Total 83,226,124 80,553,320 74,378,755 Total Operating Expenses: Regulated Services 65,558,492 63,446,909 59,338,561 Total 82,971,576 79,689,022 74,135,459 Equivalent Inpatient ADMs(EIPA): Regulated Services 8,602 8,251 7,631 Total 10,161 9,664 8,826 NPR per EIPA : Regulated Services 8,517.96 8,565.63 8,665.10 Total 8,105.21 8,237.99 8,377.42 NOR per EIPA : Regulated Services 8,537.64 8,603.82 8,671.07 Total 8,190.99 8,335.69 8,427.43 Operating Expenses per EIPA : Regulated Services 7,621.08 7,689.29 7,776.37 Total 8,165.93 8,246.25 8,399.86 Net Operating Profit(Loss): Regulated Services 7,884,487 7,546,082 6,827,139 Unegulated Services -7,629,939 -6,681,784 -6,583,843 Total 254,548 864,298 243,296
Total Non-Operating Profit(Loss): 1,532,896 1,262,244 1,019,098 Non-Operating Revenue 1,532,896 1,262,244 1,186,645 Non-Operating Expenses 0 0 167,547
Total Excess Profit 1,787,444 2,126,542 1,262,394
% Change in NPR per EIPA - Regulated -0.56 -1.15 -1.86 % Change in NOR per EIPA - Regulated -0.77 -0.78 -1.90 % Change in Oper. Expense per EIPA- Regulated -0.89 -1.12 3.65 % Change in Net Operating Profit- Regulated 4.48 10.53 -29.66
% Net Operating Profit of Regulated NOR 10.74 10.63 10.32 % Change in Net Operating Profit- Total -70.55 255.25 -94.05 % Net Total Operating Profit of Total NOR 0.31 1.07 0.33 % Change in Total Excess Profit -15.95 68.45 -76.15 % Total Excess Profit of Total Revenue 2.11 2.60 1.67

HEALTH SERVICES COST REVIEW COMMISSION DISCLOSURE OF HOSPITAL FINANCIAL AND STATISTICAL DATA FISCAL YEAR 2009 TO 2011 Page 3 =======================================================================================================
Baltimore Washington Medical Center
FISCAL YEAR ENDING June 2011 June 2010 June 2009 -------------- -------------- -------------- Gross Patient Revenue: Regulated Services 353,767,500 332,045,200 309,341,800 Unregulated Services 9,157,167 0 10,732,909 TOTAL 362,924,667 332,045,200 320,074,709 Net Patient Revenue(NPR): Regulated Services 295,750,514 281,900,262 262,470,466 Unregulated Services 9,157,167 0 10,732,909 TOTAL 304,907,681 281,900,262 273,203,375 Other Operating Revenue: Regulated Services 1,565,762 1,474,613 831,225 Unregulated Services 1,587,190 9,809,146 1,465,079 TOTAL 3,152,953 11,283,759 2,296,304 Net Operating Revenue(NOR) Regulated Services 297,316,277 283,374,875 263,301,691 Unegulated Services 10,744,357 9,809,146 12,197,989 Total 308,060,634 293,184,021 275,499,679 Total Operating Expenses: Regulated Services 281,461,913 275,681,538 263,483,958 Total 293,156,534 286,190,528 277,354,241 Equivalent Inpatient ADMs(EIPA): Regulated Services 29,727 31,830 29,941 Total 30,496 31,830 30,979 NPR per EIPA : Regulated Services 9,949.04 8,856.55 8,766.37 Total 9,998.28 8,856.55 8,818.86 NOR per EIPA : Regulated Services 10,001.71 8,902.88 8,794.13 Total 10,101.67 9,211.06 8,892.98 Operating Expenses per EIPA : Regulated Services 9,468.37 8,661.18 8,800.22 Total 9,612.95 8,991.34 8,952.85 Net Operating Profit(Loss): Regulated Services 15,854,364 7,693,337 -182,268 Unegulated Services -950,265 -699,844 -1,672,295 Total 14,904,099 6,993,493 -1,854,562
Total Non-Operating Profit(Loss): 4,246,000 1,598,400 -5,815,556 Non-Operating Revenue 4,246,000 1,598,400 -5,815,556 Non-Operating Expenses 0 0 0
Total Excess Profit 19,150,099 8,591,893 -7,670,118
% Change in NPR per EIPA - Regulated 12.34 1.03 6.14 % Change in NOR per EIPA - Regulated 12.34 1.24 6.18 % Change in Oper. Expense per EIPA- Regulated 9.32 -1.58 10.79 % Change in Net Operating Profit- Regulated 106.08 4,320.90 -101.83
% Net Operating Profit of Regulated NOR 5.33 2.71 -0.07 % Change in Net Operating Profit- Total 113.11 477.10 -123.53 % Net Total Operating Profit of Total NOR 4.84 2.39 -0.67 % Change in Total Excess Profit 122.89 212.02 -187.10 % Total Excess Profit of Total Revenue 6.13 2.91 -2.84

HEALTH SERVICES COST REVIEW COMMISSION DISCLOSURE OF HOSPITAL FINANCIAL AND STATISTICAL DATA FISCAL YEAR 2009 TO 2011 Page 4 =======================================================================================================
Bon Secours Hospital
FISCAL YEAR ENDING August 2011 August 2010 August 2009 -------------- -------------- -------------- Gross Patient Revenue: Regulated Services 128,847,200 121,320,200 122,144,200 Unregulated Services 25,492,096 22,737,655 16,537,773 TOTAL 154,339,296 144,057,855 138,681,973 Net Patient Revenue(NPR): Regulated Services 106,009,629 97,905,389 93,446,808 Unregulated Services 14,585,230 12,960,820 8,221,786 TOTAL 120,594,859 110,866,209 101,668,594 Other Operating Revenue: Regulated Services 470,471 4,780,567 357,463 Unregulated Services 3,771,169 5,635,538 9,026,292 TOTAL 4,241,640 10,416,105 9,383,755 Net Operating Revenue(NOR) Regulated Services 106,480,100 102,685,956 93,804,271 Unegulated Services 18,356,399 18,596,358 17,248,078 Total 124,836,499 121,282,314 111,052,349 Total Operating Expenses: Regulated Services 92,723,485 88,260,009 87,326,019 Total 125,678,956 119,964,912 120,940,412 Equivalent Inpatient ADMs(EIPA): Regulated Services 10,810 10,732 10,932 Total 12,949 12,744 10,319 NPR per EIPA : Regulated Services 9,806.23 9,122.63 8,548.15 Total 9,312.88 8,699.79 9,852.69 NOR per EIPA : Regulated Services 9,849.75 9,568.07 8,580.85 Total 9,640.44 9,517.15 10,762.07 Operating Expenses per EIPA : Regulated Services 8,577.22 8,223.89 7,988.24 Total 9,705.50 9,413.78 11,720.32 Net Operating Profit(Loss): Regulated Services 13,756,615 14,425,947 6,478,252 Unegulated Services -14,599,072 -13,108,545 -16,366,315 Total -842,457 1,317,402 -9,888,063
Total Non-Operating Profit(Loss): 1,072,053 548,184 -1,379,146 Non-Operating Revenue 1,221,528 684,932 -1,334,281 Non-Operating Expenses 149,475 136,748 44,865
Total Excess Profit 229,596 1,865,586 -11,267,209
% Change in NPR per EIPA - Regulated 7.49 6.72 2.20 % Change in NOR per EIPA - Regulated 2.94 11.50 2.31 % Change in Oper. Expense per EIPA- Regulated 4.30 2.95 -8.88 % Change in Net Operating Profit- Regulated -4.64 122.68 278.90
% Net Operating Profit of Regulated NOR 12.92 14.05 6.91 % Change in Net Operating Profit- Total -163.95 113.32 53.10 % Net Total Operating Profit of Total NOR -0.67 1.09 -8.90 % Change in Total Excess Profit -87.69 116.56 49.20 % Total Excess Profit of Total Revenue 0.18 1.53 -10.27

HEALTH SERVICES COST REVIEW COMMISSION DISCLOSURE OF HOSPITAL FINANCIAL AND STATISTICAL DATA FISCAL YEAR 2009 TO 2011 Page 5 =======================================================================================================
Braddock Hospital
FISCAL YEAR ENDING June 2010 June 2009 -------------- -------------- -------------- Gross Patient Revenue: Regulated Services 0 . 166,869,000 Unregulated Services 0 . 20,069,100 TOTAL 0 . 186,938,100 Net Patient Revenue(NPR): Regulated Services 0 . 142,005,200 Unregulated Services 0 . 15,873,900 TOTAL 0 . 157,879,100 Other Operating Revenue: Regulated Services 0 . 0 Unregulated Services 0 . 1,136,700 TOTAL 0 . 1,136,700 Net Operating Revenue(NOR) Regulated Services 0 . 142,005,200 Unegulated Services 0 . 17,010,600 Total 0 . 159,015,800 Total Operating Expenses: Regulated Services 0 . 132,631,877 Total 0 . 155,559,300 Equivalent Inpatient ADMs(EIPA): Regulated Services 0 . 17,988 Total 0 . 19,033 NPR per EIPA : Regulated Services 0.00 . 7,894.52 Total 0.00 . 8,295.08 NOR per EIPA : Regulated Services 0.00 . 7,894.52 Total 0.00 . 8,354.80 Operating Expenses per EIPA : Regulated Services 0.00 . 7,373.43 Total 0.00 . 8,173.19 Net Operating Profit(Loss): Regulated Services 0 . 9,373,323 Unegulated Services 0 . -5,916,823 Total 0 . 3,456,500
Total Non-Operating Profit(Loss): 0 . 1,304,200 Non-Operating Revenue 0 . 1,304,200 Non-Operating Expenses 0 . 0
Total Excess Profit 0 . 4,760,700
% Change in NPR per EIPA - Regulated . . 5.62 % Change in NOR per EIPA - Regulated . . 5.62 % Change in Oper. Expense per EIPA- Regulated . . 4.88 % Change in Net Operating Profit- Regulated . . 19.17
% Net Operating Profit of Regulated NOR 0.00 . 6.60 % Change in Net Operating Profit- Total . . 96.50 % Net Total Operating Profit of Total NOR 0.00 . 2.17 % Change in Total Excess Profit . . 33.00 % Total Excess Profit of Total Revenue 0.00 . 2.97

HEALTH SERVICES COST REVIEW COMMISSION DISCLOSURE OF HOSPITAL FINANCIAL AND STATISTICAL DATA FISCAL YEAR 2009 TO 2011 Page 6 =======================================================================================================
Calvert Memorial Hospital
FISCAL YEAR ENDING June 2011 June 2010 June 2009 -------------- -------------- -------------- Gross Patient Revenue: Regulated Services 129,181,700 120,112,700 111,417,900 Unregulated Services 16,303,597 14,236,128 17,563,082 TOTAL 145,485,297 134,348,828 128,980,982 Net Patient Revenue(NPR): Regulated Services 107,446,910 102,380,283 97,651,503 Unregulated Services 12,099,706 8,307,640 11,124,424 TOTAL 119,546,616 110,687,922 108,775,927 Other Operating Revenue: Regulated Services 4,551,830 2,327,176 1,261,725 Unregulated Services 1,031,658 1,559,025 2,154,803 TOTAL 5,583,488 3,886,201 3,416,528 Net Operating Revenue(NOR) Regulated Services 111,998,740 104,707,459 98,913,228 Unegulated Services 13,131,364 9,866,664 13,279,227 Total 125,130,104 114,574,123 112,192,455 Total Operating Expenses: Regulated Services 101,658,343 97,660,195 90,842,718 Total 124,478,541 117,305,602 110,705,329 Equivalent Inpatient ADMs(EIPA): Regulated Services 14,469 15,490 14,749 Total 16,231 17,305 16,908 NPR per EIPA : Regulated Services 7,426.11 6,609.59 6,620.81 Total 7,365.24 6,396.25 6,433.23 NOR per EIPA : Regulated Services 7,740.71 6,759.83 6,706.36 Total 7,709.24 6,620.82 6,635.29 Operating Expenses per EIPA : Regulated Services 7,026.04 6,304.87 6,159.18 Total 7,669.10 6,778.66 6,547.34 Net Operating Profit(Loss): Regulated Services 10,340,397 7,047,263 8,070,510 Unegulated Services -9,688,834 -9,778,742 -6,583,384 Total 651,563 -2,731,479 1,487,126
Total Non-Operating Profit(Loss): 606,246 465,701 706,857 Non-Operating Revenue 185,975 612,528 721,866 Non-Operating Expenses -420,271 146,827 15,009
Total Excess Profit 1,257,809 -2,265,778 2,193,983
% Change in NPR per EIPA - Regulated 12.35 -0.17 0.48 % Change in NOR per EIPA - Regulated 14.51 0.80 -0.43 % Change in Oper. Expense per EIPA- Regulated 11.44 2.37 -2.09 % Change in Net Operating Profit- Regulated 46.73 -12.68 33.98
% Net Operating Profit of Regulated NOR 9.23 6.73 8.16 % Change in Net Operating Profit- Total 123.85 -283.68 29.55 % Net Total Operating Profit of Total NOR 0.52 -2.38 1.33 % Change in Total Excess Profit 155.51 -203.27 -33.41 % Total Excess Profit of Total Revenue 1.00 -1.97 1.94

HEALTH SERVICES COST REVIEW COMMISSION DISCLOSURE OF HOSPITAL FINANCIAL AND STATISTICAL DATA FISCAL YEAR 2009 TO 2011 Page 7 =======================================================================================================
Carroll County General Hospital
FISCAL YEAR ENDING June 2011 June 2010 June 2009 -------------- -------------- -------------- Gross Patient Revenue: Regulated Services 214,427,800 202,238,000 196,154,700 Unregulated Services 99,094,532 50,764,598 54,410,406 TOTAL 313,522,332 253,002,598 250,565,106 Net Patient Revenue(NPR): Regulated Services 182,174,860 176,005,258 172,583,312 Unregulated Services 44,532,619 44,035,380 45,711,404 TOTAL 226,707,479 220,040,638 218,294,716 Other Operating Revenue: Regulated Services 1,112,911 1,313,148 1,172,241 Unregulated Services 16,994,099 15,632,319 15,577,658 TOTAL 18,107,010 16,945,467 16,749,899 Net Operating Revenue(NOR) Regulated Services 183,287,771 177,318,406 173,755,553 Unegulated Services 61,526,718 59,667,699 61,289,062 Total 244,814,489 236,986,105 235,044,615 Total Operating Expenses: Regulated Services 161,836,399 167,347,659 161,702,356 Total 235,383,186 238,281,978 230,915,503 Equivalent Inpatient ADMs(EIPA): Regulated Services 20,643 22,366 21,787 Total 30,183 27,981 27,830 NPR per EIPA : Regulated Services 8,824.85 7,869.19 7,921.56 Total 7,510.99 7,864.03 7,843.92 NOR per EIPA : Regulated Services 8,878.76 7,927.90 7,975.36 Total 8,110.89 8,469.65 8,445.79 Operating Expenses per EIPA : Regulated Services 7,839.62 7,482.11 7,422.12 Total 7,798.43 8,515.96 8,297.42 Net Operating Profit(Loss): Regulated Services 21,451,372 9,970,747 12,053,197 Unegulated Services -12,020,069 -11,266,620 -7,924,085 Total 9,431,303 -1,295,873 4,129,112
Total Non-Operating Profit(Loss): 10,693,197 -2,445,034 -6,689,757 Non-Operating Revenue 11,164,536 7,332,943 2,059,874 Non-Operating Expenses 471,339 9,777,977 8,749,631
Total Excess Profit 20,124,500 -3,740,907 -2,560,645
% Change in NPR per EIPA - Regulated 12.14 -0.66 3.71 % Change in NOR per EIPA - Regulated 11.99 -0.60 3.40 % Change in Oper. Expense per EIPA- Regulated 4.78 0.81 6.59 % Change in Net Operating Profit- Regulated 115.14 -17.28 -24.94
% Net Operating Profit of Regulated NOR 11.70 5.62 6.94 % Change in Net Operating Profit- Total 827.80 -131.38 -60.84 % Net Total Operating Profit of Total NOR 3.85 -0.55 1.76 % Change in Total Excess Profit 637.96 -46.09 -122.00 % Total Excess Profit of Total Revenue 7.86 -1.53 -1.08

HEALTH SERVICES COST REVIEW COMMISSION DISCLOSURE OF HOSPITAL FINANCIAL AND STATISTICAL DATA FISCAL YEAR 2009 TO 2011 Page 8 =======================================================================================================
Chester River Hospital
FISCAL YEAR ENDING June 2011 June 2010 June 2009 -------------- -------------- -------------- Gross Patient Revenue: Regulated Services 62,310,300 59,939,400 60,914,200 Unregulated Services 2,877,368 2,871,574 2,283,120 TOTAL 65,187,668 62,810,974 63,197,320 Net Patient Revenue(NPR): Regulated Services 51,340,374 50,998,039 50,049,509 Unregulated Services 1,704,749 971,935 2,082,791 TOTAL 53,045,123 51,969,974 52,132,300 Other Operating Revenue: Regulated Services 208,861 273,456 399,053 Unregulated Services 289,153 294,571 343,206 TOTAL 498,014 568,026 742,259 Net Operating Revenue(NOR) Regulated Services 51,549,234 51,271,495 50,448,562 Unegulated Services 1,993,902 1,266,505 2,425,998 Total 53,543,137 52,538,000 52,874,559 Total Operating Expenses: Regulated Services 49,886,918 51,116,572 51,011,116 Total 53,012,104 54,212,000 52,758,252 Equivalent Inpatient ADMs(EIPA): Regulated Services 5,495 6,386 6,595 Total 5,631 6,692 6,842 NPR per EIPA : Regulated Services 9,343.83 7,986.27 7,588.70 Total 9,420.48 7,766.41 7,618.93 NOR per EIPA : Regulated Services 9,381.84 8,029.10 7,649.20 Total 9,508.92 7,851.29 7,727.41 Operating Expenses per EIPA : Regulated Services 9,079.30 8,004.84 7,734.50 Total 9,414.61 8,101.46 7,710.41 Net Operating Profit(Loss): Regulated Services 1,662,317 154,923 -562,554 Unegulated Services -1,131,284 -1,828,923 678,862 Total 531,033 -1,674,000 116,308
Total Non-Operating Profit(Loss): 1,561,894 646,000 -44,000 Non-Operating Revenue 1,618,790 646,000 411,000 Non-Operating Expenses 56,896 0 455,000
Total Excess Profit 2,092,927 -1,028,000 72,308
% Change in NPR per EIPA - Regulated 17.00 5.24 4.21 % Change in NOR per EIPA - Regulated 16.85 4.97 -3.19 % Change in Oper. Expense per EIPA- Regulated 13.42 3.50 -7.18 % Change in Net Operating Profit- Regulated 973.00 127.54 78.80
% Net Operating Profit of Regulated NOR 3.22 0.30 -1.12 % Change in Net Operating Profit- Total 131.72 -1,539.29 106.50 % Net Total Operating Profit of Total NOR 0.99 -3.19 0.22 % Change in Total Excess Profit 303.59 -1,521.71 -84.06 % Total Excess Profit of Total Revenue 3.79 -1.93 0.14

HEALTH SERVICES COST REVIEW COMMISSION DISCLOSURE OF HOSPITAL FINANCIAL AND STATISTICAL DATA FISCAL YEAR 2009 TO 2011 Page 9 =======================================================================================================
Civista Medical Center
FISCAL YEAR ENDING June 2011 June 2010 June 2009 -------------- -------------- -------------- Gross Patient Revenue: Regulated Services 115,504,200 111,481,500 103,621,000 Unregulated Services 760,000 1,664,800 4,069,300 TOTAL 116,264,200 113,146,300 107,690,300 Net Patient Revenue(NPR): Regulated Services 95,590,668 94,973,916 88,273,027 Unregulated Services 284,800 863,000 1,646,300 TOTAL 95,875,468 95,836,916 89,919,327 Other Operating Revenue: Regulated Services 147,457 48,768 440,991 Unregulated Services 487,058 472,398 435,384 TOTAL 634,515 521,166 876,375 Net Operating Revenue(NOR) Regulated Services 95,738,125 95,022,684 88,714,018 Unegulated Services 771,858 1,335,398 2,081,684 Total 96,509,983 96,358,082 90,795,702 Total Operating Expenses: Regulated Services 92,856,943 93,008,782 88,810,903 Total 93,575,970 94,675,625 93,320,390 Equivalent Inpatient ADMs(EIPA): Regulated Services 12,619 12,436 11,783 Total 12,679 12,599 12,227 NPR per EIPA : Regulated Services 7,574.99 7,636.95 7,491.26 Total 7,561.51 7,607.00 7,354.18 NOR per EIPA : Regulated Services 7,586.68 7,640.88 7,528.69 Total 7,611.56 7,648.37 7,425.85 Operating Expenses per EIPA : Regulated Services 7,358.36 7,478.94 7,536.91 Total 7,380.16 7,514.83 7,632.34 Net Operating Profit(Loss): Regulated Services 2,881,182 2,013,901 -96,885 Unegulated Services 52,831 -331,444 -2,427,803 Total 2,934,013 1,682,457 -2,524,688
Total Non-Operating Profit(Loss): 1,659,487 178,645 1,037,391 Non-Operating Revenue 1,659,487 178,645 1,037,391 Non-Operating Expenses 0 0 0
Total Excess Profit 4,593,499 1,861,102 -1,487,298
% Change in NPR per EIPA - Regulated -0.81 1.94 2.31 % Change in NOR per EIPA - Regulated -0.71 1.49 2.46 % Change in Oper. Expense per EIPA- Regulated -1.61 -0.77 -4.50 % Change in Net Operating Profit- Regulated 43.06 2,178.65 98.44
% Net Operating Profit of Regulated NOR 3.01 2.12 -0.11 % Change in Net Operating Profit- Total 74.39 166.64 61.02 % Net Total Operating Profit of Total NOR 3.04 1.75 -2.78 % Change in Total Excess Profit 146.82 225.13 72.69 % Total Excess Profit of Total Revenue 4.68 1.93 -1.62

HEALTH SERVICES COST REVIEW COMMISSION DISCLOSURE OF HOSPITAL FINANCIAL AND STATISTICAL DATA FISCAL YEAR 2009 TO 2011 Page 10 =======================================================================================================
Doctors Community Hospital
FISCAL YEAR ENDING June 2011 June 2010 June 2009 -------------- -------------- -------------- Gross Patient Revenue: Regulated Services 213,054,400 196,074,400 188,720,500 Unregulated Services 11,917,625 8,367,242 5,567,940 TOTAL 224,972,025 204,441,642 194,288,440 Net Patient Revenue(NPR): Regulated Services 181,899,812 167,544,370 156,598,647 Unregulated Services 11,872,391 8,128,977 5,398,926 TOTAL 193,772,203 175,673,347 161,997,573 Other Operating Revenue: Regulated Services 352,448 150,612 1,375,772 Unregulated Services 5,283,785 8,124,007 6,459,268 TOTAL 5,636,233 8,274,619 7,835,040 Net Operating Revenue(NOR) Regulated Services 182,252,260 167,694,982 157,974,419 Unegulated Services 17,156,176 16,252,984 11,858,194 Total 199,408,436 183,947,966 169,832,613 Total Operating Expenses: Regulated Services 174,216,209 162,992,683 153,617,218 Total 195,357,324 180,489,970 164,614,961 Equivalent Inpatient ADMs(EIPA): Regulated Services 20,349 19,629 19,714 Total 21,487 20,467 20,295 NPR per EIPA : Regulated Services 8,939.06 8,535.37 7,943.69 Total 9,018.06 8,583.21 7,982.06 NOR per EIPA : Regulated Services 8,956.38 8,543.04 8,013.48 Total 9,280.37 8,987.50 8,368.11 Operating Expenses per EIPA : Regulated Services 8,561.47 8,303.49 7,792.45 Total 9,091.83 8,818.55 8,111.02 Net Operating Profit(Loss): Regulated Services 8,036,051 4,702,299 4,357,201 Unegulated Services -3,984,940 -1,244,303 860,450 Total 4,051,112 3,457,996 5,217,652
Total Non-Operating Profit(Loss): 13,148,798 -6,968,443 -17,579,863 Non-Operating Revenue 31,861,714 -5,095,951 -17,579,863 Non-Operating Expenses 18,712,916 1,872,492 0
Total Excess Profit 17,199,910 -3,510,447 -12,362,211
% Change in NPR per EIPA - Regulated 4.73 7.45 5.73 % Change in NOR per EIPA - Regulated 4.84 6.61 3.65 % Change in Oper. Expense per EIPA- Regulated 3.11 6.56 4.32 % Change in Net Operating Profit- Regulated 70.90 7.92 -13.49
% Net Operating Profit of Regulated NOR 4.41 2.80 2.76 % Change in Net Operating Profit- Total 17.15 -33.73 -14.27 % Net Total Operating Profit of Total NOR 2.03 1.88 3.07 % Change in Total Excess Profit 589.96 71.60 -162.83 % Total Excess Profit of Total Revenue 7.44 -1.96 -8.12

HEALTH SERVICES COST REVIEW COMMISSION DISCLOSURE OF HOSPITAL FINANCIAL AND STATISTICAL DATA FISCAL YEAR 2009 TO 2011 Page 11 =======================================================================================================
Dorchester General Hospital
FISCAL YEAR ENDING June 2011 June 2010 June 2009 -------------- -------------- -------------- Gross Patient Revenue: Regulated Services 56,094,100 51,961,600 52,734,300 Unregulated Services 1,587,378 1,576,649 1,757,285 TOTAL 57,681,478 53,538,249 54,491,585 Net Patient Revenue(NPR): Regulated Services 47,446,616 44,769,075 44,424,176 Unregulated Services 613,466 605,883 1,332,557 TOTAL 48,060,082 45,374,958 45,756,733 Other Operating Revenue: Regulated Services 371,076 701,585 646,148 Unregulated Services 301,145 304,606 313,983 TOTAL 672,221 1,006,191 960,131 Net Operating Revenue(NOR) Regulated Services 47,817,692 45,470,660 45,070,325 Unegulated Services 914,611 910,489 1,646,540 Total 48,732,303 46,381,149 46,716,865 Total Operating Expenses: Regulated Services 41,944,947 42,143,033 43,095,616 Total 44,051,259 44,752,116 45,815,146 Equivalent Inpatient ADMs(EIPA): Regulated Services 6,169 6,229 6,344 Total 6,344 6,418 6,555 NPR per EIPA : Regulated Services 7,691.07 7,187.21 7,002.74 Total 7,576.12 7,069.96 6,980.19 NOR per EIPA : Regulated Services 7,751.22 7,299.85 7,104.60 Total 7,682.09 7,226.74 7,126.66 Operating Expenses per EIPA : Regulated Services 6,799.25 6,765.63 6,793.32 Total 6,944.17 6,972.91 6,989.11 Net Operating Profit(Loss): Regulated Services 5,872,745 3,327,627 1,974,709 Unegulated Services -1,191,701 -1,698,594 -1,072,990 Total 4,681,044 1,629,033 901,718
Total Non-Operating Profit(Loss): 671,304 52,994 11,709 Non-Operating Revenue 671,304 52,994 11,709 Non-Operating Expenses 0 0 0
Total Excess Profit 5,352,348 1,682,027 913,427
% Change in NPR per EIPA - Regulated 7.01 2.63 6.06 % Change in NOR per EIPA - Regulated 6.18 2.75 6.08 % Change in Oper. Expense per EIPA- Regulated 0.50 -0.41 6.45 % Change in Net Operating Profit- Regulated 76.48 68.51 0.55
% Net Operating Profit of Regulated NOR 12.28 7.32 4.38 % Change in Net Operating Profit- Total 187.35 80.66 27.20 % Net Total Operating Profit of Total NOR 9.61 3.51 1.93 % Change in Total Excess Profit 218.21 84.14 28.82 % Total Excess Profit of Total Revenue 10.83 3.62 1.95

HEALTH SERVICES COST REVIEW COMMISSION DISCLOSURE OF HOSPITAL FINANCIAL AND STATISTICAL DATA FISCAL YEAR 2009 TO 2011 Page 12 =======================================================================================================
Fort Washington medical Center
FISCAL YEAR ENDING December 2011 December 2010 December 2009 -------------- -------------- -------------- Gross Patient Revenue: Regulated Services 47,165,008 44,747,960 47,242,143 Unregulated Services 781,339 751,514 758,007 TOTAL 47,946,347 45,499,474 48,000,150 Net Patient Revenue(NPR): Regulated Services 38,192,640 36,812,178 38,272,727 Unregulated Services 781,339 751,514 758,007 TOTAL 38,973,979 37,563,692 39,030,734 Other Operating Revenue: Regulated Services 450,760 513,382 415,065 Unregulated Services 31,244 31,783 36,615 TOTAL 482,004 545,165 451,680 Net Operating Revenue(NOR) Regulated Services 38,643,400 37,325,560 38,687,792 Unegulated Services 812,583 783,297 794,622 Total 39,455,983 38,108,857 39,482,414 Total Operating Expenses: Regulated Services 37,259,013 36,523,900 36,925,172 Total 38,485,209 37,712,300 38,123,376 Equivalent Inpatient ADMs(EIPA): Regulated Services 5,298 5,963 6,295 Total 5,338 6,023 6,243 NPR per EIPA : Regulated Services 7,209.27 6,173.78 6,079.89 Total 7,300.74 6,236.27 6,251.60 NOR per EIPA : Regulated Services 7,294.36 6,259.88 6,145.82 Total 7,391.03 6,326.78 6,323.95 Operating Expenses per EIPA : Regulated Services 7,033.04 6,125.43 5,865.82 Total 7,209.18 6,260.94 6,106.27 Net Operating Profit(Loss): Regulated Services 1,384,387 801,660 1,762,620 Unegulated Services -413,612 -405,102 -403,582 Total 970,774 396,557 1,359,038
Total Non-Operating Profit(Loss): 4,260 5,495 5,716 Non-Operating Revenue 4,260 5,495 5,716 Non-Operating Expenses 0 0 0
Total Excess Profit 975,034 402,052 1,364,754
% Change in NPR per EIPA - Regulated 16.77 1.54 -5.35 % Change in NOR per EIPA - Regulated 16.53 1.86 -5.18 % Change in Oper. Expense per EIPA- Regulated 14.82 4.43 -5.78 % Change in Net Operating Profit- Regulated 72.69 -54.52 16.00
% Net Operating Profit of Regulated NOR 3.58 2.15 4.56 % Change in Net Operating Profit- Total 144.80 -70.82 -0.55 % Net Total Operating Profit of Total NOR 2.46 1.04 3.44 % Change in Total Excess Profit 142.51 -70.54 -0.88 % Total Excess Profit of Total Revenue 2.47 1.05 3.46

HEALTH SERVICES COST REVIEW COMMISSION DISCLOSURE OF HOSPITAL FINANCIAL AND STATISTICAL DATA FISCAL YEAR 2009 TO 2011 Page 13 =======================================================================================================
Franklin Square Hospital Center
FISCAL YEAR ENDING June 2011 June 2010 June 2009 -------------- -------------- -------------- Gross Patient Revenue: Regulated Services 439,004,200 422,965,000 414,987,900 Unregulated Services 111,702,558 102,350,792 97,498,639 TOTAL 550,706,758 525,315,792 512,486,539 Net Patient Revenue(NPR): Regulated Services 376,513,275 363,651,606 355,664,346 Unregulated Services 43,181,867 39,566,212 37,669,552 TOTAL 419,695,142 403,217,818 393,333,898 Other Operating Revenue: Regulated Services 3,180,665 2,401,832 2,231,048 Unregulated Services 4,454,235 4,968,176 5,061,555 TOTAL 7,634,900 7,370,008 7,292,603 Net Operating Revenue(NOR) Regulated Services 379,693,940 366,053,438 357,895,394 Unegulated Services 47,636,102 44,534,388 42,731,107 Total 427,330,042 410,587,826 400,626,501 Total Operating Expenses: Regulated Services 340,668,797 321,032,279 322,365,732 Total 410,262,595 383,921,437 382,897,946 Equivalent Inpatient ADMs(EIPA): Regulated Services 34,758 40,072 39,391 Total 31,080 44,476 43,667 NPR per EIPA : Regulated Services 10,832.30 9,074.89 9,029.09 Total 13,503.79 9,066.06 9,007.55 NOR per EIPA : Regulated Services 10,923.81 9,134.82 9,085.73 Total 13,749.45 9,231.77 9,174.56 Operating Expenses per EIPA : Regulated Services 9,801.06 8,011.33 8,183.76 Total 13,200.30 8,632.20 8,768.56 Net Operating Profit(Loss): Regulated Services 39,025,143 45,021,159 35,529,662 Unegulated Services -21,957,696 -18,354,770 -17,801,107 Total 17,067,447 26,666,389 17,728,555
Total Non-Operating Profit(Loss): 376,560 393,168 240,780 Non-Operating Revenue 376,560 447,480 240,780 Non-Operating Expenses 0 54,312 0
Total Excess Profit 17,444,007 27,059,557 17,969,335
% Change in NPR per EIPA - Regulated 19.37 0.51 3.08 % Change in NOR per EIPA - Regulated 19.58 0.54 2.96 % Change in Oper. Expense per EIPA- Regulated 22.34 -2.11 3.30 % Change in Net Operating Profit- Regulated -13.32 26.71 1.85
% Net Operating Profit of Regulated NOR 10.28 12.30 9.93 % Change in Net Operating Profit- Total -36.00 50.41 -13.59 % Net Total Operating Profit of Total NOR 3.99 6.49 4.43 % Change in Total Excess Profit -35.53 50.59 -13.71 % Total Excess Profit of Total Revenue 4.08 6.58 4.48
HEALTH SERVICES COST REVIEW COMMISSION DISCLOSURE OF HOSPITAL FINANCIAL AND STATISTICAL DATA FISCAL YEAR 2009 TO 2011 Page 14 =======================================================================================================
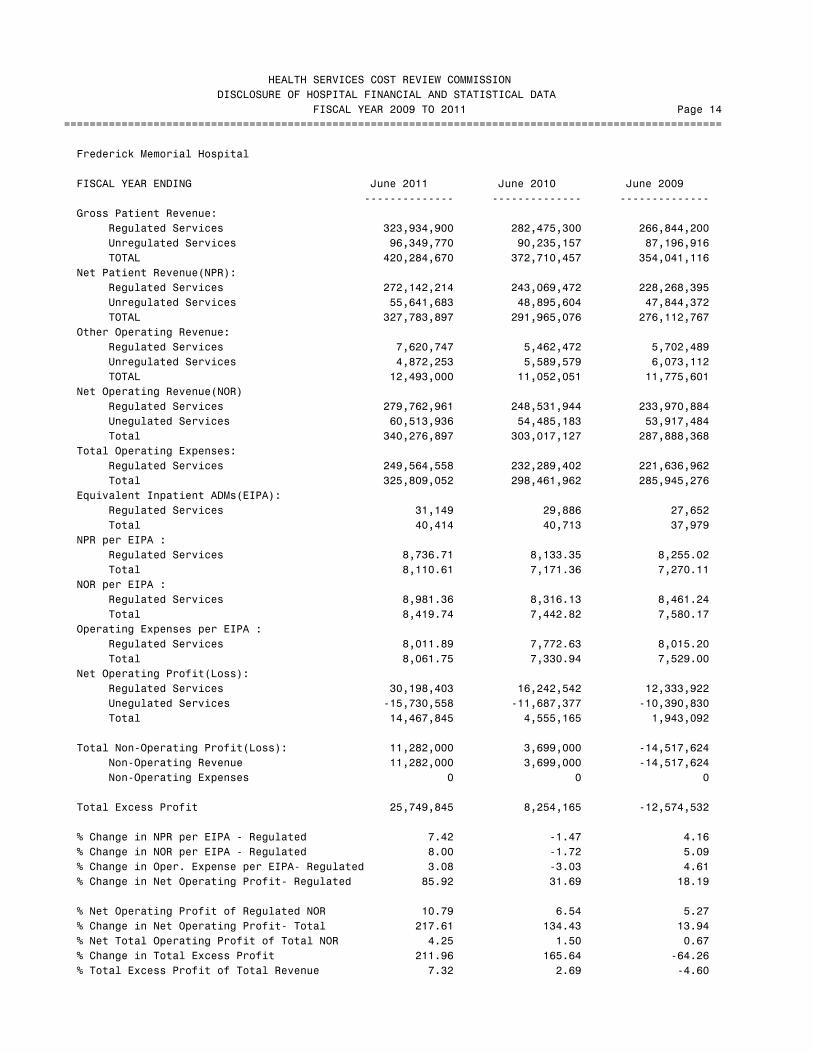
Frederick Memorial Hospital
FISCAL YEAR ENDING June 2011 June 2010 June 2009 -------------- -------------- -------------- Gross Patient Revenue: Regulated Services 323,934,900 282,475,300 266,844,200 Unregulated Services 96,349,770 90,235,157 87,196,916 TOTAL 420,284,670 372,710,457 354,041,116 Net Patient Revenue(NPR): Regulated Services 272,142,214 243,069,472 228,268,395 Unregulated Services 55,641,683 48,895,604 47,844,372 TOTAL 327,783,897 291,965,076 276,112,767 Other Operating Revenue: Regulated Services 7,620,747 5,462,472 5,702,489 Unregulated Services 4,872,253 5,589,579 6,073,112 TOTAL 12,493,000 11,052,051 11,775,601 Net Operating Revenue(NOR) Regulated Services 279,762,961 248,531,944 233,970,884 Unegulated Services 60,513,936 54,485,183 53,917,484 Total 340,276,897 303,017,127 287,888,368 Total Operating Expenses: Regulated Services 249,564,558 232,289,402 221,636,962 Total 325,809,052 298,461,962 285,945,276 Equivalent Inpatient ADMs(EIPA): Regulated Services 31,149 29,886 27,652 Total 40,414 40,713 37,979 NPR per EIPA : Regulated Services 8,736.71 8,133.35 8,255.02 Total 8,110.61 7,171.36 7,270.11 NOR per EIPA : Regulated Services 8,981.36 8,316.13 8,461.24 Total 8,419.74 7,442.82 7,580.17 Operating Expenses per EIPA : Regulated Services 8,011.89 7,772.63 8,015.20 Total 8,061.75 7,330.94 7,529.00 Net Operating Profit(Loss): Regulated Services 30,198,403 16,242,542 12,333,922 Unegulated Services -15,730,558 -11,687,377 -10,390,830 Total 14,467,845 4,555,165 1,943,092
Total Non-Operating Profit(Loss): 11,282,000 3,699,000 -14,517,624 Non-Operating Revenue 11,282,000 3,699,000 -14,517,624 Non-Operating Expenses 0 0 0
Total Excess Profit 25,749,845 8,254,165 -12,574,532
% Change in NPR per EIPA - Regulated 7.42 -1.47 4.16 % Change in NOR per EIPA - Regulated 8.00 -1.72 5.09 % Change in Oper. Expense per EIPA- Regulated 3.08 -3.03 4.61 % Change in Net Operating Profit- Regulated 85.92 31.69 18.19
% Net Operating Profit of Regulated NOR 10.79 6.54 5.27 % Change in Net Operating Profit- Total 217.61 134.43 13.94 % Net Total Operating Profit of Total NOR 4.25 1.50 0.67 % Change in Total Excess Profit 211.96 165.64 -64.26 % Total Excess Profit of Total Revenue 7.32 2.69 -4.60

HEALTH SERVICES COST REVIEW COMMISSION DISCLOSURE OF HOSPITAL FINANCIAL AND STATISTICAL DATA FISCAL YEAR 2009 TO 2011 Page 15 =======================================================================================================
Garrett County Memorial Hospital
FISCAL YEAR ENDING June 2011 June 2010 June 2009 -------------- -------------- -------------- Gross Patient Revenue: Regulated Services 40,536,700 39,731,000 36,812,400 Unregulated Services 7,680,248 8,363,635 8,470,855 TOTAL 48,216,948 48,094,635 45,283,255 Net Patient Revenue(NPR): Regulated Services 32,414,248 32,709,321 31,258,085 Unregulated Services 4,792,388 5,782,327 5,788,328 TOTAL 37,206,636 38,491,648 37,046,414 Other Operating Revenue: Regulated Services 116,971 211,887 110,915 Unregulated Services 622,209 381,134 381,695 TOTAL 739,180 593,021 492,610 Net Operating Revenue(NOR) Regulated Services 32,531,219 32,921,208 31,369,000 Unegulated Services 5,414,597 6,163,461 6,170,023 Total 37,945,816 39,084,669 37,539,024 Total Operating Expenses: Regulated Services 30,293,633 29,121,065 29,787,595 Total 36,053,685 34,610,116 35,627,406 Equivalent Inpatient ADMs(EIPA): Regulated Services 4,705 4,882 4,936 Total 5,610 5,835 6,009 NPR per EIPA : Regulated Services 6,889.14 6,700.27 6,332.68 Total 6,632.23 6,597.16 6,165.51 NOR per EIPA : Regulated Services 6,914.00 6,743.67 6,355.15 Total 6,763.99 6,698.80 6,247.50 Operating Expenses per EIPA : Regulated Services 6,438.43 5,965.24 6,034.77 Total 6,426.71 5,931.89 5,929.35 Net Operating Profit(Loss): Regulated Services 2,237,587 3,800,143 1,581,406 Unegulated Services -345,456 674,411 330,212 Total 1,892,131 4,474,553 1,911,618
Total Non-Operating Profit(Loss): 923,010 498,404 -268,839 Non-Operating Revenue 886,106 613,504 140,662 Non-Operating Expenses -36,904 115,100 409,501
Total Excess Profit 2,815,141 4,972,957 1,642,779
% Change in NPR per EIPA - Regulated 2.82 5.80 11.17 % Change in NOR per EIPA - Regulated 2.53 6.11 9.64 % Change in Oper. Expense per EIPA- Regulated 7.93 -1.15 2.70 % Change in Net Operating Profit- Regulated -41.12 140.30 512.23
% Net Operating Profit of Regulated NOR 6.88 11.54 5.04 % Change in Net Operating Profit- Total -57.71 134.07 465.35 % Net Total Operating Profit of Total NOR 4.99 11.45 5.09 % Change in Total Excess Profit -43.39 202.72 186.44 % Total Excess Profit of Total Revenue 7.25 12.53 4.36

HEALTH SERVICES COST REVIEW COMMISSION DISCLOSURE OF HOSPITAL FINANCIAL AND STATISTICAL DATA FISCAL YEAR 2009 TO 2011 Page 16 =======================================================================================================
Good Samaritan Hospital
FISCAL YEAR ENDING June 2011 June 2010 June 2009 -------------- -------------- -------------- Gross Patient Revenue: Regulated Services 304,134,300 294,819,900 286,296,100 Unregulated Services 129,542,085 123,302,881 116,863,438 TOTAL 433,676,385 418,122,781 403,159,538 Net Patient Revenue(NPR): Regulated Services 259,358,444 246,725,068 245,593,552 Unregulated Services 43,305,707 48,148,513 48,493,772 TOTAL 302,664,151 294,873,581 294,087,324 Other Operating Revenue: Regulated Services 2,523,080 2,699,822 2,253,136 Unregulated Services 1,375,499 1,017,267 1,347,200 TOTAL 3,898,579 3,717,089 3,600,336 Net Operating Revenue(NOR) Regulated Services 261,881,525 249,424,890 247,846,688 Unegulated Services 44,681,205 49,165,780 49,840,972 Total 306,562,730 298,590,670 297,687,660 Total Operating Expenses: Regulated Services 235,303,147 230,578,507 227,853,252 Total 300,253,364 294,051,048 289,772,684 Equivalent Inpatient ADMs(EIPA): Regulated Services 22,357 24,188 23,949 Total 26,986 29,947 28,831 NPR per EIPA : Regulated Services 11,601.00 10,200.43 10,254.89 Total 11,215.41 9,846.47 10,200.56 NOR per EIPA : Regulated Services 11,713.86 10,312.05 10,348.97 Total 11,359.87 9,970.59 10,325.44 Operating Expenses per EIPA : Regulated Services 10,525.02 9,532.88 9,514.13 Total 11,126.08 9,819.00 10,050.91 Net Operating Profit(Loss): Regulated Services 26,578,377 18,846,383 19,993,436 Unegulated Services -20,269,011 -14,306,761 -12,078,459 Total 6,309,366 4,539,622 7,914,976
Total Non-Operating Profit(Loss): 836,158 2,566,200 1,381,738 Non-Operating Revenue 836,158 2,566,200 1,381,738 Non-Operating Expenses 0 0 0
Total Excess Profit 7,145,524 7,105,822 9,296,714
% Change in NPR per EIPA - Regulated 13.73 -0.53 3.61 % Change in NOR per EIPA - Regulated 13.59 -0.36 3.60 % Change in Oper. Expense per EIPA- Regulated 10.41 0.20 1.17 % Change in Net Operating Profit- Regulated 41.03 -5.74 51.01
% Net Operating Profit of Regulated NOR 10.15 7.56 8.07 % Change in Net Operating Profit- Total 38.98 -42.65 75.15 % Net Total Operating Profit of Total NOR 2.06 1.52 2.66 % Change in Total Excess Profit 0.56 -23.57 19.76 % Total Excess Profit of Total Revenue 2.32 2.36 3.11

HEALTH SERVICES COST REVIEW COMMISSION DISCLOSURE OF HOSPITAL FINANCIAL AND STATISTICAL DATA FISCAL YEAR 2009 TO 2011 Page 17 =======================================================================================================
Greater Baltimore Medical Center
FISCAL YEAR ENDING June 2011 June 2010 June 2009 -------------- -------------- -------------- Gross Patient Revenue: Regulated Services 427,052,500 412,551,300 393,162,100 Unregulated Services 41,854,997 33,189,606 28,222,151 TOTAL 468,907,497 445,740,906 421,384,251 Net Patient Revenue(NPR): Regulated Services 366,631,415 359,160,116 351,006,608 Unregulated Services 21,670,921 17,622,366 16,603,476 TOTAL 388,302,336 376,782,482 367,610,084 Other Operating Revenue: Regulated Services 4,534,388 3,350,717 4,545,895 Unregulated Services 9,811,444 7,496,660 7,615,507 TOTAL 14,345,832 10,847,377 12,161,402 Net Operating Revenue(NOR) Regulated Services 371,165,803 362,510,833 355,552,503 Unegulated Services 31,482,365 25,119,026 24,218,983 Total 402,648,168 387,629,859 379,771,486 Total Operating Expenses: Regulated Services 336,781,695 334,819,819 325,771,985 Total 383,916,507 372,915,674 361,315,422 Equivalent Inpatient ADMs(EIPA): Regulated Services 35,457 36,297 36,623 Total 36,232 36,439 36,990 NPR per EIPA : Regulated Services 10,340.03 9,895.04 9,584.44 Total 10,717.01 10,340.20 9,938.11 NOR per EIPA : Regulated Services 10,467.92 9,987.35 9,708.57 Total 11,112.95 10,637.88 10,266.88 Operating Expenses per EIPA : Regulated Services 9,498.19 9,224.45 8,895.40 Total 10,595.96 10,234.08 9,767.93 Net Operating Profit(Loss): Regulated Services 34,384,108 27,691,014 29,780,518 Unegulated Services -15,652,447 -12,976,829 -11,324,454 Total 18,731,661 14,714,185 18,456,064
Total Non-Operating Profit(Loss): 6,204,084 9,037 -1,831,394 Non-Operating Revenue 7,100,813 2,438,826 947,777 Non-Operating Expenses 896,729 2,429,789 2,779,171
Total Excess Profit 24,935,745 14,723,222 16,624,670
% Change in NPR per EIPA - Regulated 4.50 3.24 8.70 % Change in NOR per EIPA - Regulated 4.81 2.87 8.71 % Change in Oper. Expense per EIPA- Regulated 2.97 3.70 4.51 % Change in Net Operating Profit- Regulated 24.17 -7.02 91.14
% Net Operating Profit of Regulated NOR 9.26 7.64 8.38 % Change in Net Operating Profit- Total 27.30 -20.27 594.35 % Net Total Operating Profit of Total NOR 4.65 3.80 4.86 % Change in Total Excess Profit 69.36 -11.44 282.23 % Total Excess Profit of Total Revenue 6.09 3.77 4.37

HEALTH SERVICES COST REVIEW COMMISSION DISCLOSURE OF HOSPITAL FINANCIAL AND STATISTICAL DATA FISCAL YEAR 2009 TO 2011 Page 18 =======================================================================================================
Harbor Hospital Center
FISCAL YEAR ENDING June 2011 June 2010 June 2009 -------------- -------------- -------------- Gross Patient Revenue: Regulated Services 200,717,500 197,161,200 200,915,200 Unregulated Services 36,785,890 37,703,996 36,590,738 TOTAL 237,503,390 234,865,196 237,505,938 Net Patient Revenue(NPR): Regulated Services 165,509,687 164,310,074 169,691,122 Unregulated Services 15,245,494 15,375,573 14,811,677 TOTAL 180,755,181 179,685,647 184,502,799 Other Operating Revenue: Regulated Services 3,295,795 2,207,599 2,672,013 Unregulated Services 7,445,500 8,090,569 7,116,396 TOTAL 10,741,295 10,298,168 9,788,409 Net Operating Revenue(NOR) Regulated Services 168,805,482 166,517,673 172,363,135 Unegulated Services 22,690,994 23,466,142 21,928,073 Total 191,496,476 189,983,815 194,291,208 Total Operating Expenses: Regulated Services 156,221,586 156,405,328 165,072,123 Total 183,840,512 183,721,998 188,476,023 Equivalent Inpatient ADMs(EIPA): Regulated Services 15,536 17,511 18,443 Total 16,210 18,358 19,382 NPR per EIPA : Regulated Services 10,653.05 9,383.37 9,200.93 Total 11,150.63 9,787.72 9,519.50 NOR per EIPA : Regulated Services 10,865.19 9,509.44 9,345.81 Total 11,813.26 10,348.68 10,024.53 Operating Expenses per EIPA : Regulated Services 10,055.22 8,931.94 8,950.48 Total 11,340.97 10,007.59 9,724.50 Net Operating Profit(Loss): Regulated Services 12,583,896 10,112,345 7,291,012 Unegulated Services -4,927,932 -3,850,528 -1,475,827 Total 7,655,964 6,261,817 5,815,185
Total Non-Operating Profit(Loss): 157,915 121,052 174,456 Non-Operating Revenue 157,915 121,052 174,456 Non-Operating Expenses 0 0 0
Total Excess Profit 7,813,879 6,382,869 5,989,641
% Change in NPR per EIPA - Regulated 13.53 1.98 3.88 % Change in NOR per EIPA - Regulated 14.26 1.75 4.45 % Change in Oper. Expense per EIPA- Regulated 12.58 -0.21 3.75 % Change in Net Operating Profit- Regulated 24.44 38.70 25.00
% Net Operating Profit of Regulated NOR 7.45 6.07 4.23 % Change in Net Operating Profit- Total 22.26 7.68 -12.67 % Net Total Operating Profit of Total NOR 4.00 3.30 2.99 % Change in Total Excess Profit 22.42 6.57 -14.79 % Total Excess Profit of Total Revenue 4.08 3.36 3.08

HEALTH SERVICES COST REVIEW COMMISSION DISCLOSURE OF HOSPITAL FINANCIAL AND STATISTICAL DATA FISCAL YEAR 2009 TO 2011 Page 19 =======================================================================================================
Harford Memorial Hospital
FISCAL YEAR ENDING December 2011 December 2010 December 2009 -------------- -------------- -------------- Gross Patient Revenue: Regulated Services 100,465,500 100,141,200 96,235,600 Unregulated Services 221,600 94,100 177,100 TOTAL 100,687,100 100,235,300 96,412,700 Net Patient Revenue(NPR): Regulated Services 80,367,789 81,680,300 78,372,221 Unregulated Services 151,800 37,700 120,700 TOTAL 80,519,589 81,718,000 78,492,921 Other Operating Revenue: Regulated Services 1,091,500 763,700 710,400 Unregulated Services 488,500 476,300 470,700 TOTAL 1,580,000 1,240,000 1,181,100 Net Operating Revenue(NOR) Regulated Services 81,459,289 82,444,000 79,082,621 Unegulated Services 640,300 514,000 591,400 Total 82,099,589 82,958,000 79,674,021 Total Operating Expenses: Regulated Services 77,961,016 76,898,545 75,803,751 Total 80,374,000 79,662,900 77,244,100 Equivalent Inpatient ADMs(EIPA): Regulated Services 10,041 11,255 11,686 Total 10,063 11,265 11,707 NPR per EIPA : Regulated Services 8,003.72 7,257.39 6,706.72 Total 8,001.19 7,253.92 6,704.71 NOR per EIPA : Regulated Services 8,112.42 7,325.25 6,767.51 Total 8,158.20 7,364.00 6,805.60 Operating Expenses per EIPA : Regulated Services 7,764.04 6,832.53 6,486.92 Total 7,986.73 7,071.50 6,598.04 Net Operating Profit(Loss): Regulated Services 3,498,273 5,545,455 3,278,870 Unegulated Services -1,772,684 -2,250,355 -848,949 Total 1,725,589 3,295,100 2,429,921
Total Non-Operating Profit(Loss): -621,000 5,190,000 7,260,800 Non-Operating Revenue 0 5,190,000 7,479,400 Non-Operating Expenses 621,000 0 218,600
Total Excess Profit 1,104,589 8,485,100 9,690,721
% Change in NPR per EIPA - Regulated 10.28 8.21 6.81 % Change in NOR per EIPA - Regulated 10.75 8.24 7.60 % Change in Oper. Expense per EIPA- Regulated 13.63 5.33 9.40 % Change in Net Operating Profit- Regulated -36.92 69.13 -28.08
% Net Operating Profit of Regulated NOR 4.29 6.73 4.15 % Change in Net Operating Profit- Total -47.63 35.61 -37.98 % Net Total Operating Profit of Total NOR 2.10 3.97 3.05 % Change in Total Excess Profit -86.98 -12.44 165.29 % Total Excess Profit of Total Revenue 1.35 9.63 11.12

HEALTH SERVICES COST REVIEW COMMISSION DISCLOSURE OF HOSPITAL FINANCIAL AND STATISTICAL DATA FISCAL YEAR 2009 TO 2011 Page 20 =======================================================================================================
Holy Cross Hospital
FISCAL YEAR ENDING June 2011 June 2010 June 2009 -------------- -------------- -------------- Gross Patient Revenue: Regulated Services 437,749,300 411,325,700 394,466,500 Unregulated Services 32,444,200 35,005,000 33,989,800 TOTAL 470,193,500 446,330,700 428,456,300 Net Patient Revenue(NPR): Regulated Services 361,064,200 341,997,483 332,740,684 Unregulated Services 19,951,900 21,223,300 21,529,500 TOTAL 381,016,100 363,220,783 354,270,184 Other Operating Revenue: Regulated Services 3,857,791 1,396,700 2,420,600 Unregulated Services 11,406,409 11,161,300 11,330,300 TOTAL 15,264,200 12,558,000 13,750,900 Net Operating Revenue(NOR) Regulated Services 364,921,991 343,394,183 335,161,284 Unegulated Services 31,358,309 32,384,600 32,859,800 Total 396,280,300 375,778,783 368,021,084 Total Operating Expenses: Regulated Services 326,261,891 311,789,082 309,458,016 Total 369,945,500 353,793,200 349,019,900 Equivalent Inpatient ADMs(EIPA): Regulated Services 39,880 38,770 38,000 Total 42,836 42,070 41,216 NPR per EIPA : Regulated Services 9,053.69 8,821.08 8,756.24 Total 8,894.74 8,633.78 8,595.40 NOR per EIPA : Regulated Services 9,150.42 8,857.10 8,819.94 Total 9,251.08 8,932.28 8,929.03 Operating Expenses per EIPA : Regulated Services 8,181.02 8,041.92 8,143.55 Total 8,636.30 8,409.68 8,468.02 Net Operating Profit(Loss): Regulated Services 38,660,100 31,605,101 25,703,268 Unegulated Services -12,325,300 -9,619,518 -6,702,084 Total 26,334,800 21,985,583 19,001,184
Total Non-Operating Profit(Loss): 17,357,300 9,766,800 -18,839,400 Non-Operating Revenue 17,357,300 9,766,800 -18,839,400 Non-Operating Expenses 0 0 0
Total Excess Profit 43,692,100 31,752,383 161,784
% Change in NPR per EIPA - Regulated 2.64 0.74 -3.79 % Change in NOR per EIPA - Regulated 3.31 0.42 -3.64 % Change in Oper. Expense per EIPA- Regulated 1.73 -1.25 -0.42 % Change in Net Operating Profit- Regulated 22.32 22.96 -26.57
% Net Operating Profit of Regulated NOR 10.59 9.20 7.67 % Change in Net Operating Profit- Total 19.78 15.71 -19.32 % Net Total Operating Profit of Total NOR 6.65 5.85 5.16 % Change in Total Excess Profit 37.60 19,526.40 -99.21 % Total Excess Profit of Total Revenue 10.56 8.24 0.05

HEALTH SERVICES COST REVIEW COMMISSION DISCLOSURE OF HOSPITAL FINANCIAL AND STATISTICAL DATA FISCAL YEAR 2009 TO 2011 Page 21 =======================================================================================================
Howard County General Hospital
FISCAL YEAR ENDING June 2011 June 2010 June 2009 -------------- -------------- -------------- Gross Patient Revenue: Regulated Services 255,470,400 244,838,400 230,685,500 Unregulated Services 0 20,581,565 19,115,758 TOTAL 255,470,400 265,419,965 249,801,258 Net Patient Revenue(NPR): Regulated Services 219,286,242 211,253,743 202,845,676 Unregulated Services 0 11,661,033 10,365,793 TOTAL 219,286,242 222,914,776 213,211,469 Other Operating Revenue: Regulated Services 54,362 43,685 52,447 Unregulated Services 2,237,797 2,736,258 2,413,954 TOTAL 2,292,159 2,779,943 2,466,401 Net Operating Revenue(NOR) Regulated Services 219,340,604 211,297,428 202,898,123 Unegulated Services 2,237,797 14,397,291 12,779,747 Total 221,578,401 225,694,719 215,677,870 Total Operating Expenses: Regulated Services 205,527,459 201,837,199 187,698,057 Total 216,227,019 223,727,115 207,211,827 Equivalent Inpatient ADMs(EIPA): Regulated Services 24,924 23,760 22,589 Total 24,924 22,852 21,689 NPR per EIPA : Regulated Services 8,798.34 8,890.97 8,979.76 Total 8,798.34 9,754.61 9,830.21 NOR per EIPA : Regulated Services 8,800.52 8,892.80 8,982.08 Total 8,890.31 9,876.25 9,943.92 Operating Expenses per EIPA : Regulated Services 8,246.30 8,494.65 8,309.19 Total 8,675.60 9,790.15 9,553.59 Net Operating Profit(Loss): Regulated Services 13,813,145 9,460,229 15,200,066 Unegulated Services -8,461,763 -7,492,625 -6,734,024 Total 5,351,382 1,967,604 8,466,043
Total Non-Operating Profit(Loss): 3,847,185 -6,200,840 -3,464,586 Non-Operating Revenue 669,164 809,508 1,467,414 Non-Operating Expenses -3,178,021 7,010,348 4,932,000
Total Excess Profit 9,198,567 -4,233,236 5,001,457
% Change in NPR per EIPA - Regulated -1.04 -0.99 -0.39 % Change in NOR per EIPA - Regulated -1.04 -0.99 -0.40 % Change in Oper. Expense per EIPA- Regulated -2.92 2.23 -3.04 % Change in Net Operating Profit- Regulated 46.01 -37.76 61.83
% Net Operating Profit of Regulated NOR 6.30 4.48 7.49 % Change in Net Operating Profit- Total 171.97 -76.76 65.33 % Net Total Operating Profit of Total NOR 2.42 0.87 3.93 % Change in Total Excess Profit 317.29 -184.64 42.90 % Total Excess Profit of Total Revenue 4.14 -1.87 2.30

HEALTH SERVICES COST REVIEW COMMISSION DISCLOSURE OF HOSPITAL FINANCIAL AND STATISTICAL DATA FISCAL YEAR 2009 TO 2011 Page 22 =======================================================================================================
James Lawrence Kernan Hospital
FISCAL YEAR ENDING June 2011 June 2010 June 2009 -------------- -------------- -------------- Gross Patient Revenue: Regulated Services 103,574,600 101,537,800 105,778,700 Unregulated Services 1,928,233 0 3,679,257 TOTAL 105,502,833 101,537,800 109,457,957 Net Patient Revenue(NPR): Regulated Services 88,207,600 87,319,800 93,226,825 Unregulated Services 1,143,233 -1,353,000 1,681,665 TOTAL 89,350,833 85,966,800 94,908,490 Other Operating Revenue: Regulated Services 618,529 597,071 886,935 Unregulated Services 1,955,016 4,866,129 1,610,065 TOTAL 2,573,545 5,463,200 2,497,000 Net Operating Revenue(NOR) Regulated Services 88,826,129 87,916,871 94,113,760 Unegulated Services 3,098,248 3,513,129 3,291,730 Total 91,924,378 91,430,000 97,405,490 Total Operating Expenses: Regulated Services 87,246,523 87,012,906 91,630,182 Total 90,594,000 91,563,920 95,194,646 Equivalent Inpatient ADMs(EIPA): Regulated Services 5,250 4,997 5,087 Total 5,348 4,997 5,264 NPR per EIPA : Regulated Services 16,799.86 17,473.40 18,326.10 Total 16,706.57 17,202.65 18,029.56 NOR per EIPA : Regulated Services 16,917.66 17,592.88 18,500.45 Total 17,187.77 18,295.88 18,503.91 Operating Expenses per EIPA : Regulated Services 16,616.81 17,411.99 18,012.24 Total 16,939.02 18,322.68 18,083.92 Net Operating Profit(Loss): Regulated Services 1,579,606 903,964 2,483,578 Unegulated Services -249,229 -1,037,884 -272,734 Total 1,330,378 -133,920 2,210,844
Total Non-Operating Profit(Loss): 1,932,000 1,309,000 -1,421,199 Non-Operating Revenue 1,932,000 1,309,000 397,501 Non-Operating Expenses 0 0 1,818,700
Total Excess Profit 3,262,378 1,175,080 789,645
% Change in NPR per EIPA - Regulated -3.85 -4.65 6.83 % Change in NOR per EIPA - Regulated -3.84 -4.91 2.36 % Change in Oper. Expense per EIPA- Regulated -4.57 -3.33 3.48 % Change in Net Operating Profit- Regulated 74.74 -63.60 -26.61
% Net Operating Profit of Regulated NOR 1.78 1.03 2.64 % Change in Net Operating Profit- Total 1,093.41 -106.06 22.38 % Net Total Operating Profit of Total NOR 1.45 -0.15 2.27 % Change in Total Excess Profit 177.63 48.81 -69.05 % Total Excess Profit of Total Revenue 3.48 1.27 0.81

HEALTH SERVICES COST REVIEW COMMISSION DISCLOSURE OF HOSPITAL FINANCIAL AND STATISTICAL DATA FISCAL YEAR 2009 TO 2011 Page 23 =======================================================================================================
Johns Hopkins Bayview Medical Center
FISCAL YEAR ENDING June 2011 June 2010 June 2009 -------------- -------------- -------------- Gross Patient Revenue: Regulated Services 530,152,100 518,108,900 513,495,600 Unregulated Services 9,081,800 9,797,300 9,715,700 TOTAL 539,233,900 527,906,200 523,211,300 Net Patient Revenue(NPR): Regulated Services 436,873,400 430,968,800 431,873,500 Unregulated Services 8,526,800 9,381,300 9,028,700 TOTAL 445,400,200 440,350,100 440,902,200 Other Operating Revenue: Regulated Services 7,822,600 7,030,600 9,289,900 Unregulated Services 41,217,000 37,923,500 41,450,300 TOTAL 49,039,600 44,954,100 50,740,200 Net Operating Revenue(NOR) Regulated Services 444,696,000 437,999,400 441,163,400 Unegulated Services 49,743,800 47,304,800 50,479,000 Total 494,439,800 485,304,200 491,642,400 Total Operating Expenses: Regulated Services 428,009,429 427,728,068 427,307,515 Total 489,673,000 484,383,800 490,071,966 Equivalent Inpatient ADMs(EIPA): Regulated Services 34,562 33,626 33,167 Total 35,274 34,271 33,623 NPR per EIPA : Regulated Services 12,640.17 12,816.61 13,021.25 Total 12,626.75 12,849.16 13,112.95 NOR per EIPA : Regulated Services 12,866.50 13,025.69 13,301.35 Total 14,016.98 14,160.90 14,622.03 Operating Expenses per EIPA : Regulated Services 12,383.71 12,720.23 12,883.58 Total 13,881.85 14,134.04 14,575.32 Net Operating Profit(Loss): Regulated Services 16,686,571 10,271,332 13,855,885 Unegulated Services -11,919,771 -9,350,932 -12,285,451 Total 4,766,800 920,400 1,570,434
Total Non-Operating Profit(Loss): 1,430,200 1,424,600 -6,894,800 Non-Operating Revenue 1,430,200 1,424,600 -6,894,800 Non-Operating Expenses 0 0 0
Total Excess Profit 6,197,000 2,345,000 -5,324,366
% Change in NPR per EIPA - Regulated -1.38 -1.57 3.66 % Change in NOR per EIPA - Regulated -1.22 -2.07 3.79 % Change in Oper. Expense per EIPA- Regulated -2.65 -1.27 2.88 % Change in Net Operating Profit- Regulated 62.46 -25.87 43.39
% Net Operating Profit of Regulated NOR 3.75 2.35 3.14 % Change in Net Operating Profit- Total 417.91 -41.39 -66.01 % Net Total Operating Profit of Total NOR 0.96 0.19 0.32 % Change in Total Excess Profit 164.26 144.04 -473.80 % Total Excess Profit of Total Revenue 1.25 0.48 -1.10

HEALTH SERVICES COST REVIEW COMMISSION DISCLOSURE OF HOSPITAL FINANCIAL AND STATISTICAL DATA FISCAL YEAR 2009 TO 2011 Page 24 =======================================================================================================
Johns Hopkins Hospital
FISCAL YEAR ENDING June 2011 June 2010 June 2009 -------------- -------------- -------------- Gross Patient Revenue: Regulated Services 1,772,066,300 1,709,103,100 1,620,280,400 Unregulated Services 7,944,657 5,651,044 5,439,920 TOTAL 1,780,010,957 1,714,754,144 1,625,720,320 Net Patient Revenue(NPR): Regulated Services 1,526,449,134 1,480,465,000 1,412,843,376 Unregulated Services 6,972,290 4,780,844 5,242,157 TOTAL 1,533,421,424 1,485,245,844 1,418,085,533 Other Operating Revenue: Regulated Services 13,482,919 12,978,862 12,601,700 Unregulated Services 121,610,341 112,518,817 102,060,174 TOTAL 135,093,260 125,497,679 114,661,874 Net Operating Revenue(NOR) Regulated Services 1,539,932,053 1,493,443,862 1,425,445,076 Unegulated Services 128,582,631 117,299,661 107,302,331 Total 1,668,514,684 1,610,743,523 1,532,747,407 Total Operating Expenses: Regulated Services 1,477,115,734 1,425,987,171 1,359,674,406 Total 1,610,358,429 1,551,076,600 1,470,612,081 Equivalent Inpatient ADMs(EIPA): Regulated Services 70,010 70,234 69,843 Total 70,607 70,947 70,526 NPR per EIPA : Regulated Services 21,803.16 21,078.89 20,228.93 Total 21,717.55 20,934.49 20,107.21 NOR per EIPA : Regulated Services 21,995.74 21,263.68 20,409.36 Total 23,630.85 22,703.37 21,733.02 Operating Expenses per EIPA : Regulated Services 21,098.50 20,303.23 19,467.66 Total 22,807.20 21,862.37 20,852.00 Net Operating Profit(Loss): Regulated Services 62,816,319 67,456,691 65,770,670 Unegulated Services -4,660,064 -7,789,768 -3,635,344 Total 58,156,255 59,666,923 62,135,326
Total Non-Operating Profit(Loss): 23,520,276 20,587,163 -55,201,263 Non-Operating Revenue 23,520,276 20,587,163 21,156,737 Non-Operating Expenses 0 0 76,358,000
Total Excess Profit 81,676,531 80,254,086 6,934,063
% Change in NPR per EIPA - Regulated 3.44 4.20 3.13 % Change in NOR per EIPA - Regulated 3.44 4.19 3.09 % Change in Oper. Expense per EIPA- Regulated 3.92 4.29 1.23 % Change in Net Operating Profit- Regulated -6.88 2.56 71.55
% Net Operating Profit of Regulated NOR 4.08 4.52 4.61 % Change in Net Operating Profit- Total -2.53 -3.97 46.91 % Net Total Operating Profit of Total NOR 3.49 3.70 4.05 % Change in Total Excess Profit 1.77 1,057.39 -90.04 % Total Excess Profit of Total Revenue 4.83 4.92 0.45

HEALTH SERVICES COST REVIEW COMMISSION DISCLOSURE OF HOSPITAL FINANCIAL AND STATISTICAL DATA FISCAL YEAR 2009 TO 2011 Page 25 =======================================================================================================
Laurel Regional Hospital
FISCAL YEAR ENDING June 2011 June 2010 June 2009 -------------- -------------- -------------- Gross Patient Revenue: Regulated Services 103,068,600 102,846,900 91,640,000 Unregulated Services 4,033,188 4,249,425 4,540,332 TOTAL 107,101,788 107,096,325 96,180,332 Net Patient Revenue(NPR): Regulated Services 84,354,149 85,075,631 76,473,729 Unregulated Services 1,324,486 1,232,334 1,295,259 TOTAL 85,678,636 86,307,965 77,768,988 Other Operating Revenue: Regulated Services 625,721 430,579 751,054 Unregulated Services 191,582 0 0 TOTAL 817,303 430,579 751,054 Net Operating Revenue(NOR) Regulated Services 84,979,870 85,506,210 77,224,783 Unegulated Services 1,516,069 1,232,334 1,295,259 Total 86,495,939 86,738,544 78,520,042 Total Operating Expenses: Regulated Services 87,305,281 85,563,681 83,281,501 Total 94,179,139 92,314,140 90,274,361 Equivalent Inpatient ADMs(EIPA): Regulated Services 9,477 9,669 10,045 Total 9,847 9,459 9,825 NPR per EIPA : Regulated Services 8,901.30 8,798.81 7,612.76 Total 8,700.60 9,124.70 7,915.10 NOR per EIPA : Regulated Services 8,967.33 8,843.34 7,687.53 Total 8,783.60 9,170.22 7,991.54 Operating Expenses per EIPA : Regulated Services 9,212.72 8,849.29 8,290.46 Total 9,563.82 9,759.69 9,187.86 Net Operating Profit(Loss): Regulated Services -2,325,411 -57,471 -6,056,718 Unegulated Services -5,357,789 -5,518,125 -5,697,601 Total -7,683,200 -5,575,596 -11,754,319
Total Non-Operating Profit(Loss): 8,601,136 6,056,896 63,350 Non-Operating Revenue 8,601,136 6,056,896 63,350 Non-Operating Expenses 0 0 0
Total Excess Profit 917,936 481,300 -11,690,969
% Change in NPR per EIPA - Regulated 1.16 15.58 -3.99 % Change in NOR per EIPA - Regulated 1.40 15.03 -3.66 % Change in Oper. Expense per EIPA- Regulated 4.11 6.74 1.41 % Change in Net Operating Profit- Regulated -3,946.23 99.05 -216.56
% Net Operating Profit of Regulated NOR -2.74 -0.07 -7.84 % Change in Net Operating Profit- Total -37.80 52.57 -68.66 % Net Total Operating Profit of Total NOR -8.88 -6.43 -14.97 % Change in Total Excess Profit 90.72 104.12 -74.44 % Total Excess Profit of Total Revenue 0.97 0.52 -14.88

HEALTH SERVICES COST REVIEW COMMISSION DISCLOSURE OF HOSPITAL FINANCIAL AND STATISTICAL DATA FISCAL YEAR 2009 TO 2011 Page 26 =======================================================================================================
Maryland General Hospital
FISCAL YEAR ENDING June 2011 June 2010 June 2009 -------------- -------------- -------------- Gross Patient Revenue: Regulated Services 183,154,500 178,831,900 181,868,000 Unregulated Services 8,412,068 8,126,907 8,435,023 TOTAL 191,566,568 186,958,807 190,303,023 Net Patient Revenue(NPR): Regulated Services 155,116,834 153,660,657 156,919,437 Unregulated Services 8,339,749 8,003,532 8,315,856 TOTAL 163,456,583 161,664,189 165,235,293 Other Operating Revenue: Regulated Services 132,329 281,654 1,174,660 Unregulated Services 1,203,226 1,312,747 1,054,110 TOTAL 1,335,555 1,594,401 2,228,770 Net Operating Revenue(NOR) Regulated Services 155,249,163 153,942,311 158,094,097 Unegulated Services 9,542,975 9,316,279 9,369,966 Total 164,792,138 163,258,590 167,464,063 Total Operating Expenses: Regulated Services 136,759,389 136,446,598 142,361,768 Total 160,525,000 160,331,953 166,541,201 Equivalent Inpatient ADMs(EIPA): Regulated Services 13,553 14,282 14,862 Total 14,175 14,931 15,551 NPR per EIPA : Regulated Services 11,445.47 10,758.77 10,558.79 Total 11,531.21 10,827.11 10,625.53 NOR per EIPA : Regulated Services 11,455.23 10,778.49 10,637.83 Total 11,625.43 10,933.89 10,768.86 Operating Expenses per EIPA : Regulated Services 10,090.94 9,553.50 9,579.23 Total 11,324.40 10,737.89 10,709.51 Net Operating Profit(Loss): Regulated Services 18,489,775 17,495,713 15,732,329 Unegulated Services -14,222,636 -14,569,076 -14,809,467 Total 4,267,138 2,926,637 922,862
Total Non-Operating Profit(Loss): -108,000 828,000 -2,334,200 Non-Operating Revenue -108,000 828,000 -2,334,200 Non-Operating Expenses 0 0 0
Total Excess Profit 4,159,138 3,754,637 -1,411,338
% Change in NPR per EIPA - Regulated 6.38 1.89 4.42 % Change in NOR per EIPA - Regulated 6.28 1.32 4.98 % Change in Oper. Expense per EIPA- Regulated 5.63 -0.27 6.24 % Change in Net Operating Profit- Regulated 5.68 11.21 -6.28
% Net Operating Profit of Regulated NOR 11.91 11.37 9.95 % Change in Net Operating Profit- Total 45.80 217.13 -67.15 % Net Total Operating Profit of Total NOR 2.59 1.79 0.55 % Change in Total Excess Profit 10.77 366.03 -138.16 % Total Excess Profit of Total Revenue 2.53 2.29 -0.85
HEALTH SERVICES COST REVIEW COMMISSION DISCLOSURE OF HOSPITAL FINANCIAL AND STATISTICAL DATA FISCAL YEAR 2009 TO 2011 Page 27 =======================================================================================================
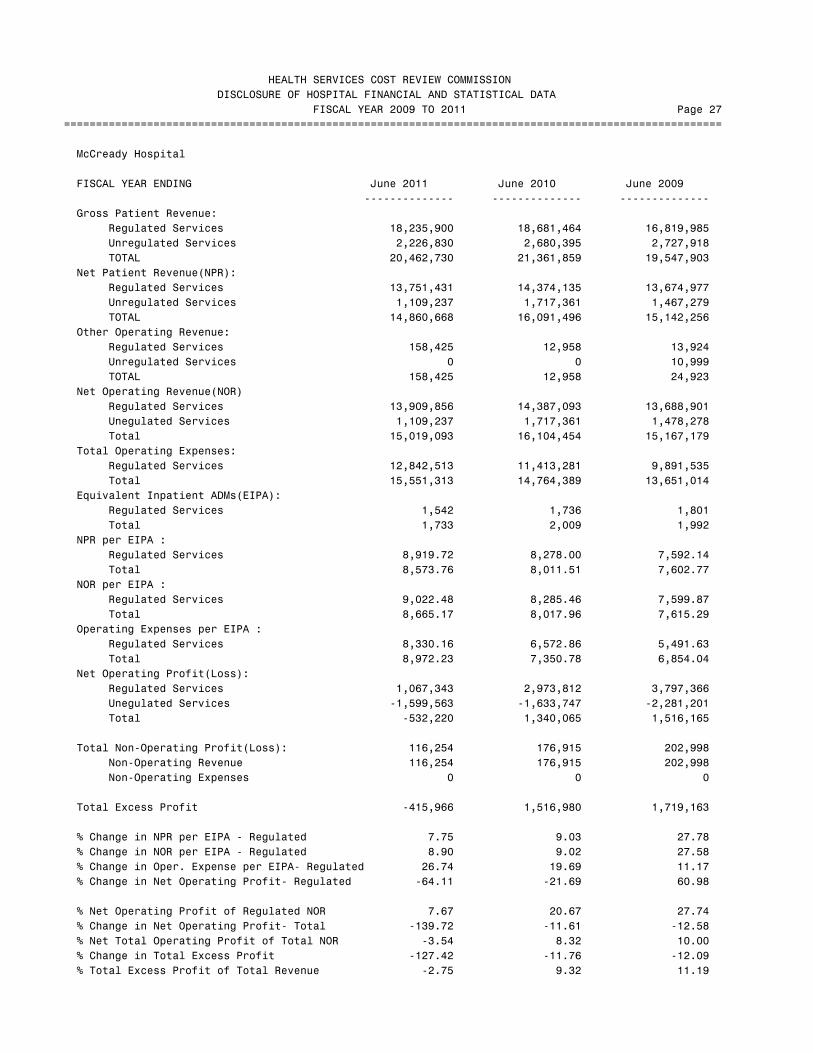
McCready Hospital
FISCAL YEAR ENDING June 2011 June 2010 June 2009 -------------- -------------- -------------- Gross Patient Revenue: Regulated Services 18,235,900 18,681,464 16,819,985 Unregulated Services 2,226,830 2,680,395 2,727,918 TOTAL 20,462,730 21,361,859 19,547,903 Net Patient Revenue(NPR): Regulated Services 13,751,431 14,374,135 13,674,977 Unregulated Services 1,109,237 1,717,361 1,467,279 TOTAL 14,860,668 16,091,496 15,142,256 Other Operating Revenue: Regulated Services 158,425 12,958 13,924 Unregulated Services 0 0 10,999 TOTAL 158,425 12,958 24,923 Net Operating Revenue(NOR) Regulated Services 13,909,856 14,387,093 13,688,901 Unegulated Services 1,109,237 1,717,361 1,478,278 Total 15,019,093 16,104,454 15,167,179 Total Operating Expenses: Regulated Services 12,842,513 11,413,281 9,891,535 Total 15,551,313 14,764,389 13,651,014 Equivalent Inpatient ADMs(EIPA): Regulated Services 1,542 1,736 1,801 Total 1,733 2,009 1,992 NPR per EIPA : Regulated Services 8,919.72 8,278.00 7,592.14 Total 8,573.76 8,011.51 7,602.77 NOR per EIPA : Regulated Services 9,022.48 8,285.46 7,599.87 Total 8,665.17 8,017.96 7,615.29 Operating Expenses per EIPA : Regulated Services 8,330.16 6,572.86 5,491.63 Total 8,972.23 7,350.78 6,854.04 Net Operating Profit(Loss): Regulated Services 1,067,343 2,973,812 3,797,366 Unegulated Services -1,599,563 -1,633,747 -2,281,201 Total -532,220 1,340,065 1,516,165
Total Non-Operating Profit(Loss): 116,254 176,915 202,998 Non-Operating Revenue 116,254 176,915 202,998 Non-Operating Expenses 0 0 0
Total Excess Profit -415,966 1,516,980 1,719,163
% Change in NPR per EIPA - Regulated 7.75 9.03 27.78 % Change in NOR per EIPA - Regulated 8.90 9.02 27.58 % Change in Oper. Expense per EIPA- Regulated 26.74 19.69 11.17 % Change in Net Operating Profit- Regulated -64.11 -21.69 60.98
% Net Operating Profit of Regulated NOR 7.67 20.67 27.74 % Change in Net Operating Profit- Total -139.72 -11.61 -12.58 % Net Total Operating Profit of Total NOR -3.54 8.32 10.00 % Change in Total Excess Profit -127.42 -11.76 -12.09 % Total Excess Profit of Total Revenue -2.75 9.32 11.19

HEALTH SERVICES COST REVIEW COMMISSION DISCLOSURE OF HOSPITAL FINANCIAL AND STATISTICAL DATA FISCAL YEAR 2009 TO 2011 Page 28 =======================================================================================================
Memorial Hosp and Med Ctr of Cumberland
FISCAL YEAR ENDING June 2010 June 2009 -------------- -------------- -------------- Gross Patient Revenue: Regulated Services 0 . 106,194,800 Unregulated Services 0 . 23,681,300 TOTAL 0 . 129,876,100 Net Patient Revenue(NPR): Regulated Services 0 . 88,316,900 Unregulated Services 0 . 15,029,900 TOTAL 0 . 103,346,800 Other Operating Revenue: Regulated Services 0 . 416,900 Unregulated Services 0 . 1,470,500 TOTAL 0 . 1,887,400 Net Operating Revenue(NOR) Regulated Services 0 . 88,733,800 Unegulated Services 0 . 16,500,400 Total 0 . 105,234,200 Total Operating Expenses: Regulated Services 0 . 83,282,630 Total 0 . 100,317,300 Equivalent Inpatient ADMs(EIPA): Regulated Services 0 . 11,167 Total 0 . 13,657 NPR per EIPA : Regulated Services 0.00 . 7,908.74 Total 0.00 . 7,567.19 NOR per EIPA : Regulated Services 0.00 . 7,946.07 Total 0.00 . 7,705.39 Operating Expenses per EIPA : Regulated Services 0.00 . 7,457.92 Total 0.00 . 7,345.37 Net Operating Profit(Loss): Regulated Services 0 . 5,451,170 Unegulated Services 0 . -534,270 Total 0 . 4,916,900
Total Non-Operating Profit(Loss): 0 . 1,339,400 Non-Operating Revenue 0 . 1,467,500 Non-Operating Expenses 0 . 128,100
Total Excess Profit 0 . 6,256,300
% Change in NPR per EIPA - Regulated . . 8.75 % Change in NOR per EIPA - Regulated . . 9.18 % Change in Oper. Expense per EIPA- Regulated . . 4.91 % Change in Net Operating Profit- Regulated . . 177.21
% Net Operating Profit of Regulated NOR 0.00 . 6.14 % Change in Net Operating Profit- Total . . 99.53 % Net Total Operating Profit of Total NOR 0.00 . 4.67 % Change in Total Excess Profit . . 25.61 % Total Excess Profit of Total Revenue 0.00 . 5.86

HEALTH SERVICES COST REVIEW COMMISSION DISCLOSURE OF HOSPITAL FINANCIAL AND STATISTICAL DATA FISCAL YEAR 2009 TO 2011 Page 29 =======================================================================================================
Memorial Hospital at Easton
FISCAL YEAR ENDING June 2011 June 2010 June 2009 -------------- -------------- -------------- Gross Patient Revenue: Regulated Services 173,171,500 160,769,200 160,032,300 Unregulated Services 33,489,644 31,648,639 32,948,771 TOTAL 206,661,144 192,417,839 192,981,071 Net Patient Revenue(NPR): Regulated Services 145,233,736 137,414,364 139,245,218 Unregulated Services 13,110,959 12,376,870 13,312,423 TOTAL 158,344,695 149,791,234 152,557,641 Other Operating Revenue: Regulated Services 4,036,480 1,806,811 1,770,296 Unregulated Services 1,421,491 1,472,209 1,451,188 TOTAL 5,457,971 3,279,020 3,221,484 Net Operating Revenue(NOR) Regulated Services 149,270,216 139,221,175 141,015,514 Unegulated Services 14,532,450 13,849,079 14,763,611 Total 163,802,666 153,070,254 155,779,125 Total Operating Expenses: Regulated Services 140,221,608 133,188,248 134,106,845 Total 154,561,476 147,698,367 147,694,022 Equivalent Inpatient ADMs(EIPA): Regulated Services 16,228 16,433 16,349 Total 19,366 19,668 19,715 NPR per EIPA : Regulated Services 8,949.77 8,362.00 8,517.27 Total 8,176.46 7,615.91 7,738.32 NOR per EIPA : Regulated Services 9,198.51 8,471.95 8,625.55 Total 8,458.30 7,782.63 7,901.73 Operating Expenses per EIPA : Regulated Services 8,640.91 8,104.83 8,202.96 Total 7,981.11 7,509.51 7,491.62 Net Operating Profit(Loss): Regulated Services 9,048,607 6,032,927 6,908,669 Unegulated Services 192,582 -661,040 1,176,434 Total 9,241,189 5,371,887 8,085,103
Total Non-Operating Profit(Loss): 9,777,820 4,540,080 -6,152,200 Non-Operating Revenue 9,777,820 4,540,080 -6,152,200 Non-Operating Expenses 0 0 0
Total Excess Profit 19,019,010 9,911,967 1,932,904
% Change in NPR per EIPA - Regulated 7.03 -1.82 9.96 % Change in NOR per EIPA - Regulated 8.58 -1.78 9.33 % Change in Oper. Expense per EIPA- Regulated 6.61 -1.20 5.54 % Change in Net Operating Profit- Regulated 49.99 -12.68 266.12
% Net Operating Profit of Regulated NOR 6.06 4.33 4.90 % Change in Net Operating Profit- Total 72.03 -33.56 163.75 % Net Total Operating Profit of Total NOR 5.64 3.51 5.19 % Change in Total Excess Profit 91.88 412.80 -21.29 % Total Excess Profit of Total Revenue 10.96 6.29 1.29

HEALTH SERVICES COST REVIEW COMMISSION DISCLOSURE OF HOSPITAL FINANCIAL AND STATISTICAL DATA FISCAL YEAR 2009 TO 2011 Page 30 =======================================================================================================
Mercy Medical Center
FISCAL YEAR ENDING June 2011 June 2010 June 2009 -------------- -------------- -------------- Gross Patient Revenue: Regulated Services 420,066,700 388,727,200 382,169,900 Unregulated Services 4,647,983 4,801,123 5,560,503 TOTAL 424,714,683 393,528,323 387,730,403 Net Patient Revenue(NPR): Regulated Services 356,258,595 335,374,561 334,232,485 Unregulated Services 4,647,983 4,801,123 5,560,503 TOTAL 360,906,578 340,175,684 339,792,988 Other Operating Revenue: Regulated Services 6,126,028 3,857,230 3,761,737 Unregulated Services 12,019,196 11,283,344 12,033,663 TOTAL 18,145,224 15,140,574 15,795,400 Net Operating Revenue(NOR) Regulated Services 362,384,623 339,231,791 337,994,222 Unegulated Services 16,667,179 16,084,467 17,594,166 Total 379,051,802 355,316,258 355,588,388 Total Operating Expenses: Regulated Services 341,721,164 307,650,947 304,063,622 Total 366,190,164 330,084,298 324,261,908 Equivalent Inpatient ADMs(EIPA): Regulated Services 33,407 33,527 33,604 Total 33,776 33,941 34,093 NPR per EIPA : Regulated Services 10,664.29 10,003.21 9,946.08 Total 10,685.19 10,022.63 9,966.54 NOR per EIPA : Regulated Services 10,847.66 10,118.26 10,058.02 Total 11,222.41 10,468.71 10,429.83 Operating Expenses per EIPA : Regulated Services 10,229.12 9,176.30 9,048.31 Total 10,841.62 9,725.30 9,510.99 Net Operating Profit(Loss): Regulated Services 20,663,459 31,580,844 33,930,600 Unegulated Services -7,801,821 -6,348,884 -2,604,120 Total 12,861,638 25,231,960 31,326,480
Total Non-Operating Profit(Loss): 22,557,807 6,014,865 -34,349,064 Non-Operating Revenue 3,303,248 6,644,117 967,824 Non-Operating Expenses -19,254,559 629,252 35,316,888
Total Excess Profit 35,419,445 31,246,825 -3,022,584
% Change in NPR per EIPA - Regulated 6.61 0.57 4.54 % Change in NOR per EIPA - Regulated 7.21 0.60 4.15 % Change in Oper. Expense per EIPA- Regulated 11.47 1.41 3.09 % Change in Net Operating Profit- Regulated -34.57 -6.93 18.07
% Net Operating Profit of Regulated NOR 5.70 9.31 10.04 % Change in Net Operating Profit- Total -49.03 -19.45 16.14 % Net Total Operating Profit of Total NOR 3.39 7.10 8.81 % Change in Total Excess Profit 13.35 1,133.78 -115.05 % Total Excess Profit of Total Revenue 9.26 8.63 -0.85

HEALTH SERVICES COST REVIEW COMMISSION DISCLOSURE OF HOSPITAL FINANCIAL AND STATISTICAL DATA FISCAL YEAR 2009 TO 2011 Page 31 =======================================================================================================
Meritus Medical Center
FISCAL YEAR ENDING June 2011 June 2010 June 2009 -------------- -------------- -------------- Gross Patient Revenue: Regulated Services 275,699,700 250,295,900 243,018,300 Unregulated Services 48,028,200 47,062,500 41,566,400 TOTAL 323,727,900 297,358,400 284,584,700 Net Patient Revenue(NPR): Regulated Services 232,040,400 209,148,200 203,634,400 Unregulated Services 28,878,200 28,307,500 27,231,200 TOTAL 260,918,600 237,455,700 230,865,600 Other Operating Revenue: Regulated Services 5,263,297 4,129,800 1,961,400 Unregulated Services 2,771,903 1,983,200 2,252,200 TOTAL 8,035,200 6,113,000 4,213,600 Net Operating Revenue(NOR) Regulated Services 237,303,697 213,278,000 205,595,800 Unegulated Services 31,650,103 30,290,700 29,483,400 Total 268,953,800 243,568,700 235,079,200 Total Operating Expenses: Regulated Services 228,333,405 211,006,835 200,960,847 Total 261,819,900 243,735,000 231,305,500 Equivalent Inpatient ADMs(EIPA): Regulated Services 25,377 24,861 24,851 Total 29,796 29,535 29,102 NPR per EIPA : Regulated Services 9,143.74 8,412.85 8,194.10 Total 8,756.81 8,039.79 7,932.99 NOR per EIPA : Regulated Services 9,351.14 8,578.96 8,273.02 Total 9,026.48 8,246.77 8,077.77 Operating Expenses per EIPA : Regulated Services 8,997.66 8,487.61 8,086.52 Total 8,787.06 8,252.40 7,948.10 Net Operating Profit(Loss): Regulated Services 8,970,292 2,271,165 4,634,953 Unegulated Services -1,836,392 -2,437,465 -861,253 Total 7,133,900 -166,300 3,773,700
Total Non-Operating Profit(Loss): 5,176,800 3,183,300 -4,587,500 Non-Operating Revenue 5,254,300 3,353,900 -4,440,000 Non-Operating Expenses 77,500 170,600 147,500
Total Excess Profit 12,310,700 3,017,000 -813,800
% Change in NPR per EIPA - Regulated 8.69 2.67 1.65 % Change in NOR per EIPA - Regulated 9.00 3.70 2.18 % Change in Oper. Expense per EIPA- Regulated 6.01 4.96 4.93 % Change in Net Operating Profit- Regulated 294.96 -51.00 -50.72
% Net Operating Profit of Regulated NOR 3.78 1.06 2.25 % Change in Net Operating Profit- Total 4,389.78 -104.41 -50.65 % Net Total Operating Profit of Total NOR 2.65 -0.07 1.61 % Change in Total Excess Profit 308.04 470.73 -109.44 % Total Excess Profit of Total Revenue 4.49 1.22 -0.35

HEALTH SERVICES COST REVIEW COMMISSION DISCLOSURE OF HOSPITAL FINANCIAL AND STATISTICAL DATA FISCAL YEAR 2009 TO 2011 Page 32 =======================================================================================================
Montgomery General Hospital
FISCAL YEAR ENDING June 2011 June 2010 June 2009 -------------- -------------- -------------- Gross Patient Revenue: Regulated Services 156,795,100 149,773,600 140,619,400 Unregulated Services 7,676,300 6,599,491 4,110,000 TOTAL 164,471,400 156,373,091 144,729,400 Net Patient Revenue(NPR): Regulated Services 135,596,229 124,219,621 121,977,000 Unregulated Services 3,782,893 3,503,857 2,341,200 TOTAL 139,379,122 127,723,478 124,318,200 Other Operating Revenue: Regulated Services 1,303,300 1,517,012 1,157,800 Unregulated Services 764,900 624,241 439,300 TOTAL 2,068,200 2,141,253 1,597,100 Net Operating Revenue(NOR) Regulated Services 136,899,529 125,736,633 123,134,800 Unegulated Services 4,547,793 4,128,098 2,780,500 Total 141,447,322 129,864,731 125,915,300 Total Operating Expenses: Regulated Services 119,548,593 115,963,398 115,736,158 Total 133,009,716 125,528,572 122,776,400 Equivalent Inpatient ADMs(EIPA): Regulated Services 15,450 14,228 14,591 Total 15,061 14,855 14,803 NPR per EIPA : Regulated Services 8,776.38 8,730.61 8,359.68 Total 9,254.38 8,598.02 8,397.91 NOR per EIPA : Regulated Services 8,860.73 8,837.23 8,439.03 Total 9,391.70 8,742.16 8,505.80 Operating Expenses per EIPA : Regulated Services 7,737.70 8,150.33 7,931.97 Total 8,831.47 8,450.26 8,293.76 Net Operating Profit(Loss): Regulated Services 17,350,936 9,773,235 7,398,642 Unegulated Services -8,913,309 -5,437,076 -4,259,742 Total 8,437,627 4,336,159 3,138,900
Total Non-Operating Profit(Loss): 988,687 2,791,019 -2,837,200 Non-Operating Revenue 988,687 2,791,019 -2,837,200 Non-Operating Expenses 0 0 0
Total Excess Profit 9,426,314 7,127,178 301,700
% Change in NPR per EIPA - Regulated 0.52 4.44 0.65 % Change in NOR per EIPA - Regulated 0.27 4.72 0.39 % Change in Oper. Expense per EIPA- Regulated -5.06 2.75 1.27 % Change in Net Operating Profit- Regulated 77.54 32.09 -8.31
% Net Operating Profit of Regulated NOR 12.67 7.77 6.01 % Change in Net Operating Profit- Total 94.59 38.14 -30.08 % Net Total Operating Profit of Total NOR 5.97 3.34 2.49 % Change in Total Excess Profit 32.26 2,262.34 -13.33 % Total Excess Profit of Total Revenue 6.62 5.37 0.25

HEALTH SERVICES COST REVIEW COMMISSION DISCLOSURE OF HOSPITAL FINANCIAL AND STATISTICAL DATA FISCAL YEAR 2009 TO 2011 Page 33 =======================================================================================================
Northwest Hospital Center
FISCAL YEAR ENDING June 2011 June 2010 June 2009 -------------- -------------- -------------- Gross Patient Revenue: Regulated Services 227,677,300 214,481,500 211,714,700 Unregulated Services 27,427,434 23,294,426 22,261,476 TOTAL 255,104,734 237,775,926 233,976,176 Net Patient Revenue(NPR): Regulated Services 187,938,400 178,377,100 178,142,957 Unregulated Services 11,408,249 9,727,678 8,944,551 TOTAL 199,346,649 188,104,778 187,087,508 Other Operating Revenue: Regulated Services 1,139,100 1,023,180 1,223,600 Unregulated Services 1,395,685 1,225,936 1,095,281 TOTAL 2,534,785 2,249,116 2,318,881 Net Operating Revenue(NOR) Regulated Services 189,077,500 179,400,280 179,366,557 Unegulated Services 12,803,934 10,953,614 10,039,832 Total 201,881,434 190,353,894 189,406,389 Total Operating Expenses: Regulated Services 170,174,366 161,514,213 159,137,100 Total 190,792,966 180,774,513 176,972,000 Equivalent Inpatient ADMs(EIPA): Regulated Services 21,539 21,733 20,971 Total 21,538 23,180 22,427 NPR per EIPA : Regulated Services 8,725.59 8,207.81 8,494.63 Total 9,255.67 8,114.99 8,342.18 NOR per EIPA : Regulated Services 8,778.47 8,254.90 8,552.98 Total 9,373.36 8,212.02 8,445.57 Operating Expenses per EIPA : Regulated Services 7,900.84 7,431.89 7,588.35 Total 8,858.52 7,798.76 7,891.13 Net Operating Profit(Loss): Regulated Services 18,903,134 17,886,067 20,229,457 Unegulated Services -7,814,666 -8,306,686 -7,795,068 Total 11,088,468 9,579,381 12,434,389
Total Non-Operating Profit(Loss): 12,763,168 7,322,217 -8,766,031 Non-Operating Revenue 12,763,168 7,322,217 -8,766,031 Non-Operating Expenses 0 0 0
Total Excess Profit 23,851,636 16,901,598 3,668,358
% Change in NPR per EIPA - Regulated 6.31 -3.38 6.80 % Change in NOR per EIPA - Regulated 6.34 -3.49 6.33 % Change in Oper. Expense per EIPA- Regulated 6.31 -2.06 5.86 % Change in Net Operating Profit- Regulated 5.69 -11.58 7.50
% Net Operating Profit of Regulated NOR 10.00 9.97 11.28 % Change in Net Operating Profit- Total 15.75 -22.96 -0.71 % Net Total Operating Profit of Total NOR 5.49 5.03 6.56 % Change in Total Excess Profit 41.12 360.74 -43.98 % Total Excess Profit of Total Revenue 11.11 8.55 2.03

HEALTH SERVICES COST REVIEW COMMISSION DISCLOSURE OF HOSPITAL FINANCIAL AND STATISTICAL DATA FISCAL YEAR 2009 TO 2011 Page 34 =======================================================================================================
Peninsula Regional Hospital
FISCAL YEAR ENDING June 2011 June 2010 June 2009 -------------- -------------- -------------- Gross Patient Revenue: Regulated Services 406,379,600 394,310,100 385,277,000 Unregulated Services 50,655,400 32,271,900 33,201,200 TOTAL 457,035,000 426,582,000 418,478,200 Net Patient Revenue(NPR): Regulated Services 339,681,900 332,910,100 331,729,600 Unregulated Services 22,959,100 17,521,900 18,785,400 TOTAL 362,641,000 350,432,000 350,515,000 Other Operating Revenue: Regulated Services 1,131,600 908,800 872,900 Unregulated Services 1,252,900 1,172,500 1,123,300 TOTAL 2,384,500 2,081,300 1,996,200 Net Operating Revenue(NOR) Regulated Services 340,813,500 333,818,900 332,602,500 Unegulated Services 24,212,000 18,694,400 19,908,700 Total 365,025,500 352,513,300 352,511,200 Total Operating Expenses: Regulated Services 304,199,081 304,760,053 303,144,053 Total 347,492,600 345,483,300 340,475,200 Equivalent Inpatient ADMs(EIPA): Regulated Services 31,681 31,730 31,193 Total 36,028 34,641 34,206 NPR per EIPA : Regulated Services 10,721.88 10,492.03 10,634.91 Total 10,065.65 10,116.20 10,247.26 NOR per EIPA : Regulated Services 10,757.59 10,520.67 10,662.89 Total 10,131.83 10,176.28 10,305.62 Operating Expenses per EIPA : Regulated Services 9,601.88 9,604.85 9,718.48 Total 9,645.18 9,973.34 9,953.75 Net Operating Profit(Loss): Regulated Services 36,614,419 29,058,847 29,458,447 Unegulated Services -19,081,519 -22,028,847 -17,422,447 Total 17,532,900 7,030,000 12,036,000
Total Non-Operating Profit(Loss): 13,306,100 12,057,000 -17,877,000 Non-Operating Revenue 15,292,000 12,057,000 -17,877,000 Non-Operating Expenses 1,985,900 0 0
Total Excess Profit 30,839,000 19,087,000 -5,841,000
% Change in NPR per EIPA - Regulated 2.19 -1.34 0.56 % Change in NOR per EIPA - Regulated 2.25 -1.33 0.84 % Change in Oper. Expense per EIPA- Regulated -0.03 -1.17 4.75 % Change in Net Operating Profit- Regulated 26.00 -1.36 -24.49
% Net Operating Profit of Regulated NOR 10.74 8.70 8.86 % Change in Net Operating Profit- Total 149.40 -41.59 -57.32 % Net Total Operating Profit of Total NOR 4.80 1.99 3.41 % Change in Total Excess Profit 61.57 426.78 -115.25 % Total Excess Profit of Total Revenue 8.11 5.24 -1.75

HEALTH SERVICES COST REVIEW COMMISSION DISCLOSURE OF HOSPITAL FINANCIAL AND STATISTICAL DATA FISCAL YEAR 2009 TO 2011 Page 35 =======================================================================================================
Prince Georges' Hospital Center
FISCAL YEAR ENDING June 2011 June 2010 June 2009 -------------- -------------- -------------- Gross Patient Revenue: Regulated Services 263,104,300 251,597,300 260,576,400 Unregulated Services 33,038,345 37,676,835 34,623,914 TOTAL 296,142,645 289,274,135 295,200,314 Net Patient Revenue(NPR): Regulated Services 214,749,210 204,287,834 210,964,197 Unregulated Services 13,179,800 16,938,796 15,513,731 TOTAL 227,929,011 221,226,630 226,477,928 Other Operating Revenue: Regulated Services 1,308,349 1,779,830 884,971 Unregulated Services 1,604,648 2,048,133 1,907,144 TOTAL 2,912,997 3,827,963 2,792,115 Net Operating Revenue(NOR) Regulated Services 216,057,559 206,067,664 211,849,168 Unegulated Services 14,784,448 18,986,929 17,420,875 Total 230,842,008 225,054,593 229,270,043 Total Operating Expenses: Regulated Services 212,877,166 209,892,050 212,101,859 Total 242,965,897 245,390,149 244,485,919 Equivalent Inpatient ADMs(EIPA): Regulated Services 16,957 17,809 18,250 Total 17,802 18,604 19,008 NPR per EIPA : Regulated Services 12,664.27 11,471.11 11,559.98 Total 12,803.91 11,891.59 11,914.57 NOR per EIPA : Regulated Services 12,741.43 11,571.06 11,608.47 Total 12,967.55 12,097.36 12,061.45 Operating Expenses per EIPA : Regulated Services 12,553.88 11,785.80 11,622.32 Total 13,648.61 13,190.46 12,861.93 Net Operating Profit(Loss): Regulated Services 3,180,393 -3,824,386 -252,691 Unegulated Services -15,304,283 -16,511,170 -14,963,185 Total -12,123,890 -20,335,556 -15,215,876
Total Non-Operating Profit(Loss): 18,769,249 16,718,235 26,693,589 Non-Operating Revenue 22,714,349 16,718,235 26,693,589 Non-Operating Expenses 3,945,100 0 0
Total Excess Profit 6,645,359 -3,617,321 11,477,713
% Change in NPR per EIPA - Regulated 10.40 -0.77 1.75 % Change in NOR per EIPA - Regulated 10.11 -0.32 1.41 % Change in Oper. Expense per EIPA- Regulated 6.52 1.41 1.90 % Change in Net Operating Profit- Regulated 183.16 -1,413.46 -135.47
% Net Operating Profit of Regulated NOR 1.47 -1.86 -0.12 % Change in Net Operating Profit- Total 40.38 -33.65 -3.74 % Net Total Operating Profit of Total NOR -5.25 -9.04 -6.64 % Change in Total Excess Profit 283.71 -131.52 257.35 % Total Excess Profit of Total Revenue 2.62 -1.50 4.48

HEALTH SERVICES COST REVIEW COMMISSION DISCLOSURE OF HOSPITAL FINANCIAL AND STATISTICAL DATA FISCAL YEAR 2009 TO 2011 Page 36 =======================================================================================================
Saint Agnes Hospital
FISCAL YEAR ENDING June 2011 June 2010 June 2009 -------------- -------------- -------------- Gross Patient Revenue: Regulated Services 376,582,900 357,504,800 358,890,700 Unregulated Services 139,902,712 125,464,523 112,470,503 TOTAL 516,485,612 482,969,323 471,361,203 Net Patient Revenue(NPR): Regulated Services 318,111,245 307,715,930 307,252,556 Unregulated Services 57,182,251 51,769,365 47,001,651 TOTAL 375,293,496 359,485,295 354,254,207 Other Operating Revenue: Regulated Services 2,843,020 1,952,195 3,590,078 Unregulated Services 4,257,915 3,810,672 3,261,559 TOTAL 7,100,935 5,762,867 6,851,637 Net Operating Revenue(NOR) Regulated Services 320,954,265 309,668,125 310,842,634 Unegulated Services 61,440,166 55,580,037 50,263,210 Total 382,394,431 365,248,162 361,105,844 Total Operating Expenses: Regulated Services 278,581,383 275,390,240 275,685,027 Total 363,256,557 349,799,377 343,421,097 Equivalent Inpatient ADMs(EIPA): Regulated Services 28,884 30,735 30,686 Total 35,929 38,014 37,473 NPR per EIPA : Regulated Services 11,013.44 10,011.87 10,012.70 Total 10,445.46 9,456.66 9,453.59 NOR per EIPA : Regulated Services 11,111.87 10,075.39 10,129.69 Total 10,643.10 9,608.26 9,636.43 Operating Expenses per EIPA : Regulated Services 9,644.86 8,960.12 8,983.98 Total 10,110.44 9,201.86 9,164.50 Net Operating Profit(Loss): Regulated Services 42,372,882 34,277,885 35,157,607 Unegulated Services -23,235,008 -18,829,100 -17,472,860 Total 19,137,874 15,448,785 17,684,747
Total Non-Operating Profit(Loss): 34,402,050 27,374,372 -37,124,996 Non-Operating Revenue 34,402,050 24,968,464 -37,124,996 Non-Operating Expenses 0 -2,405,908 0
Total Excess Profit 53,539,924 42,823,157 -19,440,249
% Change in NPR per EIPA - Regulated 10.00 -0.01 0.27 % Change in NOR per EIPA - Regulated 10.29 -0.54 0.39 % Change in Oper. Expense per EIPA- Regulated 7.64 -0.27 -1.80 % Change in Net Operating Profit- Regulated 23.62 -2.50 31.25
% Net Operating Profit of Regulated NOR 13.20 11.07 11.31 % Change in Net Operating Profit- Total 23.88 -12.64 55.85 % Net Total Operating Profit of Total NOR 5.00 4.23 4.90 % Change in Total Excess Profit 25.03 320.28 -253.95 % Total Excess Profit of Total Revenue 12.85 10.97 -6.00

HEALTH SERVICES COST REVIEW COMMISSION DISCLOSURE OF HOSPITAL FINANCIAL AND STATISTICAL DATA FISCAL YEAR 2009 TO 2011 Page 37 =======================================================================================================
Saint Josephs Medical Center
FISCAL YEAR ENDING June 2011 June 2010 June 2009 -------------- -------------- -------------- Gross Patient Revenue: Regulated Services 362,195,000 375,076,400 398,844,400 Unregulated Services 47,028,886 40,398,697 47,008,578 TOTAL 409,223,886 415,475,097 445,852,978 Net Patient Revenue(NPR): Regulated Services 293,912,806 307,247,166 339,694,906 Unregulated Services 23,093,568 19,135,082 21,683,700 TOTAL 317,006,374 326,382,248 361,378,606 Other Operating Revenue: Regulated Services 490,972 141,335 1,079,638 Unregulated Services 5,721,239 5,937,588 5,248,578 TOTAL 6,212,211 6,078,923 6,328,216 Net Operating Revenue(NOR) Regulated Services 294,403,778 307,388,501 340,774,543 Unegulated Services 28,814,807 25,072,670 26,932,278 Total 323,218,585 332,461,171 367,706,822 Total Operating Expenses: Regulated Services 293,587,390 299,994,287 322,090,976 Total 347,676,334 350,177,336 372,532,167 Equivalent Inpatient ADMs(EIPA): Regulated Services 26,720 28,322 31,752 Total 30,190 31,372 35,486 NPR per EIPA : Regulated Services 10,999.57 10,848.17 10,698.23 Total 10,500.42 10,403.73 10,183.83 NOR per EIPA : Regulated Services 11,017.95 10,853.16 10,732.23 Total 10,706.19 10,597.50 10,362.16 Operating Expenses per EIPA : Regulated Services 10,987.39 10,592.09 10,143.82 Total 11,516.32 11,162.22 10,498.14 Net Operating Profit(Loss): Regulated Services 816,389 7,394,214 18,683,567 Unegulated Services -25,274,138 -25,110,379 -23,508,912 Total -24,457,749 -17,716,165 -4,825,345
Total Non-Operating Profit(Loss): 8,418,345 5,443,008 -9,452,618 Non-Operating Revenue 8,418,345 5,443,008 12,547,382 Non-Operating Expenses 0 0 22,000,000
Total Excess Profit -16,039,404 -12,273,157 -14,277,963
% Change in NPR per EIPA - Regulated 1.40 1.40 1.17 % Change in NOR per EIPA - Regulated 1.52 1.13 1.25 % Change in Oper. Expense per EIPA- Regulated 3.73 4.42 -4.20 % Change in Net Operating Profit- Regulated -88.96 -60.42 5,529.66
% Net Operating Profit of Regulated NOR 0.28 2.41 5.48 % Change in Net Operating Profit- Total -38.05 -267.15 73.20 % Net Total Operating Profit of Total NOR -7.57 -5.33 -1.31 % Change in Total Excess Profit -30.69 14.04 -21.67 % Total Excess Profit of Total Revenue -4.84 -3.63 -3.75

HEALTH SERVICES COST REVIEW COMMISSION DISCLOSURE OF HOSPITAL FINANCIAL AND STATISTICAL DATA FISCAL YEAR 2009 TO 2011 Page 38 =======================================================================================================
Saint Mary's Hospital
FISCAL YEAR ENDING June 2011 June 2010 June 2009 -------------- -------------- -------------- Gross Patient Revenue: Regulated Services 134,162,900 125,978,346 124,100,600 Unregulated Services 9,278,303 7,961,116 7,978,916 TOTAL 143,441,203 133,939,462 132,079,516 Net Patient Revenue(NPR): Regulated Services 110,583,185 102,454,852 105,768,160 Unregulated Services 5,806,361 6,614,620 3,029,183 TOTAL 116,389,545 109,069,471 108,797,343 Other Operating Revenue: Regulated Services 273,700 2,259,219 1,440,400 Unregulated Services 1,397,344 457,444 0 TOTAL 1,671,044 2,716,663 1,440,400 Net Operating Revenue(NOR) Regulated Services 110,856,885 104,714,071 107,208,560 Unegulated Services 7,203,705 7,072,064 3,029,183 Total 118,060,590 111,786,134 110,237,743 Total Operating Expenses: Regulated Services 96,751,142 93,942,446 97,770,605 Total 112,047,407 107,501,875 108,436,642 Equivalent Inpatient ADMs(EIPA): Regulated Services 16,151 17,586 17,592 Total 15,119 18,361 18,509 NPR per EIPA : Regulated Services 6,846.82 5,826.00 6,012.37 Total 7,698.38 5,940.20 5,878.11 NOR per EIPA : Regulated Services 6,863.77 5,954.47 6,094.25 Total 7,808.91 6,088.16 5,955.93 Operating Expenses per EIPA : Regulated Services 5,990.40 5,341.95 5,557.75 Total 7,411.18 5,854.83 5,858.62 Net Operating Profit(Loss): Regulated Services 14,105,743 10,771,624 9,437,955 Unegulated Services -8,092,560 -6,487,365 -7,636,854 Total 6,013,183 4,284,259 1,801,101
Total Non-Operating Profit(Loss): 1,437,820 -1,876,534 -182,542 Non-Operating Revenue 1,437,820 133,176 1,846,900 Non-Operating Expenses 0 2,009,710 2,029,442
Total Excess Profit 7,451,003 2,407,725 1,618,559
% Change in NPR per EIPA - Regulated 17.52 -3.10 1.59 % Change in NOR per EIPA - Regulated 15.27 -2.29 1.75 % Change in Oper. Expense per EIPA- Regulated 12.14 -3.88 2.28 % Change in Net Operating Profit- Regulated 30.95 14.13 4.14
% Net Operating Profit of Regulated NOR 12.72 10.29 8.80 % Change in Net Operating Profit- Total 40.36 137.87 -73.14 % Net Total Operating Profit of Total NOR 5.09 3.83 1.63 % Change in Total Excess Profit 209.46 48.76 -78.71 % Total Excess Profit of Total Revenue 6.24 2.15 1.44

HEALTH SERVICES COST REVIEW COMMISSION DISCLOSURE OF HOSPITAL FINANCIAL AND STATISTICAL DATA FISCAL YEAR 2009 TO 2011 Page 39 =======================================================================================================
Shady Grove Adventist Hospital
FISCAL YEAR ENDING December 2011 December 2010 December 2009 -------------- -------------- -------------- Gross Patient Revenue: Regulated Services 358,655,535 335,364,985 331,274,906 Unregulated Services 21,556,507 34,336,169 35,853,773 TOTAL 380,212,042 369,701,154 367,128,679 Net Patient Revenue(NPR): Regulated Services 306,195,153 292,739,292 283,847,908 Unregulated Services 7,200,472 17,005,256 16,613,631 TOTAL 313,395,625 309,744,548 300,461,539 Other Operating Revenue: Regulated Services 2,944,664 3,405,948 2,643,215 Unregulated Services 4,388,402 4,829,756 4,557,361 TOTAL 7,333,066 8,235,704 7,200,576 Net Operating Revenue(NOR) Regulated Services 309,139,817 296,145,240 286,491,123 Unegulated Services 11,588,874 21,835,012 21,170,992 Total 320,728,691 317,980,252 307,662,115 Total Operating Expenses: Regulated Services 282,132,916 270,989,498 270,417,774 Total 296,255,894 295,731,330 292,748,994 Equivalent Inpatient ADMs(EIPA): Regulated Services 31,475 32,832 33,450 Total 33,367 36,035 36,701 NPR per EIPA : Regulated Services 9,728.20 8,916.27 8,485.78 Total 9,392.47 8,595.55 8,186.77 NOR per EIPA : Regulated Services 9,821.76 9,020.01 8,564.80 Total 9,612.24 8,824.09 8,382.96 Operating Expenses per EIPA : Regulated Services 8,963.71 8,253.81 8,084.28 Total 8,878.79 8,206.68 7,976.62 Net Operating Profit(Loss): Regulated Services 27,006,901 25,155,742 16,073,349 Unegulated Services -2,534,103 -2,906,821 -1,160,228 Total 24,472,797 22,248,922 14,913,121
Total Non-Operating Profit(Loss): 1,197,213 2,342,788 -1,255,294 Non-Operating Revenue 1,197,213 2,342,788 -1,255,294 Non-Operating Expenses 0 0 0
Total Excess Profit 25,670,010 24,591,710 13,657,827
% Change in NPR per EIPA - Regulated 9.11 5.07 0.75 % Change in NOR per EIPA - Regulated 8.89 5.31 0.97 % Change in Oper. Expense per EIPA- Regulated 8.60 2.10 -2.07 % Change in Net Operating Profit- Regulated 7.36 56.51 127.24
% Net Operating Profit of Regulated NOR 8.74 8.49 5.61 % Change in Net Operating Profit- Total 10.00 49.19 121.53 % Net Total Operating Profit of Total NOR 7.63 7.00 4.85 % Change in Total Excess Profit 4.38 80.06 461.16 % Total Excess Profit of Total Revenue 7.97 7.68 4.46

HEALTH SERVICES COST REVIEW COMMISSION DISCLOSURE OF HOSPITAL FINANCIAL AND STATISTICAL DATA FISCAL YEAR 2009 TO 2011 Page 40 =======================================================================================================
Sinai Hospital of Baltimore
FISCAL YEAR ENDING June 2011 June 2010 June 2009 -------------- -------------- -------------- Gross Patient Revenue: Regulated Services 636,490,900 619,723,100 627,278,200 Unregulated Services 146,550,900 158,468,000 109,781,389 TOTAL 783,041,800 778,191,100 737,059,589 Net Patient Revenue(NPR): Regulated Services 549,875,500 534,915,500 536,920,130 Unregulated Services 66,297,500 63,138,400 40,437,732 TOTAL 616,173,000 598,053,900 577,357,862 Other Operating Revenue: Regulated Services 11,172,500 8,486,500 10,224,011 Unregulated Services 27,165,276 26,835,600 15,441,747 TOTAL 38,337,776 35,322,100 25,665,758 Net Operating Revenue(NOR) Regulated Services 561,048,000 543,402,000 547,144,141 Unegulated Services 93,462,776 89,974,000 55,879,479 Total 654,510,776 633,376,000 603,023,620 Total Operating Expenses: Regulated Services 498,388,230 497,428,352 500,512,326 Total 630,868,676 623,937,000 591,050,256 Equivalent Inpatient ADMs(EIPA): Regulated Services 39,610 39,398 39,792 Total 48,731 49,472 41,063 NPR per EIPA : Regulated Services 13,882.08 13,577.23 13,493.11 Total 12,644.46 12,088.65 14,060.30 NOR per EIPA : Regulated Services 14,164.14 13,792.63 13,750.04 Total 13,431.18 12,802.62 14,685.33 Operating Expenses per EIPA : Regulated Services 12,582.24 12,625.73 12,578.16 Total 12,946.02 12,611.83 14,393.74 Net Operating Profit(Loss): Regulated Services 62,659,770 45,973,648 46,631,815 Unegulated Services -39,017,670 -36,534,648 -34,658,451 Total 23,642,100 9,439,000 11,973,364
Total Non-Operating Profit(Loss): 20,566,000 9,624,000 -15,055,000 Non-Operating Revenue 20,566,000 8,204,000 -15,055,000 Non-Operating Expenses 0 -1,420,000 0
Total Excess Profit 44,208,100 19,063,000 -3,081,636
% Change in NPR per EIPA - Regulated 2.25 0.62 6.16 % Change in NOR per EIPA - Regulated 2.69 0.31 4.76 % Change in Oper. Expense per EIPA- Regulated -0.34 0.38 4.56 % Change in Net Operating Profit- Regulated 36.29 -1.41 5.51
% Net Operating Profit of Regulated NOR 11.17 8.46 8.52 % Change in Net Operating Profit- Total 150.47 -21.17 124.64 % Net Total Operating Profit of Total NOR 3.61 1.49 1.99 % Change in Total Excess Profit 131.91 718.60 79.33 % Total Excess Profit of Total Revenue 6.55 2.97 -0.52

HEALTH SERVICES COST REVIEW COMMISSION DISCLOSURE OF HOSPITAL FINANCIAL AND STATISTICAL DATA FISCAL YEAR 2009 TO 2011 Page 41 =======================================================================================================
Southern Maryland Hospital Center
FISCAL YEAR ENDING December 2011 December 2010 December 2009 -------------- -------------- -------------- Gross Patient Revenue: Regulated Services 249,258,400 223,251,200 224,831,800 Unregulated Services 34,892,573 48,968,865 46,561,967 TOTAL 284,150,973 272,220,065 271,393,767 Net Patient Revenue(NPR): Regulated Services 208,612,308 186,636,112 188,617,305 Unregulated Services 13,438,473 19,793,385 18,201,765 TOTAL 222,050,781 206,429,497 206,819,070 Other Operating Revenue: Regulated Services 421,075 459,704 227,547 Unregulated Services 492,728 483,404 490,439 TOTAL 913,803 943,108 717,986 Net Operating Revenue(NOR) Regulated Services 209,033,383 187,095,816 188,844,852 Unegulated Services 13,931,201 20,276,789 18,692,204 Total 222,964,584 207,372,605 207,537,056 Total Operating Expenses: Regulated Services 198,573,862 178,386,000 179,924,946 Total 217,183,662 204,101,900 204,868,146 Equivalent Inpatient ADMs(EIPA): Regulated Services 24,068 23,770 23,928 Total 27,310 28,739 28,636 NPR per EIPA : Regulated Services 8,667.45 7,851.91 7,882.80 Total 8,130.86 7,182.91 7,222.32 NOR per EIPA : Regulated Services 8,684.94 7,871.25 7,892.31 Total 8,164.32 7,215.72 7,247.40 Operating Expenses per EIPA : Regulated Services 8,250.37 7,504.82 7,519.52 Total 7,952.64 7,101.92 7,154.20 Net Operating Profit(Loss): Regulated Services 10,459,521 8,709,816 8,919,906 Unegulated Services -4,678,599 -5,439,111 -6,250,996 Total 5,780,922 3,270,705 2,668,910
Total Non-Operating Profit(Loss): 27,600 121,913 50,554 Non-Operating Revenue 27,600 121,913 50,554 Non-Operating Expenses 0 0 0
Total Excess Profit 5,808,522 3,392,618 2,719,464
% Change in NPR per EIPA - Regulated 10.39 -0.39 11.17 % Change in NOR per EIPA - Regulated 10.34 -0.27 11.09 % Change in Oper. Expense per EIPA- Regulated 9.93 -0.20 14.03 % Change in Net Operating Profit- Regulated 20.09 -2.36 -32.57
% Net Operating Profit of Regulated NOR 5.00 4.66 4.72 % Change in Net Operating Profit- Total 76.75 22.55 -35.33 % Net Total Operating Profit of Total NOR 2.59 1.58 1.29 % Change in Total Excess Profit 71.21 24.75 -43.06 % Total Excess Profit of Total Revenue 2.60 1.64 1.31

HEALTH SERVICES COST REVIEW COMMISSION DISCLOSURE OF HOSPITAL FINANCIAL AND STATISTICAL DATA FISCAL YEAR 2009 TO 2011 Page 42 =======================================================================================================
Suburban Hospital
FISCAL YEAR ENDING June 2011 June 2010 June 2009 -------------- -------------- -------------- Gross Patient Revenue: Regulated Services 253,166,900 234,114,100 228,243,300 Unregulated Services 17,329,554 21,518,772 24,730,400 TOTAL 270,496,454 255,632,872 252,973,700 Net Patient Revenue(NPR): Regulated Services 217,988,385 201,587,614 199,185,500 Unregulated Services 14,264,942 16,006,327 17,259,100 TOTAL 232,253,327 217,593,940 216,444,600 Other Operating Revenue: Regulated Services 4,587,637 6,466,197 5,055,700 Unregulated Services 9,160,414 7,087,503 7,350,800 TOTAL 13,748,051 13,553,700 12,406,500 Net Operating Revenue(NOR) Regulated Services 222,576,022 208,053,811 204,241,200 Unegulated Services 23,425,356 23,093,830 24,609,900 Total 246,001,378 231,147,640 228,851,100 Total Operating Expenses: Regulated Services 208,508,731 198,393,041 195,403,393 Total 230,275,371 222,027,498 221,079,100 Equivalent Inpatient ADMs(EIPA): Regulated Services 20,516 19,302 19,929 Total 21,921 21,076 22,088 NPR per EIPA : Regulated Services 10,625.20 10,443.99 9,994.98 Total 10,595.24 10,324.29 9,799.33 NOR per EIPA : Regulated Services 10,848.81 10,778.99 10,248.67 Total 11,222.42 10,967.38 10,361.03 Operating Expenses per EIPA : Regulated Services 10,163.14 10,278.48 9,805.19 Total 10,505.01 10,534.65 10,009.16 Net Operating Profit(Loss): Regulated Services 14,067,291 9,660,770 8,837,807 Unegulated Services 1,658,716 -540,627 -1,065,807 Total 15,726,007 9,120,142 7,772,000
Total Non-Operating Profit(Loss): 5,903,537 -211,160 -3,531,300 Non-Operating Revenue 5,903,537 -211,200 -3,531,300 Non-Operating Expenses 0 -40 0
Total Excess Profit 21,629,544 8,908,982 4,240,700
% Change in NPR per EIPA - Regulated 1.74 4.49 2.95 % Change in NOR per EIPA - Regulated 0.65 5.17 1.91 % Change in Oper. Expense per EIPA- Regulated -1.12 4.83 4.15 % Change in Net Operating Profit- Regulated 45.61 9.31 -30.58
% Net Operating Profit of Regulated NOR 6.32 4.64 4.33 % Change in Net Operating Profit- Total 72.43 17.35 -44.83 % Net Total Operating Profit of Total NOR 6.39 3.95 3.40 % Change in Total Excess Profit 142.78 110.08 -70.45 % Total Excess Profit of Total Revenue 8.59 3.86 1.88

HEALTH SERVICES COST REVIEW COMMISSION DISCLOSURE OF HOSPITAL FINANCIAL AND STATISTICAL DATA FISCAL YEAR 2009 TO 2011 Page 43 =======================================================================================================
Union Hospital of Cecil County
FISCAL YEAR ENDING June 2011 June 2010 June 2009 -------------- -------------- -------------- Gross Patient Revenue: Regulated Services 137,717,900 126,899,200 126,780,200 Unregulated Services 33,392,400 28,374,200 16,181,600 TOTAL 171,110,300 155,273,400 142,961,800 Net Patient Revenue(NPR): Regulated Services 113,936,800 104,653,300 105,285,300 Unregulated Services 13,922,700 11,797,800 7,702,100 TOTAL 127,859,500 116,451,100 112,987,400 Other Operating Revenue: Regulated Services 829,400 1,432,600 1,209,500 Unregulated Services 1,882,900 1,890,700 1,862,300 TOTAL 2,712,300 3,323,300 3,071,800 Net Operating Revenue(NOR) Regulated Services 114,766,200 106,085,900 106,494,800 Unegulated Services 15,805,600 13,688,500 9,564,400 Total 130,571,800 119,774,400 116,059,200 Total Operating Expenses: Regulated Services 102,914,000 102,497,000 99,599,700 Total 126,141,700 121,769,100 113,610,800 Equivalent Inpatient ADMs(EIPA): Regulated Services 13,899 15,251 15,761 Total 17,267 18,659 17,769 NPR per EIPA : Regulated Services 8,197.34 6,862.04 6,680.09 Total 7,404.65 6,241.05 6,358.53 NOR per EIPA : Regulated Services 8,257.01 6,955.97 6,756.83 Total 7,561.73 6,419.16 6,531.40 Operating Expenses per EIPA : Regulated Services 7,404.29 6,720.65 6,319.36 Total 7,305.17 6,526.07 6,393.61 Net Operating Profit(Loss): Regulated Services 11,852,200 3,588,900 6,895,100 Unegulated Services -7,422,100 -5,583,600 -4,446,700 Total 4,430,100 -1,994,700 2,448,400
Total Non-Operating Profit(Loss): 6,581,100 5,193,800 -7,965,700 Non-Operating Revenue 6,766,700 5,509,700 -7,639,700 Non-Operating Expenses 185,600 315,900 326,000
Total Excess Profit 11,011,200 3,199,100 -5,517,300
% Change in NPR per EIPA - Regulated 19.46 2.72 7.66 % Change in NOR per EIPA - Regulated 18.70 2.95 6.87 % Change in Oper. Expense per EIPA- Regulated 10.17 6.35 7.23 % Change in Net Operating Profit- Regulated 230.25 -47.95 1.12
% Net Operating Profit of Regulated NOR 10.33 3.38 6.47 % Change in Net Operating Profit- Total 322.09 -181.47 -45.15 % Net Total Operating Profit of Total NOR 3.39 -1.67 2.11 % Change in Total Excess Profit 244.20 157.98 -146.84 % Total Excess Profit of Total Revenue 8.02 2.55 -5.09

HEALTH SERVICES COST REVIEW COMMISSION DISCLOSURE OF HOSPITAL FINANCIAL AND STATISTICAL DATA FISCAL YEAR 2009 TO 2011 Page 44 =======================================================================================================
Union Memorial Hospital
FISCAL YEAR ENDING June 2011 June 2010 June 2009 -------------- -------------- -------------- Gross Patient Revenue: Regulated Services 400,597,100 399,909,200 413,847,100 Unregulated Services 131,627,547 116,827,466 96,248,880 TOTAL 532,224,647 516,736,666 510,095,980 Net Patient Revenue(NPR): Regulated Services 337,555,155 336,918,166 353,456,109 Unregulated Services 47,056,844 42,816,999 36,271,722 TOTAL 384,611,999 379,735,165 389,727,831 Other Operating Revenue: Regulated Services 3,836,700 3,827,360 3,918,613 Unregulated Services 8,589,352 8,689,334 8,763,934 TOTAL 12,426,052 12,516,694 12,682,547 Net Operating Revenue(NOR) Regulated Services 341,391,855 340,745,526 357,374,722 Unegulated Services 55,646,196 51,506,333 45,035,656 Total 397,038,051 392,251,859 402,410,378 Total Operating Expenses: Regulated Services 302,554,958 311,343,631 326,289,867 Total 384,090,530 384,174,898 392,085,514 Equivalent Inpatient ADMs(EIPA): Regulated Services 23,625 26,044 27,166 Total 26,942 29,813 30,615 NPR per EIPA : Regulated Services 14,287.85 12,936.47 13,011.09 Total 14,275.36 12,737.19 12,730.10 NOR per EIPA : Regulated Services 14,450.25 13,083.43 13,155.34 Total 14,736.57 13,157.03 13,144.36 Operating Expenses per EIPA : Regulated Services 12,806.38 11,954.50 12,011.07 Total 14,256.01 12,886.11 12,807.11 Net Operating Profit(Loss): Regulated Services 38,836,897 29,401,895 31,084,855 Unegulated Services -25,889,376 -21,324,934 -20,759,991 Total 12,947,521 8,076,961 10,324,864
Total Non-Operating Profit(Loss): 8,426,792 6,635,897 -3,504,021 Non-Operating Revenue 8,426,792 6,635,897 -3,504,021 Non-Operating Expenses 0 0 0
Total Excess Profit 21,374,313 14,712,858 6,820,843
% Change in NPR per EIPA - Regulated 10.45 -0.57 1.12 % Change in NOR per EIPA - Regulated 10.45 -0.55 1.17 % Change in Oper. Expense per EIPA- Regulated 7.13 -0.47 3.65 % Change in Net Operating Profit- Regulated 32.09 -5.41 -19.96
% Net Operating Profit of Regulated NOR 11.38 8.63 8.70 % Change in Net Operating Profit- Total 60.30 -21.77 -55.48 % Net Total Operating Profit of Total NOR 3.26 2.06 2.57 % Change in Total Excess Profit 45.28 115.70 -68.66 % Total Excess Profit of Total Revenue 5.27 3.69 1.71

HEALTH SERVICES COST REVIEW COMMISSION DISCLOSURE OF HOSPITAL FINANCIAL AND STATISTICAL DATA FISCAL YEAR 2009 TO 2011 Page 45 =======================================================================================================
University MIEMSS
FISCAL YEAR ENDING June 2011 June 2010 June 2009 -------------- -------------- -------------- Gross Patient Revenue: Regulated Services 180,648,800 164,471,100 154,824,600 Unregulated Services 3,453,000 1,852,000 1,363,135 TOTAL 184,101,800 166,323,100 156,187,735 Net Patient Revenue(NPR): Regulated Services 153,261,047 139,630,090 125,289,009 Unregulated Services 3,453,000 1,852,000 1,363,135 TOTAL 156,714,047 141,482,090 126,652,144 Other Operating Revenue: Regulated Services 3,201,000 3,174,900 2,910,834 Unregulated Services 0 0 0 TOTAL 3,201,000 3,174,900 2,910,834 Net Operating Revenue(NOR) Regulated Services 156,462,047 142,804,990 128,199,844 Unegulated Services 3,453,000 1,852,000 1,363,135 Total 159,915,047 144,656,990 129,562,979 Total Operating Expenses: Regulated Services 138,690,000 138,860,132 140,611,809 Total 144,828,400 144,925,632 145,996,709 Equivalent Inpatient ADMs(EIPA): Regulated Services 8,516 8,185 7,614 Total 8,679 8,277 7,681 NPR per EIPA : Regulated Services 17,996.07 17,059.64 16,455.03 Total 18,056.39 17,093.43 16,488.89 NOR per EIPA : Regulated Services 18,371.94 17,447.54 16,837.33 Total 18,425.21 17,477.02 16,867.85 Operating Expenses per EIPA : Regulated Services 16,285.13 16,965.57 18,467.48 Total 16,686.94 17,509.47 19,007.36 Net Operating Profit(Loss): Regulated Services 17,772,047 3,944,858 -12,411,966 Unegulated Services -2,685,400 -4,213,500 -4,021,765 Total 15,086,647 -268,642 -16,433,731
Total Non-Operating Profit(Loss): 1,966,000 1,966,000 -2,167,000 Non-Operating Revenue 1,966,000 1,966,000 -2,167,000 Non-Operating Expenses 0 0 0
Total Excess Profit 17,052,647 1,697,358 -18,600,731
% Change in NPR per EIPA - Regulated 5.49 3.67 2.05 % Change in NOR per EIPA - Regulated 5.30 3.62 -0.91 % Change in Oper. Expense per EIPA- Regulated -4.01 -8.13 11.76 % Change in Net Operating Profit- Regulated 350.51 131.78 -439.89
% Net Operating Profit of Regulated NOR 11.36 2.76 -9.68 % Change in Net Operating Profit- Total 5,715.90 98.37 -3,335.40 % Net Total Operating Profit of Total NOR 9.43 -0.19 -12.68 % Change in Total Excess Profit 904.66 109.13 -1,350.35 % Total Excess Profit of Total Revenue 10.53 1.16 -14.60
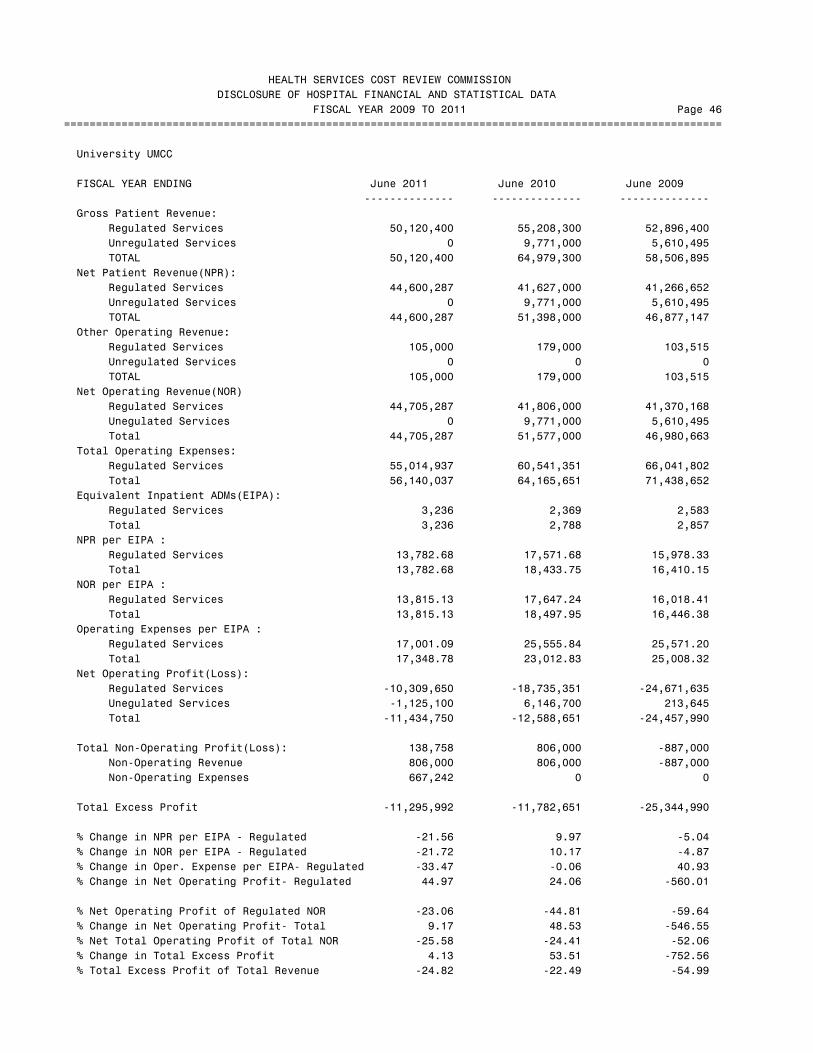
HEALTH SERVICES COST REVIEW COMMISSION DISCLOSURE OF HOSPITAL FINANCIAL AND STATISTICAL DATA FISCAL YEAR 2009 TO 2011 Page 46 =======================================================================================================
University UMCC
FISCAL YEAR ENDING June 2011 June 2010 June 2009 -------------- -------------- -------------- Gross Patient Revenue: Regulated Services 50,120,400 55,208,300 52,896,400 Unregulated Services 0 9,771,000 5,610,495 TOTAL 50,120,400 64,979,300 58,506,895 Net Patient Revenue(NPR): Regulated Services 44,600,287 41,627,000 41,266,652 Unregulated Services 0 9,771,000 5,610,495 TOTAL 44,600,287 51,398,000 46,877,147 Other Operating Revenue: Regulated Services 105,000 179,000 103,515 Unregulated Services 0 0 0 TOTAL 105,000 179,000 103,515 Net Operating Revenue(NOR) Regulated Services 44,705,287 41,806,000 41,370,168 Unegulated Services 0 9,771,000 5,610,495 Total 44,705,287 51,577,000 46,980,663 Total Operating Expenses: Regulated Services 55,014,937 60,541,351 66,041,802 Total 56,140,037 64,165,651 71,438,652 Equivalent Inpatient ADMs(EIPA): Regulated Services 3,236 2,369 2,583 Total 3,236 2,788 2,857 NPR per EIPA : Regulated Services 13,782.68 17,571.68 15,978.33 Total 13,782.68 18,433.75 16,410.15 NOR per EIPA : Regulated Services 13,815.13 17,647.24 16,018.41 Total 13,815.13 18,497.95 16,446.38 Operating Expenses per EIPA : Regulated Services 17,001.09 25,555.84 25,571.20 Total 17,348.78 23,012.83 25,008.32 Net Operating Profit(Loss): Regulated Services -10,309,650 -18,735,351 -24,671,635 Unegulated Services -1,125,100 6,146,700 213,645 Total -11,434,750 -12,588,651 -24,457,990
Total Non-Operating Profit(Loss): 138,758 806,000 -887,000 Non-Operating Revenue 806,000 806,000 -887,000 Non-Operating Expenses 667,242 0 0
Total Excess Profit -11,295,992 -11,782,651 -25,344,990
% Change in NPR per EIPA - Regulated -21.56 9.97 -5.04 % Change in NOR per EIPA - Regulated -21.72 10.17 -4.87 % Change in Oper. Expense per EIPA- Regulated -33.47 -0.06 40.93 % Change in Net Operating Profit- Regulated 44.97 24.06 -560.01
% Net Operating Profit of Regulated NOR -23.06 -44.81 -59.64 % Change in Net Operating Profit- Total 9.17 48.53 -546.55 % Net Total Operating Profit of Total NOR -25.58 -24.41 -52.06 % Change in Total Excess Profit 4.13 53.51 -752.56 % Total Excess Profit of Total Revenue -24.82 -22.49 -54.99

HEALTH SERVICES COST REVIEW COMMISSION DISCLOSURE OF HOSPITAL FINANCIAL AND STATISTICAL DATA FISCAL YEAR 2009 TO 2011 Page 47 =======================================================================================================
University of Maryland Medical Center
FISCAL YEAR ENDING June 2011 June 2010 June 2009 -------------- -------------- -------------- Gross Patient Revenue: Regulated Services 1,113,137,000 1,013,735,200 940,100,100 Unregulated Services 10,663,168 12,184,643 13,652,812 TOTAL 1,123,800,168 1,025,919,843 953,752,912 Net Patient Revenue(NPR): Regulated Services 961,486,655 873,940,200 819,239,930 Unregulated Services 10,011,558 12,184,643 12,636,812 TOTAL 971,498,213 886,124,843 831,876,742 Other Operating Revenue: Regulated Services 13,823,963 15,132,348 19,191,128 Unregulated Services 36,846,037 31,308,809 26,293,982 TOTAL 50,670,000 46,441,157 45,485,110 Net Operating Revenue(NOR) Regulated Services 975,310,618 889,072,548 838,431,058 Unegulated Services 46,857,596 43,493,452 38,930,794 Total 1,022,168,213 932,566,000 877,361,852 Total Operating Expenses: Regulated Services 883,383,327 798,890,900 760,178,731 Total 946,953,900 860,378,007 813,799,400 Equivalent Inpatient ADMs(EIPA): Regulated Services 39,823 37,747 35,291 Total 40,204 38,201 35,803 NPR per EIPA : Regulated Services 24,144.00 23,152.48 23,213.99 Total 24,163.92 23,196.47 23,234.64 NOR per EIPA : Regulated Services 24,491.13 23,553.37 23,757.79 Total 25,424.23 24,412.18 24,505.05 Operating Expenses per EIPA : Regulated Services 22,182.73 21,164.27 21,540.43 Total 23,553.43 22,522.48 22,729.73 Net Operating Profit(Loss): Regulated Services 91,927,290 90,181,648 78,252,327 Unegulated Services -16,712,977 -17,993,655 -14,689,875 Total 75,214,313 72,187,993 63,562,452
Total Non-Operating Profit(Loss): 61,751,700 -23,281,000 -55,439,000 Non-Operating Revenue 58,857,000 -23,281,000 -55,439,000 Non-Operating Expenses -2,894,700 0 0
Total Excess Profit 136,966,013 48,906,993 8,123,452
% Change in NPR per EIPA - Regulated 4.28 -0.26 2.29 % Change in NOR per EIPA - Regulated 3.98 -0.86 1.66 % Change in Oper. Expense per EIPA- Regulated 4.81 -1.75 -6.27 % Change in Net Operating Profit- Regulated 1.94 15.24 496.48
% Net Operating Profit of Regulated NOR 9.43 10.14 9.33 % Change in Net Operating Profit- Total 4.19 13.57 1,941.46 % Net Total Operating Profit of Total NOR 7.36 7.74 7.24 % Change in Total Excess Profit 180.05 502.05 114.45 % Total Excess Profit of Total Revenue 12.67 5.38 0.99

HEALTH SERVICES COST REVIEW COMMISSION DISCLOSURE OF HOSPITAL FINANCIAL AND STATISTICAL DATA FISCAL YEAR 2009 TO 2011 Page 48 =======================================================================================================
Upper Chesapeake Medical Center
FISCAL YEAR ENDING December 2011 December 2010 December 2009 -------------- -------------- -------------- Gross Patient Revenue: Regulated Services 259,833,100 226,352,700 219,562,700 Unregulated Services 273,900 182,400 118,800 TOTAL 260,107,000 226,535,100 219,681,500 Net Patient Revenue(NPR): Regulated Services 215,725,606 188,744,950 187,017,300 Unregulated Services 182,900 133,100 107,000 TOTAL 215,908,506 188,878,050 187,124,300 Other Operating Revenue: Regulated Services 1,336,000 922,400 888,100 Unregulated Services 2,403,000 2,356,600 2,368,200 TOTAL 3,739,000 3,279,000 3,256,300 Net Operating Revenue(NOR) Regulated Services 217,061,606 189,667,350 187,905,400 Unegulated Services 2,585,900 2,489,700 2,475,200 Total 219,647,506 192,157,050 190,380,600 Total Operating Expenses: Regulated Services 190,492,953 174,081,113 171,205,099 Total 198,755,260 181,321,000 177,257,000 Equivalent Inpatient ADMs(EIPA): Regulated Services 23,305 23,493 24,221 Total 23,330 24,537 24,234 NPR per EIPA : Regulated Services 9,256.60 8,034.16 7,721.19 Total 9,254.69 7,697.80 7,721.43 NOR per EIPA : Regulated Services 9,313.93 8,073.43 7,757.86 Total 9,414.96 7,831.44 7,855.80 Operating Expenses per EIPA : Regulated Services 8,173.89 7,409.98 7,068.37 Total 8,519.44 7,389.81 7,314.27 Net Operating Profit(Loss): Regulated Services 26,568,653 15,586,237 16,700,301 Unegulated Services -5,676,407 -4,750,187 -3,576,701 Total 20,892,246 10,836,050 13,123,600
Total Non-Operating Profit(Loss): -11,775,000 25,000 23,477,000 Non-Operating Revenue 0 80,000 23,477,000 Non-Operating Expenses 11,775,000 55,000 0
Total Excess Profit 9,117,246 10,861,050 36,600,600
% Change in NPR per EIPA - Regulated 15.22 4.05 7.78 % Change in NOR per EIPA - Regulated 15.37 4.07 8.09 % Change in Oper. Expense per EIPA- Regulated 10.31 4.83 1.94 % Change in Net Operating Profit- Regulated 70.46 -6.67 188.38
% Net Operating Profit of Regulated NOR 12.24 8.22 8.89 % Change in Net Operating Profit- Total 92.80 -17.43 270.85 % Net Total Operating Profit of Total NOR 9.51 5.64 6.89 % Change in Total Excess Profit -16.06 -70.33 179.23 % Total Excess Profit of Total Revenue 4.15 5.65 17.11

HEALTH SERVICES COST REVIEW COMMISSION DISCLOSURE OF HOSPITAL FINANCIAL AND STATISTICAL DATA FISCAL YEAR 2009 TO 2011 Page 49 =======================================================================================================
Washington Adventist Hospital
FISCAL YEAR ENDING December 2011 December 2010 December 2009 -------------- -------------- -------------- Gross Patient Revenue: Regulated Services 270,695,934 265,356,838 284,247,984 Unregulated Services 574,096 707,851 530,141 TOTAL 271,270,030 266,064,689 284,778,125 Net Patient Revenue(NPR): Regulated Services 219,464,572 225,153,003 233,793,878 Unregulated Services 569,563 704,397 526,645 TOTAL 220,034,135 225,857,400 234,320,523 Other Operating Revenue: Regulated Services 2,648,701 2,644,614 2,567,600 Unregulated Services 2,316,834 2,195,607 2,683,287 TOTAL 4,965,535 4,840,221 5,250,887 Net Operating Revenue(NOR) Regulated Services 222,113,273 227,797,617 236,361,478 Unegulated Services 2,886,397 2,900,004 3,209,932 Total 224,999,670 230,697,621 239,571,410 Total Operating Expenses: Regulated Services 218,674,356 222,235,425 236,950,644 Total 222,513,029 226,640,112 241,160,143 Equivalent Inpatient ADMs(EIPA): Regulated Services 19,309 20,602 23,034 Total 19,321 20,628 23,040 NPR per EIPA : Regulated Services 11,365.70 10,928.84 10,149.91 Total 11,388.47 10,949.24 10,169.95 NOR per EIPA : Regulated Services 11,502.87 11,057.21 10,261.38 Total 11,645.48 11,183.88 10,397.85 Operating Expenses per EIPA : Regulated Services 11,324.77 10,787.22 10,286.96 Total 11,516.78 10,987.18 10,466.80 Net Operating Profit(Loss): Regulated Services 3,438,917 5,562,192 -589,166 Unegulated Services -952,276 -1,504,684 -999,567 Total 2,486,641 4,057,509 -1,588,733
Total Non-Operating Profit(Loss): -427,994 485,679 -71,203 Non-Operating Revenue -427,994 485,679 -71,203 Non-Operating Expenses 0 0 0
Total Excess Profit 2,058,647 4,543,188 -1,659,936
% Change in NPR per EIPA - Regulated 4.00 7.67 0.73 % Change in NOR per EIPA - Regulated 4.03 7.76 0.87 % Change in Oper. Expense per EIPA- Regulated 4.98 4.86 0.99 % Change in Net Operating Profit- Regulated -38.17 1,044.08 -96.90
% Net Operating Profit of Regulated NOR 1.55 2.44 -0.25 % Change in Net Operating Profit- Total -38.72 355.39 -75.71 % Net Total Operating Profit of Total NOR 1.11 1.76 -0.66 % Change in Total Excess Profit -54.69 373.70 31.71 % Total Excess Profit of Total Revenue 0.92 1.97 -0.69

HEALTH SERVICES COST REVIEW COMMISSION DISCLOSURE OF HOSPITAL FINANCIAL AND STATISTICAL DATA FISCAL YEAR 2009 TO 2011 Page 50 =======================================================================================================
Western Maryland Regional M. C.
FISCAL YEAR ENDING June 2011 June 2010 June 2009 -------------- -------------- -------------- Gross Patient Revenue: Regulated Services 304,982,500 278,853,100 . Unregulated Services 51,910,900 44,033,100 . TOTAL 356,893,400 322,886,200 . Net Patient Revenue(NPR): Regulated Services 247,155,600 234,206,000 . Unregulated Services 38,269,700 31,556,000 . TOTAL 285,425,300 265,762,000 . Other Operating Revenue: Regulated Services 2,277,300 1,494,700 . Unregulated Services 2,623,100 3,033,700 . TOTAL 4,900,400 4,528,400 . Net Operating Revenue(NOR) Regulated Services 249,432,900 235,700,700 . Unegulated Services 40,892,800 34,589,700 . Total 290,325,700 270,290,400 . Total Operating Expenses: Regulated Services 234,036,619 232,833,577 . Total 287,495,800 275,300,600 . Equivalent Inpatient ADMs(EIPA): Regulated Services 25,965 26,550 . Total 29,329 29,499 . NPR per EIPA : Regulated Services 9,518.94 8,821.26 . Total 9,731.76 9,009.28 . NOR per EIPA : Regulated Services 9,606.65 8,877.56 . Total 9,898.84 9,162.79 . Operating Expenses per EIPA : Regulated Services 9,013.68 8,769.57 . Total 9,802.36 9,332.64 . Net Operating Profit(Loss): Regulated Services 15,396,281 2,867,123 . Unegulated Services -12,566,381 -7,877,323 . Total 2,829,900 -5,010,200 .
Total Non-Operating Profit(Loss): 8,160,100 6,751,000 . Non-Operating Revenue 8,160,100 6,751,000 . Non-Operating Expenses 0 0 .
Total Excess Profit 10,990,000 1,740,800 .
% Change in NPR per EIPA - Regulated 7.91 . . % Change in NOR per EIPA - Regulated 8.21 . . % Change in Oper. Expense per EIPA- Regulated 2.78 . . % Change in Net Operating Profit- Regulated 436.99 . .
% Net Operating Profit of Regulated NOR 6.17 1.22 . % Change in Net Operating Profit- Total 156.48 . . % Net Total Operating Profit of Total NOR 0.97 -1.85 . % Change in Total Excess Profit 531.32 . . % Total Excess Profit of Total Revenue 3.68 0.63 .

HEALTH SERVICES COST REVIEW COMMISSION DISCLOSURE OF HOSPITAL FINANCIAL AND STATISTICAL DATA FISCAL YEAR 2009 TO 2011 Page 1 =======================================================================================================
Germantown Emergency Center
FISCAL YEAR ENDING June 2011 -------------- -------------- -------------- Gross Patient Revenue: Regulated Services 6,672,043 0 0 Unregulated Services 7,518,602 0 0 TOTAL 14,190,645 0 0 Net Patient Revenue(NPR): Regulated Services 5,041,441 0 0 Unregulated Services 5,285,409 0 0 TOTAL 10,326,850 0 0 Other Operating Revenue: Regulated Services 139,408 0 0 Unregulated Services 399,559 0 0 TOTAL 538,967 0 0 Net Operating Revenue(NOR) Regulated Services 5,180,849 0 0 Unegulated Services 5,684,968 0 0 Total 10,865,817 0 0 Total Operating Expenses: Regulated Services 5,408,998 0 0 Total 11,209,023 0 0 Equivalent Inpatient ADMs(EIPA): Regulated Services . 0 0 Total . 0 0 NPR per EIPA : Regulated Services . 0.00 0.00 Total . 0.00 0.00 NOR per EIPA : Regulated Services . 0.00 0.00 Total . 0.00 0.00 Operating Expenses per EIPA : Regulated Services . 0.00 0.00 Total . 0.00 0.00 Net Operating Profit(Loss): Regulated Services -228,149 0 0 Unegulated Services -115,057 0 0 Total -343,206 0 0
Total Non-Operating Profit(Loss): -266,355 0 0 Non-Operating Revenue -266,355 0 0 Non-Operating Expenses 0 0 0
Total Excess Profit -609,561 0 0
% Change in NPR per EIPA - Regulated . . . % Change in NOR per EIPA - Regulated . . . % Change in Oper. Expense per EIPA- Regulated . . . % Change in Net Operating Profit- Regulated . . .
% Net Operating Profit of Regulated NOR -4.40 0.00 0.00 % Change in Net Operating Profit- Total . . . % Net Total Operating Profit of Total NOR -3.16 0.00 0.00 % Change in Total Excess Profit . . . % Total Excess Profit of Total Revenue -5.75 0.00 0.00

HEALTH SERVICES COST REVIEW COMMISSION DISCLOSURE OF HOSPITAL FINANCIAL AND STATISTICAL DATA FISCAL YEAR 2009 TO 2011 Page 2 =======================================================================================================
Queen Anne Emergency Center
FISCAL YEAR ENDING June 2011 -------------- -------------- -------------- Gross Patient Revenue: Regulated Services 3,118,500 0 0 Unregulated Services 0 0 0 TOTAL 3,118,500 0 0 Net Patient Revenue(NPR): Regulated Services 2,863,559 0 0 Unregulated Services 0 0 0 TOTAL 2,863,559 0 0 Other Operating Revenue: Regulated Services 0 0 0 Unregulated Services 0 0 0 TOTAL 0 0 0 Net Operating Revenue(NOR) Regulated Services 2,863,559 0 0 Unegulated Services 0 0 0 Total 2,863,559 0 0 Total Operating Expenses: Regulated Services 5,051,791 0 0 Total 5,051,791 0 0 Equivalent Inpatient ADMs(EIPA): Regulated Services . 0 0 Total . 0 0 NPR per EIPA : Regulated Services . 0.00 0.00 Total . 0.00 0.00 NOR per EIPA : Regulated Services . 0.00 0.00 Total . 0.00 0.00 Operating Expenses per EIPA : Regulated Services . 0.00 0.00 Total . 0.00 0.00 Net Operating Profit(Loss): Regulated Services -2,188,232 0 0 Unegulated Services 0 0 0 Total -2,188,232 0 0
Total Non-Operating Profit(Loss): 0 0 0 Non-Operating Revenue 0 0 0 Non-Operating Expenses 0 0 0
Total Excess Profit -2,188,232 0 0
% Change in NPR per EIPA - Regulated . . . % Change in NOR per EIPA - Regulated . . . % Change in Oper. Expense per EIPA- Regulated . . . % Change in Net Operating Profit- Regulated . . .
% Net Operating Profit of Regulated NOR -76.42 0.00 0.00 % Change in Net Operating Profit- Total . . . % Net Total Operating Profit of Total NOR -76.42 0.00 0.00 % Change in Total Excess Profit . . . % Total Excess Profit of Total Revenue -76.42 0.00 0.00

HEALTH SERVICES COST REVIEW COMMISSIONDISCLOSURE OF HOSPITAL FINANCIAL AND STATISTICAL DATA
FISCAL YEAR 2011-2009
ALL SPECIALTY HOSPITALS
FISCAL YEAR ENDING YEAR 2011 YEAR 2010 YEAR 2009
Gross Patient Revenue 361,591,178 390,881,594 373,612,874
Net Patient Revenue (NPR) 312,426,693 307,941,409 302,717,702
Other Operating Revenue 2,783,217 1,745,054 2,659,047
Net Operating Revenue (NOR) 315,209,910 309,686,463 305,376,749
Operating Expenses 309,571,662 305,951,473 301,656,643
Inpatient Admissions (IPAs) 17,040 17,203 16,669
Equivalent Inpatient Admissions (EIPAs) 18,741 18,627 18,072
NPR per EIPA 16,670.76 16,532.19 16,750.66
Operating Expenses per EIPA 16,518.42 16,425.35 16,691.95
Net Operating Profit (Loss) 5,638,447 3,734,990 3,720,106
Total Non-Operating Profit (Loss) 6,684,143 2,064,311 (8,322,930)
Total Excess Profits (Loss) 12,322,590 5,799,301 (4,602,824)
% Change in NPR per EIPA 0.84 (1.30) (0.48)
% Change in Cost per EIPA 0.57 (1.60) 1.09
Adventist Behavioral Health-Rockville
FISCAL YEAR ENDING YEAR 2011 YEAR 2010 YEAR 2009
Gross Patient Revenue 2,694,020 26,626,700 26,353,500
Net Patient Revenue (NPR) 20,674,928 18,801,800 20,491,700
Other Operating Revenue 441,800 216,300 139,100
Net Operating Revenue (NOR) 21,116,728 19,018,100 20,630,800
Operating Expenses 21,607,012 21,168,800 20,369,500
Inpatient Admissions (IPAs) 2,515 2,825 2,873
Equivalent Inpatient Admissions (EIPAs) 2,833 3,021 3,005
NPR per EIPA 7,297.89 6,223.70 6,819.23
Operating Expenses per EIPA 7,626.90 7,007.22 6,778.57
Net Operating Profit (Loss) (490,284) (2,150,700) 261,300
Total Non-Operating Profit (Loss) (3,285,688) (2,292,000) (2,698,500)
Total Excess Profits (Loss) (3,775,972) (4,442,700) (2,437,200)
% Change in NPR per EIPA 17.26 (8.73) 0.26
% Change in Cost per EIPA 8.84 3.37 (8.37)

HEALTH SERVICES COST REVIEW COMMISSIONDISCLOSURE OF HOSPITAL FINANCIAL AND STATISTICAL DATA
FISCAL YEAR 2011-2009
Adventist Rehab Hospital of MD.
FISCAL YEAR ENDING YEAR 2011 YEAR 2010 YEAR 2009
Gross Patient Revenue 46,328,071 43,607,400 39,847,200
Net Patient Revenue (NPR) 27,408,865 24,850,800 19,718,500
Other Operating Revenue 251,896 130,100 159,900
Net Operating Revenue (NOR) 27,660,761 24,980,900 19,878,400
Operating Expenses 27,960,206 26,033,300 25,366,100
Inpatient Admissions (IPAs) 1,597 1,631 1,642
Equivalent Inpatient Admissions (EIPAs) 1,619 1,631 1,642
NPR per EIPA 16,929.50 15,236.54 12,008.83
Operating Expenses per EIPA 17,270.05 15,961.56 15,448.29
Net Operating Profit (Loss) (299,445) (1,052,400) (5,487,700)
Total Non-Operating Profit (Loss) 2,834,829 3,267,800 6,041,700
Total Excess Profits (Loss) 2,535,384 2,215,400 554,000
% Change in NPR per EIPA 11.11 26.88 (1.25)
% Change in Cost per EIPA 8.20 3.32 6.45
Brook Lane Health Services
FISCAL YEAR ENDING YEAR 2011 YEAR 2010 YEAR 2009
Gross Patient Revenue 12,241,600 11,633,300 10,468,100
Net Patient Revenue (NPR) 9,771,500 9,286,000 8,536,900
Other Operating Revenue 143,300 142,100 125,300
Net Operating Revenue (NOR) 9,914,800 9,428,100 8,662,200
Operating Expenses 11,091,700 10,708,100 10,415,300
Inpatient Admissions (IPAs) 1,694 1,664 1,458
Equivalent Inpatient Admissions (EIPAs) 1,805 1,772 1,577
NPR per EIPA 5,413.57 5,239.94 5,413.38
Operating Expenses per EIPA 6,144.99 6,042.41 6,604.50
Net Operating Profit (Loss) (1,176,900) (1,280,000) (1,753,100)
Total Non-Operating Profit (Loss) 2,591,000 1,913,000 2,008,800
Total Excess Profits (Loss) 1,414,100 633,000 255,700
(47) 19
% Change in NPR per EIPA 3.31 (3.20) (2.15)
% Change in Cost per EIPA 1.70 (8.51) (9.32)
0 0
0 0

HEALTH SERVICES COST REVIEW COMMISSIONDISCLOSURE OF HOSPITAL FINANCIAL AND STATISTICAL DATA
FISCAL YEAR 2011-2009
Adventist Behavioral Health - Eastern Shore
FISCAL YEAR ENDING YEAR 2011 YEAR 2010 YEAR 2009
Gross Patient Revenue 2,498,500 2,608,700 3,026,700
Net Patient Revenue (NPR) 2,241,665 2,316,166 2,535,056
Other Operating Revenue 0 0 0
Net Operating Revenue (NOR) 2,241,665 2,316,166 2,535,056
Operating Expenses 905,530 808,787 1,066,731
Inpatient Admissions (IPAs) 342 300 309
Equivalent Inpatient Admissions (EIPAs) 342 300 309
NPR per EIPA 6,554.58 7,720.55 8,204.06
Operating Expenses per EIPA 2,647.75 2,695.96 3,452.20
Net Operating Profit (Loss) 1,336,135 1,507,379 1,468,325
Total Non-Operating Profit (Loss) 0 0 0
Total Excess Profits (Loss) 1,336,135 1,507,379 1,468,325
% Change in NPR per EIPA (15.10) (5.89) (8.44)
% Change in Cost per EIPA (1.79) (21.91) (20.03)
Levindale Hospital
FISCAL YEAR ENDING YEAR 2011 YEAR 2010 YEAR 2009
Gross Patient Revenue 57,501,400 64,879,000 67,857,200
Net Patient Revenue (NPR) 47,973,225 55,675,331 59,584,000
Other Operating Revenue 1,415,500 861,100 959,900
Net Operating Revenue (NOR) 49,388,725 56,536,431 60,543,900
Operating Expenses 47,759,942 52,289,889 51,485,600
Inpatient Admissions (IPAs) 893 688 749
Equivalent Inpatient Admissions (EIPAs) 949 721 774
NPR per EIPA 50,551.34 77,261.13 76,981.91
Operating Expenses per EIPA 50,326.60 72,563.12 66,518.86
Net Operating Profit (Loss) 1,628,783 4,246,542 9,058,300
Total Non-Operating Profit (Loss) (320,823) (3,669,778) (9,677,900)
Total Excess Profits (Loss) 1,307,960 576,764 (619,600)
% Change in NPR per EIPA (34.57) 0.36 (6.82)
% Change in Cost per EIPA (30.64) 9.09 (1.24)
* NOTE: FY 2005 Regulated Service Only

HEALTH SERVICES COST REVIEW COMMISSIONDISCLOSURE OF HOSPITAL FINANCIAL AND STATISTICAL DATA
FISCAL YEAR 2011-2009
Mt. Washington Pediatric Hospital
FISCAL YEAR ENDING YEAR 2011 YEAR 2010 YEAR 2009
Gross Patient Revenue 49,553,000 50,283,400 47,388,100
Net Patient Revenue (NPR) 47,647,556 45,298,185 42,414,800
Other Operating Revenue 291,981 76,487 178,000
Net Operating Revenue (NOR) 47,939,537 45,374,671 42,592,800
Operating Expenses 40,908,322 40,274,313 37,697,600
Inpatient Admissions (IPAs) 727 737 705
Equivalent Inpatient Admissions (EIPAs) 912 863 863
NPR per EIPA 52,245.13 52,489.21 49,148.09
Operating Expenses per EIPA 44,855.62 46,667.80 43,682.04
Net Operating Profit (Loss) 7,031,414 5,100,358 4,895,200
Total Non-Operating Profit (Loss) 2,662,067 (537,249) (3,290,600)
Total Excess Profits (Loss) 9,693,481 4,563,109 1,604,600
% Change in NPR per EIPA (0.47) 6.80 22.05
% Change in Cost per EIPA (3.88) 6.84 19.15
Sheppard Pratt Hospital
FISCAL YEAR ENDING YEAR 2011 YEAR 2010 YEAR 2009
Gross Patient Revenue 126,921,400 126,018,300 110,846,600
Net Patient Revenue (NPR) 103,073,206 97,548,922 92,702,000
Other Operating Revenue 195,481 89,612 1,025,700
Net Operating Revenue (NOR) 103,268,687 97,638,534 93,727,700
Operating Expenses 101,940,810 96,959,410 93,897,000
Inpatient Admissions (IPAs) 8,294 8,397 7,953
Equivalent Inpatient Admissions (EIPAs) 9,151 9,267 8,812
NPR per EIPA 11,263.60 10,526.01 10,519.97
Operating Expenses per EIPA 11,139.85 10,462.40 10,655.58
Net Operating Profit (Loss) 1,327,877 679,124 (169,300)
Total Non-Operating Profit (Loss) 4,432,073 4,403,502 (1,704,900)
Total Excess Profits (Loss) 5,759,950 5,082,626 (1,874,200)
% Change in NPR per EIPA 7.01 0.06 5.52
% Change in Cost per EIPA 6.48 (1.81) 6.48

HEALTH SERVICES COST REVIEW COMMISSIONDISCLOSURE OF HOSPITAL FINANCIAL AND STATISTICAL DATA
FISCAL YEAR 2011-2009
St. Luke Institute
FISCAL YEAR ENDING YEAR 2011 YEAR 2010 YEAR 2009
Gross Patient Revenue 6,066,087 5,707,394 6,416,974
Net Patient Revenue (NPR) 5,486,648 5,345,816 6,103,446
Other Operating Revenue 57,729 110,458 141,647
Net Operating Revenue (NOR) 5,544,377 5,456,274 6,245,093
Operating Expenses 7,075,807 7,177,979 6,900,012
Inpatient Admissions (IPAs) 68 70 80
Equivalent Inpatient Admissions (EIPAs) 72 74 102
NPR per EIPA 76,203.44 72,240.76 59,837.71
Operating Expenses per EIPA 98,275.10 96,999.72 67,647.18
Net Operating Profit (Loss) (1,531,430) (1,721,705) (654,919)
Total Non-Operating Profit (Loss) (1,197,018) (1,197,018) 2,445,670
Total Excess Profits (Loss) (2,728,448) (2,918,723) 1,790,751
% Change in NPR per EIPA 5.49 20.73 (5.29)
% Change in Cost per EIPA 1.31 43.39 (7.23)
University Specialty Hospital
FISCAL YEAR ENDING YEAR 2011 YEAR 2010 YEAR 2009
Gross Patient Revenue 57,787,100 59,517,400 61,408,500
Net Patient Revenue (NPR) 48,149,100 48,818,390 50,631,300
Other Operating Revenue (14,470) 118,898 (70,500)
Net Operating Revenue (NOR) 48,134,630 48,937,287 50,560,800
Operating Expenses 50,322,333 50,530,895 54,458,800
Inpatient Admissions (IPAs) 910 891 900
Equivalent Inpatient Admissions (EIPAs) 1,058 978 988
NPR per EIPA 45,509.55 49,937.17 51,246.26
Operating Expenses per EIPA 47,563.64 51,688.92 55,120.24
Net Operating Profit (Loss) (2,187,703) (1,593,607) (3,898,000)
Total Non-Operating Profit (Loss) (1,032,297) 176,054 (1,447,200)
Total Excess Profits (Loss) (3,220,000) (1,417,554) (5,345,200)
% Change in NPR per EIPA (8.87) (2.55) (0.19)
% Change in Cost per EIPA (7.98) (6.23) 4.54

CHANGE IN COST PER EQUIVALANT ADMISSION(EIPA): EXHIBIT I-a 1 REGULATED OPERATIONS Listed by Alphabetical Order
____________________ 2010 _____________________ _____________________ 2011 ______________________ Admis Operating Expense Admis Operating Expense %($) Hospital -sions EIPAs Expenses per EIPA -sions EIPAs Expenses per EIPA Change ƒƒƒƒƒƒƒƒƒƒƒƒƒƒƒƒƒƒƒƒƒƒƒƒƒƒƒƒƒƒƒƒƒƒƒƒƒƒƒƒƒƒƒƒƒƒƒƒƒƒƒƒƒƒƒƒƒƒƒƒƒƒƒƒƒƒƒƒƒƒƒƒƒƒƒƒƒƒƒƒƒƒƒƒƒƒƒƒƒƒƒƒƒƒƒƒƒƒƒƒƒƒƒƒƒƒƒƒƒƒƒƒƒƒƒƒƒƒƒƒƒƒƒƒƒƒƒƒƒƒƒƒƒƒƒƒƒƒƒƒƒƒƒƒƒƒƒ All Acute Hospitals 693,284 1,036,000 10,784,939,280 10,410.18 662,386 1,018,057 11,158,496,980 10,960.58 5.29% Anne Arundel Medical Center 24,309 38,222 338,052,332 8,844.44 25,266 41,134 371,871,480 9,040.48 2.22% Atlantic General Hospital 3,964 8,251 63,446,909 7,689.29 4,011 8,602 65,558,492 7,621.08 ( 0.89%) Baltimore Washington Medical Center 20,556 31,830 275,681,538 8,661.18 18,608 29,727 281,461,913 9,468.37 9.32% Bon Secours Hospital 7,450 10,732 88,260,009 8,223.89 7,203 10,810 92,723,485 8,577.22 4.30% Calvert Memorial Hospital 7,929 15,490 97,660,195 6,304.87 7,555 14,469 101,658,343 7,026.04 11.44% Carroll County General Hospital 16,139 22,366 167,347,659 7,482.11 14,339 20,643 161,836,399 7,839.62 4.78% Chester River Hospital 3,286 6,386 51,116,572 8,004.84 2,787 5,495 49,886,918 9,079.30 13.42% Civista Medical Center 8,305 12,436 93,008,782 7,478.94 7,835 12,619 92,856,943 7,358.36 ( 1.61%) Doctors Community Hospital 12,393 19,629 162,992,683 8,303.49 13,147 20,349 174,216,209 8,561.47 3.11% Dorchester General Hospital 3,549 6,229 42,143,033 6,765.63 3,454 6,169 41,944,947 6,799.25 0.50% Fort Washington medical Center 3,094 5,963 36,523,900 6,125.43 2,393 5,298 37,259,013 7,033.04 14.82% Franklin Square Hospital Center 27,770 40,072 321,032,279 8,011.33 21,950 34,758 340,668,797 9,801.06 22.34% Frederick Memorial Hospital 18,910 29,886 232,289,402 7,772.63 19,738 31,149 249,564,558 8,011.89 3.08% Garrett County Memorial Hospital 2,572 4,882 29,121,065 5,965.24 2,449 4,705 30,293,633 6,438.43 7.93% Good Samaritan Hospital 17,046 24,188 230,578,507 9,532.88 15,310 22,357 235,303,147 10,525.02 10.41% Greater Baltimore Medical Center 20,379 36,297 334,819,819 9,224.45 19,629 35,457 336,781,695 9,498.19 2.97% Harbor Hospital Center 12,897 17,511 156,405,328 8,931.94 10,677 15,536 156,221,586 10,055.22 12.58% Harford Memorial Hospital 6,720 11,255 76,898,545 6,832.53 5,566 10,041 77,961,016 7,764.04 13.63% Holy Cross Hospital 28,480 38,770 311,789,082 8,041.92 29,042 39,880 326,261,891 8,181.02 1.73% Howard County General Hospital 15,548 23,760 201,837,199 8,494.65 16,083 24,924 205,527,459 8,246.30 ( 2.92%) James Lawrence Kernan Hospital 3,248 4,997 87,012,906 17,411.99 3,286 5,250 87,246,523 16,616.81 ( 4.57%) Johns Hopkins Bayview Medical Center 21,961 33,626 427,728,068 12,720.23 22,234 34,562 428,009,429 12,383.71 ( 2.65%) Johns Hopkins Hospital 46,599 70,234 1,425,987,171 20,303.23 46,459 70,010 1,477,115,734 21,098.50 3.92% Laurel Regional Hospital 6,197 9,669 85,563,681 8,849.29 5,663 9,477 87,305,281 9,212.72 4.11% Maryland General Hospital 10,923 14,282 136,446,598 9,553.50 9,700 13,553 136,759,389 10,090.94 5.63% McCready Hospital 616 1,736 11,413,281 6,572.86 540 1,542 12,842,513 8,330.16 26.74% Memorial Hospital at Easton 9,739 16,433 133,188,248 8,104.83 9,436 16,228 140,221,608 8,640.91 6.61% Mercy Medical Center 18,447 33,527 307,650,947 9,176.30 17,637 33,407 341,721,164 10,229.12 11.47% Meritus Medical Center 16,192 24,861 211,006,835 8,487.61 16,219 25,377 228,333,405 8,997.66 6.01% Montgomery General Hospital 9,764 14,228 115,963,398 8,150.33 9,936 15,450 119,548,593 7,737.70 ( 5.06%) Northwest Hospital Center 13,292 21,733 161,514,213 7,431.89 13,385 21,539 170,174,366 7,900.84 6.31% Peninsula Regional Hospital 21,789 31,730 304,760,053 9,604.85 21,217 31,681 304,199,081 9,601.88 ( 0.03%) Prince Georges' Hospital Center 13,724 17,809 209,892,050 11,785.80 13,040 16,957 212,877,166 12,553.88 6.52% Saint Agnes Hospital 21,720 30,735 275,390,240 8,960.12 19,599 28,884 278,581,383 9,644.86 7.64% Saint Josephs Medical Center 18,931 28,322 299,994,287 10,592.09 16,822 26,720 293,587,390 10,987.39 3.73% Saint Mary's Hospital 9,102 17,586 93,942,446 5,341.95 7,857 16,151 96,751,142 5,990.40 12.14% Shady Grove Adventist Hospital 21,940 32,832 270,989,498 8,253.81 21,096 31,475 282,132,916 8,963.71 8.60%

CHANGE IN COST PER EQUIVALANT ADMISSION(EIPA): EXHIBIT I-a 2 REGULATED OPERATIONS Listed by Alphabetical Order
____________________ 2010 _____________________ _____________________ 2011 ______________________ Admis Operating Expense Admis Operating Expense %($) Hospital -sions EIPAs Expenses per EIPA -sions EIPAs Expenses per EIPA Change ƒƒƒƒƒƒƒƒƒƒƒƒƒƒƒƒƒƒƒƒƒƒƒƒƒƒƒƒƒƒƒƒƒƒƒƒƒƒƒƒƒƒƒƒƒƒƒƒƒƒƒƒƒƒƒƒƒƒƒƒƒƒƒƒƒƒƒƒƒƒƒƒƒƒƒƒƒƒƒƒƒƒƒƒƒƒƒƒƒƒƒƒƒƒƒƒƒƒƒƒƒƒƒƒƒƒƒƒƒƒƒƒƒƒƒƒƒƒƒƒƒƒƒƒƒƒƒƒƒƒƒƒƒƒƒƒƒƒƒƒƒƒƒƒƒƒƒ Sinai Hospital of Baltimore 26,001 39,398 497,428,352 12,625.73 26,157 39,610 498,388,230 12,582.24 ( 0.34%) Southern Maryland Hospital Center 17,156 23,770 178,386,000 7,504.82 17,010 24,068 198,573,862 8,250.37 9.93% Suburban Hospital 13,693 19,302 198,393,041 10,278.48 14,217 20,516 208,508,731 10,163.14 ( 1.12%) Union Hospital of Cecil County 7,986 15,251 102,497,000 6,720.65 7,032 13,899 102,914,000 7,404.29 10.17% Union Memorial Hospital 19,226 26,044 311,343,631 11,954.50 14,980 23,625 302,554,958 12,806.38 7.13% University MIEMSS 7,701 8,185 138,860,132 16,965.57 7,902 8,516 138,690,000 16,285.13 ( 4.01%) University UMCC 1,227 2,369 60,541,351 25,555.84 1,397 3,236 55,014,937 17,001.09 (33.47%) University of Maryland Medical Center 28,263 37,747 798,890,900 21,164.27 29,188 39,823 883,383,327 22,182.73 4.81% Upper Chesapeake Medical Center 14,223 23,493 174,081,113 7,409.98 13,486 23,305 190,492,953 8,173.89 10.31% Washington Adventist Hospital 15,983 20,602 222,235,425 10,787.22 14,328 19,309 218,674,356 11,324.77 4.98% Western Maryland Regional M. C. 16,345 26,550 232,833,577 8,769.57 15,521 25,965 234,036,619 9,013.68 2.78%

CHANGE IN COST PER EQUIVALANT ADMISSION(EIPA): EXHIBIT I-b 3 REGULATED OPERATIONS Listed by Percentage Change of Cost per EIPA
____________________ 2010 _____________________ _____________________ 2011 ______________________ Admis Operating Expense Admis Operating Expense %($) Hospital -sions EIPAs Expenses per EIPA -sions EIPAs Expenses per EIPA Change ƒƒƒƒƒƒƒƒƒƒƒƒƒƒƒƒƒƒƒƒƒƒƒƒƒƒƒƒƒƒƒƒƒƒƒƒƒƒƒƒƒƒƒƒƒƒƒƒƒƒƒƒƒƒƒƒƒƒƒƒƒƒƒƒƒƒƒƒƒƒƒƒƒƒƒƒƒƒƒƒƒƒƒƒƒƒƒƒƒƒƒƒƒƒƒƒƒƒƒƒƒƒƒƒƒƒƒƒƒƒƒƒƒƒƒƒƒƒƒƒƒƒƒƒƒƒƒƒƒƒƒƒƒƒƒƒƒƒƒƒƒƒƒƒƒƒƒ McCready Hospital 616 1,736 11,413,281 6,572.86 540 1,542 12,842,513 8,330.16 26.74% Franklin Square Hospital Center 27,770 40,072 321,032,279 8,011.33 21,950 34,758 340,668,797 9,801.06 22.34% Fort Washington medical Center 3,094 5,963 36,523,900 6,125.43 2,393 5,298 37,259,013 7,033.04 14.82% Harford Memorial Hospital 6,720 11,255 76,898,545 6,832.53 5,566 10,041 77,961,016 7,764.04 13.63% Chester River Hospital 3,286 6,386 51,116,572 8,004.84 2,787 5,495 49,886,918 9,079.30 13.42% Harbor Hospital Center 12,897 17,511 156,405,328 8,931.94 10,677 15,536 156,221,586 10,055.22 12.58% Saint Mary's Hospital 9,102 17,586 93,942,446 5,341.95 7,857 16,151 96,751,142 5,990.40 12.14% Mercy Medical Center 18,447 33,527 307,650,947 9,176.30 17,637 33,407 341,721,164 10,229.12 11.47% Calvert Memorial Hospital 7,929 15,490 97,660,195 6,304.87 7,555 14,469 101,658,343 7,026.04 11.44% Good Samaritan Hospital 17,046 24,188 230,578,507 9,532.88 15,310 22,357 235,303,147 10,525.02 10.41% Upper Chesapeake Medical Center 14,223 23,493 174,081,113 7,409.98 13,486 23,305 190,492,953 8,173.89 10.31% Union Hospital of Cecil County 7,986 15,251 102,497,000 6,720.65 7,032 13,899 102,914,000 7,404.29 10.17% Southern Maryland Hospital Center 17,156 23,770 178,386,000 7,504.82 17,010 24,068 198,573,862 8,250.37 9.93% Baltimore Washington Medical Center 20,556 31,830 275,681,538 8,661.18 18,608 29,727 281,461,913 9,468.37 9.32% Shady Grove Adventist Hospital 21,940 32,832 270,989,498 8,253.81 21,096 31,475 282,132,916 8,963.71 8.60% Garrett County Memorial Hospital 2,572 4,882 29,121,065 5,965.24 2,449 4,705 30,293,633 6,438.43 7.93% Saint Agnes Hospital 21,720 30,735 275,390,240 8,960.12 19,599 28,884 278,581,383 9,644.86 7.64% Union Memorial Hospital 19,226 26,044 311,343,631 11,954.50 14,980 23,625 302,554,958 12,806.38 7.13% Memorial Hospital at Easton 9,739 16,433 133,188,248 8,104.83 9,436 16,228 140,221,608 8,640.91 6.61% Prince Georges' Hospital Center 13,724 17,809 209,892,050 11,785.80 13,040 16,957 212,877,166 12,553.88 6.52% Northwest Hospital Center 13,292 21,733 161,514,213 7,431.89 13,385 21,539 170,174,366 7,900.84 6.31% Meritus Medical Center 16,192 24,861 211,006,835 8,487.61 16,219 25,377 228,333,405 8,997.66 6.01% Maryland General Hospital 10,923 14,282 136,446,598 9,553.50 9,700 13,553 136,759,389 10,090.94 5.63% All Acute Hospitals 693,284 1,036,000 10,784,939,280 10,410.18 662,386 1,018,057 11,158,496,980 10,960.58 5.29% Washington Adventist Hospital 15,983 20,602 222,235,425 10,787.22 14,328 19,309 218,674,356 11,324.77 4.98% University of Maryland Medical Center 28,263 37,747 798,890,900 21,164.27 29,188 39,823 883,383,327 22,182.73 4.81% Carroll County General Hospital 16,139 22,366 167,347,659 7,482.11 14,339 20,643 161,836,399 7,839.62 4.78% Bon Secours Hospital 7,450 10,732 88,260,009 8,223.89 7,203 10,810 92,723,485 8,577.22 4.30% Laurel Regional Hospital 6,197 9,669 85,563,681 8,849.29 5,663 9,477 87,305,281 9,212.72 4.11% Johns Hopkins Hospital 46,599 70,234 1,425,987,171 20,303.23 46,459 70,010 1,477,115,734 21,098.50 3.92% Saint Josephs Medical Center 18,931 28,322 299,994,287 10,592.09 16,822 26,720 293,587,390 10,987.39 3.73% Frederick Memorial Hospital 18,910 29,886 232,289,402 7,772.63 19,738 31,149 249,564,558 8,011.89 3.08% Doctors Community Hospital 12,393 19,629 162,992,683 8,303.49 13,147 20,349 174,216,209 8,561.47 3.11% Greater Baltimore Medical Center 20,379 36,297 334,819,819 9,224.45 19,629 35,457 336,781,695 9,498.19 2.97%

CHANGE IN COST PER EQUIVALANT ADMISSION(EIPA): EXHIBIT I-b 4 REGULATED OPERATIONS Listed by Percentage Change of Cost per EIPA
____________________ 2010 _____________________ _____________________ 2011 ______________________ Admis Operating Expense Admis Operating Expense %($) Hospital -sions EIPAs Expenses per EIPA -sions EIPAs Expenses per EIPA Change ƒƒƒƒƒƒƒƒƒƒƒƒƒƒƒƒƒƒƒƒƒƒƒƒƒƒƒƒƒƒƒƒƒƒƒƒƒƒƒƒƒƒƒƒƒƒƒƒƒƒƒƒƒƒƒƒƒƒƒƒƒƒƒƒƒƒƒƒƒƒƒƒƒƒƒƒƒƒƒƒƒƒƒƒƒƒƒƒƒƒƒƒƒƒƒƒƒƒƒƒƒƒƒƒƒƒƒƒƒƒƒƒƒƒƒƒƒƒƒƒƒƒƒƒƒƒƒƒƒƒƒƒƒƒƒƒƒƒƒƒƒƒƒƒƒƒƒ Western Maryland Regional M. C. 16,345 26,550 232,833,577 8,769.57 15,521 25,965 234,036,619 9,013.68 2.78% Anne Arundel Medical Center 24,309 38,222 338,052,332 8,844.44 25,266 41,134 371,871,480 9,040.48 2.22% Holy Cross Hospital 28,480 38,770 311,789,082 8,041.92 29,042 39,880 326,261,891 8,181.02 1.73% Dorchester General Hospital 3,549 6,229 42,143,033 6,765.63 3,454 6,169 41,944,947 6,799.25 0.50% Peninsula Regional Hospital 21,789 31,730 304,760,053 9,604.85 21,217 31,681 304,199,081 9,601.88 ( 0.03%) Sinai Hospital of Baltimore 26,001 39,398 497,428,352 12,625.73 26,157 39,610 498,388,230 12,582.24 ( 0.34%) Atlantic General Hospital 3,964 8,251 63,446,909 7,689.29 4,011 8,602 65,558,492 7,621.08 ( 0.89%) Suburban Hospital 13,693 19,302 198,393,041 10,278.48 14,217 20,516 208,508,731 10,163.14 ( 1.12%) Civista Medical Center 8,305 12,436 93,008,782 7,478.94 7,835 12,619 92,856,943 7,358.36 ( 1.61%) Johns Hopkins Bayview Medical Center 21,961 33,626 427,728,068 12,720.23 22,234 34,562 428,009,429 12,383.71 ( 2.65%) Howard County General Hospital 15,548 23,760 201,837,199 8,494.65 16,083 24,924 205,527,459 8,246.30 ( 2.92%) University MIEMSS 7,701 8,185 138,860,132 16,965.57 7,902 8,516 138,690,000 16,285.13 ( 4.01%) James Lawrence Kernan Hospital 3,248 4,997 87,012,906 17,411.99 3,286 5,250 87,246,523 16,616.81 ( 4.57%) Montgomery General Hospital 9,764 14,228 115,963,398 8,150.33 9,936 15,450 119,548,593 7,737.70 ( 5.06%) University UMCC 1,227 2,369 60,541,351 25,555.84 1,397 3,236 55,014,937 17,001.09 (33.47%)

CHANGE IN REVENUE PER ADMISSION: EXHIBIT II-a 5 REGULATED OPERATIONS Listed by Alphabetical Order
________________ 2010 ________________ ________________ 2011 _________________ Admis- Inpatient Revenue Per Admis- Inpatient Revenue Per Volume % Revenue % Hospital sions Revenue $ Admission sions Revenue $ Admission Change Change ƒƒƒƒƒƒƒƒƒƒƒƒƒƒƒƒƒƒƒƒƒƒƒƒƒƒƒƒƒƒƒƒƒƒƒƒƒƒƒƒƒƒƒƒƒƒƒƒƒƒƒƒƒƒƒƒƒƒƒƒƒƒƒƒƒƒƒƒƒƒƒƒƒƒƒƒƒƒƒƒƒƒƒƒƒƒƒƒƒƒƒƒƒƒƒƒƒƒƒƒƒƒƒƒƒƒƒƒƒƒƒƒƒƒƒƒƒƒƒƒƒƒƒƒƒƒƒƒƒƒƒƒƒƒƒƒƒƒƒƒƒ Anne Arundel Medical Center 24,309 264,504,200 10,880.92 25,266 283,383,200 11,215.99 3.94% 3.08% Atlantic General Hospital 3,964 40,445,900 10,203.30 4,011 41,101,500 10,247.20 1.19% 0.43% Baltimore Washington Medical Center 20,556 214,439,600 10,431.97 18,608 221,448,700 11,900.73 ( 9.48%) 14.08% Bon Secours Hospital 7,450 84,217,600 11,304.38 7,203 85,851,000 11,918.78 ( 3.32%) 5.44% Calvert Memorial Hospital 7,929 61,484,500 7,754.38 7,555 67,453,300 8,928.30 ( 4.72%) 15.14% Carroll County General Hospital 16,139 145,929,800 9,042.06 14,339 148,942,600 10,387.24 ( 11.15%) 14.88% Chester River Hospital 3,286 30,844,000 9,386.49 2,787 31,605,500 11,340.33 ( 15.19%) 20.82% Civista Medical Center 8,305 74,448,900 8,964.35 7,835 71,713,900 9,153.02 ( 5.66%) 2.10% Doctors Community Hospital 12,393 123,791,200 9,988.80 13,147 137,650,200 10,470.08 6.08% 4.82% Dorchester General Hospital 3,549 29,605,400 8,341.90 3,454 31,406,600 9,092.82 ( 2.68%) 9.00% Fort Washington medical Center 3,094 23,219,508 7,504.69 2,393 21,304,639 8,902.90 ( 22.66%) 18.63% Franklin Square Hospital Center 27,770 293,113,600 10,555.05 21,950 277,232,200 12,630.17 ( 20.96%) 19.66% Frederick Memorial Hospital 18,910 178,735,500 9,451.90 19,738 205,264,000 10,399.43 4.38% 10.02% Garrett County Memorial Hospital 2,572 20,932,500 8,138.61 2,449 21,099,200 8,615.43 ( 4.78%) 5.86% Good Samaritan Hospital 17,046 207,770,800 12,188.83 15,310 208,274,300 13,603.81 ( 10.18%) 11.61% Greater Baltimore Medical Center 20,379 231,627,600 11,365.99 19,629 236,413,200 12,044.08 ( 3.68%) 5.97% Harbor Hospital Center 12,897 145,212,700 11,259.42 10,677 137,938,400 12,919.21 ( 17.21%) 14.74% Harford Memorial Hospital 6,720 59,792,300 8,897.66 5,566 55,689,100 10,005.23 ( 17.17%) 12.45% Holy Cross Hospital 28,480 302,151,400 10,609.25 29,042 318,781,400 10,976.56 1.97% 3.46% Howard County General Hospital 15,548 160,213,300 10,304.43 16,083 164,853,100 10,250.15 3.44% ( 0.53%) James Lawrence Kernan Hospital 3,248 65,994,600 20,318.53 3,286 64,821,700 19,726.63 1.17% ( 2.91%) Johns Hopkins Bayview Medical Center 21,961 338,376,700 15,408.07 22,234 341,047,900 15,339.03 1.24% ( 0.45%) Johns Hopkins Hospital 46,599 1,133,951,400 24,334.24 46,459 1,175,944,600 25,311.45 ( 0.30%) 4.02% Laurel Regional Hospital 6,197 65,916,100 10,636.78 5,663 61,591,400 10,876.11 ( 8.62%) 2.25% Maryland General Hospital 10,923 136,768,700 12,521.17 9,700 131,088,300 13,514.26 ( 11.20%) 7.93% McCready Hospital 616 6,627,281 10,758.57 540 6,387,400 11,828.52 ( 12.34%) 9.95% Memorial Hospital at Easton 9,739 95,278,600 9,783.20 9,436 100,695,200 10,671.39 ( 3.11%) 9.08% Mercy Medical Center 18,447 213,884,800 11,594.56 17,637 221,773,400 12,574.33 ( 4.39%) 8.45% Meritus Medical Center 16,192 163,020,800 10,067.98 16,219 176,205,900 10,864.17 0.17% 7.91% Montgomery General Hospital 9,764 102,782,100 10,526.64 9,936 100,835,100 10,148.46 1.76% ( 3.59%) Northwest Hospital Center 13,292 131,180,300 9,869.12 13,385 141,487,200 10,570.58 0.70% 7.11% Peninsula Regional Hospital 21,789 270,774,400 12,427.11 21,217 272,153,700 12,827.15 ( 2.63%) 3.22% Prince Georges' Hospital Center 13,724 193,887,500 14,127.62 13,040 202,327,200 15,515.89 ( 4.98%) 9.83% Saint Agnes Hospital 21,720 252,642,900 11,631.81 19,599 255,527,900 13,037.80 ( 9.77%) 12.09% Saint Josephs Medical Center 18,931 250,704,300 13,243.06 16,822 228,022,300 13,555.01 ( 11.14%) 2.36% Saint Mary's Hospital 9,102 65,203,431 7,163.64 7,857 65,266,300 8,306.77 ( 13.68%) 15.96% Shady Grove Adventist Hospital 21,940 224,107,548 10,214.56 21,096 240,387,482 11,394.93 ( 3.85%) 11.56%

CHANGE IN REVENUE PER ADMISSION: EXHIBIT II-a 6 REGULATED OPERATIONS Listed by Alphabetical Order
________________ 2010 ________________ ________________ 2011 _________________ Admis- Inpatient Revenue Per Admis- Inpatient Revenue Per Volume % Revenue % Hospital sions Revenue $ Admission sions Revenue $ Admission Change Change ƒƒƒƒƒƒƒƒƒƒƒƒƒƒƒƒƒƒƒƒƒƒƒƒƒƒƒƒƒƒƒƒƒƒƒƒƒƒƒƒƒƒƒƒƒƒƒƒƒƒƒƒƒƒƒƒƒƒƒƒƒƒƒƒƒƒƒƒƒƒƒƒƒƒƒƒƒƒƒƒƒƒƒƒƒƒƒƒƒƒƒƒƒƒƒƒƒƒƒƒƒƒƒƒƒƒƒƒƒƒƒƒƒƒƒƒƒƒƒƒƒƒƒƒƒƒƒƒƒƒƒƒƒƒƒƒƒƒƒƒƒ Sinai Hospital of Baltimore 26,001 408,990,900 15,729.81 26,157 420,310,600 16,068.76 0.60% 2.15% Southern Maryland Hospital Center 17,156 161,134,900 9,392.34 17,010 176,159,200 10,356.21 ( 0.85%) 10.26% Suburban Hospital 13,693 166,084,300 12,129.14 14,217 175,435,900 12,339.87 3.83% 1.74% Union Hospital of Cecil County 7,986 66,449,000 8,320.69 7,032 69,675,200 9,908.30 ( 11.95%) 19.08% Union Memorial Hospital 19,226 295,217,300 15,355.11 14,980 254,004,700 16,956.26 ( 22.08%) 10.43% University MIEMSS 7,701 154,748,900 20,094.65 7,902 167,617,000 21,211.97 2.61% 5.56% University UMCC 1,227 28,594,800 23,304.65 1,397 21,637,500 15,488.55 13.85% ( 33.54%) University of Maryland Medical Center 28,263 759,029,500 26,855.94 29,188 815,866,000 27,952.10 3.27% 4.08% Upper Chesapeake Medical Center 14,223 137,038,400 9,634.99 13,486 150,358,300 11,149.21 ( 5.18%) 15.72% Washington Adventist Hospital 15,983 205,866,110 12,880.32 14,328 200,862,570 14,018.88 ( 10.35%) 8.84% Western Maryland Regional M. C. 16,345 171,669,500 10,502.88 15,521 182,311,000 11,746.09 ( 5.04%) 11.84% ======== ============== ============ ========== ============== ============ ========= ========= 693,284 8,958,405,378 12,921.70 662,386 9,187,206,991 13,869.87 ( 4.46%) 7.34%

CHANGE IN REVENUE PER ADMISSION: EXHIBIT II-b 7 REGULATED OPERATIONS Listed by Percentage Change of Revenue per Admission
________________ 2010 ________________ _________________ 2011 _________________ Admis- Inpatient Revenue Per Admis- Inpatient Revenue Per Volume % Revenue % Hospital sions Revenue $ Admission sions Revenue $ Admission Change Change ƒƒƒƒƒƒƒƒƒƒƒƒƒƒƒƒƒƒƒƒƒƒƒƒƒƒƒƒƒƒƒƒƒƒƒƒƒƒƒƒƒƒƒƒƒƒƒƒƒƒƒƒƒƒƒƒƒƒƒƒƒƒƒƒƒƒƒƒƒƒƒƒƒƒƒƒƒƒƒƒƒƒƒƒƒƒƒƒƒƒƒƒƒƒƒƒƒƒƒƒƒƒƒƒƒƒƒƒƒƒƒƒƒƒƒƒƒƒƒƒƒƒƒƒƒƒƒƒƒƒƒƒƒƒƒƒƒƒƒƒƒ Chester River Hospital 3,286 30,844,000 9,386.49 2,787 31,605,500 11,340.33 ( 15.19%) 20.82% Franklin Square Hospital Center 27,770 293,113,600 10,555.05 21,950 277,232,200 12,630.17 ( 20.96%) 19.66% Union Hospital of Cecil County 7,986 66,449,000 8,320.69 7,032 69,675,200 9,908.30 ( 11.95%) 19.08% Fort Washington medical Center 3,094 23,219,508 7,504.69 2,393 21,304,639 8,902.90 ( 22.66%) 18.63% Saint Mary's Hospital 9,102 65,203,431 7,163.64 7,857 65,266,300 8,306.77 ( 13.68%) 15.96% Upper Chesapeake Medical Center 14,223 137,038,400 9,634.99 13,486 150,358,300 11,149.21 ( 5.18%) 15.72% Calvert Memorial Hospital 7,929 61,484,500 7,754.38 7,555 67,453,300 8,928.30 ( 4.72%) 15.14% Carroll County General Hospital 16,139 145,929,800 9,042.06 14,339 148,942,600 10,387.24 ( 11.15%) 14.88% Harbor Hospital Center 12,897 145,212,700 11,259.42 10,677 137,938,400 12,919.21 ( 17.21%) 14.74% Baltimore Washington Medical Center 20,556 214,439,600 10,431.97 18,608 221,448,700 11,900.73 ( 9.48%) 14.08% Harford Memorial Hospital 6,720 59,792,300 8,897.66 5,566 55,689,100 10,005.23 ( 17.17%) 12.45% Saint Agnes Hospital 21,720 252,642,900 11,631.81 19,599 255,527,900 13,037.80 ( 9.77%) 12.09% Western Maryland Regional M. C. 16,345 171,669,500 10,502.88 15,521 182,311,000 11,746.09 ( 5.04%) 11.84% Good Samaritan Hospital 17,046 207,770,800 12,188.83 15,310 208,274,300 13,603.81 ( 10.18%) 11.61% Shady Grove Adventist Hospital 21,940 224,107,548 10,214.56 21,096 240,387,482 11,394.93 ( 3.85%) 11.56% Union Memorial Hospital 19,226 295,217,300 15,355.11 14,980 254,004,700 16,956.26 ( 22.08%) 10.43% Southern Maryland Hospital Center 17,156 161,134,900 9,392.34 17,010 176,159,200 10,356.21 ( 0.85%) 10.26% Frederick Memorial Hospital 18,910 178,735,500 9,451.90 19,738 205,264,000 10,399.43 4.38% 10.02% McCready Hospital 616 6,627,281 10,758.57 540 6,387,400 11,828.52 ( 12.34%) 9.95% Prince Georges' Hospital Center 13,724 193,887,500 14,127.62 13,040 202,327,200 15,515.89 ( 4.98%) 9.83% Memorial Hospital at Easton 9,739 95,278,600 9,783.20 9,436 100,695,200 10,671.39 ( 3.11%) 9.08% Dorchester General Hospital 3,549 29,605,400 8,341.90 3,454 31,406,600 9,092.82 ( 2.68%) 9.00% Washington Adventist Hospital 15,983 205,866,110 12,880.32 14,328 200,862,570 14,018.88 ( 10.35%) 8.84% Mercy Medical Center 18,447 213,884,800 11,594.56 17,637 221,773,400 12,574.33 ( 4.39%) 8.45% Maryland General Hospital 10,923 136,768,700 12,521.17 9,700 131,088,300 13,514.26 ( 11.20%) 7.93% Meritus Medical Center 16,192 163,020,800 10,067.98 16,219 176,205,900 10,864.17 0.17% 7.91% Northwest Hospital Center 13,292 131,180,300 9,869.12 13,385 141,487,200 10,570.58 0.70% 7.11% Greater Baltimore Medical Center 20,379 231,627,600 11,365.99 19,629 236,413,200 12,044.08 ( 3.68%) 5.97% Garrett County Memorial Hospital 2,572 20,932,500 8,138.61 2,449 21,099,200 8,615.43 ( 4.78%) 5.86% University MIEMSS 7,701 154,748,900 20,094.65 7,902 167,617,000 21,211.97 2.61% 5.56% Bon Secours Hospital 7,450 84,217,600 11,304.38 7,203 85,851,000 11,918.78 ( 3.32%) 5.44% Doctors Community Hospital 12,393 123,791,200 9,988.80 13,147 137,650,200 10,470.08 6.08% 4.82% University of Maryland Medical Center 28,263 759,029,500 26,855.94 29,188 815,866,000 27,952.10 3.27% 4.08% Johns Hopkins Hospital 46,599 1,133,951,400 24,334.24 46,459 1,175,944,600 25,311.45 ( 0.30%) 4.02%
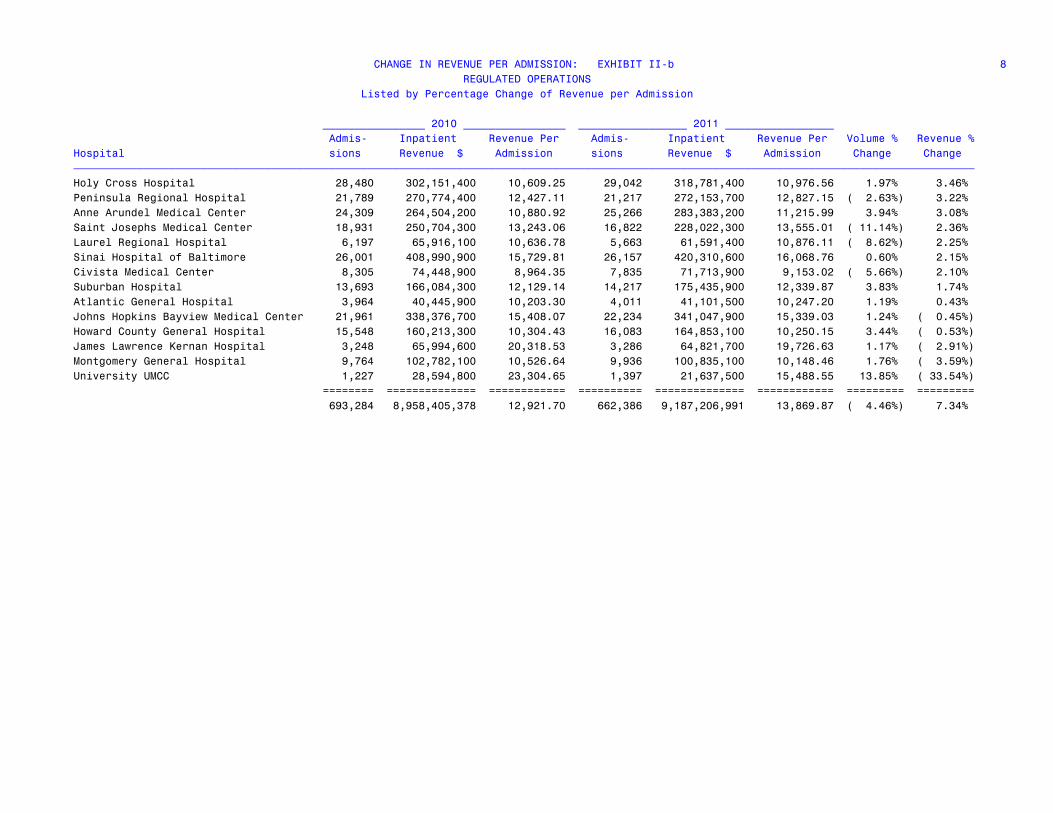
CHANGE IN REVENUE PER ADMISSION: EXHIBIT II-b 8 REGULATED OPERATIONS Listed by Percentage Change of Revenue per Admission
________________ 2010 ________________ _________________ 2011 _________________ Admis- Inpatient Revenue Per Admis- Inpatient Revenue Per Volume % Revenue % Hospital sions Revenue $ Admission sions Revenue $ Admission Change Change ƒƒƒƒƒƒƒƒƒƒƒƒƒƒƒƒƒƒƒƒƒƒƒƒƒƒƒƒƒƒƒƒƒƒƒƒƒƒƒƒƒƒƒƒƒƒƒƒƒƒƒƒƒƒƒƒƒƒƒƒƒƒƒƒƒƒƒƒƒƒƒƒƒƒƒƒƒƒƒƒƒƒƒƒƒƒƒƒƒƒƒƒƒƒƒƒƒƒƒƒƒƒƒƒƒƒƒƒƒƒƒƒƒƒƒƒƒƒƒƒƒƒƒƒƒƒƒƒƒƒƒƒƒƒƒƒƒƒƒƒƒ Holy Cross Hospital 28,480 302,151,400 10,609.25 29,042 318,781,400 10,976.56 1.97% 3.46% Peninsula Regional Hospital 21,789 270,774,400 12,427.11 21,217 272,153,700 12,827.15 ( 2.63%) 3.22% Anne Arundel Medical Center 24,309 264,504,200 10,880.92 25,266 283,383,200 11,215.99 3.94% 3.08% Saint Josephs Medical Center 18,931 250,704,300 13,243.06 16,822 228,022,300 13,555.01 ( 11.14%) 2.36% Laurel Regional Hospital 6,197 65,916,100 10,636.78 5,663 61,591,400 10,876.11 ( 8.62%) 2.25% Sinai Hospital of Baltimore 26,001 408,990,900 15,729.81 26,157 420,310,600 16,068.76 0.60% 2.15% Civista Medical Center 8,305 74,448,900 8,964.35 7,835 71,713,900 9,153.02 ( 5.66%) 2.10% Suburban Hospital 13,693 166,084,300 12,129.14 14,217 175,435,900 12,339.87 3.83% 1.74% Atlantic General Hospital 3,964 40,445,900 10,203.30 4,011 41,101,500 10,247.20 1.19% 0.43% Johns Hopkins Bayview Medical Center 21,961 338,376,700 15,408.07 22,234 341,047,900 15,339.03 1.24% ( 0.45%) Howard County General Hospital 15,548 160,213,300 10,304.43 16,083 164,853,100 10,250.15 3.44% ( 0.53%) James Lawrence Kernan Hospital 3,248 65,994,600 20,318.53 3,286 64,821,700 19,726.63 1.17% ( 2.91%) Montgomery General Hospital 9,764 102,782,100 10,526.64 9,936 100,835,100 10,148.46 1.76% ( 3.59%) University UMCC 1,227 28,594,800 23,304.65 1,397 21,637,500 15,488.55 13.85% ( 33.54%) ======== ============== ============ ========== ============== ============ ========= ========= 693,284 8,958,405,378 12,921.70 662,386 9,187,206,991 13,869.87 ( 4.46%) 7.34%

CHANGE IN UNCOMPENSATED CARE (UCC) : EXHIBIT III-a 9 REGULATED OPERATIONS Listed in Alphabetical Order by Region
________________ 2010 ________________ ________________ 2011 ________________ % Change Hospital Gross Patient Charity & % Gross Patient Charity & % UCC Area Hospital Revenue Bad Debts UCC Revenue Bad Debts UCC Amount ƒƒƒƒƒƒƒƒƒƒƒƒƒƒƒƒƒƒƒƒƒƒƒƒƒƒƒƒƒƒƒƒƒƒƒƒƒƒƒƒƒƒƒƒƒƒƒƒƒƒƒƒƒƒƒƒƒƒƒƒƒƒƒƒƒƒƒƒƒƒƒƒƒƒƒƒƒƒƒƒƒƒƒƒƒƒƒƒƒƒƒƒƒƒƒƒƒƒƒƒƒƒƒƒƒƒƒƒƒƒƒƒƒƒƒƒƒƒƒƒƒƒƒƒƒƒƒƒƒƒƒƒƒƒƒƒƒƒƒƒƒƒƒ M E T R O Anne Arundel Medical Center 415,890,500 19,615,913 4.72 461,358,800 20,849,176 4.52 6.29 Baltimore Washington Medical Center 332,045,200 25,355,718 7.64 353,767,500 31,392,741 8.87 23.81 Bon Secours Hospital 121,320,200 21,647,660 17.84 128,847,200 19,786,192 15.36 -8.60 Doctors Community Hospital 196,074,400 16,244,341 8.28 213,054,400 16,551,270 7.77 1.89 Fort Washington medical Center 44,747,960 5,866,412 13.11 47,165,008 6,265,306 13.28 6.80 Franklin Square Hospital Center 422,965,000 25,280,517 5.98 439,004,200 27,407,203 6.24 8.41 Good Samaritan Hospital 294,819,900 17,250,100 5.85 304,134,300 17,243,726 5.67 -0.04 Greater Baltimore Medical Center 412,551,300 12,894,171 3.13 427,052,500 13,164,700 3.08 2.10 Harbor Hospital Center 197,161,200 14,756,299 7.48 200,717,500 16,894,461 8.42 14.49 Holy Cross Hospital 411,325,700 32,258,317 7.84 437,749,300 36,570,000 8.35 13.37 Howard County General Hospital 244,838,400 14,324,394 5.85 255,470,400 14,923,776 5.84 4.18 James Lawrence Kernan Hospital 101,537,800 7,874,000 7.75 103,574,600 7,306,000 7.05 -7.21 Johns Hopkins Bayview Medical Center 518,108,900 40,544,200 7.83 530,152,100 36,033,600 6.80 -11.13 Johns Hopkins Hospital 1,709,103,100 69,493,300 4.07 1,772,066,300 67,989,700 3.84 -2.16 Laurel Regional Hospital 102,846,900 12,572,241 12.22 103,068,600 12,886,938 12.50 2.50 Maryland General Hospital 178,831,900 18,183,454 10.17 183,154,500 21,680,061 11.84 19.23 Mercy Medical Center 388,727,200 31,845,360 8.19 420,066,700 32,227,827 7.67 1.20 Montgomery General Hospital 149,773,600 10,553,957 7.05 156,795,100 9,166,406 5.85 -13.15 Northwest Hospital Center 214,481,500 18,018,500 8.40 227,677,300 16,944,200 7.44 -5.96 Prince Georges' Hospital Center 251,597,300 37,489,810 14.90 263,104,300 37,622,680 14.30 0.35 Saint Agnes Hospital 357,504,800 22,936,406 6.42 376,582,900 25,974,975 6.90 13.25 Saint Josephs Medical Center 375,076,400 19,033,699 5.07 362,195,000 16,376,133 4.52 -13.96 Shady Grove Adventist Hospital 335,364,985 21,197,920 6.32 358,655,535 20,446,028 5.70 -3.55 Sinai Hospital of Baltimore 619,723,100 34,503,000 5.57 636,490,900 30,647,100 4.82 -11.18 Southern Maryland Hospital Center 223,251,200 18,915,433 8.47 249,258,400 18,327,926 7.35 -3.11 Suburban Hospital 234,114,100 11,285,000 4.82 253,166,900 12,447,406 4.92 10.30 Union Memorial Hospital 399,909,200 20,485,036 5.12 400,597,100 25,082,501 6.26 22.44 University MIEMSS 164,471,100 38,977,010 23.70 180,648,800 40,569,853 22.46 4.09 University UMCC 55,208,300 7,041,000 12.75 50,120,400 5,077,113 10.13 -27.89 University of Maryland Medical Cente 1,013,735,200 83,094,000 8.20 1,113,137,000 87,042,155 7.82 4.75 Upper Chesapeake Medical Center 226,352,700 15,245,150 6.74 259,833,100 17,871,076 6.88 17.22 Washington Adventist Hospital 265,356,838 24,778,718 9.34 270,695,934 30,716,246 11.35 23.96 =============== ============== ============= ======= ============== ============= ======= ======== M E T R O 10,978,815,883 769,561,036 7.01 11,539,362,577 793,484,476 6.88 3.11

CHANGE IN UNCOMPENSATED CARE (UCC) : EXHIBIT III-a 10 REGULATED OPERATIONS Listed in Alphabetical Order by Region
________________ 2010 ________________ ________________ 2011 ________________ % Change Hospital Gross Patient Charity & % Gross Patient Charity & % UCC Area Hospital Revenue Bad Debts UCC Revenue Bad Debts UCC Amount ƒƒƒƒƒƒƒƒƒƒƒƒƒƒƒƒƒƒƒƒƒƒƒƒƒƒƒƒƒƒƒƒƒƒƒƒƒƒƒƒƒƒƒƒƒƒƒƒƒƒƒƒƒƒƒƒƒƒƒƒƒƒƒƒƒƒƒƒƒƒƒƒƒƒƒƒƒƒƒƒƒƒƒƒƒƒƒƒƒƒƒƒƒƒƒƒƒƒƒƒƒƒƒƒƒƒƒƒƒƒƒƒƒƒƒƒƒƒƒƒƒƒƒƒƒƒƒƒƒƒƒƒƒƒƒƒƒƒƒƒƒƒƒ R U R A L Atlantic General Hospital 84,190,900 5,635,600 6.69 88,149,000 5,959,000 6.76 5.74 Calvert Memorial Hospital 120,112,700 7,215,131 6.01 129,181,700 7,436,588 5.76 3.07 Carroll County General Hospital 202,238,000 8,885,880 4.39 214,427,800 11,264,251 5.25 26.77 Chester River Hospital 59,939,400 5,539,678 9.24 62,310,300 6,058,366 9.72 9.36 Civista Medical Center 111,481,500 7,152,500 6.42 115,504,200 8,897,300 7.70 24.39 Dorchester General Hospital 51,961,600 2,531,934 4.87 56,094,100 3,916,137 6.98 54.67 Frederick Memorial Hospital 282,475,300 16,012,032 5.67 323,934,900 20,807,079 6.42 29.95 Garrett County Memorial Hospital 39,731,000 3,469,744 8.73 40,536,700 3,808,831 9.40 9.77 Harford Memorial Hospital 100,141,200 10,596,400 10.58 100,465,500 12,466,311 12.41 17.65 McCready Hospital 18,681,464 2,253,275 12.06 18,235,900 2,584,031 14.17 14.68 Memorial Hospital at Easton 160,769,200 6,975,875 4.34 173,171,500 9,630,098 5.56 38.05 Meritus Medical Center 250,295,900 20,774,200 8.30 275,699,700 21,290,800 7.72 2.49 Peninsula Regional Hospital 394,310,100 25,144,200 6.38 406,379,600 26,798,600 6.59 6.58 Saint Mary's Hospital 125,978,346 9,276,662 7.36 134,162,900 7,221,433 5.38 -22.15 Union Hospital of Cecil County 126,899,200 12,059,500 9.50 137,717,900 11,884,000 8.63 -1.46 Western Maryland Regional M. C. 278,853,100 13,080,000 4.69 304,982,500 17,069,100 5.60 30.50 =============== ============== ============= ======= ============== ============= ======= ======== R U R A L 2,408,058,910 156,602,612 6.50 2,580,954,200 177,091,925 6.86 13.08
============== ============= ======= ============== ============= ======= ======== 13,386,874,793 926,163,648 6.92 14,120,316,777 970,576,401 6.87 4.80

CHANGE IN UNCOMPENSATED CARE (UCC) : EXHIBIT III-b 11 REGULATED OPERATIONS Listed by Percentage of Uncompensated Care by Region
________________ 2010 ________________ _______________ 2011 ________________ % Change Hospital Gross Charity & UCC Gross Charity & UCC UCC Area Hospital Revenues Bad Debts % Revenues Bad Debts % Amount ƒƒƒƒƒƒƒƒƒƒƒƒƒƒƒƒƒƒƒƒƒƒƒƒƒƒƒƒƒƒƒƒƒƒƒƒƒƒƒƒƒƒƒƒƒƒƒƒƒƒƒƒƒƒƒƒƒƒƒƒƒƒƒƒƒƒƒƒƒƒƒƒƒƒƒƒƒƒƒƒƒƒƒƒƒƒƒƒƒƒƒƒƒƒƒƒƒƒƒƒƒƒƒƒƒƒƒƒƒƒƒƒƒƒƒƒƒƒƒƒƒƒƒƒƒƒƒƒƒƒƒƒƒƒƒƒƒƒƒƒƒƒƒ M E T R O University MIEMSS 164,471,100 38,977,010 23.70 180,648,800 40,569,853 22.46 4.09 Bon Secours Hospital 121,320,200 21,647,660 17.84 128,847,200 19,786,192 15.36 -8.60 Prince Georges' Hospital Center 251,597,300 37,489,810 14.90 263,104,300 37,622,680 14.30 0.35 Fort Washington medical Center 44,747,960 5,866,412 13.11 47,165,008 6,265,306 13.28 6.80 Laurel Regional Hospital 102,846,900 12,572,241 12.22 103,068,600 12,886,938 12.50 2.50 Maryland General Hospital 178,831,900 18,183,454 10.17 183,154,500 21,680,061 11.84 19.23 Washington Adventist Hospital 265,356,838 24,778,718 9.34 270,695,934 30,716,246 11.35 23.96 University UMCC 55,208,300 7,041,000 12.75 50,120,400 5,077,113 10.13 -27.89 Baltimore Washington Medical Center 332,045,200 25,355,718 7.64 353,767,500 31,392,741 8.87 23.81 Harbor Hospital Center 197,161,200 14,756,299 7.48 200,717,500 16,894,461 8.42 14.49 Holy Cross Hospital 411,325,700 32,258,317 7.84 437,749,300 36,570,000 8.35 13.37 University of Maryland Medical Cente 1,013,735,200 83,094,000 8.20 1,113,137,000 87,042,155 7.82 4.75 Doctors Community Hospital 196,074,400 16,244,341 8.28 213,054,400 16,551,270 7.77 1.89 Mercy Medical Center 388,727,200 31,845,360 8.19 420,066,700 32,227,827 7.67 1.20 Northwest Hospital Center 214,481,500 18,018,500 8.40 227,677,300 16,944,200 7.44 -5.96 Southern Maryland Hospital Center 223,251,200 18,915,433 8.47 249,258,400 18,327,926 7.35 -3.11 James Lawrence Kernan Hospital 101,537,800 7,874,000 7.75 103,574,600 7,306,000 7.05 -7.21 Saint Agnes Hospital 357,504,800 22,936,406 6.42 376,582,900 25,974,975 6.90 13.25 Upper Chesapeake Medical Center 226,352,700 15,245,150 6.74 259,833,100 17,871,076 6.88 17.22 Johns Hopkins Bayview Medical Center 518,108,900 40,544,200 7.83 530,152,100 36,033,600 6.80 -11.13 Union Memorial Hospital 399,909,200 20,485,036 5.12 400,597,100 25,082,501 6.26 22.44 Franklin Square Hospital Center 422,965,000 25,280,517 5.98 439,004,200 27,407,203 6.24 8.41 Montgomery General Hospital 149,773,600 10,553,957 7.05 156,795,100 9,166,406 5.85 -13.15 Howard County General Hospital 244,838,400 14,324,394 5.85 255,470,400 14,923,776 5.84 4.18 Shady Grove Adventist Hospital 335,364,985 21,197,920 6.32 358,655,535 20,446,028 5.70 -3.55 Good Samaritan Hospital 294,819,900 17,250,100 5.85 304,134,300 17,243,726 5.67 -0.04 Suburban Hospital 234,114,100 11,285,000 4.82 253,166,900 12,447,406 4.92 10.30 Sinai Hospital of Baltimore 619,723,100 34,503,000 5.57 636,490,900 30,647,100 4.82 -11.18 Saint Josephs Medical Center 375,076,400 19,033,699 5.07 362,195,000 16,376,133 4.52 -13.96 Anne Arundel Medical Center 415,890,500 19,615,913 4.72 461,358,800 20,849,176 4.52 6.29 Johns Hopkins Hospital 1,709,103,100 69,493,300 4.07 1,772,066,300 67,989,700 3.84 -2.16 Greater Baltimore Medical Center 412,551,300 12,894,171 3.13 427,052,500 13,164,700 3.08 2.10 =============== ============== ============= ======= ============== ============= ======= ======== M E T R O 10,978,815,883 769,561,036 7.01 11,539,362,577 793,484,476 6.88 3.11

CHANGE IN UNCOMPENSATED CARE (UCC) : EXHIBIT III-b 12 REGULATED OPERATIONS Listed by Percentage of Uncompensated Care by Region
________________ 2010 ________________ _______________ 2011 ________________ % Change Hospital Gross Charity & UCC Gross Charity & UCC UCC Area Hospital Revenues Bad Debts % Revenues Bad Debts % Amount ƒƒƒƒƒƒƒƒƒƒƒƒƒƒƒƒƒƒƒƒƒƒƒƒƒƒƒƒƒƒƒƒƒƒƒƒƒƒƒƒƒƒƒƒƒƒƒƒƒƒƒƒƒƒƒƒƒƒƒƒƒƒƒƒƒƒƒƒƒƒƒƒƒƒƒƒƒƒƒƒƒƒƒƒƒƒƒƒƒƒƒƒƒƒƒƒƒƒƒƒƒƒƒƒƒƒƒƒƒƒƒƒƒƒƒƒƒƒƒƒƒƒƒƒƒƒƒƒƒƒƒƒƒƒƒƒƒƒƒƒƒƒƒ R U R A L McCready Hospital 18,681,464 2,253,275 12.06 18,235,900 2,584,031 14.17 14.68 Harford Memorial Hospital 100,141,200 10,596,400 10.58 100,465,500 12,466,311 12.41 17.65 Chester River Hospital 59,939,400 5,539,678 9.24 62,310,300 6,058,366 9.72 9.36 Garrett County Memorial Hospital 39,731,000 3,469,744 8.73 40,536,700 3,808,831 9.40 9.77 Union Hospital of Cecil County 126,899,200 12,059,500 9.50 137,717,900 11,884,000 8.63 -1.46 Meritus Medical Center 250,295,900 20,774,200 8.30 275,699,700 21,290,800 7.72 2.49 Civista Medical Center 111,481,500 7,152,500 6.42 115,504,200 8,897,300 7.70 24.39 Dorchester General Hospital 51,961,600 2,531,934 4.87 56,094,100 3,916,137 6.98 54.67 Atlantic General Hospital 84,190,900 5,635,600 6.69 88,149,000 5,959,000 6.76 5.74 Peninsula Regional Hospital 394,310,100 25,144,200 6.38 406,379,600 26,798,600 6.59 6.58 Frederick Memorial Hospital 282,475,300 16,012,032 5.67 323,934,900 20,807,079 6.42 29.95 Calvert Memorial Hospital 120,112,700 7,215,131 6.01 129,181,700 7,436,588 5.76 3.07 Western Maryland Regional M. C. 278,853,100 13,080,000 4.69 304,982,500 17,069,100 5.60 30.50 Memorial Hospital at Easton 160,769,200 6,975,875 4.34 173,171,500 9,630,098 5.56 38.05 Saint Mary's Hospital 125,978,346 9,276,662 7.36 134,162,900 7,221,433 5.38 -22.15 Carroll County General Hospital 202,238,000 8,885,880 4.39 214,427,800 11,264,251 5.25 26.77 =============== ============== ============= ======= ============== ============= ======= ======== R U R A L 2,408,058,910 156,602,612 6.50 2,580,954,200 177,091,925 6.86 13.08
============== ============= ======= ============== ============= ======= ======== 13,386,874,793 926,163,648 6.92 14,120,316,777 970,576,401 6.87 4.80

CHANGE IN NET PATIENT REVENUE(NPR) PER EIPA: EXHIBIT IV-a 13 REGULATED OPERATIONS Listed by Alphabetical Order
________________ 2010 ________________ ________________ 2011 ________________ % Change Net Patient NPR Net Patient NPR NPR Hospital Revenue EIPAs Per EIPA Revenue EIPAs Per EIPA Per EIPA ƒƒƒƒƒƒƒƒƒƒƒƒƒƒƒƒƒƒƒƒƒƒƒƒƒƒƒƒƒƒƒƒƒƒƒƒƒƒƒƒƒƒƒƒƒƒƒƒƒƒƒƒƒƒƒƒƒƒƒƒƒƒƒƒƒƒƒƒƒƒƒƒƒƒƒƒƒƒƒƒƒƒƒƒƒƒƒƒƒƒƒƒƒƒƒƒƒƒƒƒƒƒƒƒƒƒƒƒƒƒƒƒƒƒƒƒƒƒƒƒƒƒƒƒƒƒƒƒ All Acute Hospitals 11,378,307,015 1,036,000 10,982.92 11,922,902,382 1,018,057 11,711.43 6.63 Anne Arundel Medical Center 358,018,187 38,222 9,366.81 395,773,822 41,134 9,621.57 2.72 Atlantic General Hospital 70,677,900 8,251 8,565.63 73,273,700 8,602 8,517.96 -0.56 Baltimore Washington Medical Center 281,900,262 31,830 8,856.55 295,750,514 29,727 9,949.04 12.34 Bon Secours Hospital 97,905,389 10,732 9,122.63 106,009,629 10,810 9,806.23 7.49 Calvert Memorial Hospital 102,380,283 15,490 6,609.59 107,446,910 14,469 7,426.11 12.35 Carroll County General Hospital 176,005,258 22,366 7,869.19 182,174,860 20,643 8,824.85 12.14 Chester River Hospital 50,998,039 6,386 7,986.27 51,340,374 5,495 9,343.83 17.00 Civista Medical Center 94,973,916 12,436 7,636.95 95,590,668 12,619 7,574.99 -0.81 Doctors Community Hospital 167,544,370 19,629 8,535.37 181,899,812 20,349 8,939.06 4.73 Dorchester General Hospital 44,769,075 6,229 7,187.21 47,446,616 6,169 7,691.07 7.01 Fort Washington medical Center 36,812,178 5,963 6,173.78 38,192,640 5,298 7,209.27 16.77 Franklin Square Hospital Center 363,651,606 40,072 9,074.89 376,513,275 34,758 10,832.30 19.37 Frederick Memorial Hospital 243,069,472 29,886 8,133.35 272,142,214 31,149 8,736.71 7.42 Garrett County Memorial Hospital 32,709,321 4,882 6,700.27 32,414,248 4,705 6,889.14 2.82 Good Samaritan Hospital 246,725,068 24,188 10,200.43 259,358,444 22,357 11,601.00 13.73 Greater Baltimore Medical Center 359,160,116 36,297 9,895.04 366,631,415 35,457 10,340.03 4.50 Harbor Hospital Center 164,310,074 17,511 9,383.37 165,509,687 15,536 10,653.05 13.53 Harford Memorial Hospital 81,680,300 11,255 7,257.39 80,367,789 10,041 8,003.72 10.28 Holy Cross Hospital 341,997,483 38,770 8,821.08 361,064,200 39,880 9,053.69 2.64 Howard County General Hospital 211,253,743 23,760 8,890.97 219,286,242 24,924 8,798.34 -1.04 James Lawrence Kernan Hospital 87,319,800 4,997 17,473.40 88,207,600 5,250 16,799.86 -3.85 Johns Hopkins Bayview Medical Center 430,968,800 33,626 12,816.61 436,873,400 34,562 12,640.17 -1.38 Johns Hopkins Hospital 1,480,465,000 70,234 21,078.89 1,526,449,134 70,010 21,803.16 3.44 Laurel Regional Hospital 85,075,631 9,669 8,798.81 84,354,149 9,477 8,901.30 1.16 Maryland General Hospital 153,660,657 14,282 10,758.77 155,116,834 13,553 11,445.47 6.38 McCready Hospital 14,374,135 1,736 8,278.00 13,751,431 1,542 8,919.72 7.75 Memorial Hospital at Easton 137,414,364 16,433 8,362.00 145,233,736 16,228 8,949.77 7.03 Mercy Medical Center 335,374,561 33,527 10,003.21 356,258,595 33,407 10,664.29 6.61 Meritus Medical Center 209,148,200 24,861 8,412.85 232,040,400 25,377 9,143.74 8.69 Montgomery General Hospital 124,219,621 14,228 8,730.61 135,596,229 15,450 8,776.38 0.52 Northwest Hospital Center 178,377,100 21,733 8,207.81 187,938,400 21,539 8,725.59 6.31 Peninsula Regional Hospital 332,910,100 31,730 10,492.03 339,681,900 31,681 10,721.88 2.19

CHANGE IN NET PATIENT REVENUE(NPR) PER EIPA: EXHIBIT IV-a 14 REGULATED OPERATIONS Listed by Alphabetical Order
________________ 2010 ________________ ________________ 2011 ________________ % Change Net Patient NPR Net Patient NPR NPR Hospital Revenue EIPAs Per EIPA Revenue EIPAs Per EIPA Per EIPA ƒƒƒƒƒƒƒƒƒƒƒƒƒƒƒƒƒƒƒƒƒƒƒƒƒƒƒƒƒƒƒƒƒƒƒƒƒƒƒƒƒƒƒƒƒƒƒƒƒƒƒƒƒƒƒƒƒƒƒƒƒƒƒƒƒƒƒƒƒƒƒƒƒƒƒƒƒƒƒƒƒƒƒƒƒƒƒƒƒƒƒƒƒƒƒƒƒƒƒƒƒƒƒƒƒƒƒƒƒƒƒƒƒƒƒƒƒƒƒƒƒƒƒƒƒƒƒƒ Prince Georges' Hospital Center 204,287,834 17,809 11,471.11 214,749,210 16,957 12,664.27 10.40 Saint Agnes Hospital 307,715,930 30,735 10,011.87 318,111,245 28,884 11,013.44 10.00 Saint Josephs Medical Center 307,247,166 28,322 10,848.17 293,912,806 26,720 10,999.57 1.40 Saint Mary's Hospital 102,454,852 17,586 5,826.00 110,583,185 16,151 6,846.82 17.52 Shady Grove Adventist Hospital 292,739,292 32,832 8,916.27 306,195,153 31,475 9,728.20 9.11 Sinai Hospital of Baltimore 534,915,500 39,398 13,577.23 549,875,500 39,610 13,882.08 2.25 Southern Maryland Hospital Center 186,636,112 23,770 7,851.91 208,612,308 24,068 8,667.45 10.39 Suburban Hospital 201,587,614 19,302 10,443.99 217,988,385 20,516 10,625.20 1.74 Union Hospital of Cecil County 104,653,300 15,251 6,862.04 113,936,800 13,899 8,197.34 19.46 Union Memorial Hospital 336,918,166 26,044 12,936.47 337,555,155 23,625 14,287.85 10.45 University MIEMSS 139,630,090 8,185 17,059.64 153,261,047 8,516 17,996.07 5.49 University UMCC 41,627,000 2,369 17,571.68 44,600,287 3,236 13,782.68 -21.56 University of Maryland Medical Center 873,940,200 37,747 23,152.48 961,486,655 39,823 24,144.00 4.28 Upper Chesapeake Medical Center 188,744,950 23,493 8,034.16 215,725,606 23,305 9,256.60 15.22 Washington Adventist Hospital 225,153,003 20,602 10,928.84 219,464,572 19,309 11,365.70 4.00 Western Maryland Regional M. C. 234,206,000 26,550 8,821.26 247,155,600 25,965 9,518.94 7.91

CHANGE IN NET PATIENT REVENUE(NPR) PER EIPA: EXHIBIT IV-b 15 Listed by Net Patient Revenues per EIPA
________________ 2010 ________________ _______________ 2011 ________________ % Change Net Patient NPR Net Patient NPR NPR Hospital Revenue EIPAs Per EIPA Revenue EIPAs Per EIPA Per EIPA ƒƒƒƒƒƒƒƒƒƒƒƒƒƒƒƒƒƒƒƒƒƒƒƒƒƒƒƒƒƒƒƒƒƒƒƒƒƒƒƒƒƒƒƒƒƒƒƒƒƒƒƒƒƒƒƒƒƒƒƒƒƒƒƒƒƒƒƒƒƒƒƒƒƒƒƒƒƒƒƒƒƒƒƒƒƒƒƒƒƒƒƒƒƒƒƒƒƒƒƒƒƒƒƒƒƒƒƒƒƒƒƒƒƒƒƒƒƒƒƒƒƒƒƒƒƒƒƒ University of Maryland Medical Center 873,940,200 37,747 23,152.48 961,486,655 39,823 24,144.00 4.28 Johns Hopkins Hospital 1,480,465,000 70,234 21,078.89 1,526,449,134 70,010 21,803.16 3.44 University MIEMSS 139,630,090 8,185 17,059.64 153,261,047 8,516 17,996.07 5.49 James Lawrence Kernan Hospital 87,319,800 4,997 17,473.40 88,207,600 5,250 16,799.86 -3.85 Union Memorial Hospital 336,918,166 26,044 12,936.47 337,555,155 23,625 14,287.85 10.45 Sinai Hospital of Baltimore 534,915,500 39,398 13,577.23 549,875,500 39,610 13,882.08 2.25 University UMCC 41,627,000 2,369 17,571.68 44,600,287 3,236 13,782.68 -21.56 Prince Georges' Hospital Center 204,287,834 17,809 11,471.11 214,749,210 16,957 12,664.27 10.40 Johns Hopkins Bayview Medical Center 430,968,800 33,626 12,816.61 436,873,400 34,562 12,640.17 -1.38 All Acute Hospitals 11,378,307,015 1,036,000 10,982.92 11,922,902,382 1,018,057 11,711.43 6.63 Good Samaritan Hospital 246,725,068 24,188 10,200.43 259,358,444 22,357 11,601.00 13.73 Maryland General Hospital 153,660,657 14,282 10,758.77 155,116,834 13,553 11,445.47 6.38 Washington Adventist Hospital 225,153,003 20,602 10,928.84 219,464,572 19,309 11,365.70 4.00 Saint Agnes Hospital 307,715,930 30,735 10,011.87 318,111,245 28,884 11,013.44 10.00 Saint Josephs Medical Center 307,247,166 28,322 10,848.17 293,912,806 26,720 10,999.57 1.40 Franklin Square Hospital Center 363,651,606 40,072 9,074.89 376,513,275 34,758 10,832.30 19.37 Peninsula Regional Hospital 332,910,100 31,730 10,492.03 339,681,900 31,681 10,721.88 2.19 Mercy Medical Center 335,374,561 33,527 10,003.21 356,258,595 33,407 10,664.29 6.61 Harbor Hospital Center 164,310,074 17,511 9,383.37 165,509,687 15,536 10,653.05 13.53 Suburban Hospital 201,587,614 19,302 10,443.99 217,988,385 20,516 10,625.20 1.74 Greater Baltimore Medical Center 359,160,116 36,297 9,895.04 366,631,415 35,457 10,340.03 4.50 Baltimore Washington Medical Center 281,900,262 31,830 8,856.55 295,750,514 29,727 9,949.04 12.34 Bon Secours Hospital 97,905,389 10,732 9,122.63 106,009,629 10,810 9,806.23 7.49 Shady Grove Adventist Hospital 292,739,292 32,832 8,916.27 306,195,153 31,475 9,728.20 9.11 Anne Arundel Medical Center 358,018,187 38,222 9,366.81 395,773,822 41,134 9,621.57 2.72 Western Maryland Regional M. C. 234,206,000 26,550 8,821.26 247,155,600 25,965 9,518.94 7.91 Chester River Hospital 50,998,039 6,386 7,986.27 51,340,374 5,495 9,343.83 17.00 Upper Chesapeake Medical Center 188,744,950 23,493 8,034.16 215,725,606 23,305 9,256.60 15.22 Meritus Medical Center 209,148,200 24,861 8,412.85 232,040,400 25,377 9,143.74 8.69 Holy Cross Hospital 341,997,483 38,770 8,821.08 361,064,200 39,880 9,053.69 2.64 Memorial Hospital at Easton 137,414,364 16,433 8,362.00 145,233,736 16,228 8,949.77 7.03 Doctors Community Hospital 167,544,370 19,629 8,535.37 181,899,812 20,349 8,939.06 4.73 McCready Hospital 14,374,135 1,736 8,278.00 13,751,431 1,542 8,919.72 7.75 Laurel Regional Hospital 85,075,631 9,669 8,798.81 84,354,149 9,477 8,901.30 1.16 Carroll County General Hospital 176,005,258 22,366 7,869.19 182,174,860 20,643 8,824.85 12.14

CHANGE IN NET PATIENT REVENUE(NPR) PER EIPA: EXHIBIT IV-b 16 Listed by Net Patient Revenues per EIPA
________________ 2010 ________________ _______________ 2011 ________________ % Change Net Patient NPR Net Patient NPR NPR Hospital Revenue EIPAs Per EIPA Revenue EIPAs Per EIPA Per EIPA ƒƒƒƒƒƒƒƒƒƒƒƒƒƒƒƒƒƒƒƒƒƒƒƒƒƒƒƒƒƒƒƒƒƒƒƒƒƒƒƒƒƒƒƒƒƒƒƒƒƒƒƒƒƒƒƒƒƒƒƒƒƒƒƒƒƒƒƒƒƒƒƒƒƒƒƒƒƒƒƒƒƒƒƒƒƒƒƒƒƒƒƒƒƒƒƒƒƒƒƒƒƒƒƒƒƒƒƒƒƒƒƒƒƒƒƒƒƒƒƒƒƒƒƒƒƒƒƒ Howard County General Hospital 211,253,743 23,760 8,890.97 219,286,242 24,924 8,798.34 -1.04 Montgomery General Hospital 124,219,621 14,228 8,730.61 135,596,229 15,450 8,776.38 0.52 Frederick Memorial Hospital 243,069,472 29,886 8,133.35 272,142,214 31,149 8,736.71 7.42 Northwest Hospital Center 178,377,100 21,733 8,207.81 187,938,400 21,539 8,725.59 6.31 Southern Maryland Hospital Center 186,636,112 23,770 7,851.91 208,612,308 24,068 8,667.45 10.39 Atlantic General Hospital 70,677,900 8,251 8,565.63 73,273,700 8,602 8,517.96 -0.56 Union Hospital of Cecil County 104,653,300 15,251 6,862.04 113,936,800 13,899 8,197.34 19.46 Harford Memorial Hospital 81,680,300 11,255 7,257.39 80,367,789 10,041 8,003.72 10.28 Dorchester General Hospital 44,769,075 6,229 7,187.21 47,446,616 6,169 7,691.07 7.01 Civista Medical Center 94,973,916 12,436 7,636.95 95,590,668 12,619 7,574.99 -0.81 Calvert Memorial Hospital 102,380,283 15,490 6,609.59 107,446,910 14,469 7,426.11 12.35 Fort Washington medical Center 36,812,178 5,963 6,173.78 38,192,640 5,298 7,209.27 16.77 Garrett County Memorial Hospital 32,709,321 4,882 6,700.27 32,414,248 4,705 6,889.14 2.82 Saint Mary's Hospital 102,454,852 17,586 5,826.00 110,583,185 16,151 6,846.82 17.52

CHANGE IN NET OPERATING REVENUE(NOR) PER EIPA: EXHIBIT V-a 17 REGULATED OPERATIONS Listed by Alphabetical Order
________________ 2010 ________________ _______________ 2011 ________________ % Change Net Operating NOR Net Operating NOR NOR Hospital Revenue EIPAs Per EIPA Revenue EIPAs Per EIPA Per EIPA ƒƒƒƒƒƒƒƒƒƒƒƒƒƒƒƒƒƒƒƒƒƒƒƒƒƒƒƒƒƒƒƒƒƒƒƒƒƒƒƒƒƒƒƒƒƒƒƒƒƒƒƒƒƒƒƒƒƒƒƒƒƒƒƒƒƒƒƒƒƒƒƒƒƒƒƒƒƒƒƒƒƒƒƒƒƒƒƒƒƒƒƒƒƒƒƒƒƒƒƒƒƒƒƒƒƒƒƒƒƒƒƒƒƒƒƒƒƒƒƒƒƒƒƒƒƒƒƒ All Acute Hospitals 11,499,889,233 1,036,000 11,100.28 12,055,926,370 1,018,057 11,842.09 6.68 Anne Arundel Medical Center 360,830,187 38,222 9,440.38 399,181,346 41,134 9,704.41 2.80 Atlantic General Hospital 70,992,991 8,251 8,603.82 73,442,979 8,602 8,537.64 -0.77 Baltimore Washington Medical Center 283,374,875 31,830 8,902.88 297,316,277 29,727 10,001.71 12.34 Bon Secours Hospital 102,685,956 10,732 9,568.07 106,480,100 10,810 9,849.75 2.94 Calvert Memorial Hospital 104,707,459 15,490 6,759.83 111,998,740 14,469 7,740.71 14.51 Carroll County General Hospital 177,318,406 22,366 7,927.90 183,287,771 20,643 8,878.76 11.99 Chester River Hospital 51,271,495 6,386 8,029.10 51,549,234 5,495 9,381.84 16.85 Civista Medical Center 95,022,684 12,436 7,640.88 95,738,125 12,619 7,586.68 -0.71 Doctors Community Hospital 167,694,982 19,629 8,543.04 182,252,260 20,349 8,956.38 4.84 Dorchester General Hospital 45,470,660 6,229 7,299.85 47,817,692 6,169 7,751.22 6.18 Fort Washington medical Center 37,325,560 5,963 6,259.88 38,643,400 5,298 7,294.36 16.53 Franklin Square Hospital Center 366,053,438 40,072 9,134.82 379,693,940 34,758 10,923.81 19.58 Frederick Memorial Hospital 248,531,944 29,886 8,316.13 279,762,961 31,149 8,981.36 8.00 Garrett County Memorial Hospital 32,921,208 4,882 6,743.67 32,531,219 4,705 6,914.00 2.53 Good Samaritan Hospital 249,424,890 24,188 10,312.05 261,881,525 22,357 11,713.86 13.59 Greater Baltimore Medical Center 362,510,833 36,297 9,987.35 371,165,803 35,457 10,467.92 4.81 Harbor Hospital Center 166,517,673 17,511 9,509.44 168,805,482 15,536 10,865.19 14.26 Harford Memorial Hospital 82,444,000 11,255 7,325.25 81,459,289 10,041 8,112.42 10.75 Holy Cross Hospital 343,394,183 38,770 8,857.10 364,921,991 39,880 9,150.42 3.31 Howard County General Hospital 211,297,428 23,760 8,892.80 219,340,604 24,924 8,800.52 -1.04 James Lawrence Kernan Hospital 87,916,871 4,997 17,592.88 88,826,129 5,250 16,917.66 -3.84 Johns Hopkins Bayview Medical Center 437,999,400 33,626 13,025.69 444,696,000 34,562 12,866.50 -1.22 Johns Hopkins Hospital 1,493,443,862 70,234 21,263.68 1,539,932,053 70,010 21,995.74 3.44 Laurel Regional Hospital 85,506,210 9,669 8,843.34 84,979,870 9,477 8,967.33 1.40 Maryland General Hospital 153,942,311 14,282 10,778.49 155,249,163 13,553 11,455.23 6.28 McCready Hospital 14,387,093 1,736 8,285.46 13,909,856 1,542 9,022.48 8.90 Memorial Hospital at Easton 139,221,175 16,433 8,471.95 149,270,216 16,228 9,198.51 8.58 Mercy Medical Center 339,231,791 33,527 10,118.26 362,384,623 33,407 10,847.66 7.21 Meritus Medical Center 213,278,000 24,861 8,578.96 237,303,697 25,377 9,351.14 9.00 Montgomery General Hospital 125,736,633 14,228 8,837.23 136,899,529 15,450 8,860.73 0.27 Northwest Hospital Center 179,400,280 21,733 8,254.90 189,077,500 21,539 8,778.47 6.34 Peninsula Regional Hospital 333,818,900 31,730 10,520.67 340,813,500 31,681 10,757.59 2.25

CHANGE IN NET OPERATING REVENUE(NOR) PER EIPA: EXHIBIT V-a 18 REGULATED OPERATIONS Listed by Alphabetical Order
________________ 2010 ________________ _______________ 2011 ________________ % Change Net Operating NOR Net Operating NOR NOR Hospital Revenue EIPAs Per EIPA Revenue EIPAs Per EIPA Per EIPA ƒƒƒƒƒƒƒƒƒƒƒƒƒƒƒƒƒƒƒƒƒƒƒƒƒƒƒƒƒƒƒƒƒƒƒƒƒƒƒƒƒƒƒƒƒƒƒƒƒƒƒƒƒƒƒƒƒƒƒƒƒƒƒƒƒƒƒƒƒƒƒƒƒƒƒƒƒƒƒƒƒƒƒƒƒƒƒƒƒƒƒƒƒƒƒƒƒƒƒƒƒƒƒƒƒƒƒƒƒƒƒƒƒƒƒƒƒƒƒƒƒƒƒƒƒƒƒƒ Prince Georges' Hospital Center 206,067,664 17,809 11,571.06 216,057,559 16,957 12,741.43 10.11 Saint Agnes Hospital 309,668,125 30,735 10,075.39 320,954,265 28,884 11,111.87 10.29 Saint Josephs Medical Center 307,388,501 28,322 10,853.16 294,403,778 26,720 11,017.95 1.52 Saint Mary's Hospital 104,714,071 17,586 5,954.47 110,856,885 16,151 6,863.77 15.27 Shady Grove Adventist Hospital 296,145,240 32,832 9,020.01 309,139,817 31,475 9,821.76 8.89 Sinai Hospital of Baltimore 543,402,000 39,398 13,792.63 561,048,000 39,610 14,164.14 2.69 Southern Maryland Hospital Center 187,095,816 23,770 7,871.25 209,033,383 24,068 8,684.94 10.34 Suburban Hospital 208,053,811 19,302 10,778.99 222,576,022 20,516 10,848.81 0.65 Union Hospital of Cecil County 106,085,900 15,251 6,955.97 114,766,200 13,899 8,257.01 18.70 Union Memorial Hospital 340,745,526 26,044 13,083.43 341,391,855 23,625 14,450.25 10.45 University MIEMSS 142,804,990 8,185 17,447.54 156,462,047 8,516 18,371.94 5.30 University UMCC 41,806,000 2,369 17,647.24 44,705,287 3,236 13,815.13 -21.72 University of Maryland Medical Center 889,072,548 37,747 23,553.37 975,310,618 39,823 24,491.13 3.98 Upper Chesapeake Medical Center 189,667,350 23,493 8,073.43 217,061,606 23,305 9,313.93 15.37 Washington Adventist Hospital 227,797,617 20,602 11,057.21 222,113,273 19,309 11,502.87 4.03 Western Maryland Regional M. C. 235,700,700 26,550 8,877.56 249,432,900 25,965 9,606.65 8.21

CHANGE IN NET OPERATING REVENUE(NOR) PER EIPA: EXHIBIT V-b 19 Listed by Net Operating Revenues per EIPA
________________ 2010 ________________ _______________ 2011 ________________ % Change Net Operating NOR Net Operating NOR NOR Hospital Revenue EIPAs Per EIPA Revenue EIPAs Per EIPA Per EIPA ƒƒƒƒƒƒƒƒƒƒƒƒƒƒƒƒƒƒƒƒƒƒƒƒƒƒƒƒƒƒƒƒƒƒƒƒƒƒƒƒƒƒƒƒƒƒƒƒƒƒƒƒƒƒƒƒƒƒƒƒƒƒƒƒƒƒƒƒƒƒƒƒƒƒƒƒƒƒƒƒƒƒƒƒƒƒƒƒƒƒƒƒƒƒƒƒƒƒƒƒƒƒƒƒƒƒƒƒƒƒƒƒƒƒƒƒƒƒƒƒƒƒƒƒƒƒƒƒ University of Maryland Medical Center 889,072,548 37,747 23,553.37 975,310,618 39,823 24,491.13 3.98 Johns Hopkins Hospital 1,493,443,862 70,234 21,263.68 1,539,932,053 70,010 21,995.74 3.44 University MIEMSS 142,804,990 8,185 17,447.54 156,462,047 8,516 18,371.94 5.30 James Lawrence Kernan Hospital 87,916,871 4,997 17,592.88 88,826,129 5,250 16,917.66 -3.84 Union Memorial Hospital 340,745,526 26,044 13,083.43 341,391,855 23,625 14,450.25 10.45 Sinai Hospital of Baltimore 543,402,000 39,398 13,792.63 561,048,000 39,610 14,164.14 2.69 University UMCC 41,806,000 2,369 17,647.24 44,705,287 3,236 13,815.13 -21.72 Johns Hopkins Bayview Medical Center 437,999,400 33,626 13,025.69 444,696,000 34,562 12,866.50 -1.22 Prince Georges' Hospital Center 206,067,664 17,809 11,571.06 216,057,559 16,957 12,741.43 10.11 All Acute Hospitals 11,499,889,233 1,036,000 11,100.28 12,055,926,370 1,018,057 11,842.09 6.68 Good Samaritan Hospital 249,424,890 24,188 10,312.05 261,881,525 22,357 11,713.86 13.59 Washington Adventist Hospital 227,797,617 20,602 11,057.21 222,113,273 19,309 11,502.87 4.03 Maryland General Hospital 153,942,311 14,282 10,778.49 155,249,163 13,553 11,455.23 6.28 Saint Agnes Hospital 309,668,125 30,735 10,075.39 320,954,265 28,884 11,111.87 10.29 Saint Josephs Medical Center 307,388,501 28,322 10,853.16 294,403,778 26,720 11,017.95 1.52 Franklin Square Hospital Center 366,053,438 40,072 9,134.82 379,693,940 34,758 10,923.81 19.58 Harbor Hospital Center 166,517,673 17,511 9,509.44 168,805,482 15,536 10,865.19 14.26 Suburban Hospital 208,053,811 19,302 10,778.99 222,576,022 20,516 10,848.81 0.65 Mercy Medical Center 339,231,791 33,527 10,118.26 362,384,623 33,407 10,847.66 7.21 Peninsula Regional Hospital 333,818,900 31,730 10,520.67 340,813,500 31,681 10,757.59 2.25 Greater Baltimore Medical Center 362,510,833 36,297 9,987.35 371,165,803 35,457 10,467.92 4.81 Baltimore Washington Medical Center 283,374,875 31,830 8,902.88 297,316,277 29,727 10,001.71 12.34 Bon Secours Hospital 102,685,956 10,732 9,568.07 106,480,100 10,810 9,849.75 2.94 Shady Grove Adventist Hospital 296,145,240 32,832 9,020.01 309,139,817 31,475 9,821.76 8.89 Anne Arundel Medical Center 360,830,187 38,222 9,440.38 399,181,346 41,134 9,704.41 2.80 Western Maryland Regional M. C. 235,700,700 26,550 8,877.56 249,432,900 25,965 9,606.65 8.21 Chester River Hospital 51,271,495 6,386 8,029.10 51,549,234 5,495 9,381.84 16.85 Meritus Medical Center 213,278,000 24,861 8,578.96 237,303,697 25,377 9,351.14 9.00 Upper Chesapeake Medical Center 189,667,350 23,493 8,073.43 217,061,606 23,305 9,313.93 15.37 Memorial Hospital at Easton 139,221,175 16,433 8,471.95 149,270,216 16,228 9,198.51 8.58 Holy Cross Hospital 343,394,183 38,770 8,857.10 364,921,991 39,880 9,150.42 3.31 McCready Hospital 14,387,093 1,736 8,285.46 13,909,856 1,542 9,022.48 8.90 Frederick Memorial Hospital 248,531,944 29,886 8,316.13 279,762,961 31,149 8,981.36 8.00 Laurel Regional Hospital 85,506,210 9,669 8,843.34 84,979,870 9,477 8,967.33 1.40 Doctors Community Hospital 167,694,982 19,629 8,543.04 182,252,260 20,349 8,956.38 4.84

CHANGE IN NET OPERATING REVENUE(NOR) PER EIPA: EXHIBIT V-b 20 Listed by Net Operating Revenues per EIPA
________________ 2010 ________________ _______________ 2011 ________________ % Change Net Operating NOR Net Operating NOR NOR Hospital Revenue EIPAs Per EIPA Revenue EIPAs Per EIPA Per EIPA ƒƒƒƒƒƒƒƒƒƒƒƒƒƒƒƒƒƒƒƒƒƒƒƒƒƒƒƒƒƒƒƒƒƒƒƒƒƒƒƒƒƒƒƒƒƒƒƒƒƒƒƒƒƒƒƒƒƒƒƒƒƒƒƒƒƒƒƒƒƒƒƒƒƒƒƒƒƒƒƒƒƒƒƒƒƒƒƒƒƒƒƒƒƒƒƒƒƒƒƒƒƒƒƒƒƒƒƒƒƒƒƒƒƒƒƒƒƒƒƒƒƒƒƒƒƒƒƒ Carroll County General Hospital 177,318,406 22,366 7,927.90 183,287,771 20,643 8,878.76 11.99 Montgomery General Hospital 125,736,633 14,228 8,837.23 136,899,529 15,450 8,860.73 0.27 Howard County General Hospital 211,297,428 23,760 8,892.80 219,340,604 24,924 8,800.52 -1.04 Northwest Hospital Center 179,400,280 21,733 8,254.90 189,077,500 21,539 8,778.47 6.34 Southern Maryland Hospital Center 187,095,816 23,770 7,871.25 209,033,383 24,068 8,684.94 10.34 Atlantic General Hospital 70,992,991 8,251 8,603.82 73,442,979 8,602 8,537.64 -0.77 Union Hospital of Cecil County 106,085,900 15,251 6,955.97 114,766,200 13,899 8,257.01 18.70 Harford Memorial Hospital 82,444,000 11,255 7,325.25 81,459,289 10,041 8,112.42 10.75 Dorchester General Hospital 45,470,660 6,229 7,299.85 47,817,692 6,169 7,751.22 6.18 Calvert Memorial Hospital 104,707,459 15,490 6,759.83 111,998,740 14,469 7,740.71 14.51 Civista Medical Center 95,022,684 12,436 7,640.88 95,738,125 12,619 7,586.68 -0.71 Fort Washington medical Center 37,325,560 5,963 6,259.88 38,643,400 5,298 7,294.36 16.53 Garrett County Memorial Hospital 32,921,208 4,882 6,743.67 32,531,219 4,705 6,914.00 2.53 Saint Mary's Hospital 104,714,071 17,586 5,954.47 110,856,885 16,151 6,863.77 15.27

CHANGE IN TOTAL OPERATING PROFIT/LOSS : EXHIBIT VI-a 21 REGULATED & UNREGULATED OPERATIONS Listed by Alphabetical Order
_________________ 2010 _________________ ________________ 2011 _________________ Regulated Unregulated Total Regulated Unregulated Total % Change % Change Operating Operating Operating Operating Operating Operating Reg. Operating Total Net Hospital Profit/Loss Profit/Loss Profit/Loss Profit/Loss Profit/Loss Profit/Loss Profit/Loss Profit/Loss ƒƒƒƒƒƒƒƒƒƒƒƒƒƒƒƒƒƒƒƒƒƒƒƒƒƒƒƒƒƒƒƒƒƒƒƒƒƒƒƒƒƒƒƒƒƒƒƒƒƒƒƒƒƒƒƒƒƒƒƒƒƒƒƒƒƒƒƒƒƒƒƒƒƒƒƒƒƒƒƒƒƒƒƒƒƒƒƒƒƒƒƒƒƒƒƒƒƒƒƒƒƒƒƒƒƒƒƒƒƒƒƒƒƒƒƒƒƒƒƒƒƒƒƒƒƒƒƒƒƒƒƒƒƒƒƒƒƒƒƒƒƒƒƒƒƒƒƒƒƒƒ All Acute Hospitals 714,949,953 -386,837,472 328,112,481 897,429,390 -433,067,249 464,362,141 25.52 41.53 Anne Arundel Medical Center 22,777,855 -5,349,286 17,428,569 27,309,866 -7,295,678 20,014,188 19.90 14.84 Atlantic General Hospital 7,546,082 -6,681,784 864,298 7,884,487 -7,629,939 254,548 4.48 -70.55 Baltimore Washington Medical Center 7,693,337 -699,844 6,993,493 15,854,364 -950,265 14,904,099 106.08 113.11 Bon Secours Hospital 14,425,947 -13,108,545 1,317,402 13,756,615 -14,599,072 -842,457 -4.64 -163.95 Calvert Memorial Hospital 7,047,263 -9,778,742 -2,731,479 10,340,397 -9,688,834 651,563 46.73 123.85 Carroll County General Hospital 9,970,747 -11,266,620 -1,295,873 21,451,372 -12,020,069 9,431,303 115.14 827.80 Chester River Hospital 154,923 -1,828,923 -1,674,000 1,662,317 -1,131,284 531,033 973.00 131.72 Civista Medical Center 2,013,901 -331,444 1,682,457 2,881,182 52,831 2,934,013 43.06 74.39 Doctors Community Hospital 4,702,299 -1,244,303 3,457,996 8,036,051 -3,984,940 4,051,112 70.90 17.15 Dorchester General Hospital 3,327,627 -1,698,594 1,629,033 5,872,745 -1,191,701 4,681,044 76.48 187.35 Fort Washington medical Center 801,660 -405,102 396,557 1,384,387 -413,612 970,774 72.69 144.80 Franklin Square Hospital Center 45,021,159 -18,354,770 26,666,389 39,025,143 -21,957,696 17,067,447 -13.32 -36.00 Frederick Memorial Hospital 16,242,542 -11,687,377 4,555,165 30,198,403 -15,730,558 14,467,845 85.92 217.61 Garrett County Memorial Hospital 3,800,143 674,411 4,474,553 2,237,587 -345,456 1,892,131 -41.12 -57.71 Good Samaritan Hospital 18,846,383 -14,306,761 4,539,622 26,578,377 -20,269,011 6,309,366 41.03 38.98 Greater Baltimore Medical Center 27,691,014 -12,976,829 14,714,185 34,384,108 -15,652,447 18,731,661 24.17 27.30 Harbor Hospital Center 10,112,345 -3,850,528 6,261,817 12,583,896 -4,927,932 7,655,964 24.44 22.26 Harford Memorial Hospital 5,545,455 -2,250,355 3,295,100 3,498,273 -1,772,684 1,725,589 -36.92 -47.63 Holy Cross Hospital 31,605,101 -9,619,518 21,985,583 38,660,100 -12,325,300 26,334,800 22.32 19.78 Howard County General Hospital 9,460,229 -7,492,625 1,967,604 13,813,145 -8,461,763 5,351,382 46.01 171.97 James Lawrence Kernan Hospital 903,964 -1,037,884 -133,920 1,579,606 -249,229 1,330,378 74.74 1093.41 Johns Hopkins Bayview Medical Center 10,271,332 -9,350,932 920,400 16,686,571 -11,919,771 4,766,800 62.46 417.91 Johns Hopkins Hospital 67,456,691 -7,789,768 59,666,923 62,816,319 -4,660,064 58,156,255 -6.88 -2.53 Laurel Regional Hospital -57,471 -5,518,125 -5,575,596 -2,325,411 -5,357,789 -7,683,200 -3946.23 -37.80 Maryland General Hospital 17,495,713 -14,569,076 2,926,637 18,489,775 -14,222,636 4,267,138 5.68 45.80 McCready Hospital 2,973,812 -1,633,747 1,340,065 1,067,343 -1,599,563 -532,220 -64.11 -139.72 Memorial Hospital at Easton 6,032,927 -661,040 5,371,887 9,048,607 192,582 9,241,189 49.99 72.03 Mercy Medical Center 31,580,844 -6,348,884 25,231,960 20,663,459 -7,801,821 12,861,638 -34.57 -49.03 Meritus Medical Center 2,271,165 -2,437,465 -166,300 8,970,292 -1,836,392 7,133,900 294.96 4389.78 Montgomery General Hospital 9,773,235 -5,437,076 4,336,159 17,350,936 -8,913,309 8,437,627 77.54 94.59 Northwest Hospital Center 17,886,067 -8,306,686 9,579,381 18,903,134 -7,814,666 11,088,468 5.69 15.75

CHANGE IN TOTAL OPERATING PROFIT/LOSS : EXHIBIT VI-a 22 REGULATED & UNREGULATED OPERATIONS Listed by Alphabetical Order
_________________ 2010 _________________ ________________ 2011 _________________ Regulated Unregulated Total Regulated Unregulated Total % Change % Change Operating Operating Operating Operating Operating Operating Reg. Operating Total Net Hospital Profit/Loss Profit/Loss Profit/Loss Profit/Loss Profit/Loss Profit/Loss Profit/Loss Profit/Loss ƒƒƒƒƒƒƒƒƒƒƒƒƒƒƒƒƒƒƒƒƒƒƒƒƒƒƒƒƒƒƒƒƒƒƒƒƒƒƒƒƒƒƒƒƒƒƒƒƒƒƒƒƒƒƒƒƒƒƒƒƒƒƒƒƒƒƒƒƒƒƒƒƒƒƒƒƒƒƒƒƒƒƒƒƒƒƒƒƒƒƒƒƒƒƒƒƒƒƒƒƒƒƒƒƒƒƒƒƒƒƒƒƒƒƒƒƒƒƒƒƒƒƒƒƒƒƒƒƒƒƒƒƒƒƒƒƒƒƒƒƒƒƒƒƒƒƒƒƒƒƒ Peninsula Regional Hospital 29,058,847 -22,028,847 7,030,000 36,614,419 -19,081,519 17,532,900 26.00 149.40 Prince Georges' Hospital Center -3,824,386 -16,511,170 -20,335,556 3,180,393 -15,304,283 -12,123,890 183.16 40.38 Saint Agnes Hospital 34,277,885 -18,829,100 15,448,785 42,372,882 -23,235,008 19,137,874 23.62 23.88 Saint Josephs Medical Center 7,394,214 -25,110,379 -17,716,165 816,389 -25,274,138 -24,457,749 -88.96 -38.05 Saint Mary's Hospital 10,771,624 -6,487,365 4,284,259 14,105,743 -8,092,560 6,013,183 30.95 40.36 Shady Grove Adventist Hospital 25,155,742 -2,906,821 22,248,922 27,006,901 -2,534,103 24,472,797 7.36 10.00 Sinai Hospital of Baltimore 45,973,648 -36,534,648 9,439,000 62,659,770 -39,017,670 23,642,100 36.29 150.47 Southern Maryland Hospital Center 8,709,816 -5,439,111 3,270,705 10,459,521 -4,678,599 5,780,922 20.09 76.75 Suburban Hospital 9,660,770 -540,627 9,120,142 14,067,291 1,658,716 15,726,007 45.61 72.43 Union Hospital of Cecil County 3,588,900 -5,583,600 -1,994,700 11,852,200 -7,422,100 4,430,100 230.25 322.09 Union Memorial Hospital 29,401,895 -21,324,934 8,076,961 38,836,897 -25,889,376 12,947,521 32.09 60.30 University MIEMSS 3,944,858 -4,213,500 -268,642 17,772,047 -2,685,400 15,086,647 350.51 5715.90 University UMCC -18,735,351 6,146,700 -12,588,651 -10,309,650 -1,125,100 -11,434,750 44.97 9.17 University of Maryland Medical Center 90,181,648 -17,993,655 72,187,993 91,927,290 -16,712,977 75,214,313 1.94 4.19 Upper Chesapeake Medical Center 15,586,237 -4,750,187 10,836,050 26,568,653 -5,676,407 20,892,246 70.46 92.80 Washington Adventist Hospital 5,562,192 -1,504,684 4,057,509 3,438,917 -952,276 2,486,641 -38.17 -38.72 Western Maryland Regional M. C. 2,867,123 -7,877,323 -5,010,200 15,396,281 -12,566,381 2,829,900 436.99 156.48

CHANGE IN TOTAL OPERATING PROFIT/LOSS : EXHIBIT VI-b 23 REGULATED & UNREGULATED OPERATIONS Listed by Total Operating Profit
_________________ 2010 _________________ _________________ 2011 _________________ Regulated Unregulated Total Regulated Unregulated Total % Change % Change Operating Operating Operating Operating Operating Operating Reg. Operating Total Net Hospital Profit/Loss Profit/Loss Profit/Loss Profit/Loss Profit/Loss Profit/Loss Profit/Loss Profit/Loss ƒƒƒƒƒƒƒƒƒƒƒƒƒƒƒƒƒƒƒƒƒƒƒƒƒƒƒƒƒƒƒƒƒƒƒƒƒƒƒƒƒƒƒƒƒƒƒƒƒƒƒƒƒƒƒƒƒƒƒƒƒƒƒƒƒƒƒƒƒƒƒƒƒƒƒƒƒƒƒƒƒƒƒƒƒƒƒƒƒƒƒƒƒƒƒƒƒƒƒƒƒƒƒƒƒƒƒƒƒƒƒƒƒƒƒƒƒƒƒƒƒƒƒƒƒƒƒƒƒƒƒƒƒƒƒƒƒƒƒƒƒƒƒƒƒƒƒƒƒƒƒ All Acute Hospitals 714,949,953 -386,837,472 328,112,481 897,429,390 -433,067,249 464,362,141 25.52 41.53 University of Maryland Medical Center 90,181,648 -17,993,655 72,187,993 91,927,290 -16,712,977 75,214,313 1.94 4.19 Johns Hopkins Hospital 67,456,691 -7,789,768 59,666,923 62,816,319 -4,660,064 58,156,255 -6.88 -2.53 Holy Cross Hospital 31,605,101 -9,619,518 21,985,583 38,660,100 -12,325,300 26,334,800 22.32 19.78 Shady Grove Adventist Hospital 25,155,742 -2,906,821 22,248,922 27,006,901 -2,534,103 24,472,797 7.36 10.00 Sinai Hospital of Baltimore 45,973,648 -36,534,648 9,439,000 62,659,770 -39,017,670 23,642,100 36.29 150.47 Upper Chesapeake Medical Center 15,586,237 -4,750,187 10,836,050 26,568,653 -5,676,407 20,892,246 70.46 92.80 Anne Arundel Medical Center 22,777,855 -5,349,286 17,428,569 27,309,866 -7,295,678 20,014,188 19.90 14.84 Saint Agnes Hospital 34,277,885 -18,829,100 15,448,785 42,372,882 -23,235,008 19,137,874 23.62 23.88 Greater Baltimore Medical Center 27,691,014 -12,976,829 14,714,185 34,384,108 -15,652,447 18,731,661 24.17 27.30 Peninsula Regional Hospital 29,058,847 -22,028,847 7,030,000 36,614,419 -19,081,519 17,532,900 26.00 149.40 Franklin Square Hospital Center 45,021,159 -18,354,770 26,666,389 39,025,143 -21,957,696 17,067,447 -13.32 -36.00 Suburban Hospital 9,660,770 -540,627 9,120,142 14,067,291 1,658,716 15,726,007 45.61 72.43 University MIEMSS 3,944,858 -4,213,500 -268,642 17,772,047 -2,685,400 15,086,647 350.51 5715.90 Baltimore Washington Medical Center 7,693,337 -699,844 6,993,493 15,854,364 -950,265 14,904,099 106.08 113.11 Frederick Memorial Hospital 16,242,542 -11,687,377 4,555,165 30,198,403 -15,730,558 14,467,845 85.92 217.61 Union Memorial Hospital 29,401,895 -21,324,934 8,076,961 38,836,897 -25,889,376 12,947,521 32.09 60.30 Mercy Medical Center 31,580,844 -6,348,884 25,231,960 20,663,459 -7,801,821 12,861,638 -34.57 -49.03 Northwest Hospital Center 17,886,067 -8,306,686 9,579,381 18,903,134 -7,814,666 11,088,468 5.69 15.75 Carroll County General Hospital 9,970,747 -11,266,620 -1,295,873 21,451,372 -12,020,069 9,431,303 115.14 827.80 Memorial Hospital at Easton 6,032,927 -661,040 5,371,887 9,048,607 192,582 9,241,189 49.99 72.03 Montgomery General Hospital 9,773,235 -5,437,076 4,336,159 17,350,936 -8,913,309 8,437,627 77.54 94.59 Harbor Hospital Center 10,112,345 -3,850,528 6,261,817 12,583,896 -4,927,932 7,655,964 24.44 22.26 Meritus Medical Center 2,271,165 -2,437,465 -166,300 8,970,292 -1,836,392 7,133,900 294.96 4389.78 Good Samaritan Hospital 18,846,383 -14,306,761 4,539,622 26,578,377 -20,269,011 6,309,366 41.03 38.98 Saint Mary's Hospital 10,771,624 -6,487,365 4,284,259 14,105,743 -8,092,560 6,013,183 30.95 40.36 Southern Maryland Hospital Center 8,709,816 -5,439,111 3,270,705 10,459,521 -4,678,599 5,780,922 20.09 76.75 Howard County General Hospital 9,460,229 -7,492,625 1,967,604 13,813,145 -8,461,763 5,351,382 46.01 171.97 Johns Hopkins Bayview Medical Center 10,271,332 -9,350,932 920,400 16,686,571 -11,919,771 4,766,800 62.46 417.91 Dorchester General Hospital 3,327,627 -1,698,594 1,629,033 5,872,745 -1,191,701 4,681,044 76.48 187.35 Union Hospital of Cecil County 3,588,900 -5,583,600 -1,994,700 11,852,200 -7,422,100 4,430,100 230.25 322.09 Maryland General Hospital 17,495,713 -14,569,076 2,926,637 18,489,775 -14,222,636 4,267,138 5.68 45.80
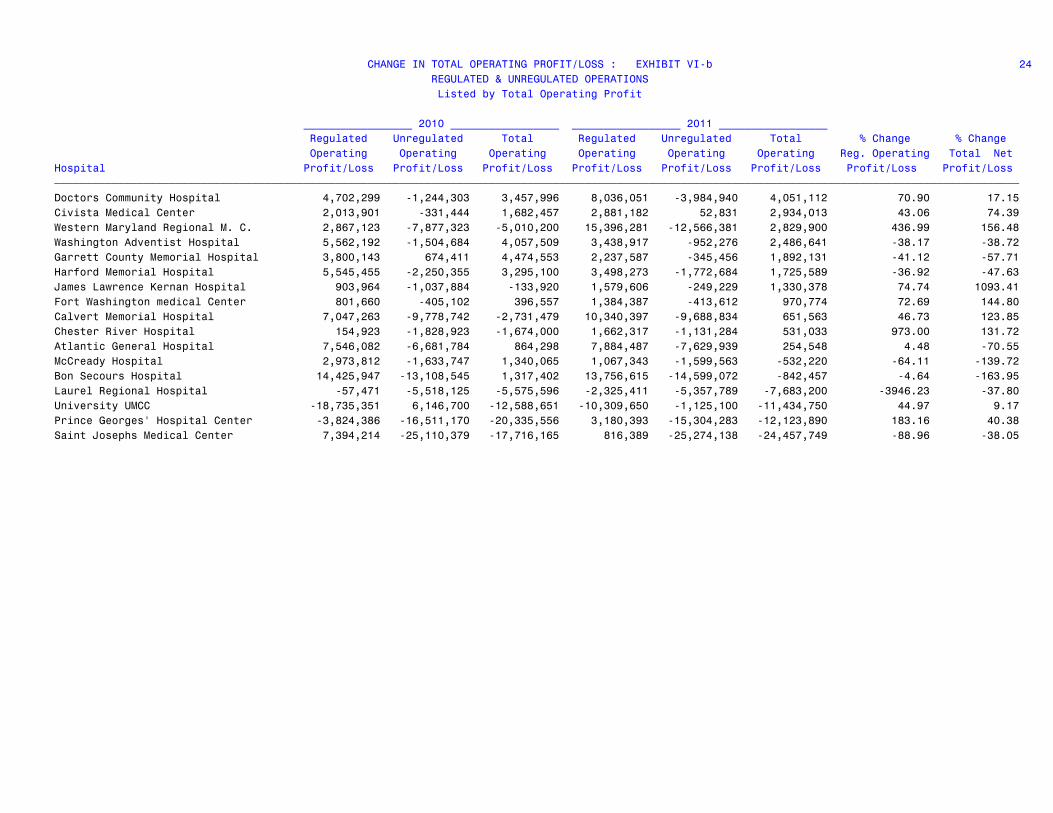
CHANGE IN TOTAL OPERATING PROFIT/LOSS : EXHIBIT VI-b 24 REGULATED & UNREGULATED OPERATIONS Listed by Total Operating Profit
_________________ 2010 _________________ _________________ 2011 _________________ Regulated Unregulated Total Regulated Unregulated Total % Change % Change Operating Operating Operating Operating Operating Operating Reg. Operating Total Net Hospital Profit/Loss Profit/Loss Profit/Loss Profit/Loss Profit/Loss Profit/Loss Profit/Loss Profit/Loss ƒƒƒƒƒƒƒƒƒƒƒƒƒƒƒƒƒƒƒƒƒƒƒƒƒƒƒƒƒƒƒƒƒƒƒƒƒƒƒƒƒƒƒƒƒƒƒƒƒƒƒƒƒƒƒƒƒƒƒƒƒƒƒƒƒƒƒƒƒƒƒƒƒƒƒƒƒƒƒƒƒƒƒƒƒƒƒƒƒƒƒƒƒƒƒƒƒƒƒƒƒƒƒƒƒƒƒƒƒƒƒƒƒƒƒƒƒƒƒƒƒƒƒƒƒƒƒƒƒƒƒƒƒƒƒƒƒƒƒƒƒƒƒƒƒƒƒƒƒƒƒ Doctors Community Hospital 4,702,299 -1,244,303 3,457,996 8,036,051 -3,984,940 4,051,112 70.90 17.15 Civista Medical Center 2,013,901 -331,444 1,682,457 2,881,182 52,831 2,934,013 43.06 74.39 Western Maryland Regional M. C. 2,867,123 -7,877,323 -5,010,200 15,396,281 -12,566,381 2,829,900 436.99 156.48 Washington Adventist Hospital 5,562,192 -1,504,684 4,057,509 3,438,917 -952,276 2,486,641 -38.17 -38.72 Garrett County Memorial Hospital 3,800,143 674,411 4,474,553 2,237,587 -345,456 1,892,131 -41.12 -57.71 Harford Memorial Hospital 5,545,455 -2,250,355 3,295,100 3,498,273 -1,772,684 1,725,589 -36.92 -47.63 James Lawrence Kernan Hospital 903,964 -1,037,884 -133,920 1,579,606 -249,229 1,330,378 74.74 1093.41 Fort Washington medical Center 801,660 -405,102 396,557 1,384,387 -413,612 970,774 72.69 144.80 Calvert Memorial Hospital 7,047,263 -9,778,742 -2,731,479 10,340,397 -9,688,834 651,563 46.73 123.85 Chester River Hospital 154,923 -1,828,923 -1,674,000 1,662,317 -1,131,284 531,033 973.00 131.72 Atlantic General Hospital 7,546,082 -6,681,784 864,298 7,884,487 -7,629,939 254,548 4.48 -70.55 McCready Hospital 2,973,812 -1,633,747 1,340,065 1,067,343 -1,599,563 -532,220 -64.11 -139.72 Bon Secours Hospital 14,425,947 -13,108,545 1,317,402 13,756,615 -14,599,072 -842,457 -4.64 -163.95 Laurel Regional Hospital -57,471 -5,518,125 -5,575,596 -2,325,411 -5,357,789 -7,683,200 -3946.23 -37.80 University UMCC -18,735,351 6,146,700 -12,588,651 -10,309,650 -1,125,100 -11,434,750 44.97 9.17 Prince Georges' Hospital Center -3,824,386 -16,511,170 -20,335,556 3,180,393 -15,304,283 -12,123,890 183.16 40.38 Saint Josephs Medical Center 7,394,214 -25,110,379 -17,716,165 816,389 -25,274,138 -24,457,749 -88.96 -38.05

TOTAL EXCESS PROFIT/LOSS : EXHIBIT VII-a 25 Listed by Alphabetical Order
___ 2010 ___ __ 2011 ___ % Change in Excess Excess Excess Hospital Profit/Loss Profit/Loss Profit/Loss ƒƒƒƒƒƒƒƒƒƒƒƒƒƒƒƒƒƒƒƒƒƒƒƒƒƒƒƒƒƒƒƒƒƒƒƒƒƒƒƒƒƒƒƒƒƒƒƒƒƒƒƒƒƒƒƒƒƒƒƒƒƒƒƒƒƒƒƒƒƒƒƒƒƒƒƒƒƒƒƒƒƒ All Acute Hospitals 481,146,540 846,604,006 75.96 Anne Arundel Medical Center 34,665,569 61,091,188 76.23 Atlantic General Hospital 2,126,542 1,787,444 -15.95 Baltimore Washington Medical Center 8,591,893 19,150,099 122.89 Bon Secours Hospital 1,865,586 229,596 -87.69 Calvert Memorial Hospital -2,265,778 1,257,809 155.51 Carroll County General Hospital -3,740,907 20,124,500 637.96 Chester River Hospital -1,028,000 2,092,927 303.59 Civista Medical Center 1,861,102 4,593,499 146.82 Doctors Community Hospital -3,510,447 17,199,910 589.96 Dorchester General Hospital 1,682,027 5,352,348 218.21 Fort Washington medical Center 402,052 975,034 142.51 Franklin Square Hospital Center 27,059,557 17,444,007 -35.53 Frederick Memorial Hospital 8,254,165 25,749,845 211.96 Garrett County Memorial Hospital 4,972,957 2,815,141 -43.39 Good Samaritan Hospital 7,105,822 7,145,524 0.56 Greater Baltimore Medical Center 14,723,222 24,935,745 69.36 Harbor Hospital Center 6,382,869 7,813,879 22.42 Harford Memorial Hospital 8,485,100 1,104,589 -86.98 Holy Cross Hospital 31,752,383 43,692,100 37.60 Howard County General Hospital -4,233,236 9,198,567 317.29 James Lawrence Kernan Hospital 1,175,080 3,262,378 177.63 Johns Hopkins Bayview Medical Center 2,345,000 6,197,000 164.26 Johns Hopkins Hospital 80,254,086 81,676,531 1.77 Laurel Regional Hospital 481,300 917,936 90.72 Maryland General Hospital 3,754,637 4,159,138 10.77 McCready Hospital 1,516,980 -415,966 -127.42 Memorial Hospital at Easton 9,911,967 19,019,010 91.88

TOTAL EXCESS PROFIT/LOSS : EXHIBIT VII-a 26 Listed by Alphabetical Order
___ 2010 ___ __ 2011 ___ % Change in Excess Excess Excess Hospital Profit/Loss Profit/Loss Profit/Loss ƒƒƒƒƒƒƒƒƒƒƒƒƒƒƒƒƒƒƒƒƒƒƒƒƒƒƒƒƒƒƒƒƒƒƒƒƒƒƒƒƒƒƒƒƒƒƒƒƒƒƒƒƒƒƒƒƒƒƒƒƒƒƒƒƒƒƒƒƒƒƒƒƒƒƒƒƒƒƒƒƒƒ Mercy Medical Center 31,246,825 35,419,445 13.35 Meritus Medical Center 3,017,000 12,310,700 308.04 Montgomery General Hospital 7,127,178 9,426,314 32.26 Northwest Hospital Center 16,901,598 23,851,636 41.12 Peninsula Regional Hospital 19,087,000 30,839,000 61.57 Prince Georges' Hospital Center -3,617,321 6,645,359 283.71 Saint Agnes Hospital 42,823,157 53,539,924 25.03 Saint Josephs Medical Center -12,273,157 -16,039,404 -30.69 Saint Mary's Hospital 2,407,725 7,451,003 209.46 Shady Grove Adventist Hospital 24,591,710 25,670,010 4.38 Sinai Hospital of Baltimore 19,063,000 44,208,100 131.91 Southern Maryland Hospital Center 3,392,618 5,808,522 71.21 Suburban Hospital 8,908,982 21,629,544 142.78 Union Hospital of Cecil County 3,199,100 11,011,200 244.20 Union Memorial Hospital 14,712,858 21,374,313 45.28 University MIEMSS 1,697,358 17,052,647 904.66 University UMCC -11,782,651 -11,295,992 4.13 University of Maryland Medical Center 48,906,993 136,966,013 180.05 Upper Chesapeake Medical Center 10,861,050 9,117,246 -16.06 Washington Adventist Hospital 4,543,188 2,058,647 -54.69 Western Maryland Regional M. C. 1,740,800 10,990,000 531.32 ============ ============ ===============

TOTAL EXCESS PROFIT/LOSS : EXHIBIT VII-b 27 Listed by Excess Profit/Loss
___ 2010 ___ __ 2011 ___ % Change in Excess Excess Excess Hospital Profit/Loss Profit/Loss Profit/Loss ƒƒƒƒƒƒƒƒƒƒƒƒƒƒƒƒƒƒƒƒƒƒƒƒƒƒƒƒƒƒƒƒƒƒƒƒƒƒƒƒƒƒƒƒƒƒƒƒƒƒƒƒƒƒƒƒƒƒƒƒƒƒƒƒƒƒƒƒƒƒƒƒƒƒƒƒƒƒƒƒƒƒ All Acute Hospitals 481,146,540 846,604,006 75.96 University of Maryland Medical Center 48,906,993 136,966,013 180.05 Johns Hopkins Hospital 80,254,086 81,676,531 1.77 Anne Arundel Medical Center 34,665,569 61,091,188 76.23 Saint Agnes Hospital 42,823,157 53,539,924 25.03 Sinai Hospital of Baltimore 19,063,000 44,208,100 131.91 Holy Cross Hospital 31,752,383 43,692,100 37.60 Mercy Medical Center 31,246,825 35,419,445 13.35 Peninsula Regional Hospital 19,087,000 30,839,000 61.57 Frederick Memorial Hospital 8,254,165 25,749,845 211.96 Shady Grove Adventist Hospital 24,591,710 25,670,010 4.38 Greater Baltimore Medical Center 14,723,222 24,935,745 69.36 Northwest Hospital Center 16,901,598 23,851,636 41.12 Suburban Hospital 8,908,982 21,629,544 142.78 Union Memorial Hospital 14,712,858 21,374,313 45.28 Carroll County General Hospital -3,740,907 20,124,500 637.96 Baltimore Washington Medical Center 8,591,893 19,150,099 122.89 Memorial Hospital at Easton 9,911,967 19,019,010 91.88 Franklin Square Hospital Center 27,059,557 17,444,007 -35.53 Doctors Community Hospital -3,510,447 17,199,910 589.96 University MIEMSS 1,697,358 17,052,647 904.66 Meritus Medical Center 3,017,000 12,310,700 308.04 Union Hospital of Cecil County 3,199,100 11,011,200 244.20 Western Maryland Regional M. C. 1,740,800 10,990,000 531.32 Montgomery General Hospital 7,127,178 9,426,314 32.26 Howard County General Hospital -4,233,236 9,198,567 317.29 Upper Chesapeake Medical Center 10,861,050 9,117,246 -16.06 Harbor Hospital Center 6,382,869 7,813,879 22.42 Saint Mary's Hospital 2,407,725 7,451,003 209.46

TOTAL EXCESS PROFIT/LOSS : EXHIBIT VII-b 28 Listed by Excess Profit/Loss
___ 2010 ___ __ 2011 ___ % Change in Excess Excess Excess Hospital Profit/Loss Profit/Loss Profit/Loss ƒƒƒƒƒƒƒƒƒƒƒƒƒƒƒƒƒƒƒƒƒƒƒƒƒƒƒƒƒƒƒƒƒƒƒƒƒƒƒƒƒƒƒƒƒƒƒƒƒƒƒƒƒƒƒƒƒƒƒƒƒƒƒƒƒƒƒƒƒƒƒƒƒƒƒƒƒƒƒƒƒƒ Good Samaritan Hospital 7,105,822 7,145,524 0.56 Prince Georges' Hospital Center -3,617,321 6,645,359 283.71 Johns Hopkins Bayview Medical Center 2,345,000 6,197,000 164.26 Southern Maryland Hospital Center 3,392,618 5,808,522 71.21 Dorchester General Hospital 1,682,027 5,352,348 218.21 Civista Medical Center 1,861,102 4,593,499 146.82 Maryland General Hospital 3,754,637 4,159,138 10.77 James Lawrence Kernan Hospital 1,175,080 3,262,378 177.63 Garrett County Memorial Hospital 4,972,957 2,815,141 -43.39 Chester River Hospital -1,028,000 2,092,927 303.59 Washington Adventist Hospital 4,543,188 2,058,647 -54.69 Atlantic General Hospital 2,126,542 1,787,444 -15.95 Calvert Memorial Hospital -2,265,778 1,257,809 155.51 Harford Memorial Hospital 8,485,100 1,104,589 -86.98 Fort Washington medical Center 402,052 975,034 142.51 Laurel Regional Hospital 481,300 917,936 90.72 Bon Secours Hospital 1,865,586 229,596 -87.69 McCready Hospital 1,516,980 -415,966 -127.42 University UMCC -11,782,651 -11,295,992 4.13 Saint Josephs Medical Center -12,273,157 -16,039,404 -30.69 ============ ============ ===============