Embed Size (px)
Citation preview

1
November 19, 2015
Company Name: JAPAN POST INSURANCE Co., Ltd.
Representative: Masami Ishii, Director and President, CEO, Representative Executive Officer
Stock exchange listing: Tokyo Stock Exchange (Code Number: 7181)
Disclosure of European Embedded Value as of September 30, 2015
Japan Post Insurance Co., Ltd. (“Japan Post Insurance”, Director and President, CEO Masami Ishii) is disclosing its European Embedded Value (“EEV”) results calculated on the basis of the European Embedded Value Principles (“EEV Principles”) as of September 30, 2015 in order to provide additional information as to the current financial position of Japan Post Insurance.
UNOFFICIAL TRANSLATION Although the Company pays close attention to provide English translation of the information disclosed in
Japanese, the Japanese original prevails over its English translation in the case of any discrepancy.
2
Contents 1. Outline of EEV............................................................................................................................... 3
(1) Embedded Value (“EV”) ......................................................................................... 3
(2) European Embedded Value (“EEV”) ..................................................................... 3
(3) EEV Approach ....................................................................................................... 3
2. Postal Life Insurance Policies ....................................................................................................... 43. EEV Results ................................................................................................................................... 5
(1) Adjusted Net Worth (“ANW”) ................................................................................ 5
(2) Value of In-Force Covered Business (“VIF”) ......................................................... 6
(3) Value of New Business .......................................................................................... 7
4. Movement Analysis ....................................................................................................................... 85. Sensitivities ................................................................................................................................... 106. Notes on the Use of Results ......................................................................................................... 12Appendix A: EEV Methodology ........................................................................................................ 13Appendix B: Main EEV Assumptions ............................................................................................... 16Appendix C: Third Party Opinion ..................................................................................................... 24Glossary ................................................................................................................................................ 25
3
1. Outline of EEV (1) Embedded Value (“EV”) EV provides an estimate of the value of future profits distributable to shareholders from the assets and liabilities of the covered business, excluding any value of new business that is expected to be sold in the future. This value is the sum of the adjusted net worth (“ANW”) and the value of in-force covered business (“VIF”).
The ANW represents the market value of net assets attributed to shareholders and is the sum of the required capital and the free surplus. The VIF is defined as the present value at the valuation date of the expected future profits distributable to shareholders from the in-force covered business, including a deduction for the cost of holding the required capital.
The profit pattern of life insurance products is typically that a loss arises at the time of issue, due to acquisition costs, followed by profits arising over the remainder of the term of the business. The profits over the remaining term of the business are typically expected to more than offset the initial losses which arose due to acquisition costs. While profits under the current accounting practices only represents the profit or loss for a single accounting period, the EV includes the present value of future profits from the in-force business. Therefore we consider that the EV is a useful indicator which provides financial information supplementary to the statutory accounting statements.
(2) European Embedded Value (“EEV”) The EEV Principles and Guidance were published in May 2004 by the CFO Forum, a group representing Chief Financial Officers of major European insurance companies, in order to improve consistency and transparency in EV reporting. In addition, the CFO Forum issued supplementary guidance regarding disclosures and sensitivities in October 2005.
(3) EEV Approach Japan Post Insurance has adopted a market-consistent approach, in which the cash flows arising from assets and liabilities are valued consistently with similar traded market instruments.
Considering disclosure circumstances in Europe and Japan, Japan Post Insurance’s management discloses Japan Post Insurance’s EV in accordance with the EEV Principles using a market-consistent approach.
4
2. Postal Life Insurance Policies Japan Post Insurance was established in September 2006, and commenced operations in October 2007, on the basis of the Postal Service Privatization Act of October 2005. Pursuant to the Postal Service Privatization Act, insurance policies held by Japan Post on September 30, 2007 (“Postal Life Insurance policies”) were taken over by the Management Organization for Postal Savings and Postal Life Insurance (“Management Organization”). The Management Organization ceded 100% of its insurance policies to Japan Post Insurance via a reinsurance agreement.
Japan Post Insurance manages the Postal Life Insurance policies ceded from the Management Organization as a block, separate from other policies. In addition, the contingency reserve and reserve for price fluctuations related to the Postal Life Insurance policies are managed separately. An amount equal to 80% of the profits arising from these policies (including profits arising from the release of the contingency reserve and reserve for price fluctuations, and excluding guaranteed policyholder dividend payments and total income taxes), as well as the fixed amount of guaranteed policyholder dividends, is used to determine the reinsurance dividend paid to the Management Organization. The EEV calculations take into consideration the profits net of this reinsurance dividend.
As the profits arising from the release of the contingency reserve and reserve for price fluctuations related to the Postal Life Insurance policies form a part of the reinsurance dividend paid to the Management Organization, the contingency reserve and reserve for price fluctuations related to these policies are included in the VIF, rather than the ANW, as it is assumed that these reserves will be released in the future. Assets supporting the Postal Life Insurance policies are valued on a book value basis for the purposes of determining distributable earnings (compliant with the EEV Principles Guidance 10.10).
5
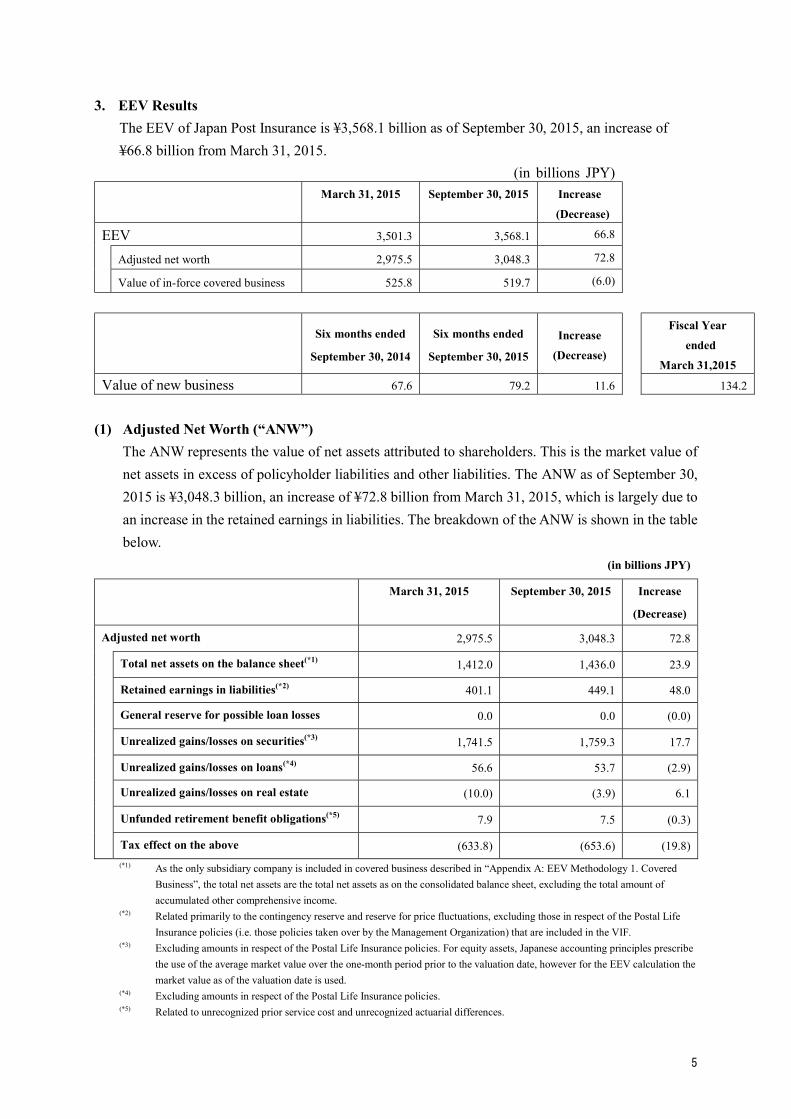
3. EEV Results The EEV of Japan Post Insurance is ¥3,568.1 billion as of September 30, 2015, an increase of ¥66.8 billion from March 31, 2015.
(in billions JPY)March 31, 2015 September 30, 2015 Increase
(Decrease)
EEV 3,501.3 3,568.1 66.8
Adjusted net worth 2,975.5 3,048.3 72.8
Value of in-force covered business 525.8 519.7 (6.0)
Six months ended
September 30, 2014
Six months ended
September 30, 2015
Increase
(Decrease)
Fiscal Year
ended
March 31,2015
Value of new business 67.6 79.2 11.6 134.2
(1) Adjusted Net Worth (“ANW”) The ANW represents the value of net assets attributed to shareholders. This is the market value of net assets in excess of policyholder liabilities and other liabilities. The ANW as of September 30, 2015 is ¥3,048.3 billion, an increase of ¥72.8 billion from March 31, 2015, which is largely due to an increase in the retained earnings in liabilities. The breakdown of the ANW is shown in the table below.
(in billions JPY)
March 31, 2015 September 30, 2015 Increase
(Decrease)
Adjusted net worth 2,975.5 3,048.3 72.8
Total net assets on the balance sheet(*1) 1,412.0 1,436.0 23.9
Retained earnings in liabilities(*2) 401.1 449.1 48.0
General reserve for possible loan losses 0.0 0.0 (0.0)
Unrealized gains/losses on securities(*3) 1,741.5 1,759.3 17.7
Unrealized gains/losses on loans(*4) 56.6 53.7 (2.9)
Unrealized gains/losses on real estate (10.0) (3.9) 6.1
Unfunded retirement benefit obligations(*5) 7.9 7.5 (0.3)
Tax effect on the above (633.8) (653.6) (19.8)(*1) As the only subsidiary company is included in covered business described in “Appendix A: EEV Methodology 1. Covered
Business”, the total net assets are the total net assets as on the consolidated balance sheet, excluding the total amount of accumulated other comprehensive income.
(*2) Related primarily to the contingency reserve and reserve for price fluctuations, excluding those in respect of the Postal Life Insurance policies (i.e. those policies taken over by the Management Organization) that are included in the VIF.
(*3) Excluding amounts in respect of the Postal Life Insurance policies. For equity assets, Japanese accounting principles prescribe the use of the average market value over the one-month period prior to the valuation date, however for the EEV calculation the market value as of the valuation date is used.
(*4) Excluding amounts in respect of the Postal Life Insurance policies. (*5) Related to unrecognized prior service cost and unrecognized actuarial differences.
6
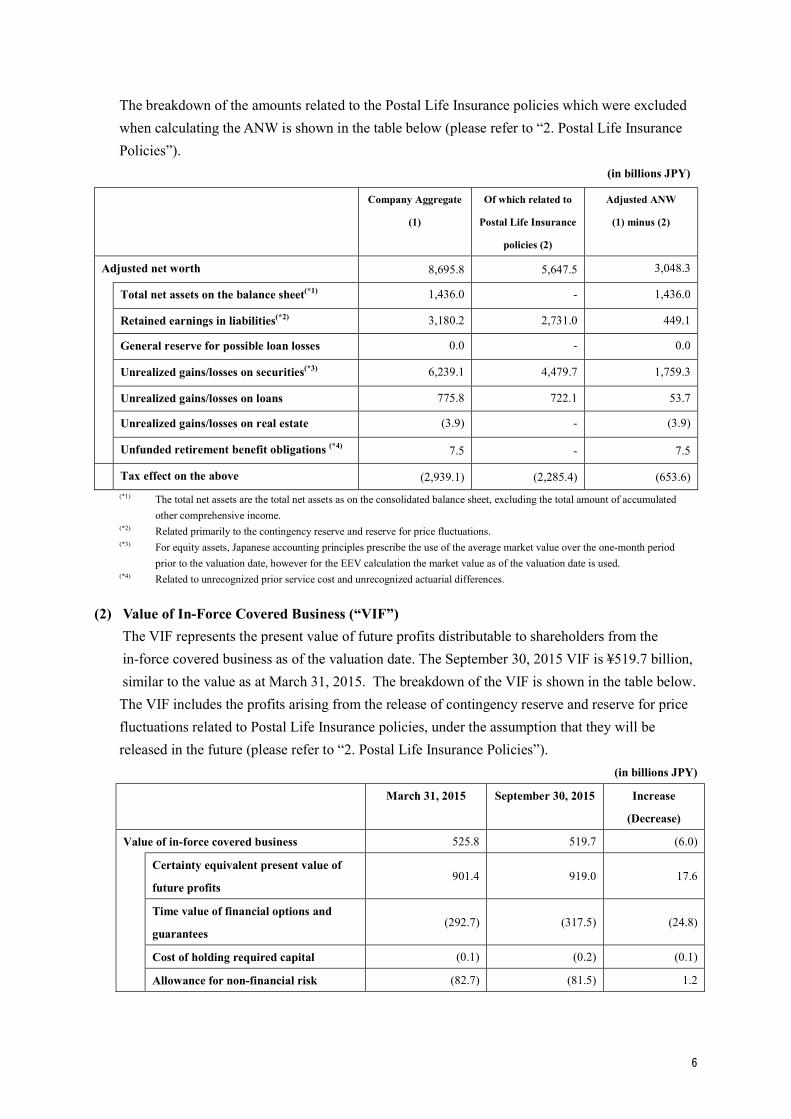
The breakdown of the amounts related to the Postal Life Insurance policies which were excluded when calculating the ANW is shown in the table below (please refer to “2. Postal Life Insurance Policies”).
(in billions JPY)
Company Aggregate
(1)
Of which related to
Postal Life Insurance
policies (2)
Adjusted ANW
(1) minus (2)
Adjusted net worth 8,695.8 5,647.5 3,048.3
Total net assets on the balance sheet(*1) 1,436.0 - 1,436.0
Retained earnings in liabilities(*2) 3,180.2 2,731.0 449.1
General reserve for possible loan losses 0.0 - 0.0
Unrealized gains/losses on securities(*3) 6,239.1 4,479.7 1,759.3
Unrealized gains/losses on loans 775.8 722.1 53.7
Unrealized gains/losses on real estate (3.9) - (3.9)
Unfunded retirement benefit obligations (*4) 7.5 - 7.5
Tax effect on the above (2,939.1) (2,285.4) (653.6)(*1) The total net assets are the total net assets as on the consolidated balance sheet, excluding the total amount of accumulated
other comprehensive income. (*2) Related primarily to the contingency reserve and reserve for price fluctuations. (*3) For equity assets, Japanese accounting principles prescribe the use of the average market value over the one-month period
prior to the valuation date, however for the EEV calculation the market value as of the valuation date is used. (*4) Related to unrecognized prior service cost and unrecognized actuarial differences.
(2) Value of In-Force Covered Business (“VIF”) The VIF represents the present value of future profits distributable to shareholders from the in-force covered business as of the valuation date. The September 30, 2015 VIF is ¥519.7 billion, similar to the value as at March 31, 2015. The breakdown of the VIF is shown in the table below. The VIF includes the profits arising from the release of contingency reserve and reserve for price fluctuations related to Postal Life Insurance policies, under the assumption that they will be released in the future (please refer to “2. Postal Life Insurance Policies”). (in billions JPY)
March 31, 2015 September 30, 2015 Increase
(Decrease)
Value of in-force covered business 525.8 519.7 (6.0)
Certainty equivalent present value of
future profits 901.4 919.0 17.6
Time value of financial options and
guarantees (292.7) (317.5) (24.8)
Cost of holding required capital (0.1) (0.2) (0.1)
Allowance for non-financial risk (82.7) (81.5) 1.2
7
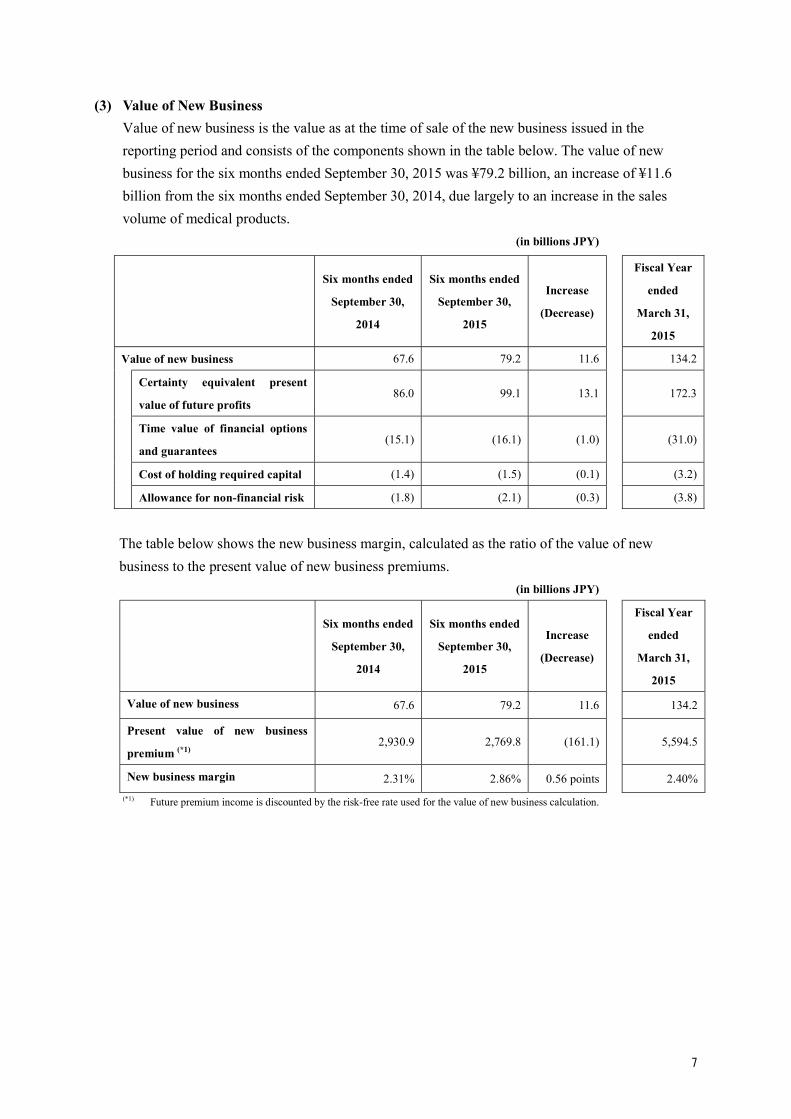
(3) Value of New Business Value of new business is the value as at the time of sale of the new business issued in the reporting period and consists of the components shown in the table below. The value of new business for the six months ended September 30, 2015 was ¥79.2 billion, an increase of ¥11.6 billion from the six months ended September 30, 2014, due largely to an increase in the sales volume of medical products. (in billions JPY)
Six months ended
September 30,
2014
Six months ended
September 30,
2015
Increase
(Decrease)
Fiscal Year
ended
March 31,
2015
Value of new business 67.6 79.2 11.6 134.2
Certainty equivalent present
value of future profits 86.0 99.1 13.1 172.3
Time value of financial options
and guarantees (15.1) (16.1) (1.0) (31.0)
Cost of holding required capital (1.4) (1.5) (0.1) (3.2)
Allowance for non-financial risk (1.8) (2.1) (0.3) (3.8)
The table below shows the new business margin, calculated as the ratio of the value of new business to the present value of new business premiums.
(in billions JPY)
Six months ended
September 30,
2014
Six months ended
September 30,
2015
Increase
(Decrease)
Fiscal Year
ended
March 31,
2015
Value of new business 67.6 79.2 11.6 134.2
Present value of new business
premium (*1)2,930.9 2,769.8 (161.1) 5,594.5
New business margin 2.31% 2.86% 0.56 points 2.40%(*1) Future premium income is discounted by the risk-free rate used for the value of new business calculation.
8
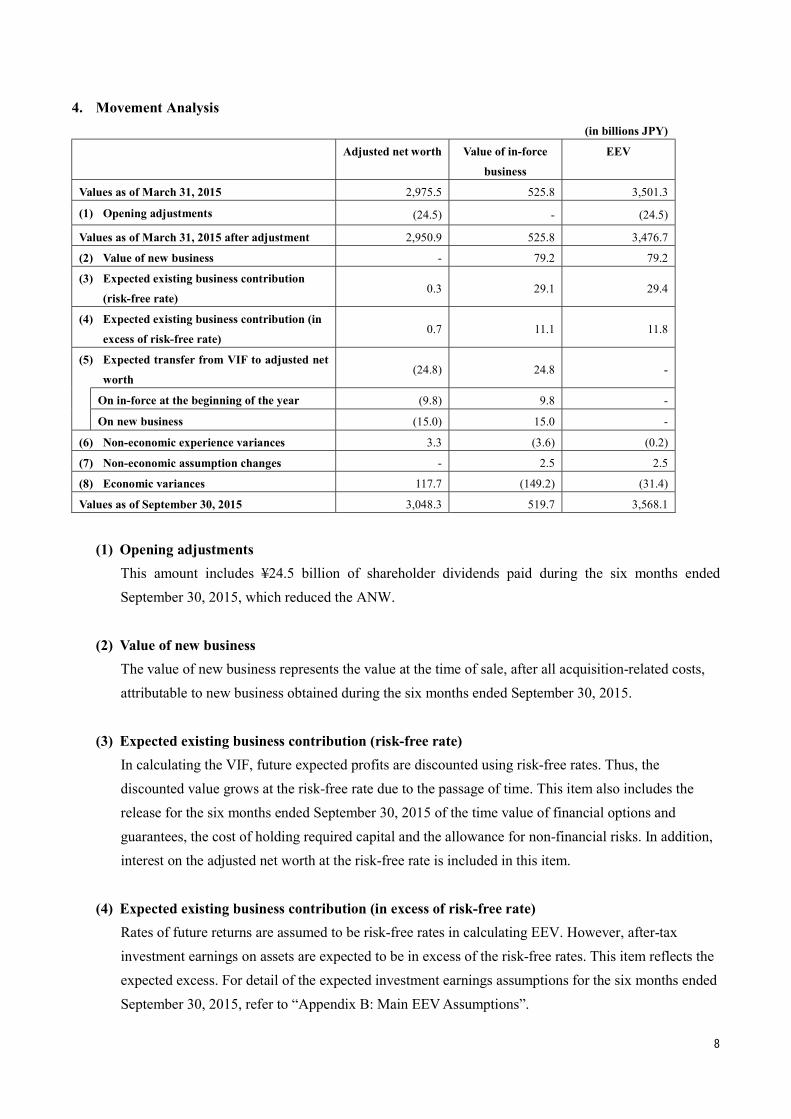
4. Movement Analysis (in billions JPY)
Adjusted net worth Value of in-force
business
EEV
Values as of March 31, 2015 2,975.5 525.8 3,501.3
(1) Opening adjustments (24.5) - (24.5)
Values as of March 31, 2015 after adjustment 2,950.9 525.8 3,476.7
(2) Value of new business - 79.2 79.2
(3) Expected existing business contribution
(risk-free rate) 0.3 29.1 29.4
(4) Expected existing business contribution (in
excess of risk-free rate) 0.7 11.1 11.8
(5) Expected transfer from VIF to adjusted net
worth (24.8) 24.8 -
On in-force at the beginning of the year (9.8) 9.8 -
On new business (15.0) 15.0 -
(6) Non-economic experience variances 3.3 (3.6) (0.2)
(7) Non-economic assumption changes - 2.5 2.5
(8) Economic variances 117.7 (149.2) (31.4)
Values as of September 30, 2015 3,048.3 519.7 3,568.1
(1) Opening adjustments This amount includes ¥24.5 billion of shareholder dividends paid during the six months ended September 30, 2015, which reduced the ANW.
(2) Value of new business The value of new business represents the value at the time of sale, after all acquisition-related costs, attributable to new business obtained during the six months ended September 30, 2015.
(3) Expected existing business contribution (risk-free rate) In calculating the VIF, future expected profits are discounted using risk-free rates. Thus, the discounted value grows at the risk-free rate due to the passage of time. This item also includes the release for the six months ended September 30, 2015 of the time value of financial options and guarantees, the cost of holding required capital and the allowance for non-financial risks. In addition, interest on the adjusted net worth at the risk-free rate is included in this item.
(4) Expected existing business contribution (in excess of risk-free rate) Rates of future returns are assumed to be risk-free rates in calculating EEV. However, after-tax investment earnings on assets are expected to be in excess of the risk-free rates. This item reflects the expected excess. For detail of the expected investment earnings assumptions for the six months ended September 30, 2015, refer to “Appendix B: Main EEV Assumptions”.
9
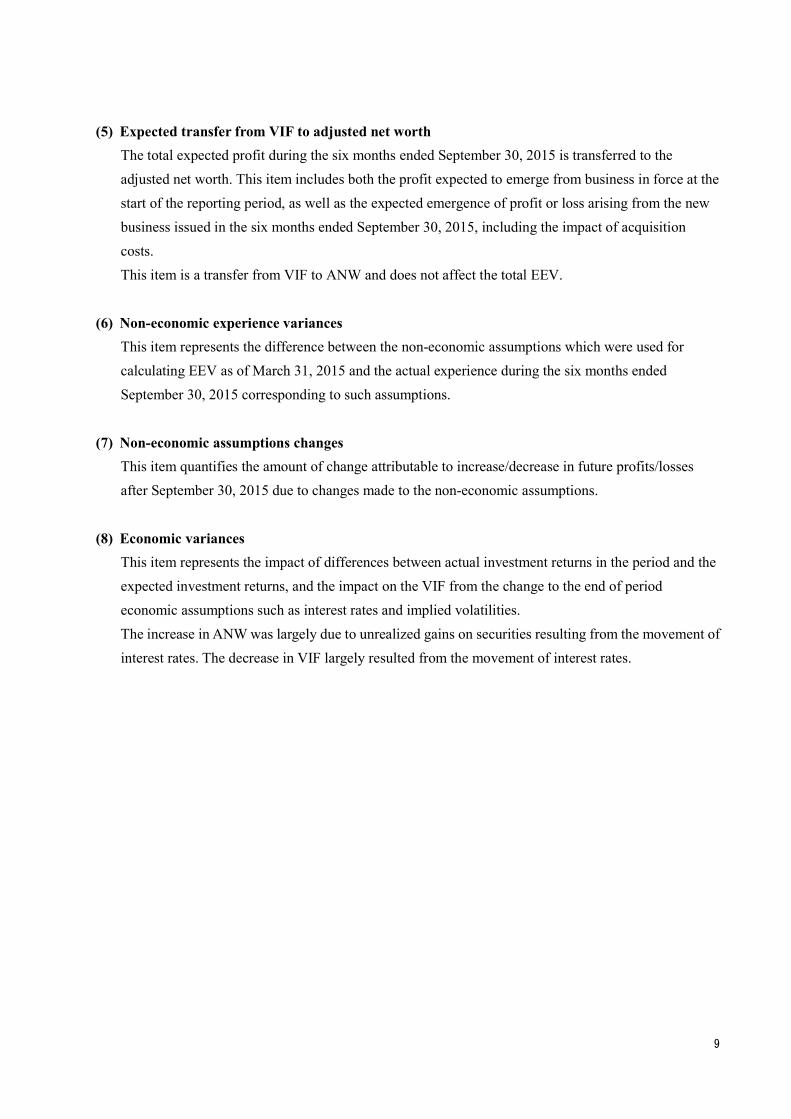
(5) Expected transfer from VIF to adjusted net worth The total expected profit during the six months ended September 30, 2015 is transferred to the adjusted net worth. This item includes both the profit expected to emerge from business in force at the start of the reporting period, as well as the expected emergence of profit or loss arising from the new business issued in the six months ended September 30, 2015, including the impact of acquisition costs. This item is a transfer from VIF to ANW and does not affect the total EEV.
(6) Non-economic experience variances This item represents the difference between the non-economic assumptions which were used for calculating EEV as of March 31, 2015 and the actual experience during the six months ended September 30, 2015 corresponding to such assumptions.
(7) Non-economic assumptions changes This item quantifies the amount of change attributable to increase/decrease in future profits/losses after September 30, 2015 due to changes made to the non-economic assumptions.
(8) Economic variances This item represents the impact of differences between actual investment returns in the period and the expected investment returns, and the impact on the VIF from the change to the end of period economic assumptions such as interest rates and implied volatilities. The increase in ANW was largely due to unrealized gains on securities resulting from the movement of interest rates. The decrease in VIF largely resulted from the movement of interest rates.
10
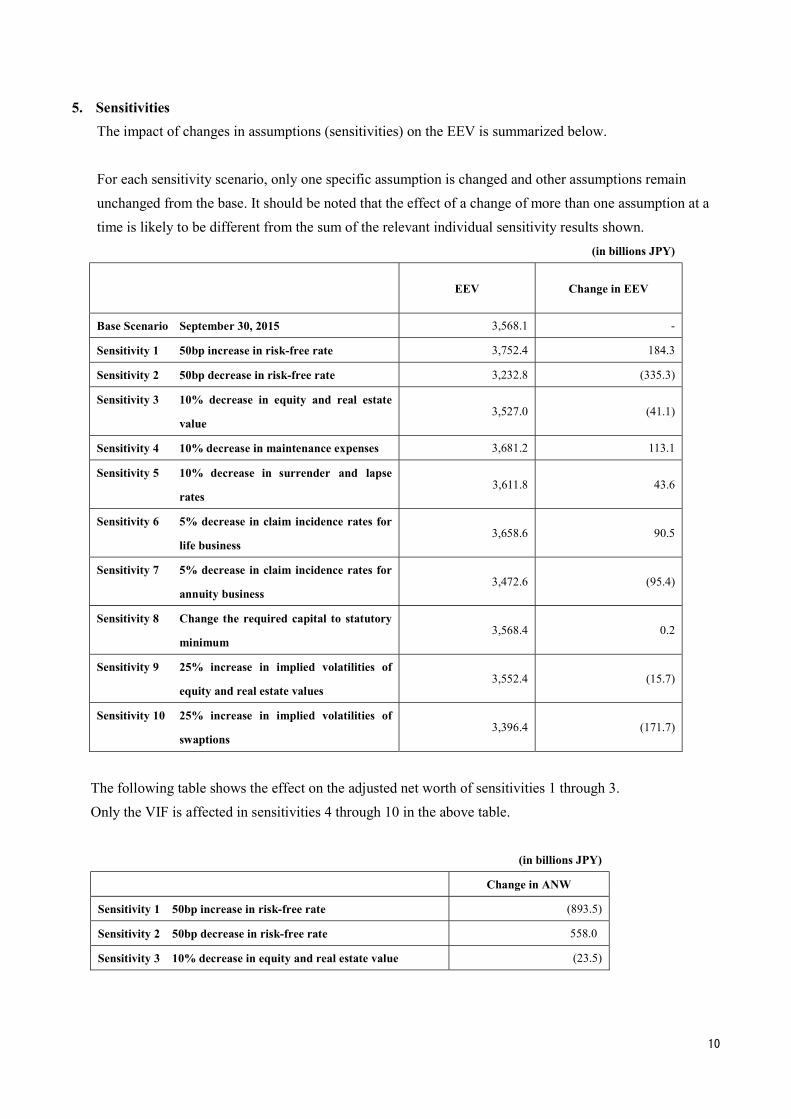
5. SensitivitiesThe impact of changes in assumptions (sensitivities) on the EEV is summarized below.
For each sensitivity scenario, only one specific assumption is changed and other assumptions remain unchanged from the base. It should be noted that the effect of a change of more than one assumption at a time is likely to be different from the sum of the relevant individual sensitivity results shown.
(in billions JPY)
EEV Change in EEV
Base Scenario September 30, 2015 3,568.1 -
Sensitivity 1 50bp increase in risk-free rate 3,752.4 184.3
Sensitivity 2 50bp decrease in risk-free rate 3,232.8 (335.3)
Sensitivity 3 10% decrease in equity and real estate
value 3,527.0 (41.1)
Sensitivity 4 10% decrease in maintenance expenses 3,681.2 113.1
Sensitivity 5 10% decrease in surrender and lapse
rates 3,611.8 43.6
Sensitivity 6 5% decrease in claim incidence rates for
life business 3,658.6 90.5
Sensitivity 7 5% decrease in claim incidence rates for
annuity business 3,472.6 (95.4)
Sensitivity 8 Change the required capital to statutory
minimum 3,568.4 0.2
Sensitivity 9 25% increase in implied volatilities of
equity and real estate values 3,552.4 (15.7)
Sensitivity 10 25% increase in implied volatilities of
swaptions 3,396.4 (171.7)
The following table shows the effect on the adjusted net worth of sensitivities 1 through 3. Only the VIF is affected in sensitivities 4 through 10 in the above table.
(in billions JPY)
Change in ANW
Sensitivity 1 50bp increase in risk-free rate (893.5)
Sensitivity 2 50bp decrease in risk-free rate 558.0
Sensitivity 3 10% decrease in equity and real estate value (23.5)
11
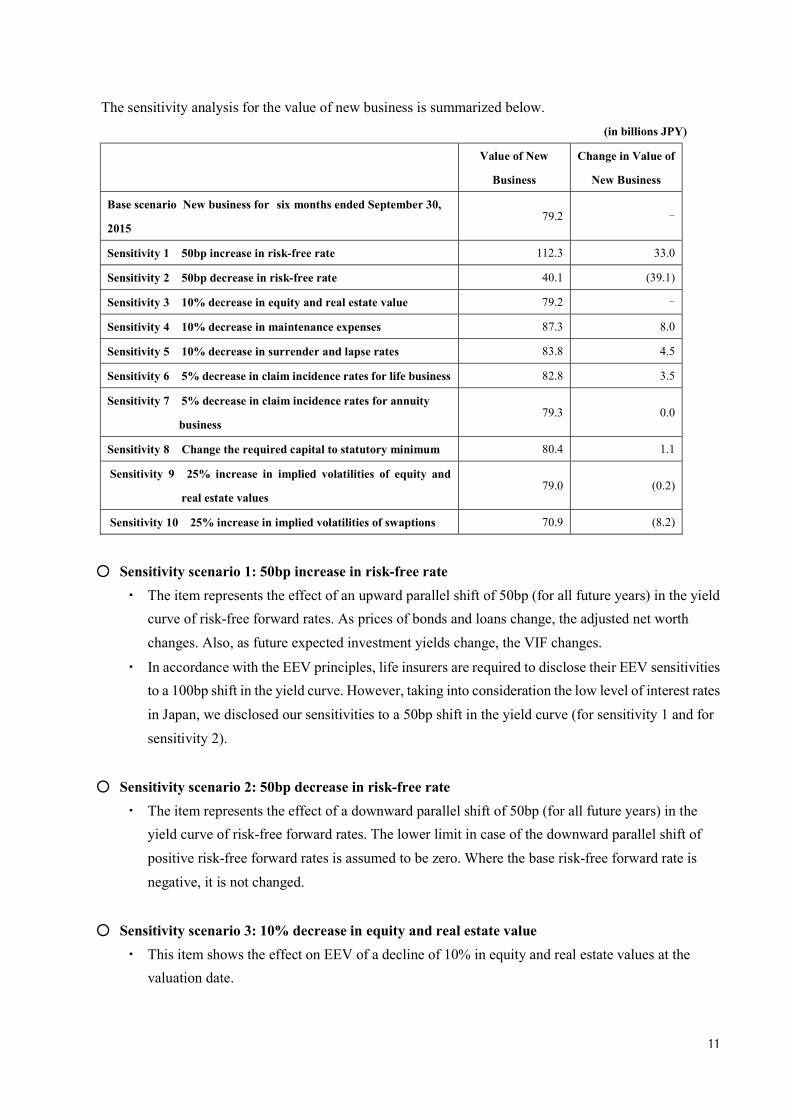
The sensitivity analysis for the value of new business is summarized below. (in billions JPY)
Value of New
Business
Change in Value of
New Business
Base scenario New business for six months ended September 30,
2015 79.2 -
Sensitivity 1 50bp increase in risk-free rate 112.3 33.0
Sensitivity 2 50bp decrease in risk-free rate 40.1 (39.1)
Sensitivity 3 10% decrease in equity and real estate value 79.2 -
Sensitivity 4 10% decrease in maintenance expenses 87.3 8.0
Sensitivity 5 10% decrease in surrender and lapse rates 83.8 4.5
Sensitivity 6 5% decrease in claim incidence rates for life business 82.8 3.5
Sensitivity 7 5% decrease in claim incidence rates for annuity
business79.3 0.0
Sensitivity 8 Change the required capital to statutory minimum 80.4 1.1
Sensitivity 9 25% increase in implied volatilities of equity and
real estate values79.0 (0.2)
Sensitivity 10 25% increase in implied volatilities of swaptions 70.9 (8.2)
○ Sensitivity scenario 1: 50bp increase in risk-free rate ・ The item represents the effect of an upward parallel shift of 50bp (for all future years) in the yield
curve of risk-free forward rates. As prices of bonds and loans change, the adjusted net worth changes. Also, as future expected investment yields change, the VIF changes.
・ In accordance with the EEV principles, life insurers are required to disclose their EEV sensitivities to a 100bp shift in the yield curve. However, taking into consideration the low level of interest rates in Japan, we disclosed our sensitivities to a 50bp shift in the yield curve (for sensitivity 1 and for sensitivity 2).
○ Sensitivity scenario 2: 50bp decrease in risk-free rate ・ The item represents the effect of a downward parallel shift of 50bp (for all future years) in the
yield curve of risk-free forward rates. The lower limit in case of the downward parallel shift of positive risk-free forward rates is assumed to be zero. Where the base risk-free forward rate is negative, it is not changed.
○ Sensitivity scenario 3: 10% decrease in equity and real estate value ・ This item shows the effect on EEV of a decline of 10% in equity and real estate values at the
valuation date.
12
○ Sensitivity scenario 4: 10% decrease in maintenance expenses ・ The item represents the effect of a decrease of 10% in maintenance expenses, i.e. the base rates are
multiplied by 90%.
○ Sensitivity scenario 5: 10% decrease in surrender and lapse rates ・ The item represents the effect of a decrease of 10% in surrender and lapse rates, i.e. the base rates
are multiplied by 90%.
○ Sensitivity scenario 6: 5% decrease in claim incidence rates for life business ・ The item represents the effect of a decrease of 5% in mortality and morbidity rates for life business,
i.e. the base rates are multiplied by 95%.
○ Sensitivity scenario 7: 5% decrease in claim incidence rates for annuity business ・ The item represents the effect of a decrease of 5% in mortality and morbidity rates for annuities
business, i.e. the base rates are multiplied by 95%.
○ Sensitivity scenario 8: Change required capital to statutory minimum ・ The item represents the effect of a change in the level of required capital to the statutory minimum
level in Japan, i.e. a 200% solvency margin ratio.
○ Sensitivity scenario 9: 25% increase in implied volatilities of equity and real estate ・ The item represents the effect on the time value of financial options and guarantees of an increase
of 25% in the implied volatilities of equity and real estate values options.
○ Sensitivity scenario 10: 25% increase in implied volatilities of swaptions ・ The item represents the effect on the time value of financial options and guarantees of an increase
of 25% in the base implied volatilities of swaptions.
6. Notes on the Use of Results The calculation of EEV results involves certain assumptions regarding the future that are subject to risk
and uncertainty, many of which are outside Japan Post Insurance’s control. Actual future results might differ materially from the assumptions used in the EEV calculation. Consequently, the inclusion of EEV results herein should not be regarded as a statement by Japan Post Insurance that the stream of future after-tax profits discounted to produce the EEV results will be achieved; the users are strongly advised to exercise caution.
13
Appendix A: EEV Methodology The methodology and assumptions adopted by Japan Post Insurance to calculate the EEV results as of September 30, 2015 are market-consistent and in accordance with the EEV Principles and Guidance issued by the European CFO Forum in May 2004.
1. Covered Business All of the life insurance business written through Japan Post Insurance and its subsidiaries is covered in the EEV calculations. Japan Post Insurance has only life insurance business. Although Japan Post Insurance is a member of the Japan Post group, the EEV in this document is calculated on a solo entity basis.
2. ANW The ANW is calculated by adjusting the total net assets on Japan Post Insurance’s balance sheet for the following:
・ Consistent with the EEV Principles, the ANW is calculated at market value. Items on the balance sheet which are not held at market value, such as bonds categorized as “Held to Maturity”, loans and real estate, are by principle taken at market value, and differences between the market value and the book value of these items have been added to the ANW on a post-tax basis. However, the amounts relating to Postal Life Insurance policies are not included in the ANW calculation (see “2. Postal Life Insurance Policies”).
・ Certain liabilities that can be considered effectively part of net assets are added on a post-tax basis to the ANW. In particular, the contingency reserve, reserve for price fluctuations, the unallocated portion of reserves for policyholder dividends and general reserves for possible loan losses related to the new policies that were issued after the establishment of Japan Post Insurance have been added to the ANW on a post-tax basis. However, the corresponding items for Postal Life Insurance policies are not included in the ANW calculation (see “2. Postal Life Insurance Policies”).
・ In relation to pension benefit obligations, unrecognized prior service cost and unrecognized actuarial differences are reflected in the ANW on a post-tax basis.
Free surplus is the amount of any ANW in excess of the amount of required capital.
3. VIF The VIF is calculated as the certainty equivalent present value of projected after-tax profits, less deductions for the time value of financial options and guarantees, the cost of holding required capital and an allowance for non-financial risks.
4. Certainty Equivalent Present Value of Future Profits The certainty equivalent present value of future profits is the present value of the future cash flows, calculated on a deterministic basis, using best estimate operating assumptions, and assuming that all assets
14
earn the risk-free rate and all cash flows are discounted at the risk-free rate. Future profits include the profits arising from the release of the contingency reserve and reserve for price fluctuations related to Postal Life Insurance policies, under the assumption that they will be released in the future. Furthermore, such profits are considered net of the reinsurance dividend paid to the Management Organization. When calculating future profits, the assets related to Postal Life Insurance policies are valued at book value (please refer to “2. Postal Life Insurance Policies”). The certainty equivalent approach is such that that future investment risk premiums (e.g., excess investment yield over the risk-free rate, expected from risk assets such as equities and corporate bonds) are not reflected in the EEV and the value of new business. It reflects the intrinsic value of financial options and guarantees (e.g., policyholder dividends), but not the time value of financial options and guarantees; this is calculated separately.
5. Time Value of Financial Options and Guarantees The time value of financial options and guarantees is calculated as the difference between the certainty equivalent present value of future profits using best estimate operating assumptions and the average of the present value of future after-tax profits calculated by stochastic methods where economic assumptions are consistent with current market prices for traded assets.
Elements of the kind described below have been taken into account in calculating the time value of financial options and guarantees:
・ Dividend Options for Participating Business For participating business, the amount of profit distributable to shareholders is asymmetric with respect to realized profits and losses. For example, when profits emerge, policyholders’ dividends are paid out and shareholders do not receive 100% of the profit. On the other hand, when losses arise, shareholders need to bear the cost of guarantees attached to participating policies. Policyholders’ dividends have been assumed as certain percentages of the profit, and future dividend amounts therefore vary according to the economic scenario.
・ Policyholder behavior Policyholders have a variety of options against Japan Post Insurance in responding to changes in economic conditions. In this valuation, the cost of changes in the surrender behavior in in response to the level of interest rates has been allowed for.
6. Cost of Holding Required Capital Life insurance companies are required to hold a certain amount of capital in addition to the statutory liabilities in order to maintain financial soundness. The cost of holding required capital is the cost incurred through the payment of taxes on the investment income of the assets backing the required capital and the investment expenses incurred for the management of the related assets. The EEV Principles define the minimum required capital to be equal to the statutory minimum capital
15
requirement and that required capital may include amounts required to meet internal objectives. In Japan, the statutory minimum is a 200% solvency margin ratio (the “Japanese Solvency Margin standard”), and Japan Post Insurance has assumed a level of required capital corresponding to a 600% solvency margin ratio.Under the Japanese Solvency Margin standard, policy reserves in excess of the full-term Zillmer reserve equivalent can be recognized as a margin item, with some limitation, and this has been reflected in the calculation of required capital. It should be noted that the contingency reserve and reserve for price fluctuations relating to the reinsured Postal Life Insurance policies are included in the VIF calculation and are also permitted to be recognized as solvency margin. As a result, the values of the required capital as of March 31, 2015 and as of September 30, 2015 were both zero. However, release of such reserves could lead to non-zero required capital in the future.
7. Allowance for Non-Financial Risk The EEV Principles state that “EV is the present value of shareholders’ interests in the earnings distributable from assets allocated to the covered business after sufficient allowance for the aggregate risks in the covered business.” The EEV Principles require the value to be calculated taking into account all risks. There are some non-financial risks for which the existing best estimate assumptions do not allow for the impact on the EEV of the full range of potential outcomes. These non-financial risks (e.g., operational risk, catastrophe risk) are taken into account via the allowance for non-financial risk. Also, tax must be paid when profits arise, while tax must be zero when losses occur in a reporting period. Even if losses arise, the losses on a tax basis can be carried forward to be offset by future profits. However, as losses can be carried forward for a limited period, there is risk that Japan Post Insurance will not be able to take full advantage of the tax benefits from losses carried forward. Japan Post Insurance estimated the allowance for non-financial risk with a simple model.
8. Value of New Business The value of new business for the six months ended September 30, 2015 is the value as at the time of sale of the new business issued. It has been calculated in a similar way as to the EEV as of September 30, 2015. The value of new business includes new business and additional riders. However the renewals of existing policies are excluded from the value of new business. The economic assumptions are as at June 30, 2015 and non-economic assumptions are the same as assumptions used to calculate the VIF.
16
Appendix B: Main EEV Assumptions 1. Economic Assumptions
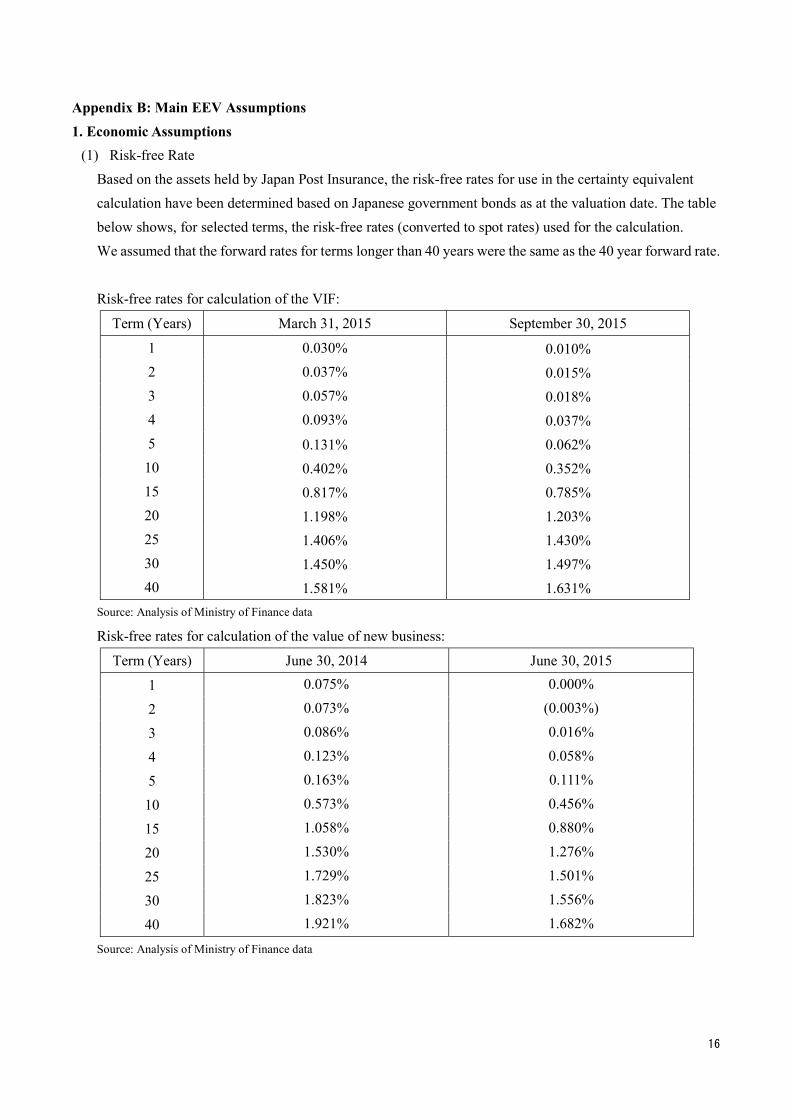
(1) Risk-free Rate Based on the assets held by Japan Post Insurance, the risk-free rates for use in the certainty equivalent calculation have been determined based on Japanese government bonds as at the valuation date. The table below shows, for selected terms, the risk-free rates (converted to spot rates) used for the calculation. We assumed that the forward rates for terms longer than 40 years were the same as the 40 year forward rate.
Risk-free rates for calculation of the VIF:
Term (Years) March 31, 2015 September 30, 2015
1 0.030% 0.010% 2 0.037% 0.015% 3 0.057% 0.018% 4 0.093% 0.037% 5 0.131% 0.062% 10 0.402% 0.352% 15 0.817% 0.785% 20 1.198% 1.203% 25 1.406% 1.430% 30 1.450% 1.497% 40 1.581% 1.631%
Source: Analysis of Ministry of Finance data
Risk-free rates for calculation of the value of new business:
Term (Years) June 30, 2014 June 30, 2015
1 0.075% 0.000%
2 0.073% (0.003%)
3 0.086% 0.016%
4 0.123% 0.058%
5 0.163% 0.111%
10 0.573% 0.456%
15 1.058% 0.880%
20 1.530% 1.276%
25 1.729% 1.501%
30 1.823% 1.556%
40 1.921% 1.682%
Source: Analysis of Ministry of Finance data
17
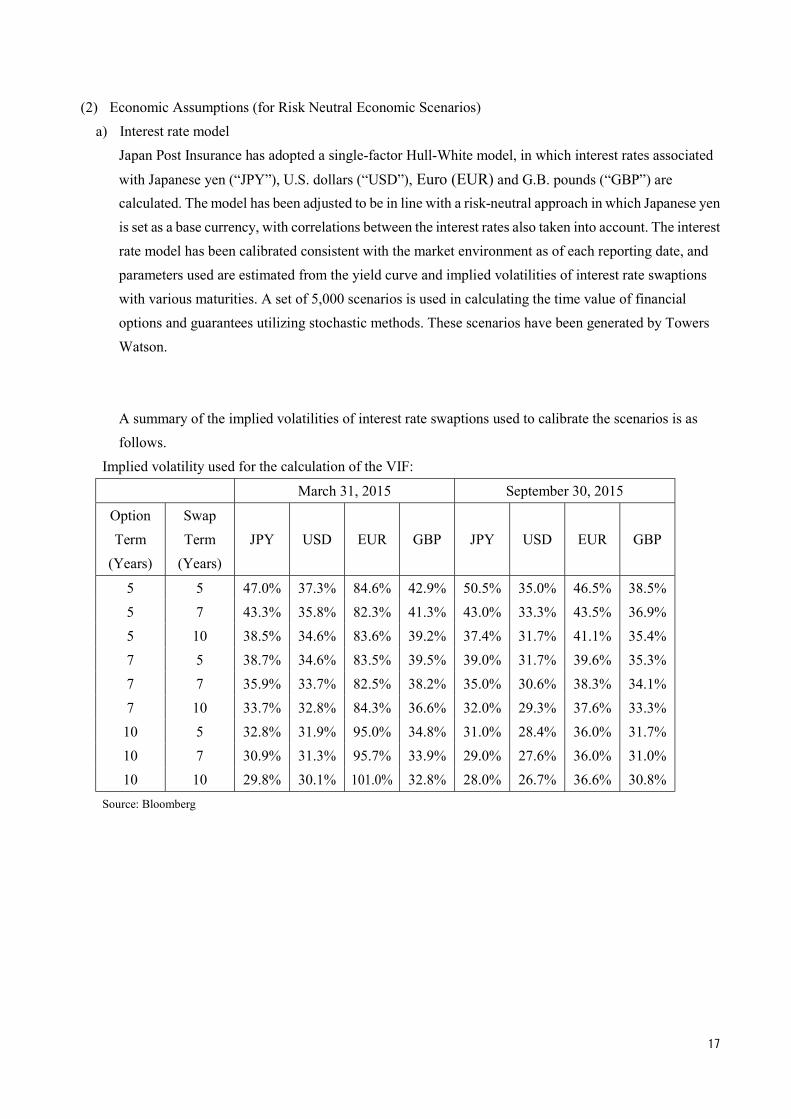
(2) Economic Assumptions (for Risk Neutral Economic Scenarios) a) Interest rate model
Japan Post Insurance has adopted a single-factor Hull-White model, in which interest rates associated
with Japanese yen (“JPY”), U.S. dollars (“USD”), Euro (EUR) and G.B. pounds (“GBP”) are calculated. The model has been adjusted to be in line with a risk-neutral approach in which Japanese yen is set as a base currency, with correlations between the interest rates also taken into account. The interest rate model has been calibrated consistent with the market environment as of each reporting date, and parameters used are estimated from the yield curve and implied volatilities of interest rate swaptions with various maturities. A set of 5,000 scenarios is used in calculating the time value of financial options and guarantees utilizing stochastic methods. These scenarios have been generated by Towers Watson.
A summary of the implied volatilities of interest rate swaptions used to calibrate the scenarios is as follows.
Implied volatility used for the calculation of the VIF:
March 31, 2015 September 30, 2015
Option Term
(Years)
Swap Term
(Years)JPY USD EUR GBP JPY USD EUR GBP
5 5 47.0% 37.3% 84.6% 42.9% 50.5% 35.0% 46.5% 38.5%5 7 43.3% 35.8% 82.3% 41.3% 43.0% 33.3% 43.5% 36.9%5 10 38.5% 34.6% 83.6% 39.2% 37.4% 31.7% 41.1% 35.4%7 5 38.7% 34.6% 83.5% 39.5% 39.0% 31.7% 39.6% 35.3%7 7 35.9% 33.7% 82.5% 38.2% 35.0% 30.6% 38.3% 34.1%7 10 33.7% 32.8% 84.3% 36.6% 32.0% 29.3% 37.6% 33.3%10 5 32.8% 31.9% 95.0% 34.8% 31.0% 28.4% 36.0% 31.7%10 7 30.9% 31.3% 95.7% 33.9% 29.0% 27.6% 36.0% 31.0%10 10 29.8% 30.1% 101.0% 32.8% 28.0% 26.7% 36.6% 30.8%
Source: Bloomberg
18
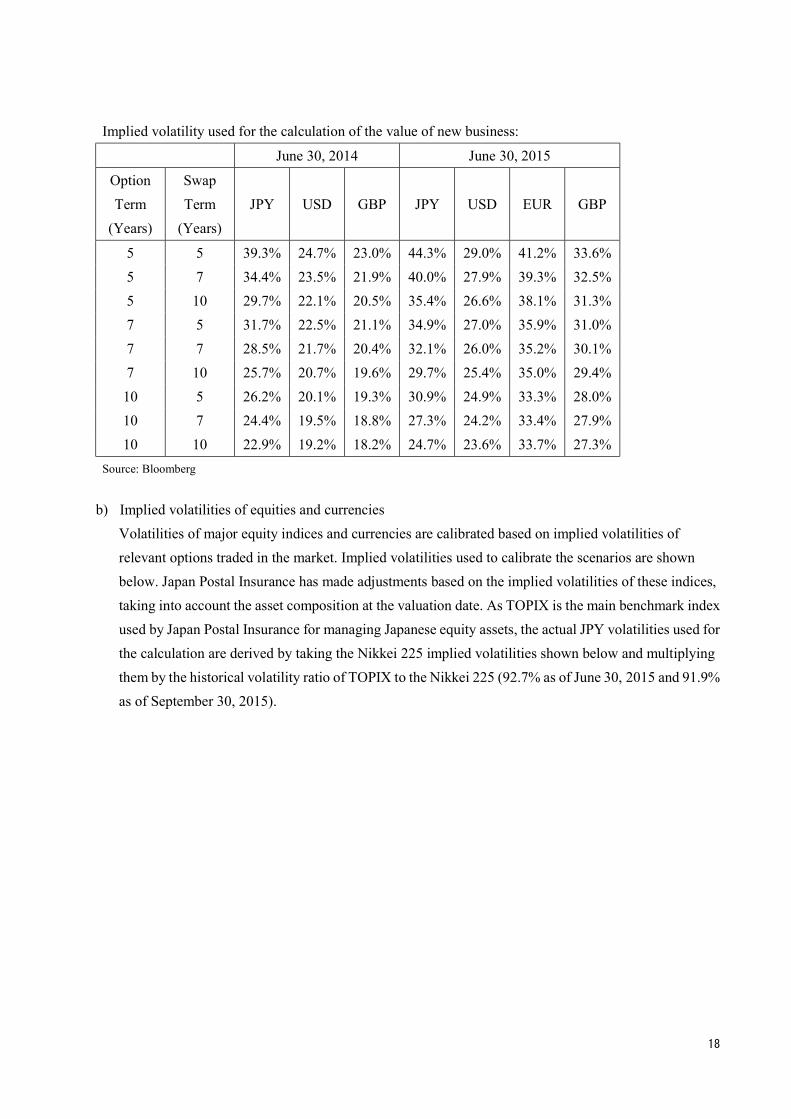
Implied volatility used for the calculation of the value of new business:
June 30, 2014 June 30, 2015
Option Term
(Years)
Swap Term
(Years)JPY USD GBP JPY USD EUR GBP
5 5 39.3% 24.7% 23.0% 44.3% 29.0% 41.2% 33.6%5 7 34.4% 23.5% 21.9% 40.0% 27.9% 39.3% 32.5%5 10 29.7% 22.1% 20.5% 35.4% 26.6% 38.1% 31.3%7 5 31.7% 22.5% 21.1% 34.9% 27.0% 35.9% 31.0%7 7 28.5% 21.7% 20.4% 32.1% 26.0% 35.2% 30.1%7 10 25.7% 20.7% 19.6% 29.7% 25.4% 35.0% 29.4%10 5 26.2% 20.1% 19.3% 30.9% 24.9% 33.3% 28.0%10 7 24.4% 19.5% 18.8% 27.3% 24.2% 33.4% 27.9%10 10 22.9% 19.2% 18.2% 24.7% 23.6% 33.7% 27.3%
Source: Bloomberg
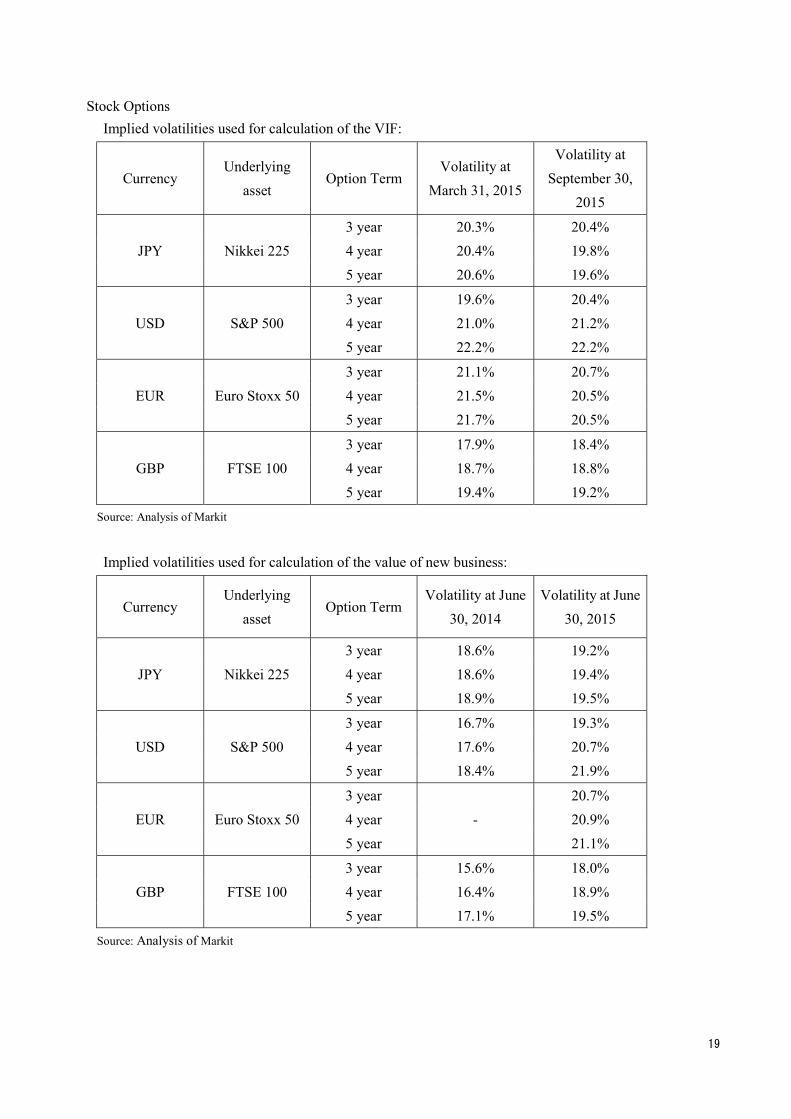
b) Implied volatilities of equities and currencies Volatilities of major equity indices and currencies are calibrated based on implied volatilities of relevant options traded in the market. Implied volatilities used to calibrate the scenarios are shown below. Japan Postal Insurance has made adjustments based on the implied volatilities of these indices, taking into account the asset composition at the valuation date. As TOPIX is the main benchmark index used by Japan Postal Insurance for managing Japanese equity assets, the actual JPY volatilities used for the calculation are derived by taking the Nikkei 225 implied volatilities shown below and multiplying them by the historical volatility ratio of TOPIX to the Nikkei 225 (92.7% as of June 30, 2015 and 91.9% as of September 30, 2015).
19
Stock Options Implied volatilities used for calculation of the VIF:
Currency Underlying
asset Option Term
Volatility at March 31, 2015
Volatility at September 30,
2015
JPY Nikkei 225 3 year 20.3% 20.4% 4 year 20.4% 19.8% 5 year 20.6% 19.6%
USD S&P 500 3 year 19.6% 20.4% 4 year 21.0% 21.2% 5 year 22.2% 22.2%
EUR Euro Stoxx 503 year 21.1% 20.7% 4 year 21.5% 20.5% 5 year 21.7% 20.5%
GBP FTSE 100 3 year 17.9% 18.4% 4 year 18.7% 18.8% 5 year 19.4% 19.2%
Source: Analysis of Markit
Implied volatilities used for calculation of the value of new business:
Currency Underlying
asset Option Term
Volatility at June 30, 2014
Volatility at June 30, 2015
JPY Nikkei 225 3 year 18.6% 19.2% 4 year 18.6% 19.4% 5 year 18.9% 19.5%
USD S&P 500 3 year 16.7% 19.3% 4 year 17.6% 20.7% 5 year 18.4% 21.9%
EUR Euro Stoxx 503 year 20.7% 4 year - 20.9% 5 year 21.1%
GBP FTSE 100 3 year 15.6% 18.0% 4 year 16.4% 18.9% 5 year 17.1% 19.5%
Source: Analysis of Markit
20
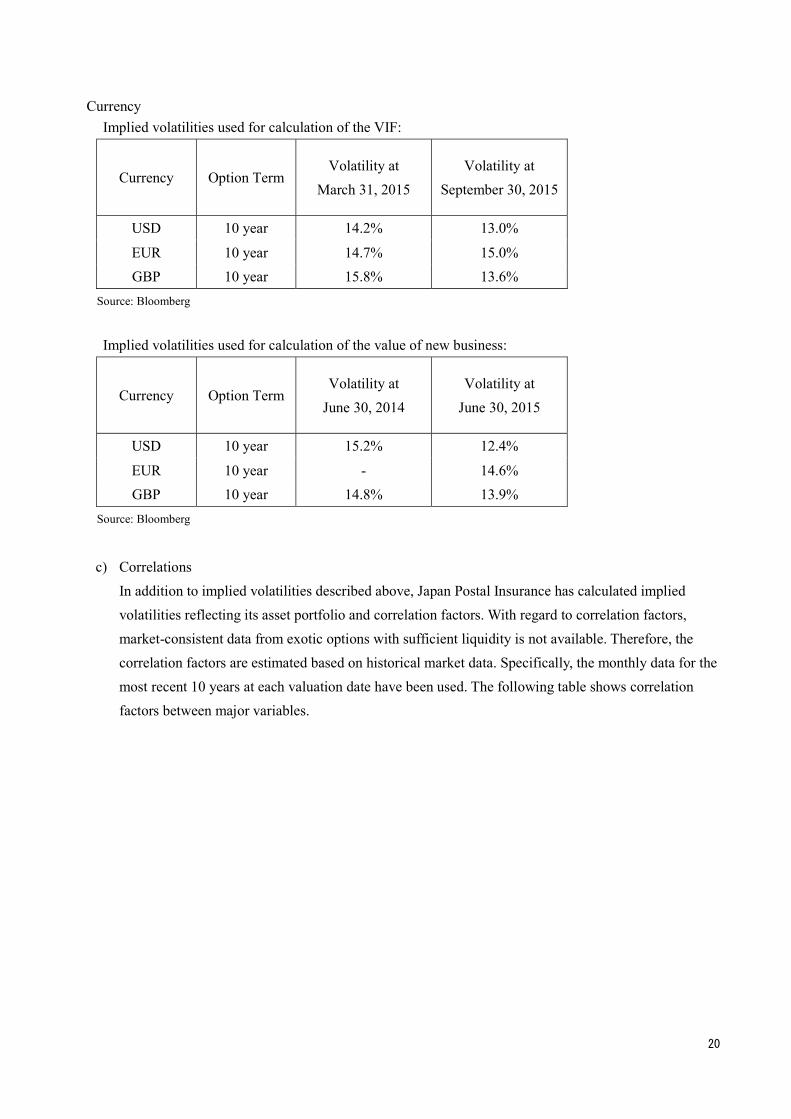
Currency Implied volatilities used for calculation of the VIF:
Currency Option TermVolatility at
March 31, 2015 Volatility at
September 30, 2015
USD 10 year 14.2% 13.0%
EUR 10 year 14.7% 15.0% GBP 10 year 15.8% 13.6%
Source: Bloomberg
Implied volatilities used for calculation of the value of new business:
Currency Option TermVolatility at
June 30, 2014 Volatility at
June 30, 2015
USD 10 year 15.2% 12.4%
EUR 10 year - 14.6% GBP 10 year 14.8% 13.9%
Source: Bloomberg
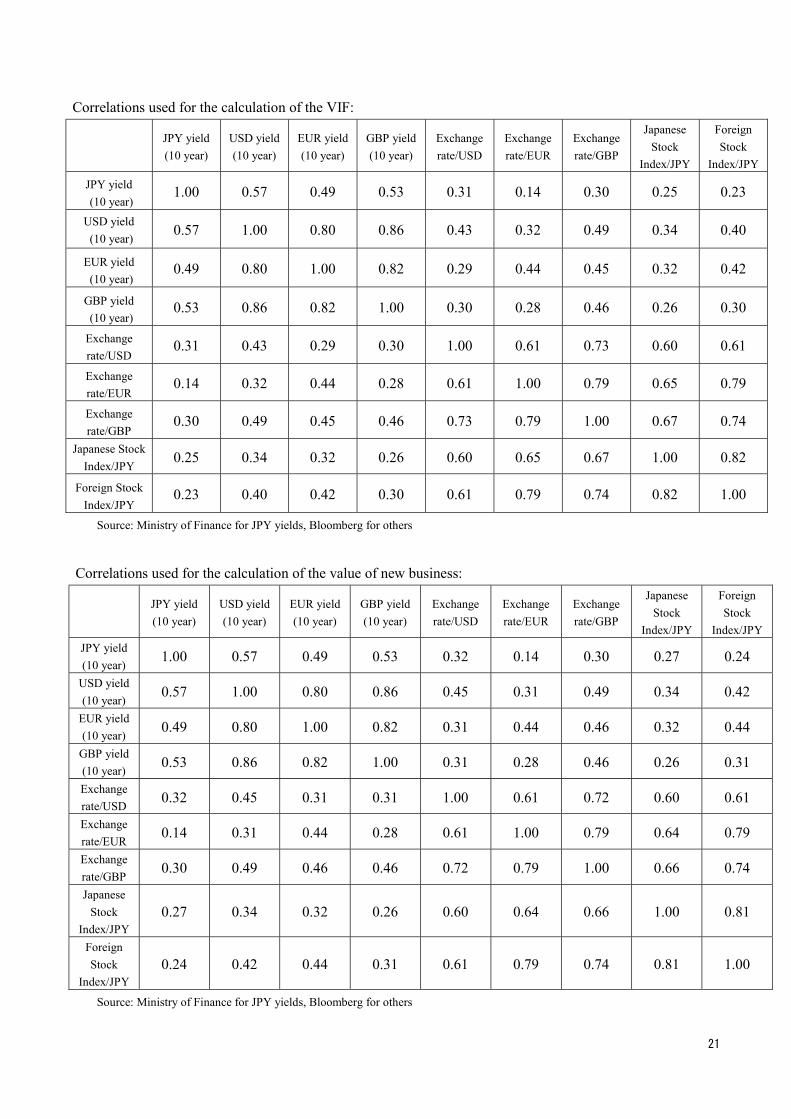
c) CorrelationsIn addition to implied volatilities described above, Japan Postal Insurance has calculated implied volatilities reflecting its asset portfolio and correlation factors. With regard to correlation factors, market-consistent data from exotic options with sufficient liquidity is not available. Therefore, the correlation factors are estimated based on historical market data. Specifically, the monthly data for the most recent 10 years at each valuation date have been used. The following table shows correlation factors between major variables.
21
Correlations used for the calculation of the VIF:
JPY yield (10 year)
USD yield (10 year)
EUR yield (10 year)
GBP yield (10 year)
Exchange rate/USD
Exchange rate/EUR
Exchange rate/GBP
Japanese Stock
Index/JPY
Foreign Stock
Index/JPY
JPY yield (10 year)
1.00 0.57 0.49 0.53 0.31 0.14 0.30 0.25 0.23
USD yield (10 year)
0.57 1.00 0.80 0.86 0.43 0.32 0.49 0.34 0.40
EUR yield (10 year)
0.49 0.80 1.00 0.82 0.29 0.44 0.45 0.32 0.42
GBP yield (10 year)
0.53 0.86 0.82 1.00 0.30 0.28 0.46 0.26 0.30
Exchange rate/USD
0.31 0.43 0.29 0.30 1.00 0.61 0.73 0.60 0.61
Exchange rate/EUR
0.14 0.32 0.44 0.28 0.61 1.00 0.79 0.65 0.79
Exchange rate/GBP
0.30 0.49 0.45 0.46 0.73 0.79 1.00 0.67 0.74
Japanese Stock Index/JPY
0.25 0.34 0.32 0.26 0.60 0.65 0.67 1.00 0.82
Foreign Stock Index/JPY
0.23 0.40 0.42 0.30 0.61 0.79 0.74 0.82 1.00
Source: Ministry of Finance for JPY yields, Bloomberg for others
Correlations used for the calculation of the value of new business:
JPY yield (10 year)
USD yield (10 year)
EUR yield (10 year)
GBP yield (10 year)
Exchange rate/USD
Exchange rate/EUR
Exchange rate/GBP
Japanese Stock
Index/JPY
Foreign Stock
Index/JPYJPY yield (10 year)
1.00 0.57 0.49 0.53 0.32 0.14 0.30 0.27 0.24
USD yield (10 year)
0.57 1.00 0.80 0.86 0.45 0.31 0.49 0.34 0.42
EUR yield (10 year) 0.49 0.80 1.00 0.82 0.31 0.44 0.46 0.32 0.44
GBP yield (10 year) 0.53 0.86 0.82 1.00 0.31 0.28 0.46 0.26 0.31
Exchange rate/USD 0.32 0.45 0.31 0.31 1.00 0.61 0.72 0.60 0.61
Exchange rate/EUR
0.14 0.31 0.44 0.28 0.61 1.00 0.79 0.64 0.79
Exchange rate/GBP
0.30 0.49 0.46 0.46 0.72 0.79 1.00 0.66 0.74
Japanese Stock
Index/JPY0.27 0.34 0.32 0.26 0.60 0.64 0.66 1.00 0.81
Foreign Stock
Index/JPY0.24 0.42 0.44 0.31 0.61 0.79 0.74 0.81 1.00
Source: Ministry of Finance for JPY yields, Bloomberg for others
22
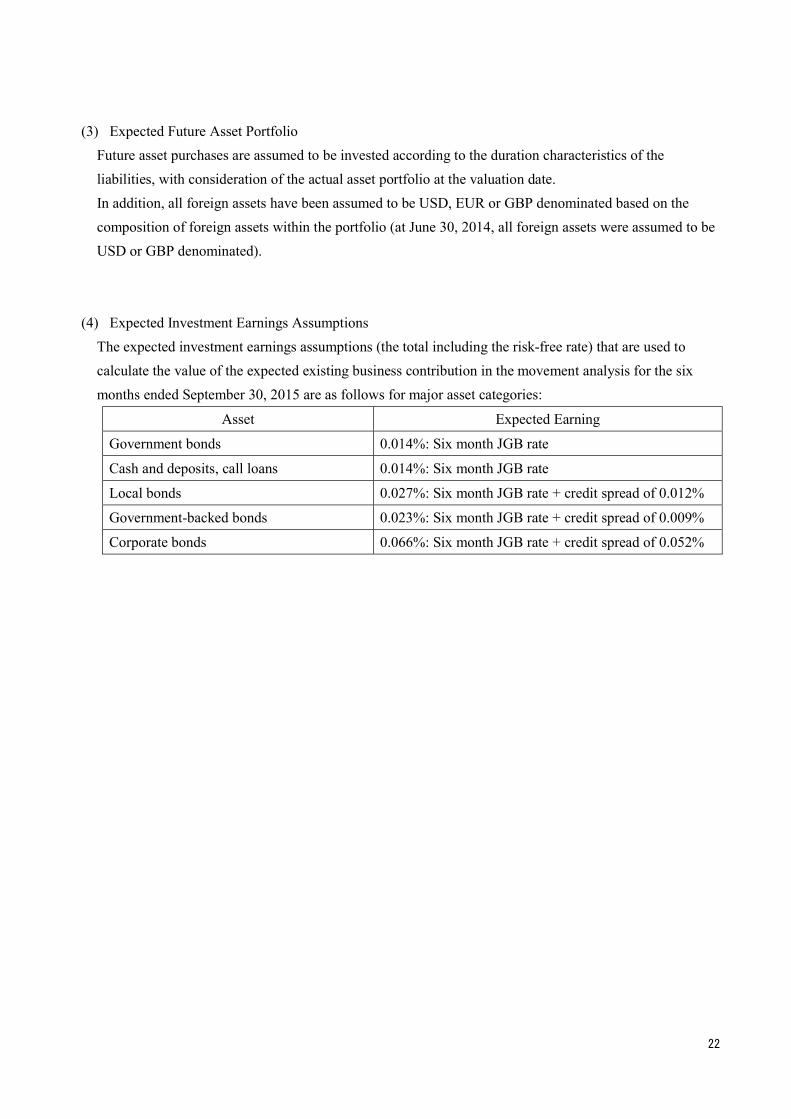
(3) Expected Future Asset Portfolio Future asset purchases are assumed to be invested according to the duration characteristics of the liabilities, with consideration of the actual asset portfolio at the valuation date. In addition, all foreign assets have been assumed to be USD, EUR or GBP denominated based on the composition of foreign assets within the portfolio (at June 30, 2014, all foreign assets were assumed to be USD or GBP denominated).
(4) Expected Investment Earnings Assumptions The expected investment earnings assumptions (the total including the risk-free rate) that are used to calculate the value of the expected existing business contribution in the movement analysis for the six months ended September 30, 2015 are as follows for major asset categories:
Asset Expected Earning
Government bonds 0.014%: Six month JGB rate
Cash and deposits, call loans 0.014%: Six month JGB rate
Local bonds 0.027%: Six month JGB rate + credit spread of 0.012%
Government-backed bonds 0.023%: Six month JGB rate + credit spread of 0.009%
Corporate bonds 0.066%: Six month JGB rate + credit spread of 0.052%
23
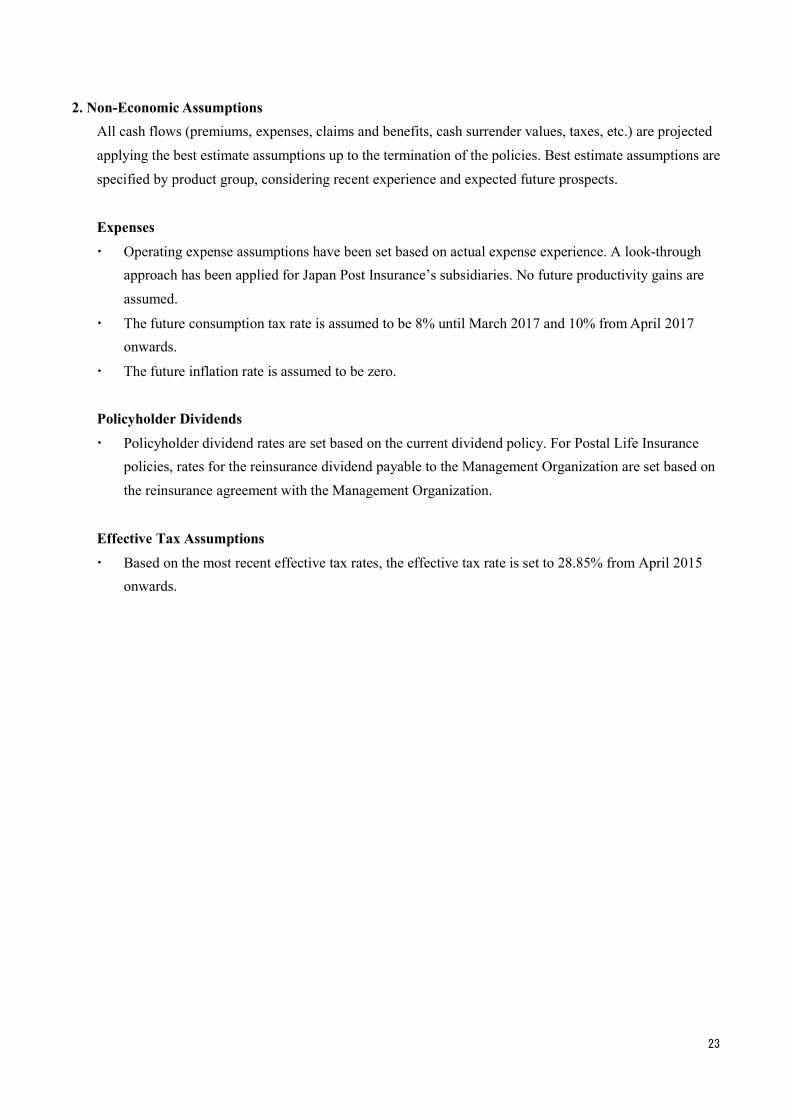
2. Non-Economic Assumptions All cash flows (premiums, expenses, claims and benefits, cash surrender values, taxes, etc.) are projected applying the best estimate assumptions up to the termination of the policies. Best estimate assumptions are specified by product group, considering recent experience and expected future prospects.
Expenses ・ Operating expense assumptions have been set based on actual expense experience. A look-through
approach has been applied for Japan Post Insurance’s subsidiaries. No future productivity gains are assumed.
・ The future consumption tax rate is assumed to be 8% until March 2017 and 10% from April 2017 onwards.
・ The future inflation rate is assumed to be zero.
Policyholder Dividends ・ Policyholder dividend rates are set based on the current dividend policy. For Postal Life Insurance
policies, rates for the reinsurance dividend payable to the Management Organization are set based on the reinsurance agreement with the Management Organization.
Effective Tax Assumptions ・ Based on the most recent effective tax rates, the effective tax rate is set to 28.85% from April 2015
onwards.
24
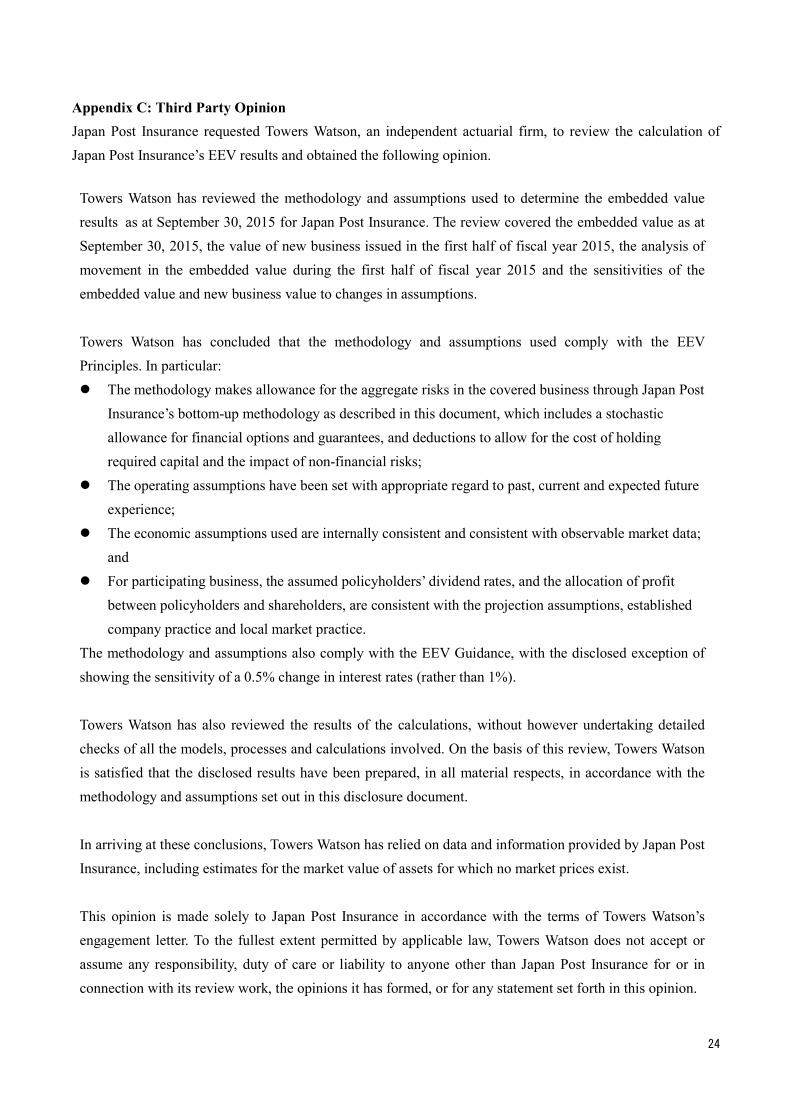
Appendix C: Third Party OpinionJapan Post Insurance requested Towers Watson, an independent actuarial firm, to review the calculation of Japan Post Insurance’s EEV results and obtained the following opinion.
Towers Watson has reviewed the methodology and assumptions used to determine the embedded value results as at September 30, 2015 for Japan Post Insurance. The review covered the embedded value as at September 30, 2015, the value of new business issued in the first half of fiscal year 2015, the analysis of movement in the embedded value during the first half of fiscal year 2015 and the sensitivities of the embedded value and new business value to changes in assumptions.
Towers Watson has concluded that the methodology and assumptions used comply with the EEV Principles. In particular: The methodology makes allowance for the aggregate risks in the covered business through Japan Post
Insurance’s bottom-up methodology as described in this document, which includes a stochastic allowance for financial options and guarantees, and deductions to allow for the cost of holding required capital and the impact of non-financial risks;
The operating assumptions have been set with appropriate regard to past, current and expected future experience;
The economic assumptions used are internally consistent and consistent with observable market data; and
For participating business, the assumed policyholders’ dividend rates, and the allocation of profit between policyholders and shareholders, are consistent with the projection assumptions, established company practice and local market practice.
The methodology and assumptions also comply with the EEV Guidance, with the disclosed exception of showing the sensitivity of a 0.5% change in interest rates (rather than 1%).
Towers Watson has also reviewed the results of the calculations, without however undertaking detailed checks of all the models, processes and calculations involved. On the basis of this review, Towers Watson is satisfied that the disclosed results have been prepared, in all material respects, in accordance with the methodology and assumptions set out in this disclosure document.
In arriving at these conclusions, Towers Watson has relied on data and information provided by Japan Post Insurance, including estimates for the market value of assets for which no market prices exist.
This opinion is made solely to Japan Post Insurance in accordance with the terms of Towers Watson’s engagement letter. To the fullest extent permitted by applicable law, Towers Watson does not accept or assume any responsibility, duty of care or liability to anyone other than Japan Post Insurance for or in connection with its review work, the opinions it has formed, or for any statement set forth in this opinion.
25
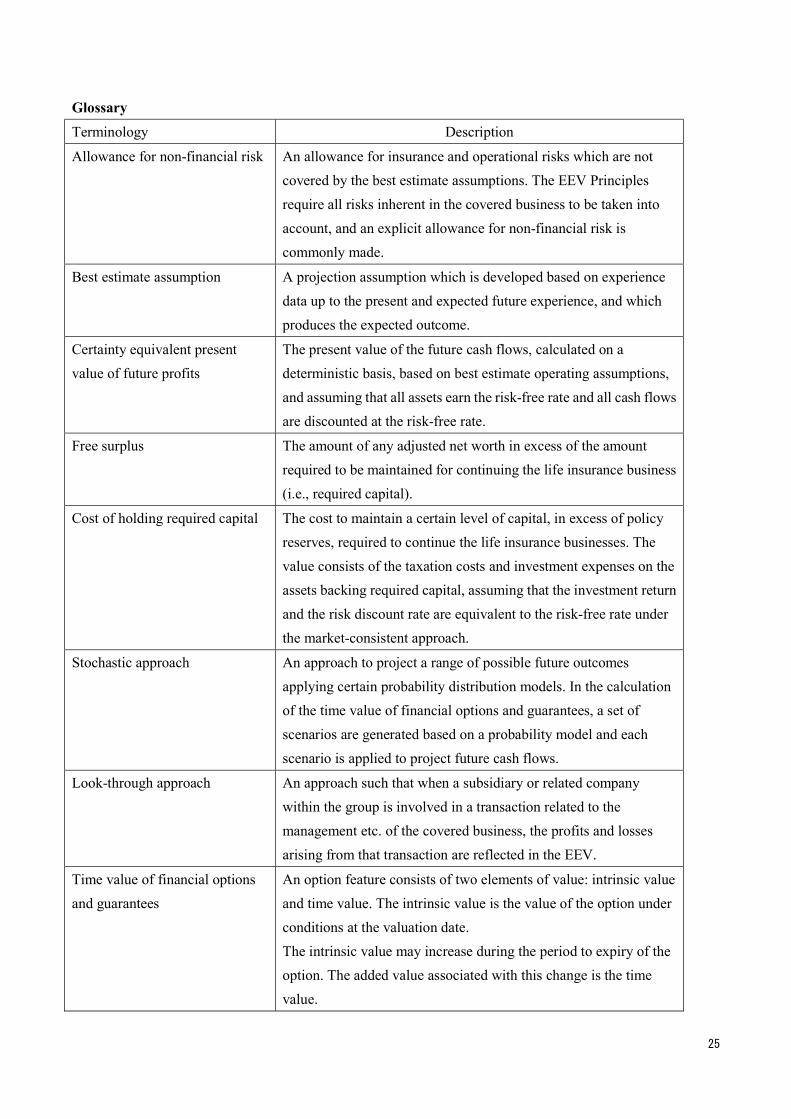
Glossary Terminology Description
Allowance for non-financial risk An allowance for insurance and operational risks which are not covered by the best estimate assumptions. The EEV Principles require all risks inherent in the covered business to be taken into account, and an explicit allowance for non-financial risk is commonly made.
Best estimate assumption A projection assumption which is developed based on experience data up to the present and expected future experience, and which produces the expected outcome.
Certainty equivalent present value of future profits
The present value of the future cash flows, calculated on a deterministic basis, based on best estimate operating assumptions, and assuming that all assets earn the risk-free rate and all cash flows are discounted at the risk-free rate.
Free surplus The amount of any adjusted net worth in excess of the amount required to be maintained for continuing the life insurance business (i.e., required capital).
Cost of holding required capital The cost to maintain a certain level of capital, in excess of policy reserves, required to continue the life insurance businesses. The value consists of the taxation costs and investment expenses on the assets backing required capital, assuming that the investment return and the risk discount rate are equivalent to the risk-free rate under the market-consistent approach.
Stochastic approach An approach to project a range of possible future outcomes applying certain probability distribution models. In the calculation of the time value of financial options and guarantees, a set of scenarios are generated based on a probability model and each scenario is applied to project future cash flows.
Look-through approach An approach such that when a subsidiary or related company within the group is involved in a transaction related to the management etc. of the covered business, the profits and losses arising from that transaction are reflected in the EEV.
Time value of financial options and guarantees
An option feature consists of two elements of value: intrinsic value and time value. The intrinsic value is the value of the option under conditions at the valuation date. The intrinsic value may increase during the period to expiry of the option. The added value associated with this change is the time value.

26
Terminology Description
Management Organization for Postal Savings and Postal Life Insurance (referred to as the “Management Organization” in the document)
Management Organization for Postal Savings and Postal Life Insurance was set up on October 1, 2007 to manage the insurance policies issued by Japan Post before September 30, 2007 (referred to as “Postal Life Insurance policies” in the document). Japan Post Insurance is responsible for all of the insurance obligations of the Postal Life Insurance policies through its reinsurance agreement with Management Organization for Postal Savings and Postal Life Insurance.
Postal Service Privatization Under the Postal Service Privatization Act, on October 1, 2007 Japan Post was privatized and split into five entities (Japan Post Holdings Co., Ltd., Japan Post Service Co., Ltd., Japan Post Network Co., Ltd., Japan Post Bank Co., Ltd., and Japan Post Insurance Co., Ltd.) Further, the Act for Partial Revision of the Postal Service Privatization Act and Others was passed, such that on October 1, 2012 Japan Post Service Co., Ltd. and Japan Post Network Co., Ltd. were merged to form Japan Post Co., Ltd.