Embed Size (px)
Citation preview

TESTWORK REPORT FOR THE MT TODD GOLD PROJECT FEASIBILITY STUDY
DISCLAIMER
This document is for the private information and benefit only of the client for whom it was prepared and the particular purpose previously advised to Ausenco Services Pty Ltd. The contents of this document are not to be relied upon or used, in whole or in part, by or for the benefit of others without prior adaption and specific written verification by Ausenco Services Pty Ltd.
Particular financial and other projections and analysis contained herein, to the extent they are based upon assumptions concerning future events and circumstances over which Ausenco Services Pty Ltd has no control, are by their nature uncertain and are to be treated accordingly. Ausenco Services Pty Ltd makes no warranties regarding such projections and analysis.
Ausenco Services Pty Ltd and its corporate affiliates and its subsidiaries and their respective officers, directors, employees and agents assume no responsibility for reliance upon this document or any of its contents by any other party other than Ausenco Services Pty Ltd’s clients.
Copyright in this document is wholly reserved to Ausenco Services Pty Ltd.

TESTWORK REPORT FOR THE MT TODD GOLD PROJECT FEASIBILITY STUDY
Review of Metallurgical Testwork
undertaken on
Batman Deposit Gold Ore Samples from the
Mt Todd Project
Feasibility Study for
Vista Gold Australia Pty Ltd

TESTWORK REPORT FOR THE MT TODD GOLD PROJECT FEASIBILITY STUDY
Date: January 2013 Page 3 of 92 Filename: Testwork Report - Rev C.docx
Table of Contents
1.1 Introduction 8 1.2 Testwork Conclusions 8 1.3 Review of Previous Metallurgical Testwork 11 1.4 Sample Selection, 2011 Test Work Campaign 20 1.5 Head Assays 23 1.6 Mineralogy 31 1.7 Comminution Testwork 34 1.8 Leach Optimisation 55 1.9 Effect of HPGR on Gold Extraction 65 1.10 Cyanide Variability Testwork 67 1.11 Bulk Leaches 76 1.12 Ancillary Testwork 77 1.13 Agitator Testwork 79 1.14 Materials Handling 80 1.15 Cyanide Destruction 80 1.16 Thickener Testwork 82 1.17 Flotation Testwork 83 1.18 Magnetic Separation Testwork 84 1.19 Recovery and Reagent Consumption 85 1.20 Further Recommended Testwork 89

TESTWORK REPORT FOR THE MT TODD GOLD PROJECT FEASIBILITY STUDY
Date: January 2013 Page 4 of 92 Filename: Testwork Report - Rev C.docx
List of Tables
Table 1 - Average gold and leach extractions from leach test work only 9
Table 2 - Abrasion Index Results 12
Table 3 - Bond Mill Work Indices 12
Table 4 - Whole ore leach tests, HPGR vs. Conventional Crush 13
Table 5 - Grind optimisation and pre-conditioning tests 15
Table 6 - NaCN optimisation results, maintain / decay, Composite 2 16
Table 7 - NaCN optimisation results, maintain / decay, Composite No. 1 16
Table 8 - Cyanide optimisation leach tests 17
Table 9 - CIP test results 18
Table 10 - Drill hole VB08-041 leach test results 19
Table 11 - Mine Plan Summary 21
Table 12 - Comminution samples by origin 22
Table 13 - Main Ore Type Composite Head Assay 24
Table 14 - Variability composite head assay 26
Table 15 - Mt Todd Mineral Abundance 32
Table 16 - Gold in Batman samples 33
Table 17 - Average particle and grain sizes 34
Table 18 - SMC Test® results 35
Table 19 - CWI Results 36
Table 20 - UCS Results 37
Table 21 - BWi Results (106 µm closing screen) 38
Table 22 - BWI at different closing screen sizes for the master composite sample 39
Table 23 - BWI at different closing screen sizes for various variability samples 40
Table 24 - Bond Work Index (200 µm closing screen), HPGR Product vs. Conventionally Crushed feed, Polysius 41
Table 25 - LABMILL Testwork Results 43
Table 26 - Bond Work Index, MHT-001 & MHT-004 HPGR Product, AMMTEC 44
Table 27 - Bond Work Index, 2010 HPGR Sample HPGR Product, AMMTEC 44
Table 28 - Grind establishment tests, conventionally crushed verses HPGR product 45
Table 29 - ATWAL abrasion test results 47
Table 30 - ATWAL wear rate categories 47
Table 31 - Summary of MAGRO semi-industrial scale test results 48
Table 32 - Initial grind optimisation tests 50
Table 33 - Final grind optimisation tests 52
Table 34 - Comparative NPV for Batman ores at various grind sizes and leach times 54
Table 35 - Comminution circuit design criteria 54

TESTWORK REPORT FOR THE MT TODD GOLD PROJECT FEASIBILITY STUDY
Date: January 2013 Page 5 of 92 Filename: Testwork Report - Rev C.docx
Table 36 - Pre-aeration Tests 56
Table 37 - Sparging Tests 57
Table 38 - Cyanide Optimisation Tests 58
Table 39 - Pulp density optimisation tests 59
Table 40 - Pre-conditioning and Lead Nitrate Tests 62
Table 41 - Lead nitrate and pre-conditioning option comparison 63
Table 42 - Cyanide maintenance tests 64
Table 43 - HPGR verses conventionally crushed CIL tests, MHT-001 and MHT-004 65
Table 44 - HPGR verses conventionally crushed CIL tests, 2010 HPGR composite 66
Table 45 - Leach Variability Tests, 125 µm grind size 69
Table 46 - Leach variability tests, 90 µm grind size 74
Table 47 - Bulk Leach Tests 76
Table 48 - Fleming Constants, Testwork 77
Table 49 - Fleming Constants, Design 77
Table 50 - Oxygen uptake rate (master composite) 78
Table 51 – Slurry Apparent Viscosity 78
Table 52 - Leach Residue Solution Analysis 80
Table 53 - Air–SO2 Test Results, Sample WH4270 81
Table 54 - Air–SO2 test results, sample WH4271 81
Table 55 - Thickener Testwork Results 82
Table 56 - Rougher Flotation Testwork Results 83
Table 57 - Magnetic Separation, 100% passing 3.35 mm, master composite 84
Table 58 - Magnetic Separation, 100% passing 3.35 mm, Var-79 84
Table 59 - Leach results at optimised conditions (24 h), main composites, 90 µm 85
Table 60 - Leach results at optimised conditions (24 h), variability composites 86
Table 61 - Leach Extraction Results 87
Table 62 - Leach extraction results, by ore type 87
Table 63 - Design Recoveries 88
Table 64 - Reagent consumptions from leach testwork only 88
Table 65 - Reagent consumptions from leach testwork only, by ore type 88
TESTWORK REPORT FOR THE MT TODD GOLD PROJECT FEASIBILITY STUDY
Date: January 2013 Page 6 of 92 Filename: Testwork Report - Rev C.docx
List of Figures
Figure 1 - Plan View of 2011 Metallurgical Drill Holes 20
Figure 2 - Grade comparison expected verses versus actual assays - variability composites 25
Figure 3 - Cyanide soluble copper relationship 31
Figure 4 - Closing screen size versus average BWi for master composite sample 39
Figure 5 - Closing screen size versus average BWi for variability samples 41
Figure 6 - MHT-001 Feed and Product Size Distributions 42
Figure 7 - MHT-004 Feed and Product Size Distributions 42
Figure 8 - Master composite leach kinetics at various grind P80 sizes, initial grind optimisation 50
Figure 9 - Initial Grind Optimisation NPV Analysis 51
Figure 10 - Master composite leach kinetics at various grind P80 sizes, final grind optimisation 53
Figure 11 - Final Grind Optimisation NPV Analysis 53
Figure 12 - The effect of pre-aeration on leach kinetics 56
Figure 13 - The effect of dissolved oxygen levels on leach kinetics 58
Figure 14 - The effect of pulp density on leach kinetics 60
Figure 15 - The effect pre-conditioning and lead nitrate conditioning on gold leach kinetics 62
Figure 16 - The effect pre-conditioning and lead nitrate conditioning on copper leach kinetics 63
Figure 17 - Grade–extraction relationship for gold, 125 µm grind size 73
Figure 18 - Grade–extraction relationship for copper, 125 µm grind size 73
Figure 19 - Grade–extraction relationship for gold, 90 µm grind size 75
Figure 20 - Grade–extraction relationship for copper, 90 µm grind size 75
Figure 21 - Copper extraction verses depth, drill holes VB11-009 and VB11-010 76
Figure 22 - Oxygen uptake rate (master composite) 78
Figure 23 - Viscosity versus Shear Rate (master composite) 79

TESTWORK REPORT FOR THE MT TODD GOLD PROJECT FEASIBILITY STUDY
Date: January 2013 Page 7 of 92 Filename: Testwork Report - Rev C.docx
Appendices
Appendix 1 – Testwork Sample Selection
Appendix 2 – ALS Ammtec Metallurgical Testwork Report
Appendix 3 – Mt Todd Gold ECS Grind Optimisation Report

TESTWORK REPORT FOR THE MT TODD GOLD PROJECT FEASIBILITY STUDY
Date: January 2013 Page 8 of 92 Filename: Testwork Report - Rev C.docx
1.1 Introduction
A metallurgical test work program was developed by Vista Gold on samples representing the Batman
deposit to support the Mt Todd Project Feasibility Study (FS) during 2011 - 2012. The aim of this program
was to re-validate the findings of previous testwork programs, and to expand on the understanding of the
metallurgical variability of the Batman orebody. The program was completed by ALS Ammtec in Perth,
Western Australia, during the second half of 2011 and first quarter of 2012. The test work program was
managed by Vista Gold and comprised:
comminution characteristics of the ore, including ball mill work index tests, SMC tests, crusher work
index tests and unconfined compressive strength tests for selected comminution and variability
composites
grind establishment cyanide leaches on the master composite sample
cyanidation concentration leaches on the master composite sample
investigating the optimum sparging conditions for the master composite sample
investigating the benefit of pre-aeration, pre-conditioning and lead nitrate addition for the master
composite sample
investigating the benefit of HPGR for gold extraction
gathering of engineering data, including oxygen uptake, carbon kinetics and slurry viscosity
cyanide detoxification tests by the continuous air/SO2/Cu2+ process
leach performance of 99 variability samples at a grind size of 125 µm P80 and of 30 variability
samples at a grind size of 90 µm P80
identifying the level of magnetic sulfide mineralisation within the master composite sample
rougher flotation performance
mineralogical assessment on selected variability samples.
In addition, several other tests were performed as below. ALS Ammtec prepared samples for dispatch to:
SPX Flow Technology to establish the optimum leach density and agitation requirements
Outotec for thickening testwork
ThyssenKrupp Polysius for high pressure grinding and ball mill grindability testwork
TUNRA to establish the materials handling characteristics.
Test work was completed on composite and variability samples prepared by Vista Gold from eight drill
holes that intersected the ore beneath the existing pit in the Batman deposit and the samples are
considered representative of the Batman ore.
1.2 Testwork Conclusions
Conclusions drawn from the comminution and metallurgical test work programs on the composites and
variability samples of the remaining ore in the Batman deposit are detailed below:

TESTWORK REPORT FOR THE MT TODD GOLD PROJECT FEASIBILITY STUDY
Date: January 2013 Page 9 of 92 Filename: Testwork Report - Rev C.docx
The testwork performed is considered sufficient to demonstrate the flowsheet and provide the
process plant design criteria for the FS design
The Batman ore is considered free-milling and non “preg-robbing” and amenable to gold extraction
by conventional cyanidation processes
The Batman ore is classified as ‘competent’ to ‘very competent’
The results of the crusher work index (‘CWI’) tests on selected Batman variability samples ranged
from 4.7 kWh/t to 8.4 kWh/t, with an average of 6.3 kWh/t and 75th percentile value of 8.4 kWh/t
The results of the BWi tests on the Batman comminution samples indicated little variability between
the samples with an average of 26.1 kWh/t and a 75th percentile value of 27.7 kWh/t at a closing
screen size of 106 µm, with all samples displaying above average hardness relative to the global
database
There are two main ore types in the Batman deposit (oxide and sulphide ore) that can be defined
and classified by their different leach performance and reagent consumption rates. The two main
ore types have been categorised by depth, with the oxide ore defined as material above the base
of oxidation while the sulfide ore is below the base of oxidation. The base of oxidation, on average,
is at a depth of 40 m below surface
The average gold and copper leach extractions at the grind size P80 of 90 µm, and CIL reagent
consumptions for the Batman oxide and sulfide ore samples are shown in Table 1. It should be
noted that actual plant extractions are typically marginally lower than achieved in the laboratory.
These figures exclude the residual free cyanide required at the end of the leach circuit to inhibit
copper loading onto the carbon, as well as the cyanide required for the cold cyanide wash in the
elution circuit.
Table 1 - Average gold and leach extractions from leach test work only
Ore Type Gold Leach Extraction
% Au
Copper Leach Extraction
% Cu
Sodium Cyanide Consumption
kg/t NaCN1
Lime Consumption
kg/t (60% CaO)2
Oxide Ore 84.4 42.4 0.77 0.64
Sulfide Ore 81.7 6.6 0.59 0.54
Weighted Average 81.7 6.9 0.59 0.54
1 In addition to the cyanide consumption numbers shown in Table 1, 0.16 kg/t NaCN for sulfide ore and
0.56 kg/t NaCN for oxide ore was added to ensure sufficient free cyanide exists in the system to prevent copper loading onto carbon. To accommodate the cold cyanide wash in the elution circuit, an additional 0.02 kg/t was added. This resulted in a total cyanide consumption used in operating costs of 0.77 kg/t.
2 In addition to the lime consumption numbers shown in Table 1, 0.84 kg/t lime for sulfide and 3.10 kg/t lime
for oxide ore is required for the cyanide detoxification circuit. This resulted in a total weighted average lime consumption of 1.40 kg/t lime at 60%w/w solids. This equates to a total consumption of 0.91 kg/t at 92% CaO, which is the quality of the lime sourced for the Mt Todd project.

TESTWORK REPORT FOR THE MT TODD GOLD PROJECT FEASIBILITY STUDY
Date: January 2013 Page 10 of 92 Filename: Testwork Report - Rev C.docx
There is high variability in cyanide soluble copper between the oxide and sulfide ore samples. This
is attributed to the difference in copper mineralogy: oxide material contains secondary copper
minerals (such as chalcocite and bornite) while sulfide material contains primary copper minerals
(such as chalcopyrite). The leach kinetics for secondary copper minerals in cyanide solution are
typically faster than for primary copper minerals
The current mine schedule indicates that the oxide ore represents only 0.66% of the total tonnage
in the Batman reserve. The oxide ore will not be processed separately but blended with sulfide
ore, with the expected performance of the blended feed approximately the weighted average
shown in Table 1.
For the Batman samples tested, pre-conditioning with lime for 4 hours prior to cyanidation
decreased the cyanide consumption by up to 30%, but also increased the lime consumption by
60%. There was no improvement in gold extraction observed with pre-conditioning. This is
contrary to the findings of 2010 feasibility testwork, which showed a significant increase in gold
extraction as well as a reduction in cyanide consumption (see Table 5). Consequently, the pre-
conditioning step that existed in the 2010 prefeasibility study flowsheet, has been removed
There appears to be no benefit to leach kinetics from elevated dissolved oxygen levels achieved by
the sparging of oxygen in place of air, therefore air sparging only is recommended for the CIL
circuit
The addition of lead nitrate [Pb(NO3)2] to the leach at a rate of 100 g/t appears to increase the gold
leach kinetics for the Batman ore, as well as reducing NaCN consumption. Pb(NO3)2 addition also
has the added benefit of suppressing the leaching of copper, reducing the formation of copper
cyanide complexes
There was no observed improvement in leach kinetics or overall gold extraction on samples
crushed by HPGR and ground to a P80 of 90 µm, compared to samples that were conventionally
crushed
Dynamic thickening testwork indicates underflow densities greater than 65%w/w solids with
acceptable overflow clarity could be achieved with settling rates between 0.2 t/m2/h and
1.64 t/m2/h at a P80 grind size of 125 µm. The grind optimisation testwork has indicated an
optimum P80 of 90 µm and further thickening testwork is required to confirm the settling rates for
thickener sizingat this finer grind size
The Batman ore contains magnetic pyrrhotite, which contains up to 40% of the gold mineralization.
This is to be considered further in the design of the tramp metal management system
HPGR testwork and modeling indicates a circuit specific energy of 4.1 kWh/t,confirming the high
ore competency indicated by the SMC DWi and Axb values measured for this ore
HPGR circuit modeling indicates a relatively high circulating load, due to:
- The relatively coarse HPGR product (reflecting the high ore competency)
- The fine wet screen separation size proposed for the operation (required to minimize the milling inefficiencies related to the very high BWi values)
BWi testwork completed on HPGR products has indicated a reduction in the measured ball mill
work index for HPGR crushed material compared to conventionally crushed material. This
observation is supported by the shorter grind times required by the HPGR product in the laboratory
mill to achieve a P80 of 90 µm
Preliminary rougher flotation tests achieved poor copper recoveries ranging between 40% and
45%, which was not deemed sufficient to justify the inclusion of a flotation circuit in the flowsheet.
Flotation was not pursued further as a potential processing path for the Batman ores
TESTWORK REPORT FOR THE MT TODD GOLD PROJECT FEASIBILITY STUDY
Date: January 2013 Page 11 of 92 Filename: Testwork Report - Rev C.docx
TUNRA materials handling tests indicated that the Batman sulfide ore should be moderately easy
handling material with a low bulk strength. The testwork indicates no special considerations are
required for the chute/bin design for handling the ore
Cyanide detoxification tests using the air/SO2/Cu2+ process at a laboratory scale demonstrated
that the weak acid dissociable cyanide (CNWAD) in the CIL tailings slurry can be reduced to
<10 ppm CNWAD.
1.3 Review of Previous Metallurgical Testwork
In this section, testwork undertaken during previous study phases is reviewed. Subsequent Sections 1.4
to 1.19 cover sample selection, assays and mineralogy, and testwork procedures and results related to
the current testwork program.
1.3.1 Introduction
Two test work campaigns have previously been completed on Mt Todd Batman orebody. Both campaigns
were completed by Resource Development Incorporated (RDi) in its laboratory located in Colorado, USA.
The results of these campaigns formed the basis of both the initial feasibility study completed by RDi in
2009, and the prefeasibility study (PFS) completed in 2010.
1.3.2 Background/Timeline
A summary of the previous metallurgical testwork programs and reviews completed by Vista Gold follows:
RDi completed a study in 2006 using historical metallurgical testwork results (completed by others)
and proposed a conceptual flowsheet consisting of crushing, grinding, flotation to produce a copper
concentrate and a float tailings CIL circuit to recover gold
RDi later received some core samples from an historic drill program to perform new testwork to
validate the conceptual flowsheet
The core samples were classified as transitional ore with the predominant sulfide species being
pyrite and secondary copper mineralisation (such as chalcocite and bornite). It should be noted that
the current mine plan indicates that the transitional material represents only a small fraction the
remaining resource
the preliminary results from this RDi testwork program validated the conceptual proposed flowsheet
and indicated an overall gold recovery of about 82%, with 90% of the copper reporting to a cleaner
concentrate grading 19% Cu at a primary grind of 200 mesh
Vista then completed two drilling programs in 2007 and 2008 focusing on the deeper ore beneath
the existing Batman pit. This deeper ore was considered to be more representative of the
remaining resource than that sampled for the 2006 testwork
The testwork performed on the 2007/2008 drill core failed to duplicate the results of the previous
2006 testwork program on the historic core samples. Subsequent investigations indicated a
significant change in mineralogy of the deposit with increasing depth. The copper mineralogy
changed from secondary to primary copper mineralisation (ie. from chalcocite to chalcopyrite) and
pyrrhotite replaced pyrite as the dominant sulfide species
TESTWORK REPORT FOR THE MT TODD GOLD PROJECT FEASIBILITY STUDY
Date: January 2013 Page 12 of 92 Filename: Testwork Report - Rev C.docx
The testwork program failed to produce an acceptable copper concentrate from the drill core
samples representing the deeper, primary ore. Given the low copper prices at that time the
testwork was undertaken, Vista Gold decided to remove the copper flotation circuit from the
proposed flowsheet and shift the focus to optimising gold recovery. All further testwork focused on
optimising a whole ore leach process flowsheet.
1.3.3 Samples
The following composites were prepared for RDi’s test work program from samples representing deeper
Batman ore from the 2007/2008 drilling program:
Composite 1 - 1200 kg composite sample made up from 2007 drill core. The composite included
samples from five drill holes selected to be representative of a cross section of the deposit. The
head assay was 1.3 g/t Au, 0.92% S and 447 ppm Cu. The sequential copper analysis indicated
80.4% of the copper in the sample was primary copper. The dominant sulfide in the sample was
pyrrhotite
Composite 2 - 140 kg composite sample made up from 2008 drill core with a head assay of 0.89 g/t
Au and 450 ppm Cu. The sequential copper analysis indicated 80.3% of the copper in the sample
was primary copper. Similar to Composite 1, the dominant sulfide in the sample was pyrrhotite
Drill hole 41 sample sourced from the oxide and transitional zones (depth of 0–65 m), with a head
assay of 1.78 g/t, 1.42% S and 448 ppm Cu. The sample was split into four main interval samples
labeled 3A, 3B, 3C and 3D. Composite 3A, representing the 0-20 m interval had copper oxides as
the dominant copper species. Composite 3B representing the 20-30 m interval was dominated by
secondary copper minerals.
1.3.4 Comminution Testwork
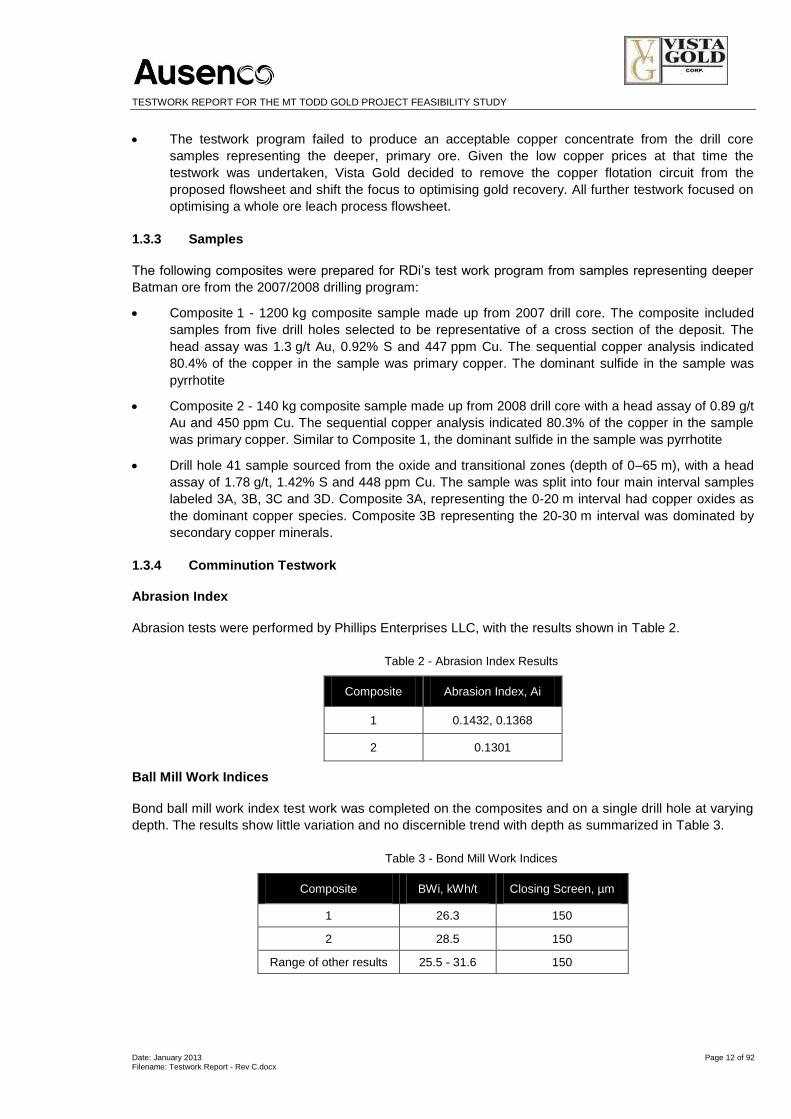
Abrasion Index
Abrasion tests were performed by Phillips Enterprises LLC, with the results shown in Table 2.
Table 2 - Abrasion Index Results
Composite Abrasion Index, Ai
1 0.1432, 0.1368
2 0.1301
Ball Mill Work Indices
Bond ball mill work index test work was completed on the composites and on a single drill hole at varying
depth. The results show little variation and no discernible trend with depth as summarized in Table 3.
Table 3 - Bond Mill Work Indices
Composite BWi, kWh/t Closing Screen, µm
1 26.3 150
2 28.5 150
Range of other results 25.5 - 31.6 150

TESTWORK REPORT FOR THE MT TODD GOLD PROJECT FEASIBILITY STUDY
Date: January 2013 Page 13 of 92 Filename: Testwork Report - Rev C.docx
HPGR Testwork
An HPGR (High Pressure Grinding Rolls) pilot test work campaign was completed by Polysius in
Germany on a 100 kg sub-sample of Composite 1. The results were used to assess the difference in
power requirement between a SAG/ball mill circuit, a 3-stage crush/ball mill circuit and a HPGR/ball mill
circuit to generate a 150 µm P80 product. The assessment concluded that an HPGR/ball mill circuit has a
significantly lower specific energy requirement (a difference of 9.48 kWh/t at a 150 µm P80 grind) than the
SAG/ball option. On this basis, RDi selected an HPGR/ball mill circuit for the prefeasibility process
flowsheet.
Material from the HPGR pilot test work was returned to RDi and subjected to flotation and cyanide
leaching test work. Cyanide leaching was completed on flotation tailings and whole ore cyanide leaching
to assess if the inclusion of the HPGR would provide a benefit for copper and gold recovery. The test
results showed no benefit for gold recovery in the leaching of flotation tailings or for whole ore leaching.
Whole ore leach tests were performed on material crushed by an HPGR and compared to material that
was conventionally crushed at various grind times. Leach conditions targeted 40%w/w solids, 0.2%w/v
NaCN, 24 hours residence time, oxygen sparging and pH 11. The results are summarised in Table 4.
Table 4 - Whole ore leach tests, HPGR vs. Conventional Crush
Parameter Conventional Crush HPGR Crush
Grind time, min 30 45 60 30 45 60
Grind size, P80 µm 198 58 38 59 36 <36
Gold extraction, % Au 75.3 61.4 38.8 76.7 32.8 34.8
NaCN Consumption, kg/t 1.25 2.64 2.87 2.38 2.62 2.73
Lime Consumption, kg/t 3.15 3.17 3.07 2.05 1.95 1.82
The results indicated that a finer grind size can be achieved within the same grind time for HPGR crushed
material compared to conventionally crushed material, with gold extraction decreasing at finer grind sizes.
A possible reasoning for this behavior may be that at finer grind sizes, the liberation of cyanide
consuming sulfide minerals increases consuming cyanide and reducing gold extraction.
This outcome conflicts with the test work performed by ALS Ammtec in 2011 (see Section 1.7.9), which
indicated an increase in gold extraction with finer grind sizes when combining oxygen sparging with the
same leach conditions. The RDi test work was completed using bottle rolls, whereas the 2011 ALS
Ammtec test work was completed in an agitated vat.
1.3.5 Gravity Testwork
Gravity recovery test work at P80 grind sizes of 212, 150 and 106 µm was completed on the Composite 1
sample. The results indicated limited free gold at the grind sizes tested. Any free gold present did not
concentrate to a significant extent.
Gravity concentration was not pursued further.
TESTWORK REPORT FOR THE MT TODD GOLD PROJECT FEASIBILITY STUDY
Date: January 2013 Page 14 of 92 Filename: Testwork Report - Rev C.docx
1.3.6 Flotation Testwork (to confirm flowsheet developed in 2006)
Flotation test work was completed on Composite 1. Rougher flotation tests resulted in 80% gold recovery
to concentrate at a 75 µm grind size. Desliming and regrinding of rougher tailings followed by a scavenger
flotation stage improved the overall gold float recovery to approximately 85%.
The best copper concentrate produced contained 6% Cu, compared to 19% Cu concentrate produced in
the 2006 test work program. Analysis of the concentrate indicated the dominant sulfide mineral was
pyrrhotite and not pyrite. Further mineralogical examinations concluded that the dominant sulfide minerals
in the majority of the remaining resource consisted of pyrrhotite and chalcopyrite (a primary copper
mineral), whereas the sample used in the 2006 testwork program was predominately pyrite and
secondary copper minerals.
The production of a saleable copper concentrate was not as viable as indicated in previous test work.
Also, the processing challenges associated with cyanide soluble copper encountered in previous
operations at Mt Todd would be a lesser problem when treating the deeper primary ores. The flotation of
copper was therefore deemed unnecessary, and a whole ore leach process flowsheet was pursued with a
greater focus on gold recovery.
1.3.7 Leach Testwork
Grind Optimisation Tests
Grind optimisation cyanide leach tests were performed at P80 grind sizes of 212, 106, 75 and 53 µm, at
an initial cyanide concentration of 0.1% NaCN and leach pH 11. Timed samples were taken at 6, 24, 48
and 72 hours.
These tests were repeated with 0, 2 and 4 hours of pre-conditioning. Pre-conditioning was referred to as
pre-aeration during this testwork, however no air or oxygen was added to the slurry at any point, with pre-
aeration defined as the addition of lime to the slurry for pH adjustment prior to the addition of cyanide.
This is referred to as pre-conditioning hereafter in this report. The results are shown in Table 5.
The grind optimisation test work in Table 5 indicated that:
approximately 80% of the cyanide soluble gold reports to solution within 24 hours
gold extraction increases with fineness of grind. This contradicts the results observed during the
HPGR testwork completed by RDi in Section 1.3.4, but is consistent with the grind optimization
work completed by Ammtec in 2011 (see Section 1.7.9).
As it was difficult to suspend solids at a P80 grind size of 212 µm, the results of this grind size were
discounted. Grind sizes finer than 106 µm were not considered as it was concluded that the results
indicated little improvement in gold extraction. This conclusion is however in conflict with the actual
results, which indicated a difference of almost 6% recovery between the 106 µm and 53 µm grinds.
The optimum primary grind size selected for the 2010 feasibility study was 150 µm. The selection criteria
and analysis undertaken to derive at this primary grind size is however unclear.
Pre-conditioning involved the addition of lime for pH adjustment, followed by agitating the slurry for 0, 2 or
4 hours before cyanide leaching. Results showed a significant improvement in gold recovery and a
reduction in cyanide consumption with increased pre-conditioning times and a 4-hour pre-conditioning
stage was included in the flowsheet.

TESTWORK REPORT FOR THE MT TODD GOLD PROJECT FEASIBILITY STUDY
Date: January 2013 Page 15 of 92 Filename: Testwork Report - Rev C.docx
Pre-conditioning tests performed during the 2011 test work program, on samples representing material
beneath the existing Batman pit, did not replicate these results. Refer to Section 1.8.5.
Table 5 - Grind optimisation and pre-conditioning tests
Pre-conditioning Grind P80 Calculated Head grade
NaCN Lime Gold Extraction, % Copper
Extraction, %
Hours µm Au
g/t
Cu
ppm
kg/t kg/t 24 h 48 h 72 h 72 h
0 200 0.85 440 1.73 4.50 75.9 77.1 78.3 18.7
0 106 1.07 447 1.85 4.42 72.6 76.5 77.7 21.7
0 75 1.08 473 1.67 4.44 78.5 79.9 81.2 21.0
0 53 1.11 486 1.97 4.39 79.7 83.7 85.1 21.0
2 200 0.92 440 0.72 4.49 75.3 78.0 79.4 20.5
2 106 0.87 438 0.72 4.71 78.7 80.0 81.4 20.6
2 75 0.93 477 0.77 4.70 75.5 78.4 82.9 22.8
2 53 1.06 455 0.90 4.90 85 86.4 86.4 23.9
4 200 0.92 448 0.60 4.71 72.4 75.3 76.4 19.7
4 106 0.90 435 0.59 4.80 80.7 83.7 85.1 23.7
4 75 0.88 427 0.60 4.73 81.2 82.6 82.4 25.0
4 53 0.90 489 0.60 4.92 86.4 87.9 89.4 25.6
Cyanide Optimisation Tests
Initial tests were performed on Composite 2 to examine the difference between maintaining cyanide
concentration and allowing it to decay at varying grind sizes. The test conditions were:
4 hours of pre-conditioning
initial pH of 11
40% w/w solids
no air or oxygen sparging
initial sodium cyanide concentration of 0.10%w/v, maintained at 0.10% w/v or allowed to decay
P80 grind sizes of 75 µm, 106 µm and 150 µm.
The outcome of this work is summarised in Table 6. Tests were also completed on Composite 1 at a grind
size of 150 µm. These results are shown in Table 7.

TESTWORK REPORT FOR THE MT TODD GOLD PROJECT FEASIBILITY STUDY
Date: January 2013 Page 16 of 92 Filename: Testwork Report - Rev C.docx
Table 6 - NaCN optimisation results, maintain / decay, Composite 2
Pre-conditioning Grind Calculated Head grade
NaCN Lime Gold Extraction, % Copper
Extraction, % Maintain / Decay
Hours µm Au
g/t
Cu
ppm
kg/t kg/t 24 h 48 h 48 h
4 150 1.29 498 0.43 4.83 78.2 81.3 18.5 Maintain
4 150 1.25 513 0.42 4.01 78.5 81.0 16.6 Maintain
4 150 1.03 475 0.30 4.03 76.0 77.4 16.2 Decay
4 150 1.19 505 0.31 3.96 77.8 79.2 15.3 Decay
4 106 1.10 475 0.48 5.02 78.9 79.8 17.5 Maintain
4 106 1.11 446 0.37 5.01 78.9 80.2 17.4 Maintain
4 106 1.05 486 0.36 5.14 79.2 79.1 17.3 Decay
4 106 1..11 448 0.42 5.57 76.8 79.0 17.8 Decay
4 75 1.08 542 0.42 6.46 78.6 81.2 17.3 Maintain
4 75 1.23 542 0.47 6.51 85.9 87.2 17.4 Maintain
4 75 0.97 490 0.43 6.52 81.5 84.2 17.5 Decay
4 75 0.97 445 0.42 6.49 79.1 83.4 19.0 Decay
Table 7 - NaCN optimisation results, maintain / decay, Composite No. 1
Pre-conditioning Grind Calculated Head grade
CN Lime Gold Extraction, % Copper
Extraction, %
Maintain / Decay
Hours µm
Au
g/t
Cu
ppm
kg/t kg/t 24 h 30 h 24 h 30 h
4 150 1.14 522 0.60 9.42 82.6 - 13.5 - Decay
4 150 1.1 496 0.89 9.43 79.1 - 13.2 - Maintain
4 150 1.03 457 0.54 9.42 - 80.4 - 14.3 Decay
4 150 0.93 484 0.60 9.51 79.3 82.2 12.8 14.5 Maintain
The test work results presented in Table 6 and Table 7 indicate that:
composite 1 exhibits better leach kinetics compared to Composite 2 at a P80 grind size of 150 µm,
but the NaCN and lime consumptions are higher for Composite 1
almost 80% of the soluble gold reported to solution within 24 and 48 hours, with either the ‘decay’
and ‘maintain’ mode at all grind sizes tested
maintaining a constant NaCN concentration over the course of leaching is not beneficial.
TESTWORK REPORT FOR THE MT TODD GOLD PROJECT FEASIBILITY STUDY
Date: January 2013 Page 17 of 92 Filename: Testwork Report - Rev C.docx
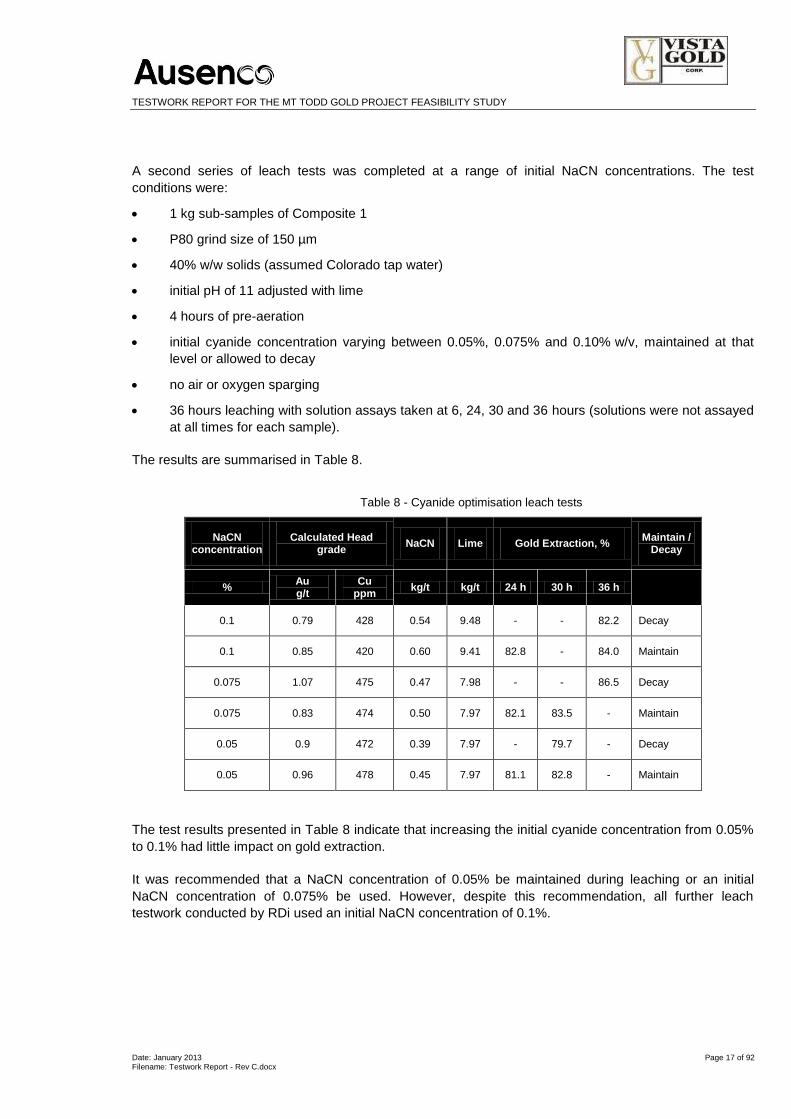
A second series of leach tests was completed at a range of initial NaCN concentrations. The test
conditions were:
1 kg sub-samples of Composite 1
P80 grind size of 150 µm
40% w/w solids (assumed Colorado tap water)
initial pH of 11 adjusted with lime
4 hours of pre-aeration
initial cyanide concentration varying between 0.05%, 0.075% and 0.10% w/v, maintained at that
level or allowed to decay
no air or oxygen sparging
36 hours leaching with solution assays taken at 6, 24, 30 and 36 hours (solutions were not assayed
at all times for each sample).
The results are summarised in Table 8.
Table 8 - Cyanide optimisation leach tests
NaCN concentration
Calculated Head grade
NaCN Lime Gold Extraction, % Maintain /
Decay
% Au g/t
Cu ppm
kg/t kg/t 24 h 30 h 36 h
0.1 0.79 428 0.54 9.48 - - 82.2 Decay
0.1 0.85 420 0.60 9.41 82.8 - 84.0 Maintain
0.075 1.07 475 0.47 7.98 - - 86.5 Decay
0.075 0.83 474 0.50 7.97 82.1 83.5 - Maintain
0.05 0.9 472 0.39 7.97 - 79.7 - Decay
0.05 0.96 478 0.45 7.97 81.1 82.8 - Maintain
The test results presented in Table 8 indicate that increasing the initial cyanide concentration from 0.05%
to 0.1% had little impact on gold extraction.
It was recommended that a NaCN concentration of 0.05% be maintained during leaching or an initial
NaCN concentration of 0.075% be used. However, despite this recommendation, all further leach
testwork conducted by RDi used an initial NaCN concentration of 0.1%.

TESTWORK REPORT FOR THE MT TODD GOLD PROJECT FEASIBILITY STUDY
Date: January 2013 Page 18 of 92 Filename: Testwork Report - Rev C.docx
Carbon-in-Pulp (CIP) Tests
Four CIP tests were performed under the following conditions:
1 kg sub-samples of Composite 1
grind size of 150 µm
40% w/w solids
initial pH of 11 adjusted with lime
4 hours of pre-aeration
initial cyanide concentration of 0.1% w/v, run in decay mode
no air or oxygen sparging
30 hours leaching with solutions assayed at 30 hours. 20 g/L of carbon was added after 24 hours.
The results of the CIP tests are summarised in Table 9.
Table 9 - CIP test results
Calculated Head grade NaCN Lime Gold Extraction, % Copper Extraction, %
Au Cu kg/t kg/t 30 h 30 h
1.05 468 0.52 3.10 82.3 14.1
1.01 415 0.58 3.09 82.0 15.6
1.04 444 0.40 3.09 85.4 14.4
1.15 465 0.46 3.11 86.7 14.4
The results presented in Table 9 show that after 30 hours, the gold extraction ranged between 82.0% and
86.7%. The four CIP tests returned the highest gold extractions achieved in the 2010 feasibility testwork
program and were used as the basis of the 2010 feasibility design. Based on these results, an extraction
of 82% was recommended for process plant design. The higher extractions achieved in the CIP tests are
difficult to explain, as the carbon was not added until after 24 hours of leaching. This could be a function
of inaccuracy in the gold-on-carbon assays, used in calculating the gold extraction.
Variability Tests
Leach tests were performed on the four composites made up from drill hole VB08-041, which represented
the oxide and transitional zones in the ore body. The tests conditions were:
grind size of 150 µm
40% w/w solids
initial pH of 11 with lime
4 hours of pre-conditioning
initial cyanide concentration of 0.1% w/v, run in decay mode
no air or oxygen sparging
30 hours leaching with solution assay taken at 30 hours.

TESTWORK REPORT FOR THE MT TODD GOLD PROJECT FEASIBILITY STUDY
Date: January 2013 Page 19 of 92 Filename: Testwork Report - Rev C.docx
The results of the four variability tests are summarised in Table 10.
Table 10 - Drill hole VB08-041 leach test results
Composite Calculated Head
grade NaCN Lime
Gold Extraction, %
Copper Extraction, %
Au
g/t
Cu
ppm
kg/t kg/t 30 h 30 h
3A 1.04 993 1.31 4.49 38.7 58.7
3A 2.23 949 1.26 4.50 16.6 57.2
3B 0.45 654 1.25 4.23 63.2 79.2
3B 0.34 701 1.25 4.22 65.6 79.2
3C 0.57 444 0.60 4.46 86.1 48.6
3C 0.53 440 0.66 4.49 83.9 50.0
3D 0.62 476 0.78 5.45 90.0 56.7
3D 0.75 502 0.83 5.49 90.8 57.8
The results of the variability tests summarised in Table 10 show a higher copper extraction for the four
oxide and transitional samples. This is consistent with the experience of previous Mt Todd operations that
mined ore from the oxide and transitional zones. Sample 3B marks the start of the transitional material,
where the dominant copper species is secondary copper as distinct from the copper oxides in Sample 3A.
Due to the high cyanide soluble copper levels in the oxide and transitional ores and the resulting high
cyanide consumption, blending of material from these zones should be practised.
1.3.8 Thickening Testwork
Dynamic thickening test work was undertaken on leach feed and leach tail samples of Composite 1. The
tests were completed at pH 8 (to simulate the conditions for pre-leach thickening) and pH 11 (tailings
thickening) at 150 µm P80.
The test work showed that the settling rate is pH dependent, with a higher settling rate achieved at pH 11.
On this basis a tailings thickener was incorporated into the flowsheet. A design settling rate of 0.11 m2/t/d
(or 0.38 t/m2h) was selected to achieve an underflow solids density of 55% w/w. The selected settling
rate was for a conventional thickener and RDi proposed a 65 m conventional thickener.
A high-rate thickener was selected for the 2010 feasibility study flowsheet to reduce the plant foot print
and in the absence of high-rate thickener test work a typical settling rate of 1.5 t/m2h was adopted.
1.3.9 Rheology Testwork
Basic rheology tests were performed, but the slurry settled quickly at 35% to 45% w/w solids and the
viscosity could not be measured.
This concludes the review of previous testwork. The following section relates to sample selection for the
current test work program.

TESTWORK REPORT FOR THE MT TODD GOLD PROJECT FEASIBILITY STUDY
Date: January 2013 Page 20 of 92 Filename: Testwork Report - Rev C.docx
1.4 Sample Selection, 2011 Test Work Campaign
Samples used for the 2011 metallurgical test work program (ECS testwork program) were sourced from
eight holes from the 2010/2011 drilling program. The drill holes were orientated to intersect the main
Batman ore body beneath the existing pit to be representative of the ore within the feasibility study pit
shell.
All samples from drill holes labelled VB11 were drilled in 2011, logged, packaged and shipped directly to
the laboratory for processing. Drill holes labelled MHT were drilled and logged during 2010 and were
stored in cold storage before being transported to the laboratory in 2011.
Figure 1 shows the plan view of the drill holes within the Batman deposit for the 2011 metallurgical test
work campaign.
Figure 1 - Plan View of 2011 Metallurgical Drill Holes
1.4.1 Geology Background
The Batman ores are classified as sulfide ore (or fresh), mixed ore (or transitional) and non-sulfide ore (or
oxide), based on degree of weathering. The test work samples were predominantly logged as sulfide ore,
although it is understood that due to the degree of weathering in the existing pit, it was difficult to
distinguish between lithologies and the transitional and sulfide zones.
The life of mine (LOM) production forecast for each ore type is shown in Table 11.

TESTWORK REPORT FOR THE MT TODD GOLD PROJECT FEASIBILITY STUDY
Date: January 2013 Page 21 of 92 Filename: Testwork Report - Rev C.docx
Table 11 - Mine Plan Summary
Ore Type LOM Production, k t % of Total Reserves
Non-sulfide 1,136 0.66
Mixed 1,917 1.11
Sulfide 168,894 98.22
Non-sulfide 1,136 0.66
TOTAL 171,946 100.00
Due to the dominance of sulfide ore in the mine plan and in the drill core samples available, the test work
program focused predominantly on the performance of this ore type. As was demonstrated during the
2010 feasibility testwork program, material from the oxide zone has significantly different cyanide soluble
copper levels compared to the sulfide ore, due to the difference in copper mineralisation. Oxide ore
samples were selected from drill holes VB11-009 and VB11-010 and tested as variability samples to
confirm the findings of the previous PFS testwork program and to predict the impact of processing the
remaining oxide reserves.
Taking into consideration the difficulty in distinguishing between lithologies and the transition and sulfide
zones, a decision was made to combine the sulfide ore and transitional ore, reducing the main ore types
to two – sulfide and oxide. Furthermore, based on the leach results obtained during the 2011 test work
program, the sulfide and oxide zones are classified based on pit depth. Test work has shown samples
sourced from the top 40 m of the pit show different mineralogical characteristics compared to samples
sourced from deeper in the pit, highlighted by the difference in cyanide soluble copper extraction in the
leach test work.
Copper mineralisation in the oxide zone consists predominately of oxide copper minerals and secondary
copper sulfide minerals (mainly chalcocite and bornite), which are known cyanocides (ie. highly cyanide
soluble), affecting reagent consumptions and possibly also gold extractions. Primary copper species (ie.
chalcopyrite) dominate the copper mineralisation in the sulfide ore. All samples sourced from depths
below 40 m are classified as sulfide. As the majority of the oxide material has already been mined by
previous operators and the remaining oxide ore represents only 0.66% of the total resource, it was
important to consider this ore separately, so that the results do not artificially impact on the calculated
averages for recovery and reagent consumption.
Only two host rock lithologies, greywacke and siltstone, were identified and logged during the 2010/2011
drilling program. However, there was no clear classification or delineation between the greywacke
dominant or siltstone dominant domains within the pit shell and consequently the variability test work did
not include evaluation of the two lithologies.
1.4.2 Comminution Samples
Twenty comminution samples were selected from the 2010/2011 drilling program. The sample origins
(drill hole and interval) are provided in detail in Appendix 1. A summary of the comminution samples is
shown in Table 12. The samples were selected to represent each of the drill holes, with three or four
composite samples selected from each. All composite samples from drill holes MHT-001 and MHT-004
were selected to allow comparison to the comminution test work completed by Polysius on the same
samples.

TESTWORK REPORT FOR THE MT TODD GOLD PROJECT FEASIBILITY STUDY
Date: January 2013 Page 22 of 92 Filename: Testwork Report - Rev C.docx
Table 12 - Comminution samples by origin
Sample Composite No. Drill Hole Interval
Comminution 1 #04 MHT-003 383 394
Comminution 2 #10 MHT-003 448 457
Comminution 3 #13 MHT-003 478 489
Comminution 4 #24 VB11-001 434 445
Comminution 5 #27 VB11-001 467 480
Comminution 6 #28 VB11-001 512 529
Comminution 7 #42 VB11-002 374 384
Comminution 8 #47 VB11-002 423 432
Comminution 9 #52 VB11-002 470 479
Comminution 10 #55 VB11-002 498 523
Comminution 11 #56 MHT-001 227 279
Comminution 12 #57 MHT-001 279 328
Comminution 13 #58 MHT-001 328 403
Comminution 14 #60 MHT-004 285 335
Comminution 15 #61 MHT-004 335 383
Comminution 16 #62 MHT-004 383 436
Comminution 17 #63 MHT-004 436 499
Comminution 18 #65 VB11-003 353 363
Comminution 19 #69 VB11-003 396 407
Comminution 20 #74 VB11-003 452 467
1.4.3 Metallurgical Composites
Four main ore type composite samples were generated from drill core available from the 2010/2011
drilling program:
master composite
MHT-001 drill hole composite, used for HPGR testwork
MHT-004 drill hole composite, used for HPGR testwork
2010 HPGR composite, used for additional HPGR testwork.
TESTWORK REPORT FOR THE MT TODD GOLD PROJECT FEASIBILITY STUDY
Date: January 2013 Page 23 of 92 Filename: Testwork Report - Rev C.docx
The origin (drill hole and interval) of each sample selected for the ore type composites is provided in
Appendix 1.1. The samples were selected to give a spatial representation of the Batman deposit. The
master composite is made up of 3 kg sub-samples of the variability composite samples 1 to 79 to create
sufficient mass for the planned test work program. Each variability composite represents approximately a
10 m interval by drill hole depth, which was selected to ensure there was sufficient mass of each
composite for test work (approximately 90 kg). The shortage of available drill core and the mass
requirement of the master composite did not allow the creation of a master composite sample that closely
reflected the design head grades. Variability samples 80 to 99 from drill holes VB11-009 and VB11-010
were late in arriving at ALS Ammtec and were not be included in the master composite recipe.
The MHT-001 and MHT-004 composites were made up from 2010 drill core that was sourced from cold
storage. These samples were selected by Vista Gold specifically for HPGR test work. Sample preparation
was completed at ALS Ammtec before the samples were shipped to Polysius in Germany. Sub-samples
of the MHT-001 and MHT-004 composites were kept at ALS Ammtec for the variability leach test work
program.
The 2010 HPGR composite was made up from 2010 drill core that was sourced from cold storage. The
testing of 2010 samples was not part of the original testwork program. Due to the inconclusive nature of
the HPGR versus conventionally crushed leach tests outlined in Section 1.9.1 and the shortage of 2011
samples to complete further HPGR testwork, this composite was created from 1 m intervals of core
samples from nine 2010 drill holes available on site.
1.4.4 Leach Variability Samples
Leach variability samples were selected to be representative of the various levels of oxidation and spatial
representation and variations in grade that make up the Batman ore deposit. A total of 99 variability
composites were constructed from core available from the 2010/2011 drill program.
Full details of drill hole, intersection and gold assay used to make up each of the variability samples are
provided in Appendix 1.1.
1.5 Head Assays
1.5.1 Main Composites
The head assays of the four main composites are shown in Table 13.
Salient points are:
The gold head grade of the master composite is higher than the design head grade of 0.85 g/t.
The master composite was used to determine the optimal leach conditions and not to calculate
process plant recovery or reagent consumption.
The 2010 HPGR composite sample assay is very similar to the master composite apart from the
arsenic assay, therefore the two leach tests are comparable.
The MHT-001 and MHT-004 composites have a lower gold and copper grade than the other
composites.
The head grades of the MHT-001 and MHT-004 composites are less important as they were
dedicated to comminution testwork.

TESTWORK REPORT FOR THE MT TODD GOLD PROJECT FEASIBILITY STUDY
Date: January 2013 Page 24 of 92 Filename: Testwork Report - Rev C.docx
Table 13 - Main Ore Type Composite Head Assay
Analyte Unit Master Composite
MHT-001 Composite
MHT-004 Composite
2010 HPGR Composite
Au(1) g/t 1.06 0.80 0.49 1.01
Au(2) g/t 1.02 0.71 0.45 0.79
Au(3) g/t 1.15/1.23 N/A N/A 1.02
Au(average) g/t 1.01/0.96 N/A N/A 0.92
Ag g/t 1.1 0.5 0.4 0.9
As ppm 290 40 130 8.92
Cu ppm 482 218 206 590
CN Sol. Cu ppm 204 36 84 N/A
CTOTAL % 0.15 0.12 0.15 0.12
CORGANIC % < 0.03 <0.03 0.03 <0.03
Fe % 5.5 5.08 4.84 6.82
Hg ppm < 0.1 0.1 <0.1 0.1
Pd ppm < 0.02 <0.02 <0.02 N/A
Pt ppm < 0.02 <0.02 <0.02 N/A
STOTAL % 1.32 0.68 0.8 1.34
SSULFIDE % 1.04 0.54 0.6 1.16
True SG(1) 3.35 2.81 2.78 2.80
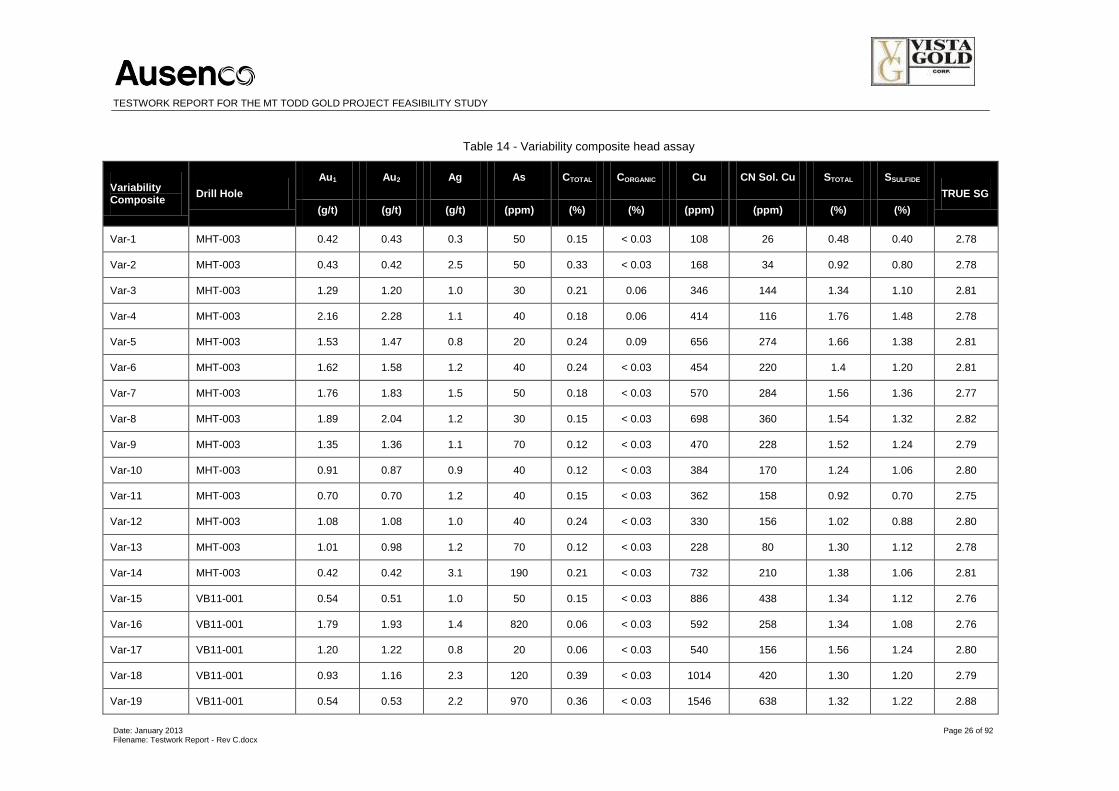
1.5.2 Variability Composites
The head assay of the variability samples are shown in Table 14.
The following conclusions are drawn from the variability composites presented in Table 14 without
significant exception, the gold grades show little variability (difference between Au1 and Au2), indicating
that it is unlikely that there is coarse free gold present
the total carbon (CTOTAL) levels in samples vary significantly. However, this is thought to be a
function of carbonate levels, as the organic carbon content is very low for all samples, hence
the risk of ‘preg-robbing’ is considered negligible for all composites.
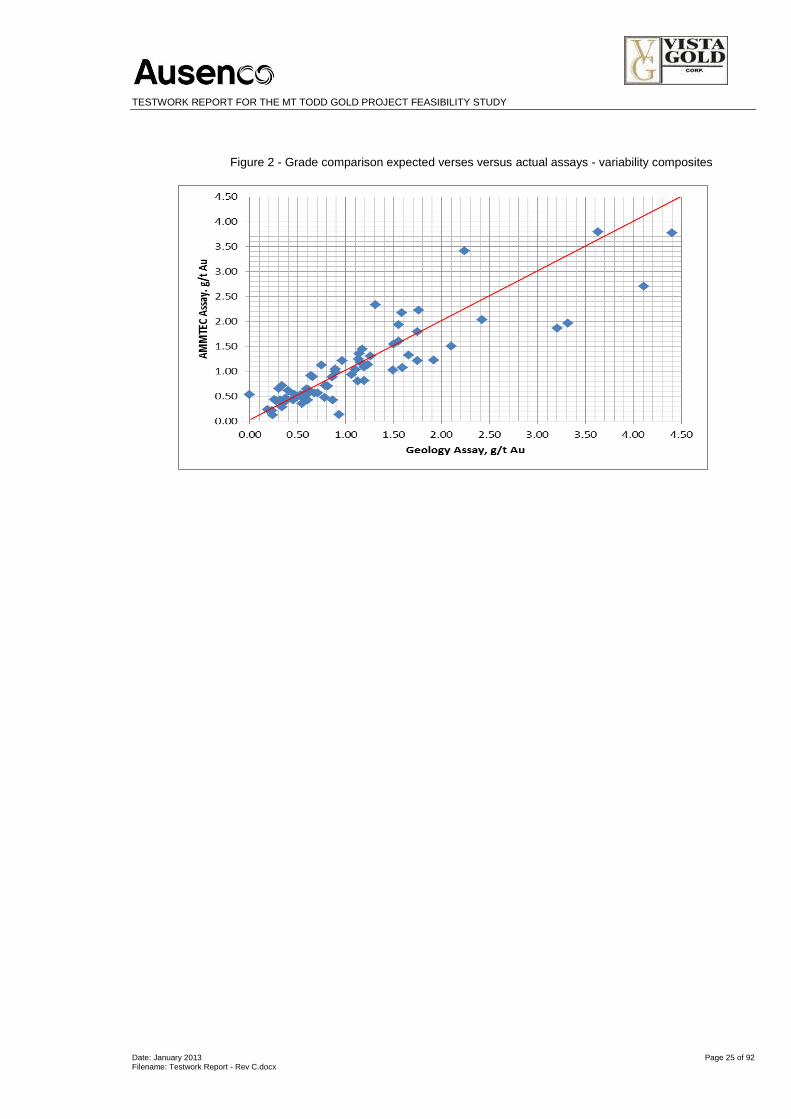
Figure 2 shows a comparison of the ‘expected’ gold grade and the ‘analytical’ assays of each sample as
determined by ALS Ammtec.
This indicates no bias in the results when comparing the geological assays to the assays completed by
ALS Ammtec. There were an equal number of higher results reported by ALS Ammtec as there were for
the geology assays.
TESTWORK REPORT FOR THE MT TODD GOLD PROJECT FEASIBILITY STUDY
Date: January 2013 Page 25 of 92 Filename: Testwork Report - Rev C.docx
Figure 2 - Grade comparison expected verses versus actual assays - variability composites
TESTWORK REPORT FOR THE MT TODD GOLD PROJECT FEASIBILITY STUDY
Date: January 2013 Page 26 of 92 Filename: Testwork Report - Rev C.docx
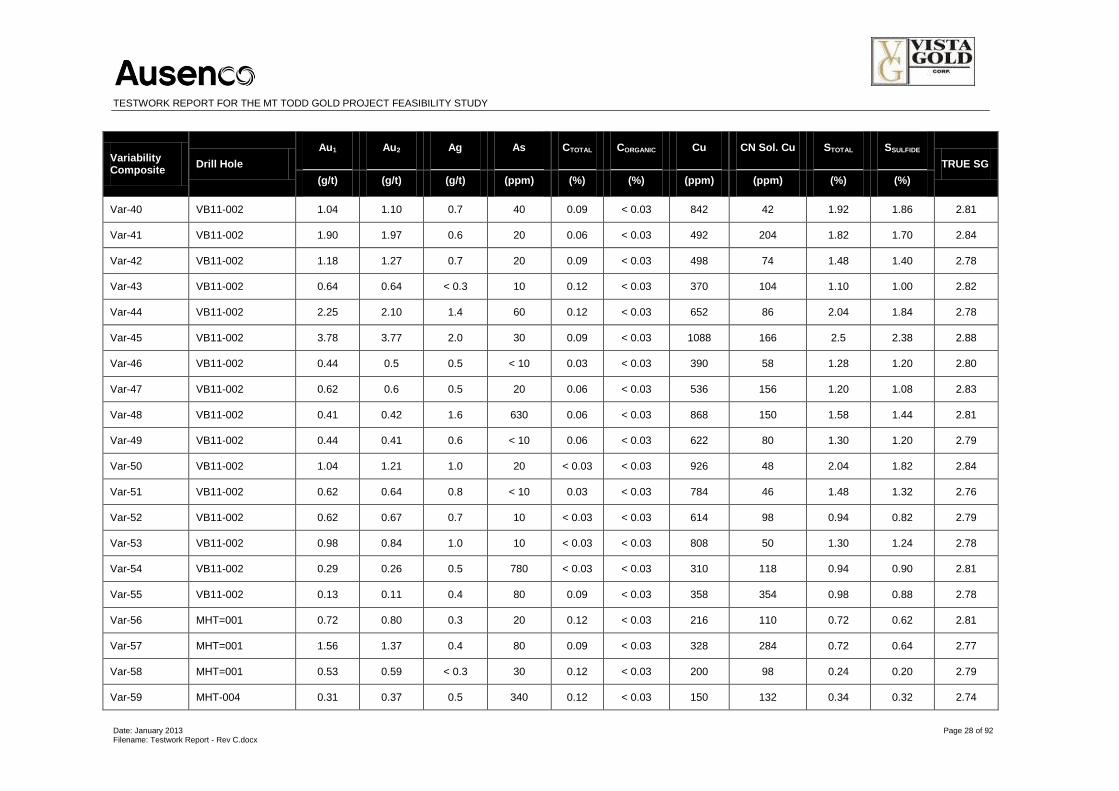
Table 14 - Variability composite head assay
Variability Composite
Drill Hole
Au1 Au2 Ag As CTOTAL CORGANIC Cu CN Sol. Cu STOTAL SSULFIDE
TRUE SG
(g/t) (g/t) (g/t) (ppm) (%) (%) (ppm) (ppm) (%) (%)
Var-1 MHT-003 0.42 0.43 0.3 50 0.15 < 0.03 108 26 0.48 0.40 2.78
Var-2 MHT-003 0.43 0.42 2.5 50 0.33 < 0.03 168 34 0.92 0.80 2.78
Var-3 MHT-003 1.29 1.20 1.0 30 0.21 0.06 346 144 1.34 1.10 2.81
Var-4 MHT-003 2.16 2.28 1.1 40 0.18 0.06 414 116 1.76 1.48 2.78
Var-5 MHT-003 1.53 1.47 0.8 20 0.24 0.09 656 274 1.66 1.38 2.81
Var-6 MHT-003 1.62 1.58 1.2 40 0.24 < 0.03 454 220 1.4 1.20 2.81
Var-7 MHT-003 1.76 1.83 1.5 50 0.18 < 0.03 570 284 1.56 1.36 2.77
Var-8 MHT-003 1.89 2.04 1.2 30 0.15 < 0.03 698 360 1.54 1.32 2.82
Var-9 MHT-003 1.35 1.36 1.1 70 0.12 < 0.03 470 228 1.52 1.24 2.79
Var-10 MHT-003 0.91 0.87 0.9 40 0.12 < 0.03 384 170 1.24 1.06 2.80
Var-11 MHT-003 0.70 0.70 1.2 40 0.15 < 0.03 362 158 0.92 0.70 2.75
Var-12 MHT-003 1.08 1.08 1.0 40 0.24 < 0.03 330 156 1.02 0.88 2.80
Var-13 MHT-003 1.01 0.98 1.2 70 0.12 < 0.03 228 80 1.30 1.12 2.78
Var-14 MHT-003 0.42 0.42 3.1 190 0.21 < 0.03 732 210 1.38 1.06 2.81
Var-15 VB11-001 0.54 0.51 1.0 50 0.15 < 0.03 886 438 1.34 1.12 2.76
Var-16 VB11-001 1.79 1.93 1.4 820 0.06 < 0.03 592 258 1.34 1.08 2.76
Var-17 VB11-001 1.20 1.22 0.8 20 0.06 < 0.03 540 156 1.56 1.24 2.80
Var-18 VB11-001 0.93 1.16 2.3 120 0.39 < 0.03 1014 420 1.30 1.20 2.79
Var-19 VB11-001 0.54 0.53 2.2 970 0.36 < 0.03 1546 638 1.32 1.22 2.88

TESTWORK REPORT FOR THE MT TODD GOLD PROJECT FEASIBILITY STUDY
Date: January 2013 Page 27 of 92 Filename: Testwork Report - Rev C.docx
Variability Composite
Drill Hole
Au1 Au2 Ag As CTOTAL CORGANIC Cu CN Sol. Cu STOTAL SSULFIDE
TRUE SG
(g/t) (g/t) (g/t) (ppm) (%) (%) (ppm) (ppm) (%) (%)
Var-20 VB11-001 1.32 1.32 2.1 410 0.81 < 0.03 1118 508 1.74 1.48 2.82
Var-21 VB11-001 1.22 1.14 1.1 30 < 0.03 < 0.03 1100 480 2.06 1.70 2.79
Var-22 VB11-001 0.86 0.74 0.4 20 < 0.03 < 0.03 510 100 1.50 1.16 2.81
Var-23 VB11-001 0.9 0.72 0.4 10 0.03 < 0.03 522 78 1.48 1.20 2.77
Var-24 VB11-001 1.46 1.43 0.5 180 0.09 < 0.03 464 106 1.60 1.16 2.83
Var-25 VB11-001 1.93 2.14 1.0 30 0.06 < 0.03 742 210 1.66 1.42 2.75
Var-26 VB11-001 1.01 1.04 0.6 < 10 < 0.03 < 0.03 662 122 1.56 1.24 2.81
Var-27 VB11-001 0.71 0.70 0.5 60 < 0.03 < 0.03 4740 96 1.10 0.88 2.78
Var-28 VB11-001 0.51 0.54 0.5 50 < 0.03 < 0.03 522 96 1.38 1.02 2.80
Var-29 VB11-002 2.31 2.35 1.4 110 0.06 < 0.03 528 238 0.90 0.72 2.80
Var-30 VB11-002 3.83 3.76 1.9 11100 0.12 < 0.03 680 268 2.10 1.98 2.79
Var-31 VB11-002 0.57 0.52 1.1 110 0.09 < 0.03 250 104 0.52 0.48 2.77
Var-32 VB11-002 0.33 0.36 1.0 150 0.51 0.06 156 60 0.40 0.32 2.74
Var-33 VB11-002 0.23 0.22 1.0 40 0.18 < 0.03 122 66 0.30 0.22 2.79
Var-34 VB11-002 0.39 0.37 8.4 140 0.63 < 0.03 762 72 0.90 0.90 2.83
Var-35 VB11-002 0.36 0.39 1.4 50 0.18 < 0.03 312 90 1.04 1.04 2.80
Var-36 VB11-002 0.86 0.91 2.2 90 0.18 < 0.03 486 128 1.34 1.32 2.77
Var-37 VB11-002 1.25 1.18 2.0 180 0.30 < 0.03 642 120 1.50 1.50 2.82
Var-38 VB11-002 0.75 0.68 1.3 320 0.21 < 0.03 680 240 1.34 1.34 2.80
Var-39 VB11-002 3.04 3.79 0.7 60 0.15 < 0.03 820 50 1.70 1.52 2.84
TESTWORK REPORT FOR THE MT TODD GOLD PROJECT FEASIBILITY STUDY
Date: January 2013 Page 28 of 92 Filename: Testwork Report - Rev C.docx
Variability Composite
Drill Hole
Au1 Au2 Ag As CTOTAL CORGANIC Cu CN Sol. Cu STOTAL SSULFIDE
TRUE SG
(g/t) (g/t) (g/t) (ppm) (%) (%) (ppm) (ppm) (%) (%)
Var-40 VB11-002 1.04 1.10 0.7 40 0.09 < 0.03 842 42 1.92 1.86 2.81
Var-41 VB11-002 1.90 1.97 0.6 20 0.06 < 0.03 492 204 1.82 1.70 2.84
Var-42 VB11-002 1.18 1.27 0.7 20 0.09 < 0.03 498 74 1.48 1.40 2.78
Var-43 VB11-002 0.64 0.64 < 0.3 10 0.12 < 0.03 370 104 1.10 1.00 2.82
Var-44 VB11-002 2.25 2.10 1.4 60 0.12 < 0.03 652 86 2.04 1.84 2.78
Var-45 VB11-002 3.78 3.77 2.0 30 0.09 < 0.03 1088 166 2.5 2.38 2.88
Var-46 VB11-002 0.44 0.5 0.5 < 10 0.03 < 0.03 390 58 1.28 1.20 2.80
Var-47 VB11-002 0.62 0.6 0.5 20 0.06 < 0.03 536 156 1.20 1.08 2.83
Var-48 VB11-002 0.41 0.42 1.6 630 0.06 < 0.03 868 150 1.58 1.44 2.81
Var-49 VB11-002 0.44 0.41 0.6 < 10 0.06 < 0.03 622 80 1.30 1.20 2.79
Var-50 VB11-002 1.04 1.21 1.0 20 < 0.03 < 0.03 926 48 2.04 1.82 2.84
Var-51 VB11-002 0.62 0.64 0.8 < 10 0.03 < 0.03 784 46 1.48 1.32 2.76
Var-52 VB11-002 0.62 0.67 0.7 10 < 0.03 < 0.03 614 98 0.94 0.82 2.79
Var-53 VB11-002 0.98 0.84 1.0 10 < 0.03 < 0.03 808 50 1.30 1.24 2.78
Var-54 VB11-002 0.29 0.26 0.5 780 < 0.03 < 0.03 310 118 0.94 0.90 2.81
Var-55 VB11-002 0.13 0.11 0.4 80 0.09 < 0.03 358 354 0.98 0.88 2.78
Var-56 MHT=001 0.72 0.80 0.3 20 0.12 < 0.03 216 110 0.72 0.62 2.81
Var-57 MHT=001 1.56 1.37 0.4 80 0.09 < 0.03 328 284 0.72 0.64 2.77
Var-58 MHT=001 0.53 0.59 < 0.3 30 0.12 < 0.03 200 98 0.24 0.20 2.79
Var-59 MHT-004 0.31 0.37 0.5 340 0.12 < 0.03 150 132 0.34 0.32 2.74

TESTWORK REPORT FOR THE MT TODD GOLD PROJECT FEASIBILITY STUDY
Date: January 2013 Page 29 of 92 Filename: Testwork Report - Rev C.docx
Variability Composite
Drill Hole
Au1 Au2 Ag As CTOTAL CORGANIC Cu CN Sol. Cu STOTAL SSULFIDE
TRUE SG
(g/t) (g/t) (g/t) (ppm) (%) (%) (ppm) (ppm) (%) (%)
Var-60 MHT-004 0.25 0.26 0.4 140 0.18 0.06 136 54 0.36 0.30 2.74
Var-61 MHT-004 0.51 0.51 0.6 110 0.105 0.03 154 82 0.50 0.46 2.79
Var-62 MHT-004 0.58 0.54 0.5 150 0.12 < 0.03 238 194 0.84 0.70 2.77
Var-63 MHT-004 0.69 0.64 0.9 90 0.09 < 0.03 342 72 1.18 0.98 2.82
Var-64 VB11-003 0.5 0.56 0.3 30 0.21 0.03 130 192 0.98 0.78 2.80
Var-65 VB11-003 0.53 0.59 0.4 30 0.27 0.09 178 214 0.68 0.54 2.80
Var-66 VB11-003 1.06 1.00 0.6 30 0.21 0.03 236 244 0.98 0.78 2.77
Var-67 VB11-003 0.94 0.92 0.3 50 0.12 < 0.03 336 86 1.12 0.98 2.83
Var-68 VB11-003 1.36 1.25 0.6 30 0.12 < 0.03 398 110 1.10 0.90 2.81
Var-69 VB11-003 1.62 1.47 0.6 20 0.12 < 0.03 596 118 1.42 1.10 2.79
Var-70 VB11-003 2.68 2.72 0.5 10 0.09 < 0.03 544 234 1.82 1.32 2.83
Var-71 VB11-003 1.11 1.15 < 0.3 80 0.09 < 0.03 226 48 0.88 0.64 2.76
Var-72 VB11-003 0.45 0.43 < 0.3 20 0.06 < 0.03 208 40 0.62 0.54 2.78
Var-73 VB11-003 0.60 0.52 0.7 120 0.30 0.06 530 204 0.70 0.62 2.76
Var-74 VB11-003 0.48 0.46 < 0.3 20 0.12 < 0.03 246 94 0.70 0.54 2.79
Var-75 VB11-003 0.19 0.22 0.4 40 0.06 < 0.03 184 72 0.44 0.34 2.75
Var-76 VB11-003 0.48 0.43 0.5 70 0.09 < 0.03 256 84 0.94 0.80 2.82
Var-77 VB11-003 0.44 0.40 0.5 80 0.09 < 0.03 238 86 0.74 0.50 2.75
Var-78 VB11-003 0.38 0.42 1.2 40 0.12 < 0.03 468 172 1.00 0.84 2.82
Var-79 VB11-003 0.13 0.13 0.5 40 0.12 < 0.03 140 74 0.36 0.26 2.74

TESTWORK REPORT FOR THE MT TODD GOLD PROJECT FEASIBILITY STUDY
Date: January 2013 Page 30 of 92 Filename: Testwork Report - Rev C.docx
Variability Composite
Drill Hole
Au1 Au2 Ag As CTOTAL CORGANIC Cu CN Sol. Cu STOTAL SSULFIDE
TRUE SG
(g/t) (g/t) (g/t) (ppm) (%) (%) (ppm) (ppm) (%) (%)
Var-80 VB11-009 0.47 0.58 < 0.3 60 < 0.03 < 0.03 238 204 0.82 0.72 2.81
Var-81 VB11-009 0.61 0.61 < 0.3 40 0.03 < 0.03 230 184 0.82 0.70 2.76
Var-82 VB11-009 0.38 0.34 < 0.3 30 0.06 < 0.03 162 134 0.78 0.68 2.82
Var-83 VB11-009 0.18 0.19 < 0.3 30 0.03 < 0.03 148 80 0.70 0.62 2.75
Var-84 VB11-009 0.54 0.49 0.4 20 0.09 < 0.03 304 134 0.86 0.74 2.80
Var-85 VB11-009 0.54 0.48 0.4 20 0.06 < 0.03 258 100 1.04 0.90 2.79
Var-86 VB11-009 1.26 1.44 0.4 10 0.06 < 0.03 460 76 1.30 1.10 2.83
Var-87 VB11-009 0.85 0.67 0.6 20 0.03 < 0.03 824 140 2.10 1.60 2.79
Var-88 VB11-009 1.25 1.21 0.5 130 0.06 < 0.03 516 124 1.42 1.24 2.81
Var-89 VB11-009 0.53 0.4 0.7 20 0.06 < 0.03 934 304 1.60 1.40 2.37
Var-90 VB11-010 0.38 0.38 < 0.3 40 0.03 < 0.03 176 118 0.78 0.70 2.79
Var-91 VB11-010 0.64 0.62 0.3 20 < 0.03 < 0.03 220 152 0.82 0.74 2.80
Var-92 VB11-010 0.42 0.41 0.5 50 0.03 < 0.03 222 124 0.82 0.80 2.76
Var-93 VB11-010 0.19 0.18 < 0.3 30 0.03 < 0.03 144 54 0.70 0.60 2.79
Var-94 VB11-010 0.30 0.29 0.4 20 0.09 < 0.03 210 86 0.84 0.76 2.79
Var-95 VB11-010 0.60 0.59 0.7 20 0.06 < 0.03 532 186 1.82 1.44 2.85
Var-96 VB11-010 0.67 0.58 0.4 20 0.06 < 0.03 274 68 1.06 0.88 2.78
Var-97 VB11-010 0.73 0.56 0.5 40 0.06 < 0.03 702 174 1.34 1.12 2.75
Var-98 VB11-010 0.81 0.66 1 30 0.09 < 0.03 738 212 2.58 2.20 2.85
Var-99 VB11-010 0.33 0.38 0.3 10 < 0.03 < 0.03 536 112 1.48 1.24 2.77
TESTWORK REPORT FOR THE MT TODD GOLD PROJECT FEASIBILITY STUDY
Date: January 2013 Page 31 of 92 Filename: Testwork Report - Rev C.docx
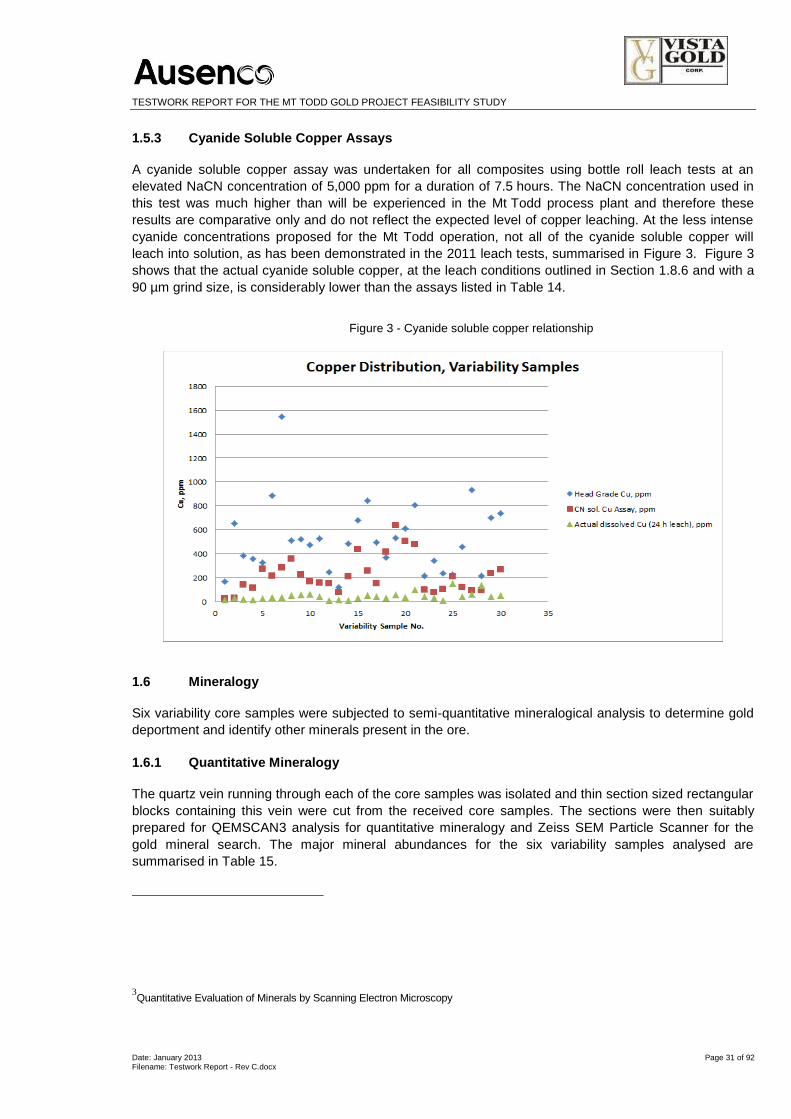
1.5.3 Cyanide Soluble Copper Assays
A cyanide soluble copper assay was undertaken for all composites using bottle roll leach tests at an
elevated NaCN concentration of 5,000 ppm for a duration of 7.5 hours. The NaCN concentration used in
this test was much higher than will be experienced in the Mt Todd process plant and therefore these
results are comparative only and do not reflect the expected level of copper leaching. At the less intense
cyanide concentrations proposed for the Mt Todd operation, not all of the cyanide soluble copper will
leach into solution, as has been demonstrated in the 2011 leach tests, summarised in Figure 3. Figure 3
shows that the actual cyanide soluble copper, at the leach conditions outlined in Section 1.8.6 and with a
90 µm grind size, is considerably lower than the assays listed in Table 14.
Figure 3 - Cyanide soluble copper relationship
1.6 Mineralogy
Six variability core samples were subjected to semi-quantitative mineralogical analysis to determine gold
deportment and identify other minerals present in the ore.
1.6.1 Quantitative Mineralogy
The quartz vein running through each of the core samples was isolated and thin section sized rectangular
blocks containing this vein were cut from the received core samples. The sections were then suitably
prepared for QEMSCAN3 analysis for quantitative mineralogy and Zeiss SEM Particle Scanner for the
gold mineral search. The major mineral abundances for the six variability samples analysed are
summarised in Table 15.
3Quantitative Evaluation of Minerals by Scanning Electron Microscopy

TESTWORK REPORT FOR THE MT TODD GOLD PROJECT FEASIBILITY STUDY
Date: January 2013 Page 32 of 92 Filename: Testwork Report - Rev C.docx
Table 15 - Mt Todd Mineral Abundance
Mineral Grouping
Abundance (%w/w)
Var-16
Abundance (%w/w) Var-19
Abundance (%w/w) Var-26
Abundance (%w/w) Var-33
Abundance (%w/w) Var-39
Abundance (%w/w) Var-91
Gold 0.09 0.00 0.00 0.00 0.00 0.02
Silver 0.00 0.00 0.00 0.00 0.00 0.00
Bismuth 0.09 0.00 0.00 0.00 0.00 0.02
Pyrite 16.79 37.33 0.80 4.04 13.30 23.50
Pyrrhotite 0.23 0.03 16.82 0.12 0.41 0.46
Chalcopyrite 0.94 0.06 0.84 0.07 0.06 0.09
Sphalerite 0.00 0.01 0.14 0.08 0.00 0.00
Galena 0.03 0.18 0.02 0.04 0.04 0.00
Arsenopyrite 0.06 0.00 0.00 0.00 0.00 0.00
Quartz 75.50 56.35 50.44 12.16 26.99 57.58
Mica/Clays 6.15 0.13 30.66 70.68 58.00 14.53
Carbonates 0.02 5.90 0.02 2.12 0.64 0.10
Fe Oxides 0.07 0.01 0.09 1.62 0.09 3.62
Minor Silicates 0.00 0.00 0.04 7.00 0.24 0.02
Minor Phases 0.02 0.01 0.13 2.08 0.24 0.05
Total 99.99 100.01 100.00 100.01 100.01 99.99
The QEMSCAN analysis highlights the following:
the indicative mineralogy of the samples shows a dominance of quartz and mica/clays in all
samples, which is expected since the quartz vein was targeted
several sulfides were detected in the samples, including pyrite, pyrrhotite, chalcopyrite, sphalerite
and galena
pyrite is the dominant sulphide except in Var-26 where a large pyrrhotite grain was detected in the
measurement area, which is contrary to the conclusions of the 2010 feasibility study
chalcopyrite shows a significant occurrence in Var-16 and Var-26, which are both sourced from the
same drill hole VB-11
sphalerite and galena were detected only in trace amounts
the manual SEM EDS analysis of the detected gold grains during the gold search found that the
majority of the gold occurred as both pure gold and argentian gold
the mineralogical data above should be taken only as indicative, as measurement of a single 2D
cross-sectional surface cannot produce statistically robust mineral populations.
TESTWORK REPORT FOR THE MT TODD GOLD PROJECT FEASIBILITY STUDY
Date: January 2013 Page 33 of 92 Filename: Testwork Report - Rev C.docx
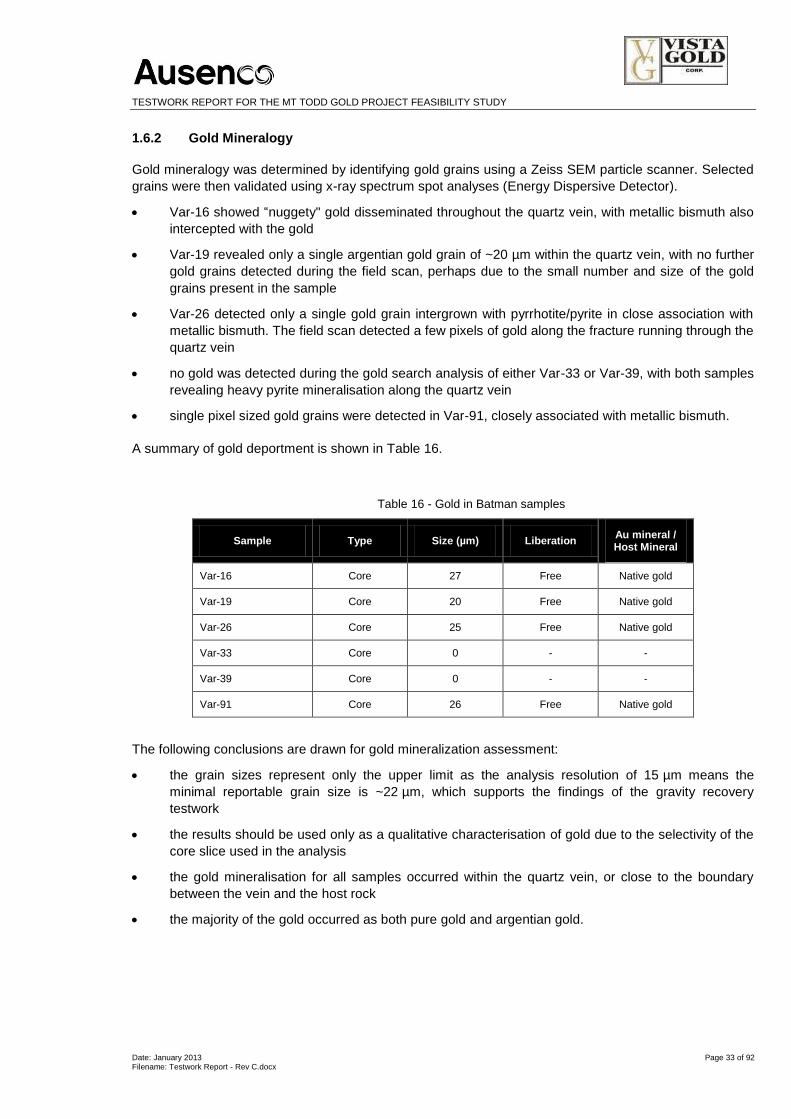
1.6.2 Gold Mineralogy
Gold mineralogy was determined by identifying gold grains using a Zeiss SEM particle scanner. Selected
grains were then validated using x-ray spectrum spot analyses (Energy Dispersive Detector).
Var-16 showed “nuggety" gold disseminated throughout the quartz vein, with metallic bismuth also
intercepted with the gold
Var-19 revealed only a single argentian gold grain of ~20 µm within the quartz vein, with no further
gold grains detected during the field scan, perhaps due to the small number and size of the gold
grains present in the sample
Var-26 detected only a single gold grain intergrown with pyrrhotite/pyrite in close association with
metallic bismuth. The field scan detected a few pixels of gold along the fracture running through the
quartz vein
no gold was detected during the gold search analysis of either Var-33 or Var-39, with both samples
revealing heavy pyrite mineralisation along the quartz vein
single pixel sized gold grains were detected in Var-91, closely associated with metallic bismuth.
A summary of gold deportment is shown in Table 16.
Table 16 - Gold in Batman samples
Sample Type Size (µm) Liberation Au mineral / Host Mineral
Var-16 Core 27 Free Native gold
Var-19 Core 20 Free Native gold
Var-26 Core 25 Free Native gold
Var-33 Core 0 - -
Var-39 Core 0 - -
Var-91 Core 26 Free Native gold
The following conclusions are drawn for gold mineralization assessment:
the grain sizes represent only the upper limit as the analysis resolution of 15 µm means the
minimal reportable grain size is ~22 µm, which supports the findings of the gravity recovery
testwork
the results should be used only as a qualitative characterisation of gold due to the selectivity of the
core slice used in the analysis
the gold mineralisation for all samples occurred within the quartz vein, or close to the boundary
between the vein and the host rock
the majority of the gold occurred as both pure gold and argentian gold.
TESTWORK REPORT FOR THE MT TODD GOLD PROJECT FEASIBILITY STUDY
Date: January 2013 Page 34 of 92 Filename: Testwork Report - Rev C.docx
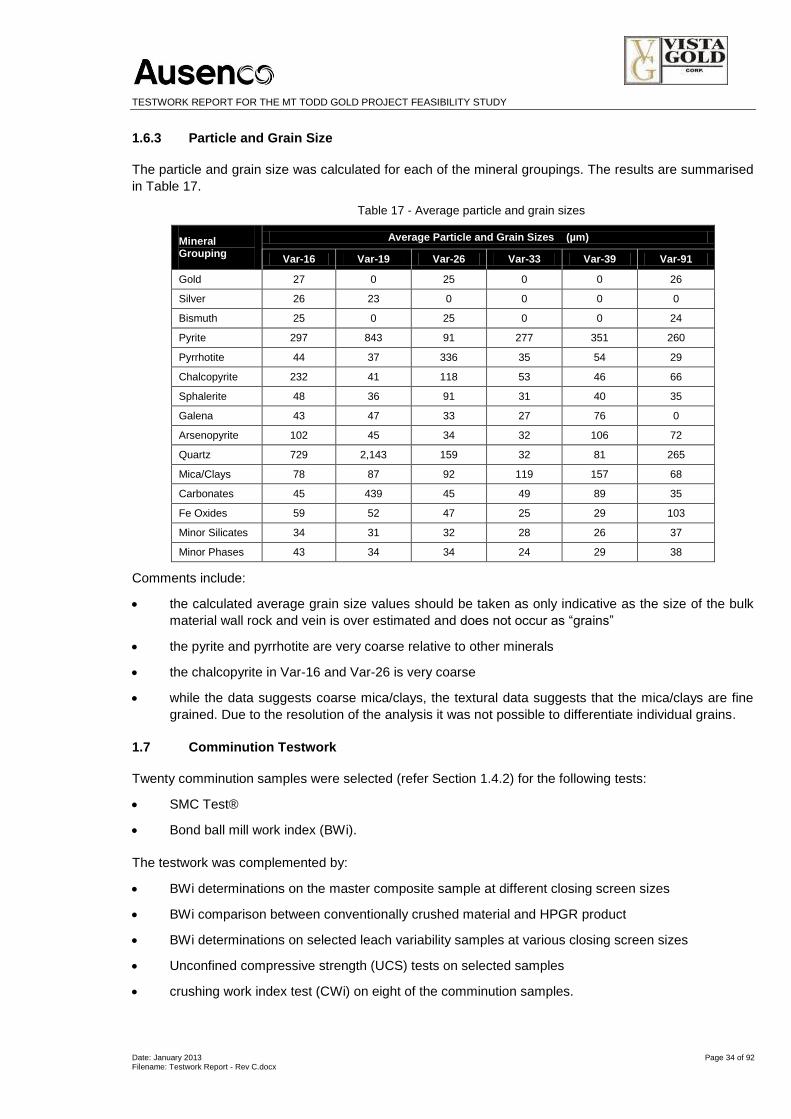
1.6.3 Particle and Grain Size
The particle and grain size was calculated for each of the mineral groupings. The results are summarised
in Table 17.
Table 17 - Average particle and grain sizes
Mineral Grouping
Average Particle and Grain Sizes (µm)
Var-16 Var-19 Var-26 Var-33 Var-39 Var-91
Gold 27 0 25 0 0 26
Silver 26 23 0 0 0 0
Bismuth 25 0 25 0 0 24
Pyrite 297 843 91 277 351 260
Pyrrhotite 44 37 336 35 54 29
Chalcopyrite 232 41 118 53 46 66
Sphalerite 48 36 91 31 40 35
Galena 43 47 33 27 76 0
Arsenopyrite 102 45 34 32 106 72
Quartz 729 2,143 159 32 81 265
Mica/Clays 78 87 92 119 157 68
Carbonates 45 439 45 49 89 35
Fe Oxides 59 52 47 25 29 103
Minor Silicates 34 31 32 28 26 37
Minor Phases 43 34 34 24 29 38
Comments include:
the calculated average grain size values should be taken as only indicative as the size of the bulk
material wall rock and vein is over estimated and does not occur as “grains”
the pyrite and pyrrhotite are very coarse relative to other minerals
the chalcopyrite in Var-16 and Var-26 is very coarse
while the data suggests coarse mica/clays, the textural data suggests that the mica/clays are fine
grained. Due to the resolution of the analysis it was not possible to differentiate individual grains.
1.7 Comminution Testwork
Twenty comminution samples were selected (refer Section 1.4.2) for the following tests:
SMC Test®
Bond ball mill work index (BWi).
The testwork was complemented by:
BWi determinations on the master composite sample at different closing screen sizes
BWi comparison between conventionally crushed material and HPGR product
BWi determinations on selected leach variability samples at various closing screen sizes
Unconfined compressive strength (UCS) tests on selected samples
crushing work index test (CWi) on eight of the comminution samples.
TESTWORK REPORT FOR THE MT TODD GOLD PROJECT FEASIBILITY STUDY
Date: January 2013 Page 35 of 92 Filename: Testwork Report - Rev C.docx
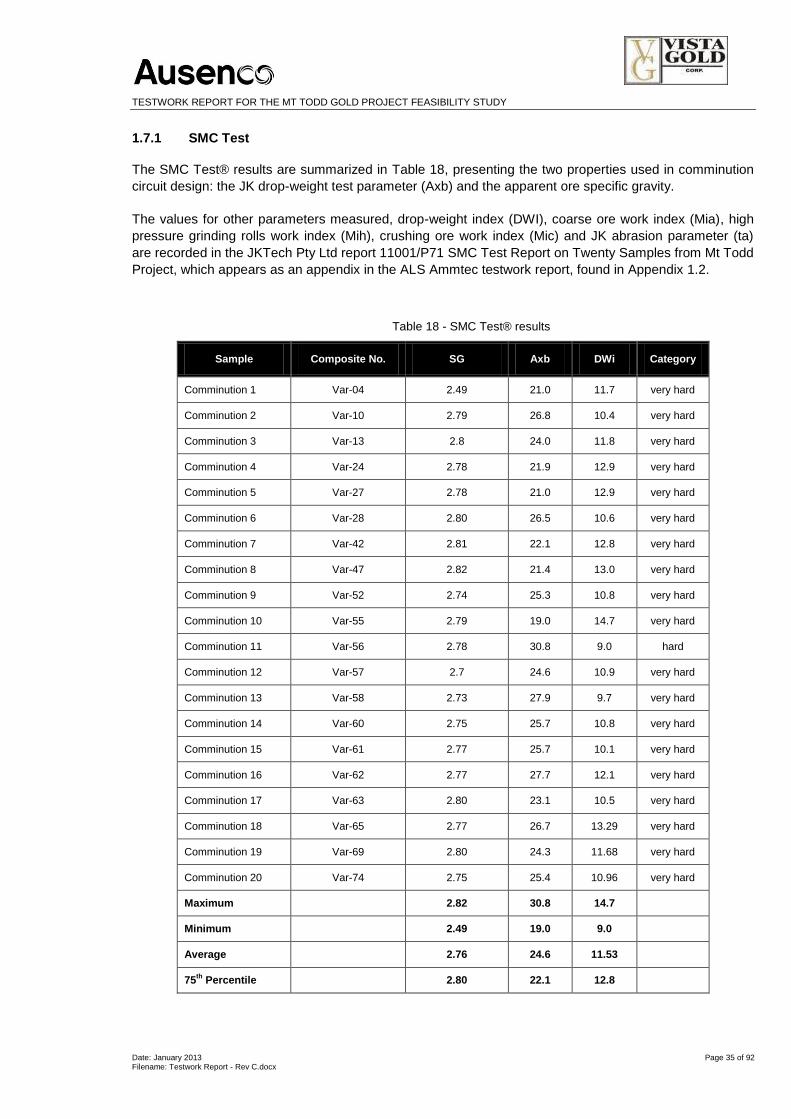
1.7.1 SMC Test
The SMC Test® results are summarized in Table 18, presenting the two properties used in comminution
circuit design: the JK drop-weight test parameter (Axb) and the apparent ore specific gravity.
The values for other parameters measured, drop-weight index (DWI), coarse ore work index (Mia), high
pressure grinding rolls work index (Mih), crushing ore work index (Mic) and JK abrasion parameter (ta)
are recorded in the JKTech Pty Ltd report 11001/P71 SMC Test Report on Twenty Samples from Mt Todd
Project, which appears as an appendix in the ALS Ammtec testwork report, found in Appendix 1.2.
Table 18 - SMC Test® results
Sample Composite No. SG Axb DWi Category
Comminution 1 Var-04 2.49 21.0 11.7 very hard
Comminution 2 Var-10 2.79 26.8 10.4 very hard
Comminution 3 Var-13 2.8 24.0 11.8 very hard
Comminution 4 Var-24 2.78 21.9 12.9 very hard
Comminution 5 Var-27 2.78 21.0 12.9 very hard
Comminution 6 Var-28 2.80 26.5 10.6 very hard
Comminution 7 Var-42 2.81 22.1 12.8 very hard
Comminution 8 Var-47 2.82 21.4 13.0 very hard
Comminution 9 Var-52 2.74 25.3 10.8 very hard
Comminution 10 Var-55 2.79 19.0 14.7 very hard
Comminution 11 Var-56 2.78 30.8 9.0 hard
Comminution 12 Var-57 2.7 24.6 10.9 very hard
Comminution 13 Var-58 2.73 27.9 9.7 very hard
Comminution 14 Var-60 2.75 25.7 10.8 very hard
Comminution 15 Var-61 2.77 25.7 10.1 very hard
Comminution 16 Var-62 2.77 27.7 12.1 very hard
Comminution 17 Var-63 2.80 23.1 10.5 very hard
Comminution 18 Var-65 2.77 26.7 13.29 very hard
Comminution 19 Var-69 2.80 24.3 11.68 very hard
Comminution 20 Var-74 2.75 25.4 10.96 very hard
Maximum 2.82 30.8 14.7
Minimum 2.49 19.0 9.0
Average 2.76 24.6 11.53
75th
Percentile 2.80 22.1 12.8

TESTWORK REPORT FOR THE MT TODD GOLD PROJECT FEASIBILITY STUDY
Date: January 2013 Page 36 of 92 Filename: Testwork Report - Rev C.docx
Table 18 shows the Batman ore is consistently very competent throughout the ore body, with the
following key points:
average SG of 2.76
75th percentile Axb value of 22.1
75th percentile DWi value of 12.8 kWh/m³.
1.7.2 Crushing Work Index Testwork on Selected Variability Composites
The results of the CWI tests on selected Batman variability samples are presented in Table 19.
Table 19 - CWI Results
Composite No. CWI ( kWh/t)
Var-04 7.5
Var-10 5.0
Var-13 4.7
Var-27 7.4
Var-42 5.3
Var-52 5.8
Var-57 8.4
Var-59 6.1
Table 19 includes:
maximum value of 8.4 kWh/t
minimum value of 4.7 kWh/t
average value of 6.3 kWh/t
75th percentile value of 7.4 kWh/t.
1.7.3 Unconfined Compressive Strength Tests on Selected Samples
The results of the UCS tests on samples from the MHT-001 and MHT-004 drill holes are presented in
Table 20.

TESTWORK REPORT FOR THE MT TODD GOLD PROJECT FEASIBILITY STUDY
Date: January 2013 Page 37 of 92 Filename: Testwork Report - Rev C.docx
Table 20 - UCS Results
Drill Hole Composite
Number UCS (MPa)
MHT-001 Var-56 127.1
MHT-001 Var-56 64.4
MHT-001 Var-57 69.8
MHT-001 Var-57 82.3
MHT-001 Var-58 39.4
MHT-001 Var-58 70.3
MHT-004 Var-58 120.0
MHT-004 Var-59 103.6
MHT-004 Var-59 131.8
MHT-004 Var-60 91.9
MHT-004 Var-60 174.2
MHT-004 Var-61 104.8
MHT-004 Var-61 182.3
MHT-004 Var-62 13.5
MHT-004 Var-62 54.9
MHT-004 Var-63 88.2
MHT-001 Var-63 127.1
Table 20 includes:
maximum value of 182.3 kWh/t
minimum value of 13.2 kWh/t
average value of 94.9 kWh/t
75th percentile value of 121.7 kWh/t.
1.7.4 Bond Ball Mill Work Index Tests on Comminution Composites
The results of the BWi tests on the Batman comminution samples at a 106 µm closing screen are
presented in Table 21.

TESTWORK REPORT FOR THE MT TODD GOLD PROJECT FEASIBILITY STUDY
Date: January 2013 Page 38 of 92 Filename: Testwork Report - Rev C.docx
Table 21 - BWi Results (106 µm closing screen)
Sample Composite No. BWI ( kWh/t)
Comminution 1 Var-04 25.0
Comminution 2 Var-10 24.8
Comminution 3 Var-13 27.7
Comminution 4 Var-24 24.4
Comminution 5 Var-27 26.6
Comminution 6 Var-28 27.7
Comminution 7 Var-42 24.6
Comminution 8 Var-47 26.3
Comminution 9 Var-52 28.0
Comminution 10 Var-55 25.5
Comminution 11 Var-56 27.4
Comminution 12 Var-57 28.1
Comminution 13 Var-58 27.6
Comminution 14 Var-60 27.8
Comminution 15 Var-61 28.2
Comminution 16 Var-62 25.1
Comminution 17 Var-63 26.7
Comminution 18 Var-65 24.6
Comminution 19 Var-69 23.6
Comminution 20 Var-74 24.9
Table 21 shows that there is little variability between the comminution samples. All samples displayed
above average hardness:
maximum value of 28.2 kWh/t
minimum value of 23.6 kWh/t
average value of 26.2 kWh/t
75th percentile value of 27.7 kWh/t.

TESTWORK REPORT FOR THE MT TODD GOLD PROJECT FEASIBILITY STUDY
Date: January 2013 Page 39 of 92 Filename: Testwork Report - Rev C.docx
1.7.5 Bond Ball Mill Work Index Tests on Master Composite at Various Closing Screen Sizes
The results of the BWi tests on the master composite at different closing screen sizes are shown in Table
22 and represented graphically in Figure 4.
Table 22 - BWI at different closing screen sizes for the master composite sample
Sample Closing screen
size (µm)
BWi
( kWh/t)
Master composite 75 24.1
Master composite 106 25.1
Master composite 150 26.2
Master composite 212 28.0
Master composite 300 30.5
Figure 4 - Closing screen size versus average BWi for master composite sample
The plot of Bond Ball Mill work index (‘BWi’) versus closing screen aperture shown in Figure 4 indicates
that the Mt Todd Batman ore exhibits an unconventional trend whereby the BWi values decrease as the
closing screen size (and the corresponding grind size) decreases. More typically, the BWi increases with
fineness of grind (decreasing closing screen size).
This atypical relationship of BWi to fineness of grind has significant implications for modelling of the
comminution circuit and the determination of the optimum grind size. While unconventional, this
relationship has been observed previously by ALS Ammtec at several operations in the Eastern
Goldfields of Western Australia and therefore is not unique to the Batman ore.
For this reason an additional phase of test work was undertaken on available variability samples to
determine if this ‘inverse’ trend was consistent across the Batman deposit.
20
22
24
26
28
30
32
0 50 100 150 200 250 300 350
BW
I, k
Wh
/t
Closing Screen Size, µm

TESTWORK REPORT FOR THE MT TODD GOLD PROJECT FEASIBILITY STUDY
Date: January 2013 Page 40 of 92 Filename: Testwork Report - Rev C.docx
1.7.6 Additional Bond Ball Mill Work Index Tests on Variability Composites
The objective of the additional BWi tests on the variability composite samples at various closing screen
apertures was to strengthen the database of BWi results and to determine whether the unconventional
trend observed in Figure 4 is consistent across the Batman deposit. The results of this test work are
summarised in Table 23.
Table 23 - BWI at different closing screen sizes for various variability samples
Closing Screen Size μm
75 106 125 150 180 212 300
P80, μm 53 75 90 106 125 150 212
Var-4 - - 24.2 24.4 25.0 25.3 -
Var-10 - - - - 24.8 - -
Var -13 - - - - 26.8 29.1 -
Var -24 - - - 23.4 24.4 25.0 -
Var -27 - - 26.3 26.5 27.8 28.5 -
Var -28 25.9 26.1 26.6 27.2 26.7 27.7 29.9
Var - 42 - - - - 25.4 - -
Var - 47 - - - 27.0 27.6 - -
Var - 52 - - - - 27.3 - -
Var - 55 22.9 23.7 23.5 24.2 25.8 26.8 28.2
Var - 56 - - - 27.9 28.3 29.0 -
Var - 57 - - - 27.6 27.9 28.5 -
Var - 58 - - - 27.6 27.4 28.8 -
Var - 60 - - - 25.8 25.9 27.4 -
Var - 61 - - - - 27.4 - -
Var - 62 - - - 26.5 25.1 26.3 -
Var - 65 - - - 24.5 24.4 26.0 -
Var - 69 - - - 23.6 24.6 25.1 -
Var - 74 - - 23.5 23.6 23.8 24.6 26.5
Min 22.9 23.7 23.5 23.4 23.8 24.6 26.5
Max 25.9 26.1 26.6 27.6 28.3 29.1 29.9
Ave 24.4 24.9 24.8 25.7 26.1 27.0 28.2
75th Percentile 25.2 25.5 26.3 27.2 27.4 28.5 29.0
The average BWI for each closing screen size is plotted in Figure 5.

TESTWORK REPORT FOR THE MT TODD GOLD PROJECT FEASIBILITY STUDY
Date: January 2013 Page 41 of 92 Filename: Testwork Report - Rev C.docx
Figure 5 - Closing screen size versus average BWi for variability samples
Figure 5 confirms a strong trend whereby BWi increases with closing screen size.
1.7.7 Comminution Testwork on HPGR Product
BWi results on MHT-001 and MHT-004 HPGR Product Samples, Polysius
Further comminution test work was completed by Polysius to determine the effect of high pressure
grinding on the BWi. High pressure grinding often produces micro-cracks in the progeny particles,
reducing the overall particle strength and generating a greater distribution of fine material in the ball mill
feed which in turn reduces the downstream ball mill energy requirements.
In theory, this should result in a reduced BWi for material that has been treated in a HPGR compared to
conventionally crushed product. The results of this testwork are summarised in Table 24, comparing the
BWi of HPGR product against a conventionally crushed product. Feed and product particle size
distributions for the MHT-001 and MHT-004 samples are shown in Figure 6 and Figure 7. Note that this
testwork was undertaken using a 200 µm closing sieve, before the determination of the optimum grind
size.
Table 24 - Bond Work Index (200 µm closing screen), HPGR Product vs. Conventionally Crushed feed, Polysius
Sample Conventional Crushing
BWi (kWh/t)
HPGR
BWi (kWh/t)
MHT-001 27.1 25.1
MHT-004 - 25.7 24.5
24.0
24.5
25.0
25.5
26.0
26.5
27.0
27.5
28.0
28.5
29.0
0.0 50.0 100.0 150.0 200.0 250.0
Ave
rage
BW
I, k
Wh
/t
Closing Screen Size, µm

TESTWORK REPORT FOR THE MT TODD GOLD PROJECT FEASIBILITY STUDY
Date: January 2013 Page 42 of 92 Filename: Testwork Report - Rev C.docx
Figure 6 - MHT-001 Feed and Product Size Distributions
Figure 7 - MHT-004 Feed and Product Size Distributions
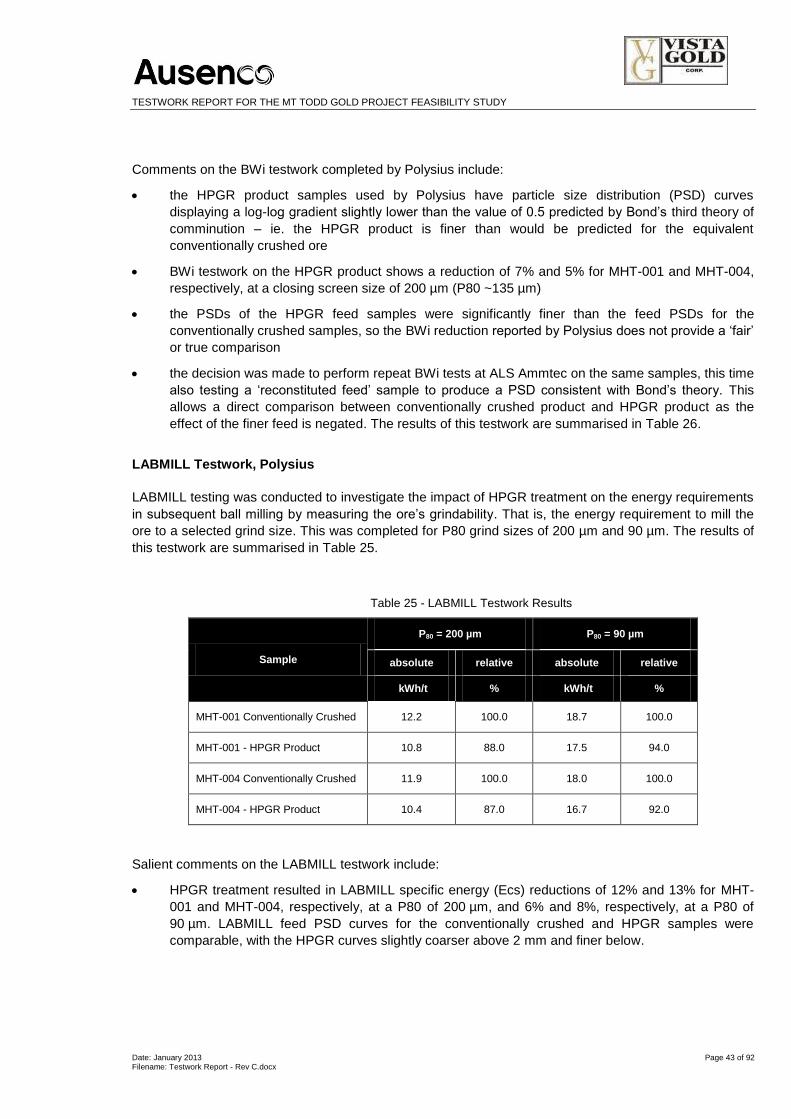
TESTWORK REPORT FOR THE MT TODD GOLD PROJECT FEASIBILITY STUDY
Date: January 2013 Page 43 of 92 Filename: Testwork Report - Rev C.docx
Comments on the BWi testwork completed by Polysius include:
the HPGR product samples used by Polysius have particle size distribution (PSD) curves
displaying a log-log gradient slightly lower than the value of 0.5 predicted by Bond’s third theory of
comminution – ie. the HPGR product is finer than would be predicted for the equivalent
conventionally crushed ore
BWi testwork on the HPGR product shows a reduction of 7% and 5% for MHT-001 and MHT-004,
respectively, at a closing screen size of 200 µm (P80 ~135 µm)
the PSDs of the HPGR feed samples were significantly finer than the feed PSDs for the
conventionally crushed samples, so the BWi reduction reported by Polysius does not provide a ‘fair’
or true comparison
the decision was made to perform repeat BWi tests at ALS Ammtec on the same samples, this time
also testing a ‘reconstituted feed’ sample to produce a PSD consistent with Bond’s theory. This
allows a direct comparison between conventionally crushed product and HPGR product as the
effect of the finer feed is negated. The results of this testwork are summarised in Table 26.
LABMILL Testwork, Polysius
LABMILL testing was conducted to investigate the impact of HPGR treatment on the energy requirements
in subsequent ball milling by measuring the ore’s grindability. That is, the energy requirement to mill the
ore to a selected grind size. This was completed for P80 grind sizes of 200 µm and 90 µm. The results of
this testwork are summarised in Table 25.
Table 25 - LABMILL Testwork Results
Sample
P80 = 200 µm P80 = 90 µm
absolute relative absolute relative
kWh/t % kWh/t %
MHT-001 Conventionally Crushed 12.2 100.0 18.7 100.0
MHT-001 - HPGR Product 10.8 88.0 17.5 94.0
MHT-004 Conventionally Crushed 11.9 100.0 18.0 100.0
MHT-004 - HPGR Product 10.4 87.0 16.7 92.0
Salient comments on the LABMILL testwork include:
HPGR treatment resulted in LABMILL specific energy (Ecs) reductions of 12% and 13% for MHT-
001 and MHT-004, respectively, at a P80 of 200 µm, and 6% and 8%, respectively, at a P80 of
90 µm. LABMILL feed PSD curves for the conventionally crushed and HPGR samples were
comparable, with the HPGR curves slightly coarser above 2 mm and finer below.
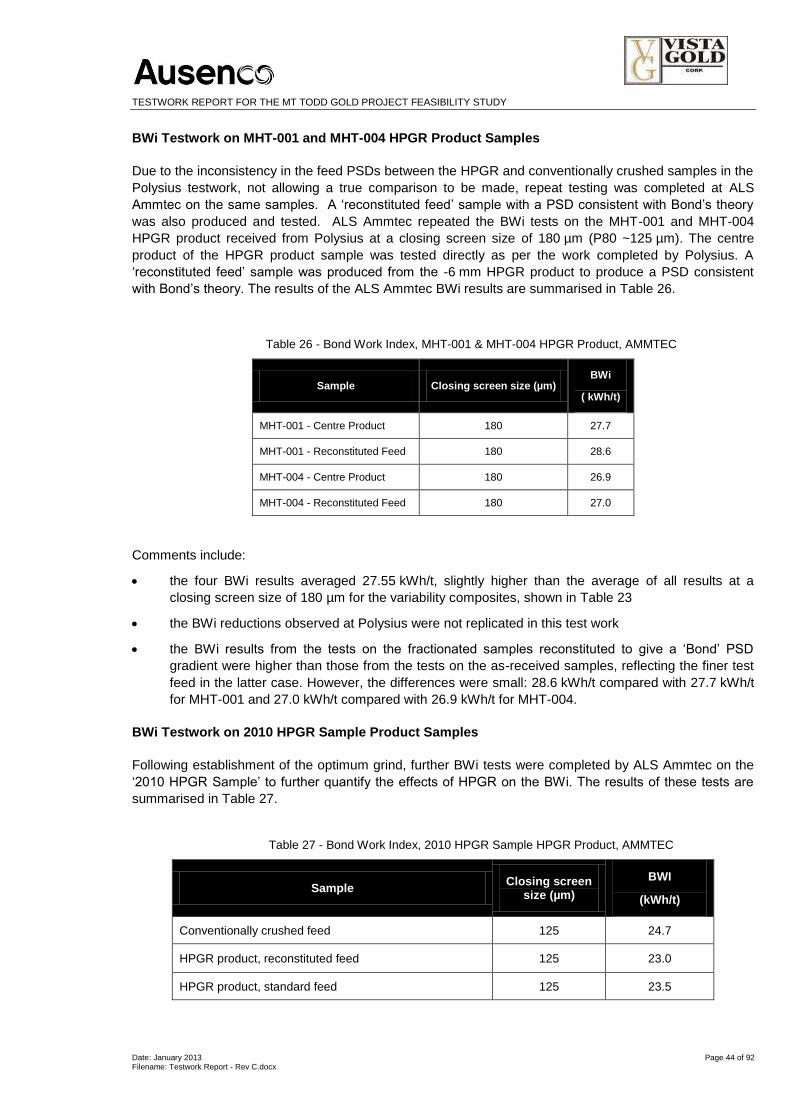
TESTWORK REPORT FOR THE MT TODD GOLD PROJECT FEASIBILITY STUDY
Date: January 2013 Page 44 of 92 Filename: Testwork Report - Rev C.docx
BWi Testwork on MHT-001 and MHT-004 HPGR Product Samples
Due to the inconsistency in the feed PSDs between the HPGR and conventionally crushed samples in the
Polysius testwork, not allowing a true comparison to be made, repeat testing was completed at ALS
Ammtec on the same samples. A ‘reconstituted feed’ sample with a PSD consistent with Bond’s theory
was also produced and tested. ALS Ammtec repeated the BWi tests on the MHT-001 and MHT-004
HPGR product received from Polysius at a closing screen size of 180 µm (P80 ~125 µm). The centre
product of the HPGR product sample was tested directly as per the work completed by Polysius. A
‘reconstituted feed’ sample was produced from the -6 mm HPGR product to produce a PSD consistent
with Bond’s theory. The results of the ALS Ammtec BWi results are summarised in Table 26.
Table 26 - Bond Work Index, MHT-001 & MHT-004 HPGR Product, AMMTEC
Sample Closing screen size (µm) BWi
( kWh/t)
MHT-001 - Centre Product 180 27.7
MHT-001 - Reconstituted Feed 180 28.6
MHT-004 - Centre Product 180 26.9
MHT-004 - Reconstituted Feed 180 27.0
Comments include:
the four BWi results averaged 27.55 kWh/t, slightly higher than the average of all results at a
closing screen size of 180 µm for the variability composites, shown in Table 23
the BWi reductions observed at Polysius were not replicated in this test work
the BWi results from the tests on the fractionated samples reconstituted to give a ‘Bond’ PSD
gradient were higher than those from the tests on the as-received samples, reflecting the finer test
feed in the latter case. However, the differences were small: 28.6 kWh/t compared with 27.7 kWh/t
for MHT-001 and 27.0 kWh/t compared with 26.9 kWh/t for MHT-004.
BWi Testwork on 2010 HPGR Sample Product Samples
Following establishment of the optimum grind, further BWi tests were completed by ALS Ammtec on the
‘2010 HPGR Sample’ to further quantify the effects of HPGR on the BWi. The results of these tests are
summarised in Table 27.
Table 27 - Bond Work Index, 2010 HPGR Sample HPGR Product, AMMTEC
Sample Closing screen
size (µm)
BWI
(kWh/t)
Conventionally crushed feed 125 24.7
HPGR product, reconstituted feed 125 23.0
HPGR product, standard feed 125 23.5

TESTWORK REPORT FOR THE MT TODD GOLD PROJECT FEASIBILITY STUDY
Date: January 2013 Page 45 of 92 Filename: Testwork Report - Rev C.docx
Comments include:
the BWi of the conventionally crushed product at a closing screen size of 125 µm (90 µm P80) was
24.7 kWh/t, very similar to the average value of 24.8 kWh/t from the variability test program,
summarised in Table 23
the BWi for the HPGR product from standard feed is approximately 2% higher than that of the
reconstituted feed sample, in contrast to the lower results observed in the previous ALS Ammtec
work summarised in Table 26. However, the differences are too small to suggest any sort of trend
and indicate there is no need to prepare reconstituted feed samples to produce a Bond PSD for
any future BWi testwork completed on Batman ores
the difference between the average BWi value of 23.25 kWh/t for the HPGR product and that of the
conventionally crushed product (24.7 kWh/t) is about 6%, and this is consistent with the grind
establishment results that indicated an 8% reduction in ball milling specific energy for HPGR
product.
Grind Establishment Tests
Grind establishment tests were performed to determine the grinding time to achieve P80 values of 90 µm
and 106 µm for both conventionally crushed mill feed and HPGR product mill feed. The results are
summarised in Table 28.
Table 28 - Grind establishment tests, conventionally crushed verses HPGR product
Sample Feed size Target grind size Time
mm P80 (μm) min:sec
2010 HPGR Sample - HPGR Product < 3.35 106 16:01
90 17:27
2010 HPGR Sample - Conventionally Crushed < 3.35 106 17:45
90 18:53
Comments include:
the grind establishment tests reveal the grind time required to achieve a P80 of 106 µm is about
11% less for material that has been treated with a HPGR compared to conventionally crushed
material
there is an 8% reduction in grind time required to achieve a P80 of 90 µm
while not a true measure of power input, these results support the findings from the BWi testwork.
Summary
The effect was examined of HPGR treatment on Bond ball mill work index (BWi) and ball milling specific
energy, with a view to determining ball milling power requirements in an HPGR-based circuit treating
Batman ores. Milling specific energy requirements are affected by both the increased fineness and the
reduction in work index typically observed in HPGR products.
TESTWORK REPORT FOR THE MT TODD GOLD PROJECT FEASIBILITY STUDY
Date: January 2013 Page 46 of 92 Filename: Testwork Report - Rev C.docx
Work Index
The Polysius interpretation of their testwork results indicates BWi reductions of 7 and 5% for MHT-
001 and MHT-004, respectively, at 200 µm closing sieve
The Polysius interpretation was queried as it took no account of the finer feed used for BWi testing
in the HPGR part of the testwork. AMMTEC conducted parallel testwork to examine this effect
The AMMTEC testwork, on the same samples as used by Polysius but at a slightly finer closing
sieve of 180 µm, returned the following results:
- There were measurable but statistically insignificant BWi differences (0.3-3.2%) between the HPGR product samples as received from Polysius and samples reconstituted to produce 'Bond' sizing curves, with the latter displaying the higher values as expected
- The HPGR product BWi results were all slightly higher than the results from previous AMMTEC tests on conventionally crushed samples at the same closing sieve size, hence
- The BWi reductions indicated by Polysius were not replicated in the AMMTEC tests.
Following the determination of the optimum grind size, AMMTEC conducted further BWi tests
comparing HPGR and conventionally crushed samples, using the '2010 HPGR Sample' and a
125 µm closing sieve. In contrast to the tests at 180 µm sieve, these tests indicated a BWi
reduction of 6%, closely replicating the Polysius findings at 200 µm sieve.
Specific Energy
Polysius conducted comparative LABMILL tests on HPGR and conventionally crushed
products. At the 90 µm P80 grind size subsequently determined to be the optimum for this project,
specific energy reductions of 6 and 8% were measured for MHT-001 and MHT-004, respectively
In grind establishment tests conducted by AMMTEC at the 90 µm P80 optimum grind size, a
grinding time reduction of 8% was measured. This translates to an 8% milling specific energy
reduction for the HPGR product.
Conclusion - Impact of HPGR on Ball Milling
The inclusion of an HPGR in comminution circuits has typically resulted in a reduction in ball milling
specific energy (compared to conventionally crushed mill feed) due to the combined effects of a finer ball
mill feed and micro-cracking within particles. The increased fines reduce the amount of material to be
ground in the ball mill and the “micro-cracking” materialising as a reduction in BWi.
Energy reductions of up to 50% have been recorded in laboratory tests4, although more typically values
in the range of 5% to 15% are seen. In the case of the Batman ore, the potential benefit of 6% to 8% is at
the lower end of the typical range. The ALS-Ammtec tests on the Polysius samples did not replicate the
Polysius findings of a 5-7% BWi reduction, showing no significant difference between HPGR and
conventionally crushed products. However, subsequent ALS-Ammtec tests at the optimum grind size
returned a value of 6% for BWi reduction due to HPGR treatment.
4 Baum, W. (1998). HPGR as a processing tool for gold & copper leaching, flotation and gravity separation, Raw Material Technology
Seminar, Tucson, 1998
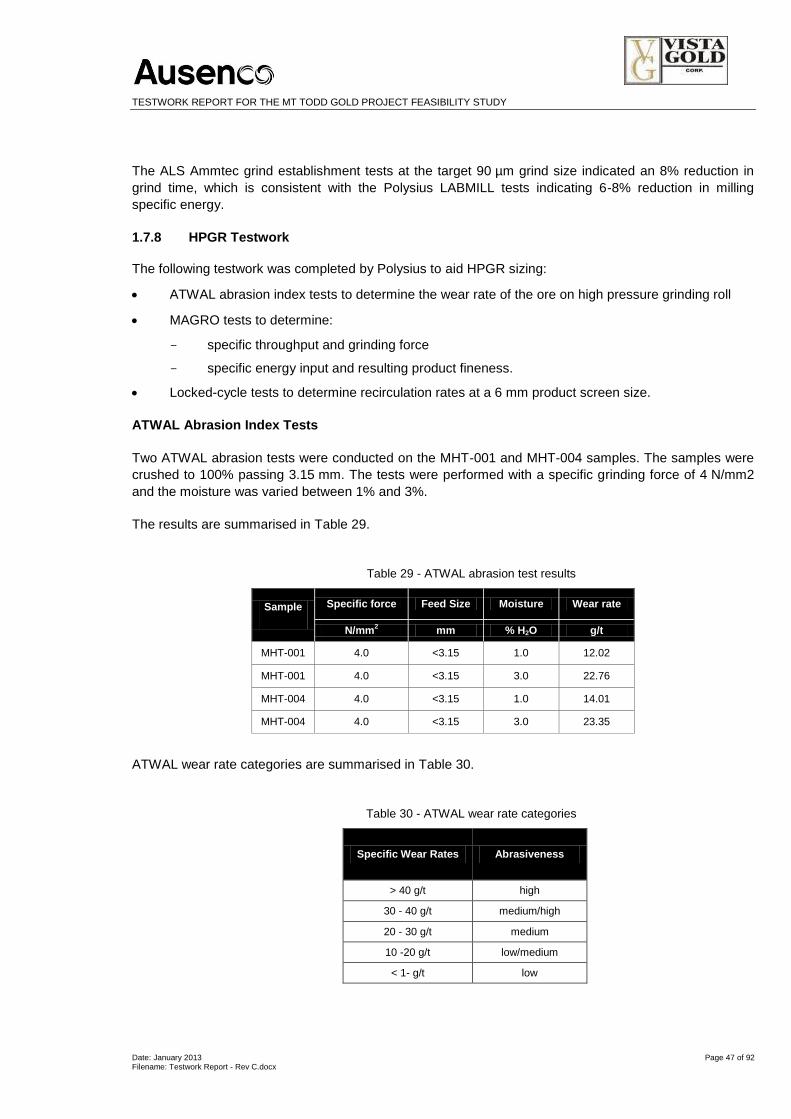
TESTWORK REPORT FOR THE MT TODD GOLD PROJECT FEASIBILITY STUDY
Date: January 2013 Page 47 of 92 Filename: Testwork Report - Rev C.docx
The ALS Ammtec grind establishment tests at the target 90 µm grind size indicated an 8% reduction in
grind time, which is consistent with the Polysius LABMILL tests indicating 6-8% reduction in milling
specific energy.
1.7.8 HPGR Testwork
The following testwork was completed by Polysius to aid HPGR sizing:
ATWAL abrasion index tests to determine the wear rate of the ore on high pressure grinding roll
MAGRO tests to determine:
- specific throughput and grinding force
- specific energy input and resulting product fineness.
Locked-cycle tests to determine recirculation rates at a 6 mm product screen size.
ATWAL Abrasion Index Tests
Two ATWAL abrasion tests were conducted on the MHT-001 and MHT-004 samples. The samples were
crushed to 100% passing 3.15 mm. The tests were performed with a specific grinding force of 4 N/mm2
and the moisture was varied between 1% and 3%.
The results are summarised in Table 29.
Table 29 - ATWAL abrasion test results
Sample Specific force Feed Size Moisture Wear rate
N/mm2 mm % H2O g/t
MHT-001 4.0 <3.15 1.0 12.02
MHT-001 4.0 <3.15 3.0 22.76
MHT-004 4.0 <3.15 1.0 14.01
MHT-004 4.0 <3.15 3.0 23.35
ATWAL wear rate categories are summarised in Table 30.
Table 30 - ATWAL wear rate categories
Specific Wear Rates Abrasiveness
> 40 g/t high
30 - 40 g/t medium/high
20 - 30 g/t medium
10 -20 g/t low/medium
< 1- g/t low

TESTWORK REPORT FOR THE MT TODD GOLD PROJECT FEASIBILITY STUDY
Date: January 2013 Page 48 of 92 Filename: Testwork Report - Rev C.docx
Based on the results presented in Table 29, both the MHT-001 and MHT-004 samples have low/medium
abrasiveness at 1% moisture and a medium abrasiveness at 3% moisture. The two samples showed
similar results at the tested moisture levels.
MAGRO Tests
The MAGRO test results are summarised in Table 31.
Table 31 - Summary of MAGRO semi-industrial scale test results
Sample Magro Test
Cycle Feed Size (mm)
Feed Moisture
(%)
Specific Force
( N/mm2)
Specific Energy ( kWh/t)
Net Absorbed
Power ( kW)
Specific Throughput
(ts/(m3h))
MHT-001 M1 Single Pass
-31.5 3.0 2.50 1.33 24.95 282.7
MHT-001 M2 / M2.1
Single Pass
-31.5 3.0 3.69 1.91 33.89 267.9
MHT-001 M3 Single Pass
-31.5 3.0 4.71 2.31 39.48 259.1
MHT-001 M4 Single Pass
-31.5 1.0 3.80 2.03 37.13 276.3
MHT-004 M1 Single Pass
-31.5 3.0 2.49 1.53 28.65 284.0
MHT-004 M2 / M2.1
Single Pass
-31.5 3.0 3.98 2.07 38.33 280.5
MHT-004 M3 Single Pass
-31.5 3.0 4.76 2.40 43.61 274.1
MHT-004 M4 Single Pass
-31.5 1.0 3.58 1.88 33.85 273.0
MHT-001; M2.1 S/O + Fresh Feed
M2.2 Locked Cycle
-31.5 3.0 3.62 1.98 35.12 268.3
MHT-001; M2.2 S/O + Fresh Feed
M2.3 Locked Cycle
-31.5 3.0 3.51 1.93 34.53 270.3
MHT-004; M2.1 S/O + Fresh Feed
M2.2 Locked Cycle
-31.5 3.0 3.68 1.97 35.61 273.4
The following conclusions were drawn from the MAGRO test results presented in Table 31:
the specific throughput was very similar for both the MHT-001 and MHT-004 samples, varying
between 259 and 283 t*s/m3*h for MHT-001 and between 272 and 284 t*s/m3*h for MHT-004
moisture content did not impact on the specific throughput rate
the specific energy consumption varied between 1.33 and 2.31 kWh/t for MHT-001 and between
1.53 and 2.40 kWh/t for MHT-004, depending on the applied specific press force and moisture
at a standard press force of 3.5 N/mm2 the specific energy consumption was 1.8 kWh/t for MHT-
001 and 1.9 kW/t for MHT-004.
TESTWORK REPORT FOR THE MT TODD GOLD PROJECT FEASIBILITY STUDY
Date: January 2013 Page 49 of 92 Filename: Testwork Report - Rev C.docx
Product Fineness Tests
Polysius made the following conclusions on product fineness for the Batman ore:
for MHT-001, a product fineness of approximately 67% <6.3 mm, 27% <1 mm and 12% <200 µm
was achieved in a single pass through the MAGRO machine from a feed of <31.5 mm at a specific
press force of 3.5 N/mm2
for MHT-004, a product fineness of approximately 65% <6.3 mm, 25% <1 mm and 11% <200 µm
was achieved in a single pass through the MAGRO machine from a feed of < 31.5 mm at a specific
press force of 3.5 N/mm2.
Locked Cycle Tests
Polysius made the following conclusions from the locked cycle tests performed on the Batman ore:
the percentage of screen undersize was fairly constant during the three cycles, indicating that the
steady state conditions were achieved in three cycles
the circulation factor required to produce a 6 mm product (P80 = 3.25 mm) was 1.9 for MHT-001
and 2.0 for MHT-004. The required specific energy input (based on new feed) was 3.7 kWh/t for
MHT-001 and 3.9 kWh/t for MHT-004.
1.7.9 Optimum Grindsize
Comparative cyanide leach tests were completed investigating the effect of grind size on gold dissolution
for the master composite sample. Two grind optimisation exercises were completed, with the initial grind
optimisation test work undertaken early in the test work program using preliminary comminution and
financial data to determine the grind size to be used in the subsequent leach optimisation test work.
The second grind optimisation test work program was undertaken at the completion of the leach
optimisation test work using improved comminution data (incorporating the atypical trend in BWi vs. grind
size for the Batman ore) and updated financial data. The outcomes of this final grind optimisation were
used for ball mill sizing and for final variability leach test work.
Initial Grind Optimisation
The objective of the initial grind optimisation test work was to determine the grind size to be used for the
leach optimisation testwork and for preliminary ball mill sizing calculations.
The standard conditions for the initial grind optimisation leach tests were:
initial pH of 11 adjusted with 60% available CaO
55% w/w solids using Perth tap water
oxygen sparging to maintain dissolved oxygen (DO) level >10 ppm
24 hour leach with solution assays at 1, 2, 4, 6, 8, 12 and 24 hours
activated carbon was added after 4 hours
initial cyanide concentration of 0.10% w/v maintained at > 0.05% w/v.
The results are summarised in Table 32.

TESTWORK REPORT FOR THE MT TODD GOLD PROJECT FEASIBILITY STUDY
Date: January 2013 Page 50 of 92 Filename: Testwork Report - Rev C.docx
Table 32 - Initial grind optimisation tests
Composite Target P80 Grind
Size (µm)
Extraction % Au
Reference Test
8 h 12 h 24 h
Master composite 212 72.7 72.7 72.7 Average of WH3788 &
WH37893
Master composite 150 76.5 78.1 78.1 Average of WH3789 &
WH37894
Master composite 106 80.3 80.3 80.3 Average of WH3790 &
WH37895
Master composite 75 83.5 84.3 84.3 Average of WH3791 &
WH37896
Master composite 53 84.5 85.4 85.4 Average of WH3792 &
WH37896
The resultant gold leach curves for each grind size are presented in Figure 8.
Figure 8 - Master composite leach kinetics at various grind P80 sizes, initial grind optimisation
While a detailed cost benefit analysis is required to determine the optimum grind size and leach time,
there is a noticeable trend of increasing gold extraction with fineness of grind. The leach results in Table
32 indicate that leaching is complete after 8 hours. However, these results should be viewed with caution,
as carbon adsorption is not efficient at such low residence times in full scale operation. Also, the results of
the variability test work campaign showed an average increase of 2% gold extraction between 8 and
24 hours leach time. On this basis, the 24 hours leach residence has been maintained for the CIL design
as per the 2010 feasibility study.
0
10
20
30
40
50
60
70
80
90
0 5 10 15 20 25 30
Go
ld E
xtra
ctio
n, %
Leach Residence Time, hours
212 µm
150 µm
106 µm
75 µm
53 µm

TESTWORK REPORT FOR THE MT TODD GOLD PROJECT FEASIBILITY STUDY
Date: January 2013 Page 51 of 92 Filename: Testwork Report - Rev C.docx
Gold extraction and cyanide/lime consumptions from the grind optimisation leach tests were used to
calculate the incremental increases in revenue (due to increased gold recovery). These were then used
in a cash flow model with the incremental increases in operating and capital costs incurred by grinding
finer than a P80 of 212 µm. The cash flows were used to calculate comparative net present values
(NPV’s) for each grind size.
The assessment used a gold price of A$1023/oz (as applied in the 2010 feasibility study) and a BWi of
27.7 kWh/t (75th percentile of the results outlined in Table 21). At the time this initial grind optimisation
test work was completed, there was insufficient BWi data available to indicate and confidently determine
the atypical trend between BWi and grind size.
The results of the NPV analysis for the optimum grind are summarised in Figure 9.
Figure 9 - Initial Grind Optimisation NPV Analysis
The results of the initial grind optimisation exercise were:
gold recovery from all ore types is grind sensitive between P80 sizes of 53 µm and 212 µm
there is no benefit in leaching beyond 24 hours
a grind P80 of 125 µm was indicated as optimum.
A grind P80 of 125 µm and a leach residence time of 24 hours were selected for the leach optimisation
test work.
-60
-40
-20
0
20
40
60
50 70 90 110 130 150 170 190 210 230
Net
Pre
sen
t V
alu
e, U
SD
M
Grind P80 size, um

TESTWORK REPORT FOR THE MT TODD GOLD PROJECT FEASIBILITY STUDY
Date: January 2013 Page 52 of 92 Filename: Testwork Report - Rev C.docx
Final Grind Optimisation
The objective of the final grind optimisation test work was to use the fresh comminution data
(incorporating the trend in BWi vs. grind size and the 8% reduction in milling specific energy due to HPGR
crushing) and an updated market gold price to determine the optimum grind size allowing the ball mill
sizing to be finalized, as well as for the final variability leach testwork.
The standard conditions for the final grind optimisation leach tests were:
initial pH of 11 adjusted with 60% available CaO
60% w/w solids using Perth tap water
air sparging
48 hour leach with solution assays at 1, 2, 4, 6, 8, 12, 24, 36 and 48 hours
activated carbon was added at the start of the leach cycle
100 g/t lead nitrate addition
initial cyanide concentration of 0.05% w/v maintained at > 0.025% w/v.
The results are summarised in Table 33.
Table 33 - Final grind optimisation tests
Composite Target P80 Grind
Size (µm)
Extraction % Au
Reference Test
24 h 36 h 48 h
Master composite 150 75.4 75.4 77.4
Average of WH4455 & WH4456
Master composite 125 78.8 78.8 78.8
Average of WH4457 & WH4458
Master composite 106 79.6 79.6 81.9
Average of WH4459 & WH4460
Master composite 90 82.4 82.4 83.0
Average of WH4461 & WH4462
Master composite 75 82.8 83.3 83.7
Average of WH4463 & WH4464
The gold leach curve is presented in Figure 10.

TESTWORK REPORT FOR THE MT TODD GOLD PROJECT FEASIBILITY STUDY
Date: January 2013 Page 53 of 92 Filename: Testwork Report - Rev C.docx
Figure 10 - Master composite leach kinetics at various grind P80 sizes, final grind optimisation
As per the initial grind optimisation leach tests, there is a noticeable trend with increasing gold extraction
with fineness of grind.
For the final grind optimisation exercise, a gold price of A$1200/oz was provided by Vista and used in the
cash flow models. The updated comminution data was incorporated to estimate the power requirements
of the ball mill for each grind size. The results, which have been reported separately, (refer to document
2027-RPT-001 Mt Todd Gold ECS Grind Optimisation Report in Appendix 1.3), and are summarised in
Table 34. The results of the NPV analysis are summarised in Figure 11.
Figure 11 - Final Grind Optimisation NPV Analysis
0
10
20
30
40
50
60
70
80
90
0 10 20 30 40 50
Go
ld E
xtra
ctio
n, %
Leach Residence Time, hours
150 µm
125 µm
106 µm
90 µm
75 µm
-60.0
-40.0
-20.0
0.0
20.0
40.0
60.0
80.0
100.0
120.0
140.0
50 60 70 80 90 100110120130140150160170180190200210220230
Net
Pre
sen
t V
alu
e, U
SD
M
Grind P80 size, um
24 hours
36 hours
48 hours

TESTWORK REPORT FOR THE MT TODD GOLD PROJECT FEASIBILITY STUDY
Date: January 2013 Page 54 of 92 Filename: Testwork Report - Rev C.docx
The results of the final grind optimisation exercise were:
gold recovery from all ore types is grind sensitive between P80 sizes of 53 µm and 212 µm
gold continues to leach up to 48 hours, although there is little benefit beyond 24 hours
the optimum grind P80 is 90 µm.
A grind P80 of 90 µm and a leach residence time of 24 hours were consequently selected for the Mt Todd
project.
Table 34 - Comparative NPV for Batman ores at various grind sizes and leach times
Grind Size, P80 (µm) NPV, (A$ millions)
24 h leach 36 h leach 48 h leach
53 80.1 78.8 14.2
60 98.6 98.1 34.0
65 107.8 106.9 44.2
75 119.2 117.3 57.5
90 121.0 117.6 62.2
106 116.2 111.2 60.4
125 103.6 96.7 51.4
150 79.6 70.1 32.1
212 0.0 -15.7 -35.7
1.7.10 Comminution Design Criteria
The comminution design criteria selected from the 2011 test work program are summarised in Table 35.
Table 35 - Comminution circuit design criteria
Parameter Unit Value Source
Grind size µm 90 Section 1.7
Ore SG5 t/m3 2.76 Average of Table 18
Axb 22.1 75th percentile of Table 18
CWi kWh/t 7.4 75th percentile of Table 19
RWi kWh/t 22.6 PFS
BWi kWh/t 26.3 75
th percentile of Table 23for closing
screen size of 125 µm
UCS MPa 121.7 75th percentile of Table 20
Milling specific energy reduction due to HPGR % 8 Section 1.7.7
Ai g 0.135 2010 feasibility study
5Specific gravity measured in SMC Test
® is an apparent density not a true density and is only used in grinding power calculations.

TESTWORK REPORT FOR THE MT TODD GOLD PROJECT FEASIBILITY STUDY
Date: January 2013 Page 55 of 92 Filename: Testwork Report - Rev C.docx
1.8 Leach Optimisation
The leach optimisation test work was undertaken following completion of the initial grind optimisation
exercise, as outlined in Section 1.7.9. This initial grind optimisation exercise identified the target grind size
P80 of 125 µm. The majority of the 2011 test work, including all of the leach optimisation test work, was
performed at the initial optimum grind size P80 of 125 µm. Although the grind size P80 of 90 µm was later
deemed to be optimal, the conclusions derived from this test work remain applicable.
The leach optimisation tests aimed to identify the optimal conditions at which to operate the CIL circuit,
including pre-aeration time, by examining:
sparging method – air injection or oxygen injection
cyanide concentration
pulp density
lead nitrate addition
pre-conditioning with lime
residence time.
The results of the test work are summarised in Sections 1.8.1 to 1.8.7.
1.8.1 Pre-Aeration Tests
Comparative leach tests were conducted on the master composite sample to investigate the effect of pre-
aeration on cyanide consumption and leach kinetics. Pre-aeration is defined here as the addition of either
air or oxygen to the pulp prior to cyanidation. The pre-aeration tests were completed prior to any grind
optimisation exercise, thus the 2010 feasibility study primary grind size of 150 µm was selected for these
tests. The variable tested was pre-leach aeration time of zero and 4 hours.
The standard conditions for each leach test were:
grind P80 = 150 µm
pre-aeration time of 0 and 4 hours
initial pre-aeration and leach pH of 11 adjusted with 60% available CaO
initial cyanide concentration of 0.10% maintained at >0.05%
55% w/w solids using Perth tap water
pre-leach oxygen sparging to maintain DO level >10 ppm
leach oxygen-sparging to maintain DO level >10 ppm
24 hour leach with solution assays at 1, 2, 4, 6, 8, 12 and 24 hours.
The results are summarised in Table 36. The leach kinetics are shown in Figure 12.

TESTWORK REPORT FOR THE MT TODD GOLD PROJECT FEASIBILITY STUDY
Date: January 2013 Page 56 of 92 Filename: Testwork Report - Rev C.docx
Table 36 - Pre-aeration Tests
Pre-leach aeration time
Extraction % Au
Extraction % Cu
Consumption Reference Test
(h) 8 h 12 h 24 h 24 h NaCN (kg/t)
Lime (kg/t)
0 75.9 77.4 77.4 8.5 0.88 0.31 WH3789
0 77.2 78.8 78.8 9.9 0.86 0.31 WH3794
4 78.2 78.2 78.2 7.3 0.73 0.57 WH3798
4 78.5 78.5 78.5 7.7 0.74 0.55 WH3799
Figure 12 - The effect of pre-aeration on leach kinetics
Comments on pre-aeration include:
pre-aeration does not affect the leach kinetics of gold for the Batman ore
pre-aeration decreased the leach extraction of copper by approximately 1.5%
there is a small improvement in cyanide consumption in the tests using pre-aeration of
approximately 0.1 kg/t
lime consumption increased by approximately 0.25 kg/t when including a 4-hour pre-aeration step.
Pre-aeration is not recommended when treating Batman ore, as there is no measureable increase in
leach recovery and the improvement in cyanide consumption does not warrant the additional capital
expenditure for tankage.
0
10
20
30
40
50
60
70
80
90
0 5 10 15 20 25 30
Go
ld E
xtra
ctio
n, %
Leach Residence Time, hours
0 h
0 h
4 h
4 h

TESTWORK REPORT FOR THE MT TODD GOLD PROJECT FEASIBILITY STUDY
Date: January 2013 Page 57 of 92 Filename: Testwork Report - Rev C.docx
1.8.2 Sparging Tests
Oxygen is a necessary component in the reaction to dissolve gold in cyanide, and is generally provided
either from air or a high-purity gaseous oxygen supply during leaching, as opposed to before leaching as
was investigated in the pre-aeration tests in Section 1.8.1.
Cyanidation leach tests were completed on the master composite to assess the effect of dissolved
oxygen (DO) levels on leach kinetics. Tests were undertaken with and without air sparging. The target
DO levels were about 9 ppm for air sparging and 20 ppm for oxygen sparging.
The standard conditions for each leach test were:
grind P80 = 125 µm
initial pH of 11 adjusted with 60% available CaO
initial cyanide concentration of 0.10% maintained at >0.05%
55% w/w solids using Perth tap water
24 hour leach with solution assays at 1, 2, 4, 8, 12 and 24 hours.
Variables that were investigated in this suite of tests were:
no sparge tests to maintain natural DO level
air sparge tests to maintain DO level ~9 ppm
oxygen sparge tests to maintain DO level >20 ppm.
The average results are summarised in Table 37. The comparative leach kinetics for each of the tests is
shown in Figure 13.
From the sparging leach tests, it is concluded that:
elevated DO levels do not significantly increase leach kinetics or ultimate recovery of gold for the
Batman ore
increased DO levels increased the leach extraction of copper, which is an undesirable effect
reagent consumption was comparable for all tests.
All further tests on the master composite were completed using air-sparging, maintaining DO levels
between 8–9 ppm.
Table 37 - Sparging Tests
Composite
DO Level (average)
Extraction % Au Extraction
% Cu Consumption
Reference Test
(ppm) 8 h 12 h 24 h 24 h NaCN (kg/t)
Lime (kg/t)
No sparging
9.6 66.0 68.8 77.2 7.9 0.59 0.46 Average of WH3760
& WH37863
Air sparging
9.4 70.5 72.4 77.5 7.5 0.56 0.47 Average of WH3761
& WH37864
Oxygen sparging
29.2 68.5 70.5 77.3 9.9 0.68 0.46 Average of WH3762
& WH37865

TESTWORK REPORT FOR THE MT TODD GOLD PROJECT FEASIBILITY STUDY
Date: January 2013 Page 58 of 92 Filename: Testwork Report - Rev C.docx
Figure 13 - The effect of dissolved oxygen levels on leach kinetics
1.8.3 Cyanide Optimisation
Comparative cyanide leach tests were completed on the master composite sample to investigate the
effect of cyanide concentration on gold dissolution rates and final extraction.
The standard conditions for each leach test were:
grind P80 = 125 µm
initial pH of 11 adjusted with 60% available CaO
55% w/w solids using Perth tap water
air sparging to maintain DO level ~9 ppm
24 hour leach with solution assays at 1, 2, 4, 8, 12 and 24 hours.
The results are summarised in Table 38.
Table 38 - Cyanide Optimisation Tests
NaCN Level Extraction
% Au Extraction
% Cu Consumption
Reference Test
Added (kg/t)
%w/v Residual
(ppm) 12 h 24 h 24 h
NaCN (kg/t)
Lime (kg/t)
1.25 0.10%, maintain
> 0.05% 700 70.5 77.3 9.9 0.68 0.46
Average of WH3762 & WH37865
0.65 0.05%, maintain
> 0.025% 175 73.0 76.9 7.2 0.46 0.48
Average of WH3766 & WH37869
0.45 0.025%, maintain > 0.015%
90 64.8 73.2 6.2 0.36 0.47 Average of WH3767 &
WH37870
0.26 0.015%, maintain > 0.01%
80 59.9 65.0 5.8 0.19 0.47 Average of WH3768 &
WH37871
0
10
20
30
40
50
60
70
80
90
0 5 10 15 20 25 30
Go
ld E
xtra
ctio
n, %
Leach Residence Time, hours
No Sparge
Air Sparge
Oxygen Sparge

TESTWORK REPORT FOR THE MT TODD GOLD PROJECT FEASIBILITY STUDY
Date: January 2013 Page 59 of 92 Filename: Testwork Report - Rev C.docx
The outcomes of the cyanide optimisation leach tests include:
increased cyanide concentrations achieved higher extractions for both gold and copper
doubling the sodium cyanide (NaCN) addition rate from an initial concentration of 0.05% w/v to
0.10% w/v marginally improves the 24-hour gold extraction by 0.4%. This small increase in gold
extraction does not warrant the additional NaCN consumption.
An initial cyanide concentration of 0.05% w/v NaCN and maintaining residual cyanide concentration
above 0.025% w/v NaCN was selected for the remaining test work.
1.8.4 Pulp Density Optimisation
Comparative cyanide leach tests were conducted on the master composite sample to investigate the
effect of pulp density on gold and copper leach kinetics and final extractions. Increasing the pulp density
of the leach reduces the volume of tankage required in the CIL circuit and reduces overall cyanide
consumption and detox costs but can introduce agitation and handling issues due to increased slurry
viscosity and pulp density.
The objective of this testwork was to determine the leach extractions at various pulp densities. The
optimal operating density decision is based on the results of this testwork, as well as the agitation
testwork completed by SPX Flow Technology, discussed in Section 1.13 and the rheology testwork
discussed in Section 1.12.3.
The standard conditions for each leach test were:
grind P80 = 125 µm
initial pH of 11 adjusted with 60% available CaO
initial cyanide concentration of 0.10% maintained at > 0.05%
pulp densities tested were, 50%, 60%and 65%w/w solids using Perth tap water
oxygen sparging to maintain DO level ~9 ppm
24 hour leach with solution assays at 2, 4, 8, 12 and 24 hours.
The results are summarised in Table 39, with leach kinetic curves shown in Figure 14.
Table 39 - Pulp density optimisation tests
Density Extraction % Au Extraction
% Cu Consumption
Reference Test
%w/w solids
12 h 24 h 24 h NaCN (kg/t)
Lime (kg/t)
50% 73.8 75.7 7.3 0.57 0.51 Average of WH3772
& WH37875
60% 71.1 75.7 7.5 0.50 0.49 Average of WH3773
& WH37876
65% 75.8 76.9 8.0 0.56 0.44 Average of WH3774
& WH37877

TESTWORK REPORT FOR THE MT TODD GOLD PROJECT FEASIBILITY STUDY
Date: January 2013 Page 60 of 92 Filename: Testwork Report - Rev C.docx
Figure 14 - The effect of pulp density on leach kinetics
Comments of the pulp density optimisation leach test work include:
minor improvement in leach kinetics was observed at increasing pulp densities, however the
ultimate gold extraction at 24 hours is independent of pulp density
given the potential for improved metallurgical performance and reduced operating costs with
increase pulp density, the leach pulp density selected should be governed by the physical
limitations of successfully agitating and handling the slurry within the CIL circuit.
The agitation test work undertaken by SPX Flow Technology, suggests that the Batman ore could be
successfully agitated at a pulp density of 60% w/w solids without floating the carbon. At higher pulp
densities, issues with carbon dispersion were experienced. In benchmarking gold operations, there are
limited examples of plants that operate CIL circuits with a pulp density greater than 60% w/w solids. The
Batman ore is hard (resulting in a narrow particle size distribution), and is primary in nature (contains little
or no clay minerals), both of which aid in reducing viscosity at elevated pulp densities. Although operating
at 60% w/w solids is not typical, there is an operation with similar ore characteristics operating at similar
pulp densities in Western Australia.
The rheology test work indicates that the slurry behaves like a pseudoplastic Non-Newtonian (Bingham
plastic) fluid at pulp densities above 55% w/w solids and is shear thinning. This would indicate that at pulp
densities above 55% w/w solids, careful consideration must be given to the design of the intertank
screens and launders.
The decision was subsequently made to complete all further test work at a pulp density of
60% w/w solids. Given that the slurry rheology testwork indicates a marked increase in viscosity at lower
shear rates between 55% and 60% w/w solids, careful consideration is to be given in the design to control
of the pulp density in the leach feed thickener underflow.
The results of the agitation testwork are discussed in Section 1.13.
0
10
20
30
40
50
60
70
80
90
0 5 10 15 20 25 30
Go
ld E
xtra
ctio
n, %
Leach Residence Time, hours
50% w/w
60% w/w
65% w/w

TESTWORK REPORT FOR THE MT TODD GOLD PROJECT FEASIBILITY STUDY
Date: January 2013 Page 61 of 92 Filename: Testwork Report - Rev C.docx
1.8.5 Lead Nitrate Addition and Pre-Conditioning
Comparative leach tests were completed on the master composite sample to determine:
the effect of pre-conditioning the leach feed, using lime to elevate the pH of the leach feed to 11
prior to the addition of cyanide. Pre-conditioning times of 2 and 4 hours were investigated. The
previous PFS testwork indicated some increase in leach extraction and reduction in cyanide
consumption by pre-conditioning the leach feed for up to 4 hours with lime prior to cyanidation
the effect of Pb(NO3)2 addition at various rates on leach extraction rates. Pb(NO3)2 has been
used in gold plants to increase the leach extraction kinetics and overall plant recovery. Pb(NO3)2
addition rates of 50, 100 and 200 g/t were tested
the effect of the combination of both pre-conditioning and Pb(NO3)2 addition.
The standard conditions for each test were:
grind P80 = 125 µm
initial leach pH of 11 adjusted with 60% available CaO
initial sodium cyanide concentration of 0.05% w/v, maintained at >0.025% w/v
60% w/w solids using Perth tap water
leach air-sparging to maintain DO level ~9 ppm
24-hour leach with solution assays at 1, 2, 4, 8, 12 and 24 hours.
The results of the pre-conditioning and lead nitrate addition test work are summarised in Table 40. For
comparison, the table includes results of leach tests completed at the same conditions with and without
Pb(NO3)2 addition.
The leach kinetics for both gold and copper are presented in Figure 15 and Figure 16 respectively.
Outcomes of the pre-conditioning and lead nitrate addition testwork include:
pre-conditioning with lime reduces cyanide consumption by up to 0.21 kg/t or 30% after 4 hours,
but increases lime consumption by up to 0.23 kg/t or 60% after 4 hours
pre-conditioning alone did not have any measureable benefit to overall gold extraction but was
detrimental with respected to increased copper extraction
the addition of 50 g/t and 100 g/t of Pb(NO3)2 reduced cyanide consumption by as much as
0.34 kg/t or 55%
Pb(NO3)2 addition has no impact on lime consumption
Pb(NO3)2 addition improved leach kinetics slightly as well as the overall recovery of gold after 24
hours
Pb(NO3)2 addition depresses the leaching of copper
the combination of Pb(NO3)2 addition and pre-conditioning further reduces the cyanide
consumption by 0.05 kg/t.
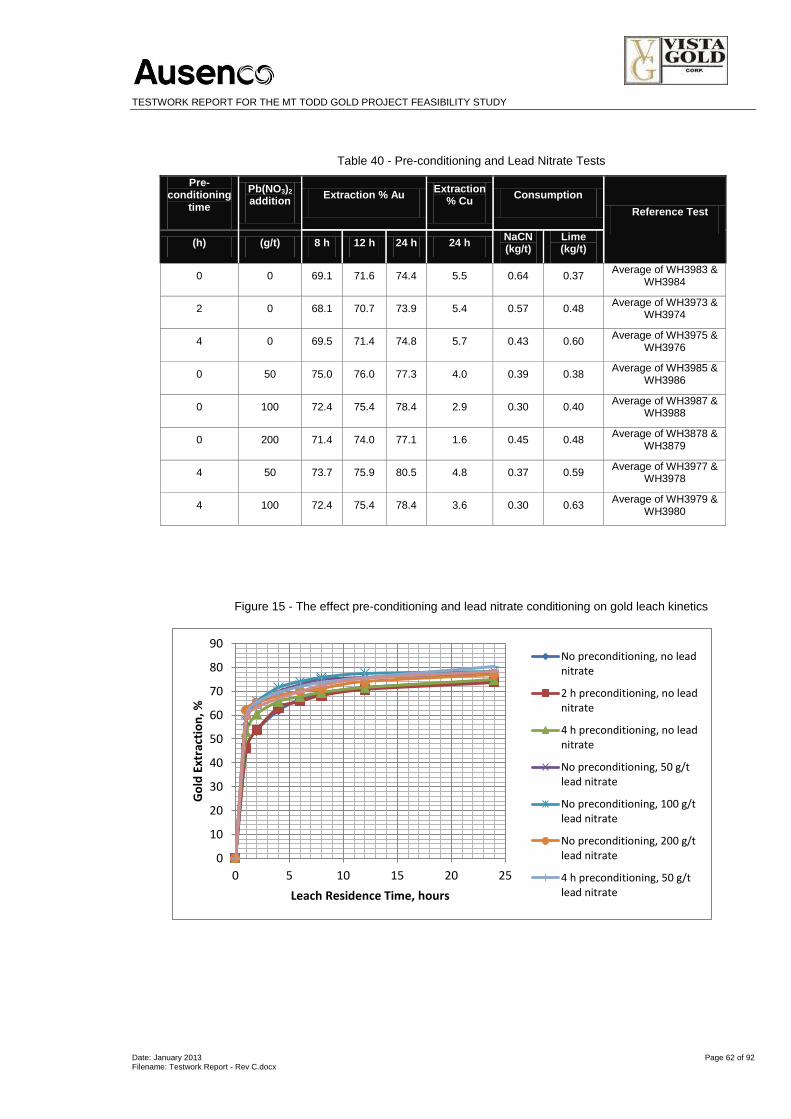
TESTWORK REPORT FOR THE MT TODD GOLD PROJECT FEASIBILITY STUDY
Date: January 2013 Page 62 of 92 Filename: Testwork Report - Rev C.docx
Table 40 - Pre-conditioning and Lead Nitrate Tests
Pre-conditioning
time
Pb(NO3)2 addition
Extraction % Au Extraction
% Cu Consumption
Reference Test
(h) (g/t) 8 h 12 h 24 h 24 h NaCN (kg/t)
Lime (kg/t)
0 0 69.1 71.6 74.4 5.5 0.64 0.37 Average of WH3983 &
WH3984
2 0 68.1 70.7 73.9 5.4 0.57 0.48 Average of WH3973 &
WH3974
4 0 69.5 71.4 74.8 5.7 0.43 0.60 Average of WH3975 &
WH3976
0 50 75.0 76.0 77.3 4.0 0.39 0.38 Average of WH3985 &
WH3986
0 100 72.4 75.4 78.4 2.9 0.30 0.40 Average of WH3987 &
WH3988
0 200 71.4 74.0 77.1 1.6 0.45 0.48 Average of WH3878 &
WH3879
4 50 73.7 75.9 80.5 4.8 0.37 0.59 Average of WH3977 &
WH3978
4 100 72.4 75.4 78.4 3.6 0.30 0.63 Average of WH3979 &
WH3980
Figure 15 - The effect pre-conditioning and lead nitrate conditioning on gold leach kinetics
0
10
20
30
40
50
60
70
80
90
0 5 10 15 20 25
Go
ld E
xtra
ctio
n, %
Leach Residence Time, hours
No preconditioning, no leadnitrate
2 h preconditioning, no leadnitrate
4 h preconditioning, no leadnitrate
No preconditioning, 50 g/tlead nitrate
No preconditioning, 100 g/tlead nitrate
No preconditioning, 200 g/tlead nitrate
4 h preconditioning, 50 g/tlead nitrate

TESTWORK REPORT FOR THE MT TODD GOLD PROJECT FEASIBILITY STUDY
Date: January 2013 Page 63 of 92 Filename: Testwork Report - Rev C.docx
Figure 16 - The effect pre-conditioning and lead nitrate conditioning on copper leach kinetics
To evaluate the benefits of pre-conditioning and lead nitrate addition, a cost benefit analysis was
completed. For this exercise, lead nitrate dosage rates of 50 g/t and 100 g/t were examined. Higher
dosages were not considered due to the associated high cost of lead nitrate.
The calculated NPVs for each option assessed are summarised in Table 41.
Table 41 - Lead nitrate and pre-conditioning option comparison
Option Description NPV M$
1 No pre-conditioning, no lead nitrate 0.0
2 2 h pre-conditioning, no lead nitrate -0.3
3 4 h pre-conditioning, no lead nitrate 0.0
4 0 h pre-conditioning, 50 g/t lead nitrate 1.1
5 0 h pre-conditioning, 100 g/t lead nitrate 1.4
6 4 h pre-conditioning, 50 g/t lead nitrate 1.1
7 4 h pre-conditioning, 100 g/t lead nitrate 1.2
Table 41 shows the improved project economics with the inclusion of pre-conditioning and lead nitrate
addition. As a result, the variability leach tests were completed with 100 g/t Pb(NO3)2.
0
1
2
3
4
5
6
0 5 10 15 20 25
Co
pp
er
Extr
acti
on
, %
Leach Residence Time, hours
No preconditioning, no leadnitrate
2 h preconditioning, no leadnitrate
4 h preconditioning, no leadnitrate
No preconditioning, 50 g/t leadnitrate
No preconditioning, 100 g/t leadnitrate
No preconditioning, 200 g/t leadnitrate
4 h preconditioning, 50 g/t leadnitrate
4 h preconditioning, 100 g/t leadnitrate
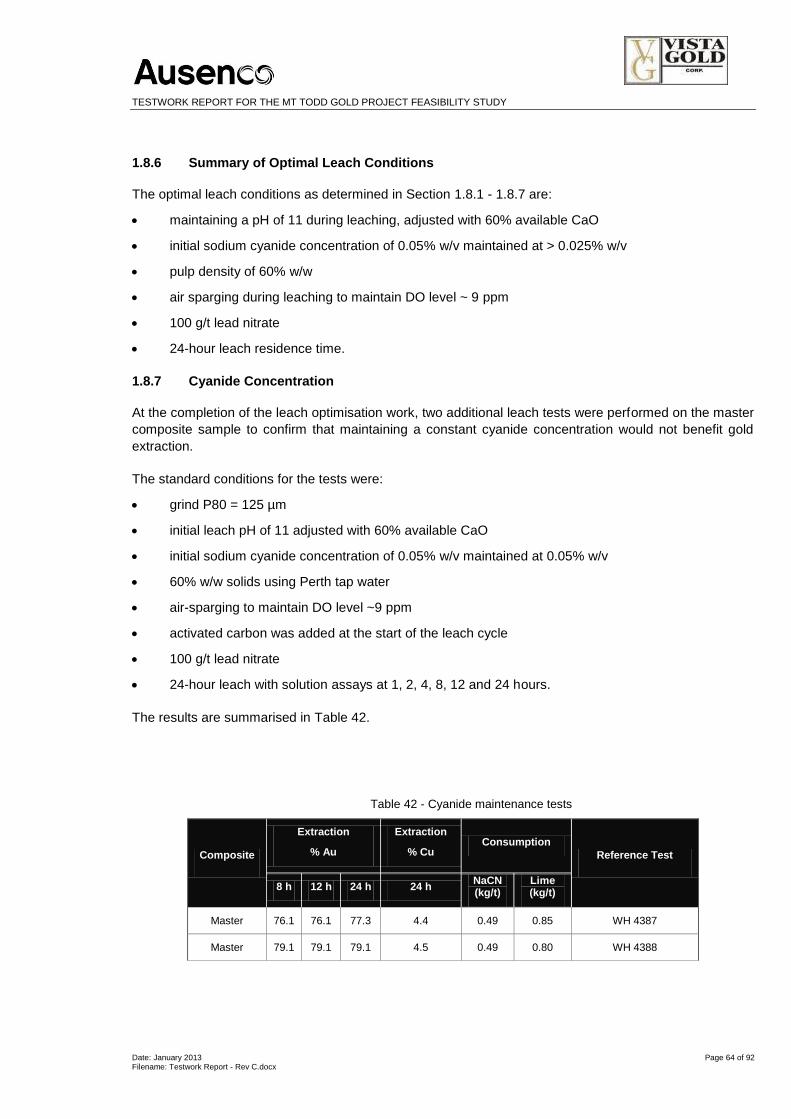
TESTWORK REPORT FOR THE MT TODD GOLD PROJECT FEASIBILITY STUDY
Date: January 2013 Page 64 of 92 Filename: Testwork Report - Rev C.docx
1.8.6 Summary of Optimal Leach Conditions
The optimal leach conditions as determined in Section 1.8.1 - 1.8.7 are:
maintaining a pH of 11 during leaching, adjusted with 60% available CaO
initial sodium cyanide concentration of 0.05% w/v maintained at > 0.025% w/v
pulp density of 60% w/w
air sparging during leaching to maintain DO level ~ 9 ppm
100 g/t lead nitrate
24-hour leach residence time.
1.8.7 Cyanide Concentration
At the completion of the leach optimisation work, two additional leach tests were performed on the master
composite sample to confirm that maintaining a constant cyanide concentration would not benefit gold
extraction.
The standard conditions for the tests were:
grind P80 = 125 µm
initial leach pH of 11 adjusted with 60% available CaO
initial sodium cyanide concentration of 0.05% w/v maintained at 0.05% w/v
60% w/w solids using Perth tap water
air-sparging to maintain DO level ~9 ppm
activated carbon was added at the start of the leach cycle
100 g/t lead nitrate
24-hour leach with solution assays at 1, 2, 4, 8, 12 and 24 hours.
The results are summarised in Table 42.
Table 42 - Cyanide maintenance tests
Composite
Extraction
% Au
Extraction
% Cu Consumption
Reference Test
8 h 12 h 24 h 24 h NaCN (kg/t)
Lime (kg/t)
Master 76.1 76.1 77.3 4.4 0.49 0.85 WH 4387
Master 79.1 79.1 79.1 4.5 0.49 0.80 WH 4388
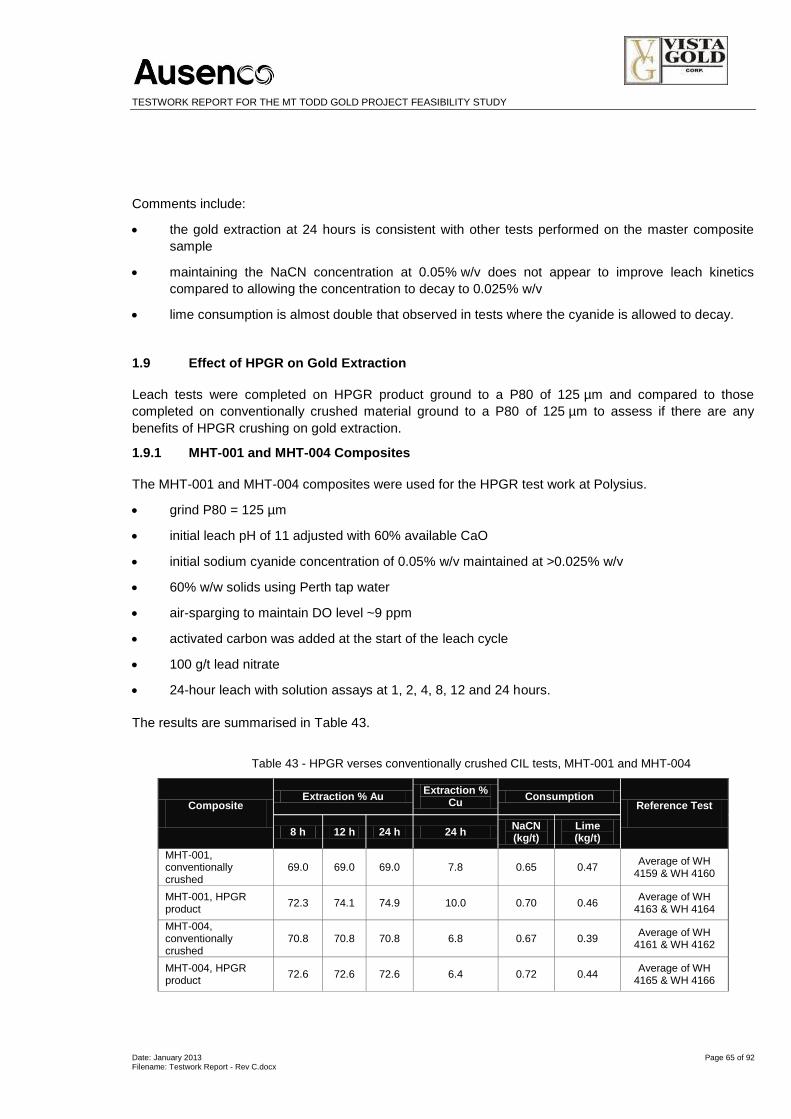
TESTWORK REPORT FOR THE MT TODD GOLD PROJECT FEASIBILITY STUDY
Date: January 2013 Page 65 of 92 Filename: Testwork Report - Rev C.docx
Comments include:
the gold extraction at 24 hours is consistent with other tests performed on the master composite
sample
maintaining the NaCN concentration at 0.05% w/v does not appear to improve leach kinetics
compared to allowing the concentration to decay to 0.025% w/v
lime consumption is almost double that observed in tests where the cyanide is allowed to decay.
1.9 Effect of HPGR on Gold Extraction
Leach tests were completed on HPGR product ground to a P80 of 125 µm and compared to those
completed on conventionally crushed material ground to a P80 of 125 µm to assess if there are any
benefits of HPGR crushing on gold extraction.
1.9.1 MHT-001 and MHT-004 Composites
The MHT-001 and MHT-004 composites were used for the HPGR test work at Polysius.
grind P80 = 125 µm
initial leach pH of 11 adjusted with 60% available CaO
initial sodium cyanide concentration of 0.05% w/v maintained at >0.025% w/v
60% w/w solids using Perth tap water
air-sparging to maintain DO level ~9 ppm
activated carbon was added at the start of the leach cycle
100 g/t lead nitrate
24-hour leach with solution assays at 1, 2, 4, 8, 12 and 24 hours.
The results are summarised in Table 43.
Table 43 - HPGR verses conventionally crushed CIL tests, MHT-001 and MHT-004
Composite Extraction % Au
Extraction % Cu
Consumption Reference Test
8 h 12 h 24 h 24 h NaCN (kg/t)
Lime (kg/t)
MHT-001, conventionally crushed
69.0 69.0 69.0 7.8 0.65 0.47 Average of WH
4159 & WH 4160
MHT-001, HPGR product
72.3 74.1 74.9 10.0 0.70 0.46 Average of WH
4163 & WH 4164
MHT-004, conventionally crushed
70.8 70.8 70.8 6.8 0.67 0.39 Average of WH
4161 & WH 4162
MHT-004, HPGR product
72.6 72.6 72.6 6.4 0.72 0.44 Average of WH
4165 & WH 4166
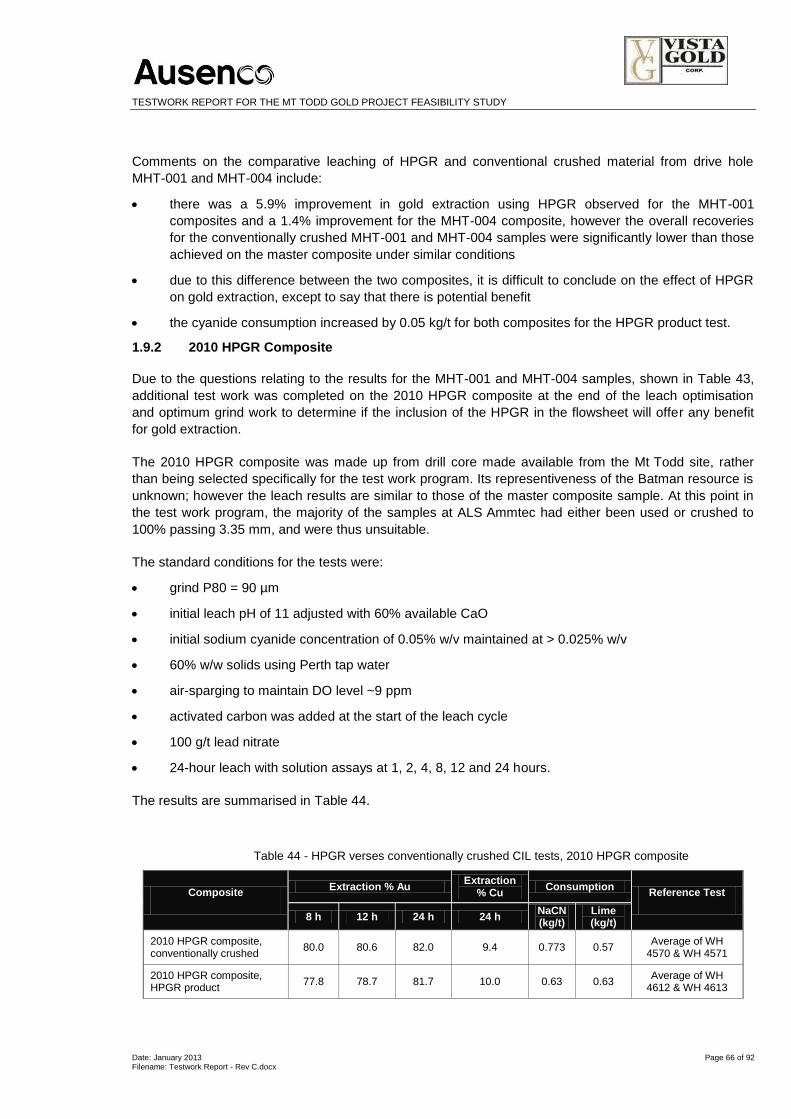
TESTWORK REPORT FOR THE MT TODD GOLD PROJECT FEASIBILITY STUDY
Date: January 2013 Page 66 of 92 Filename: Testwork Report - Rev C.docx
Comments on the comparative leaching of HPGR and conventional crushed material from drive hole
MHT-001 and MHT-004 include:
there was a 5.9% improvement in gold extraction using HPGR observed for the MHT-001
composites and a 1.4% improvement for the MHT-004 composite, however the overall recoveries
for the conventionally crushed MHT-001 and MHT-004 samples were significantly lower than those
achieved on the master composite under similar conditions
due to this difference between the two composites, it is difficult to conclude on the effect of HPGR
on gold extraction, except to say that there is potential benefit
the cyanide consumption increased by 0.05 kg/t for both composites for the HPGR product test.
1.9.2 2010 HPGR Composite
Due to the questions relating to the results for the MHT-001 and MHT-004 samples, shown in Table 43,
additional test work was completed on the 2010 HPGR composite at the end of the leach optimisation
and optimum grind work to determine if the inclusion of the HPGR in the flowsheet will offer any benefit
for gold extraction.
The 2010 HPGR composite was made up from drill core made available from the Mt Todd site, rather
than being selected specifically for the test work program. Its representiveness of the Batman resource is
unknown; however the leach results are similar to those of the master composite sample. At this point in
the test work program, the majority of the samples at ALS Ammtec had either been used or crushed to
100% passing 3.35 mm, and were thus unsuitable.
The standard conditions for the tests were:
grind P80 = 90 µm
initial leach pH of 11 adjusted with 60% available CaO
initial sodium cyanide concentration of 0.05% w/v maintained at > 0.025% w/v
60% w/w solids using Perth tap water
air-sparging to maintain DO level ~9 ppm
activated carbon was added at the start of the leach cycle
100 g/t lead nitrate
24-hour leach with solution assays at 1, 2, 4, 8, 12 and 24 hours.
The results are summarised in Table 44.
Table 44 - HPGR verses conventionally crushed CIL tests, 2010 HPGR composite
Composite Extraction % Au
Extraction % Cu
Consumption Reference Test
8 h 12 h 24 h 24 h NaCN (kg/t)
Lime (kg/t)
2010 HPGR composite, conventionally crushed
80.0 80.6 82.0 9.4 0.773 0.57 Average of WH
4570 & WH 4571
2010 HPGR composite, HPGR product
77.8 78.7 81.7 10.0 0.63 0.63 Average of WH
4612 & WH 4613

TESTWORK REPORT FOR THE MT TODD GOLD PROJECT FEASIBILITY STUDY
Date: January 2013 Page 67 of 92 Filename: Testwork Report - Rev C.docx
Comments on the comparative leaching of HPGR and conventionally crushed material from the 2010
HPGR composite include:
unlike the tests performed on the MHT-001 and MHT-004 products, there is no apparent benefit in
gold recovery observed for the HPGR product sample
the grind size used for these tests is at P80 of 90 µm compared to a P80 of 125 µm for the tests on
the MHT-001 and MHT-004 samples and it is possible at the finer grind size, the benefits of micro-
cracking had been lost
based on these results, the inclusion of the HPGR flowsheet will have no benefit on gold extraction
at the optimum P80 grind size of 90 µm.
1.10 Cyanide Variability Testwork
A total of 99 leach variability samples covering a range of head grades (refer Section 1.4.4) were selected
from eight drill holes considered to be represent the remaining Batman deposit, spatially. Each sample
was subjected to an optimised cyanide leach test as per the conditions outlined in Section 1.8.6.
Activated carbon was added at the start of the leach cycle in each test.
There were two series of variability tests completed, based on the initial and final optimum grind sizes of
P80 of 125 µm and P80 of 90 µm:
The initial batch of variability leach tests was completed on each of the 99 variability samples at the
initial optimum grind size of P80 125 µm
The second batch of variability leach tests was completed on 30 selected samples from the
99 variability composites, at the optimum grind size of P80 90 µm. The 30 samples were selected
to give an approximate average head grade close to the design gold head grade of 0.85 g/t, and
also an average extraction close to the average achieved for the initial batch of variability test work.
Samples were selected from each of the drill holes, including samples from the oxide zone (Var-81
and Var-91). A reference low grade sample (Var-33) was also included.
The results for the initial batch of 99 variability leach tests, performed at a grind size of P80 125 µm, are
summarised in Table 45. The head grade versus gold and copper extraction and head grade versus
residue grade relationship are illustrated graphically in Figure 17 and Figure 18, respectively.
The results for the second batch of 30 variability leach tests, performed at a grind size of P80 90 µm, are
summarised in Table 46. The head grade versus gold and copper extraction and head grade versus
residue grade relationships are illustrated graphically in Figure 19 and Figure 20, respectively.
The following conclusions are drawn from the results of the variability test work:
Gold extractions from the initial variability test work program averaged 77.6% after 24 hours,
ranging from 62.7% to 90.9% (125 µm grind size). This includes all samples with head grades that
fall below the cut-off grade of 0.4 g/t
The sample with the lowest gold extraction (Var-30) had a very high grade and was still leaching at
48 hours. The average leach extraction is similar to that of the master composite sample at a grind
size of 125 µm P80
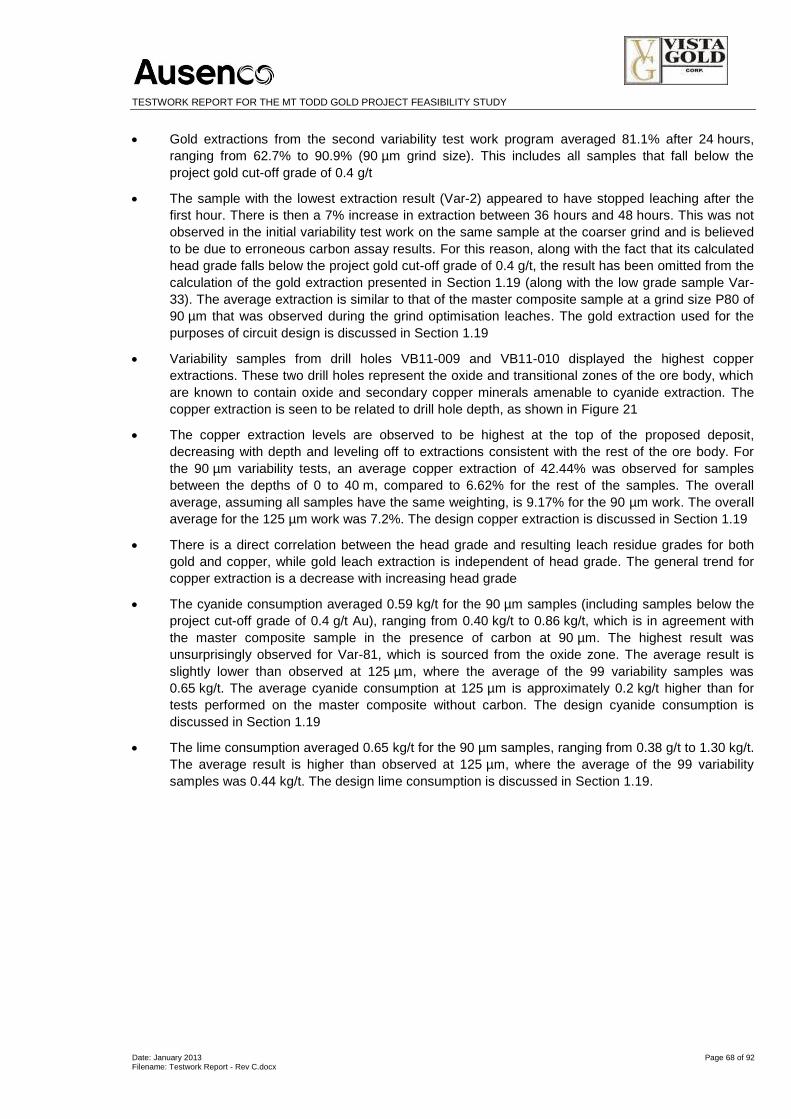
TESTWORK REPORT FOR THE MT TODD GOLD PROJECT FEASIBILITY STUDY
Date: January 2013 Page 68 of 92 Filename: Testwork Report - Rev C.docx
Gold extractions from the second variability test work program averaged 81.1% after 24 hours,
ranging from 62.7% to 90.9% (90 µm grind size). This includes all samples that fall below the
project gold cut-off grade of 0.4 g/t
The sample with the lowest extraction result (Var-2) appeared to have stopped leaching after the
first hour. There is then a 7% increase in extraction between 36 hours and 48 hours. This was not
observed in the initial variability test work on the same sample at the coarser grind and is believed
to be due to erroneous carbon assay results. For this reason, along with the fact that its calculated
head grade falls below the project gold cut-off grade of 0.4 g/t, the result has been omitted from the
calculation of the gold extraction presented in Section 1.19 (along with the low grade sample Var-
33). The average extraction is similar to that of the master composite sample at a grind size P80 of
90 µm that was observed during the grind optimisation leaches. The gold extraction used for the
purposes of circuit design is discussed in Section 1.19
Variability samples from drill holes VB11-009 and VB11-010 displayed the highest copper
extractions. These two drill holes represent the oxide and transitional zones of the ore body, which
are known to contain oxide and secondary copper minerals amenable to cyanide extraction. The
copper extraction is seen to be related to drill hole depth, as shown in Figure 21
The copper extraction levels are observed to be highest at the top of the proposed deposit,
decreasing with depth and leveling off to extractions consistent with the rest of the ore body. For
the 90 µm variability tests, an average copper extraction of 42.44% was observed for samples
between the depths of 0 to 40 m, compared to 6.62% for the rest of the samples. The overall
average, assuming all samples have the same weighting, is 9.17% for the 90 µm work. The overall
average for the 125 µm work was 7.2%. The design copper extraction is discussed in Section 1.19
There is a direct correlation between the head grade and resulting leach residue grades for both
gold and copper, while gold leach extraction is independent of head grade. The general trend for
copper extraction is a decrease with increasing head grade
The cyanide consumption averaged 0.59 kg/t for the 90 µm samples (including samples below the
project cut-off grade of 0.4 g/t Au), ranging from 0.40 kg/t to 0.86 kg/t, which is in agreement with
the master composite sample in the presence of carbon at 90 µm. The highest result was
unsurprisingly observed for Var-81, which is sourced from the oxide zone. The average result is
slightly lower than observed at 125 µm, where the average of the 99 variability samples was
0.65 kg/t. The average cyanide consumption at 125 µm is approximately 0.2 kg/t higher than for
tests performed on the master composite without carbon. The design cyanide consumption is
discussed in Section 1.19
The lime consumption averaged 0.65 kg/t for the 90 µm samples, ranging from 0.38 g/t to 1.30 kg/t.
The average result is higher than observed at 125 µm, where the average of the 99 variability
samples was 0.44 kg/t. The design lime consumption is discussed in Section 1.19.

TESTWORK REPORT FOR THE MT TODD GOLD PROJECT FEASIBILITY STUDY
Date: January 2013 Page 69 of 92 Filename: Testwork Report - Rev C.docx
Table 45 - Leach Variability Tests, 125 µm grind size
Sample Hole
Calc. head Leach
extraction (% Au)
Leach extraction (%
Cu)
NaCN (kg/t)
24 h
Lime (kg/t)
24 h (g/t Au)
(Cu ppm) 24 h 48 h 24 h 48 h
Var-1 MHT-003 0.37 139 67.7 67.7 5.9 10.2 0.57 0.40
Var-2 MHT-003 0.36 208 69.2 69.2 8.2 8.8 0.81 0.40
Var-3 MHT-003 1.06 397 76.3 76.3 5.2 10.6 0.65 0.40
Var-4 MHT-003 2.01 434 80.5 82.6 4.8 9.1 0.64 0.42
Var-5 MHT-003 1.37 725 80.2 80.2 3.0 6.2 0.65 0.36
Var-6 MHT-003 1.36 494 79.0 80.1 2.4 3.9 0.62 0.37
Var-7 MHT-003 1.52 616 77.1 78.2 3.6 6.6 0.62 0.42
Var-8 MHT-003 1.73 699 75.4 76.3 3.5 6.3 0.74 0.42
Var-9 MHT-003 1.05 483 76.4 78.1 3.3 5.9 0.80 0.40
Var-10 MHT-003 0.73 403 79.5 79.5 3.8 7.1 0.77 0.40
Var-11 MHT-003 0.63 413 78.5 81.1 2.8 4.3 0.59 0.40
Var-12 MHT-003 0.93 323 77.3 77.3 5.8 8.6 0.65 0.45
Var-13 MHT-003 0.50 240 71.2 71.2 4.4 6.3 0.62 0.55
Var-14 MHT-003 0.40 750 72.5 72.5 1.6 2.0 0.57 0.46
Var-15 VB11-001 0.56 974 76.6 80.4 2.6 4.6 0.61 0.35
Var-16 VB11-001 1.67 612 75.6 76.7 3.3 6.1 0.63 0.43
Var-17 VB11-001 1.22 567 82.8 82.8 4.5 10.0 0.63 0.42
Var-18 VB11-001 0.87 1,192 83.8 85.0 2.3 4.0 0.64 0.43
Var-19 VB11-001 0.56 1,799 75.8 79.5 1.0 2.2 0.65 0.35
Var-20 VB11-001 1.38 1,235 78.9 78.9 2.3 4.0 0.49 0.46
Var-21 VB11-001 1.21 1,218 85.9 87.6 3.9 7.6 0.68 0.52
Var-22 VB11-001 0.84 549 79.6 82.1 6.1 9.9 0.59 0.50
Var-23 VB11-001 0.70 600 66.1 74.4 7.0 12.6 0.66 0.55
Var-24 VB11-001 1.25 523 75.6 80.0 7.3 9.2 0.61 0.98
Var-25 VB11-001 1.74 829 79.2 81.6 4.2 10.7 0.63 1.39
Var-26 VB11-001 0.98 740 73.4 73.4 8.4 14.2 0.66 0.66

TESTWORK REPORT FOR THE MT TODD GOLD PROJECT FEASIBILITY STUDY
Date: January 2013 Page 70 of 92 Filename: Testwork Report - Rev C.docx
Sample Hole
Calc. head Leach
extraction (% Au)
Leach extraction (%
Cu)
NaCN (kg/t)
24 h
Lime (kg/t)
24 h (g/t Au)
(Cu ppm) 24 h 48 h 24 h 48 h
Var-27 VB11-001 0.69 559 80.0 79.8 7.8 14.2 0.77 0.42
Var-28 VB11-001 0.44 587 74.6 77.3 6.0 11.4 0.60 0.33
Var-29 VB11-001 2.05 626 65.4 69.3 4.6 6.6 0.61 0.38
Var-30 VB11-001 3.21 794 62.7 64.8 2.2 3.0 0.44 0.33
Var-31 VB11-002 0.49 280 75.6 75.6 2.1 3.3 0.43 0.37
Var-32 VB11-002 0.42 170 75.1 76.3 2.2 3.2 0.42 0.34
Var-33 VB11-002 0.17 134 71.1 71.1 8.8 14.1 0.44 0.44
Var-34 VB11-002 0.36 835 73.7 75.0 1.6 2.5 0.59 0.37
Var-35 VB11-002 0.34 320 73.8 73.8 2.5 4.8 0.45 0.33
Var-36 VB11-002 0.75 539 81.3 81.3 1.4 2.5 0.56 0.29
Var-37 VB11-002 0.96 716 71.9 78.1 1.7 3.6 0.59 0.34
Var-38 VB11-002 0.66 796 72.8 72.8 3.2 5.2 0.61 0.36
Var-39 VB11-002 2.32 972 80.2 83.8 4.2 7.9 0.63 0.35
Var-40 VB11-002 1.01 992 79.2 82.1 4.5 7.3 0.29 0.33
Var-41 VB11-002 1.57 569 80.6 82.2 5.6 11.2 0.61 0.36
Var-42 VB11-002 1.28 552 83.4 84.4 6.0 11.3 0.62 0.41
Var-43 VB11-002 0.57 411 84.2 84.2 6.9 10.0 0.62 0.36
Var-44 VB11-002 2.03 690 75.7 77.8 3.3 5.0 0.59 0.31
Var-45 VB11-002 3.17 1,225 82.5 85.2 4.3 7.4 0.65 0.45
Var-46 VB11-002 0.44 446 81.2 84.2 7.4 14.8 0.66 0.53
Var-47 VB11-002 0.46 709 77.3 78.4 6.2 11.2 0.66 0.58
Var-48 VB11-002 0.37 1102 71.1 73.2 3.6 8.8 0.62 0.79
Var-49 VB11-002 0.42 778 76.2 76.2 8.0 17.7 0.88 1.06
Var-50 VB11-002 0.99 1,107 83.2 84.8 6.4 11.4 0.90 0.48
Var-51 VB11-002 0.56 911 82.0 82.0 5.3 9.0 0.60 0.54
Var-52 VB11-002 0.66 682 73.6 75.8 7.1 12.7 0.85 0.54
Var-53 VB11-002 0.82 870 79.2 81.8 6.8 11.5 0.68 0.54
Var-54 VB11-002 0.26 339 66.8 66.8 11.8 17.4 0.83 0.51
Var-55 VB11-002 0.08 425 74.4 74.4 5.9 10.5 0.65 0.40

TESTWORK REPORT FOR THE MT TODD GOLD PROJECT FEASIBILITY STUDY
Date: January 2013 Page 71 of 92 Filename: Testwork Report - Rev C.docx
Sample Hole
Calc. head Leach
extraction (% Au)
Leach extraction (%
Cu)
NaCN (kg/t)
24 h
Lime (kg/t)
24 h (g/t Au)
(Cu ppm) 24 h 48 h 24 h 48 h
Var-56 MHT001 0.76 261 71.1 71.1 8.7 13.7 0.61 0.48
Var-57 MHT001 1.21 393 68.7 70.1 7.6 13.6 0.79 0.50
Var-58 MHT001 0.49 241 78.0 79.5 6.0 14.9 0.64 0.76
Var-59 MHT004 0.32 184 72.0 72.0 8.2 13.0 0.55 0.44
Var-60 MHT004 0.25 181 71.9 71.9 7.9 14.4 0.75 0.38
Var-61 MHT004 0.53 190 75.9 77.4 8.6 13.2 0.72 0.52
Var-62 MHT004 0.69 299 73.6 75.2 5.0 8.0 0.56 0.45
Var-63 MHT004 0.74 366 74.2 74.2 9.0 15.4 0.70 0.76
Var-64 VB11-003 0.62 178 77.7 80.6 8.7 15.9 0.58 0.43
Var-65 VB11-003 0.61 229 80.4 80.4 5.3 10.4 0.63 0.37
Var-66 VB11-003 0.92 272 89.2 90.2 2.0 4.4 0.56 0.35
Var-67 VB11-003 0.83 457 81.0 81.9 4.4 12.6 0.74 0.49
Var-68 VB11-003 1.06 467 81.2 83.1 4.4 10.2 0.58 0.38
Var-69 VB11-003 1.48 718 76.6 78.4 4.4 10.2 0.63 0.37
Var-70 VB11-003 1.96 655 80.1 83.2 3.5 7.6 0.58 0.36
Var-71 VB11-003 0.98 261 82.9 83.8 5.8 11.9 0.57 0.37
Var-72 VB11-003 0.37 291 78.7 78.7 5.3 10.6 0.63 1.73
Var-73 VB11-003 0.55 650 87.3 87.3 6.2 13.0 0.70 0.38
Var-74 VB11-003 0.42 315 85.8 85.8 7.2 19.0 0.61 2.21
Var-75 VB11-003 0.17 237 75.8 75.8 2.8 5.1 0.55 0.38
Var-76 VB11-003 0.36 316 84.5 84.9 7.4 11.3 0.82 0.51
Var-77 VB11-003 0.36 294 73.4 74.7 2.6 6.5 0.61 0.35
Var-78 VB11-003 0.43 529 75.6 79.1 2.4 6.4 0.66 1.09
Var-79 VB11-003 0.15 205 80.2 80.2 6.2 12.4 0.63 0.47
Var-80 VB11-009 0.45 380 84.8 86.7 46.1 69.8 0.94 0.71
Var-81 VB11-009 0.63 371 79.3 85.8 43.6 63.6 0.90 0.60
Var-82 VB11-009 0.33 250 80.8 81.8 31.3 42.0 0.64 0.78
Var-83 VB11-009 0.21 186 85.8 85.8 11.7 19.4 0.44 0.80
Var-84 VB11-009 0.58 380 81.6 82.7 7.7 13.2 0.83 0.50
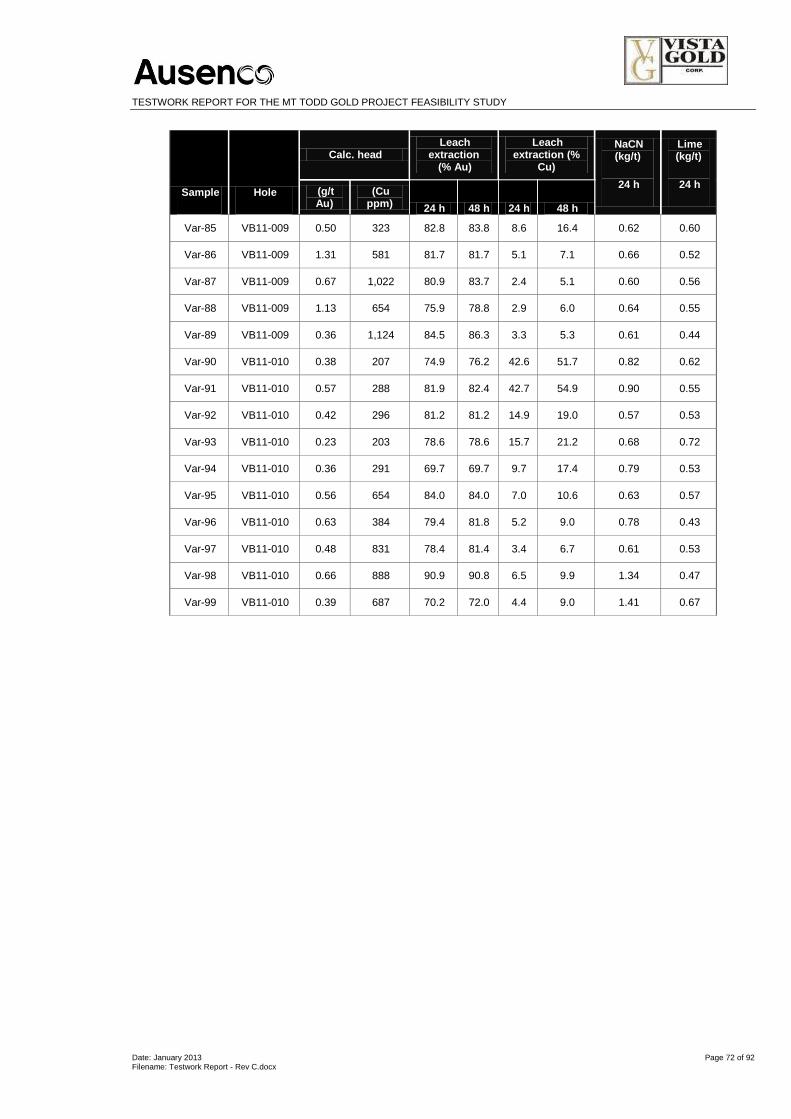
TESTWORK REPORT FOR THE MT TODD GOLD PROJECT FEASIBILITY STUDY
Date: January 2013 Page 72 of 92 Filename: Testwork Report - Rev C.docx
Sample Hole
Calc. head Leach
extraction (% Au)
Leach extraction (%
Cu)
NaCN (kg/t)
24 h
Lime (kg/t)
24 h (g/t Au)
(Cu ppm) 24 h 48 h 24 h 48 h
Var-85 VB11-009 0.50 323 82.8 83.8 8.6 16.4 0.62 0.60
Var-86 VB11-009 1.31 581 81.7 81.7 5.1 7.1 0.66 0.52
Var-87 VB11-009 0.67 1,022 80.9 83.7 2.4 5.1 0.60 0.56
Var-88 VB11-009 1.13 654 75.9 78.8 2.9 6.0 0.64 0.55
Var-89 VB11-009 0.36 1,124 84.5 86.3 3.3 5.3 0.61 0.44
Var-90 VB11-010 0.38 207 74.9 76.2 42.6 51.7 0.82 0.62
Var-91 VB11-010 0.57 288 81.9 82.4 42.7 54.9 0.90 0.55
Var-92 VB11-010 0.42 296 81.2 81.2 14.9 19.0 0.57 0.53
Var-93 VB11-010 0.23 203 78.6 78.6 15.7 21.2 0.68 0.72
Var-94 VB11-010 0.36 291 69.7 69.7 9.7 17.4 0.79 0.53
Var-95 VB11-010 0.56 654 84.0 84.0 7.0 10.6 0.63 0.57
Var-96 VB11-010 0.63 384 79.4 81.8 5.2 9.0 0.78 0.43
Var-97 VB11-010 0.48 831 78.4 81.4 3.4 6.7 0.61 0.53
Var-98 VB11-010 0.66 888 90.9 90.8 6.5 9.9 1.34 0.47
Var-99 VB11-010 0.39 687 70.2 72.0 4.4 9.0 1.41 0.67

TESTWORK REPORT FOR THE MT TODD GOLD PROJECT FEASIBILITY STUDY
Date: January 2013 Page 73 of 92 Filename: Testwork Report - Rev C.docx
Figure 17 - Grade–extraction relationship for gold, 125 µm grind size
Figure 18 - Grade–extraction relationship for copper, 125 µm grind size
0
10
20
30
40
50
60
70
80
90
100
0
0.2
0.4
0.6
0.8
1
1.2
0 1 2 3 4
Go
ld E
xtra
ctio
n, %
Go
ld R
esi
du
e G
rad
e, g
/t
Calculated Gold Head Grade, g/t
ResidueGoldGrade, g/t
GoldExtraction, %
-10
0
10
20
30
40
50
0
200
400
600
800
1000
1200
1400
1600
1800
2000
0 500 1000 1500 2000
Co
pp
er
Extr
acti
on
, %
Re
sid
ue
Co
pp
er
Gra
de
, pp
m
Calculated Copper Head Grade, ppm
ResidueCopperGrade, ppm
CopperExtraction,%

TESTWORK REPORT FOR THE MT TODD GOLD PROJECT FEASIBILITY STUDY
Date: January 2013 Page 74 of 92 Filename: Testwork Report - Rev C.docx
Table 46 - Leach variability tests, 90 µm grind size
Sample Hole Calc. head
Leach extraction
(% Au)
Leach extraction
(% Cu)
NaCN (kg/t)
Lime (kg/t)
(g/t Au) (Cu ppm) 24 h 48 h 24 h 48 h 24 h 24 h
Var-2 MHT-003 0.30 209 63.2 70.2 7.4 9.0 0.41 0.49
Var-5 MHT-003 1.26 754 82.5 82.5 4.5 10.4 0.59 0.38
Var-10 MHT-003 0.69 402 79.6 79.6 5.9 11.8 0.62 0.49
Var-11 MHT-003 0.59 397 82.9 82.9 4.6 6.8 0.63 0.48
Var-12 MHT-003 0.83 382 78.2 78.2 7.0 12.3 0.59 0.59
Var-15 VB11-001 0.51 1,024 76.2 80.5 3.8 5.8 0.56 0.44
Var-19 VB11-001 0.49 1,859 85.8 85.8 2.0 3.5 0.55 0.45
Var-22 VB11-001 0.68 597 83.4 86.7 9.1 13.8 0.79 0.57
Var-23 VB11-001 0.64 590 78.0 79.8 10.5 16.2 0.75 0.57
Var-27 VB11-001 0.57 544 84.2 84.2 11.6 22.8 0.77 0.62
Var-29 VB11-002 2.15 634 72.9 74.4 7.0 12.5 0.59 0.50
Var-31 VB11-002 0.44 304 72.4 77.2 4.0 4.4 0.63 0.59
Var-33 VB11-002 0.16 158 74.8 74.8 10.9 14.7 0.42 0.60
Var-36 VB11-002 0.79 562 84.8 84.8 1.7 2.2 0.40 0.43
Var-38 VB11-002 0.61 827 85.4 85.4 4.0 6.3 0.54 0.48
Var-40 VB11-002 1.00 1,070 79.5 83.0 5.2 9.8 0.63 0.60
Var-42 VB11-002 1.25 608 85.6 85.6 7.4 11.2 0.50 0.79
Var-43 VB11-002 0.54 391 87.0 87.0 8.4 11.7 0.44 0.57
Var-47 VB11-002 0.47 723 83.0 85.0 8.3 14.2 0.65 0.63
Var-52 VB11-002 0.68 677 78.2 82.4 5.4 13.6 0.47 0.75
Var-53 VB11-002 0.92 938 87.0 87.0 10.9 23.2 0.71 1.30
Var-56 MHT001 0.78 269 71.9 75.6 15.7 20.1 0.48 1.20
Var-63 MHT004 0.70 383 79.0 78.7 8.4 17.6 0.59 0.61
Var-66 VB11-003 1.04 290 90.3 90.3 3.3 7.0 0.47 0.55
Var-81 VB11-009 0.69 342 85.8 85.6 44.4 59.1 0.86 0.57
Var-86 VB11-009 1.31 517 79.5 81.7 8.1 21.6 0.75 1.22
Var-89 VB11-009 0.37 1,218 83.7 86.7 5.1 8.5 0.61 0.53
Var-91 VB11-010 0.59 348 83.0 83.0 40.4 54.0 0.69 0.96
Var-97 VB11-010 0.48 862 83.0 85.3 4.8 15.4 0.47 0.73
Var-98 VB11-010 0.64 963 90.8 90.6 5.4 13.3 0.63 0.96
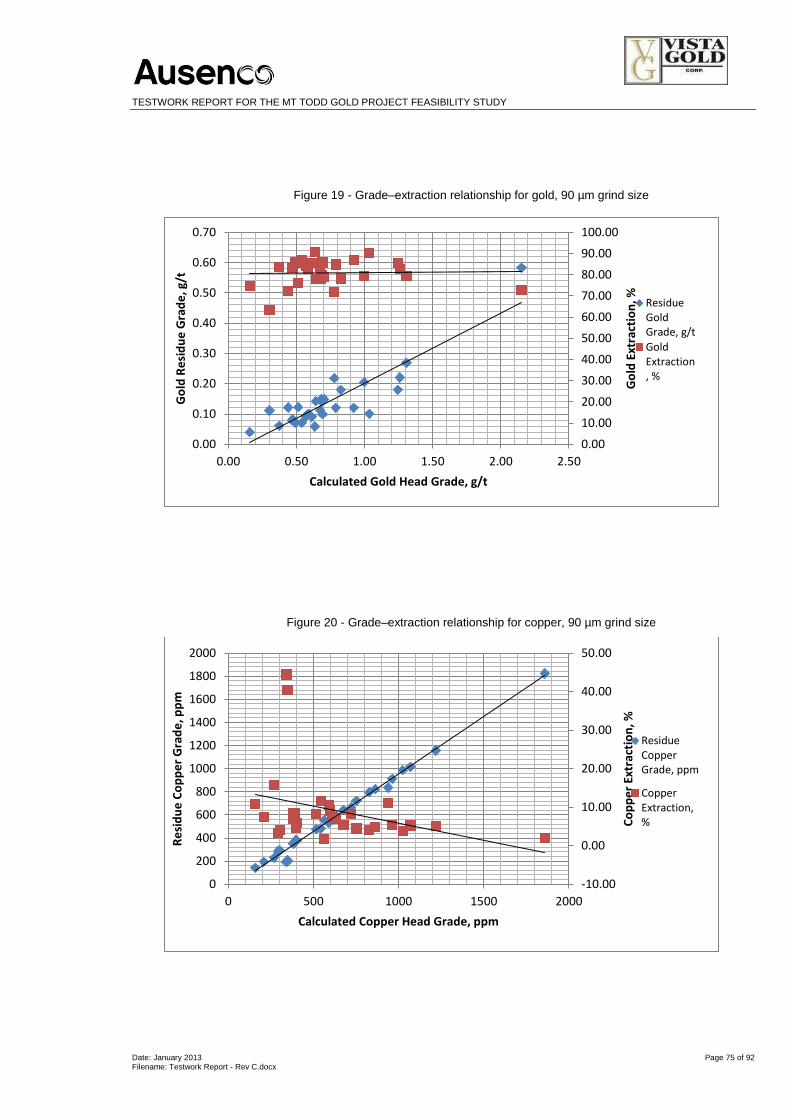
TESTWORK REPORT FOR THE MT TODD GOLD PROJECT FEASIBILITY STUDY
Date: January 2013 Page 75 of 92 Filename: Testwork Report - Rev C.docx
Figure 19 - Grade–extraction relationship for gold, 90 µm grind size
Figure 20 - Grade–extraction relationship for copper, 90 µm grind size
0.00
10.00
20.00
30.00
40.00
50.00
60.00
70.00
80.00
90.00
100.00
0.00
0.10
0.20
0.30
0.40
0.50
0.60
0.70
0.00 0.50 1.00 1.50 2.00 2.50
Go
ld E
xtra
ctio
n, %
Go
ld R
esi
du
e G
rad
e, g
/t
Calculated Gold Head Grade, g/t
ResidueGoldGrade, g/t
GoldExtraction, %
-10.00
0.00
10.00
20.00
30.00
40.00
50.00
0
200
400
600
800
1000
1200
1400
1600
1800
2000
0 500 1000 1500 2000
Co
pp
er
Extr
acti
on
, %
Re
sid
ue
Co
pp
er
Gra
de
, pp
m
Calculated Copper Head Grade, ppm
ResidueCopperGrade, ppm
CopperExtraction,%

TESTWORK REPORT FOR THE MT TODD GOLD PROJECT FEASIBILITY STUDY
Date: January 2013 Page 76 of 92 Filename: Testwork Report - Rev C.docx
Figure 21 - Copper extraction verses depth, drill holes VB11-009 and VB11-010
1.11 Bulk Leaches
Three bulk leaches (2 x 15 kg and 1 x 9 kg samples) were completed on the master composite sample at
125 µm. The purpose of the 9 kg leach was to provide sample for the sequential CIP tests, and that of the
15 kg bulk leaches was to provide sufficient feedstock for the cyanide detoxification testwork.
The bulk leach tests were performed under the conditions noted in Section 1.8.6. The 15kg tests were
performed as CIL tests, while the 9kg test was a straight leach test. These results are summarised in
Table 47.
Table 47 - Bulk Leach Tests
Composite Gold extraction, %
Copper extraction, %
Consumption Reference Test
12 h 24 h 12 h 24 h
NaCN (kg/t)
Lime (kg/t)
Master, 15 kg 78.8 78.8 4.2 4.2 0.46 0.44 WH4270
Master, 15 kg 78.4 78.4 6.0 6.0 0.41 0.45 WH4271
Master, 9 kg 84.6 84.6 3.3 3.3 0.46 0.44 WH4158
The extraction results of the 15 kg bulk leaches are comparable to the 3 kg batch tests at 125 µm. The
gold extraction result for the 9 kg test was much higher at 84.6%, with a lower copper extraction of 3.3%.
This was the only bulk leach test completed without carbon addition. The cyanide consumption of
0.20 kg/t is lower than the average consumption for the variability leach tests.
0.0
5.0
10.0
15.0
20.0
25.0
30.0
35.0
40.0
45.0
50.0
0 20 40 60 80 100 120
Co
pp
er
Extr
acti
on
, %
Depth, m
125 micron
90 micron
Expon. (125 micron)
Expon. (90 micron)

TESTWORK REPORT FOR THE MT TODD GOLD PROJECT FEASIBILITY STUDY
Date: January 2013 Page 77 of 92 Filename: Testwork Report - Rev C.docx
1.12 Ancillary Testwork
1.12.1 Carbon Adsorption Testwork
The 9 kg bulk leach test completed on the master composite sample was subjected to sequential CIP
testwork to determine carbon adsorption kinetics for both gold and copper. The Fleming model was used
to define the carbon kinetics. The Fleming constants are presented in Table 48.
Table 48 - Fleming Constants, Testwork
Composite
Gold loading kinetics Copper loading kinetics
Reference Test
Fleming k h-1 Fleming n Fleming k h
-1 Fleming n
Master 164.54 0.71 2.51 0.868 WH4158
The carbon adsorption kinetics results for gold, summarised in Table 48, indicate fast adsorption kinetics
and no unusual loading characteristics. By comparison, industry standard results are:
Rate constant, k ranging from 60 to 200, nominal 150
Time constant, n ranging from 0.4 to 1.0, nominal 0.6.
The Fleming coefficients derived for copper are not relevant for the Mt Todd CIL design as the copper
loading will be controlled by NaCN addition. As has been demonstrated in the variability leach tests,
maintaining a high NaCN concentration is successful at keeping the copper from loading onto the carbon.
The Fleming rate constants selected for design are shown in Table 49.
Table 49 - Fleming Constants, Design
Composite
Gold loading kinetics
Reference Test
Fleming k h-1 Fleming n
Master 125 0.6 WH4158
1.12.2 Oxygen Uptake Rate
A test to determine the oxygen uptake rate was completed on the master composite sample. The oxygen
consumption of the pulp was measured by monitoring the dissolved oxygen concentration of the pulp
while sparging with air. The total oxygen (with air sparging) consumption for a 6-hour period for the
master composite is shown in Table 50.

TESTWORK REPORT FOR THE MT TODD GOLD PROJECT FEASIBILITY STUDY
Date: January 2013 Page 78 of 92 Filename: Testwork Report - Rev C.docx
Table 50 - Oxygen uptake rate (master composite)
Composite Oxygen Uptake after 6 hours
(mg/L/min)
Master 0.019
The oxygen uptake over a 24 hour time period is shown in Figure 22. The results show a low oxygen
consumption rate of less than 0.02 mg/L/min after 6 hours, supporting the use of air sparging rather than
oxygen sparging.
Figure 22 - Oxygen uptake rate (master composite)
1.12.3 Viscosity Testwork
Slurry viscosity was measured at pulp solids concentrations of 45, 50, 55, 60 and 65% w/w solids at
pH 10.5 adjusted with lime for the master composite sample ground to a P80 of 125 µm. The results are
shown in Figure 23 and summarised in Table 51 for various shear rates.
Table 51 – Slurry Apparent Viscosity
Shear rate Viscosity (cps) at various pulp densities
(s-1) 45% w/w 50% w/w 55% w/w 60% w/w 65% w/w
4.2 0 0 43 1,512 1,069
7.4 0 0 51 1,042 1,051
13.1 0 0 63 726 934
21.9 0 0 75 465 567
38.9 0 0 87 289 365
67.4 0 0 98 217 246
119.2 32 36 103 173 210
209.5 48 53 118 148 202
-0.0200
-0.0100
0.0000
0.0100
0.0200
0.0300
0.0400
0.0500
0.0600
0.0700
0 5 10 15 20 25Oxy
gen
Up
take
rat
e, m
g/L/
min
Residence time, h

TESTWORK REPORT FOR THE MT TODD GOLD PROJECT FEASIBILITY STUDY
Date: January 2013 Page 79 of 92 Filename: Testwork Report - Rev C.docx
Comments include:
the slurry has very low viscosities at pulp densities of 50% w/w solids and below
the slurry behaves like a pseudoplastic Non-Newtonian (Bingham plastic) fluid at pulp densities
above 55% w/w solids, with a constant shear rate required to initiate flow
This testwork was completed prior to determining the final optimised grind of P80 90 µm and it is
likely that a finer grind will impact slurry viscosity. Additional rheology test work at the final optimum
grind size is recommended
If the Mt Todd CIL circuit was to be operated at 55% w/w solids, the residence time of the system
will be reduced to about 17 hours, which will result in a 1.0% drop in gold recovery.
Figure 23 - Viscosity versus Shear Rate (master composite)
1.13 Agitator Testwork
Agitator test work was performed by SPX Flow Technology on a master composite sample at a grind size
of 125 µm. The objective of this work was to observe the mixing performance at pulp densities of 45, 50,
55, 60 and 65% w/w solids. Lime was added to the slurry to increase the pH to 11 to simulate the CIL
operating conditions. Carbon was added to the system to observe any tendency of the carbon to floating.
Based on the results, SPX Flow Technology recommended an agitator design and maximum pulp
density. The full report can be found in Appendix 1.2. The results are summarised below:
SPX recommended against operating at 65% w/w solids as carbon was observed to float and
unacceptable mixing performance was observed
at 60% w/w solids the slurry was observed to be more free flowing and mixing was greatly
improved, with good carbon distribution and SPX predicted no potential issues operating at this
density in a full-scale tank
at pulp densities lower than 60% w/w solids, mixing performance was acceptable.
0
500
1000
1500
2000
0 10 20 30 40 50 60 70 80 90 100 110 120 130 140 150 160 170 180 190 200 210
VIS
CO
SIT
Y (
cp
s)
SHEAR RATE (SEC-1 )
VISCOSITY vs SHEAR RATE
65% SOLIDS (w/w)
60% SOLIDS (w/w)
55% SOLIDS (w/w)
50% SOLIDS (w/w)
45% SOLIDS (w/w)

TESTWORK REPORT FOR THE MT TODD GOLD PROJECT FEASIBILITY STUDY
Date: January 2013 Page 80 of 92 Filename: Testwork Report - Rev C.docx
1.14 Materials Handling
TUNRA Bulk Solids Handling Research Associates completed test work to determine the flow
characteristics of the Batman ore, with respect to the design of chutes and bins in the process plant. The
full report can be found in Appendix 1.2. The results are summarised below:
the Batman ore was classified as being a “moderately easy handling material” with a low bulk
strength
reasonably low wall friction was observed with both stainless steel 3CR12 and bisplate 500,
making either material suitable for use as chute and bin liners
the measured maximum angle of repose was ~35°
the Batman ore has a very low propensity to form stable rat-holes.
1.15 Cyanide Destruction
Cyanide destruction tests were completed on leach residue of the master composite. The
air/SO2/Cu2+ cyanide destruction technology was tested.
The slurry used in the cyanide destruction testwork was taken from a bulk leach test performed under the
optimised conditions outlined in Section 1.8.6 and a 125 µm grind.
A sample of leach residue solution from each test was taken for detailed analysis and the results are
summarised in Table 52.
Table 52 - Leach Residue Solution Analysis
Analyte Unit WH4270 WH4271 Reference Test
CNFREE mg/L 133 133 WH4270 & WH4271
CNWAD mg/L 182 214 WH4270 & WH4271
CNTOTAL mg/L 213 230 WH4270 & WH4271
Cu mg/L 34.1 40.4 WH4270 & WH4271
Ni mg/L 0.65 0.6 WH4270 & WH4271
Pb Mg/L 0.05 <0.05 WH4270 & WH4271
Zn mg/L 5.3 7.2 WH4270 & WH4271
Fe mg/L 11.4 5.9 WH4270 & WH4271
The results of the air/SO2/Cu2+ tests on the leach residue slurries are summarised in Table 53 and Table
54.

TESTWORK REPORT FOR THE MT TODD GOLD PROJECT FEASIBILITY STUDY
Date: January 2013 Page 81 of 92 Filename: Testwork Report - Rev C.docx
Table 53 - Air–SO2 Test Results, Sample WH4270
Test No
Reagent Addition Tails
Reference Test SO2 Cu2+
Ca(OH)2
(g/gSO2) CNWAD
(ppm) CNTOT (ppm)
Cu ppm
Fe ppm
(g/g CN)
(ppm)
D1 2.7 26 0.50 39.0 40.2 23.2 0.4 WH4270/D1
D2 3.4 27 0.83 39.5 41.6 20.4 0.8 WH4270/D2
D3 3.5 24 2.36 27.2 28.1 17.0 0.4 WH4270/D3
D4 5.0 24 1.64 0.6 5.35 0.7 1.7 WH4270/D4
D5 4.9 23 1.46 2.4 19.5 0.2 6.1 WH4270/D5
D6 4.6 5 1.42 2.0 8.29 2.1 2.2 WH4270/D6
Table 54 - Air–SO2 test results, sample WH4271
Test No
Reagent Addition Tails
Reference Test SO2 Cu2+
Ca(OH)2 (g/gSO2) CNWAD (ppm) CNTOT (ppm)
Cu ppm
Fe ppm
(g/g CN) (ppm)
D7 2.7 0 0.9 18.8 19.8 3.5 0.4 WH4271/D7
D8 3.7 0 1.3 0.9 1.3 1.8 0.2 WH4271/D8
D9 4.3 0 0.2 7.1 7.4 1.6 0.1 WH4271/D9
D10 5.0 0 0.9 1.4 3.2 1.6 0.6 WH4271/D10
D11 5.2 21 1.1 0.8 1.1 1.2 0.1 WH4271/D11
D12 4.7 11 2.3 0.4 1.0 1.3 0.2 WH4271/D12
The results from Table 53 and Table 54 indicate that:
the air/SO2/Cu2+ method successfully reduces CNWAD to levels of less than 10 ppm
sample WH4270 required a SO2:CN ratio of between 4.5 and 4.7 to reduce CN levels below the
target of 10 ppm
sample WH4271 required a SO2:CN ratio of 4.2 to 4.4
a SO2:CN ratio of 4.3 was selected for design
a copper dosage of 25 ppm to 30 ppm appears to be effective in eliminating dissolved iron in
sample WH4270, though in general, copper dosage had a negligible effect on CN elimination. No
copper was added to eliminate dissolved iron in sample WH4271, as it appears enough copper had
leached into the solution from the ore to supply adequate copper for the process. There is therefore
no requirement for copper addition into the dexoficiation circuit

TESTWORK REPORT FOR THE MT TODD GOLD PROJECT FEASIBILITY STUDY
Date: January 2013 Page 82 of 92 Filename: Testwork Report - Rev C.docx
the lime dosage requirement was in the range of 1.4-1.6 g/g SO2 for sample WH4270
the lime requirement for sample WH4271 was 0.9-1.3 g/g SO2
a lime ratio of 1.3 g/g SO2 was selected for design
raising the slurry pH seemed to be detrimental to the process, resulting in higher residual iron in
solution.
1.16 Thickener Testwork
Settling rate test work was carried out by Outotec on the master composite sample at a grind size of
125 µm. Initial flocculant screening tests were conducted on the master composite sample to select the
most appropriate flocculant for the thickener test work program. The flocculants tested were from the
BASF range: types 10, 342, 800HP, 1011 and 919. Magnafloc 10 was selected as it was the best
performing flocculant in terms of free settling rate and overflow clarity. The thickener test results are
presented in Table 55.
Table 55 - Thickener Testwork Results
Slurry pH
Feed
Floc dosage
rate (g/t)
Overflow clarity (ppm)
Underflow Solids
Reference Test Settling rate
(t/m2.h)
Pulp density (%
w/w)
Pulp density (%w/w)
Vane yield
stress (Pa)
10.4 0.2 12.5 18 < 100 70.9 141 Report S1817
10.4 0.4 12.5 18 < 100 69.1 103 Report S1817
10.4 0.8 12.5 18 < 100 65.2 54 Report S1817
10.4 1.2 12.5 18 < 100 63.1 39 Report S1817
10.4 1.6 12.5 18 < 200 63.2 34 Report S1817
10.4 0.8 12.5 12 < 100 65.4 50 Report S1817
10.4 0.8 12.5 6 < 100 65.1 36 Report S1817
10.4 0.8 12.5 6 < 100 65.1 36 Report S1817

TESTWORK REPORT FOR THE MT TODD GOLD PROJECT FEASIBILITY STUDY
Date: January 2013 Page 83 of 92 Filename: Testwork Report - Rev C.docx
The test work indicates that:
the target underflow density of 60% w/w was achieved in all tests with overflow clarities less than
200 ppm
prior to the completion of the thickener testwork, a specific settling rate of 1.5 t/m2/h was assumed,
which was based on industry experience using high rate thickeners for similar ores. The
requirement for a 38 m thickener was derived using this value. Due to time constraints it was
necessary to proceed before the testwork was reported and quotes were sought for a 39 m
thickener, having conservatively added 1 m to the diameter, which equates to a specific settling
rate of 1.4 t/m2.h. Review of the testwork results determined that a 39 m thickener would satisfy
the Batman ore requirements as settling rates up to 1.64 t/m2/h achieved underflow densities in
excess of the target 60% w/w solids with acceptable overflow clarities less than 200 ppm dissolved
solids. A specific settling rate of 1.4 t/m2/h was selected for the design
a flocculant addition rate of 18 g/t was used for operating cost calculations
additional work was completed to compare using a larger diameter thickener with a lower flocculant
consumption. This is discussed in Section 3.4.2.
1.17 Flotation Testwork
Rougher flotation test work was completed on the master composite sample to investigate the possibility
of separating the gold bearing sulfide and silica minerals. A sub-sample of the master composite sample
was crushed, and ground to a P80 of 250 µm. The test work was carried out using two different silica
flotation reagents. Results are shown in Table 56.
Table 56 - Rougher Flotation Testwork Results
Silica Collector
Concentrate Grades and Recoveries Tails Grade
Reference Test Wt. (%)
Au (ppm)
Au Recovery
(%)
Cu (ppm)
Cu Recovery
(%)
Au (ppm)
Cu (ppm)
F2835 14.0 3.5 52.6 3,533 85.2 0.5 100 WH3785
D817M 22.2 2.2 56.4 2,022 85.2 0.5 100 WH3786
Comments include:
the LF B17M collector test achieved 56.36% Au recovery with 22.16% mass pull to the
concentrate, giving an overall concentrate grade of 2.2 g/t Au
the Flotagen 2835 collector achieved 52.55% Au recovery with 14.00% mass pull to the
concentrate, giving an overall concentrate grade of 3.5 g/t Au
copper recovery was high for both tests
due to the poor gold recovery, flotation of Batman ore is not appropriate.
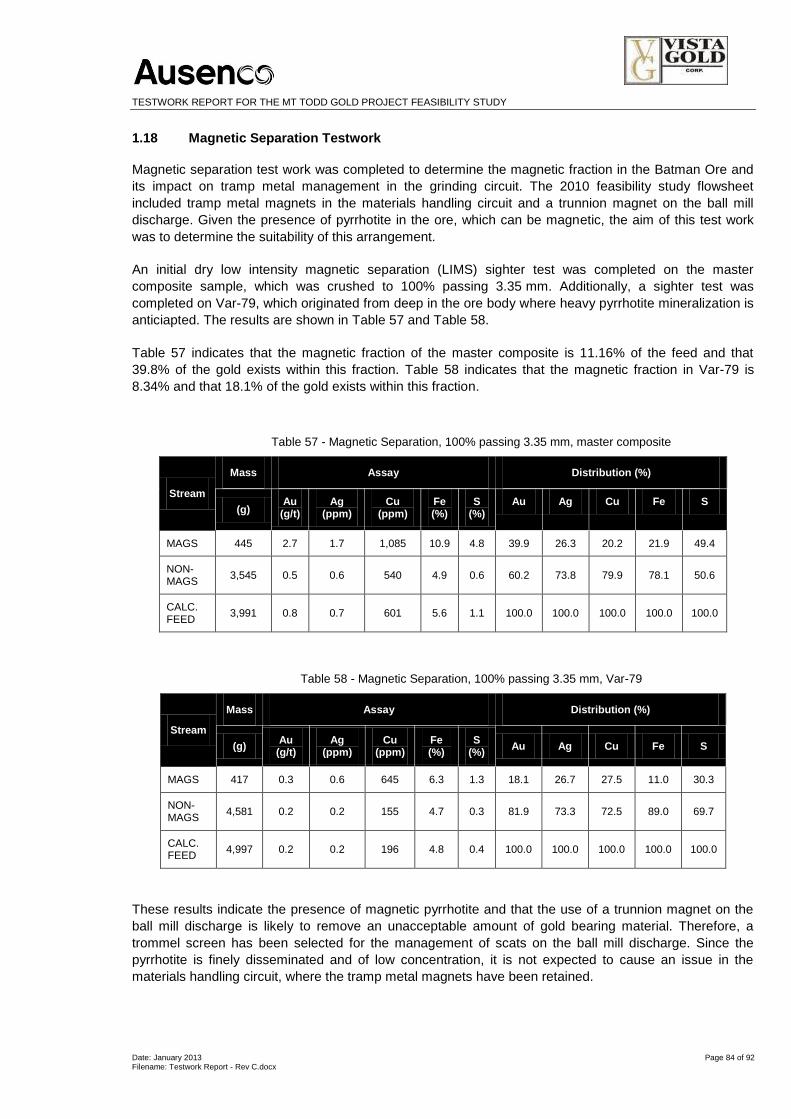
TESTWORK REPORT FOR THE MT TODD GOLD PROJECT FEASIBILITY STUDY
Date: January 2013 Page 84 of 92 Filename: Testwork Report - Rev C.docx
1.18 Magnetic Separation Testwork
Magnetic separation test work was completed to determine the magnetic fraction in the Batman Ore and
its impact on tramp metal management in the grinding circuit. The 2010 feasibility study flowsheet
included tramp metal magnets in the materials handling circuit and a trunnion magnet on the ball mill
discharge. Given the presence of pyrrhotite in the ore, which can be magnetic, the aim of this test work
was to determine the suitability of this arrangement.
An initial dry low intensity magnetic separation (LIMS) sighter test was completed on the master
composite sample, which was crushed to 100% passing 3.35 mm. Additionally, a sighter test was
completed on Var-79, which originated from deep in the ore body where heavy pyrrhotite mineralization is
anticiapted. The results are shown in Table 57 and Table 58.
Table 57 indicates that the magnetic fraction of the master composite is 11.16% of the feed and that
39.8% of the gold exists within this fraction. Table 58 indicates that the magnetic fraction in Var-79 is
8.34% and that 18.1% of the gold exists within this fraction.
Table 57 - Magnetic Separation, 100% passing 3.35 mm, master composite
Stream
Mass Assay Distribution (%)
(g) Au
(g/t) Ag
(ppm) Cu
(ppm) Fe (%)
S (%)
Au Ag Cu Fe S
MAGS 445 2.7 1.7 1,085 10.9 4.8 39.9 26.3 20.2 21.9 49.4
NON-MAGS
3,545 0.5 0.6 540 4.9 0.6 60.2 73.8 79.9 78.1 50.6
CALC. FEED
3,991 0.8 0.7 601 5.6 1.1 100.0 100.0 100.0 100.0 100.0
Table 58 - Magnetic Separation, 100% passing 3.35 mm, Var-79
Stream
Mass Assay Distribution (%)
(g) Au
(g/t) Ag
(ppm) Cu
(ppm) Fe (%)
S (%)
Au Ag Cu Fe S
MAGS 417 0.3 0.6 645 6.3 1.3 18.1 26.7 27.5 11.0 30.3
NON-MAGS
4,581 0.2 0.2 155 4.7 0.3 81.9 73.3 72.5 89.0 69.7
CALC. FEED
4,997 0.2 0.2 196 4.8 0.4 100.0 100.0 100.0 100.0 100.0
These results indicate the presence of magnetic pyrrhotite and that the use of a trunnion magnet on the
ball mill discharge is likely to remove an unacceptable amount of gold bearing material. Therefore, a
trommel screen has been selected for the management of scats on the ball mill discharge. Since the
pyrrhotite is finely disseminated and of low concentration, it is not expected to cause an issue in the
materials handling circuit, where the tramp metal magnets have been retained.

TESTWORK REPORT FOR THE MT TODD GOLD PROJECT FEASIBILITY STUDY
Date: January 2013 Page 85 of 92 Filename: Testwork Report - Rev C.docx
1.19 Recovery and Reagent Consumption
Leach extraction and reagent consumption data for all leach tests undertaken on the main composites at
the optimum leach conditions and a grind size of 90 µm have been collated in Table 59. These tests
correspond with the following composite samples:
Tests 1 and 2 were performed on the master composite sample as part of the grind optimisation
exercise
Tests 3 to 6 were performed on the 2010 HPGR composite.
Leach extractions and reagent consumptions for the leach variability composites that are above the
project head grade cut off of 0.4 g/t Au are shown in Table 60. All tests were performed in the presence of
20 g/L of carbon. Recovery onto carbon was recorded for both gold and copper, which is listed in the
tables. The recovery onto carbon is only an indicative result as all tests were performed with fresh carbon,
whereas in plant operation the carbon will have a degree of fouling.
The reagent consumptions presented in Table 60 have been adjusted for a 24-hour residence time.
Table 59 - Leach results at optimised conditions (24 h), main composites, 90 µm
Test No
Calc. Head Leach Extraction Recovery to carbon Consumption
Reference Test Au Cu
Au (%) Cu (%) Au (%) Cu (%) NaCN (kg/t) Lime (kg/t)
(g/t) (ppm)
1 0.8 554 80.8 5.5 80.6 1.1 0.45 0.42 WH 4461
2 0.9 575 83.9 6.4 83.7 0.9 0.64 0.43 WH 4462
3 0.9 694 82.3 9.2 82.1 1.0 0.77 0.57 WH 4570
4 0.9 680 81.7 9.6 81.5 1.1 0.77 0.56 WH 4571
5 0.9 619 81.9 10.4 81.7 1.9 0.64 0.60 WH 4612
6 0.9 669 81.4 9.6 81.2 1.6 0.63 0.66 WH 4613
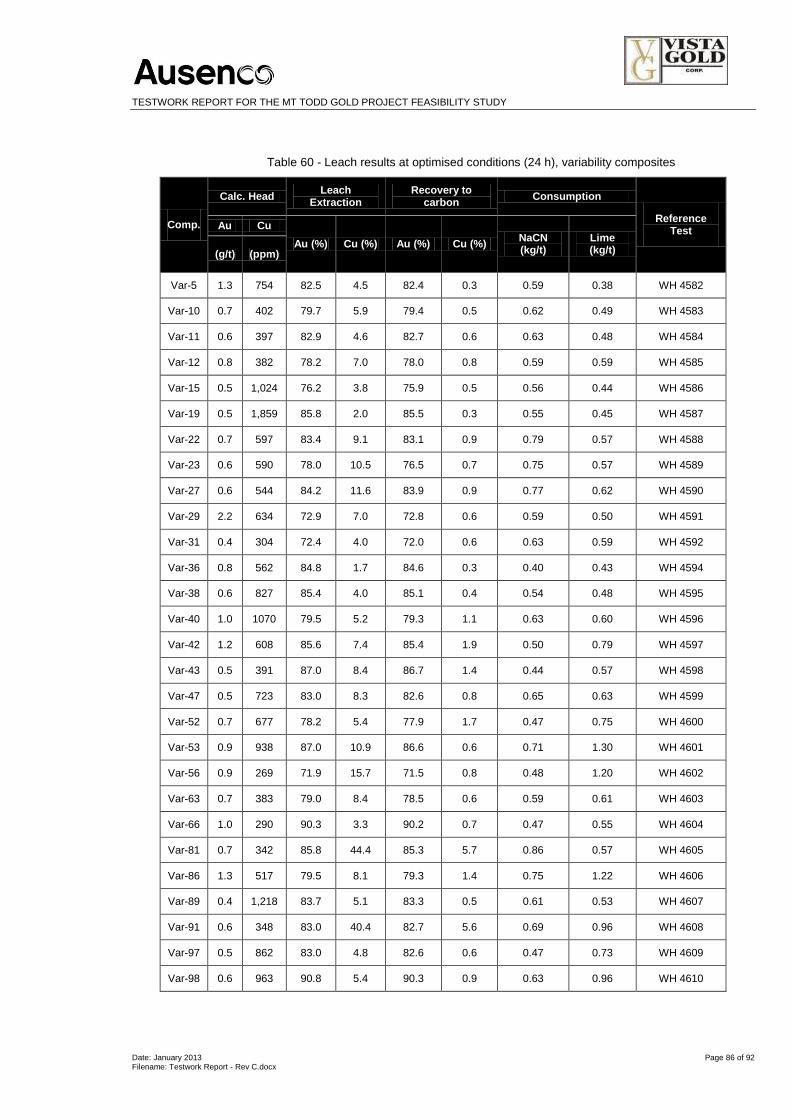
TESTWORK REPORT FOR THE MT TODD GOLD PROJECT FEASIBILITY STUDY
Date: January 2013 Page 86 of 92 Filename: Testwork Report - Rev C.docx
Table 60 - Leach results at optimised conditions (24 h), variability composites
Comp.
Calc. Head Leach
Extraction Recovery to
carbon Consumption
Reference Test
Au Cu
Au (%) Cu (%) Au (%) Cu (%) NaCN (kg/t)
Lime (kg/t) (g/t) (ppm)
Var-5 1.3 754 82.5 4.5 82.4 0.3 0.59 0.38 WH 4582
Var-10 0.7 402 79.7 5.9 79.4 0.5 0.62 0.49 WH 4583
Var-11 0.6 397 82.9 4.6 82.7 0.6 0.63 0.48 WH 4584
Var-12 0.8 382 78.2 7.0 78.0 0.8 0.59 0.59 WH 4585
Var-15 0.5 1,024 76.2 3.8 75.9 0.5 0.56 0.44 WH 4586
Var-19 0.5 1,859 85.8 2.0 85.5 0.3 0.55 0.45 WH 4587
Var-22 0.7 597 83.4 9.1 83.1 0.9 0.79 0.57 WH 4588
Var-23 0.6 590 78.0 10.5 76.5 0.7 0.75 0.57 WH 4589
Var-27 0.6 544 84.2 11.6 83.9 0.9 0.77 0.62 WH 4590
Var-29 2.2 634 72.9 7.0 72.8 0.6 0.59 0.50 WH 4591
Var-31 0.4 304 72.4 4.0 72.0 0.6 0.63 0.59 WH 4592
Var-36 0.8 562 84.8 1.7 84.6 0.3 0.40 0.43 WH 4594
Var-38 0.6 827 85.4 4.0 85.1 0.4 0.54 0.48 WH 4595
Var-40 1.0 1070 79.5 5.2 79.3 1.1 0.63 0.60 WH 4596
Var-42 1.2 608 85.6 7.4 85.4 1.9 0.50 0.79 WH 4597
Var-43 0.5 391 87.0 8.4 86.7 1.4 0.44 0.57 WH 4598
Var-47 0.5 723 83.0 8.3 82.6 0.8 0.65 0.63 WH 4599
Var-52 0.7 677 78.2 5.4 77.9 1.7 0.47 0.75 WH 4600
Var-53 0.9 938 87.0 10.9 86.6 0.6 0.71 1.30 WH 4601
Var-56 0.9 269 71.9 15.7 71.5 0.8 0.48 1.20 WH 4602
Var-63 0.7 383 79.0 8.4 78.5 0.6 0.59 0.61 WH 4603
Var-66 1.0 290 90.3 3.3 90.2 0.7 0.47 0.55 WH 4604
Var-81 0.7 342 85.8 44.4 85.3 5.7 0.86 0.57 WH 4605
Var-86 1.3 517 79.5 8.1 79.3 1.4 0.75 1.22 WH 4606
Var-89 0.4 1,218 83.7 5.1 83.3 0.5 0.61 0.53 WH 4607
Var-91 0.6 348 83.0 40.4 82.7 5.6 0.69 0.96 WH 4608
Var-97 0.5 862 83.0 4.8 82.6 0.6 0.47 0.73 WH 4609
Var-98 0.6 963 90.8 5.4 90.3 0.9 0.63 0.96 WH 4610
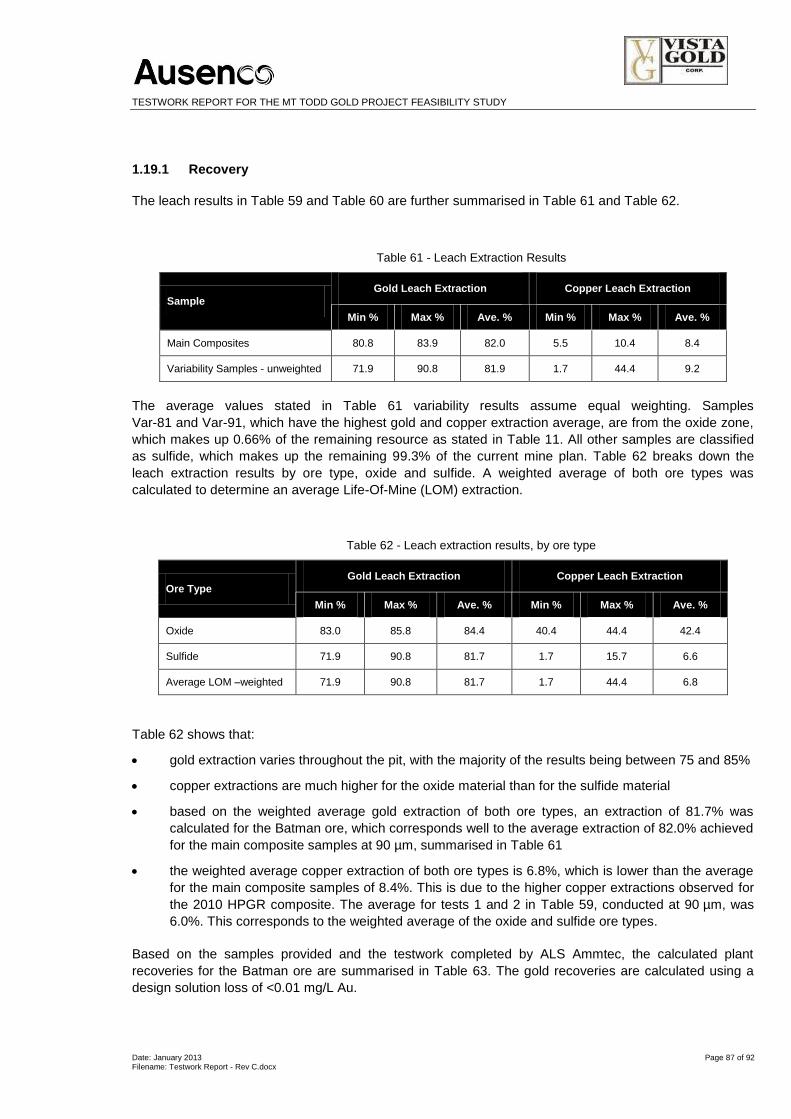
TESTWORK REPORT FOR THE MT TODD GOLD PROJECT FEASIBILITY STUDY
Date: January 2013 Page 87 of 92 Filename: Testwork Report - Rev C.docx
1.19.1 Recovery
The leach results in Table 59 and Table 60 are further summarised in Table 61 and Table 62.
Table 61 - Leach Extraction Results
Sample
Gold Leach Extraction Copper Leach Extraction
Min % Max % Ave. % Min % Max % Ave. %
Main Composites 80.8 83.9 82.0 5.5 10.4 8.4
Variability Samples - unweighted 71.9 90.8 81.9 1.7 44.4 9.2
The average values stated in Table 61 variability results assume equal weighting. Samples
Var-81 and Var-91, which have the highest gold and copper extraction average, are from the oxide zone,
which makes up 0.66% of the remaining resource as stated in Table 11. All other samples are classified
as sulfide, which makes up the remaining 99.3% of the current mine plan. Table 62 breaks down the
leach extraction results by ore type, oxide and sulfide. A weighted average of both ore types was
calculated to determine an average Life-Of-Mine (LOM) extraction.
Table 62 - Leach extraction results, by ore type
Ore Type
Gold Leach Extraction Copper Leach Extraction
Min % Max % Ave. % Min % Max % Ave. %
Oxide 83.0 85.8 84.4 40.4 44.4 42.4
Sulfide 71.9 90.8 81.7 1.7 15.7 6.6
Average LOM –weighted 71.9 90.8 81.7 1.7 44.4 6.8
Table 62 shows that:
gold extraction varies throughout the pit, with the majority of the results being between 75 and 85%
copper extractions are much higher for the oxide material than for the sulfide material
based on the weighted average gold extraction of both ore types, an extraction of 81.7% was
calculated for the Batman ore, which corresponds well to the average extraction of 82.0% achieved
for the main composite samples at 90 µm, summarised in Table 61
the weighted average copper extraction of both ore types is 6.8%, which is lower than the average
for the main composite samples of 8.4%. This is due to the higher copper extractions observed for
the 2010 HPGR composite. The average for tests 1 and 2 in Table 59, conducted at 90 µm, was
6.0%. This corresponds to the weighted average of the oxide and sulfide ore types.
Based on the samples provided and the testwork completed by ALS Ammtec, the calculated plant
recoveries for the Batman ore are summarised in Table 63. The gold recoveries are calculated using a
design solution loss of <0.01 mg/L Au.

TESTWORK REPORT FOR THE MT TODD GOLD PROJECT FEASIBILITY STUDY
Date: January 2013 Page 88 of 92 Filename: Testwork Report - Rev C.docx
Table 63 - Design Recoveries
Ore type Gold Recovery, % Copper Recovery, %
Oxide 83.6 5.63
Sulfide 80.9 0.78
Overall - weighted 81.0 0.82
1.19.2 Reagent Consumption
The cyanide and lime consumptions from the variability test work results shown in Table 59 and Table 60
are further summarised in Table 64. Table 65 further breaks down the reagent consumption results by
ore type. The average values stated are a weighted average based on the proportion of each ore type in
the mine plan.
Table 64 - Reagent consumptions from leach testwork only
Sample
Cyanide Consumption Lime Consumption
(60% CaO)
Min Max
Ave. (kg/t)
Min Max
Ave. (kg/t)
(kg/t) (kg/t) (kg/t) (kg/t)
Main Composites 0.45 0.77 0.65 0.42 0.66 0.54
Variability Samples - not weighted 0.46 0.86 0.61 0.38 0.70 0.54
Table 65 - Reagent consumptions from leach testwork only, by ore type
Ore Type
Cyanide Consumption Lime Consumption
(60% CaO)
Min Max
Ave. (kg/t)
Min Max
Ave. (kg/t)
(kg/t) (kg/t) (kg/t) (kg/t)
Oxide 0.69 0.86 0.77 0.57 0.70 0.64
Sulfide 0.40 0.79 0.59 0.38 0.66 0.54
Overall - weighted 0.40 0.79 0.59 0.38 0.66 0.54

TESTWORK REPORT FOR THE MT TODD GOLD PROJECT FEASIBILITY STUDY
Date: January 2013 Page 89 of 92 Filename: Testwork Report - Rev C.docx
Table 64 and Table 65 show that:
The average cyanide consumption for the variability samples is similar to that of the main
composite samples. The highest cyanide consumers (>0.8 kg/t) averaged approximately 120 mg/L
of copper in solution at 24 hours. The average for the rest of the samples was half this value at
60 mg/L. Therefore the presence of cyanide soluble copper presents the biggest risk for increased
cyanide consumption
oxide ore has a considerably higher cyanide consumption rate of 0.77 kg/t compared to 0.59 kg/t
for the sulfide ore. This highlights the importance of blending this material into the plant slowly to
avoid upsetting plant operations
the average lime consumption is similar for the master composite and the variability samples. Var-
91, which is oxide ore, had the highest lime consumption at 0.70 kg/t consumption
as per cyanide, the oxide ore has a higher lime consumption of 0.64 kg/t, compared to 0.54 kg/t for
the sulfide ore in the leach circuit (using lime with a 60% w/w CaO content).
The cyanide addition rate needs to be increased to allow for the residual free cyanide at the end of
leaching and to ensure that leaching is complete, and that the CNFREE to copper ratio at the end of the
leach is sufficient to ensure that the copper cyanide complexes exist as Cu(CN)32- or Cu(CN)43-, to
control copper adsorption onto the carbon. It has been calculated that an additional 711 ppm of NaCN
should be maintained for the oxide ore, and an additional 200 ppm should be maintained for the sulfide
ore at the end of the leach. This equates to an additional 0.56 kg/t for the oxide ore, and an additional
0.16 kg/t for the sulfide ore.
In addition to the lime consumptions shown in Table 65, 0.84 kg/t lime for sulfide and 3.10 kg/t lime for
oxide ore is required for the cyanide detoxification circuit. This resulted in a total weighted lime
consumption of 1.40 kg/t lime at 60%w/w solids and equates to a total consumption of 0.91 kg/t at 92%
CaO, which is the quality of the lime sourced for the Mt Todd project.
1.20 Further Recommended Testwork
The following test work should be undertaken prior to the next phase of engineering:
Thickening testwork was completed at a 125 µm grind size and repeat tests at 90 µm are
warranted to confirm the thickener sizing
Viscosity testwork was completed at a 125 µm grind size and repeat tests are recommended at
90 µm to confirm that the CIL circuit can be operated at a 60% w/w solids density.

TESTWORK REPORT FOR THE MT TODD GOLD PROJECT FEASIBILITY STUDY
Date: January 2013 Page 90 of 92 Filename: Testwork Report - Rev C.docx
Appendix 1 – Testwork Sample Selection

TESTWORK REPORT FOR THE MT TODD GOLD PROJECT FEASIBILITY STUDY
Date: January 2013 Page 91 of 92 Filename: Testwork Report - Rev C.docx
Appendix 2 – ALS Ammtec Metallurgical Testwork Report

TESTWORK REPORT FOR THE MT TODD GOLD PROJECT FEASIBILITY STUDY
Date: January 2013 Page 92 of 92 Filename: Testwork Report - Rev C.docx
Appendix 3 – Mt Todd Gold ECS Grind Optimisation Report