Embed Size (px)
Citation preview
i
Disclaimer
This financial report contains forward-looking statements about financial and operational matters. Because they relate to future events and are subject to future circumstances, these forward-looking statements are subject to risks, uncertainties and other factors. As a result, actual financial results, operational performance and other future developments could differ materially from those envisaged by the forward-looking statements.
SSE plc gives no express or implied warranty as to the impartiality, accuracy, completeness or correctness of the information, opinions or statements expressed herein. Neither SSE plc nor its affiliates assume liability of any kind for any damage or loss arising from any use of this document or its contents.
This document does not constitute an offer or invitation to underwrite, subscribe for, or otherwise acquire or dispose of any SSE shares or other securities and the information contained herein cannot be relied upon as a guide to future performance.
Definitions
These financial results for the six months to 30 September 2018 are reported under IFRS, as adopted by the EU.
In order to present the financial results and performance of the Group in a consistent and meaningful way, SSE applies a number of adjusted accounting measures throughout this financial report. These adjusted measures are used for internal management reporting purposes and are believed to present the underlying performance of the Group in the most useful manner for ordinary shareholders and other stakeholders.
The definitions SSE uses for adjusted measures are consistently applied and are explained in the Alternative Performance Measures section before the Summary Financial Statements.
In preparing this financial report SSE has been mindful of the commentary issued in May 2016 by the Financial Reporting Council on the European Securities and Markets Authority’s Guidelines on Alternative Performance Measures. SSE will monitor developing practice in the use of Alternative Performance Measures and will continue to prioritise this, ensuring the financial information in its results statements is clear, consistent and relevant to the users of those statements.
Important note: planned SSE Energy Services transaction
On 8 November 2017, the Board of Directors of SSE plc announced it had entered into an agreement with innogy SE in respect of a proposed demerger of SSE’s household energy and services business in Great Britain (now named SSE Energy Services) and immediate combination of that business with innogy SE’s subsidiary npower to form a new independent UK-based group - to be held by SSE shareholders (following the demerger) and (following the combination) with minority shareholding participation by innogy SE (65.6% and 34.4% respectively). Following the combination, the new independent business will be separately listed on the London Stock Exchange. SSE shareholders will retain their existing SSE shares and will also hold one share in the newly-listed business for every existing SSE plc share they hold at the demerger record date.
In this financial report, this demerger of SSE Energy Services, combination with npower and listing on the London Stock Exchange is described as ‘the planned SSE Energy Services transaction’. On 8 May 2018, the Competition and Markets Authority referred the proposed combination of SSE Energy Services and npower for a so-called ‘Phase 2’ investigation, by a group of independent panel members. SSE shareholders approved resolutions relating to the transaction at a General Meeting on 19 July 2018. The CMA’s final report was published on 10 October 2018 and confirmed that the planned SSE Energy Services transaction does not raise any competition concerns.
At 30 September 2018, SSE has assessed that it is highly probably that SSE Energy Services will be disposed and has presented the assets and liabilities of that business as held for disposal and the business activity as discontinued (see note 4.2. (i) of the Condensed Interim Statements). ‘Held for disposal’, as presented throughout this statement may be either ‘held for sale’ or ‘held for distribution’ as defined by IFRS 5. Therefore, the results of SSE Energy Services have been excluded from the profit and loss metrics. As the Group continues to fund SSE Energy Services, and will do so until completion of the transaction, the capital expenditure and debt related metrics presented include the activity of that business.
Impact of the Retail demerger on the Group’s APMs
The following metrics have been adjusted in all periods presented to exclude the contribution of SSE Energy Services, which has been presented as a discontinued operation as at 30 September 2018:
• Adjusted EBITDA;
• Adjusted operating profit:
• Adjusted profit before tax;
• Adjusted current tax charge; and
• Adjusted earnings per share.
‘Adjusted net debt and hybrid capital’, and ‘investment and capital expenditure’ have not been adjusted as the Group continues to fund SSE Energy Services, and will continue to do so until the date of disposal. SSE Energy Services has no external debt and all intercompany funding to the disposal group continues to eliminate on consolidation, therefore no adjustments are required to the Group’s ‘adjusted net finance cost’ measure.
ii
Table of Contents Outlook ................................................................................................................................................ 1 Focus on core businesses .................................................................................................................... 2 SSE’s financial performance in the six months to 30 September 2018 at-a-glance ............................ 4
Strategic Overview .................................................................................................................................. 6 Group Financial Overview .....................................................................................................................10
Group Financial Review HY 2018/19 .................................................................................................13 Earnings .............................................................................................................................................15 Outlook ..............................................................................................................................................17 Dividend Policy – a five-year plan .....................................................................................................18 Financial management and balance sheet ........................................................................................20 Tax .....................................................................................................................................................23 Financial priorities .............................................................................................................................24
WHOLESALE ...........................................................................................................................................25
Wholesale Key Performance Indicators ............................................................................................25 Introduction to the Wholesale businesses ........................................................................................26 Renewable Energy .............................................................................................................................26 Flexible Thermal Generation .............................................................................................................28 Energy Portfolio Management (EPM) ...............................................................................................28 Gas Production ..................................................................................................................................29 Gas Storage........................................................................................................................................30 Wholesale businesses – Priorities .....................................................................................................30
NETWORKS ............................................................................................................................................32
Networks Key Performance Indicators ..............................................................................................32 Introduction to the Networks businesses .........................................................................................32 Electricity Transmission .....................................................................................................................33 Electricity Distribution .......................................................................................................................35 SGN ....................................................................................................................................................38 Networks businesses – Priorities .......................................................................................................38
RETAIL ....................................................................................................................................................40
Retail Key Performance Indicators ....................................................................................................40 Introduction to the Retail businesses................................................................................................40 SSE Business Energy ..........................................................................................................................40 SSE Enterprise ....................................................................................................................................41 SSE Airtricity ......................................................................................................................................42 SSE Energy Services (Held for disposal) .............................................................................................42 Retail businesses – Priorities .............................................................................................................43
Alternative Performance Measures ......................................................................................................45 Condensed Interim Statements ............................................................................................................51
1
SSE plc Interim results for the six months to 30 September 2018
14 November 2018
This report sets out the interim results for SSE plc for six months to 30 September 2018, which are ahead of the expectations set out in the Trading Statement and Notification of Close Period Statement issued on 12 and 25 September 2018 respectively.
Headline results (excluding SSE Energy Services)
Excluding SSE Energy Services, which is held for disposal:
• adjusted earnings per share is 19.6 pence (down 39.9%);
• adjusted profit before tax is £246.4m (down 40.9%);
• reported loss per share is 22.6 pence; and
• reported loss before tax is £265.3m.
SSE has also today announced the interim dividend per share for 2018/19 of is 29.3 pence, an increase of 3.2%.
SSE is today announcing that it will consolidate the development, operation and ownership of all of its renewable energy assets in the UK and Ireland under a single entity called SSE Renewables.
Revenue – adoption of IFRS15
As a consequence of adoption of IFRS 15 on 1 April 2018, optimisation trading revenue and costs of sales, which were previously presented gross, are now presented within cost of sales on a net basis. This has reduced revenue and cost of sales by £7.9bn in the six months ended 30 September 2018, with no impact on gross profit or the Group’s cashflows.
Outlook
Dividend
SSE continues to intend to recommend a full-year dividend of 97.5 pence per share for 2018/19 and to deliver the five-year dividend plan set out in May 2018.
Adjusted operating profit (excluding SSE Energy Services)
The outlook for SSE’s Networks and Wholesale businesses for the financial year to 31 March 2019 is in line with that set out in its Trading Statement:
• Adjusted operating profit for the Networks businesses is expected to increase by a mid-single digit percentage; and
• Performance of Wholesale businesses will continue to be dependent on the range of factors set out at the start of the financial year; Energy Portfolio Management (EPM), however, is now expected to incur a slightly lower than previously forecast adjusted operating loss for 2018/19, at around £300m, as a result of action taken since September.
Adjusted earnings per share (excluding SSE Energy Services)
Excluding the results for SSE Energy Services, which is now held for disposal, SSE currently expects to deliver adjusted earnings per share in the range of 70p to 75p for 2018/19 as a whole, which compares to 98.3p on a like for like basis for the year ended 31 March 2018.
The forecast adjusted EPS number excludes two gains on sale: £74.2m recognised from the sale in May 2018 of a further 14.9% stake in Clyde Wind farm. A further £53m is expected to be received as a distribution from the Environmental Capital Fund (in which SSE has a 48% stake) as a result of its sale of the independent gas transportation network Indigo Pipelines in November 2018.
2
SSE Energy Services
SSE currently expects that its household Energy Supply Business (part of SSE Energy Services) will report an adjusted operating profit margin of between 2% and 3% for the year ended 31 March 2019 compared to 6.8% in the year ended 31 March 2018, reflecting competitive pressures and the anticipated impact of the Default Tariff Cap from 1 January 2019. Margins are expected to be lower still in 2019/20.
Following Ofgem’s final decisions on the Default Tariff Cap on 6 November and the end of the period for appeals on the CMA’s approval of the proposed transaction on 7 November, SSE and innogy SE made an announcement regarding discussions on revised commercial terms and the potential implications of these discussions for the likelihood and timetable for completing the proposed combination of SSE Energy Services and npower Ltd. As previously stated, these discussions are expected to take place over several weeks and an update on their progress will be provided as soon as possible, and certainly by mid-December.
SSE does not intend to provide further comment on the discussions until such an update, but creating a new independent energy supplier remains its objective. There is now some uncertainty as to whether this transaction can be completed, as originally contemplated; nevertheless, the Board believes that the best future for SSE Energy Services, including its customers and employees, will continue to lie outside the SSE group.
Capital and investment expenditure
SSE’s capital and investment expenditure for 2018/19 is still expected to total around £1.7bn. Around two thirds of this relates to economically-regulated networks and renewable energy. Material progress has been made at key projects such as the new Caithness-Moray transmission link, the Stronelairg onshore wind farm and the Beatrice offshore wind farm, which all continue to be on schedule for completion as planned.
Forecast EPM impact in 2019/20 and new approach to hedging
Looking ahead, the financial impact of the energy portfolio situation set out in the Trading Statement on 12 September 2018 is expected to extend into 2019/20. Following action taken since September, SSE currently expects EPM to report an adjusted operating loss of around £115m in 2019/20 with a potential variation around this of +/-£25m. Thereafter EPM is expected to earn a small profit through service provision.
SSE has today published on sse.com a document setting out its new approach to the management of its energy portfolio, the objective of which is to reduce SSE’s exposure to volatility in energy commodities and so make their impact on shorter-term earnings more visible and predictable. SSE expects to transition to this hedging approach over the period to 31 March 2020.
Focus on core businesses
The evolution of the SSE group of businesses is continuing. SSE is today setting out how it is taking forward its plans to focus on its core businesses of economically-regulated networks and renewables, complemented by flexible thermal generation and business energy sales. This focus is in line with its vision of being a leading energy company in a low carbon world. This includes:
• Setting out options for securing value including planned disposals of stakes in two onshore wind farms; and through partial or full disposal of its investment in Gas Production. Options for use of any proceeds from disposals include debt management, returning value to shareholders through share buy backs and/or creating value through investment. SSE is also engaging with partners to help its Telecoms business deliver value for customers and shareholders.
• Confirming its investment pipeline in Electricity Transmission, its focus on leadership in innovation in Electricity Distribution and its commitment to targeting frontier performance in the RIIO 2 price control.
3
• Announcing plans to consolidate the development, operation and ownership of all of its renewable energy assets under a single entity called SSE Renewables, with its own experienced management team focused entirely on delivering a strategy to create long-term value from and future opportunities in renewable energy; and
These plans support the evolution of the SSE group to be clearly focused on low-carbon infrastructure, providing high earnings visibility and positioned to create value for shareholders and society through the low carbon transition.
Richard Gillingwater, Chairman of SSE, said:
“Although our half-year results are slightly ahead of the position we set out in September, they fall well short of what we hoped to achieve at the start of the year. This is disappointing and regrettable, but important changes are now being made to the way SSE manages its exposure to energy commodities.
“The commercial terms of the proposed combination of SSE Energy Services and npower are the subject of ongoing discussions, and creating a new independent energy supplier remains our objective. The Board believes that the best future for SSE Energy Services, including its customers and employees, lies outside the SSE group.
“Looking ahead, we are taking forward the strategy we set out in May to position SSE as a leading energy company in a low carbon world, with a focus on regulated networks and renewables, complemented by flexible thermal generation and business energy sales. Material progress is being achieved in these businesses, which make up most of the value in SSE.
“The 29.3 pence interim dividend that we have announced today is the first step in delivering our five-year dividend plan and paves the way for the 97.5 pence full-year dividend that we expect to recommend in May.
“This is a company with a clear strategy for its core businesses and highly valuable assets in a sector that’s yielding investment opportunities that go with the grain of political, economic and environmental focus on decarbonisation, and it is this that will support the delivery of our dividend plan in the years to come.”
4
SSE’s financial performance in the six months to 30 September 2018 at-a-glance
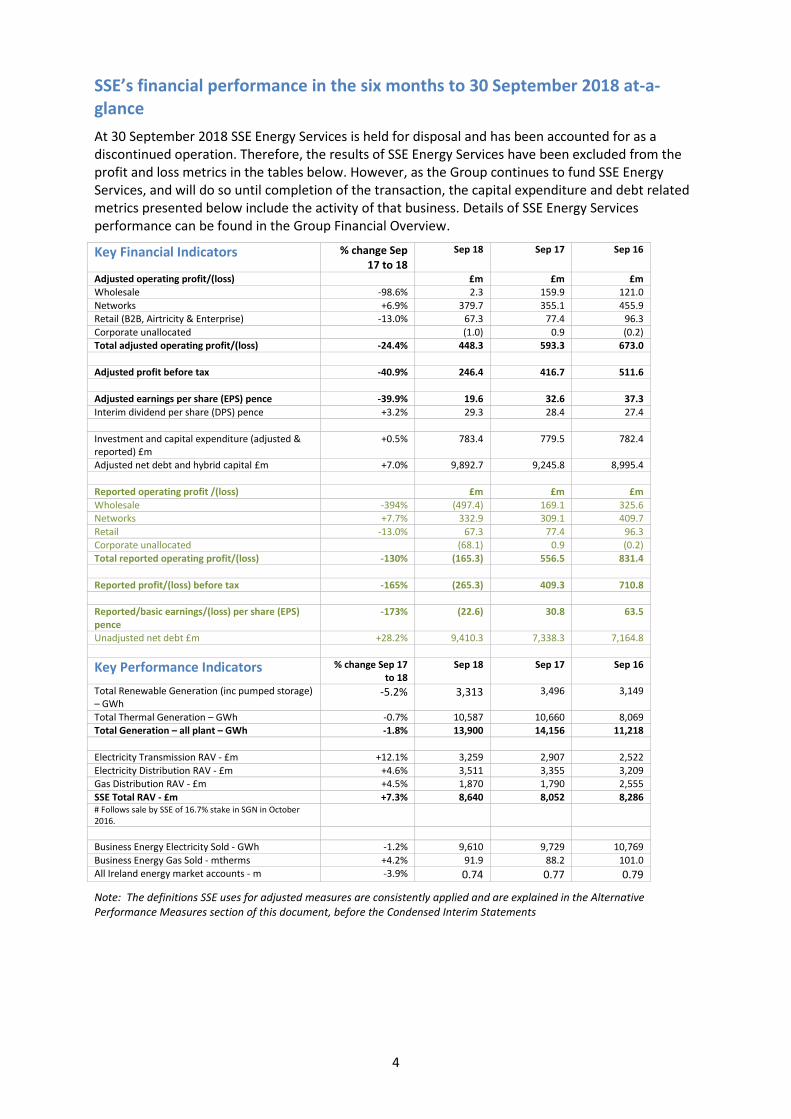
At 30 September 2018 SSE Energy Services is held for disposal and has been accounted for as a discontinued operation. Therefore, the results of SSE Energy Services have been excluded from the profit and loss metrics in the tables below. However, as the Group continues to fund SSE Energy Services, and will do so until completion of the transaction, the capital expenditure and debt related metrics presented below include the activity of that business. Details of SSE Energy Services performance can be found in the Group Financial Overview.
Key Financial Indicators % change Sep 17 to 18
Sep 18 Sep 17
Sep 16
Adjusted operating profit/(loss) £m £m £m Wholesale -98.6% 2.3 159.9 121.0
Networks +6.9% 379.7 355.1 455.9 Retail (B2B, Airtricity & Enterprise) -13.0% 67.3 77.4 96.3
Corporate unallocated (1.0) 0.9 (0.2) Total adjusted operating profit/(loss) -24.4% 448.3 593.3 673.0
Adjusted profit before tax -40.9% 246.4 416.7 511.6
Adjusted earnings per share (EPS) pence -39.9% 19.6 32.6 37.3
Interim dividend per share (DPS) pence +3.2% 29.3 28.4 27.4
Investment and capital expenditure (adjusted & reported) £m
+0.5% 783.4 779.5 782.4
Adjusted net debt and hybrid capital £m +7.0% 9,892.7 9,245.8 8,995.4
Reported operating profit /(loss) £m £m £m
Wholesale -394% (497.4) 169.1 325.6 Networks +7.7% 332.9 309.1 409.7
Retail -13.0% 67.3 77.4 96.3 Corporate unallocated (68.1) 0.9 (0.2)
Total reported operating profit/(loss) -130% (165.3) 556.5 831.4
Reported profit/(loss) before tax -165% (265.3) 409.3 710.8 Reported/basic earnings/(loss) per share (EPS) pence
-173% (22.6) 30.8 63.5
Unadjusted net debt £m +28.2% 9,410.3 7,338.3 7,164.8
Key Performance Indicators % change Sep 17 to 18
Sep 18 Sep 17 Sep 16
Total Renewable Generation (inc pumped storage) – GWh
-5.2% 3,313 3,496 3,149
Total Thermal Generation – GWh -0.7% 10,587 10,660 8,069 Total Generation – all plant – GWh -1.8% 13,900 14,156 11,218
Electricity Transmission RAV - £m +12.1% 3,259 2,907 2,522
Electricity Distribution RAV - £m +4.6% 3,511 3,355 3,209 Gas Distribution RAV - £m +4.5% 1,870 1,790 2,555
SSE Total RAV - £m +7.3% 8,640 8,052 8,286 # Follows sale by SSE of 16.7% stake in SGN in October 2016.
Business Energy Electricity Sold - GWh -1.2% 9,610 9,729 10,769
Business Energy Gas Sold - mtherms +4.2% 91.9 88.2 101.0 All Ireland energy market accounts - m -3.9% 0.74 0.77 0.79
Note: The definitions SSE uses for adjusted measures are consistently applied and are explained in the Alternative Performance Measures section of this document, before the Condensed Interim Statements

5
Further Information
Investor Timetable Interim ex-dividend date 17 January 2019 Record Date 18 January 2019 Final date for receipt of Scrip Elections 14 February 2019 Interim dividend payment date 15 March 2019 Q3 Trading Statement By 31 January 2019 Notification of Close Period By 31 March 2019 Preliminary Results for the year ended 31 March 2019 22 May 2019 AGM (Perth) and Q1 Trading Statement 18 July 2019 Contact Details Investors and Analysts [email protected] + 44 (0)345 0760 530 Media [email protected] + 44 (0)345 0760 530
Webcast facility
SSE will present its interim results for the six months ended 30 September 2018 on Wednesday 14 November. You can join the webcast by visiting www.sse.com and following the links on either the homepage or investor pages; or directly using https://edge.media-server.com/m6/p/qzgnmxz8. This will also be available as a teleconference, details below. Both facilities will be available to replay.
Confirmation: 6866795
Location Phone Type Phone Number United Kingdom Toll-free/Freephone 0800 279 7204 United Kingdom, Local Local +44 (0)330 336 9411 United States, Brooklyn Local +1 929-477-0448 United States/Canada Toll-free/Freephone 888-254-3590
Online information
News releases and announcements are made available on SSE’s website at www.sse.com. You can also follow the latest news from SSE at www.twitter.com/sse.
6
Strategic Overview
Putting safety first
The safety of the people who work on behalf of SSE is the company’s first priority. SSE's combined Total Recordable Injury Rate for employees and employees of other companies working on SSE sites was 0.20 per 100,000 hours worked in the twelve months to 30 September 2018, compared to 0.19 for the same period the previous year. While this is up slightly compared to last September, SSE has, and continues to pursue an ultimate goal of injury-free working, supported by a simple licence for everyone working on its behalf: If it’s not safe, we don’t do it.
Focusing on the core and giving visibility on value
We are taking forward the strategy we set out in May to position SSE as a leading energy company in a low carbon world, with a focus on regulated networks and renewables, complemented by flexible thermal generation and business energy sales. These businesses, which make up the large majority of the SSE group, are performing well.
At the same time, we have been taking active steps to deal with the issues set out in the Trading Statement in September and working to deliver the planned SSE Energy Services transaction.
Delivering change in managing commodity price exposures
SSE is clearly very disappointed that its adjusted operating profit for the six months to 30 September 2018 is significantly lower than it sought to achieve at the start of the year. This mainly follows the impact of decisions intended to mitigate commodity price risk to SSE's businesses through management of its energy portfolio. Since September, significant action has been taken to limit future exposures in this financial year and into the next. In addition, and also in line with the transition to a business focused on regulated networks and renewable energy, SSE is today setting out how its approach to management of commodity price exposures will evolve to meet the needs of a changing SSE group of businesses.
Working to create a new, independent energy supplier
A year on from the demerger announcement, SSE continues to believe that creating a new, independent energy supplier has the potential to deliver real benefits for customers and the market as a whole, and that remains the objective. The best future for SSE Energy Services, including its customers and employees, lies outside the SSE group.
Preparing for the combination of SSE Energy Services and npower and listing of the new company is a complex process. It is required to be undertaken in line with the rules and obligations governing such matters, including information sharing; and in line with the fact that the two companies continue to compete. The Default Tariff cap, including the methodology and input data underpinning it, and the process for future adjustments, is similarly complex, with the final decisions only being announced on 6 November. The period for appeals to the CMA’s approval of the proposed transaction did not conclude until 7 November. On 8 November it was concluded that further discussions were required on revised commercial terms, with potential implications of these discussions for the likelihood and timetable for completing the proposed combination of SSE Energy Services and npower Ltd.
In now assessing potential changes to the commercial terms of the proposed SSE Energy Services/npower combination, the interest of customers, employees and shareholders will be paramount. There is now some uncertainty as to whether this transaction can be completed, as originally contemplated, but we continue to believe the best future for SSE Energy Services lies outside the SSE group. In the meantime, the skilled and committed SSE Energy Services team continues to be focused on providing a high standard of service to customers.
7
Taking forward a new business model
The future SSE will have a clear vision to be a leading provider of energy in a low-carbon world. It will also have a clear strategy focused on creating value for shareholders and society from developing, owning and operating energy infrastructure and services in a sustainable way. Ultimately, the financial objective of this strategy will be to remunerate shareholders’ investment through the payment of dividends.
SSE is today setting out how it is taking forward its business model to realise the opportunities presented by a changing energy system through the delivery of three things:
• Focus on SSE’s core, low-carbon businesses of economically-regulated networks and
renewables, complemented by flexible thermal generation and business energy sales;
• Greater visibility of SSE's assets and earnings for investors; and
• Stronger platforms for success for SSE's businesses, supporting financial and strategic partnering.
In a complex operating environment, SSE believes there are significant opportunities for its evolving business model to create value from the long-term trends of decarbonisation, electrification and infrastructure set out in its Business Update in May 2018. This emphasis on focusing on core businesses and giving visibility of assets and earnings is the best means of giving businesses the right platforms for success for the benefit of shareholders and for society as a whole.
Focusing on our core businesses
The focus of the evolving business model is clear: economically-regulated networks and renewables, complemented by flexible thermal generation and business energy sales.
SSE's networks businesses have historically underpinned dividend growth and their role in enabling the transition to a low carbon economy, as well as transporting energy more flexibly and locally in the future, will be significant. The Transmission business is now close to completing the new Caithness-Moray link that will enable deployment of more renewable energy assets and the Distribution business is seeking to build on its leadership position in the preparations for the DNO/DSO transition. We are preparing for, and targeting frontier performance in the RIIO 2 price controls; and we remain on course to have a net total RAV of £10bn by 2023.
At the same time, SSE’s renewable energy portfolio across the UK and Ireland has grown substantially over the past decade; and the recent progress of the major wind farms onshore at Stronelairg and offshore at Beatrice has been excellent. We see strong future growth prospects for renewable energy in the UK, Ireland and beyond given reduced technology costs, the strong need for decarbonisation and public policy designed to achieve it. We will consolidate the development, operation and ownership of our renewable energy assets under a single, wholly-owned entity, SSE Renewables. The business will have an experienced management team focused entirely on a strategy to create long-term value, realising opportunities in offshore wind, reinvigorating options in onshore wind, delivering efficient investment and considering future partnerships.
Other businesses are complementary to the clean infrastructure core provided by networks and renewables. Flexible thermal generation will play a critical role in the transition to a low carbon economy and decarbonised electricity system. Business Energy is an important route to market for electricity generation output.
Building the right platforms for success for all businesses
Looking at the rest of the SSE group, the priority is to give each business the best platform for success. The recent gas discovery by Total on the Glendronach prospect, in which SSE has a 20% stake, was welcome news, but Gas Production for SSE is an investment, not a business in which SSE is required to develop or operate. Ultimately, it is not consistent with our focus on assets that contribute to the decarbonisation of the energy system set out in the Business Update in May 2018.
8
This means it is an example of a non-core activity with different routes available for securing value, and we would expect disposal to be the most likely option in due course.
SSE’s Telecoms business has continued to expand its network, increase its customer base and enter into new partnerships. We believe partnerships will help deliver future value for customers and shareholders.
Visibility on value and remunerating shareholders' investment
The evolution of the SSE group of businesses is continuing, in line with the focus on low carbon businesses. This evolution will be accompanied by a clear commitment to setting out the right operational and financial performance indicators on a business-by-business basis. This greater visibility of assets should therefore also support greater visibility of earnings.
This, in turn, should support SSE’s commitment to a dividend that remunerates shareholders over the long-term, which remains as solid as ever. SSE’s primary financial objective for 2018/19 is delivery of a full-year dividend of 97.5 pence per share, and its commitment to delivering the clearly-defined five-year plan for the dividend remains strong.
Engaging with politicians and regulators
SSE is a public-listed company working in the public interest. Since energy is an essential service, highly regulated, and key to realising government social, economic and environmental objectives, it is understandably highly politicised. As a responsible company SSE embraces this challenge and has a strong commitment to effective engagement with politicians and regulators.
SSE believes in creating value for all of its stakeholders as demonstrated by its commitment to the Fair Tax Mark, the real Living Wage and its efforts in building strong indigenous supply chains in the countries in which it operates. It combines this with a clear, transparent and future-orientated approach to political and regulatory advocacy.
This approach extends to engagement on Brexit. SSE is less exposed to the impact of the UK leaving the EU than companies with more international operations and more ‘just in time’ supply chains, but it has significant investment in both the UK and Ireland energy markets and therefore favours a clear and stable transitional policy environment. Preparations are being made within each of SSE’s businesses for any ‘no deal’ scenario.
Elsewhere, a constructive approach has been taken with the UK Government and Ofgem over the confirmation of CfD auctions and the development of policy regarding RIIO2 and the road to more active network management. This approach extends to challenges such as the Labour party’s policy on state control of electricity networks and Ofgem’s desire to see competition in transmission. SSE disagrees with the position taken by advocates of these changes but is committed to open, respectful and honest engagement around meeting shared objectives.
Governance Update
Following today’s announcement of the appointment of Melanie Smith as a non-Executive Director with effect from 1 January 2019, the Board will comprise the Chairman, six non-Executive Directors and three Executive Directors. Three of the Directors will be women and seven will be men. In accordance with the 2018 UK Corporate Governance Code, which applies to SSE from 1 April 2019, SSE has appointed Sue Bruce as the designated non-Executive Director for employee engagement with immediate effect.
Creating sustainable value for shareholders and society
The operating environment for energy companies is likely to remain complex and challenging. SSE is taking decisive action to deal with all of the key issues and making material progress in its core businesses of regulated energy networks and renewables. The assets in these businesses are of a high quality and are growing. Looking ahead, SSE believes it has the strategic priorities, assets,

9
opportunities and focus to create sustainable value for shareholders and society in the years ahead, including delivery of its five-year dividend plan.
Alistair Phillips-Davies
Chief Executive
10
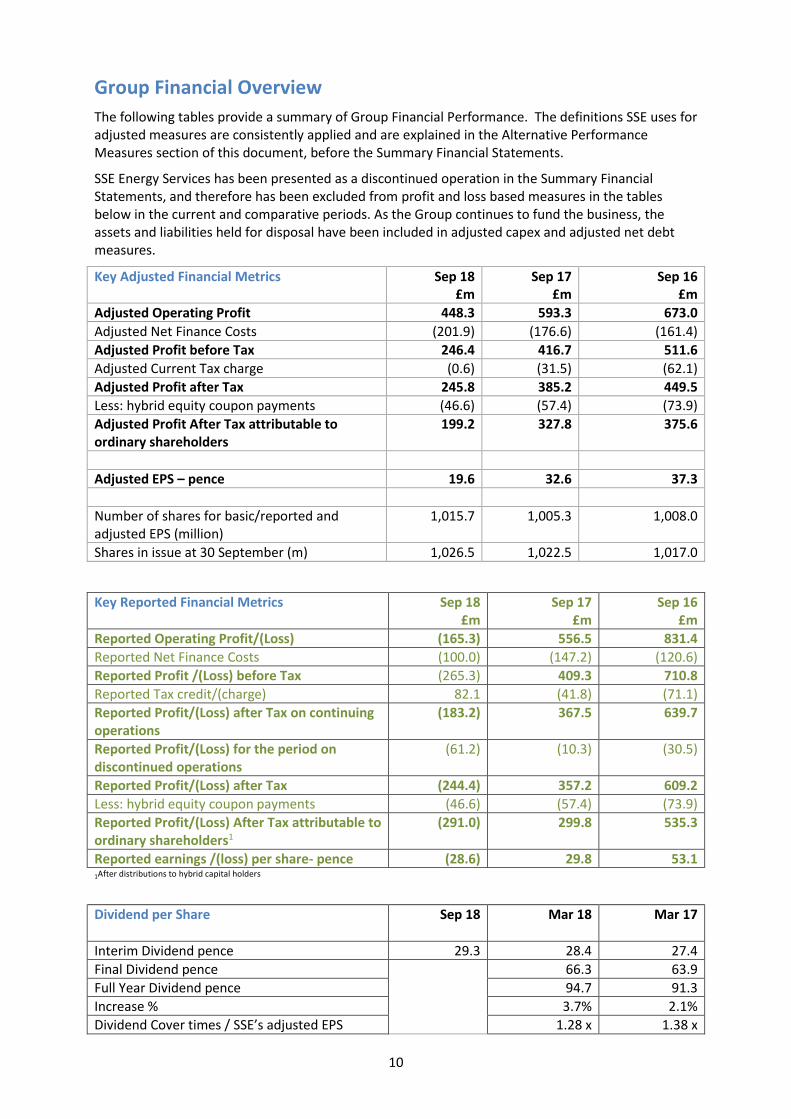
Group Financial Overview
The following tables provide a summary of Group Financial Performance. The definitions SSE uses for adjusted measures are consistently applied and are explained in the Alternative Performance Measures section of this document, before the Summary Financial Statements.
SSE Energy Services has been presented as a discontinued operation in the Summary Financial Statements, and therefore has been excluded from profit and loss based measures in the tables below in the current and comparative periods. As the Group continues to fund the business, the assets and liabilities held for disposal have been included in adjusted capex and adjusted net debt measures.
Key Adjusted Financial Metrics Sep 18 £m
Sep 17 £m
Sep 16 £m
Adjusted Operating Profit 448.3 593.3 673.0
Adjusted Net Finance Costs (201.9) (176.6) (161.4)
Adjusted Profit before Tax 246.4 416.7 511.6
Adjusted Current Tax charge (0.6) (31.5) (62.1)
Adjusted Profit after Tax 245.8 385.2 449.5
Less: hybrid equity coupon payments (46.6) (57.4) (73.9)
Adjusted Profit After Tax attributable to ordinary shareholders
199.2 327.8 375.6
Adjusted EPS – pence 19.6 32.6 37.3
Number of shares for basic/reported and adjusted EPS (million)
1,015.7 1,005.3 1,008.0
Shares in issue at 30 September (m) 1,026.5 1,022.5 1,017.0
Key Reported Financial Metrics Sep 18 £m
Sep 17 £m
Sep 16 £m
Reported Operating Profit/(Loss) (165.3) 556.5 831.4
Reported Net Finance Costs (100.0) (147.2) (120.6)
Reported Profit /(Loss) before Tax (265.3) 409.3 710.8
Reported Tax credit/(charge) 82.1 (41.8) (71.1)
Reported Profit/(Loss) after Tax on continuing operations
(183.2) 367.5 639.7
Reported Profit/(Loss) for the period on discontinued operations
(61.2) (10.3) (30.5)
Reported Profit/(Loss) after Tax (244.4) 357.2 609.2
Less: hybrid equity coupon payments (46.6) (57.4) (73.9)
Reported Profit/(Loss) After Tax attributable to ordinary shareholders1
(291.0) 299.8 535.3
Reported earnings /(loss) per share- pence (28.6) 29.8 53.1 1After distributions to hybrid capital holders
Dividend per Share Sep 18
Mar 18
Mar 17
Interim Dividend pence 29.3 28.4 27.4
Final Dividend pence 66.3 63.9
Full Year Dividend pence 94.7 91.3
Increase % 3.7% 2.1%
Dividend Cover times / SSE’s adjusted EPS 1.28 x 1.38 x
11
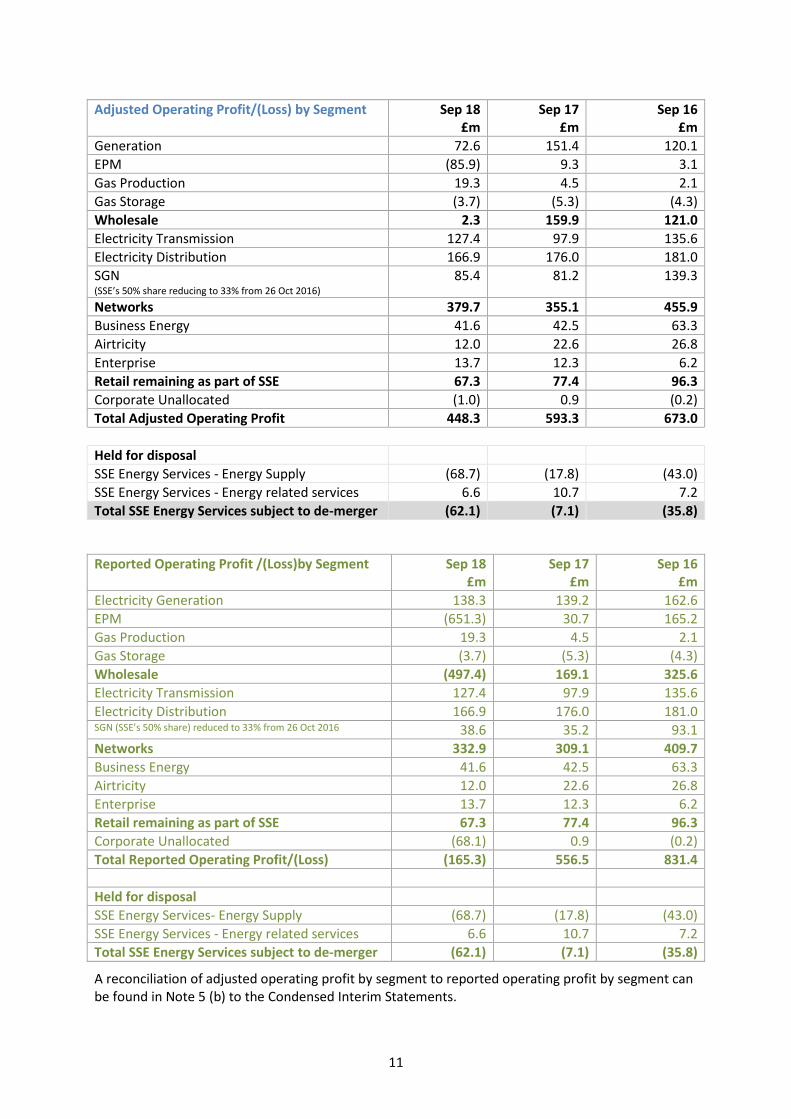
Adjusted Operating Profit/(Loss) by Segment Sep 18 £m
Sep 17 £m
Sep 16 £m
Generation 72.6 151.4 120.1
EPM (85.9) 9.3 3.1
Gas Production 19.3 4.5 2.1
Gas Storage (3.7) (5.3) (4.3)
Wholesale 2.3 159.9 121.0
Electricity Transmission 127.4 97.9 135.6
Electricity Distribution 166.9 176.0 181.0
SGN (SSE’s 50% share reducing to 33% from 26 Oct 2016)
85.4 81.2 139.3
Networks 379.7 355.1 455.9
Business Energy 41.6 42.5 63.3
Airtricity 12.0 22.6 26.8
Enterprise 13.7 12.3 6.2
Retail remaining as part of SSE 67.3 77.4 96.3
Corporate Unallocated (1.0) 0.9 (0.2)
Total Adjusted Operating Profit 448.3 593.3 673.0
Held for disposal
SSE Energy Services - Energy Supply (68.7) (17.8) (43.0)
SSE Energy Services - Energy related services 6.6 10.7 7.2
Total SSE Energy Services subject to de-merger (62.1) (7.1) (35.8)
Reported Operating Profit /(Loss)by Segment Sep 18 £m
Sep 17 £m
Sep 16 £m
Electricity Generation 138.3 139.2 162.6
EPM (651.3) 30.7 165.2
Gas Production 19.3 4.5 2.1
Gas Storage (3.7) (5.3) (4.3)
Wholesale (497.4) 169.1 325.6
Electricity Transmission 127.4 97.9 135.6
Electricity Distribution 166.9 176.0 181.0 SGN (SSE’s 50% share) reduced to 33% from 26 Oct 2016 38.6 35.2 93.1
Networks 332.9 309.1 409.7
Business Energy 41.6 42.5 63.3
Airtricity 12.0 22.6 26.8
Enterprise 13.7 12.3 6.2
Retail remaining as part of SSE 67.3 77.4 96.3
Corporate Unallocated (68.1) 0.9 (0.2)
Total Reported Operating Profit/(Loss) (165.3) 556.5 831.4
Held for disposal
SSE Energy Services- Energy Supply (68.7) (17.8) (43.0)
SSE Energy Services - Energy related services 6.6 10.7 7.2
Total SSE Energy Services subject to de-merger (62.1) (7.1) (35.8)
A reconciliation of adjusted operating profit by segment to reported operating profit by segment can be found in Note 5 (b) to the Condensed Interim Statements.
12
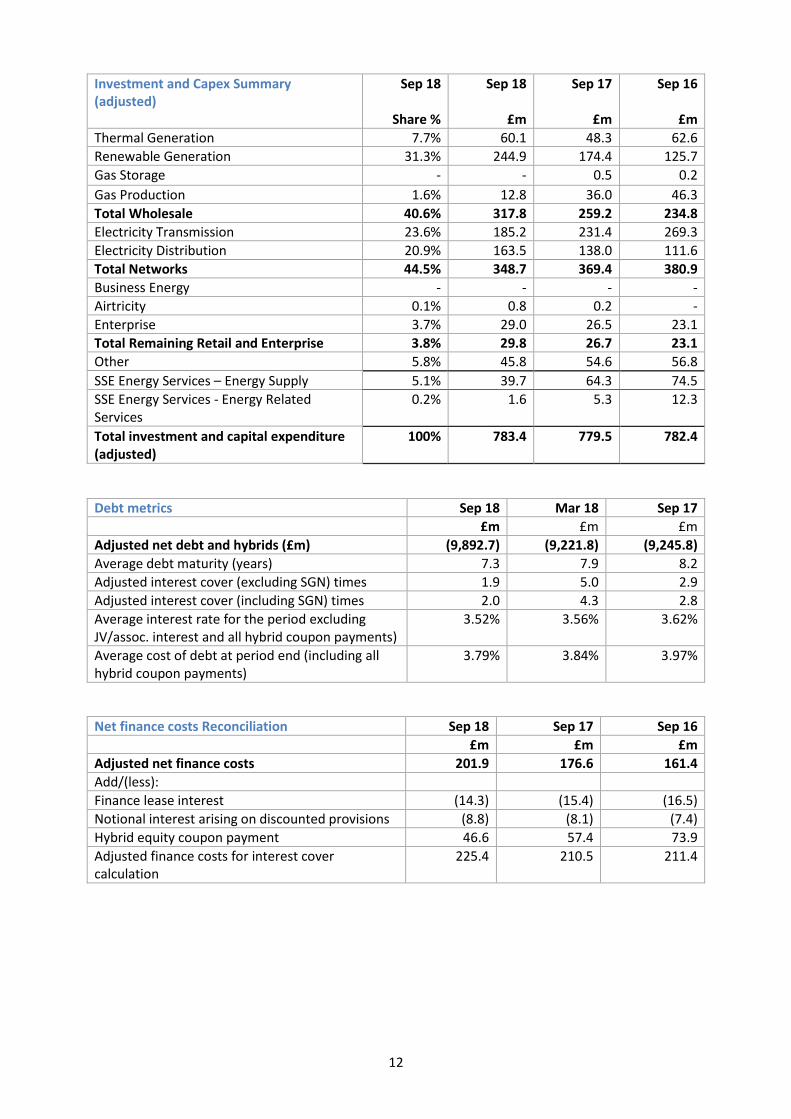
Investment and Capex Summary (adjusted)
Sep 18 Sep 18 Sep 17
Sep 16
Share % £m £m £m
Thermal Generation 7.7% 60.1 48.3 62.6
Renewable Generation 31.3% 244.9 174.4 125.7
Gas Storage - - 0.5 0.2
Gas Production 1.6% 12.8 36.0 46.3
Total Wholesale 40.6% 317.8 259.2 234.8
Electricity Transmission 23.6% 185.2 231.4 269.3
Electricity Distribution 20.9% 163.5 138.0 111.6
Total Networks 44.5% 348.7 369.4 380.9
Business Energy - - - -
Airtricity 0.1% 0.8 0.2 -
Enterprise 3.7% 29.0 26.5 23.1
Total Remaining Retail and Enterprise 3.8% 29.8 26.7 23.1
Other 5.8% 45.8 54.6 56.8
SSE Energy Services – Energy Supply 5.1% 39.7 64.3 74.5
SSE Energy Services - Energy Related Services
0.2% 1.6 5.3 12.3
Total investment and capital expenditure (adjusted)
100% 783.4 779.5 782.4
Debt metrics Sep 18 Mar 18 Sep 17
£m £m £m
Adjusted net debt and hybrids (£m) (9,892.7) (9,221.8) (9,245.8)
Average debt maturity (years) 7.3 7.9 8.2
Adjusted interest cover (excluding SGN) times 1.9 5.0 2.9
Adjusted interest cover (including SGN) times 2.0 4.3 2.8
Average interest rate for the period excluding JV/assoc. interest and all hybrid coupon payments)
3.52% 3.56% 3.62%
Average cost of debt at period end (including all hybrid coupon payments)
3.79% 3.84% 3.97%
Net finance costs Reconciliation Sep 18 Sep 17 Sep 16
£m £m £m
Adjusted net finance costs 201.9 176.6 161.4
Add/(less):
Finance lease interest (14.3) (15.4) (16.5)
Notional interest arising on discounted provisions (8.8) (8.1) (7.4)
Hybrid equity coupon payment 46.6 57.4 73.9
Adjusted finance costs for interest cover calculation
225.4 210.5 211.4
13
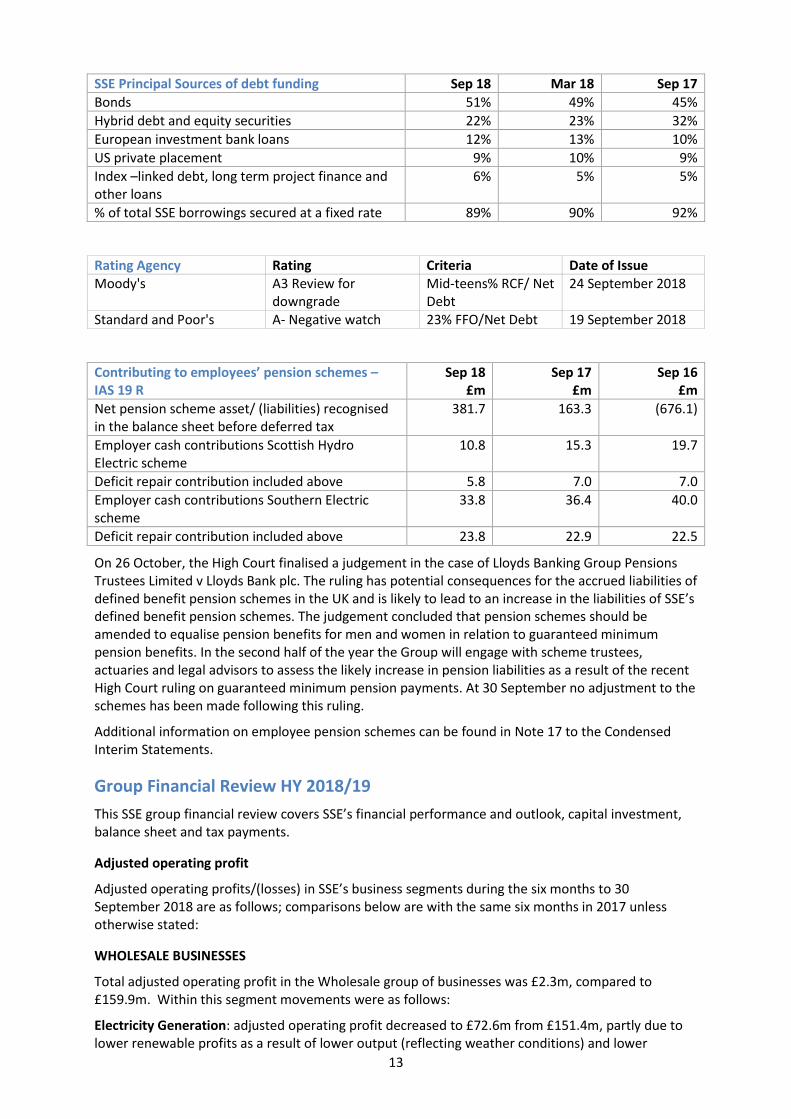
SSE Principal Sources of debt funding Sep 18 Mar 18 Sep 17
Bonds 51% 49% 45%
Hybrid debt and equity securities 22% 23% 32%
European investment bank loans 12% 13% 10%
US private placement 9% 10% 9%
Index –linked debt, long term project finance and other loans
6% 5% 5%
% of total SSE borrowings secured at a fixed rate 89% 90% 92%
Rating Agency Rating Criteria Date of Issue Moody's A3 Review for
downgrade Mid-teens% RCF/ Net Debt
24 September 2018
Standard and Poor's A- Negative watch 23% FFO/Net Debt 19 September 2018
Contributing to employees’ pension schemes – IAS 19 R
Sep 18 £m
Sep 17 £m
Sep 16 £m
Net pension scheme asset/ (liabilities) recognised in the balance sheet before deferred tax
381.7 163.3 (676.1)
Employer cash contributions Scottish Hydro Electric scheme
10.8 15.3 19.7
Deficit repair contribution included above 5.8 7.0 7.0
Employer cash contributions Southern Electric scheme
33.8 36.4 40.0
Deficit repair contribution included above 23.8 22.9 22.5
On 26 October, the High Court finalised a judgement in the case of Lloyds Banking Group Pensions Trustees Limited v Lloyds Bank plc. The ruling has potential consequences for the accrued liabilities of defined benefit pension schemes in the UK and is likely to lead to an increase in the liabilities of SSE’s defined benefit pension schemes. The judgement concluded that pension schemes should be amended to equalise pension benefits for men and women in relation to guaranteed minimum pension benefits. In the second half of the year the Group will engage with scheme trustees, actuaries and legal advisors to assess the likely increase in pension liabilities as a result of the recent High Court ruling on guaranteed minimum pension payments. At 30 September no adjustment to the schemes has been made following this ruling.
Additional information on employee pension schemes can be found in Note 17 to the Condensed Interim Statements.
Group Financial Review HY 2018/19
This SSE group financial review covers SSE’s financial performance and outlook, capital investment, balance sheet and tax payments.
Adjusted operating profit
Adjusted operating profits/(losses) in SSE’s business segments during the six months to 30 September 2018 are as follows; comparisons below are with the same six months in 2017 unless otherwise stated:
WHOLESALE BUSINESSES
Total adjusted operating profit in the Wholesale group of businesses was £2.3m, compared to £159.9m. Within this segment movements were as follows:
Electricity Generation: adjusted operating profit decreased to £72.6m from £151.4m, partly due to lower renewable profits as a result of lower output (reflecting weather conditions) and lower
14
achieved power prices. In addition, the six months to September 2017 included a £24.0m gain on the sale of a 5% stake in the Clyde wind farm, while the £74.2m gain on sale on a further 14.9% stake in Clyde reported in May 2018 is reported as exceptional under SSE’s stated policy and is not included in the adjusted operating profit figure. Renewables adjusted operating profit for the six months to 30 September 2018 was £76.1m compared to £149.4m in the same period last year.
Energy Portfolio Management: EPM recorded an adjusted operating loss of £(85.9)m, which compares to the forecast adjusted operating loss of around £100m set out in September 2018 and to an adjusted operating profit of £9.3m in prior year. This was primarily due to the negative impact of persistently high gas prices on SSE’s energy position.
Gas Production: adjusted and reported operating profit increased to £19.3m compared to £4.5m, mainly due to lower depreciation charges.
Gas Storage: Challenging market conditions continue and an adjusted and reported operating loss of £(3.7)m was recorded, compared to an adjusted and reported operating loss of £(5.3)m.
Reported Wholesale operating profit/(loss): an operating loss of £(497.4)m is reported compared to an operating profit of £169.1m in the prior year. This is primarily as a result of the £(651.3)m reported operating loss in EPM due to IFRS 9 mark-to-market remeasurements of £(565.4)m on operating derivative contracts in addition to £(85.9)m of realised losses on trading activity in the period.
NETWORKS BUSINESSES
Total adjusted operating profit for FY2018/19 in the economically-regulated Networks businesses segment is still expected to increase by a mid-single digit percentage, mainly as a result of the phasing of income recovery in Electricity Transmission and a higher expected contribution from SGN.
In line with this, total adjusted operating profit across the Networks businesses in the first six months was £379.7m, compared to £355.1m in the same period last year. Within that, business segment movements were as follows:
Electricity Transmission: adjusted and reported operating profit increased to £127.4m from £97.9m, mainly due to increased Transmission Use of System revenue (TNUoS), slightly offset by an increase in controllable costs.
Electricity Distribution: adjusted and reported operating profit was down at £166.9m compared to £176.0m. While revenues have increased, these have been more than offset by higher operating costs including higher fault costs relating to weather.
Gas Distribution: SSE’s share of SGN’s adjusted operating profit increased to £85.4m from £81.2m due to increased regulated revenue reflecting RPI and improved incentives performance.
Reported Network operating profit: an operating profit of £332.9m was reported compared to £309.1m due to increased profitability in Transmission noted above.
RETAIL BUSINESSES
Total adjusted operating profit across the remaining Retail businesses was £67.3m, compared to £77.4m in the same period last year. Within that, business segment movements were as follows:
Energy Supply (Business Energy): adjusted and reported operating profit remains relatively flat at £41.6m compared to £42.5m. There has been growth in customer numbers driven by an increase in the SME customer base, but this has been offset in electricity volume terms by losses in the Major Business segment.
Airtricity: An adjusted and reported operating profit of £12.0m was achieved compared to £22.6m in the same period last year. This is mainly due to a change in the within year phasing of an element of Refit payments, operating profit is expected to recover in the second half of the year.
15
Enterprise: Adjusted and reported operating profit was similar at £13.7m compared to £12.3m, reflecting improvement in Utility Solutions, Slough Heat and Power and Telecoms, slightly offset by contract delays in other parts of the business.
CORPORATE UNALLOCATED
An adjusted operating loss of £(1.0)m was recorded compared to a profit of £0.9m. A reported operating loss of £(68.1)m was reported, mainly due to exceptional charges of £67.1m recognised in advance of the SSE Energy Services demerger. This was compared to a profit of £0.9m.
DISCONTINUED OPERATIONS – SSE Energy Services
Discontinued operation: SSE Energy Services – Energy Supply (households in GB): An adjusted and reported loss of £(68.7)m was recorded compared to £(17.8)m. It is not unusual for GB domestic supply to report a loss in the first six months, due to the phasing of demand over the year and the first six months of 18/19 were impacted by lower demand, higher energy costs and the decision not to further raise tariffs.
Discontinued operation: SSE Energy Services – Energy-related Services: adjusted and reported operating profit fell to £6.6m compared to £10.7m, mainly due to reduced profits from retail telecoms and broadband.
Revenue - Adoption of IFRS 15
On 1 April 2018 the Group adopted IFRS15, which introduces a new 5-step model to account for revenue from contracts with customers. As a result of adoption, and the clear principles defining “revenue” contained within, the Group reassessed its previous gross presentation of commodity optimisation trading revenues and costs and concluded that whilst previously acceptable, a gross presentation neither reflected the revised principles defining revenue nor the underlying economic purpose for these trades. Therefore, following adoption of IFRS 15, sales and purchases of commodity optimisation trades are now presented net within cost of sales. In the six months ended 30 September 2018 the impact of the adoption of IFRS 15 is a reduction to revenue and cost of sales of £7.9bn. The presentational adjustment has had no impact on the Group’s operating profit or cashflows. The Group’s full impact assessment of adoption of IFRS 15 is disclosed in Note 3.2 to the Condensed Interim Statements.
Earnings
Adjusted earnings per share
To monitor its financial performance over the medium term, SSE consistently reports on its adjusted earnings per share (EPS) measure. This measure is calculated by excluding the charge for deferred tax, interest costs on net pension liabilities, exceptional items and the impact of certain re-measurements.
SSE’s adjusted EPS measure has been calculated consistently and provides an important and meaningful measure of underlying financial performance. In adjusting for exceptional items and certain re-measurements, adjusted EPS reflects SSE’s internal performance management, avoids the volatility associated with mark-to-market IFRS 9 re-measurements and means that items deemed to be exceptional due to their nature and scale do not distort the presentation of SSE’s underlying results. For more detail on these and other adjusted items please refer to the Adjusted Performance Measures section of this report.
In the six months to 30 September 2018, SSE’s adjusted earnings per share on continuing operations was 19.6 pence, compared to 32.6 pence for the same six months last year. As expected, it reflects the impact of the issues set out in SSE’s Trading Statement on 12 September 2018. It also reflects that SSE Energy Services is now reported as discontinued operation.
16
Summarising the impact of Movements on Derivatives
SSE enters into forward purchase contracts (for power, gas and other commodities) to meet the future demands of its energy supply businesses and to optimise the value of its Generation and Gas Production assets. Some of these contracts are determined to be derivative financial instruments under IFRS 9 and as such are required to be recorded at their fair value as at the date of the financial statements.
SSE shows the change in the fair value of these forward contracts separately as this mark-to-market movement does not reflect the realised operating performance of the businesses. The underlying value of these contracts is recognised as the relevant commodity is delivered, which for the large majority of the position at 30 September 2018 is expected to be by 31 March 2020.
The adverse movement on operating derivatives under IFRS 9 of £565.4m arose mainly from a deterioration in the fair value of forward gas contracts. While indicative of a direction of travel there are limitations to the IFRS 9 measure if using it to assess SSE’s commodity exposure, namely:
• The IFRS 9 values do not reflect all contracts but only those designated as ‘held for trading’; and
• The IFRS 9 movement in operating derivatives represents the position up to 30 September 2018 and does not reflect price movements and actions taken since that date.
As at 13 November, EPM is expected to report an adjusted operating loss of around £300m in 2018/19 and an adjusted operating loss of around £115m with a potential variation around this of +/-£25m in 2019/20. Thereafter EPM is expected to earn a small profit through service provision.
The Group has assessed its exposure to counterparty credit risk on derivative contracts due to the size of the derivative portfolio. Following that review, which considered factors such as the credit rating of its counterparties and Master Netting Agreements in place, the Group assessed there is no material increase in credit risk.
Partly offsetting the losses recognised on operating derivatives are gains of £39.6m arising on the remeasurement of financing derivatives at 30 September, primarily due to the increase in the interest rate in the period. These remeasurements are also presented separately as these do not represent underlying business performance in the period. The result on financing derivatives will be recognised in adjusted profit before tax when the derivatives are settled.
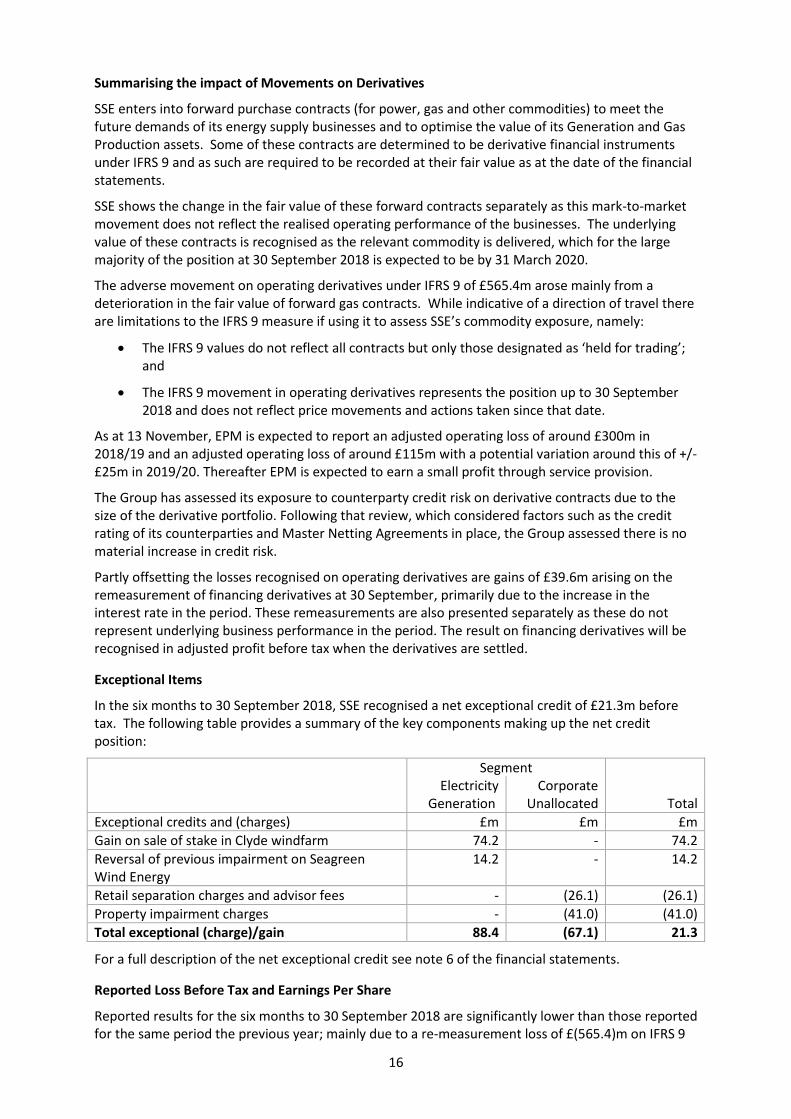
Exceptional Items
In the six months to 30 September 2018, SSE recognised a net exceptional credit of £21.3m before tax. The following table provides a summary of the key components making up the net credit position:
Segment Electricity
Generation Corporate
Unallocated Total
Exceptional credits and (charges) £m £m £m
Gain on sale of stake in Clyde windfarm 74.2 - 74.2
Reversal of previous impairment on Seagreen Wind Energy
14.2 - 14.2
Retail separation charges and advisor fees - (26.1) (26.1)
Property impairment charges - (41.0) (41.0)
Total exceptional (charge)/gain 88.4 (67.1) 21.3
For a full description of the net exceptional credit see note 6 of the financial statements.
Reported Loss Before Tax and Earnings Per Share
Reported results for the six months to 30 September 2018 are significantly lower than those reported for the same period the previous year; mainly due to a re-measurement loss of £(565.4)m on IFRS 9
17
operating derivative contracts in the current year, compared to a £21.4m gain on similar contracts in the prior period.
The re-measurement loss is explained in more detail in the relevant sections throughout this report and is the main driver for:
• A reported loss before tax on continuing operations of £(265.3m) being recorded for the six months to 30 September 2018 compared to a reported profit before tax of £409.3m for the same six months last year; and
• A reported loss per share on continuing operations of (22.6p) being recorded compared to reported earnings per share of 30.8p.
Outlook
Dividend
SSE continues to intend to recommend a full-year dividend of 97.5 pence per share for 2018/19 and to deliver the five-year dividend plan set out in May 2018.
Adjusted operating profit (excluding SSE Energy Services)
The outlook for SSE’s Networks and Wholesale businesses for the financial year to 31 March 2019 is in line with that set out in its Trading Statement:
• Adjusted operating profit for the Networks businesses is expected to increase by a mid-single digit percentage; and
• Performance of Wholesale businesses will continue to be dependent on the range of factors set out at the start of the financial year; Energy Portfolio Management (EPM), however, is now expected to incur a slightly lower than previously forecast adjusted operating loss for 2018/19, at around £300m, as a result of action taken since September.
Adjusted earnings per share (excluding SSE Energy Services)
Excluding the results for SSE Energy Services, which is now held for disposal, SSE currently expects to deliver adjusted earnings per share in the range of 70p to 75p for 2018/19 as a whole, which compares to 98.3p on a like for like basis for the year ended 31 March 2018.
The forecast adjusted EPS number excludes two gains on sale: £74.2m recognised from the sale in May 2018 of a further 14.9% stake in Clyde Wind farm. A further £53m is expected to be received as a distribution from the Environmental Capital Fund (in which SSE has a 48% stake) as a result of its sale of the independent gas transportation network Indigo Pipelines in November 2018.
SSE Energy Services
SSE currently expects that its household Energy Supply Business (part of SSE Energy Services) will report an adjusted operating profit margin of between 2% and 3% for the year ended 31 March 2019 compared to 6.8% in the year ended 31 March 2018, reflecting competitive pressures and the anticipated impact of the Default Tariff Cap from 1 January 2019. Margins are expected to be lower still in 2019/20.
Following Ofgem’s final decisions on the Default Tariff Cap on 6 November and the end of the period for appeals on the CMA’s approval of the proposed transaction on 7 November, SSE and innogy SE agreed on 8 November to enter into discussions and work together regarding potential changes to the commercial terms of the proposed combination of SSE Energy Services and npower Ltd. As previously stated, these discussions are expected to take place over several weeks and an update on their progress will be provided as soon as possible, and certainly by mid-December.
SSE does not intend to provide further comment on the discussions until such an update, but creating a new independent energy supplier remains its objective. There is now some uncertainty as to whether this transaction can be completed, as originally contemplated; nevertheless, the Board
18
believes that the best future for SSE Energy Services, including its customers and employees, will continue to lie outside the SSE group.
Dividend Policy – a five-year plan
Remunerating shareholders’ investment through payment of dividends
SSE’s strategy, set out in May 2018, is to create value for shareholders and society from developing, operating and owning energy and related infrastructure and services in a sustainable way. It is against this backdrop that SSE believes the best future for its Energy Services business is outside the SSE group.
The first financial objective of this strategy is to remunerate shareholders’ investment through the payment of dividends. SSE believes that its dividends should be sustainable, based on the quality and nature of its assets and operations, the earnings derived from them and the longer-term financial outlook.
In line with this and reflecting the underlying quality and value of its assets and earnings and the cash flows they deliver, SSE’s plan for the dividend for the five years to 2023 is as set out in May 2018:
• For 2018/19, SSE is intending to recommend a full-year dividend of 97.5 pence per share with the interim payment related to this of 29.3 pence per share. This provides clarity in a year of transition and is not subject to the timing of either the SSE Energy Services transaction or the Domestic Gas and Electricity (Tariff Cap Bill).
• For 2019/20, SSE is planning to set the first post-transaction dividend at 80 pence per share, which reflects the impact of the changes in the SSE group expected to take effect by then. This provides a sustainable basis for future dividend growth.
• For 2020/21, 2021/22 and 2022/23 SSE is targeting annual increases in the full-year dividend that at least keep pace with RPI inflation. This reflects SSE’s confidence in the quality and value of its assets and earnings and cash flows they deliver.
Investment and Capital Expenditure
Central to SSE’s strategic framework is efficient and disciplined investment in developing and building assets, mainly in economically-regulated energy networks and renewable sources of energy. In practice, this means that investment should be in line with SSE’s commitment to strong financial management and consistent with its vision of being a leading energy company in a low carbon world.
Investing efficiently in energy assets that the UK and Ireland need in 2018/19
SSE invests only in assets for which returns are expected to be clearly greater than the cost of capital. All projects are intended to complement SSE’s existing portfolio of assets and are governed and executed in an efficient manner and in line with SSE’s commitment to strong financial management.
During the six months to 30 September 2018, SSE’s investment and capital expenditure (including SSE Energy Services) totalled £783.4m, and included:
• A major investment programme in electricity networks totalling £348.7m (45% of the total). This includes ongoing construction of the Caithness-Moray electricity transmission link and connections for the Stronelairg onshore wind farm, Tomatin OHL project and the reinforcement of the existing Fort Augustus-Fort William network. This investment, alongside continued upgrading of the electricity distribution network to meet the changing needs of customers, will further increase the total Regulated Asset Value (RAV) of SSE’s networks businesses;
• Further investment in renewable energy in GB and Ireland totalling £244.9m (31% of the total). Progress continues on 463MW of on- and offshore wind farm capacity with the Stronelairg onshore wind farm (228MW) and the project-financed Beatrice offshore wind farm (SSE share: 235MW) still in construction. Both remain due for completion in calendar
19
year 2019. This capacity for renewable energy supports the delivery of government targets relating to climate change and output from it qualifies for either the Renewables Obligation (RO), which also applies in Northern Ireland, Contracts for Difference (CfD) or the Renewable Energy Feed in Tariff 2 in Ireland.
• Complementary investment in flexible thermal generation totalling £60.1m (8% of the total), including the Keadby 2 and Ferrybridge Multifuel 2 projects.
• Retail investment of £41.3m mainly relates to infrastructure to support SSE’s regulatory obligation to install smart meters for its Energy Supply customers as part of the UK’s Smart Metering rollout. At 30 September 2018, SSE had well over one million smart meters on supply in customers’ homes. Post installation, SSE’s meters transfer to a contracted Meter Asset Provider and SSE’s investment and capital expenditure excludes the capital cost of installation and meter assets.
• In addition, £29.0m has been invested in Enterprise, supporting Telecoms and Utility Solutions projects and £45.8m in Corporate Services, which was mainly on IT.
SSE is continuing to undertake significant investment in assets, with capital and investment expenditure for FY2018/19 still expected to be around £1.7bn. Around two thirds of this relates to maintaining and developing economically-regulated electricity networks and renewable energy projects, with a further 9% relating to complementary thermal generation assets. Much of the revenue derived from economically regulated networks and renewables assets is index-linked.
Investing efficiently in energy assets that the UK and Ireland need – a five year plan
SSE’s strategy is to create value for shareholders and society from developing, operating and owning energy and related infrastructure and services in a sustainable way. Central to this is investing in assets for which returns are expected to be clearly greater than the cost of capital. New assets should complement SSE’s existing portfolio of assets and their development and construction should be governed and executed in an efficient manner and in line with SSE’s commitment to strong financial management.
SSE is currently expecting capital and investment expenditure to total around £6bn across the five years to March 2023. Economically-regulated electricity networks and government-supported renewable sources of energy are expected to account for around 70% of this. As is to be expected, the investment is weighted more towards the first half of the five-year period than the second; and includes around £1.7bn planned for 2018/19 and around £1.3bn currently planned for 2019/20.
Around 80% of the £6bn is committed. It includes around £2.8bn of investment in electricity networks, which should support further growth in the RAV to around £10bn in 2023. It also includes investment in electricity generation such as a new £350m highly efficient and flexible gas-fired power station at Keadby 2 in Lincolnshire, an additional multi-fuel plant and some potential investment in offshore wind farms.
Final investment decisions will be determined by the need to secure returns that are clearly greater than the cost of capital, enhance earnings and support the delivery of dividend commitments. Indeed, SSE believes that strict financial discipline is more important than ever as auctions become an increasing feature of energy networks infrastructure provision, and SSE will not resort to taking on inappropriate risks or accepting returns on investment that are financially unsustainable.
20
SSE’s principal joint ventures and associates
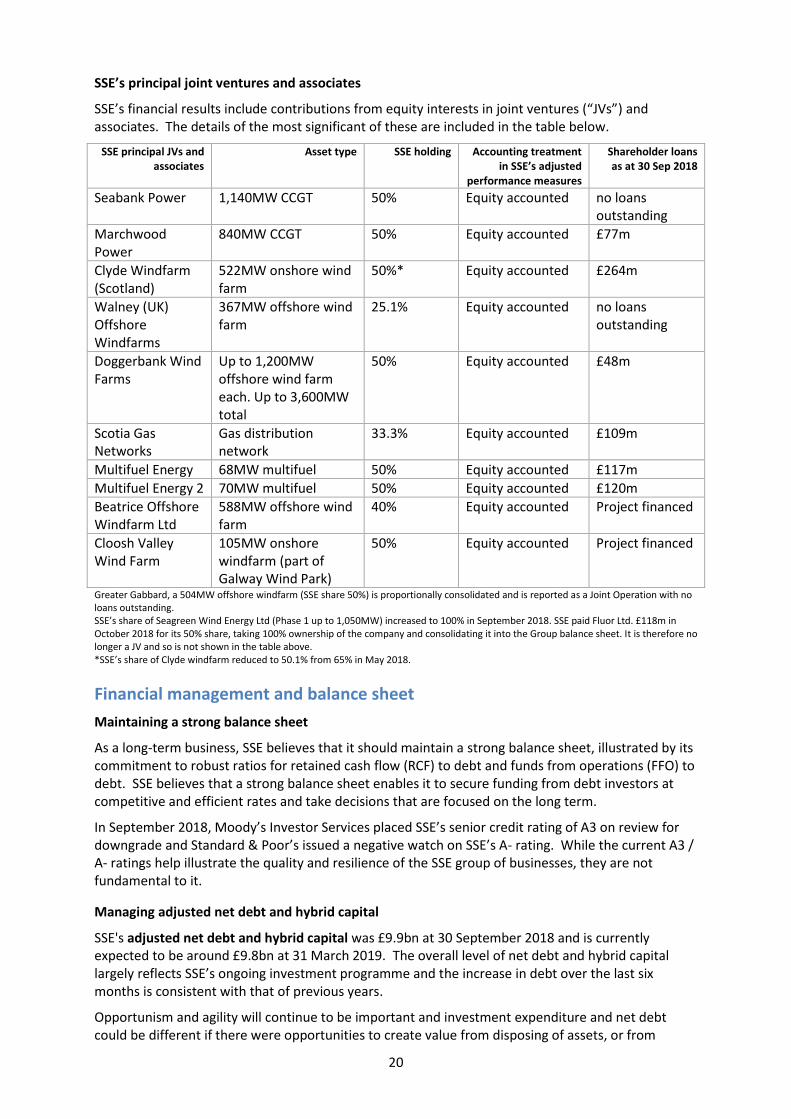
SSE’s financial results include contributions from equity interests in joint ventures (“JVs”) and associates. The details of the most significant of these are included in the table below.
SSE principal JVs and associates
Asset type SSE holding Accounting treatment in SSE’s adjusted
performance measures
Shareholder loans as at 30 Sep 2018
Seabank Power 1,140MW CCGT 50% Equity accounted no loans outstanding
Marchwood Power
840MW CCGT 50% Equity accounted £77m
Clyde Windfarm (Scotland)
522MW onshore wind farm
50%* Equity accounted £264m
Walney (UK) Offshore Windfarms
367MW offshore wind farm
25.1% Equity accounted no loans outstanding
Doggerbank Wind Farms
Up to 1,200MW offshore wind farm each. Up to 3,600MW total
50% Equity accounted £48m
Scotia Gas Networks
Gas distribution network
33.3% Equity accounted £109m
Multifuel Energy 68MW multifuel 50% Equity accounted £117m
Multifuel Energy 2 70MW multifuel 50% Equity accounted £120m
Beatrice Offshore Windfarm Ltd
588MW offshore wind farm
40% Equity accounted Project financed
Cloosh Valley Wind Farm
105MW onshore windfarm (part of Galway Wind Park)
50% Equity accounted Project financed
Greater Gabbard, a 504MW offshore windfarm (SSE share 50%) is proportionally consolidated and is reported as a Joint Operation with no loans outstanding. SSE’s share of Seagreen Wind Energy Ltd (Phase 1 up to 1,050MW) increased to 100% in September 2018. SSE paid Fluor Ltd. £118m in October 2018 for its 50% share, taking 100% ownership of the company and consolidating it into the Group balance sheet. It is therefore no longer a JV and so is not shown in the table above. *SSE’s share of Clyde windfarm reduced to 50.1% from 65% in May 2018.
Financial management and balance sheet
Maintaining a strong balance sheet
As a long-term business, SSE believes that it should maintain a strong balance sheet, illustrated by its commitment to robust ratios for retained cash flow (RCF) to debt and funds from operations (FFO) to debt. SSE believes that a strong balance sheet enables it to secure funding from debt investors at competitive and efficient rates and take decisions that are focused on the long term.
In September 2018, Moody’s Investor Services placed SSE’s senior credit rating of A3 on review for downgrade and Standard & Poor’s issued a negative watch on SSE’s A- rating. While the current A3 / A- ratings help illustrate the quality and resilience of the SSE group of businesses, they are not fundamental to it.
Managing adjusted net debt and hybrid capital
SSE's adjusted net debt and hybrid capital was £9.9bn at 30 September 2018 and is currently expected to be around £9.8bn at 31 March 2019. The overall level of net debt and hybrid capital largely reflects SSE’s ongoing investment programme and the increase in debt over the last six months is consistent with that of previous years.
Opportunism and agility will continue to be important and investment expenditure and net debt could be different if there were opportunities to create value from disposing of assets, or from
21
further investments or acquisitions. Financial results also have an impact on net debt; and management of net debt will be one of the options for using proceeds from any future disposals of businesses, assets or investments.
Adjusted net debt excludes finance leases and includes outstanding liquid funds that relate to wholesale energy transactions. Adjusted net debt at 30 September 2018 also includes an accounting increase of £136.8m as a result of fair value adjustments.
A reconciliation of adjusted net debt and hybrid capital to reported net debt is provided in the table headed Adjusted Net Debt and Hybrid Capital in the Alternative Performance Measures section of this statement.
The fair value adjustment relates to marked-to-market movements on cross-currency swaps and floating rate swaps that are classed as fair value hedges under IFRS. The hedges ensure that any movement in the fair value of net debt is offset by an equivalent movement in the derivative position.
The fair value increase in net debt was driven by both Sterling and Euro weakness against the US Dollar along with rising interest rates during the six months to 30 September 2018. This benefit is offset by an equivalent increase to the ‘in the money’ derivative position of SSE’s fair value hedges.
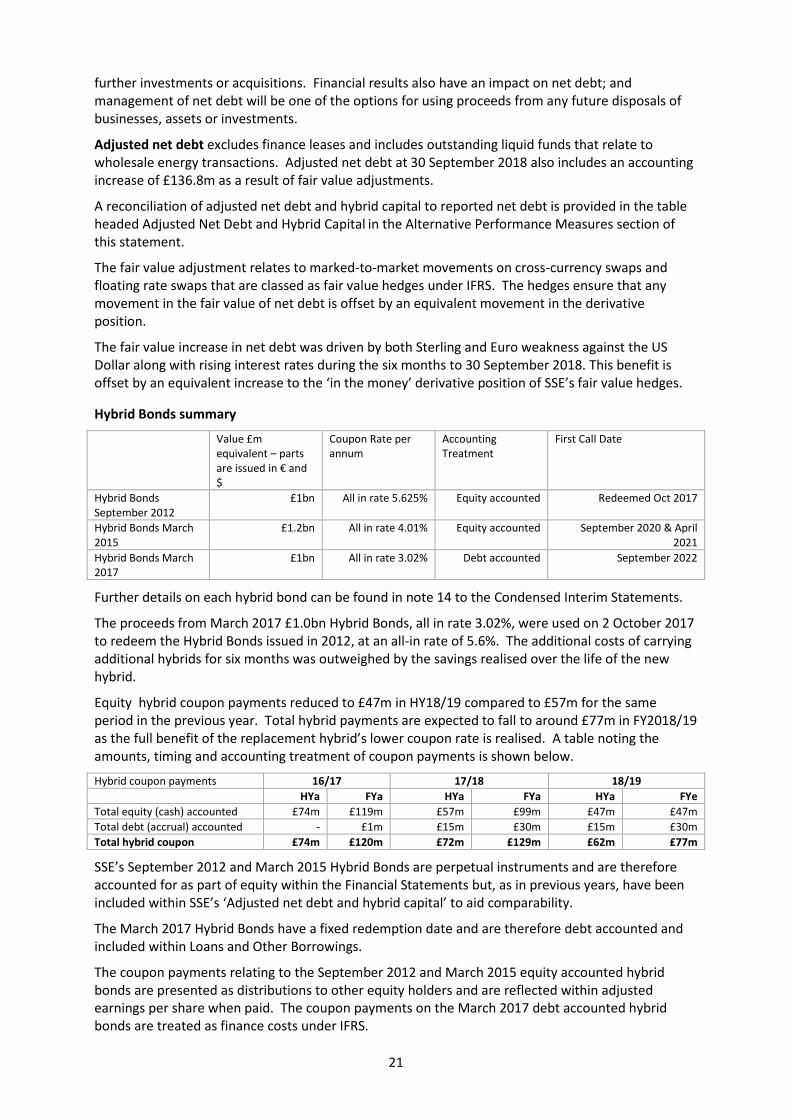
Hybrid Bonds summary
Value £m equivalent – parts are issued in € and $
Coupon Rate per annum
Accounting Treatment
First Call Date
Hybrid Bonds September 2012
£1bn All in rate 5.625% Equity accounted Redeemed Oct 2017
Hybrid Bonds March 2015
£1.2bn All in rate 4.01% Equity accounted September 2020 & April 2021
Hybrid Bonds March 2017
£1bn All in rate 3.02% Debt accounted September 2022
Further details on each hybrid bond can be found in note 14 to the Condensed Interim Statements.
The proceeds from March 2017 £1.0bn Hybrid Bonds, all in rate 3.02%, were used on 2 October 2017 to redeem the Hybrid Bonds issued in 2012, at an all-in rate of 5.6%. The additional costs of carrying additional hybrids for six months was outweighed by the savings realised over the life of the new hybrid.
Equity hybrid coupon payments reduced to £47m in HY18/19 compared to £57m for the same period in the previous year. Total hybrid payments are expected to fall to around £77m in FY2018/19 as the full benefit of the replacement hybrid’s lower coupon rate is realised. A table noting the amounts, timing and accounting treatment of coupon payments is shown below.
Hybrid coupon payments 16/17 17/18 18/19
HYa FYa HYa FYa HYa FYe
Total equity (cash) accounted £74m £119m £57m £99m £47m £47m
Total debt (accrual) accounted - £1m £15m £30m £15m £30m
Total hybrid coupon £74m £120m £72m £129m £62m £77m
SSE’s September 2012 and March 2015 Hybrid Bonds are perpetual instruments and are therefore accounted for as part of equity within the Financial Statements but, as in previous years, have been included within SSE’s ‘Adjusted net debt and hybrid capital’ to aid comparability.
The March 2017 Hybrid Bonds have a fixed redemption date and are therefore debt accounted and included within Loans and Other Borrowings.
The coupon payments relating to the September 2012 and March 2015 equity accounted hybrid bonds are presented as distributions to other equity holders and are reflected within adjusted earnings per share when paid. The coupon payments on the March 2017 debt accounted hybrid bonds are treated as finance costs under IFRS.
22
SSE has confirmed that the criteria applied by the Rating Agencies, Moody’s and Standard and Poor’s, will result in broadly the same value of hybrid equity treatment as that of previous years.
Managing net finance costs
SSE’s adjusted net finance costs, including interest on debt accounted hybrid bonds but not equity accounted hybrid bonds, were £201.9m in the six months to 30 September 2018 compared to £176.6m for the same period the previous year. This reflected higher net debt and higher JV interest costs.
Reported net finance costs were £100.0m, compared to £147.2m, reflecting the impact of changes in the fair value of financing derivatives being partially offset by higher net debt costs.
Summarising cash and cash equivalents
At 30 September 2018, SSE’s adjusted net debt included cash and cash equivalents totalling £0.2bn, the same as at March 2018. Medium term borrowings reaching maturity in 2018/19 total £0.6bn, comprising a Eurobond at 5% and a term loan at 3.52% both of which matured in October 2018.
The cash collateral value has increased by £286m in the first six months of the year and totalled £361.6m at 30 September 2018. The increase relates to collateral required to cover out of the money commodity positions.
The cash and cash equivalents total includes £84.3m relating to the SSE Energy Service Group and £2.0m for SSE Water which are presented as assets held for disposal within the Condensed Interim Statements.
Focusing on effective financial management: Treasury facilities in 2018/19
During the six months to 30 September 2018, SSE successfully issued its second Green Bond being a €650m, 9 year bond with a coupon of 1.375% which has been fully swapped to Sterling giving an all-in rate of 2.556%. This followed the €600m 0.875%, 7 year Green Bond SSE issued in September 2017 and will continue to help SSE to take a leading role in supporting the transition towards a low carbon future, through its plans to continue to invest in renewable energy, and reaffirm its position as a leader in renewable sources of energy.
During October 2018 SSE also issued a €200m 2 year Floating Rate Note that was fully swapped back to Sterling giving an all in floating rate of GBP Libor plus 50.5bps.
Refinancing over the medium term
Following the debt that matured in October 2018 (referenced above) SSE’s next significant potential refinancing milestones are:
• June 2020 when it will redeem its €600m/2% coupon bond; and
• September 2020 which is the first call date for the £750m/3.875% coupon equity accounted Hybrid.
Maintaining a prudent Treasury policy
SSE's treasury policy is designed to be prudent and flexible. In line with that, cash from operations is first used to finance regulatory and maintenance capital expenditure and then dividend payments, with capital and investment expenditure for growth generally financed by a combination of: cash from operations; bank borrowings and bond issuance.
As a matter of policy, a minimum of 50% of SSE's debt is subject to fixed rates of interest. Within this policy framework, SSE borrows as required on different interest bases, with financial instruments being used to achieve the desired out-turn interest rate profile. At 30 September 2018, 89% of SSE's borrowings were at fixed rates.
23
Borrowings are mainly in Sterling and Euros to reflect the underlying currency denomination of assets and cash flows within SSE. All other foreign currency borrowings are swapped back into either Sterling or Euros.
Transactional foreign exchange risk arises in respect of: procurement contracts; fuel and carbon purchasing; commodity hedging and energy portfolio management operations; and long-term service agreements for plant.
SSE's policy is to hedge any material transactional foreign exchange risks through the use of forward currency purchases and/or financial instruments. Translational foreign exchange risk arises in respect of overseas investments, hedging in respect of such exposures is determined as appropriate to the circumstances on a case-by-case basis. Overall, while SSE has kept its treasury policy under review following the result of the UK’s EU Referendum in June 2016, it has so far identified no need for change.
Ensuring a strong debt structure through medium and long-term borrowings
Ability to raise funds at competitive rates is fundamental to investment. SSE’s fund-raising over the last 5 years, including hybrid capital and term loans, now totals £5.8bn and SSE’s objective is to maintain a reasonable range of debt maturities. Its average debt maturity, excluding hybrid securities, at 30 September 2018 was 7.3 years, compared with 7.9 years at 31 March 2018. The reduction in debt maturity reflects SSE’s recent debt issuance which has taken advantage of the best value on the maturity curve. And SSE’s average cost of debt is now consistently below 4.0%.
SSE’s debt structure remains strong, and on 30 September 2018 it had around £9.4bn of medium/long term borrowings in the form of issued bonds, European Investment Bank debt, hybrid securities and other loans.
Going concern
The directors regularly review the Group’s funding structure and have assessed that the Condensed Interim Statements should be prepared on a going concern basis. In making their assessment the directors have assessed the forecast future cashflows of the Group taking account of the available liquidity in the commercial paper market. In addition, the Group still has significant headroom on its committed borrowing facilities while the next significant refinancing of external debt is not due until 2020.
Operating a Scrip Dividend Scheme
The renewal of SSE’s Scrip Dividend Scheme was approved by shareholders at its 2018 AGM. The Scrip Dividend Scheme gives shareholders the option to receive new, fully paid ordinary shares in the Company in place of their cash dividend payments. It therefore reduces cash outflow and so supports the balance sheet.
The average Scrip dividend take-up since 2010 is 24%, and for the 2017/18 full year dividend it was 21%. In May 2018 SSE announced that, if Scrip take-up of the full-year dividend exceeds 20%, SSE now intends to buy back shares so that its dilutive effect is not excessive, starting with the 2018/19 full year dividend. SSE believes this strikes the right balance in terms of giving shareholders choice, potentially securing cash dividend payment savings and managing the number of additional shares issued.
Tax
SSE considers being a responsible taxpayer a core element of being a responsible member of society. SSE seeks to pay the right amount of tax on its profits, in the right place, at the right time, and continues to be the only FTSE 100 company to have been awarded the Fair Tax Mark. While SSE has an obligation to its customers and shareholders to efficiently manage its total tax liability, it does not seek to use the tax system in a way it does not consider it was meant to operate, or use “tax havens” to reduce its tax liabilities.
24
SSE understands it also has an obligation to the society in which it operates, and from which it benefits – for example, tax receipts are vital for the public services SSE relies upon. Therefore, SSE’s tax policy is to operate within both the letter and spirit of the law at all times.
For reasons already stated above, SSE’s focus is on adjusted profit before tax, and in line with that, SSE believes that the adjusted current tax charge on that profit is the tax measure that best reflects underlying performance. SSE’s adjusted current tax rate for 2018/19, based on adjusted profit before tax, is forecast to be only 0.2%, as compared with 7.4% in 2017/18 on the same basis, and after prior period adjustments. In 2017/18, SSE had prior period tax credits – through the carry back of tax losses and truing up of earlier year tax returns – totalling £66.0m. In 2018/19, those tax credits are forecast to be slightly higher at £68.0m. While those tax credits may not have had a significant impact on SSE’s adjusted underlying current tax charge for 2017/18, they are expected to be sufficient to almost eliminate the adjusted underlying current tax charge for 2018/19.
On 12 November 2018, SSE published Talking Tax 2018, summarising its approach to tax matters for the year ended 31 March 2018 (see sse.com).
Financial priorities
SSE’s financial priorities for the remainder of the 2018/19 financial year are to
• Remunerate shareholders’ investment through recommending a full-year dividend of 97.5 pence per share.
• Maintain financial discipline in relation to capital and investment expenditure currently expected to total around £1.7bn for the year as a whole;
• Focus on strong financial management, including robust ratios for RCF and FFO/debt;
• Seek maximum value from any disposals of investments, assets or businesses; and
• Maintain a strong commitment to responsible tax policies and transparency on tax.
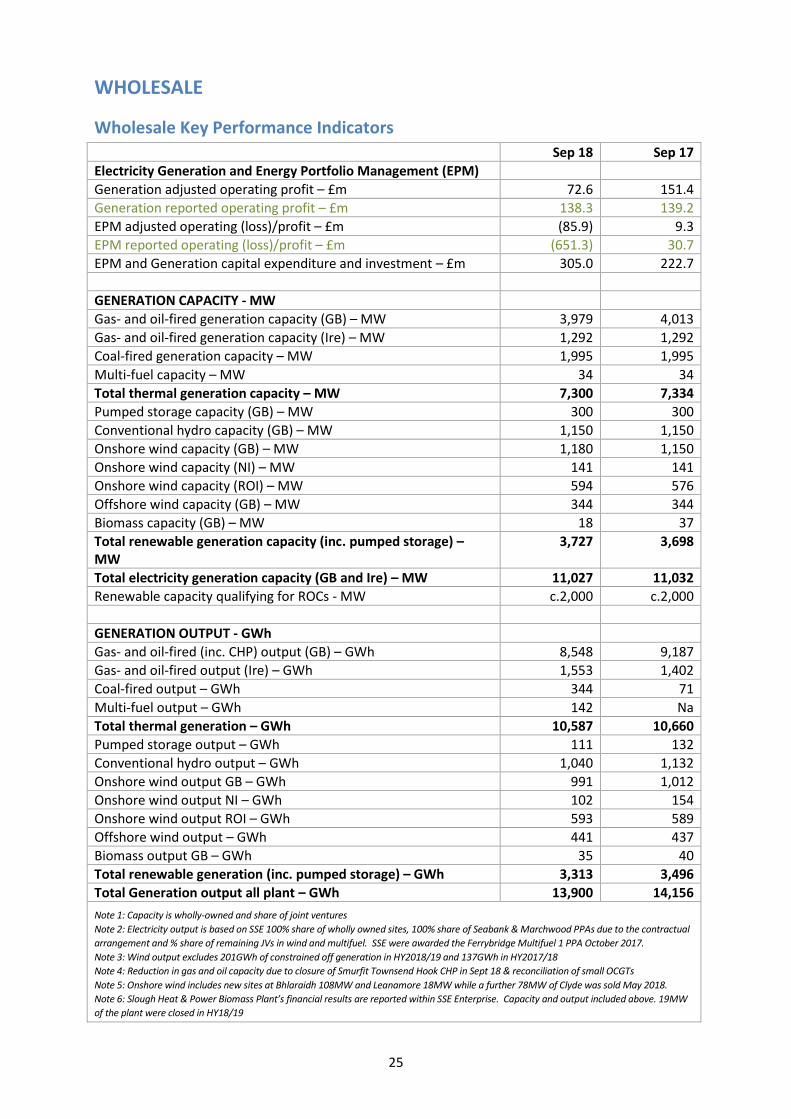
25
WHOLESALE
Wholesale Key Performance Indicators
Sep 18 Sep 17
Electricity Generation and Energy Portfolio Management (EPM)
Generation adjusted operating profit – £m 72.6 151.4
Generation reported operating profit – £m 138.3 139.2
EPM adjusted operating (loss)/profit – £m (85.9) 9.3
EPM reported operating (loss)/profit – £m (651.3) 30.7
EPM and Generation capital expenditure and investment – £m 305.0 222.7
GENERATION CAPACITY - MW
Gas- and oil-fired generation capacity (GB) – MW 3,979 4,013
Gas- and oil-fired generation capacity (Ire) – MW 1,292 1,292
Coal-fired generation capacity – MW 1,995 1,995
Multi-fuel capacity – MW 34 34
Total thermal generation capacity – MW 7,300 7,334
Pumped storage capacity (GB) – MW 300 300
Conventional hydro capacity (GB) – MW 1,150 1,150
Onshore wind capacity (GB) – MW 1,180 1,150
Onshore wind capacity (NI) – MW 141 141
Onshore wind capacity (ROI) – MW 594 576
Offshore wind capacity (GB) – MW 344 344
Biomass capacity (GB) – MW 18 37
Total renewable generation capacity (inc. pumped storage) – MW
3,727 3,698
Total electricity generation capacity (GB and Ire) – MW 11,027 11,032
Renewable capacity qualifying for ROCs - MW c.2,000 c.2,000
GENERATION OUTPUT - GWh
Gas- and oil-fired (inc. CHP) output (GB) – GWh 8,548 9,187
Gas- and oil-fired output (Ire) – GWh 1,553 1,402
Coal-fired output – GWh 344 71
Multi-fuel output – GWh 142 Na
Total thermal generation – GWh 10,587 10,660
Pumped storage output – GWh 111 132
Conventional hydro output – GWh 1,040 1,132
Onshore wind output GB – GWh 991 1,012
Onshore wind output NI – GWh 102 154
Onshore wind output ROI – GWh 593 589
Offshore wind output – GWh 441 437
Biomass output GB – GWh 35 40
Total renewable generation (inc. pumped storage) – GWh 3,313 3,496
Total Generation output all plant – GWh 13,900 14,156
Note 1: Capacity is wholly-owned and share of joint ventures
Note 2: Electricity output is based on SSE 100% share of wholly owned sites, 100% share of Seabank & Marchwood PPAs due to the contractual
arrangement and % share of remaining JVs in wind and multifuel. SSE were awarded the Ferrybridge Multifuel 1 PPA October 2017.
Note 3: Wind output excludes 201GWh of constrained off generation in HY2018/19 and 137GWh in HY2017/18
Note 4: Reduction in gas and oil capacity due to closure of Smurfit Townsend Hook CHP in Sept 18 & reconciliation of small OCGTs
Note 5: Onshore wind includes new sites at Bhlaraidh 108MW and Leanamore 18MW while a further 78MW of Clyde was sold May 2018.
Note 6: Slough Heat & Power Biomass Plant’s financial results are reported within SSE Enterprise. Capacity and output included above. 19MW
of the plant were closed in HY18/19
26
Introduction to the Wholesale businesses
SSE’s Wholesale businesses are Electricity Generation (renewable and thermal), Gas Storage, Gas Production and Energy Portfolio Management. Electricity Generation in particular is well positioned to support the trends towards decarbonisation, electrification and infrastructure. Renewable energy, complemented by flexible thermal generation and business energy sales, is core to the SSE group.
The markets in which SSE's Wholesale businesses operate continue to be impacted by a number of key long-term trends and developments, including an uncertain macroeconomic environment; commodity price volatility; government intervention; regulatory change; and the ongoing transition to a low carbon economy.
Market developments - UK
SSE believes that putting a meaningful price on carbon emissions is a critical part of the UK’s energy policy and is one of the most important policy tools the government has to help industry continue to deliver reliable and lower carbon electricity cost-effectively. In Budget 2018, the UK Government confirmed it will freeze the CPS rate at £18/tCO2 for 2020-21. The Budget also announced that in the event of a ‘no deal’ Brexit whereby the UK departs from the EU ETS in 2019, the UK Government would introduce a Carbon Emissions Tax (£16/ tCO2). The tax would apply to all stationary installations currently participating in the EU ETS from 1 April 2019. This would be applied in addition to the CPS rate.
In July 2018, the UK Government confirmed the next CfD auction for ‘less established technologies’, including offshore wind, will take place by May 2019, with subsequent auctions every two years. The Government expects these auctions could support 1-2GW of new offshore wind per year in the 2020s. The UK Government has also confirmed that onshore wind farm developments on the Scottish islands will have the opportunity to compete in these CfD auctions.
Also, in July 2018, the UK Government announced it will procure 46.3GW in the T-4 auction for delivery in 2022/23 and 4.6GW in the T-1 auction for delivery in 2019/20. SSE has submitted prequalification applications for both upcoming auctions planned to start on 5 February 2019 and 29 January 2019, respectively.
Market developments - Ireland
In July 2018, the Irish Government confirmed the high level design of a new Renewable Electricity Support Scheme (RESS) aimed at supporting 11-12GWh of renewable electricity to 2030. Onshore wind will be eligible to compete for support from the first RESS auction, estimated to take place in 2019 for delivery in 2020. The high level design of the new Irish RESS confirms that offshore wind will be eligible to compete for support. SSE believes offshore wind has real opportunities from the second RESS auction, indicatively scheduled for 2020, with further auctions signalled for 2021, 2023, and 2025. The scheme is awaiting State Aid approval before being implemented.
On 1 October, the new Integrated Single Electricity Market (I-SEM) was introduced on the island of Ireland. The new market replaces the Single Electricity Market (SEM), which has been in operation since 2007, and is designed to increase access to cheaper sources of electricity, allow for more cost-effective delivery of energy to consumers, and enable investors and operators to better manage risk. SSE’s interactions with the market, including new balancing obligations, are being managed through a dedicated I-SEM trading desk within Energy Portfolio Management.
Renewable Energy
Creating SSE Renewables
SSE has today made a separate announcement relating to its plans to consolidate the development, operation and ownership of all of its renewable energy assets in the UK and Ireland under a single wholly-owned entity. Called SSE Renewables, it will consolidate under a single entity, its existing and
27
operational assets, including JV interests and assets under development and construction in onshore wind; offshore wind; flexible hydro; run-of-river hydro; and pumped storage.
The business will have a specialist management team, led by Jim Smith as Managing Director, focused entirely on creating and delivering the long-term value and future opportunities which renewable energy represents.
Renewable energy capacity and output
While there has been a net increase in renewable capacity, electricity output, including pumped storage, decreased in the first half of 2018/19, compared to the same period in the previous year (3.2TWh compared to 3.5TWh), and was around 14% lower than expected for the period (including constrained off generation). The primary driver for this differential was relatively dry, still weather during the period which resulted in lower than expected wind speeds and hydro production.
Onshore wind
Following the sale of 78MW of capacity at Clyde, SSE’s onshore wind farm capacity now stands at 1,915MW. Final turbines have been installed at Stronelairg (228MW), SSE’s final wind farm to be accredited under the Renewables Obligation, and the project is on track for completion by Spring 2019, it is not currently included in SSE’s generation capacity totals.
SSE’s onshore wind farm pipeline consists of over 800MW of potential new build projects. This includes around 525MW of capacity with consent for development, some of which SSE may seek to increase through planning amendments to accommodate more advanced turbine technology. This includes the joint venture Viking Wind Farm (up to 457MW – SSE share 50%), located on Shetland, and Strathy South (up to 133MW).
At present, there is no indication of a further UK CfD auction for onshore wind. In the context of market and technology developments SSE continues to take forward development options for new onshore wind farms and extensions to existing wind farms and is well placed to take advantage of any future opportunities as they emerge.
Offshore wind
The six months to 30 September has seen excellent progress towards completion of the Beatrice offshore wind farm (588MW – SSE share 40%). 33 of 84 turbines have now been installed and are exporting power to the grid. On 6 November, Beatrice Offshore Windfarm Ltd (BOWL) submitted a ‘Start Date Notice’ to the Low Carbon Contracts Company (LCCC) confirming it has met the necessary conditions to trigger the start of Contracts for Difference payments for Phase I. Subject to a 10-day review period by the LCCC, CfD payments will commence as of 6 November 2018. The full project is on track for completion in Spring 2019 at which time SSE Generation will operate the wind farm.
SSE has interests in three further offshore wind prospects under development, which are governed in line with the fact that some of the UK projects could be eligible to compete in the same CfD auction:
• Seagreen (Phase 1 up to 1,050MW), wholly owned by SSE following its acquisition of Fluor Ltd.’s 50% share of the joint venture. The future ownership structure will be further reviewed in the coming months with the view to maximising value for SSE shareholders. At present, SSE remains focused on preparing the Seagreen Phase 1 projects, Alpha and Bravo, for the next UK CfD auction.
• Dogger Bank (up to 3.6GW), a 50:50 joint venture with Equinor to develop three projects in the Dogger Bank zone – Creyke Beck A, Creyke Beck B and Teesside A. The projects are being progressed in preparation for the next CfD auction.
• Arklow Bank Wind Park Phase II (minimum 520MW) in Ireland, wholly owned by SSE.
In October 2018, The Crown Estate confirmed the application by Greater Gabbard Offshore Wind Farm (SSE share – 50%) for an extension to the existing wind farm site (up to 500MW) had
28
successfully progressed to the next phase of the process. The next steps will be for The Crown Estate to undertake a habitats assessment of the proposed extension project.
SSE continues to engage with The Crown Estate and Crown Estate Scotland on their leasing processes for new seabed to maintain a pipeline of offshore projects through to the late 2020s and beyond.
Flexible Thermal Generation
Existing fleet
SSE’s thermal fleet fulfils an important function within the wider electricity market by providing reliable capacity at scale in response to market changes and events, for example, unplanned nuclear outages and periods of low rain or wind.
SSE’s CCGTs are among the most flexible on the GB and Irish electricity systems and have increasingly created value from their intra-day flexibility. This flexibility is important in supporting the transition to a low carbon electricity system.
SSE has an ownership interest in five gas-fired power stations that participate in the GB electricity market:
• Medway (735MW wholly owned) has capacity obligations through September 2022.
• Keadby (755MW wholly owned) has capacity obligations through September 2022.
• Peterhead (1,180MW wholly owned) has a capacity obligation from October 2018 through September 2019 and from October 2021 through September 2022.
• Seabank (1,164MW) and Marchwood (840MW) SSE has a 50% stake in each of these gas-fired power stations, which both have capacity obligations through September 2022.
A sixth gas-fired power station, Great Island (464MW), participates in the Integrated Single Electricity Market in Ireland and has a Capacity Contract through September 2019.
SSE operates one wholly owned coal-fired power station, at Fiddler’s Ferry (1,995MW), which has capacity obligations for three of its four units until September 2019. Preparation for the safe demolition of the Ferrybridge ‘C’ coal-fired power station is under way.
Future development
Construction of Ferrybridge Multifuel 2 (69MW – SSE share 50%) is under way, with completion on track for 2019. SSE is also carrying out site preparation work for a potential new multifuel plant (up to 50MW) at Slough.
In May 2018 SSE announced its decision, in partnership with Siemens, to proceed with a unique commercial opportunity to introduce first-of-a-kind, high efficiency, gas-fired generation technology to the UK. SSE will invest £350m in an 840MW CCGT at Keadby 2 in Lincolnshire, adjacent to its existing Keadby CCGT. Construction is under way and is expected to take around three and a half years. SSE intends to participate in future capacity market auctions to secure an agreement for Keadby 2.
Additionally, SSE continues to develop a CCGT project at Ferrybridge D with the view to progressing should market conditions warrant further investment in high efficiency gas-fired generation during the transition to a low carbon electricity system. There is also considerable value in the optionality of the existing sites at Ferrybridge and Fiddler’s Ferry.
Energy Portfolio Management (EPM)
The role of SSE’s Energy Portfolio Management function includes risk management for its market-based businesses and, where appropriate, securing value and managing volatility in volume and price through the risk-managed trading of energy-related commodities.
29
Review of EPM activities and changes to EPM operations
In its Notification of Closed Period Statement, published 25 September 2018, SSE said it expected to set out how EPM activities will evolve to reflect its asset base and operations following the planned SSE Energy Services transaction.
A review of SSE’s strategy for managing its energy portfolio has now been carried out taking into account:
• the evolution of the SSE group of businesses; and
• evolution in global energy commodity markets.
The review has also taken account of feedback from shareholders and investors that enhanced clarity in hedging approach and portfolio positions is important, particularly following the forecast adjusted operating loss in SSE’s Energy Portfolio Management division in 2018/19.
The conclusions of the review have led to the changes outlined below. Further details of the SSE’s Group’s approach to hedging have been published today on sse.com and it is expected to transition to this approach over the period to March 2020.
Over the same period, SSE intends to make the following changes to the operations of its Energy Portfolio Management (EPM) division:
• EPM’s financial position will continue to be measured and managed using Value at Risk (VaR).
The VaR metric quantifies EPM’s level of financial risk over a certain time period and sets the
probability of gains or losses within a desired range. The EPM VaR, which is approved by the
SSE Board, will be progressively reduced to under £10m per day at a confidence level of
97.5%;
• Profit at Risk will be introduced to measure the downside risk to profitability of SSE’s
portfolio of physical and financial assets, analysed by time periods in which energy is
delivered. It will consider both price risk and volume risk and will act as a lead indicator of
commodity price exposure across the SSE group; it will ensure that trading positions cannot
have a material impact on SSE group earnings; and
• Rather than taking a Group portfolio approach to long term commodity price exposures and
hedging, EPM will become an operational function responsible for executing commodity
trades to implement the agreed hedging approach for each asset class in the SSE Group.
The Wholesale Risk Committee will continue to have oversight of EPM’s trading position and the VaR. It will report directly to a newly formed SSE Board Committee, which will be chaired by Tony Cocker and oversee the transition to the new hedging approach.
Gas Production
GAS PRODUCTION Sep 18 Sep 17
Gas production adjusted (and reported) operating profit - £m 19.3 4.5
Gas production– M therms 246.6 254.9
Gas production– Mboe 4.40 4.21
Liquids production – Mboe 0.32 0.38
Gas production capital investment – £m 12.8 36.0
Technical review carried out annually: Mar 18 Mar 17
Total net proven and probable reserves (2P) bn therms 1.9 2.5
Total net proven and probable reserves (2P) Mboe 33.8 43.0
30
SSE has a diverse equity share in over 15 producing fields across 25 licences in three regions of the UK Continental Shelf: the Easington Catchment Area, the Bacton Area and Greater Laggan Area. In September 2018, Total announced a major gas discovery on the Glendronach prospect, operated by Total E&P UK with a 60% interest alongside partners Ineos E&P UK Limited (20%) and SSE E&P UK Limited (20%). Total stated that preliminary tests confirm good reservoir quality, permeability and well production deliverability, with recoverable resources estimated at about one trillion cubic feet (equivalent to around 10 billion therms), although this discovery is not yet on a net proven and probable basis and is not included in the table above. Total expects that the discovery can be developed quickly with the existing infrastructure around the Edradour field and the Laggan-Tormore facilities of the Shetland Gas Plant, in which SSE also has a 20% stake.
SSE’s gas production assets represent an investment, rather than a business in which we are involved in development and operational activities. As gas production is ultimately not consistent with SSE’s focus on assets that contribute to the decarbonisation of the energy system, set out in May 2018, SSE will seek different routes available for securing value, with disposal expected to be the most likely. In the meantime, SSE is continuing to support exploration and appraisal activities around its existing assets.
Gas Storage
GAS STORAGE Sep 18 Sep 17
Gas storage adjusted (and reported) operating (loss) - £m (3.7) (5.3)
Gas storage customer nominations met - % 100 100
Gas storage capital investment - £m - 0.5
The economic conditions continued to be challenging for gas storage in the first half of 2018/19. Following the closure of Rough capacity, SSE now holds around 40% of the UK's conventional underground gas storage capacity, and the overall UK storage duration curve has shrunk to around 16 days. This loss of energy storage will be further exacerbated as coal-fired generation shuts over the next few years, taking with it the storage inherent in coal stocks.
Although the UK has access to diverse gas supply sources, such as interconnection and LNG, gas storage will play an important role in safeguarding the UK’s gas and electricity security of supply. SSE’s gas storage assets are well-placed to provide this service to energy users; however, the market continues to undervalue this service, making it increasingly challenging to cover the cost of maintaining and operating these assets.
SSE remains committed to working with UK government departments and the Regulator to ensure that the critical role of UK storage in relation to security of supply and stability of gas price is maintained.
Wholesale businesses – Priorities
The priorities for SSE’s Wholesale businesses for the remainder of the 2018/19 financial year, in addition to their first goal of safe working, are to:
• begin to consolidate the development, operation and ownership of all of its renewable energy assets under a single wholly-owned entity, SSE Renewables.
• advance its offshore wind projects, with a focus on preparing Seagreen and Dogger Bank projects in readiness for the upcoming UK Contracts for Difference auction, expected in May 2019.
• prepare for and implement the transition to the new SSE Group approach to hedging and associated disclosure commitments, by March 2020;

31
• maintain and operate efficiently and reliably its generation portfolio across the UK and Ireland; and
• deliver new assets in construction, in particular Beatrice, Stronelairg, and Ferrybridge Multifuel 2, and develop new opportunities to build, own and operate assets in the future.
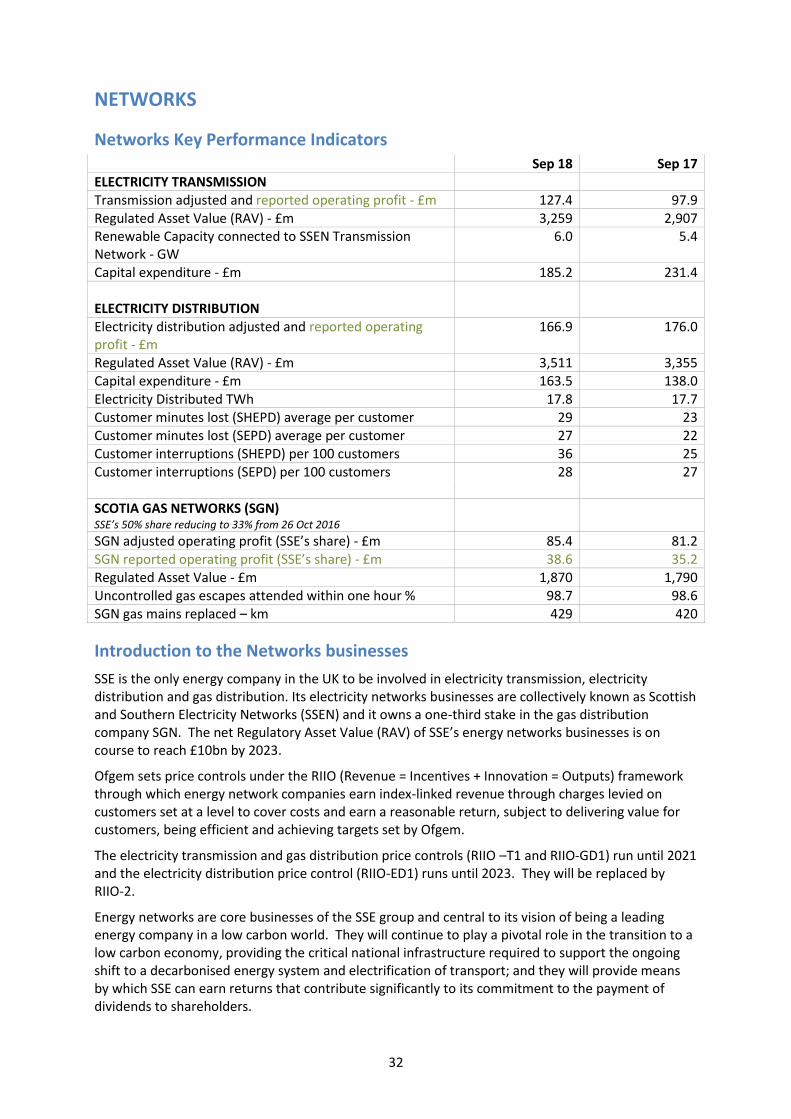
32
NETWORKS
Networks Key Performance Indicators Sep 18 Sep 17 ELECTRICITY TRANSMISSION Transmission adjusted and reported operating profit - £m 127.4 97.9 Regulated Asset Value (RAV) - £m 3,259 2,907 Renewable Capacity connected to SSEN Transmission Network - GW
6.0 5.4
Capital expenditure - £m 185.2 231.4 ELECTRICITY DISTRIBUTION Electricity distribution adjusted and reported operating profit - £m
166.9 176.0
Regulated Asset Value (RAV) - £m 3,511 3,355 Capital expenditure - £m 163.5 138.0 Electricity Distributed TWh 17.8 17.7 Customer minutes lost (SHEPD) average per customer 29 23 Customer minutes lost (SEPD) average per customer 27 22 Customer interruptions (SHEPD) per 100 customers 36 25 Customer interruptions (SEPD) per 100 customers 28 27 SCOTIA GAS NETWORKS (SGN) SSE’s 50% share reducing to 33% from 26 Oct 2016
SGN adjusted operating profit (SSE’s share) - £m 85.4 81.2 SGN reported operating profit (SSE’s share) - £m 38.6 35.2 Regulated Asset Value - £m 1,870 1,790 Uncontrolled gas escapes attended within one hour % 98.7 98.6 SGN gas mains replaced – km 429 420
Introduction to the Networks businesses
SSE is the only energy company in the UK to be involved in electricity transmission, electricity distribution and gas distribution. Its electricity networks businesses are collectively known as Scottish and Southern Electricity Networks (SSEN) and it owns a one-third stake in the gas distribution company SGN. The net Regulatory Asset Value (RAV) of SSE’s energy networks businesses is on course to reach £10bn by 2023.
Ofgem sets price controls under the RIIO (Revenue = Incentives + Innovation = Outputs) framework through which energy network companies earn index-linked revenue through charges levied on customers set at a level to cover costs and earn a reasonable return, subject to delivering value for customers, being efficient and achieving targets set by Ofgem.
The electricity transmission and gas distribution price controls (RIIO –T1 and RIIO-GD1) run until 2021 and the electricity distribution price control (RIIO-ED1) runs until 2023. They will be replaced by RIIO-2.
Energy networks are core businesses of the SSE group and central to its vision of being a leading energy company in a low carbon world. They will continue to play a pivotal role in the transition to a low carbon economy, providing the critical national infrastructure required to support the ongoing shift to a decarbonised energy system and electrification of transport; and they will provide means by which SSE can earn returns that contribute significantly to its commitment to the payment of dividends to shareholders.
33
Ofgem sets out future regulatory framework
In July 2018, Ofgem published RIIO2 Framework Decision: Our approach to setting price controls for GB gas and electricity networks. SSEN supports Ofgem’s intention to give consumers a stronger voice in setting outputs, shaping and assessing business plans and welcomes Ofgem’s focus on allowing network companies to earn returns that are fair and represent good value for consumers, reflect the risks faced in these businesses, and prevailing financial market conditions.
Ofgem is now taking work forward the consultation on sector specific methodologies planned for December 2018. SSEN will continue to advocate constructively for a regulatory framework that strikes the right balance between driving efficiency and maintaining a stable investment climate that continues to deliver improvements in network reliability, innovation and customer service and pave the way for the further decarbonisation of the energy system.
Electricity Transmission
SSEN, operating as Scottish Hydro Electric Transmission plc, owns, operates and develops the high voltage electricity transmission system in the north of Scotland and remote islands.
Since the start of the RIIO-T1 Price Control in 2013, SSEN’s capital investment in its transmission network has totalled over £2.5bn, with this investment playing a pivotal role in providing key national infrastructure to facilitate the transition to a decarbonised energy system.
In addition to the base rate of return on the RAV of SSEN’s transmission assets, RIIO-T1 allows additional revenue to be earned through financial incentives based on efficient use of total expenditure (totex) for the benefit of customers.
For SSEN, the outcome of efficiency savings will be dependent on the successful completion of multi-year large scale projects and the successful close out of RIIO-T1 after 2021. It is expected that SSEN will deliver totex savings over the course of RIIO-T1 of which, under the price control agreement, 50% will be retained by SSEN, supporting returns for RIIO-T1, with the remaining 50% returned to customers through lower charges than would otherwise have been the case.
Maintaining network reliability
SSEN’s first priority is to provide a safe and reliable supply of electricity to the electricity customers it serves. Despite the current period of rapid growth in transmission development, including commissioning of substantial new assets and the connection of large volumes of renewable generation capacity, SSEN’s focus on operational excellence has maintained a reliability of over 99.9%.
As its transmission assets, many of which date back to the 1950s, naturally reach the end of their operational life, SSEN has an ongoing programme of maintenance and refurbishment to ensure its critical, national infrastructure assets, continue to deliver for electricity customers and wider society.
Preparing for the energisation of the Caithness-Moray transmission link
SSEN continues to make progress with the delivery of its new Caithness-Moray transmission link. With an agreed allowance of £1.1bn, the project is the largest single investment undertaken by any part of the SSE group to date. Construction of most aspects of the project is now complete and it is now at an advanced stage of commissioning and remains on track for delivery by the end of calendar year 2018.
Enabling the transition to a low carbon economy
SSEN’s strategic priority for the RIIO-T1 period has been to enable the transition to a low carbon economy through building the transmission infrastructure necessary to connect and transport renewable energy.
In the six months to 30 September 2018, SSEN successfully completed and energised the connections for: Dorenell wind farm (220MW); and Beatrice Offshore Wind Farm (588MW). Good progress
34
continues to be made with Moray Offshore East Wind Limited (MOWEL) (900MW) which remains on track to be energised in 2021/22.
The installed renewable electricity generation capacity connected to SSEN’s transmission network has grown from 3.3GW at the start of the RIIO-ET1 price control in April 2013 to over 6GW as at 30 September 2018.
Investing to provide modern infrastructure to support a decarbonised energy system
In the remaining years of the RIIO-T1 Price Control, SSEN has a healthy pipeline of projects. With a total planned investment of around £900m, the transmission business remains on track to increase its RAV to around £3.6bn by 2021.
Looking further ahead, SSEN has visibility of a further £700m of contingent projects that are dependent on the progress of onshore wind developments against a continued uncertain policy regime. Although the timing and ultimate need for these projects remains unclear, progression is most likely during the next price control period.
Preparing to connect Scotland’s island groups
SSEN continues to work with its generation customers and other stakeholders across the three Scottish island groups to take forward proposals to provide transmission connections to enable the connection of renewable electricity generation. Together, these three island links could provide an investment opportunity of around £1.5bn for SSEN.
Following the submission of the Orkney Needs Case in March 2018, SSEN has now submitted Needs Cases for both the Western Isles and Shetland transmission links. Both links would deliver a 600MW subsea cable, predicated on the main renewable developers on both island groups being successful in the 2019 CfD auction.
SSEN will continue to engage positively and constructively with developers, Ofgem, Government and other stakeholders to take forward its proposals in a timely manner, as soon as developer commitment and all necessary regulatory and planning approvals are confirmed.
Addressing competition in transmission
In September 2018, Ofgem published a number of documents setting out its latest developments in its approach to Competition in Onshore Transmission.
SSEN continues to have a number of significant concerns about its implementation. In particular, it believes Ofgem’s proposals effectively reopen the current Price Control; they are justified on unproven customer benefits; they are not underpinned by legislation; and they risk delays to the delivery of well-established and advanced projects.
For these reasons, SSEN continues to believe competition should not be implemented until such time that these material factors are adequately addressed in an open and transparent manner.
Whilst SSEN will continue to engage constructively with Ofgem and other stakeholders as part of this process, it will also consider all options available to ensure the integrity of the Price Control is maintained and the development of existing projects continues.
Planning for RIIO-T2
Preparations are well under way to gather evidence to support the development of SSEN’s RIIO-T2 business plan, due to be submitted in late 2019.
A key focus in the six months to 30 September 2018 has been the establishment of its RIIO-T2 User Group. The User Group brings together eight experts who have a varied background in areas including non-traditional business models, innovation, fuel poverty, community energy and consumer research. SSEN is confident it will provide the right level of industry and consumer insight, whilst also providing independent challenge and scrutiny as it prepares its RIIO-T2 business plan.
35
SSEN will continue to undertake further engagement and consultation with key stakeholders in the second half of the year to ensure it develops a credible and evidence-based business plan for submission to Ofgem in late 2019.
In support of its preparations for RIIO-T2; to be able to meet customers’ future needs over the next decade and beyond; and to understand what technologies are likely to impact electricity generation and demand profiles, SSEN published in August 2018 its North of Scotland Future Energy Scenario report.
It set out SSEN’s view, informed following extensive stakeholder engagement, of the range of potential generation scenarios in the north of Scotland for the period 2021-2030. It summarises the scenario analysis undertaken at a national and localised level to determine what network development options and the scale of investment required to meet future demands on the network.
Director of Transmission appointment
Rob McDonald, currently SSE’s Managing Director, Corporate and Business Services, and before that Director of Regulation, has been appointed Director of Transmission, in succession to David Gardner, who intimated earlier this year his wish to retire from SSE in the course of 2019.
Electricity Distribution
SSEN, operating as Scottish Hydro Electric Power Distribution (SHEPD) and Southern Electric Power Distribution (SEPD) under licence, is responsible for maintaining the electricity distribution networks supplying over 3.7 million homes and businesses across central southern England and north of the central belt of Scotland.
Delivering for customers and investors under the incentive-based framework
SSEN is now approaching the mid-point of the RIIO-ED1 Price Control, and has delivered significant changes to its operations, processes and standards to ensure the needs of its customers remain at the forefront of decision making. It aims to be as efficient and effective as possible and earn returns that are fair to customers and shareholders alike, focusing on four key areas:
• Good performance in relation to incentives available within RIIO-ED1;
• Efficient delivery of capital investment;
• Focused delivery of regulatory outputs; and
• Maintaining a leadership position in innovation.
Targeting good performance in incentives: IIS
Incentives cover the Interruptions Incentive Scheme (IIS); Customer Satisfaction and Stakeholder Engagement; and Connections.
Under the IIS, SSEN is incentivised on its performance against the loss of electricity supply through the recording of Customer Interruptions (CI) and Customers Minutes Lost (CML), which include both planned and unplanned supply interruptions.
In the six months to 30 September 2018, in SSEN’s central southern England network region CI per 100 customers increased slightly to 28 (27 last year) and the average CML increased to 27 (22 last year). Performance in 2018 was impacted by the sustained heatwave in June and July which caused a number of challenges affecting SSEN’s lower voltage networks. This included weather related faults with its switch gear, sagging lines due to the extreme heat as well as several lightning storms.
After a particularly strong performance in the first half of last year, in SSEN’s north of Scotland network region CI per 100 customers increased to 36 (25 last year) and the average CML increased to 29 (22 last year). While the total number of faults only increased by around 10% compared to the first six months of last year, the total number of customers impacted by faults in the first half of
36
2018/19 was significantly higher than the same period last year, explaining the negative impact on performance.
Network performance across both SSEN’s networks was also impacted by last year’s cold snap as a result of residual damage to SSEN’s underground network infrastructure caused by the ‘beast from the east’ which resulted in a number of faults in the six months to 30 September 2018.
SSEN is targeting improvements in this area through a continuous programme of investment in the network. This includes the refurbishment and reinforcement of assets; upgrades to automation which reduces the number of customers affected and the duration of faults; minimise the impact of tree related damage; as well as investments in new innovative technologies.
Responding to the needs of customers and stakeholders
SSEN continues to place its customers and stakeholders at the heart of its decision making, and in the six months to 30 September 2018 implemented a number of changes to its customer services operations as it continues to improve the experience for its customers and respond to the incentive-based framework. This includes a programme of digital communications, extending the reach of its social media activity and promoting alternative forms of customer contact.
SSEN also relaunched its award winning Power Track app, which now includes a number of new features including the ability for customers to report faults directly and send SSEN images of potential damage to SSEN’s infrastructure. These new additions will help improve SSEN’s response time to faults, helping restore power to customers affected far quicker and safer than before, which in turn should positively influence future IIS performance and the opportunity to earn incentive revenue.
SSEN’s internal and external inclusive service panels are now well established providing regular scrutiny and challenge to ensure SSEN meets its ambitions to be a leading provider of customer service recognised across a range of sectors, committed to provide an inclusive and accessible service for all its customers. In August 2018, SSEN extended is online customer service by adding specialist accessibility and language software to its website.
Placing customers at the forefront of connections policy
In October 2018, Ofgem announced its decision not to penalise SSEN under the penalty only Incentive on Connections Engagement (ICE). This is the third consecutive year SSEN has avoided a penalty since its introduction at the beginning of the RIIO-ED1 Price Control period, demonstrating SSEN’s commitment to ensure its connections customers and stakeholders continue to play a pivotal role in informing and influencing SSEN’s connections activities, engagements and policies.
Delivering a major programme of capital investment
SSEN continues to undertake a major capital investment delivery programme across both its distribution licenced networks which will deliver significant improvements for its customers and provide the infrastructure required to support economic development, as well as contributing to sustained and fair returns and increased RAV.
In the six months to 30 September 2018, SSEN invested a total of £163.5m in its electricity distribution networks, bringing the total invested since the beginning of the ED1 Price Control to over £1bn – which is part of a forecast investment of £2.4bn throughout the RIIO-ED1 period.
In the north of Scotland SSEN continues to take forward a major rolling programme of investment to replace the existing subsea cables which have successfully and safely served the Scottish islands for many decades, maintaining network reliability for Scotland’s island communities. In the six months to 30 September 2018, SSEN has successfully replaced a number of cables serving the Orkney Islands and is actively taking forward a number of other cable replacements across the north of Scotland. This is separate to the island connections proposals being developed by SSEN’s Transmission business.
37
Following a change in Marine Planning Policy, the costs associated with the ongoing maintenance and replacement of SSEN’s subsea cable assets have increased and SSEN is currently preparing to submit a ‘reopener’ to Ofgem in early 2019 for the additional funding required to support its subsea cable replacement programme. Subject to regulatory approval, the responsible and evidenced based approach SSEN has adopted to inform its subsea cable replacement programme will deliver RAV growth, whilst minimising the cost impact to its customers.
Delivering regulatory outputs through efficiency
Transformational change will play a key role in the development and improvement of the service provided to SSEN’s customers. In August 2018, SSEN entered into a partnership with Williams Advanced Engineering to design a functional specification for the first live overhead line inspection robot to be used on SSEN’s high voltage electricity networks, as part of an Ofgem-funded project. The innovative trial will help minimise potential disruption to SSEN’s customers, maximise operational efficiencies and provide up-to-date asset and safety data to help inform SSEN’s ongoing maintenance and replacement programme.
SSEN is also working in collaboration with UK Power Networks on another Ofgem funded innovation project which seeks to develop new Artificial Intelligence (AI) technology designed to help predict and prevent power cuts before they happen. ‘Project Synaps’ will be the first time that leading-edge AI technology and ‘big data’ have been used to improve network reliability, and it will enable engineers to use a library of network data, in conjunction with artificial intelligence, to predict and locate a potential fault on network equipment before it occurs. It is predicted the trial could half the number of faults on low voltage networks and if successful, could be installed across electricity networks from 2020.
Maintaining leadership in innovation
Distributed generation, electric vehicles, demand-side response and energy storage are transforming the energy system and giving customers access to new products and services from a new range of providers. Electricity distribution network companies will play a pivotal role in this revolution which will increase the investment needed in both network assets and in the systems needed to support smart and flexible solutions across networks, creating new opportunities in managing this demand.
In October 2018, Ofgem set out the steps companies are taking as part of the transition to DSOs, including the need for appropriate structures to be in place to manage this transition. SSEN is already in the process of making the necessary structural changes to its operational model which will ensure the transition to DSO is transparent, with clear lines of accountability and responsibility across its distribution networks business.
As SSEN continues the transition to a Distribution System Operator it continues to trial new technologies and alternative network solutions to deliver a smart, flexible low carbon energy system.
In September 2018, Ofgem confirmed its final funding decision for SSEN’s Project Transition, which will replicate and trial one of the elements of one of the proposed DSO models being explored by the industry. The final approved funding of £11m will deliver one of the market models being considered by the Open Networks Project.
In April 2018, SSEN announced that it has entered into a partnership with leading software company, Open Utility, to learn from and participate in its revolutionary smart grid platform, Piclo, which helps Distribution System Operators (DSOs) procure flexible capacity from technologies such as batteries and demand-response aggregators and energy efficiency initiatives to meet the needs of local electricity users.
SSEN remains committed to collaborating across the industry to help ensure there is a coordinated and consistent transition to a DSO and continues to play a leading role in the influential Open Networks project, led by the Energy Networks Association, supported by comprehensive stakeholder engagement.
38
Delivering a smooth transition to low carbon transport
SSEN continues to actively support the growth in electric vehicles (EV) which is forecast to accelerate in the coming years in response to ambitious targets set by both the UK and Scottish Governments to phase out petrol and diesel vehicles by 2040 and 2032 respectively.
In September 2018, SSEN’s ‘My Electric Avenue’ was recognised for its leading contribution to understanding and managing the impact of EV growth on electricity networks with Ofgem awarding SSEN a discretionary reward of £300,000 from its Low Carbon Networks Fund, the only GB DNO to receive a discretionary award. Learnings from the project and have helped inform UK Government legislation to mandate that all EV chargers in Britain are smart, enabling distribution network operators (DNOs) to safeguard, maintain and develop smarter networks to cope with the increase in EVs in the future.
Fulfilling its responsibilities to meet Shetland’s future energy needs
Following Ofgem’s decision to reject the Shetland New Energy Solution (SNES) in November last year, SSEN is currently exploring further options to ensure long term security of supply on Shetland at the most economical cost.
This includes an assessment of whether a whole system solution, utilising the proposed transmission link, represents the best value option for Shetland and GB consumers compared with alternative options, which was one of the factors that led to Ofgem rejecting SSEN’s previous SNES proposal.
Upon completion of this work, SSEN expects to submit its recommendation to Ofgem on its assessment of the options to meet Shetland’s future energy needs before the end of the current financial year.
SGN
Covering Scotland and the south of England, SGN is the gas network company distributing natural and green gas to 5.9 million homes and businesses through a network of 74,000 mains and services. Good progress is continuing to be made building a third distribution network in the west of Northern Ireland comprising some 700km of new gas pipelines which will allow up to 40,000 customers to connect for the first time to mains natural gas. SGN now has 35 biomethane plants connected to its GB networks, supplying enough green gas for the needs of almost 175,000 homes. This is good progress towards achieving SGN’s ambition of supplying 250,000 customers with green gas.
As the current RIIO-GD1 eight-year Price Control moves closer to its 2021 conclusion, SGN’s first priority is to ensure all its operations are run safely for the public at large, customers, contractors and employees. It continues to be focused on the delivery of all its outputs under this RIIO framework as well as maximising the regulatory incentives. Key priorities in operations include meeting its 97% emergency response targets and achieving gas mains replacement targets (844km across both networks for 2018/19). Complementing this, the customer experience transformation programme is continuing to deliver enhanced customer experience, drawing on digital technology and reducing the costs associated with providing good service to customers.
Networks businesses – Priorities
The priorities for SSE’s Networks businesses for the remainder of the 2018/19 financial year, in addition to their first goal of safe working, are to:
• provide leading customer service, delivering required outputs and maintaining efficient controls over expenditure;
• complete the commissioning and energisation of the new Caithness-Moray link;
• maintain good progress in the development and delivery of new assets;

39
• progress innovations that will improve network reliability, efficiency and customer service and inform industry-wide improvements to support the transition to a smart, flexible energy system;
• continue to adapt and prepare for the evolution of the regulatory framework for future Price Control, RIIO-2, including maintaining effective stakeholder relationships.
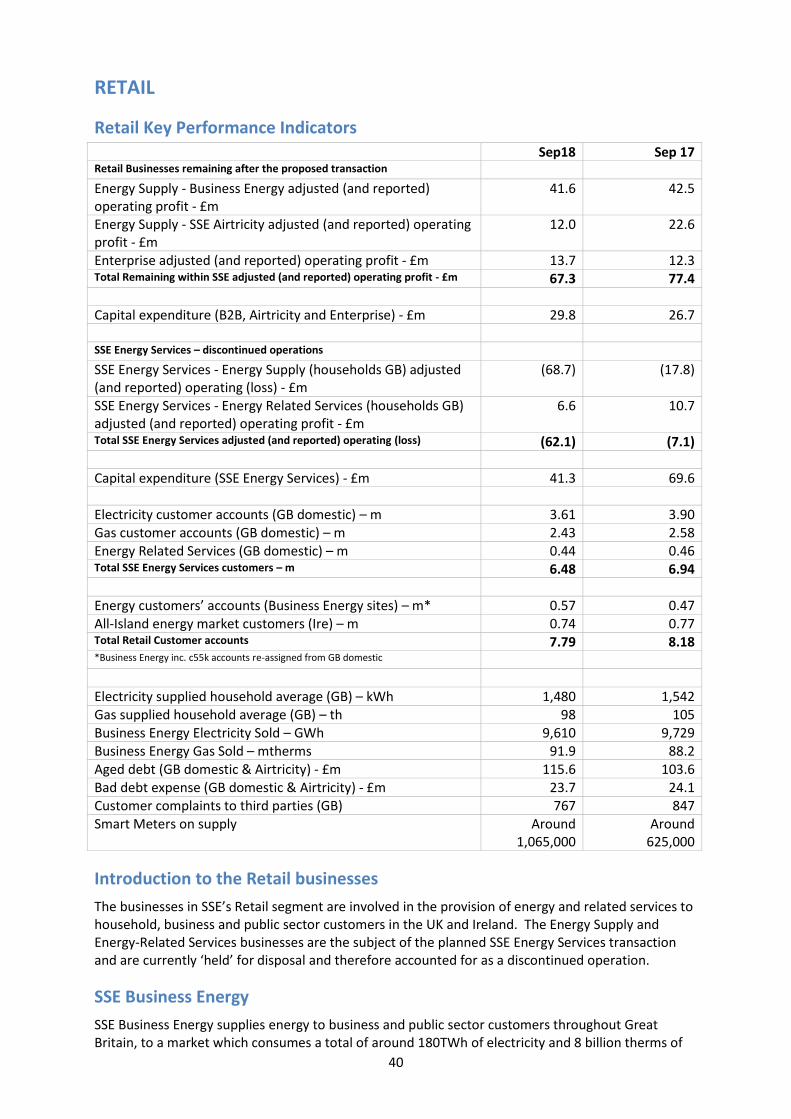
40
RETAIL
Retail Key Performance Indicators Sep18 Sep 17 Retail Businesses remaining after the proposed transaction Energy Supply - Business Energy adjusted (and reported) operating profit - £m
41.6 42.5
Energy Supply - SSE Airtricity adjusted (and reported) operating profit - £m
12.0 22.6
Enterprise adjusted (and reported) operating profit - £m 13.7 12.3 Total Remaining within SSE adjusted (and reported) operating profit - £m 67.3 77.4 Capital expenditure (B2B, Airtricity and Enterprise) - £m 29.8 26.7 SSE Energy Services – discontinued operations SSE Energy Services - Energy Supply (households GB) adjusted (and reported) operating (loss) - £m
(68.7) (17.8)
SSE Energy Services - Energy Related Services (households GB) adjusted (and reported) operating profit - £m
6.6 10.7
Total SSE Energy Services adjusted (and reported) operating (loss) (62.1) (7.1) Capital expenditure (SSE Energy Services) - £m 41.3 69.6 Electricity customer accounts (GB domestic) – m 3.61 3.90 Gas customer accounts (GB domestic) – m 2.43 2.58 Energy Related Services (GB domestic) – m 0.44 0.46 Total SSE Energy Services customers – m 6.48 6.94 Energy customers’ accounts (Business Energy sites) – m* 0.57 0.47 All-Island energy market customers (Ire) – m 0.74 0.77 Total Retail Customer accounts 7.79 8.18 *Business Energy inc. c55k accounts re-assigned from GB domestic Electricity supplied household average (GB) – kWh 1,480 1,542 Gas supplied household average (GB) – th 98 105 Business Energy Electricity Sold – GWh 9,610 9,729 Business Energy Gas Sold – mtherms 91.9 88.2 Aged debt (GB domestic & Airtricity) - £m 115.6 103.6 Bad debt expense (GB domestic & Airtricity) - £m 23.7 24.1 Customer complaints to third parties (GB) 767 847 Smart Meters on supply Around
1,065,000 Around
625,000
Introduction to the Retail businesses
The businesses in SSE’s Retail segment are involved in the provision of energy and related services to household, business and public sector customers in the UK and Ireland. The Energy Supply and Energy-Related Services businesses are the subject of the planned SSE Energy Services transaction and are currently ‘held’ for disposal and therefore accounted for as a discontinued operation.
SSE Business Energy
SSE Business Energy supplies energy to business and public sector customers throughout Great Britain, to a market which consumes a total of around 180TWh of electricity and 8 billion therms of
41
gas annually. It complements SSE’s interests in renewables and flexible thermal generation, providing a route to markets for electricity output through standard contracts and power purchase agreements.
In the six months to 30 September 2018, SSE Business Energy performed well across all customer segments. Its strong position is built on solid core competencies in meeting business customers’ energy needs. SSE Business Energy was once again recognised for its customer service commitment, ranking highly in the Citizens Advice league table that scores non-domestic energy providers on how well they handle customer complaints.
SSE Business Energy continues to focus on its core market segments, whilst broadening into related services such as energy optimisation and demand side response where there is an opportunity to use data and technology to improve outcomes for customers. In September 2018, SSE Business Energy launched a ‘Virtual Power Plant’ service, offering real-time, flexible energy management services through Origami Energy’s technology platform, to help customers unlock the value of the flexibility in their dispatchable generation, battery storage and demand side response.
SSE Business Energy continues to focus on its core market segments, whilst broadening into related services such as energy optimisation and demand side response where there is an opportunity to use data and technology to improve outcomes for customers. In September 2018, SSE Business Energy launched a ‘Virtual Power Plant’ service, offering real-time, flexible energy management services through Origami Energy’s technology platform, to help customers unlock the value of the flexibility in their dispatchable generation, battery storage and demand side response.
SSE Enterprise
SSE Enterprise is a group of businesses that delivers energy and telecoms services to the private and public sector in the UK. It currently has five business areas: Contracting, Rail, Utilities, Energy Solutions and Telecoms. It maintains a strong focus on improving efficiency and delivering growth in its core markets.
Telecoms
SSE Enterprise continues to grow its network and customer base following the unbundling of a further 177 BT exchanges as well as the decision to partner Three UK and O2 to jointly invest in a London network to enhance 4G services and enable 5G services. It has also struck a partnership with Sky, giving customers more choice for last-mile providers and positioning them as the service provider of choice.
The business is also delivering innovation solutions, such as the work under way to lay fibre optic cables in London’s waste water system – thanks to an innovative partnership between SSE Enterprise Telecoms and Thames Water. SSE ended its participation in the National Broadband Plan process in Ireland during the summer.
Energy
Innovative technologies are also changing the energy requirements of organisations. With a rich energy heritage, Enterprise will seek opportunities in emerging markets such as electric vehicles. For example, Enterprise has now installed 782 charge points for electric vehicles across London and delivered infrastructure for electric bus charging at Waterloo bus station.
In addition to EV charging solutions, SSE Enterprise Utilities aims to be a leader in multi-utility infrastructure and distributed energy networks. The business is well placed to develop propositions in the dynamic marketplace of distributed energy. Slough Heat and Power continues to be focused on the growth of its private electricity, steam and water networks.
SSE Enterprise Energy Solutions helps organisations use their energy more effectively. It will seek alignment opportunities within Enterprise - most especially with the Utilities division. It now has over 100,000-meter points in its energy visualisation platform Business Energy Intelligence (BEI).
42
SSE Airtricity
SSE's retail arm in Ireland, SSE Airtricity, is the only retail energy brand that operates in each of the competitive gas and electricity markets across the island. There continues to be advantage in energy groups in Ireland combining power production and energy supply to households and businesses. This is exemplified by Generation Green, a campaign which brings together SSE Airtricity’s heritage in renewable energy with a customer proposition based on using 100% green energy.
At 30 September 2018, SSE Airtricity supplied electricity and natural gas to 0.7 million household and business customer accounts in the Republic of Ireland (ROI) and Northern Ireland (NI), making it the second-largest provider of energy and related services in the combined market.
SSE Energy Services (Held for disposal)
SSE Energy Services remains one of the largest suppliers operating in the household energy market in Great Britain. It comprises SSE’s domestic energy supply and energy-related services businesses in Great Britain. It is the subject of the planned transaction with innogy SE’s subsidiary, npower to create a new, independent energy supplier. On 10 October 2018, the CMA announced the final results of its investigation stating that the transaction posed no threat to competition.
Preparing for the combination of SSE Energy Services and npower and listing of the new company is a complex process, which is required to be undertaken in line with the rules and obligations governing such matters and in a way that is consistent with the fact the two companies continue to compete in the market. The Default Tariff cap including the methodology and input data underpinning it, and the process for future adjustments, is similarly complex, with the final decisions only being announced in early November. The period for appeals to the CMA’s approval of the proposed transaction also did not conclude until November.
SSE and innogy SE have entered into discussions and are working together regarding potential changes to the commercial terms of the planned transaction. These discussions are expected to take place over several weeks and an update on their progress will be provided as soon as possible and by mid-December. It is likely that a completion of the proposed combination will be delayed beyond Q1 2019, but all work to seek to achieve the formation and listing of the new company will continue.
Delivering on SSE Energy Services’ strategic priorities
In its full-year results statement for 2017/18, SSE set out four key strategic priorities for SSE Energy Services. It also identified digitalising the business and the way in which it serves customers as a key enabler to each of these objectives.
Attracting and retaining more customers: The market for energy and related services in Great Britain remains intensely competitive, with over 70 suppliers competing for customers and around 3 million customers switching their electricity provider in the six months to 30 September according to Energy UK statistics. Although SSE Energy Services regrettably had to implement an average 6.7% dual fuel price increase in July 2018, SSE works hard to price as competitively as possible and is one of the only major suppliers not to have increased prices twice in 2018, despite a significant and sustained increase in wholesale energy prices. Against such a competitive backdrop, to attract and retain customers more effectively suppliers must find new and innovative ways to offer value to customers beyond simply price. With that in mind, SSE has continued to develop new and innovative propositions, with a new range launched to market in August. Since their launch, around 40 percent of new tariff sign-ups have been to these value-based propositions, rather than simply the cheapest priced energy tariff on offer.
Reducing operating costs
Efforts to reduce operating costs are increasingly pressing given the imposition of the default tariff cap by Ofgem, which will come into force on 1 January 2019. SSE supports the development of a healthy, well-functioning competitive market and continues to believe the competition described
43
above, not caps, best serves the long-term interests of customers. The level at which the cap has been set is disappointing and is not, in SSE’s view, sustainable or cost-reflective. It is clear from its statutory consultation that Ofgem expects all suppliers should be able to achieve lower-quartile operating costs, which will be strongly influenced by new entrants with a number of cost advantages and therefore presents more established suppliers with a significant challenge. Against this backdrop of planned price controls and fierce competition, SSE continues to work hard to minimise its controllable costs and become as efficient as possible. In the six months to 30 September 2018 it delivered further recurring cost savings through initiatives to increase efficiency. Over the coming months, while making the necessary preparations for implementation of the price cap, SSE will continue to seek ways to drive out costs while maintaining a focus on delivering the right outcomes for customers, including enhanced deployment of digital services for customers.
Delivering the smart meter roll-out in a safe, cost-effective and customer-centric way
SSE believes strongly in the potential for smart meters to transform its relationship with customers and is focused on delivering its obligation to roll out smart meters in a way which is safe, minimises the costs and maximises the benefits for customers. In the six months to 30 September 2018, SSE reached a significant milestone and has well over one million smart meters on supply. During the same period, SSE began rolling out small volumes of the enduring SMETS2 meters ahead of a full transition from SMETS1 to SMETS2 in 2019. In line with its ambition, SSE continues to perform well compared to industry benchmarks on safety, customer satisfaction, electronic billing and energy efficiency advice, according to the BEIS quarterly benchmarking report. While progress has been good, the programme continues to face issues in the form of outstanding technical constraints on meter functionality and central system infrastructure. The key challenge, however, is around driving customer demand for smart meters. SSE has introduced exclusive offers for customers taking a smart meter and SSE continues to support the work of Smart Energy GB to raise awareness and interest in smart meters more generally.
Building on SSE’s customer-centric culture
SSE recognises that energy is an essential service and it therefore has a unique responsibility to look after its customers. It is committed to building on its customer-centric culture by putting customers at the heart of its decision-making and, with this in mind, has established Customer Forums to understand customers’ views on topics including smart, vulnerability, affordability, electric heating, and the proposed merger with npower. SSE continues to perform well in key external benchmarking surveys and remains consistently among the best performers in the Citizens Advice energy supplier performance rankings, which assess suppliers on service provision across five different categories. In Ofgem’s biyearly complaint handling report, published in September 2018, SSE also performed best of all suppliers assessed for the proportion of complaints resolved and customer satisfaction with how their complaint was handled. As part of further efforts to improve online services for customers, a simplified online account setup process has seen conversion increase from less than 50% to over 80%. As reflected in its achievement of the British Standard for Inclusive Service Provision, SSE recognises that any customer can be vulnerable at different times and that this will require it to be adaptable and flexible in how it meets customers’ needs.
Retail businesses – Priorities
The priorities for SSE’s Retail businesses for the remainder of the 2018/19 financial year, in addition to their first goal of safe working, are to:
• continue the preparations to form and list the new company combining SSE Energy Services and npower;
• maintain high standards of service for all customers;
• continue the development of Business Energy, complementing other businesses in the SSE group;
• take forward opportunities to create value in SSE Enterprise businesses; and

44
• enhance SSE Enterprise’s capability in developing larger projects, which give longer-term visibility of earnings.
45
Alternative Performance Measures
When assessing, discussing and measuring the Group’s financial performance, management refer to measures used for internal performance management. These measures are not defined or specified under International Financial Reporting Standards (IFRS) and as such are considered to be Alternative Performance Measures (“APMs”). By their nature, APMs are not uniformly applied by all preparers including other participants in the Group’s industry. Accordingly, APMs used by the Group may not be comparable to other companies within the Group’s industry.
Purpose
APMs are used by management to aid comparison and assess historical performance against internal performance benchmarks and across reporting periods. These measures provide an ongoing and consistent basis to assess performance by excluding items that are materially non-recurring, uncontrollable or exceptional. These measures can be classified in terms of their key financial characteristics:
• Profit measures allow management to assess and benchmark underlying business performance during the year. They are primarily used by operational management to measure operating profit contribution and are also used by the Board to assess performance against business plan.
• Capital measures allow management to track and assess the progress of the Group’s significant ongoing investment in capital assets and projects against their investment cases, including the expected timing of their operational deployment.
• Debt measures allow management to record and monitor both operating cash generation and the Group’s ongoing financing and liquidity position.
The following table explains the key APMs applied by the Group and referred to in these statements:
Group APM Purpose
Closest equivalent IFRS measure Adjustments to reconcile to primary financial statements
Adjusted EBITDA (earnings before interest, tax, depreciation and amortisation)
Profit measure
Operating profit • Movement on operating and financing derivatives (‘certain re-measurements’)
• Exceptional items
• Share of joint ventures and associates’ interest and tax
• Depreciation and amortisation before exceptional charges
• Share of joint venture and associates’ depreciation and amortisation
• Release of deferred income
Adjusted operating profit
Profit measure
Operating profit • Movement on operating and financing derivatives (‘certain re-measurements’)
• Exceptional items
• Share of joint ventures and associates’ interest and tax
Adjusted profit before tax
Profit measure
Profit before tax • Movement on operating and financing derivatives (‘certain re-measurements’)
• Exceptional items
• Interest on net pension assets/liabilities (IAS 19R)
• Share of joint ventures and associates’ tax
Adjusted net finance costs
Profit measure
Net finance costs • Movement on financing derivatives
• Share of joint ventures and associates’ interest
• Interest on net pension assets/liabilities (IAS 19R)
Adjusted current tax charge
Profit measure
Tax charge • Share of joint ventures and associates’ tax
• Deferred tax including share of joint ventures and associates
• Tax on exceptional items and certain re-measurements
• Reclassification of tax liabilities
Adjusted earnings per share
Profit measure
Earnings per share
• Exceptional items
• Movements on operating and financing derivatives (‘certain re-measurements’)
• Interest on net pension assets/liabilities (IAS 19R)
• Deferred tax including share of joint ventures and associates
Adjusted net debt and hybrid capital
Debt measure Unadjusted net debt
• Hybrid equity
• Outstanding liquid funds
• Finance leases
• Cash presented as held for disposal
46
Investment and capital expenditure (adjusted)
Capital measure
Capital additions to Intangible Assets and Property, Plant and Equipment
• Other expenditure
• Customer funded additions
• Allowances and certificates
• Disposed additions
• Joint ventures and associate additions
Rationale for adjustments
Adjustments to Profit Measure
1 Movement on operating and financing derivatives (‘certain re-measurements’)
This adjustment can be designated between operating and financing derivatives.
Operating derivatives are contracts where the Group’s Energy Portfolio Management function enters into forward commitments or options to buy or sell electricity, gas and other commodities to meet the future demand requirements of the Group’s domestic and business energy supply operating units, or to optimise the value of its Wholesale assets. Certain of these contracts are determined to be derivative financial instruments under IFRS 9 and as such are required to be recorded at their fair value. Changes in the fair value of those commodity contracts designated as IFRS 9 financial instruments are reflected in the income statement (as part of ‘certain re-measurements’). These are not considered revenue as there has been no sale and therefore are considered to be cost of sales. The Group shows the change in the fair value of these forward contracts separately as this mark-to-market movement is not relevant to the underlying performance of its operating segments due to the volatility that can arise on revaluation. The Group will recognise the contracted rate in revenue when the underlying commodity is delivered, which will predominantly be within the subsequent 12 to 30 months. Conversely, commodity contracts that are not financial instruments under IFRS 9 are accounted for as ‘own use’ contracts and are consequently not recorded until the commodity is delivered and the contract is settled.
Financing derivatives include all fair value and cash flow interest rate hedges, non-hedge accounted (mark-to-market) interest rate derivatives, cash flow foreign exchange hedges and non-hedge accounted foreign exchange contracts entered into by the Group to manage its banking and liquidity requirements as well as risk management relating to interest rate and foreign exchange exposures. Changes in the fair value of those financing derivatives are reflected in the income statement (as part of ‘certain re-measurements’). The Group shows the change in the fair value of these forward contracts separately as this mark-to-market movement is not relevant to the underlying performance of its operating segments.
The re-measurements arising from operating and financing derivatives, and the tax effects thereof, are disclosed separately to aid understanding of the underlying performance of the Group.
2 Exceptional Items
Exceptional charges or credits, and the tax effects thereof, are considered unusual by nature or scale and of such significance that separate disclosure is required for the underlying performance of the Group to be properly understood. Further explanation for the classification of an item as exceptional is included in Note 2 (iii).
3 Share of joint ventures and associates’ interest and tax
This adjustment can be split between the Group’s share of interest and the Group’s share of tax arising from its investments in equity accounted joint ventures and associates.
The Group is required to report profit before interest and tax (‘operating profit’) including its share of the profit after tax of its equity accounted joint ventures and associates. However, for internal performance management purposes and for consistency of treatment, SSE reports its adjusted profit measures before its share of the interest and/or tax on joint ventures and associates.
4 Interest on net pension assets/liabilities (IAS 19R)
The Group’s interest charges relating to defined benefit pension schemes are derived from the net assets/liabilities of the schemes as valued under IAS 19R. This will mean that the charge recognised in any given year will be dependent on the impact of actuarial assumptions such as inflation and discount rates. To avoid income statement volatility derived from this basis of measurement and reflecting the non-cash nature of these charges, the Group excludes these from its adjusted profit measures.
5 Deferred tax
The Group adjusts for deferred tax when arriving at adjusted profit after tax, adjusted earnings per share and its adjusted effective rate of tax. Deferred tax arises as a result of differences in accounting and tax bases that give rise to potential future accounting credits or charges. As the Group remains committed to its ongoing capital programme, the liabilities associated are not expected to reverse and accordingly the Group excludes these from its adjusted profit measures. The 31 March 2018 ‘adjusted current tax’ APM was presented net of a reclassification adjustment, from current to deferred tax, in respect of liabilities related to historic open tax positions.
Adjustments to Debt measure
6 Hybrid capital
The characteristics of certain hybrid capital securities mean they qualify for recognition as equity rather than debt under IFRS. Consequently, their coupon payments are presented within dividends rather than within finance costs. As a result, the coupon payments are not included in SSE’s adjusted profit before tax measure. In order to present total funding provided from sources other than ordinary shareholders, SSE presents its adjusted net debt measure inclusive of hybrid capital to better reflect the Group’s funding position.
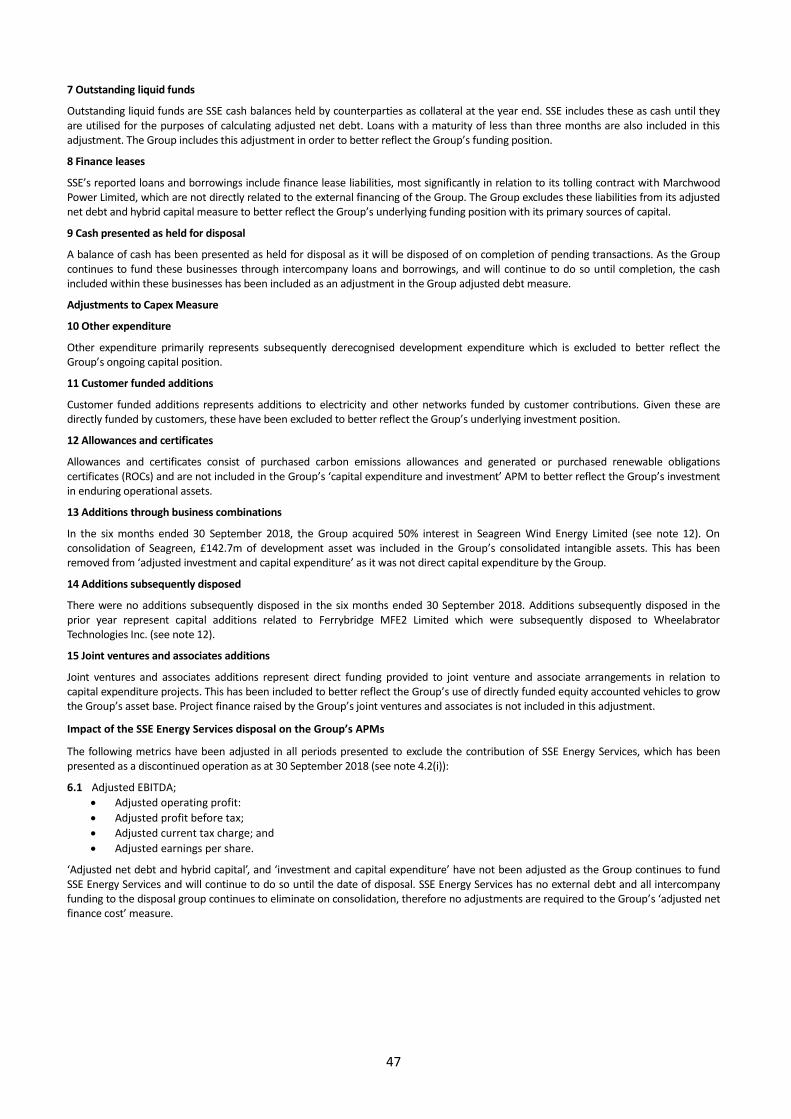
47
7 Outstanding liquid funds
Outstanding liquid funds are SSE cash balances held by counterparties as collateral at the year end. SSE includes these as cash until they are utilised for the purposes of calculating adjusted net debt. Loans with a maturity of less than three months are also included in this adjustment. The Group includes this adjustment in order to better reflect the Group’s funding position.
8 Finance leases
SSE’s reported loans and borrowings include finance lease liabilities, most significantly in relation to its tolling contract with Marchwood Power Limited, which are not directly related to the external financing of the Group. The Group excludes these liabilities from its adjusted net debt and hybrid capital measure to better reflect the Group’s underlying funding position with its primary sources of capital.
9 Cash presented as held for disposal
A balance of cash has been presented as held for disposal as it will be disposed of on completion of pending transactions. As the Group continues to fund these businesses through intercompany loans and borrowings, and will continue to do so until completion, the cash included within these businesses has been included as an adjustment in the Group adjusted debt measure.
Adjustments to Capex Measure
10 Other expenditure
Other expenditure primarily represents subsequently derecognised development expenditure which is excluded to better reflect the Group’s ongoing capital position.
11 Customer funded additions
Customer funded additions represents additions to electricity and other networks funded by customer contributions. Given these are directly funded by customers, these have been excluded to better reflect the Group’s underlying investment position.
12 Allowances and certificates
Allowances and certificates consist of purchased carbon emissions allowances and generated or purchased renewable obligations certificates (ROCs) and are not included in the Group’s ‘capital expenditure and investment’ APM to better reflect the Group’s investment in enduring operational assets.
13 Additions through business combinations
In the six months ended 30 September 2018, the Group acquired 50% interest in Seagreen Wind Energy Limited (see note 12). On consolidation of Seagreen, £142.7m of development asset was included in the Group’s consolidated intangible assets. This has been removed from ‘adjusted investment and capital expenditure’ as it was not direct capital expenditure by the Group.
14 Additions subsequently disposed
There were no additions subsequently disposed in the six months ended 30 September 2018. Additions subsequently disposed in the prior year represent capital additions related to Ferrybridge MFE2 Limited which were subsequently disposed to Wheelabrator Technologies Inc. (see note 12).
15 Joint ventures and associates additions
Joint ventures and associates additions represent direct funding provided to joint venture and associate arrangements in relation to capital expenditure projects. This has been included to better reflect the Group’s use of directly funded equity accounted vehicles to grow the Group’s asset base. Project finance raised by the Group’s joint ventures and associates is not included in this adjustment.
Impact of the SSE Energy Services disposal on the Group’s APMs
The following metrics have been adjusted in all periods presented to exclude the contribution of SSE Energy Services, which has been presented as a discontinued operation as at 30 September 2018 (see note 4.2(i)):
6.1 Adjusted EBITDA;
• Adjusted operating profit:
• Adjusted profit before tax;
• Adjusted current tax charge; and
• Adjusted earnings per share.
‘Adjusted net debt and hybrid capital’, and ‘investment and capital expenditure’ have not been adjusted as the Group continues to fund SSE Energy Services and will continue to do so until the date of disposal. SSE Energy Services has no external debt and all intercompany funding to the disposal group continues to eliminate on consolidation, therefore no adjustments are required to the Group’s ‘adjusted net finance cost’ measure.
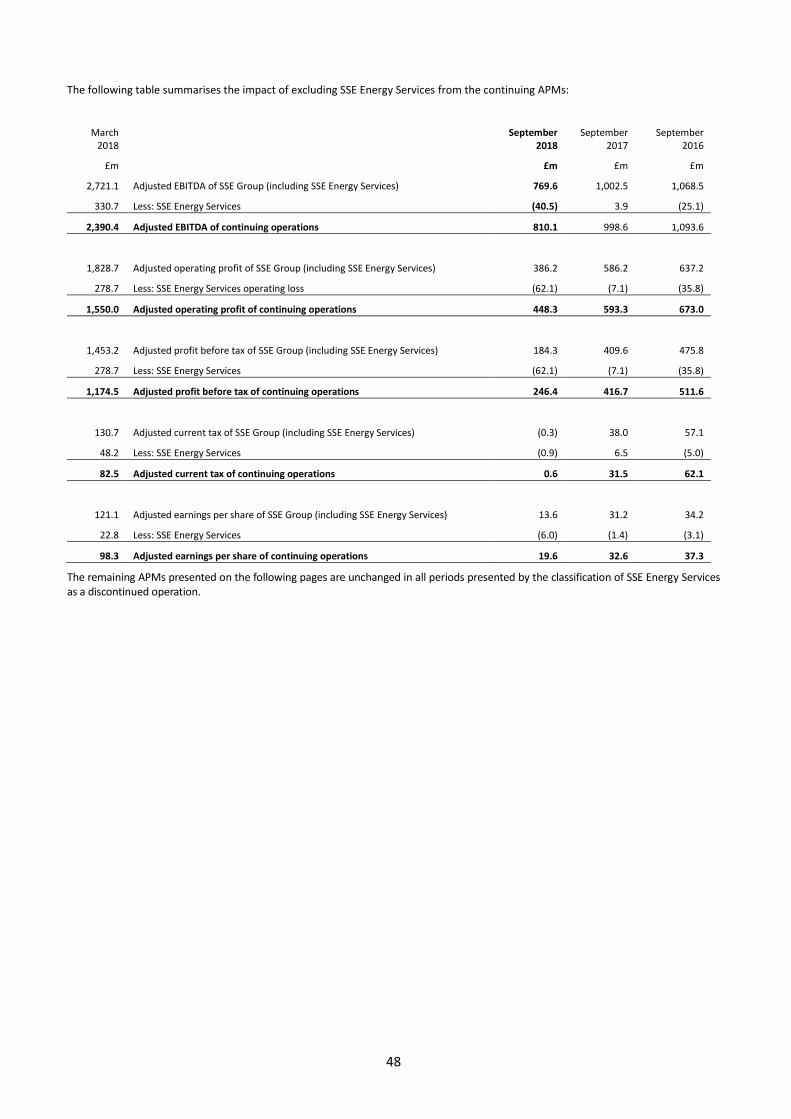
48
The following table summarises the impact of excluding SSE Energy Services from the continuing APMs:
March 2018
September 2018
September 2017
September 2016
£m £m £m £m
2,721.1 Adjusted EBITDA of SSE Group (including SSE Energy Services) 769.6 1,002.5 1,068.5
330.7 Less: SSE Energy Services (40.5) 3.9 (25.1)
2,390.4 Adjusted EBITDA of continuing operations 810.1 998.6 1,093.6
1,828.7 Adjusted operating profit of SSE Group (including SSE Energy Services) 386.2 586.2 637.2
278.7 Less: SSE Energy Services operating loss (62.1) (7.1) (35.8)
1,550.0 Adjusted operating profit of continuing operations 448.3 593.3 673.0
1,453.2 Adjusted profit before tax of SSE Group (including SSE Energy Services) 184.3 409.6 475.8
278.7 Less: SSE Energy Services (62.1) (7.1) (35.8)
1,174.5 Adjusted profit before tax of continuing operations 246.4 416.7 511.6
130.7 Adjusted current tax of SSE Group (including SSE Energy Services) (0.3) 38.0 57.1
48.2 Less: SSE Energy Services (0.9) 6.5 (5.0)
82.5 Adjusted current tax of continuing operations 0.6 31.5 62.1
121.1 Adjusted earnings per share of SSE Group (including SSE Energy Services) 13.6 31.2 34.2
22.8 Less: SSE Energy Services (6.0) (1.4) (3.1)
98.3 Adjusted earnings per share of continuing operations 19.6 32.6 37.3
The remaining APMs presented on the following pages are unchanged in all periods presented by the classification of SSE Energy Services as a discontinued operation.
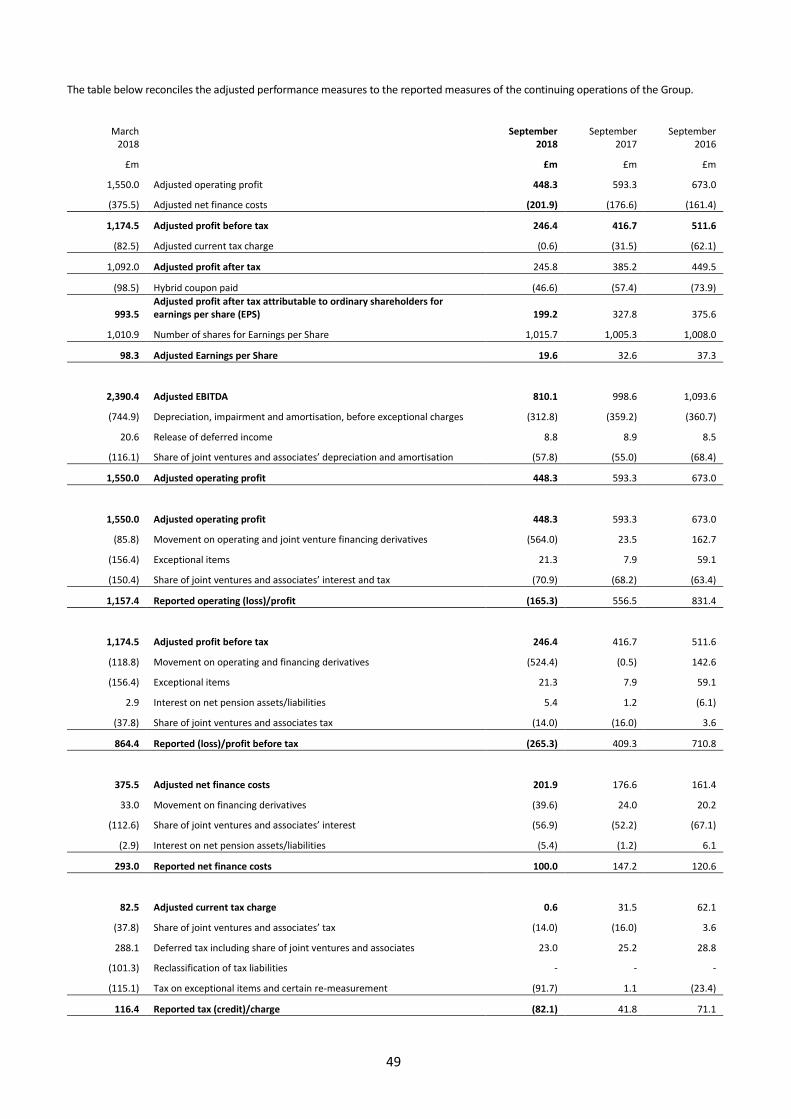
49
The table below reconciles the adjusted performance measures to the reported measures of the continuing operations of the Group.
March 2018
September 2018
September 2017
September 2016
£m £m £m £m
1,550.0 Adjusted operating profit 448.3 593.3 673.0
(375.5) Adjusted net finance costs (201.9) (176.6) (161.4)
1,174.5 Adjusted profit before tax 246.4 416.7 511.6
(82.5) Adjusted current tax charge (0.6) (31.5) (62.1)
1,092.0 Adjusted profit after tax 245.8 385.2 449.5
(98.5) Hybrid coupon paid (46.6) (57.4) (73.9)
993.5 Adjusted profit after tax attributable to ordinary shareholders for earnings per share (EPS) 199.2 327.8 375.6
1,010.9 Number of shares for Earnings per Share 1,015.7 1,005.3 1,008.0
98.3 Adjusted Earnings per Share 19.6 32.6 37.3
2,390.4 Adjusted EBITDA 810.1 998.6 1,093.6
(744.9) Depreciation, impairment and amortisation, before exceptional charges (312.8) (359.2) (360.7)
20.6 Release of deferred income 8.8 8.9 8.5
(116.1) Share of joint ventures and associates’ depreciation and amortisation (57.8) (55.0) (68.4)
1,550.0 Adjusted operating profit 448.3 593.3 673.0
1,550.0 Adjusted operating profit 448.3 593.3 673.0
(85.8) Movement on operating and joint venture financing derivatives (564.0) 23.5 162.7
(156.4) Exceptional items 21.3 7.9 59.1
(150.4) Share of joint ventures and associates’ interest and tax (70.9) (68.2) (63.4)
1,157.4 Reported operating (loss)/profit (165.3) 556.5 831.4
1,174.5 Adjusted profit before tax 246.4 416.7 511.6
(118.8) Movement on operating and financing derivatives (524.4) (0.5) 142.6
(156.4) Exceptional items 21.3 7.9 59.1
2.9 Interest on net pension assets/liabilities 5.4 1.2 (6.1)
(37.8) Share of joint ventures and associates tax (14.0) (16.0) 3.6
864.4 Reported (loss)/profit before tax (265.3) 409.3 710.8
375.5 Adjusted net finance costs 201.9 176.6 161.4
33.0 Movement on financing derivatives (39.6) 24.0 20.2
(112.6) Share of joint ventures and associates’ interest (56.9) (52.2) (67.1)
(2.9) Interest on net pension assets/liabilities (5.4) (1.2) 6.1
293.0 Reported net finance costs 100.0 147.2 120.6
82.5 Adjusted current tax charge 0.6 31.5 62.1
(37.8) Share of joint ventures and associates’ tax (14.0) (16.0) 3.6
288.1 Deferred tax including share of joint ventures and associates 23.0 25.2 28.8
(101.3) Reclassification of tax liabilities - - -
(115.1) Tax on exceptional items and certain re-measurement (91.7) 1.1 (23.4)
116.4 Reported tax (credit)/charge (82.1) 41.8 71.1
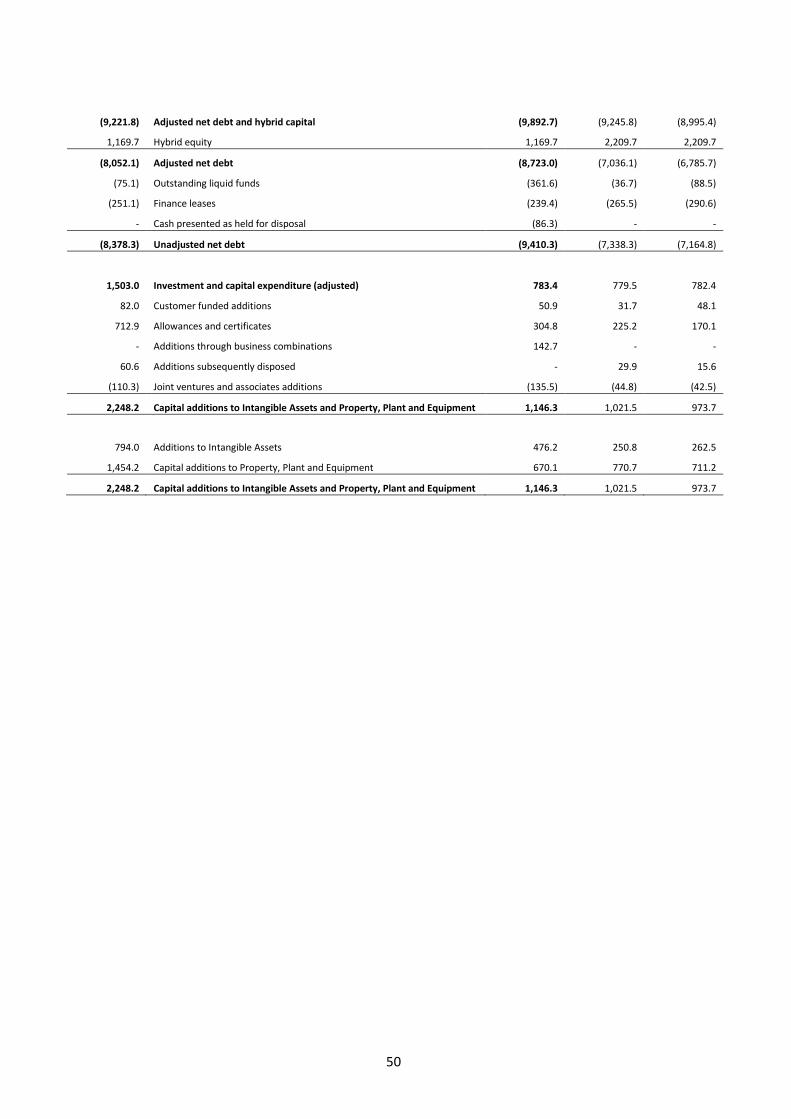
50
(9,221.8) Adjusted net debt and hybrid capital (9,892.7) (9,245.8) (8,995.4)
1,169.7 Hybrid equity 1,169.7 2,209.7 2,209.7
(8,052.1) Adjusted net debt (8,723.0) (7,036.1) (6,785.7)
(75.1) Outstanding liquid funds (361.6) (36.7) (88.5)
(251.1) Finance leases (239.4) (265.5) (290.6)
- Cash presented as held for disposal (86.3) - -
(8,378.3) Unadjusted net debt (9,410.3) (7,338.3) (7,164.8)
1,503.0 Investment and capital expenditure (adjusted) 783.4 779.5 782.4
82.0 Customer funded additions 50.9 31.7 48.1
712.9 Allowances and certificates 304.8 225.2 170.1
- Additions through business combinations 142.7 - -
60.6 Additions subsequently disposed - 29.9 15.6
(110.3) Joint ventures and associates additions (135.5) (44.8) (42.5)
2,248.2 Capital additions to Intangible Assets and Property, Plant and Equipment 1,146.3 1,021.5 973.7
794.0
Additions to Intangible Assets 476.2 250.8 262.5
1,454.2 Capital additions to Property, Plant and Equipment 670.1 770.7 711.2
2,248.2 Capital additions to Intangible Assets and Property, Plant and Equipment 1,146.3 1,021.5 973.7
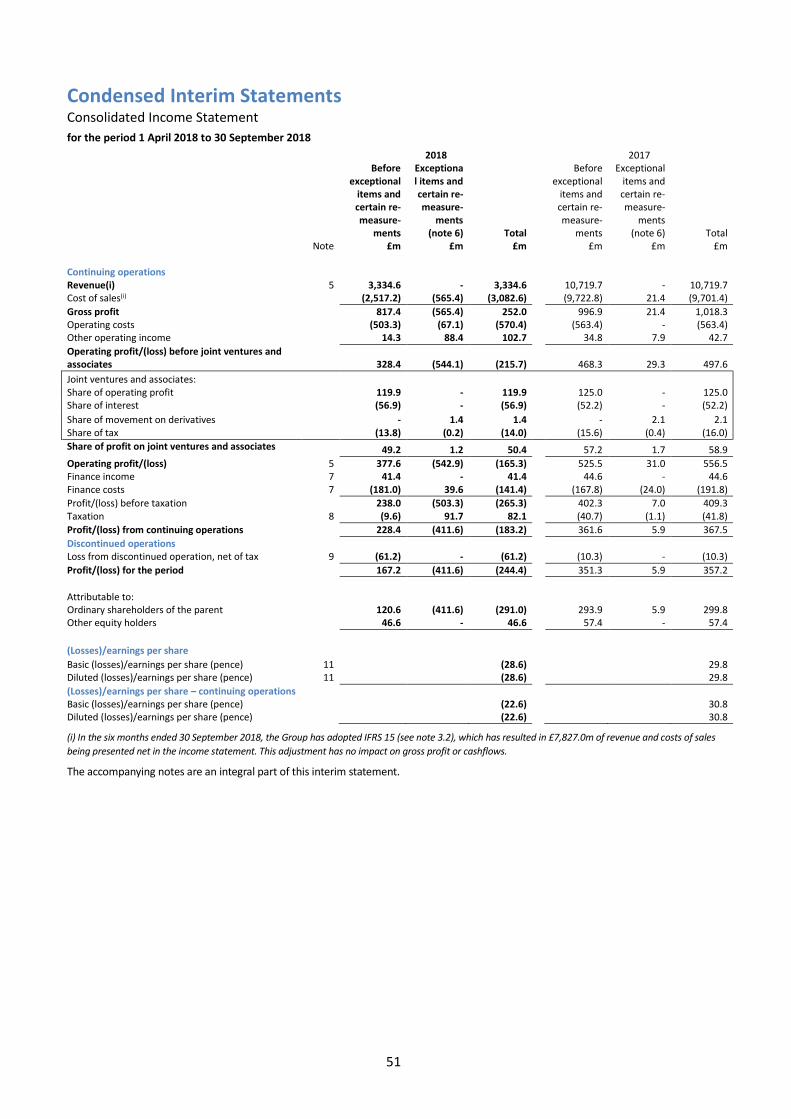
51
Condensed Interim Statements Consolidated Income Statement
for the period 1 April 2018 to 30 September 2018
2018 2017
Before exceptional
items and certain re-measure-
ments
Exceptional items and certain re-measure-
ments (note 6) Total
Before exceptional
items and certain re-measure-
ments
Exceptional items and certain re-measure-
ments (note 6) Total
Note £m £m £m £m £m £m Continuing operations Revenue(i) 5 3,334.6 - 3,334.6 10,719.7 - 10,719.7 Cost of sales(i) (2,517.2) (565.4) (3,082.6) (9,722.8) 21.4 (9,701.4)
Gross profit 817.4 (565.4) 252.0 996.9 21.4 1,018.3 Operating costs (503.3) (67.1) (570.4) (563.4) - (563.4) Other operating income 14.3 88.4 102.7 34.8 7.9 42.7
Operating profit/(loss) before joint ventures and associates 328.4 (544.1) (215.7) 468.3 29.3 497.6
Joint ventures and associates: Share of operating profit 119.9 - 119.9 125.0 - 125.0 Share of interest (56.9) - (56.9) (52.2) - (52.2)
Share of movement on derivatives - 1.4 1.4 - 2.1 2.1 Share of tax (13.8) (0.2) (14.0) (15.6) (0.4) (16.0)
Share of profit on joint ventures and associates 49.2 1.2 50.4 57.2 1.7 58.9
Operating profit/(loss) 5 377.6 (542.9) (165.3) 525.5 31.0 556.5 Finance income 7 41.4 - 41.4 44.6 - 44.6 Finance costs 7 (181.0) 39.6 (141.4) (167.8) (24.0) (191.8)
Profit/(loss) before taxation 238.0 (503.3) (265.3) 402.3 7.0 409.3 Taxation 8 (9.6) 91.7 82.1 (40.7) (1.1) (41.8)
Profit/(loss) from continuing operations 228.4 (411.6) (183.2) 361.6 5.9 367.5
Discontinued operations Loss from discontinued operation, net of tax 9 (61.2) - (61.2) (10.3) - (10.3)
Profit/(loss) for the period 167.2 (411.6) (244.4) 351.3 5.9 357.2
Attributable to: Ordinary shareholders of the parent 120.6 (411.6) (291.0) 293.9 5.9 299.8 Other equity holders 46.6 - 46.6 57.4 - 57.4
(Losses)/earnings per share
Basic (losses)/earnings per share (pence) 11 (28.6) 29.8 Diluted (losses)/earnings per share (pence) 11 (28.6) 29.8
(Losses)/earnings per share – continuing operations Basic (losses)/earnings per share (pence) (22.6) 30.8 Diluted (losses)/earnings per share (pence) (22.6) 30.8
(i) In the six months ended 30 September 2018, the Group has adopted IFRS 15 (see note 3.2), which has resulted in £7,827.0m of revenue and costs of sales
being presented net in the income statement. This adjustment has no impact on gross profit or cashflows.
The accompanying notes are an integral part of this interim statement.
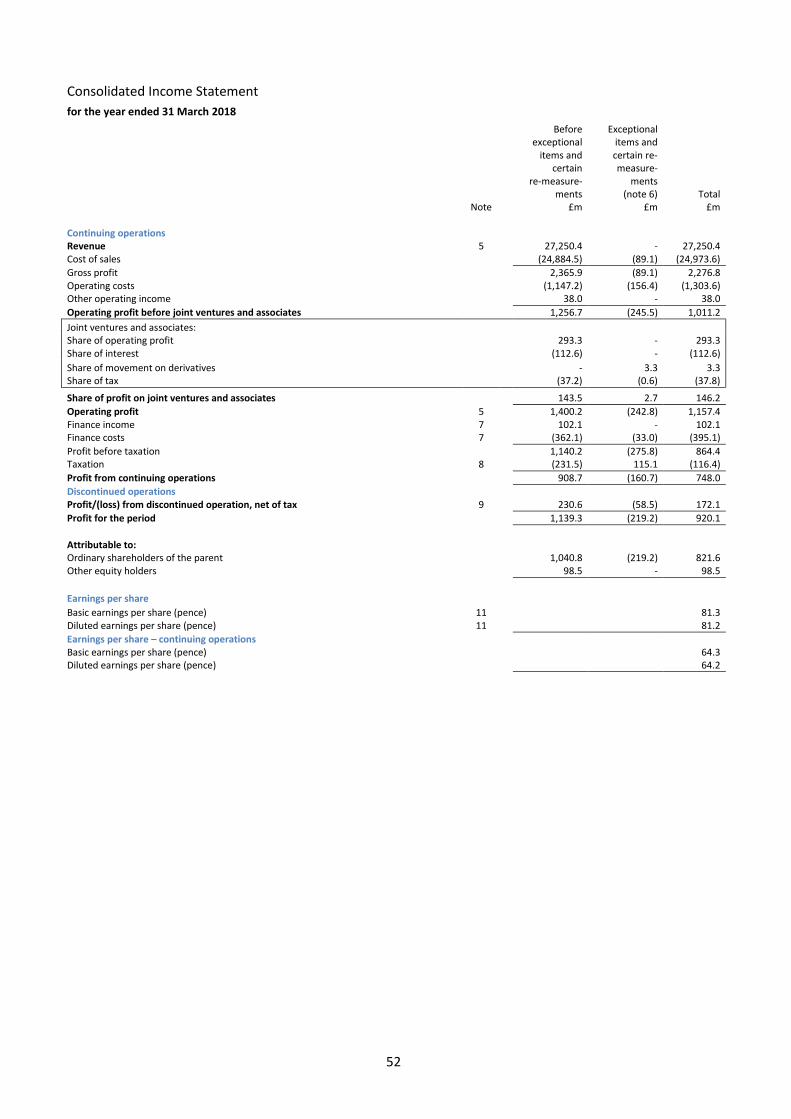
52
Consolidated Income Statement
for the year ended 31 March 2018
Before exceptional
items and certain
re-measure-ments
Exceptional items and certain re-measure-
ments (note 6) Total
Note £m £m £m Continuing operations Revenue 5 27,250.4 - 27,250.4 Cost of sales (24,884.5) (89.1) (24,973.6)
Gross profit 2,365.9 (89.1) 2,276.8 Operating costs (1,147.2) (156.4) (1,303.6) Other operating income 38.0 - 38.0
Operating profit before joint ventures and associates 1,256.7 (245.5) 1,011.2
Joint ventures and associates: Share of operating profit 293.3 - 293.3 Share of interest (112.6) - (112.6)
Share of movement on derivatives - 3.3 3.3 Share of tax (37.2) (0.6) (37.8)
Share of profit on joint ventures and associates 143.5 2.7 146.2
Operating profit 5 1,400.2 (242.8) 1,157.4 Finance income 7 102.1 - 102.1 Finance costs 7 (362.1) (33.0) (395.1)
Profit before taxation 1,140.2 (275.8) 864.4 Taxation 8 (231.5) 115.1 (116.4)
Profit from continuing operations 908.7 (160.7) 748.0
Discontinued operations Profit/(loss) from discontinued operation, net of tax 9 230.6 (58.5) 172.1
Profit for the period 1,139.3 (219.2) 920.1
Attributable to: Ordinary shareholders of the parent 1,040.8 (219.2) 821.6 Other equity holders 98.5 - 98.5
Earnings per share
Basic earnings per share (pence) 11 81.3 Diluted earnings per share (pence) 11 81.2
Earnings per share – continuing operations Basic earnings per share (pence) 64.3 Diluted earnings per share (pence) 64.2
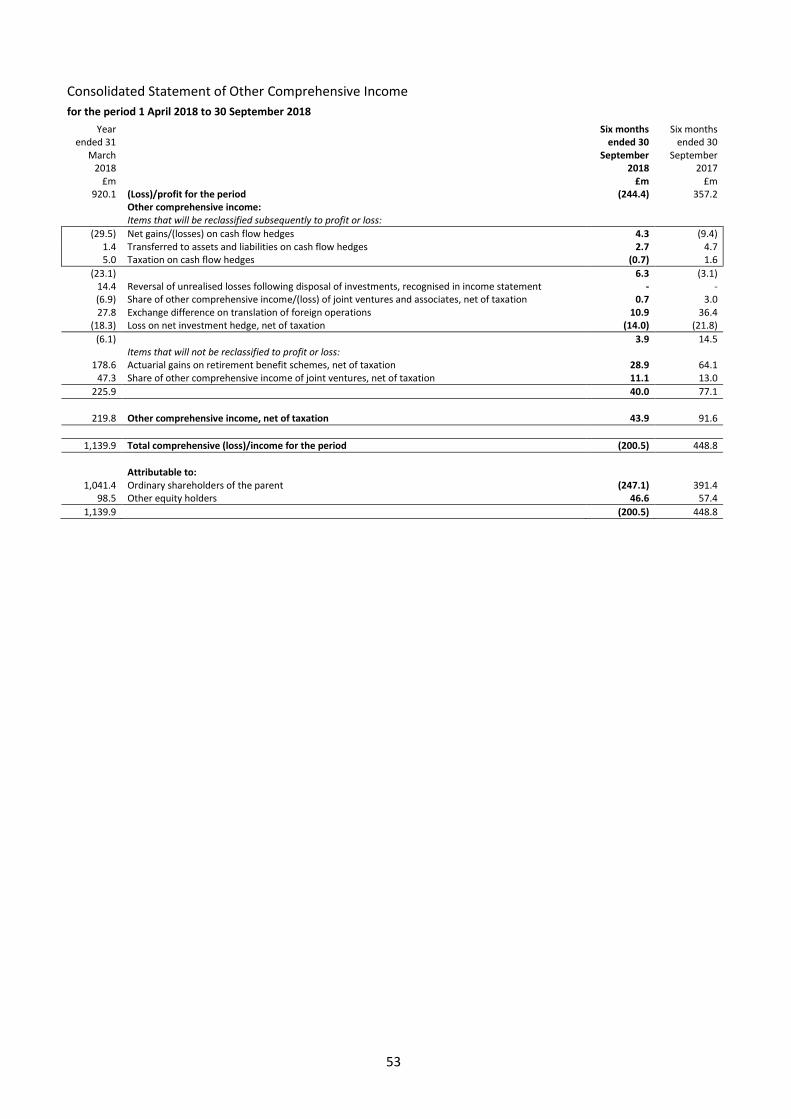
53
Consolidated Statement of Other Comprehensive Income
for the period 1 April 2018 to 30 September 2018
Year ended 31
March 2018
Six months ended 30
September 2018
Six months ended 30
September 2017
£m £m £m 920.1 (Loss)/profit for the period (244.4) 357.2
Other comprehensive income: Items that will be reclassified subsequently to profit or loss:
(29.5) Net gains/(losses) on cash flow hedges 4.3 (9.4) 1.4 Transferred to assets and liabilities on cash flow hedges 2.7 4.7 5.0 Taxation on cash flow hedges (0.7) 1.6
(23.1) 6.3 (3.1) 14.4 Reversal of unrealised losses following disposal of investments, recognised in income statement - - (6.9) Share of other comprehensive income/(loss) of joint ventures and associates, net of taxation 0.7 3.0 27.8 Exchange difference on translation of foreign operations 10.9 36.4
(18.3) Loss on net investment hedge, net of taxation (14.0) (21.8)
(6.1) 3.9 14.5 Items that will not be reclassified to profit or loss:
178.6 Actuarial gains on retirement benefit schemes, net of taxation 28.9 64.1 47.3 Share of other comprehensive income of joint ventures, net of taxation 11.1 13.0
225.9 40.0 77.1
219.8 Other comprehensive income, net of taxation 43.9 91.6
1,139.9 Total comprehensive (loss)/income for the period (200.5) 448.8
Attributable to:
1,041.4 Ordinary shareholders of the parent (247.1) 391.4 98.5 Other equity holders 46.6 57.4
1,139.9 (200.5) 448.8
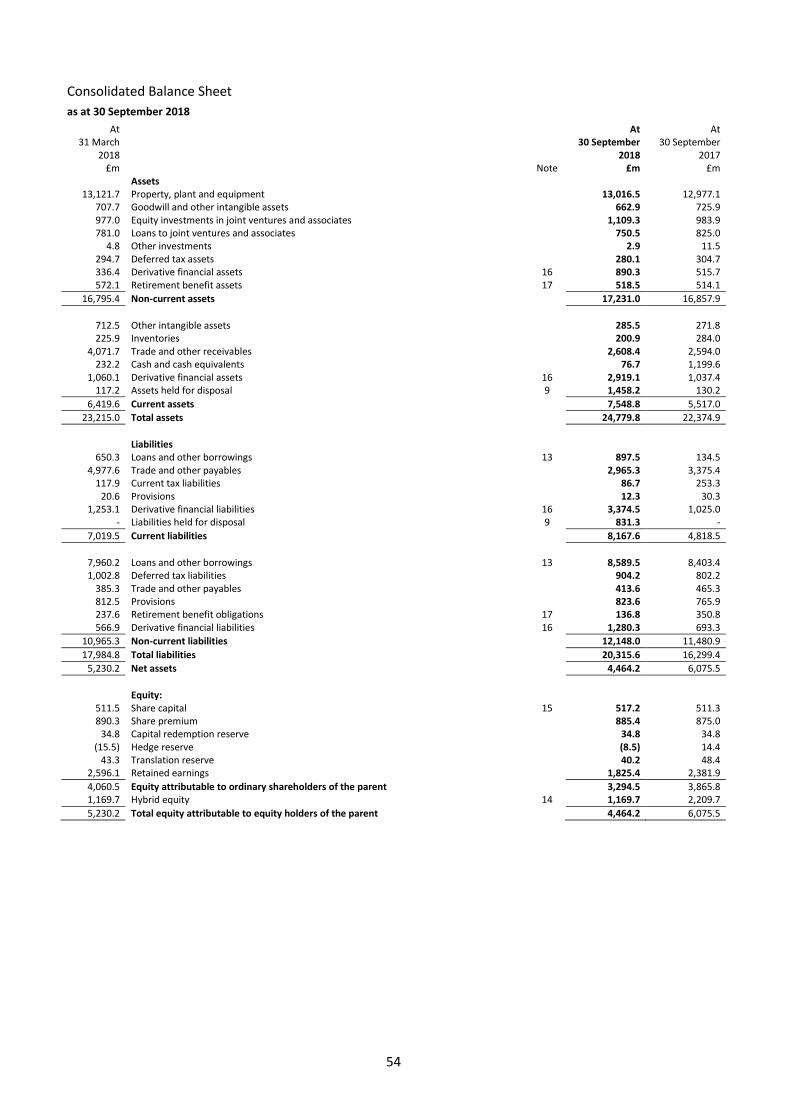
54
Consolidated Balance Sheet
as at 30 September 2018
At 31 March
2018
At 30 September
2018
At 30 September
2017 £m Note £m £m
Assets 13,121.7 Property, plant and equipment 13,016.5 12,977.1
707.7 Goodwill and other intangible assets 662.9 725.9 977.0 Equity investments in joint ventures and associates 1,109.3 983.9 781.0 Loans to joint ventures and associates 750.5 825.0
4.8 Other investments 2.9 11.5 294.7 Deferred tax assets 280.1 304.7 336.4 Derivative financial assets 16 890.3 515.7 572.1 Retirement benefit assets 17 518.5 514.1
16,795.4 Non-current assets 17,231.0 16,857.9
712.5 Other intangible assets 285.5 271.8 225.9 Inventories 200.9 284.0
4,071.7 Trade and other receivables 2,608.4 2,594.0 232.2 Cash and cash equivalents 76.7 1,199.6
1,060.1 Derivative financial assets 16 2,919.1 1,037.4 117.2 Assets held for disposal 9 1,458.2 130.2
6,419.6 Current assets 7,548.8 5,517.0
23,215.0 Total assets 24,779.8 22,374.9
Liabilities
650.3 Loans and other borrowings 13 897.5 134.5 4,977.6 Trade and other payables 2,965.3 3,375.4
117.9 Current tax liabilities 86.7 253.3 20.6 Provisions 12.3 30.3
1,253.1 Derivative financial liabilities 16 3,374.5 1,025.0 - Liabilities held for disposal 9 831.3 -
7,019.5 Current liabilities 8,167.6 4,818.5
7,960.2 Loans and other borrowings 13 8,589.5 8,403.4 1,002.8 Deferred tax liabilities 904.2 802.2
385.3 Trade and other payables 413.6 465.3 812.5 Provisions 823.6 765.9 237.6 Retirement benefit obligations 17 136.8 350.8 566.9 Derivative financial liabilities 16 1,280.3 693.3
10,965.3 Non-current liabilities 12,148.0 11,480.9
17,984.8 Total liabilities 20,315.6 16,299.4
5,230.2 Net assets 4,464.2 6,075.5
Equity:
511.5 Share capital 15 517.2 511.3 890.3 Share premium 885.4 875.0
34.8 Capital redemption reserve 34.8 34.8 (15.5) Hedge reserve (8.5) 14.4
43.3 Translation reserve 40.2 48.4 2,596.1 Retained earnings 1,825.4 2,381.9
4,060.5 Equity attributable to ordinary shareholders of the parent 3,294.5 3,865.8 1,169.7 Hybrid equity 14 1,169.7 2,209.7
5,230.2 Total equity attributable to equity holders of the parent 4,464.2 6,075.5
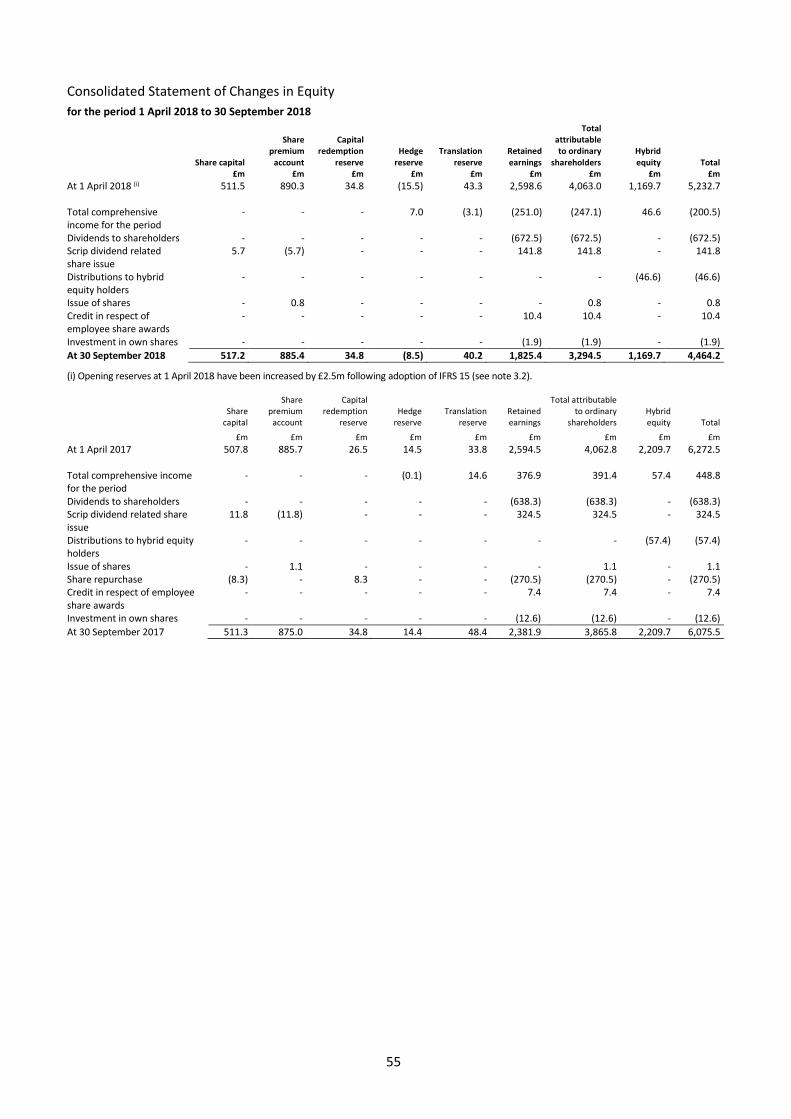
55
Consolidated Statement of Changes in Equity
for the period 1 April 2018 to 30 September 2018
Share capital
Share premium
account
Capital redemption
reserve Hedge
reserve Translation
reserve Retained earnings
Total attributable to ordinary
shareholders Hybrid equity Total
£m £m £m £m £m £m £m £m £m
At 1 April 2018 (i) 511.5 890.3 34.8 (15.5) 43.3 2,598.6 4,063.0 1,169.7 5,232.7 Total comprehensive income for the period
- - - 7.0 (3.1) (251.0) (247.1) 46.6 (200.5)
Dividends to shareholders - - - - - (672.5) (672.5) - (672.5) Scrip dividend related share issue
5.7 (5.7) - - - 141.8 141.8 - 141.8
Distributions to hybrid equity holders
- - - - - - - (46.6) (46.6)
Issue of shares - 0.8 - - - - 0.8 - 0.8 Credit in respect of employee share awards
- - - - - 10.4 10.4 - 10.4
Investment in own shares - - - - - (1.9) (1.9) - (1.9)
At 30 September 2018 517.2 885.4 34.8 (8.5) 40.2 1,825.4 3,294.5 1,169.7 4,464.2
(i) Opening reserves at 1 April 2018 have been increased by £2.5m following adoption of IFRS 15 (see note 3.2).
Share
capital
Share premium
account
Capital redemption
reserve Hedge
reserve Translation
reserve
Retained earnings
Total attributable to ordinary
shareholders Hybrid equity Total
£m £m £m £m £m £m £m £m £m
At 1 April 2017 507.8 885.7 26.5 14.5 33.8 2,594.5 4,062.8 2,209.7 6,272.5 Total comprehensive income for the period
- - - (0.1) 14.6 376.9 391.4 57.4 448.8
Dividends to shareholders - - - - - (638.3) (638.3) - (638.3) Scrip dividend related share issue
11.8 (11.8) - - - 324.5 324.5 - 324.5
Distributions to hybrid equity holders
- - - - - - - (57.4) (57.4)
Issue of shares - 1.1 - - - - 1.1 - 1.1 Share repurchase (8.3) - 8.3 - - (270.5) (270.5) - (270.5) Credit in respect of employee share awards
- - - - - 7.4 7.4 - 7.4
Investment in own shares - - - - - (12.6) (12.6) - (12.6)
At 30 September 2017 511.3 875.0 34.8 14.4 48.4 2,381.9 3,865.8 2,209.7 6,075.5
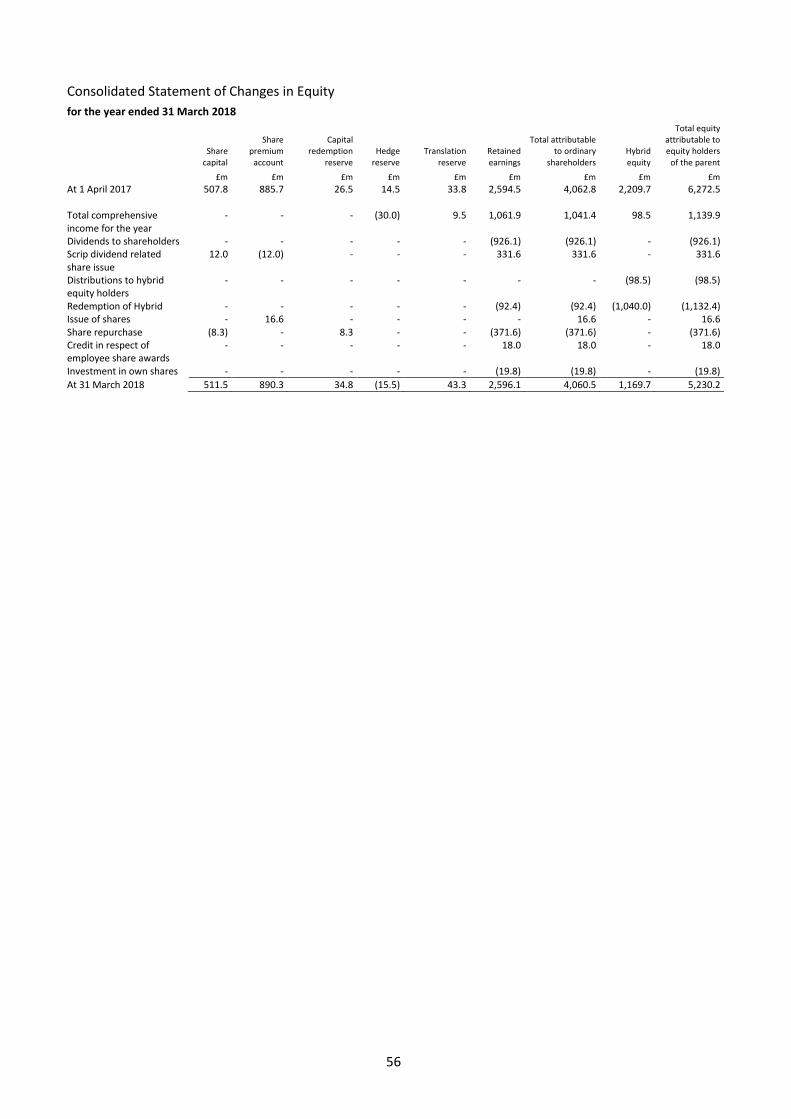
56
Consolidated Statement of Changes in Equity
for the year ended 31 March 2018
Share
capital
Share premium
account
Capital redemption
reserve Hedge
reserve Translation
reserve Retained earnings
Total attributable to ordinary
shareholders Hybrid equity
Total equity attributable to equity holders
of the parent
£m £m £m £m £m £m £m £m £m
At 1 April 2017 507.8 885.7 26.5 14.5 33.8 2,594.5 4,062.8 2,209.7 6,272.5 Total comprehensive income for the year
- - - (30.0) 9.5 1,061.9 1,041.4 98.5 1,139.9
Dividends to shareholders - - - - - (926.1) (926.1) - (926.1) Scrip dividend related share issue
12.0 (12.0) - - - 331.6 331.6 - 331.6
Distributions to hybrid equity holders
- - - - - - - (98.5) (98.5)
Redemption of Hybrid - - - - - (92.4) (92.4) (1,040.0) (1,132.4) Issue of shares - 16.6 - - - - 16.6 - 16.6 Share repurchase (8.3) - 8.3 - - (371.6) (371.6) - (371.6) Credit in respect of employee share awards
- - - - - 18.0 18.0 - 18.0
Investment in own shares - - - - - (19.8) (19.8) - (19.8)
At 31 March 2018 511.5 890.3 34.8 (15.5) 43.3 2,596.1 4,060.5 1,169.7 5,230.2
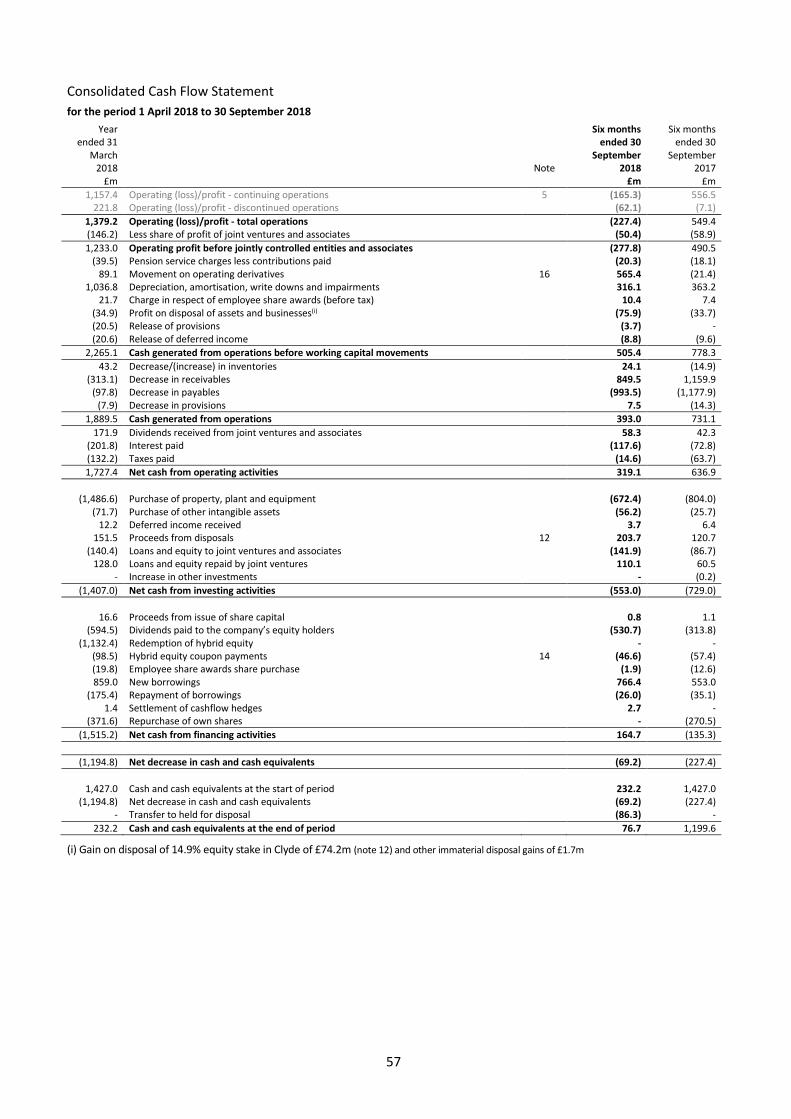
57
Consolidated Cash Flow Statement
for the period 1 April 2018 to 30 September 2018
Year ended 31
March 2018 Note
Six months ended 30
September 2018
Six months ended 30
September 2017
£m £m £m
1,157.4 Operating (loss)/profit - continuing operations 5 (165.3) 556.5 221.8 Operating (loss)/profit - discontinued operations (62.1) (7.1)
1,379.2 Operating (loss)/profit - total operations (227.4) 549.4 (146.2) Less share of profit of joint ventures and associates (50.4) (58.9)
1,233.0 Operating profit before jointly controlled entities and associates (277.8) 490.5 (39.5) Pension service charges less contributions paid (20.3) (18.1)
89.1 Movement on operating derivatives 16 565.4 (21.4) 1,036.8 Depreciation, amortisation, write downs and impairments 316.1 363.2
21.7 Charge in respect of employee share awards (before tax) 10.4 7.4 (34.9) Profit on disposal of assets and businesses(i) (75.9) (33.7) (20.5) Release of provisions (3.7) - (20.6) Release of deferred income (8.8) (9.6)
2,265.1 Cash generated from operations before working capital movements 505.4 778.3
43.2 Decrease/(increase) in inventories 24.1 (14.9) (313.1) Decrease in receivables 849.5 1,159.9
(97.8) Decrease in payables (993.5) (1,177.9) (7.9) Decrease in provisions 7.5 (14.3)
1,889.5 Cash generated from operations 393.0 731.1
171.9 Dividends received from joint ventures and associates 58.3 42.3 (201.8) Interest paid (117.6) (72.8) (132.2) Taxes paid (14.6) (63.7)
1,727.4 Net cash from operating activities 319.1 636.9
(1,486.6) Purchase of property, plant and equipment (672.4) (804.0)
(71.7) Purchase of other intangible assets (56.2) (25.7) 12.2 Deferred income received 3.7 6.4
151.5 Proceeds from disposals 12 203.7 120.7 (140.4) Loans and equity to joint ventures and associates (141.9) (86.7)
128.0 Loans and equity repaid by joint ventures 110.1 60.5 - Increase in other investments - (0.2)
(1,407.0) Net cash from investing activities (553.0) (729.0)
16.6 Proceeds from issue of share capital 0.8 1.1
(594.5) Dividends paid to the company’s equity holders (530.7) (313.8) (1,132.4) Redemption of hybrid equity - -
(98.5) Hybrid equity coupon payments 14 (46.6) (57.4) (19.8) Employee share awards share purchase (1.9) (12.6) 859.0 New borrowings 766.4 553.0
(175.4) Repayment of borrowings (26.0) (35.1) 1.4 Settlement of cashflow hedges 2.7 -
(371.6) Repurchase of own shares - (270.5)
(1,515.2) Net cash from financing activities 164.7 (135.3)
(1,194.8) Net decrease in cash and cash equivalents (69.2) (227.4)
1,427.0 Cash and cash equivalents at the start of period 232.2 1,427.0
(1,194.8) Net decrease in cash and cash equivalents (69.2) (227.4) - Transfer to held for disposal (86.3) -
232.2 Cash and cash equivalents at the end of period 76.7 1,199.6
(i) Gain on disposal of 14.9% equity stake in Clyde of £74.2m (note 12) and other immaterial disposal gains of £1.7m
58
1. Condensed Financial Statements
SSE plc (the Company) is a company domiciled in Scotland. The Condensed Interim Statements comprise those of the Company and its subsidiaries (together referred to as the Group).
The financial information set out in these condensed interim statements does not constitute the Group’s statutory accounts for the periods ended 30 September 2018, 31 March 2018 or 30 September 2017 within the meaning of Section 435 of the Companies Act 2006. Statutory accounts for the year ended 31 March 2018, which were prepared in accordance with International Financial Reporting Standards as adopted by the EU (adopted IFRS), have been reported on by the Group’s auditors and delivered to the Registrar of Companies. The financial information set out in these interim statements has been prepared in accordance with the Disclosure and Transparency Rules of the Financial Conduct Authority and IAS 34 Interim Financial Reporting as adopted by the EU.
The report of the auditor was (i) unqualified (ii) did not include reference to any matters to which the auditors drew attention by way of emphasis without qualifying their report and (iii) did not contain statements under section 498 (2) or (3) of the Companies Act 2006. The interim financial information is unaudited but has been formally reviewed by the auditor and its report to the Company is set out on page 83.
These interim statements were authorised by the Board on 13 November 2018.
2. Basis of preparation
These condensed interim statements for the period to 30 September 2018 and the comparative information for the period to 30 September 2017 have been prepared applying the accounting policies and presentation used in the Group’s consolidated financial statements for the year ended 31 March 2018, with the exception of IFRS 9 ‘Financial Instruments’ and IFRS 15 ‘Revenue from Contracts with Customers’ which were adopted on 1 April 2018, as set out in Note 3.
(i) Adjusted measures
The Directors assess the performance of the Group and its reportable segments based on ‘adjusted measures’. These measures are used for internal performance management and are believed to be appropriate for explaining underlying performance to users of the accounts. These measures are also deemed the most useful for the ordinary shareholders of the Company and for other stakeholders.
Reconciliations from the reported measures to adjusted measures along with further description of the rationale for those adjustments are included in the ‘Alternative Performance Measures’ section.
(ii) Going concern
The Directors consider that the Group has adequate resources to continue in operational existence for the foreseeable future and the interim statements are therefore prepared on a going concern basis.
The Directors regularly review the Group’s funding structure (see note 13) to ensure that the Group has the short and long term funding required. In September 2018, the Group issued a €650m Green Bond which was used to repay £500m of Eurobonds on 1 October 2018, subsequent to the period end. The next substantial tranche of debt does not mature until June 2020.
(iii) Exceptional items and certain re-measurements
Exceptional items are those charges or credits that are considered unusual by nature and/or scale and of such significance that separate disclosure is required for the financial statements to be properly understood. The trigger points for exceptional items will tend to be non-recurring although exceptional charges may impact the same asset class or segment over time. Market conditions that have deteriorated significantly over time will only be captured to the extent observable at the balance sheet date. Examples of items that may be considered exceptional include material asset or business impairment charges, business restructuring costs, significant gains or losses on disposal and provisions in relation to contractual settlements following significant disputes and claims. The Directors consider that any individual gain or loss on disposal of greater than £30.0m would be disclosed as being exceptional by nature of its scale. Other gains or losses on disposal below this level may be considered to be exceptional by reference to specific circumstances which will be explained on a case by case basis. Impairments of intangible development projects as part of the normal course of business are not considered exceptional.
Certain re-measurements arise on certain commodity, interest rate and currency contracts which are accounted for as held for trading or as fair value hedges in accordance with the Group’s policy for such financial instruments. The amounts shown in the before exceptional items and certain re-measurements results for these contracts is the amount settled in the period. This excludes commodity contracts not treated as financial instruments under IFRS 9 where held for the Group’s own use requirements which are not recorded until the underlying commodity is delivered.
(iv) Other additional disclosures
As permitted by IAS 1 ‘Presentation of financial statements’, the Group’s income statement discloses additional information in respect of joint ventures and associates, exceptional items and certain re-measurements to aid understanding of the Group’s financial performance and to present results clearly and consistently.
59
3. Summary of significant new accounting policies and reporting changes
The Group has adopted IFRS 9 'Financial Instruments' and IFRS 15 'Revenue from Contracts with Customers' from 1 April 2018. The key accounting policy changes, transition approach and financial impact of adopting these standards are disclosed below. Other issued amendments and interpretations of adopted IFRS, mandatory for the year ended 31 March 2019 and not early adopted, have been applied by the Group and have not had a material impact.
3.1 IFRS 9 ‘Financial Instruments’
This standard replaces IAS 39 ‘Financial Instruments: Recognition and Measurement’ and sets out the requirements for recognising and measuring financial assets, financial liabilities and some contracts to buy or sell non-financial items. The impact of adopting this standard can be summarised with reference to the three project phases:
(i) Classification and measurement
As a result of adopting IFRS 9, unquoted equity instruments previously measured at amortised cost have been classified as equity instruments and measured at fair value through other comprehensive income. The value of unquoted equity instruments reclassified at 1 April 2018 was £4.8m. Adoption has not resulted in changes to the carrying value of these, or any other, financial instruments held by the Group.
The Group will continue to measure equity instruments at fair value through other comprehensive income, as an election on an instrument-by-instrument basis on initial recognition.
(ii) Impairment
As a result of adopting IFRS 9, no changes to the impairment provisions have been made. Given the short term nature of the majority of affected financial assets, and the Group’s focus on mitigating significant credit risk through regular monitoring and securitisation, the inclusion of forward looking information as required by IFRS 9 did not result in a change to the Group’s provisioning at 30 September 2018.
(iii) Hedge accounting
As previously noted in the 31 March 2018 Annual Report, the Group has elected to continue to apply the hedge accounting requirements of IAS 39 as permitted by IFRS 9.
Transition approach
The Group has applied the exemption from the requirement to restate comparative information about classification and measurement, including impairment. There has been no change to opening retained earnings as a result of adoption.
60
3. Summary of significant new accounting policies and reporting changes (continued)
3.2 IFRS 15 ‘Revenue from contracts with customers’
This standard replaces IAS 11 ‘Construction contracts’, IAS 18 ‘Revenue’, IFRIC 18 ‘Transfers of Assets from Customers’ and a number of other revenue related interpretations previously adopted by the Group. The key changes to revenue accounting policies, summarised for each Business Area, are noted below:
Networks
Revenue relating to Distribution Connections is recognised ‘over time’ with reference to the ongoing obligation to provide connection access to the Distribution Network, rather than at the point of time the connection was completed under IFRIC 18.
Retail – continuing operations
Revenue and costs relating to Third Party Intermediary companies (used by Business Energy customers to support and advise them in changing Supplier) are offset within cost of sales in the Income Statement, rather than recognised gross as previously applied.
For construction contracts undertaken by the Enterprise segment, revenue is recognised on a ‘costs incurred’ input basis with costs expensed as they occur, rather than the margin mark-up basis previously applied. This change in treatment removes work in progress from the Group’s balance sheet.
Retail – discontinued operations
Revenue and costs relating to customer support schemes (such as the Warm Home Discount) are offset within revenue in the Income Statement, rather than recognised gross as previously applied
For certain equipment provided to customers on inception of a contract – for example, internet routers delivered to a customer on inception of a Broadband contract – revenue is recognised when the equipment is delivered rather than over the customer contract period as previously applied.
Wholesale
As previously noted within the Group’s 2018 Annual Report, the presentation of sales and purchases of commodity optimisation trades on a gross or net basis varies across its industry peer group. Due to the future adoption of IFRS 15, and the clear principles defining “revenue” contained within, a review was undertaken to conclude on whether a gross or net presentation of sales and purchases of commodity trades provided a more relevant reflection of their underlying economic reality. The review, which completed during the first half of this financial year, concluded that whilst a gross presentation of sales commodity optimisation trades was acceptable under previous revenue standards, it neither reflects the revised principles defining revenue nor the underlying economic purpose for this trading and should therefore be presented net in cost of sales alongside purchase commodity optimisation trades. As this change is a direct consequence of adopting IFRS 15, and the clear principles defining “revenue” contained within, the Group has applied the transition approach afforded by that standard and applied a net presentation from 1 April 2018 onwards. This change to presentation had no impact on the operating profit of the Group’s EPM segment.
Transition approach
The Group has applied the ‘Modified Retrospective’ transition approach, whereby prior periods are not restated to reflect the above changes in accounting policies, with the cumulative effect of initially applying IFRS 15 recognised on 1 April 2018 instead. The Group has also elected to take advantage of the practical expedient whereby contracts that have been completed under the previous accounting policies at the beginning of the earliest period are not restated.
61
3. Summary of significant new accounting policies and reporting changes (continued)
3.2 IFRS 15 ‘Revenue from contracts with customers’ (continued)
On adoption of IFRS 15 on 1 April 2018, the opening reserves of the Group were increased by £2.5m. The application of IFRS 15 has resulted in the following revenue and operating profit adjustments being made to the amounts recognised in these Condensed Interim Statements:
For the six month period to 30 September 2018
Historic Revenue Policies
£m Adjustments
£m
IFRS 15 Revenue Policies
£m Revenue by Segment Continuing operations Networks
Electricity Distribution(i) 360.4 (48.8) 311.6 Electricity Transmission 197.3 - 197.3
557.7 (48.8) 508.9
Retail Business Energy 1,221.8 (24.5) 1,197.3 Airtricity 439.5 - 439.5 Enterprise 220.5 7.2 227.7
1,881.8 (17.3) 1,864.5
Wholesale Electricity Generation 273.9 - 273.9 EPM(ii) 8,458.4 (7,827.0) 631.4 Gas storage 11.3 - 11.3 Gas production 16.9 - 16.9
8,760.5 (7,827.0) 933.5
Corporate unallocated 27.7 - 27.7
Total revenue from continuing operations 11,227.7 (7,893.1) 3,334.6
Discontinued operations
SSE Energy Services – Energy Supply 1,369.1 (23.5) 1,345.6 SSE Energy Services – Energy Related Services 58.5 0.6 59.1
Total revenue from discontinued operations 1,427.6 (22.9) 1,404.7
Total revenue 12,655.3 (7,916.0) 4,739.3
Operating profit/(loss) by Segment Continuing operations Networks
Electricity Distribution(i) 167.2 (0.3) 166.9 Electricity Transmission 127.4 - 127.4 Gas Distribution 38.6 - 38.6
333.2 (0.3) 332.9
Retail Business Energy 41.6 - 41.6 Airtricity 12.0 - 12.0 Enterprise 12.8 0.9 13.7
66.4 0.9 67.3
Wholesale Electricity Generation 138.3 - 138.3 EPM(ii) (651.3) - (651.3) Gas storage (3.7) - (3.7) Gas production 19.3 - 19.3
(497.4) - (497.4)
Corporate unallocated (68.1) - (68.1)
Total operating loss from continuing operations (165.9) 0.6 (165.3)
Discontinued operations
SSE Energy Services – Energy Supply (68.7) - (68.7) SSE Energy Services – Energy Related Services 6.6 - 6.6
Total operating loss from continuing operations (62.1) - (62.1)
Total operating loss (228.0) 0.6 (227.4)
(i) The reduction to Electricity Distribution revenue is offset by a reduction to depreciation of £48.5m. Therefore, the net operating profit impact is £0.3m in the period.
(ii) The reduction in EPM revenue of £7,827.0m is offset by an equal reduction to cost of sales, to present all transactions entered into for the purposes of optimisation on a net basis. There is no impact of this adjustment on operating profit or cashflows of the EPM segment.
62
3. Summary of significant new accounting policies and reporting changes (continued)
3.3 New or amended EU endorsed accounting standards
The following issued standards have not yet been adopted by the Group:
i) IFRS 16 ‘Leases’ which will be effective from 1 January 2019 (1 April 2019 to the Group); and
ii) IFRS 17 ‘Insurance contracts’ which will be effective from 1 January 2021 (1 April 2021 to the Group), subject to EU endorsement.
In addition to these, there are a number of other amendments and annual improvement project recommendations that are not yet effective and are subject to endorsement by the EU. These are not anticipated to have a material impact on the Group’s consolidated financial statements.
Disclosure of the anticipated impact from adoption of IFRS 16 was provided in Note 2.3 of the Group’s consolidated Financial Statements for the year ended 31 March 2018. The project to assess adoption of this standard has progressed during the current year, with attention principally focused on lease data capture and cleanse activities. Given the variety of transition approaches available on adoption, as well as the number of unique leases in place, the full implementation effect of the standard will only be determined once the project has completed. The Group’s assessment of the expected impact of adoption remains unchanged.
The Group has yet to commence a project to fully assess the impact from adoption of IFRS 17, however the Group’s initial expectation is that adoption of this standard will not have a material impact on the Group’s consolidated financial statements.
4. Critical accounting judgements and key sources of estimation uncertainty
In the process of applying the Group’s accounting policies, management necessarily makes judgements and estimates that have a significant effect on the amounts recognised in the financial statements. Changes in the assumptions underlying the estimates could result in a significant impact to the financial statements. The Group’s key accounting judgement and estimation areas are noted below.
4.1 Significant financial judgements – estimation uncertainties
The preparation of these Condensed Interim Statements has specifically considered the following significant financial judgements, all of which are areas of estimation uncertainty.
(i) Impairment testing and valuation of certain non-current assets – estimation uncertainty
The Group reviews the carrying amounts of its goodwill, other intangible assets and specific property, plant and equipment assets to determine whether any impairment of the carrying value of those assets requires to be recorded. At 30 September 2018, the Group has reviewed goodwill, intangible development assets and specific property, plant and equipment assets related to gas production, thermal power generation and wind power generation for indicators of impairment arising since the last formal review performed at 31 March 2018. In conducting its reviews, the Group makes judgements and estimates in considering the recoverable amount of the respective assets or cash-generating units (CGUs).
The main assumptions in the Group’s impairment assessments performed at 31 March 2018 were: regulation and legislation changes, power, gas, carbon and other commodity prices, volatility of gas prices, plant running regimes and load factors, expected proven and probable reserves, and discount rates. Any significant change to these assumptions could impact the Group results at 30 September 2018.
At 30 September 2018, the Group assessed that an indicator of impairment existed that necessitated an impairment review of the Group’s investment in its held for disposal Retail domestic supply business, following the price cap announced by Ofgem on 6 September 2018. An impairment assessment was performed at 30 September which resulted in no impairment being recognised. Following the balance sheet date, the Group has assessed that the impact of the finalised price cap announced on 6 November 2018 results in no impairment.
The Group has assessed that the forward gas price increases throughout the months of August and September 2018 were not an indicator of a reversal of impairment of the Group’s gas production assets, which would necessitate a formal impairment review at 30 September. The increase in gas price is considered a short term market movement, not necessarily representative of longer term trends. The Group will reassess the assets for impairment at 31 March 2019.
(ii) Revenue recognition – estimated energy consumption – estimation uncertainty
Revenue from Retail energy supply activities includes an estimate of the value of electricity or gas supplied to customers between the date of the last meter reading and the year end. This estimation will comprise of values for i) billed revenue in relation to consumption from unread meters based on estimated consumption taking account of various factors including usage patterns and weather trends (disclosed as trade receivables) and ii) unbilled revenue (disclosed as accrued income) calculated by assessing a number of factors such as externally notified aggregated volumes supplied to customers from national settlement bodies, amounts billed to customers and other adjustments.
Given the non-routine process, number of differing inputs and the extent of differing inputs and the extent of management judgement noted below, the unbilled revenue estimate is considered a significant estimate made by management in preparing the Condensed Interim Statements. The unbilled income receivable related to the domestic supply business has been presented as held for disposal at 30 September 2018. In addition, the revenue derived from the accrued income is included in revenue from discontinued operations (see note 9).
63
4. Critical accounting judgements and key sources of estimation uncertainty (continued)
4.1 Significant financial judgements – estimation uncertainties (continued)
(ii) Revenue recognition – estimated energy consumption – estimation uncertainty (continued)
Unbilled revenue is calculated by applying the tariffs applicable to customers to the calculated volume of electricity or gas consumed. This estimation methodology is subject to an internal corroboration process that provides support for the judgements made by management. This corroboration process requires the comparison of calculated unbilled volumes to a ‘benchmark’ measure of unbilled volumes (in GWh and millions of therms) which is derived from historical weather-adjusted consumption patterns and aggregated, independently validated but unreconciled metering data that is used in industry reconciliation processes for total consumption by supplier. This comparison of the estimated supplied quantity of electricity or gas that is deemed to have been delivered to customers against the aggregate supplied quantity of electricity or gas applicable to the Group’s customers that is measured by industry system operators, is a key judgement. The estimation of electricity unbilled revenue is further influenced by the impact on estimated electricity or gas supplied of national settlements data or, for electricity only, feed-in-tariff supported volumes and spill from solar PV generation.
(iii) Retirement benefits – estimation uncertainty
The assumptions in relation to the cost of providing post-retirement benefits during the period are based on the Group’s best estimates and are set after consultation with qualified actuaries. While these assumptions are believed to be appropriate, a change in these assumptions would impact the level of the retirement benefit obligation recorded and the cost to the Group of administering the schemes. Further detail on the calculation basis and key assumptions used is disclosed in Note 17 of these interim statements.
4.2 Other key accounting judgements
(i) Presentation of SSE’s household energy and services business in Great Britain – accounting judgement
On 8 November 2017, the Group announced that it had entered into an agreement with innogy SE (‘innogy’) in respect of a proposed demerger of SSE’s household energy and services business in Great Britain and combination with innogy’s subsidiary, npower Group plc, to form a new independent UK incorporated company. At 31 March 2018 the Group assessed that the Retail business did not meet the criteria to be held for disposal as the transaction remained subject to SSE shareholder approval and Competition and Markets Authority (‘CMA’) approval.
On 19 July 2018, SSE’s shareholders approved the transaction and on 30 August 2018, the CMA announced the preliminary findings of its investigation, which gave consent to the transaction subject to its final ruling. The CMA’s preliminary ruling required no material remediations to be implemented, therefore SSE assessed at 30 September 2018 that it was highly probable that the transaction would be completed, and the IFRS 5 criteria to present the assets and liabilities as held for disposal are met, despite the transaction remaining subject to final approval. Following the transaction SSE will retain an energy supply business to business customers - this activity has been presented as a continuing activity within this statement and the assets and liabilities are not presented as held for disposal.
On 10 October 2018, subsequent to the financial period end, the CMA announced the final results of its investigation which granted final approval of the transaction.
On 8 November 2018 the Group announced that it had entered into discussions with innogy regarding potential changes to the commercial terms of the proposed combination and stated that it was likely that the proposed combination would be delayed beyond Q1 2019. However, all work to seek to achieve the formation and listing of the company would continue. The Group has assessed that the IFRS 5 criteria to present the business as held for disposal continue to be met following the announcement. ‘Held for disposal’, as presented throughout these Condensed Interim Statements may be either ‘held for sale’ or ‘held for distribution’ as defined by IFRS 5. A further update on the progress of the transaction will be provided by mid-December 2018.
(ii) Accounting for costs of the smart meter infrastructure programme – accounting judgement
Through its participation in the UK smart metering programme, the Group is required to make payments to the Data Communications Company (“DCC”) as it develops infrastructure to support the UK smart meter roll-out. The Group has assessed that the DCC costs incurred are capital in nature as they will provide future economic benefit and the Group has the power to control certain assets through the terms of the Smart Meter Code. These assets relate to the centralised infrastructure costs of the UK’s smart meter programme. At 30 September 2018, the costs capitalised to date total £96.3m (2017: £71.5m; March 2018: £86.6m). SSE is aware that other market participants have expensed these costs as incurred, however, given that it has been assessed that control exists over these assets, they have been capitalised.
(iii) Accounting for capacity market payments – accounting judgement
The Group’s UK Supply businesses are required to make payments to an independent Settlement Body to ensure sufficient reliable electricity capacity is available throughout the year. This charge is based on the Supplier’s forecast energy demands between November and February and is charged over the course of the delivery year.
In accordance with IFRIC 21 “Levies”, a liability for the full year charge is recognised progressively between November and February. The Group has assessed that this represents a regulatory operating cost to the business for its operations throughout the year and therefore recognises the cost over the course of the year. Any difference between the liability and charge is recognised as a settlement prepaid asset.
64
4. Critical accounting judgements and key sources of estimation uncertainty (continued)
4.2 Other key accounting judgements (continued)
(iv) Lease classification for Smart Meter contracts – accounting judgement
During the year ended 31 March 2017, the Group disposed of smart meter assets to Meter Fit 10 Limited and entered into an agreement for the provision of meter asset provider (MAP) services with Meter Fit 10 Limited and a joint venture company, Maple Topco Limited.
The Group has assessed that the arrangements with both parties, in common with all similar arrangements, do not contain leases of the smart meters owned by the MAP due to other parties taking a significant amount of the output from the meters and due to the Group being unable to control either the operation or the physical access to the meters. The IFRS 16 “Leases” implementation project has concluded that this assessment will not change upon adoption of that standard.
4.3 Other areas of estimation uncertainty
(i) Tax provisioning – estimation uncertainty
The Group has a number of open tax issues with the tax authorities in the UK and Republic of Ireland, the two jurisdictions in which the Group operates. Where management makes a judgement that an outflow of funds is probable, and a reliable estimate of the dispute can be made, provision is made for the best estimate of the most likely liability.
In estimating any such liability, the Group applies a risk-based approach, taking into account the specific circumstances of each dispute based on management’s interpretation of tax law and supported, where appropriate, by discussion and analysis by external tax advisors. These estimates are inherently judgemental and could change substantially over time as each dispute progresses and new facts emerge. Provisions are reviewed on an ongoing basis, however the resolution of tax issues can take a considerable period of time to conclude and it is possible that amounts ultimately paid will be different from the amounts provided. Provisions for uncertain tax positions are included in current tax liabilities, and total £66.1m at 30 September 2018 (2017: £131.6m; March 2018: £66.1m).
IFRIC 23 “Uncertainty over Income Tax Treatments”, issued by the IASB with an effective date for the Group of 1 April 2019 but yet to be endorsed by the EU, clarifies the application of IAS 12 “Income Taxes” regarding recognition and measurement when there is uncertainty over the income tax treatment. Analysis of the potential impact from adopting this interpretation is ongoing, however adoption may result in changes to the judgements or estimates made for tax provisions.
(ii) Decommissioning costs – estimation uncertainty
The estimated cost of decommissioning at the end of the useful lives of certain property, plant and equipment assets is reviewed periodically and has been reassessed as at 31 March 2018. Decommissioning costs in relation to gas exploration and production assets are periodically agreed with the field operators and reflect the latest expected economic production lives of the fields. Provision is made for the estimated discounted cost of decommissioning at the balance sheet date. The dates for settlement of future decommissioning costs are uncertain, particularly for gas exploration and production assets where reassessment of gas and liquid reserves can lengthen or shorten the life of the field life, as well as the upward and downward movement in commodity prices and operating costs, but are currently expected to be incurred beginning in 2019 and increasing in the subsequent decade and out to 2040.
(iii) Gas and liquid reserves
The volume and production profile of proven and probable (2P) gas and liquids reserves is an estimate that affects the unit of production depreciation of producing gas and liquids property, plant and equipment. This is also a significant input estimate to the associated impairment and decommissioning calculations. The estimation of gas and liquid reserves is subject to change between reporting periods, following the review and updating of inputs such as regional activity, geological data, reservoir performance data, well drilling activity, commodity prices and production costs. Proven and probable (2P) reserves, and other reserve classifications other than 2P, can both increase and decrease following assessment of the inputs.
The estimates of gas and liquid reserves are formally reviewed on an annual basis using an independent reservoir auditor, and the impact of a change in estimated proven and probable reserves is dealt with prospectively by depreciating the remaining book value of producing assets over the expected future production. If proven and probable reserves estimates are revised downwards, earnings could be affected by an immediate write-down (impairment) of the asset’s book value or a higher future depreciation expense.
65
5. Segmental information
The Group’s operating segments are those used internally by the Board to run the business and make strategic decisions.
The types of products and services from which each reportable segment in continuing operations derives its revenues are:
Business area Reported segments Description
Continuing operations
Networks Electricity Distribution The economically regulated lower voltage distribution of electricity to customer premises in the North of Scotland and the South of England.
Electricity Transmission The economically regulated high voltage transmission of electricity from generating plant to the distribution network in the North of Scotland.
Gas Distribution SSE’s share of Scotia Gas Networks, which operates two economically regulated gas distribution networks in Scotland and the South of England.
Retail Business Energy The supply of electricity and gas to business customers in Great Britain.
Airtricity The supply of electricity, gas and energy related services to residential and business customers in the Republic of Ireland and Northern Ireland.
Enterprise The integrated provision of services in competitive markets for industrial and commercial customers including electrical contracting, private energy networks, lighting services and telecoms capacity and bandwidth.
Wholesale Electricity Generation The generation of power from renewable and thermal plant in the UK and Ireland.
Energy Portfolio Management (EPM)
The optimisation of SSE’s power and gas and other commodity requirements.
Gas Storage The operation of gas storage facilities in the UK.
Gas Production The production and processing of gas and oil from North Sea fields.
The internal measure of profit used by the Board is ‘adjusted profit before interest and tax’ or ‘adjusted operating profit’ which is arrived at before exceptional items, the impact of financial instruments measured under IFRS 9, the net interest costs associated with defined benefit pension schemes and after the removal of taxation and interest on profits from joint ventures and associates.
Analysis of revenue, operating profit and earnings before interest, taxation, depreciation and amortisation (‘EBITDA’) by segment is provided below. All revenue and profit before taxation arise from operations within the UK and Ireland.
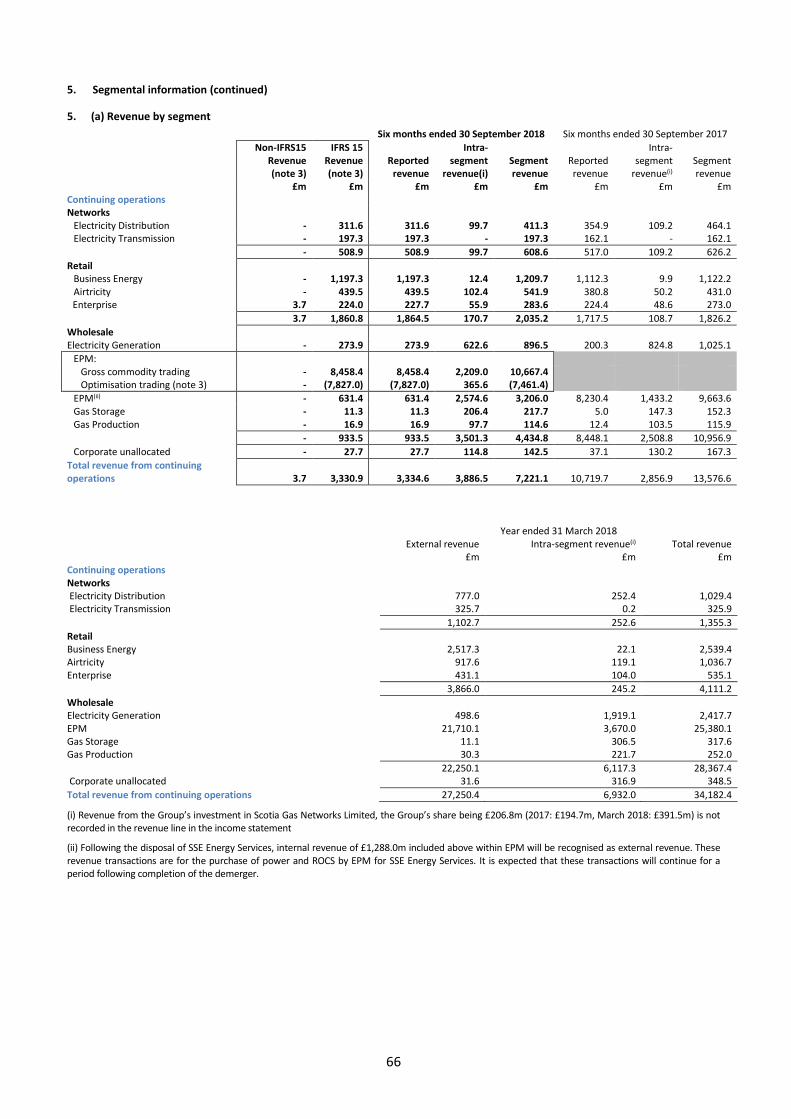
66
5. Segmental information (continued)
5. (a) Revenue by segment
Six months ended 30 September 2018 Six months ended 30 September 2017
Non-IFRS15 Revenue (note 3)
IFRS 15 Revenue (note 3)
Reported revenue
Intra-segment
revenue(i) Segment revenue
Reported revenue
Intra-segment
revenue(i) Segment revenue
£m £m £m £m £m £m £m £m Continuing operations Networks
Electricity Distribution - 311.6 311.6 99.7 411.3 354.9 109.2 464.1 Electricity Transmission - 197.3 197.3 - 197.3 162.1 - 162.1
- 508.9 508.9 99.7 608.6 517.0 109.2 626.2
Retail Business Energy - 1,197.3 1,197.3 12.4 1,209.7 1,112.3 9.9 1,122.2 Airtricity - 439.5 439.5 102.4 541.9 380.8 50.2 431.0 Enterprise 3.7 224.0 227.7 55.9 283.6 224.4 48.6 273.0
3.7 1,860.8 1,864.5 170.7 2,035.2 1,717.5 108.7 1,826.2
Wholesale Electricity Generation - 273.9 273.9 622.6 896.5 200.3 824.8 1,025.1
EPM: Gross commodity trading - 8,458.4 8,458.4 2,209.0 10,667.4 Optimisation trading (note 3) - (7,827.0) (7,827.0) 365.6 (7,461.4)
EPM(ii) - 631.4 631.4 2,574.6 3,206.0 8,230.4 1,433.2 9,663.6 Gas Storage - 11.3 11.3 206.4 217.7 5.0 147.3 152.3 Gas Production - 16.9 16.9 97.7 114.6 12.4 103.5 115.9
- 933.5 933.5 3,501.3 4,434.8 8,448.1 2,508.8 10,956.9
Corporate unallocated - 27.7 27.7 114.8 142.5 37.1 130.2 167.3
Total revenue from continuing operations 3.7 3,330.9 3,334.6 3,886.5 7,221.1 10,719.7 2,856.9 13,576.6
Year ended 31 March 2018 External revenue Intra-segment revenue(i) Total revenue £m £m £m Continuing operations Networks Electricity Distribution 777.0 252.4 1,029.4 Electricity Transmission 325.7 0.2 325.9
1,102.7 252.6 1,355.3
Retail Business Energy 2,517.3 22.1 2,539.4 Airtricity 917.6 119.1 1,036.7 Enterprise 431.1 104.0 535.1
3,866.0 245.2 4,111.2
Wholesale Electricity Generation 498.6 1,919.1 2,417.7 EPM 21,710.1 3,670.0 25,380.1 Gas Storage 11.1 306.5 317.6 Gas Production 30.3 221.7 252.0
22,250.1 6,117.3 28,367.4 Corporate unallocated 31.6 316.9 348.5
Total revenue from continuing operations 27,250.4 6,932.0 34,182.4
(i) Revenue from the Group’s investment in Scotia Gas Networks Limited, the Group’s share being £206.8m (2017: £194.7m, March 2018: £391.5m) is not recorded in the revenue line in the income statement
(ii) Following the disposal of SSE Energy Services, internal revenue of £1,288.0m included above within EPM will be recognised as external revenue. These revenue transactions are for the purchase of power and ROCS by EPM for SSE Energy Services. It is expected that these transactions will continue for a period following completion of the demerger.
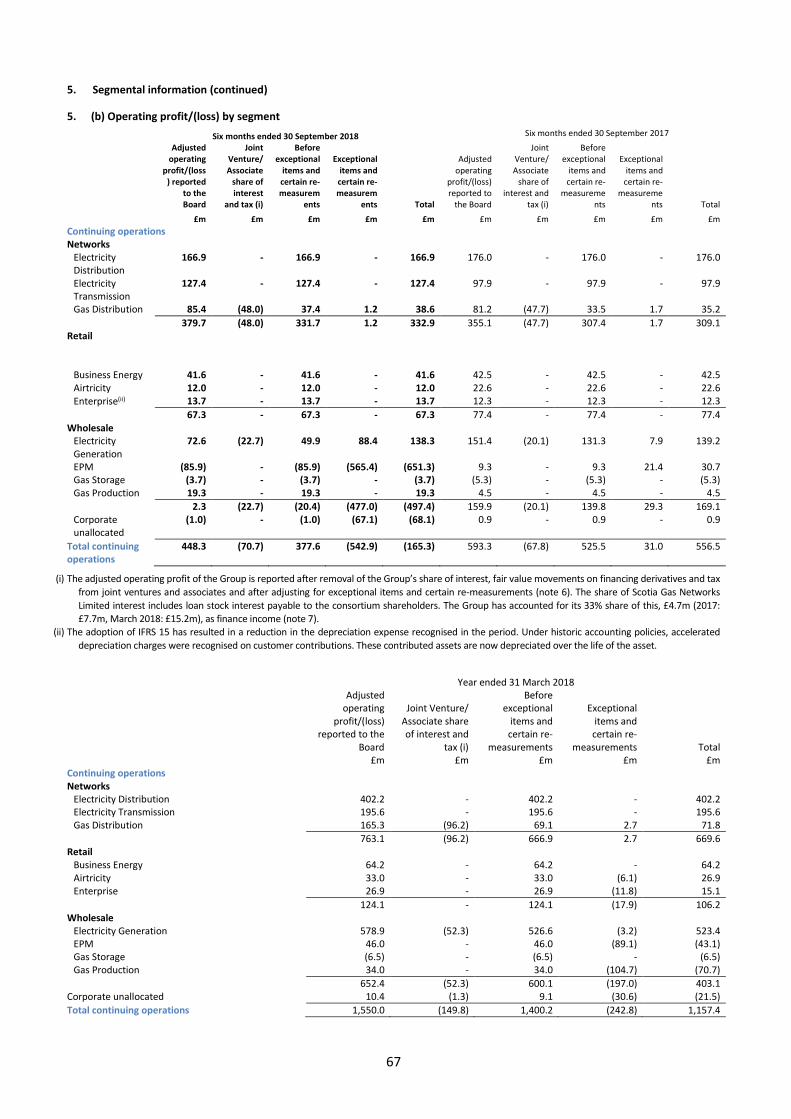
67
5. Segmental information (continued)
5. (b) Operating profit/(loss) by segment
Six months ended 30 September 2018 Six months ended 30 September 2017
Adjusted operating
profit/(loss) reported
to the Board
Joint Venture/ Associate
share of interest
and tax (i)
Before exceptional
items and certain re-measurem
ents
Exceptional items and certain re-measurem
ents Total
Adjusted operating
profit/(loss) reported to
the Board
Joint Venture/ Associate
share of interest and
tax (i)
Before exceptional
items and certain re-
measurements
Exceptional items and certain re-
measurements Total
£m £m £m £m £m £m £m £m £m £m
Continuing operations Networks
Electricity Distribution
166.9 - 166.9 - 166.9 176.0 - 176.0 - 176.0
Electricity Transmission
127.4 - 127.4 - 127.4 97.9 - 97.9 - 97.9
Gas Distribution 85.4 (48.0) 37.4 1.2 38.6 81.2 (47.7) 33.5 1.7 35.2
379.7 (48.0) 331.7 1.2 332.9 355.1 (47.7) 307.4 1.7 309.1 Retail
Business Energy 41.6 - 41.6 - 41.6 42.5 - 42.5 - 42.5 Airtricity 12.0 - 12.0 - 12.0 22.6 - 22.6 - 22.6 Enterprise(ii) 13.7 - 13.7 - 13.7 12.3 - 12.3 - 12.3
67.3 - 67.3 - 67.3 77.4 - 77.4 - 77.4 Wholesale
Electricity Generation
72.6 (22.7) 49.9 88.4 138.3 151.4 (20.1) 131.3 7.9 139.2
EPM (85.9) - (85.9) (565.4) (651.3) 9.3 - 9.3 21.4 30.7 Gas Storage (3.7) - (3.7) - (3.7) (5.3) - (5.3) - (5.3) Gas Production 19.3 - 19.3 - 19.3 4.5 - 4.5 - 4.5
2.3 (22.7) (20.4) (477.0) (497.4) 159.9 (20.1) 139.8 29.3 169.1 Corporate unallocated
(1.0) - (1.0) (67.1) (68.1) 0.9 - 0.9 - 0.9
Total continuing operations
448.3 (70.7) 377.6 (542.9) (165.3) 593.3 (67.8) 525.5 31.0 556.5
(i) The adjusted operating profit of the Group is reported after removal of the Group’s share of interest, fair value movements on financing derivatives and tax
from joint ventures and associates and after adjusting for exceptional items and certain re-measurements (note 6). The share of Scotia Gas Networks
Limited interest includes loan stock interest payable to the consortium shareholders. The Group has accounted for its 33% share of this, £4.7m (2017: £7.7m, March 2018: £15.2m), as finance income (note 7).
(ii) The adoption of IFRS 15 has resulted in a reduction in the depreciation expense recognised in the period. Under historic accounting policies, accelerated
depreciation charges were recognised on customer contributions. These contributed assets are now depreciated over the life of the asset.
Year ended 31 March 2018
Adjusted operating
profit/(loss) reported to the
Board
Joint Venture/ Associate share of interest and
tax (i)
Before exceptional
items and certain re-
measurements
Exceptional items and certain re-
measurements Total £m £m £m £m £m Continuing operations Networks
Electricity Distribution 402.2 - 402.2 - 402.2 Electricity Transmission 195.6 - 195.6 - 195.6 Gas Distribution 165.3 (96.2) 69.1 2.7 71.8
763.1 (96.2) 666.9 2.7 669.6 Retail
Business Energy 64.2 - 64.2 - 64.2 Airtricity 33.0 - 33.0 (6.1) 26.9 Enterprise 26.9 - 26.9 (11.8) 15.1
124.1 - 124.1 (17.9) 106.2 Wholesale
Electricity Generation 578.9 (52.3) 526.6 (3.2) 523.4 EPM 46.0 - 46.0 (89.1) (43.1) Gas Storage (6.5) - (6.5) - (6.5) Gas Production 34.0 - 34.0 (104.7) (70.7)
652.4 (52.3) 600.1 (197.0) 403.1 Corporate unallocated 10.4 (1.3) 9.1 (30.6) (21.5)
Total continuing operations 1,550.0 (149.8) 1,400.2 (242.8) 1,157.4
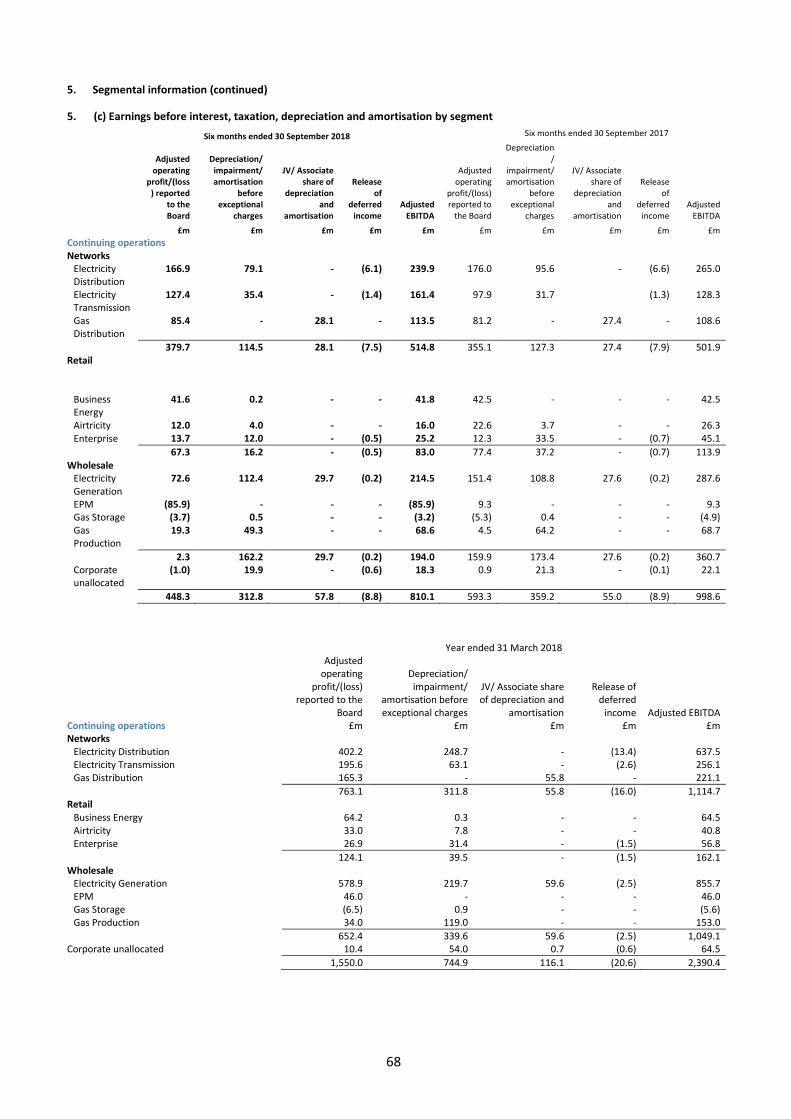
68
5. Segmental information (continued)
5. (c) Earnings before interest, taxation, depreciation and amortisation by segment
Six months ended 30 September 2018 Six months ended 30 September 2017
Adjusted operating
profit/(loss) reported
to the Board
Depreciation/ impairment/ amortisation
before exceptional
charges
JV/ Associate share of
depreciation and
amortisation
Release of
deferred income
Adjusted EBITDA
Adjusted operating
profit/(loss) reported to
the Board
Depreciation/
impairment/ amortisation
before exceptional
charges
JV/ Associate share of
depreciation and
amortisation
Release of
deferred income
Adjusted EBITDA
£m £m £m £m £m £m £m £m £m £m
Continuing operations Networks
Electricity Distribution
166.9 79.1 - (6.1) 239.9 176.0 95.6 - (6.6) 265.0
Electricity Transmission
127.4 35.4 - (1.4) 161.4 97.9 31.7 (1.3) 128.3
Gas Distribution
85.4 - 28.1 - 113.5 81.2 - 27.4 - 108.6
379.7 114.5 28.1 (7.5) 514.8 355.1 127.3 27.4 (7.9) 501.9 Retail
Business Energy
41.6 0.2 - - 41.8 42.5 - - - 42.5
Airtricity 12.0 4.0 - - 16.0 22.6 3.7 - - 26.3 Enterprise 13.7 12.0 - (0.5) 25.2 12.3 33.5 - (0.7) 45.1
67.3 16.2 - (0.5) 83.0 77.4 37.2 - (0.7) 113.9 Wholesale
Electricity Generation
72.6 112.4 29.7 (0.2) 214.5 151.4 108.8 27.6 (0.2) 287.6
EPM (85.9) - - - (85.9) 9.3 - - - 9.3 Gas Storage (3.7) 0.5 - - (3.2) (5.3) 0.4 - - (4.9) Gas Production
19.3 49.3 - - 68.6 4.5 64.2 - - 68.7
2.3 162.2 29.7 (0.2) 194.0 159.9 173.4 27.6 (0.2) 360.7 Corporate unallocated
(1.0) 19.9 - (0.6) 18.3 0.9 21.3 - (0.1) 22.1
448.3 312.8 57.8 (8.8) 810.1 593.3 359.2 55.0 (8.9) 998.6
Year ended 31 March 2018
Adjusted operating
profit/(loss) reported to the
Board
Depreciation/ impairment/
amortisation before exceptional charges
JV/ Associate share of depreciation and
amortisation
Release of deferred
income Adjusted EBITDA Continuing operations £m £m £m £m £m Networks
Electricity Distribution 402.2 248.7 - (13.4) 637.5 Electricity Transmission 195.6 63.1 - (2.6) 256.1 Gas Distribution 165.3 - 55.8 - 221.1
763.1 311.8 55.8 (16.0) 1,114.7 Retail
Business Energy 64.2 0.3 - - 64.5 Airtricity 33.0 7.8 - - 40.8 Enterprise 26.9 31.4 - (1.5) 56.8
124.1 39.5 - (1.5) 162.1 Wholesale
Electricity Generation 578.9 219.7 59.6 (2.5) 855.7 EPM 46.0 - - - 46.0 Gas Storage (6.5) 0.9 - - (5.6) Gas Production 34.0 119.0 - - 153.0
652.4 339.6 59.6 (2.5) 1,049.1 Corporate unallocated 10.4 54.0 0.7 (0.6) 64.5
1,550.0 744.9 116.1 (20.6) 2,390.4
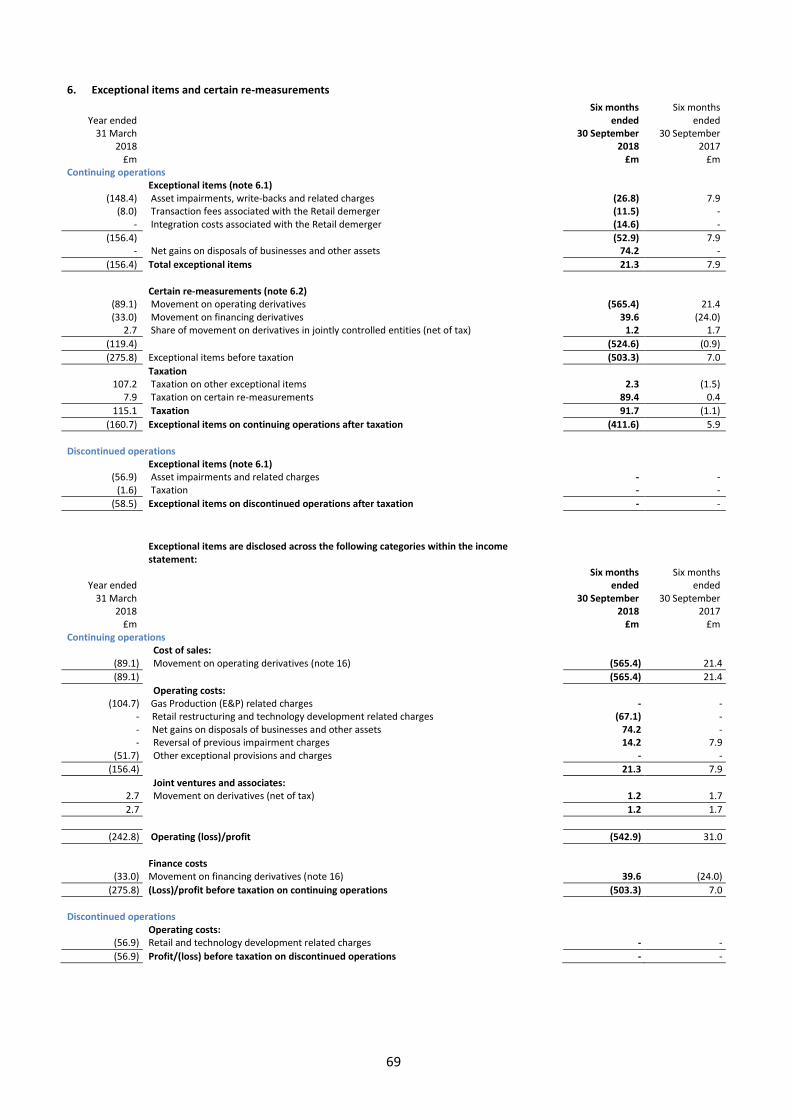
69
6. Exceptional items and certain re-measurements
Year ended
31 March 2018
£m
Six months ended
30 September 2018
£m
Six months ended
30 September 2017
£m Continuing operations
Exceptional items (note 6.1) (148.4) Asset impairments, write-backs and related charges (26.8) 7.9
(8.0) Transaction fees associated with the Retail demerger (11.5) - - Integration costs associated with the Retail demerger (14.6) -
(156.4) (52.9) 7.9 - Net gains on disposals of businesses and other assets 74.2 -
(156.4) Total exceptional items 21.3 7.9
Certain re-measurements (note 6.2)
(89.1) Movement on operating derivatives (565.4) 21.4 (33.0) Movement on financing derivatives 39.6 (24.0)
2.7 Share of movement on derivatives in jointly controlled entities (net of tax) 1.2 1.7
(119.4) (524.6) (0.9)
(275.8) Exceptional items before taxation (503.3) 7.0
Taxation 107.2 Taxation on other exceptional items 2.3 (1.5)
7.9 Taxation on certain re-measurements 89.4 0.4
115.1 Taxation 91.7 (1.1)
(160.7) Exceptional items on continuing operations after taxation (411.6) 5.9
Discontinued operations
Exceptional items (note 6.1) (56.9) Asset impairments and related charges - -
(1.6) Taxation - -
(58.5) Exceptional items on discontinued operations after taxation - -
Exceptional items are disclosed across the following categories within the income statement:
Year ended
31 March 2018
£m
Six months ended
30 September 2018
£m
Six months ended
30 September 2017
£m Continuing operations
Cost of sales: (89.1) Movement on operating derivatives (note 16) (565.4) 21.4
(89.1) (565.4) 21.4
Operating costs: (104.7) Gas Production (E&P) related charges - -
- Retail restructuring and technology development related charges (67.1) - - Net gains on disposals of businesses and other assets 74.2 - - Reversal of previous impairment charges 14.2 7.9
(51.7) Other exceptional provisions and charges - -
(156.4) 21.3 7.9
Joint ventures and associates: 2.7 Movement on derivatives (net of tax) 1.2 1.7
2.7 1.2 1.7
(242.8) Operating (loss)/profit (542.9) 31.0
Finance costs
(33.0) Movement on financing derivatives (note 16) 39.6 (24.0)
(275.8) (Loss)/profit before taxation on continuing operations (503.3) 7.0
Discontinued operations
Operating costs: (56.9) Retail and technology development related charges - -
(56.9) Profit/(loss) before taxation on discontinued operations - -
70
6. Exceptional items and certain re-measurements (continued)
6.1 Exceptional items
(i) Clyde gain on sale
On 30 May 2018, the Group’s joint venture partners Greencoat UK Wind plc and GLIL Infrastructure LLP exercised their right to purchase a further 14.9% equity stake in Clyde Windfarm (Scotland) Limited for consideration of £202.0m. The Group recognised an exceptional gain on sale of £74.2m in line with the Group’s accounting policy. SSE retains a 50.1% stake in the Company following the sale.
(ii) Reversal of previous Seagreen impairment
On 24 September 2018, the Group acquired a further 50% of Seagreen Wind Energy Limited (‘Seagreen’), taking its ownership to 100% and bringing Seagreen under full control of the Group. On completion of the acquisition, the Group reversed a previous impairment charge of £14.2m as there is renewed commitment to develop the project. The reversal of impairment, while not exceptional by size, has been recognised as an exceptional credit as it was originally charged within the 2013/14 impairment of SSE’s offshore wind portfolio, which was treated as exceptional at the time.
(iii) Retail costs
SSE has presented SSE Energy Services as held for disposal (see note 4.2(i)) and accordingly has recognised certain charges that will be incurred on completion. These charges are non-cash impairment charges of £41.0m to certain properties which will be sub-let to SSE Energy Services following completion where SSE has assessed that the income received through this contract will not support their current carrying value. This charge would not be recognised if those properties remained within the Group, as they continue to support operations of the Group while being utilised by SSE.
The Group has also incurred £26.1m of project costs including restructuring costs to separate IT systems and introduce physical separation between SSE and the SSE Energy Services in sites that will be used by both businesses.
Exceptional items recognised in the previous financial year
In the financial year ended 31 March 2018, a number of exceptional charges and credits were recognised as discussed below. Of these exceptional charges and credits only one was recognised in the six month period ended 30 September 2017, being the reversal of historic Dogger Bank impairment charges of £7.9m, following a renewed commitment to the project by the joint venture partners.
Gas production - The Group recognised net impairment charges of £104.7m related to its North Sea gas production assets following an increase in projected costs in certain fields and revised assessment of hydrocarbon reserves. An exceptional charge of £104.2m was recognised on the Greater Laggan fields following a reduction in the independently assessed quantity of proven and probable (2P) hydrocarbon reserves and increased forecast production costs. In addition, an impairment charge of £19.3m was recognised in relation to the Bacton field assets due to a reassessment of hydrocarbon reserves. Offsetting these impairment charges was an exceptional credit of £18.8m reversing previous impairments on the ECA field following an increase to estimated hydrocarbon reserves.
Retail and other technology developments – In the year ended 31 March 2018 the Group undertook an internal restructuring exercise following the announcement on 8 November 2018 that it plans to demerge its UK domestic supply business. That restructuring, which was concluded on 1 April 2018, necessitated a detailed impairment assessment to ensure that a new demerged Retail business would contain assets that would be utilised in its post-demerger operations. This review resulted in £29.3m of impairments of discontinued software development cost related to the Group’s previous Retail strategic investment in transformation, and a further £33.7m of charges in relation to Retail related software developments and programmes within the Group’s central service company and other subsidiaries. As part of its preparation for the proposed demerger, the Group also incurred £11.8m of exceptional transaction-related costs in the year to 31 March 2018.
Other – The Group disposed of its 1.8% shareholding in Faroe Petroleum Limited for cash consideration of £4.0m, crystallising £7.2m of losses on disposal, and disposed of its 15% shareholding in Burntisland Fabrication Limited (‘BIFAB’) for consideration of £1. The sale of shareholding in BIFAB resulted in an exceptional charge of £16.5m, including £10.0m of losses previously recognised in the statement of other comprehensive income. The Group also recognised an impairment charge of £15.6m on its Barkip anaerobic digestion plant following experience of operational issues and assessment of future economic prospects. Finally, the Group recognised combined charges of £11.8m in its Enterprise Utilities business following detailed review and assessment of the assets and contracts in its Heat Network portfolio.
6.2 Certain re-measurements
The Group EPM function enters into forward commodity purchase (and sales) contracts to meet the future demand requirements of its domestic and business energy supply operating units and to optimise the value of its Generation and other Wholesale assets. Certain of these contracts are determined to be derivative financial instruments under IFRS 9 and as such are required to be recorded at their fair value. Changes in the fair value of those commodity contracts designated as IFRS 9 financial instruments are reflected in the income statement (as part of ‘certain re-measurements’). The Group shows the change in the fair value of these forward contracts separately as this mark-to-market movement is not relevant to the underlying performance of its operating segments. The Group will recognise the underlying value of these contracts as the relevant commodity is delivered, which will predominately be within the subsequent 12 to 30 months. Conversely, commodity contracts that are not financial instruments under IFRS 9 are accounted for as ‘own use’ contracts. The re-measurements arising from IFRS 9 are disclosed separately to aid understanding of the underlying performance of the Group. This category also includes income statement movement on financing derivatives (and hedged items) as described in Note 16.
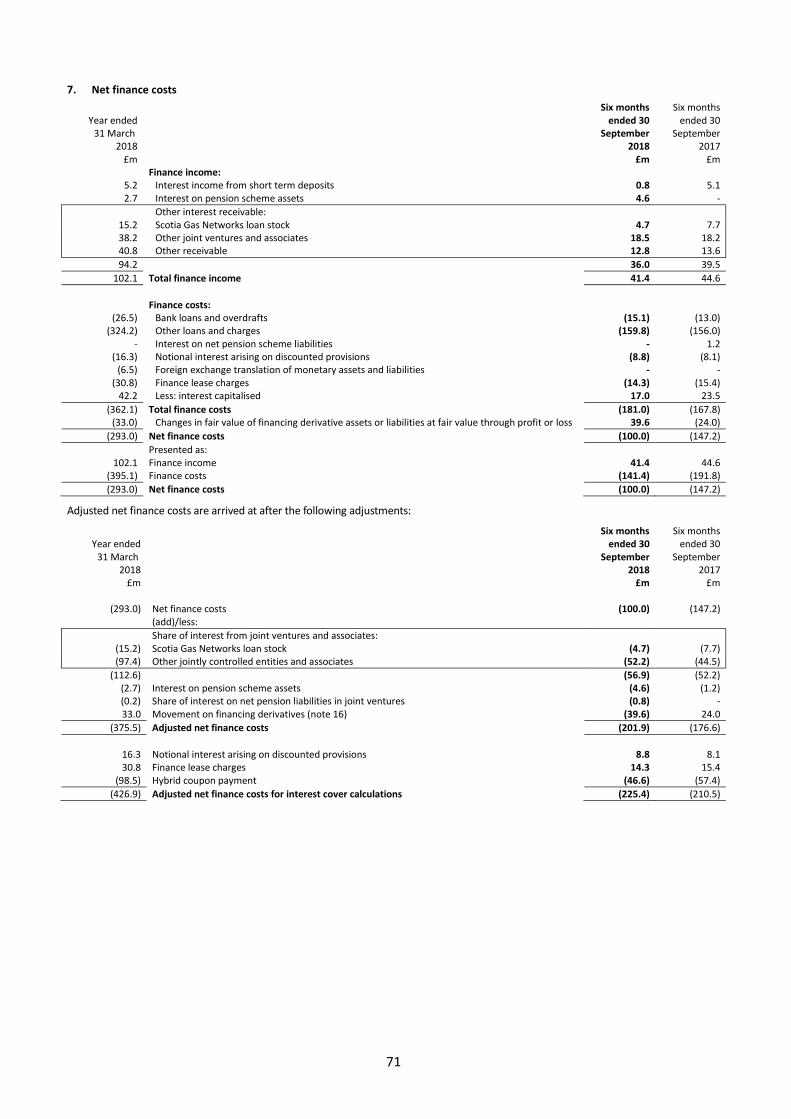
71
7. Net finance costs
Year ended 31 March
2018
Six months ended 30
September 2018
Six months ended 30
September 2017
£m £m £m Finance income:
5.2 Interest income from short term deposits 0.8 5.1 2.7 Interest on pension scheme assets 4.6 -
Other interest receivable: 15.2 Scotia Gas Networks loan stock 4.7 7.7 38.2 Other joint ventures and associates 18.5 18.2 40.8 Other receivable 12.8 13.6
94.2 36.0 39.5
102.1 Total finance income 41.4 44.6
Finance costs:
(26.5) Bank loans and overdrafts (15.1) (13.0) (324.2) Other loans and charges (159.8) (156.0)
- Interest on net pension scheme liabilities - 1.2 (16.3) Notional interest arising on discounted provisions (8.8) (8.1)
(6.5) Foreign exchange translation of monetary assets and liabilities - - (30.8) Finance lease charges (14.3) (15.4)
42.2 Less: interest capitalised 17.0 23.5
(362.1) Total finance costs (181.0) (167.8) (33.0) Changes in fair value of financing derivative assets or liabilities at fair value through profit or loss 39.6 (24.0)
(293.0) Net finance costs (100.0) (147.2)
Presented as: 102.1 Finance income 41.4 44.6
(395.1) Finance costs (141.4) (191.8)
(293.0) Net finance costs (100.0) (147.2)
Adjusted net finance costs are arrived at after the following adjustments:
Year ended 31 March
2018
Six months ended 30
September 2018
Six months ended 30
September 2017
£m £m £m
(293.0) Net finance costs (100.0) (147.2) (add)/less:
Share of interest from joint ventures and associates: (15.2) Scotia Gas Networks loan stock (4.7) (7.7) (97.4) Other jointly controlled entities and associates (52.2) (44.5)
(112.6) (56.9) (52.2) (2.7) Interest on pension scheme assets (4.6) (1.2) (0.2) Share of interest on net pension liabilities in joint ventures (0.8) - 33.0 Movement on financing derivatives (note 16) (39.6) 24.0
(375.5) Adjusted net finance costs (201.9) (176.6)
16.3 Notional interest arising on discounted provisions 8.8 8.1 30.8 Finance lease charges 14.3 15.4
(98.5) Hybrid coupon payment (46.6) (57.4)
(426.9) Adjusted net finance costs for interest cover calculations (225.4) (210.5)
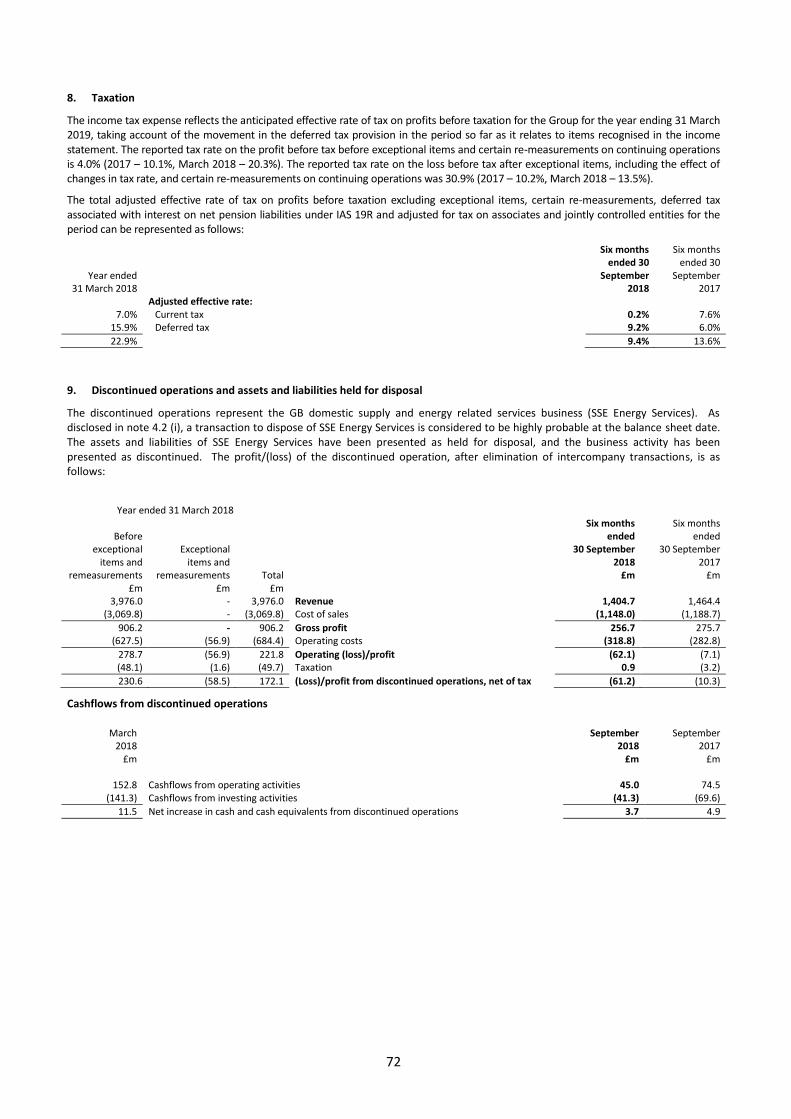
72
8. Taxation
The income tax expense reflects the anticipated effective rate of tax on profits before taxation for the Group for the year ending 31 March 2019, taking account of the movement in the deferred tax provision in the period so far as it relates to items recognised in the income statement. The reported tax rate on the profit before tax before exceptional items and certain re-measurements on continuing operations is 4.0% (2017 – 10.1%, March 2018 – 20.3%). The reported tax rate on the loss before tax after exceptional items, including the effect of changes in tax rate, and certain re-measurements on continuing operations was 30.9% (2017 – 10.2%, March 2018 – 13.5%).
The total adjusted effective rate of tax on profits before taxation excluding exceptional items, certain re-measurements, deferred tax associated with interest on net pension liabilities under IAS 19R and adjusted for tax on associates and jointly controlled entities for the period can be represented as follows:
Year ended 31 March 2018
Six months ended 30
September 2018
Six months ended 30
September 2017
Adjusted effective rate: 7.0% Current tax 0.2% 7.6%
15.9% Deferred tax 9.2% 6.0%
22.9% 9.4% 13.6%
9. Discontinued operations and assets and liabilities held for disposal
The discontinued operations represent the GB domestic supply and energy related services business (SSE Energy Services). As disclosed in note 4.2 (i), a transaction to dispose of SSE Energy Services is considered to be highly probable at the balance sheet date. The assets and liabilities of SSE Energy Services have been presented as held for disposal, and the business activity has been presented as discontinued. The profit/(loss) of the discontinued operation, after elimination of intercompany transactions, is as follows:
Year ended 31 March 2018
Before exceptional
items and remeasurements
Exceptional items and
remeasurements Total
Six months ended
30 September 2018
£m
Six months ended
30 September 2017
£m £m £m £m
3,976.0 - 3,976.0 Revenue 1,404.7 1,464.4 (3,069.8) - (3,069.8) Cost of sales (1,148.0) (1,188.7)
906.2 - 906.2 Gross profit 256.7 275.7 (627.5) (56.9) (684.4) Operating costs (318.8) (282.8)
278.7 (56.9) 221.8 Operating (loss)/profit (62.1) (7.1) (48.1) (1.6) (49.7) Taxation 0.9 (3.2)
230.6 (58.5) 172.1 (Loss)/profit from discontinued operations, net of tax (61.2) (10.3)
Cashflows from discontinued operations
March
2018 £m
September 2018
£m
September 2017
£m
152.8 Cashflows from operating activities 45.0 74.5 (141.3) Cashflows from investing activities (41.3) (69.6)
11.5 Net increase in cash and cash equivalents from discontinued operations 3.7 4.9
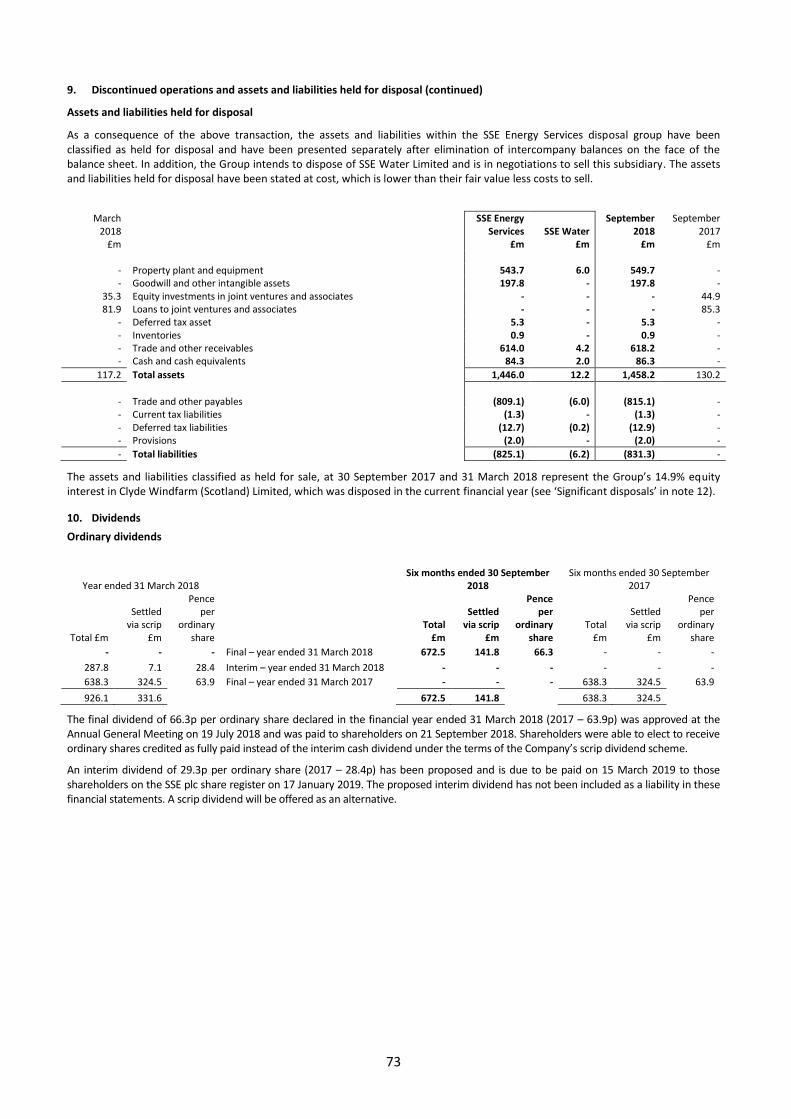
73
9. Discontinued operations and assets and liabilities held for disposal (continued)
Assets and liabilities held for disposal
As a consequence of the above transaction, the assets and liabilities within the SSE Energy Services disposal group have been classified as held for disposal and have been presented separately after elimination of intercompany balances on the face of the balance sheet. In addition, the Group intends to dispose of SSE Water Limited and is in negotiations to sell this subsidiary. The assets and liabilities held for disposal have been stated at cost, which is lower than their fair value less costs to sell.
March 2018
£m
SSE Energy Services
£m SSE Water
£m
September 2018
£m
September 2017
£m
- Property plant and equipment 543.7 6.0 549.7 - - Goodwill and other intangible assets 197.8 - 197.8 -
35.3 Equity investments in joint ventures and associates - - - 44.9 81.9 Loans to joint ventures and associates - - - 85.3
- Deferred tax asset 5.3 - 5.3 - - Inventories 0.9 - 0.9 - - Trade and other receivables 614.0 4.2 618.2 - - Cash and cash equivalents 84.3 2.0 86.3 -
117.2 Total assets 1,446.0 12.2 1,458.2 130.2
- Trade and other payables (809.1) (6.0) (815.1) - - Current tax liabilities (1.3) - (1.3) - - Deferred tax liabilities (12.7) (0.2) (12.9) - - Provisions (2.0) - (2.0) -
- Total liabilities (825.1) (6.2) (831.3) -
The assets and liabilities classified as held for sale, at 30 September 2017 and 31 March 2018 represent the Group’s 14.9% equity interest in Clyde Windfarm (Scotland) Limited, which was disposed in the current financial year (see ‘Significant disposals’ in note 12).
10. Dividends
Ordinary dividends
Year ended 31 March 2018 Six months ended 30 September
2018 Six months ended 30 September
2017
Total £m
Settled via scrip
£m
Pence per
ordinary share
Total £m
Settled via scrip
£m
Pence per
ordinary share
Total £m
Settled via scrip
£m
Pence per
ordinary share
- - - Final – year ended 31 March 2018 672.5 141.8 66.3 - - -
287.8 7.1 28.4 Interim – year ended 31 March 2018 - - - - - -
638.3 324.5 63.9 Final – year ended 31 March 2017 - - - 638.3 324.5 63.9
926.1 331.6 672.5 141.8 638.3 324.5
The final dividend of 66.3p per ordinary share declared in the financial year ended 31 March 2018 (2017 – 63.9p) was approved at the Annual General Meeting on 19 July 2018 and was paid to shareholders on 21 September 2018. Shareholders were able to elect to receive ordinary shares credited as fully paid instead of the interim cash dividend under the terms of the Company’s scrip dividend scheme.
An interim dividend of 29.3p per ordinary share (2017 – 28.4p) has been proposed and is due to be paid on 15 March 2019 to those shareholders on the SSE plc share register on 17 January 2019. The proposed interim dividend has not been included as a liability in these financial statements. A scrip dividend will be offered as an alternative.
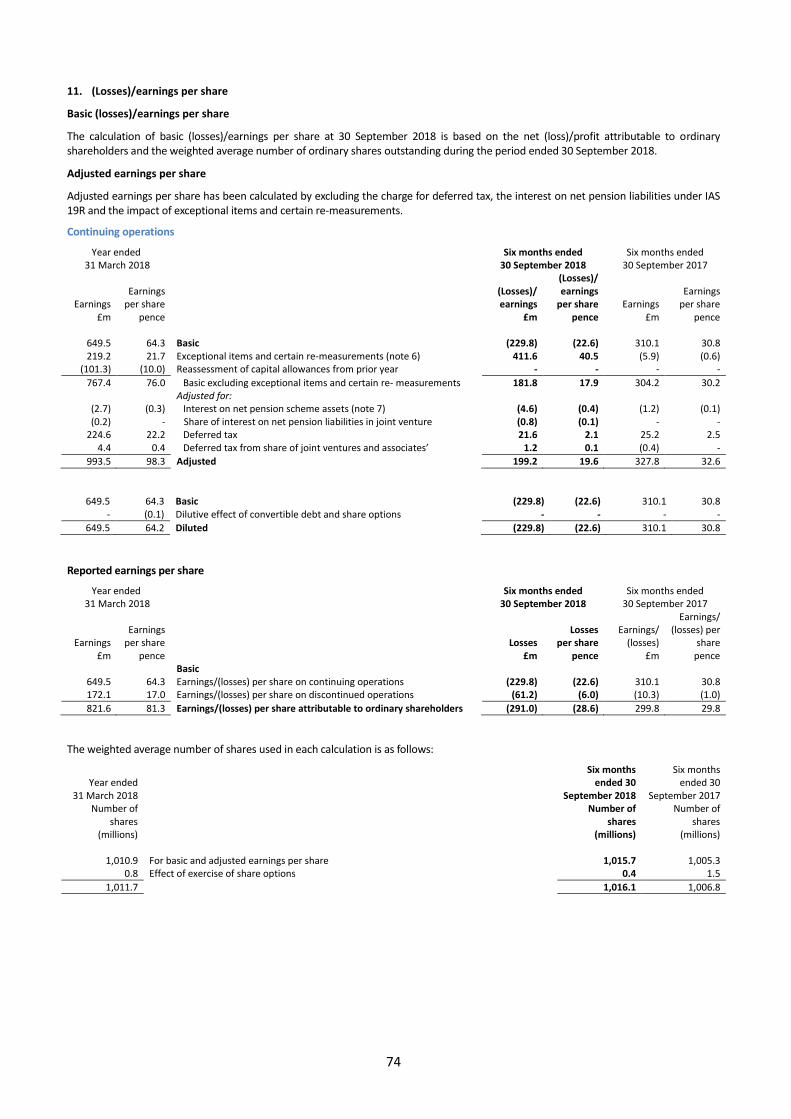
74
11. (Losses)/earnings per share
Basic (losses)/earnings per share
The calculation of basic (losses)/earnings per share at 30 September 2018 is based on the net (loss)/profit attributable to ordinary shareholders and the weighted average number of ordinary shares outstanding during the period ended 30 September 2018.
Adjusted earnings per share
Adjusted earnings per share has been calculated by excluding the charge for deferred tax, the interest on net pension liabilities under IAS 19R and the impact of exceptional items and certain re-measurements.
Continuing operations
Year ended 31 March 2018
Six months ended 30 September 2018
Six months ended 30 September 2017
Earnings £m
Earnings per share
pence
(Losses)/ earnings
£m
(Losses)/ earnings
per share pence
Earnings £m
Earnings per share
pence
649.5 64.3 Basic (229.8) (22.6) 310.1 30.8 219.2 21.7 Exceptional items and certain re-measurements (note 6) 411.6 40.5 (5.9) (0.6)
(101.3) (10.0) Reassessment of capital allowances from prior year - - - -
767.4 76.0 Basic excluding exceptional items and certain re- measurements 181.8 17.9 304.2 30.2 Adjusted for:
(2.7) (0.3) Interest on net pension scheme assets (note 7) (4.6) (0.4) (1.2) (0.1) (0.2) - Share of interest on net pension liabilities in joint venture (0.8) (0.1) - -
224.6 22.2 Deferred tax 21.6 2.1 25.2 2.5 4.4 0.4 Deferred tax from share of joint ventures and associates’ 1.2 0.1 (0.4) -
993.5 98.3 Adjusted 199.2 19.6 327.8 32.6
649.5 64.3 Basic (229.8) (22.6) 310.1 30.8 - (0.1) Dilutive effect of convertible debt and share options - - - -
649.5 64.2 Diluted (229.8) (22.6) 310.1 30.8
Reported earnings per share
Year ended 31 March 2018
Six months ended 30 September 2018
Six months ended 30 September 2017
Earnings £m
Earnings per share
pence Losses
£m
Losses per share
pence
Earnings/ (losses)
£m
Earnings/ (losses) per
share pence
Basic 649.5 64.3 Earnings/(losses) per share on continuing operations (229.8) (22.6) 310.1 30.8 172.1 17.0 Earnings/(losses) per share on discontinued operations (61.2) (6.0) (10.3) (1.0)
821.6 81.3 Earnings/(losses) per share attributable to ordinary shareholders (291.0) (28.6) 299.8 29.8
The weighted average number of shares used in each calculation is as follows:
Year ended 31 March 2018
Number of shares
(millions)
Six months ended 30
September 2018 Number of
shares (millions)
Six months ended 30
September 2017 Number of
shares (millions)
1,010.9 For basic and adjusted earnings per share 1,015.7 1,005.3
0.8 Effect of exercise of share options 0.4 1.5
1,011.7 1,016.1 1,006.8
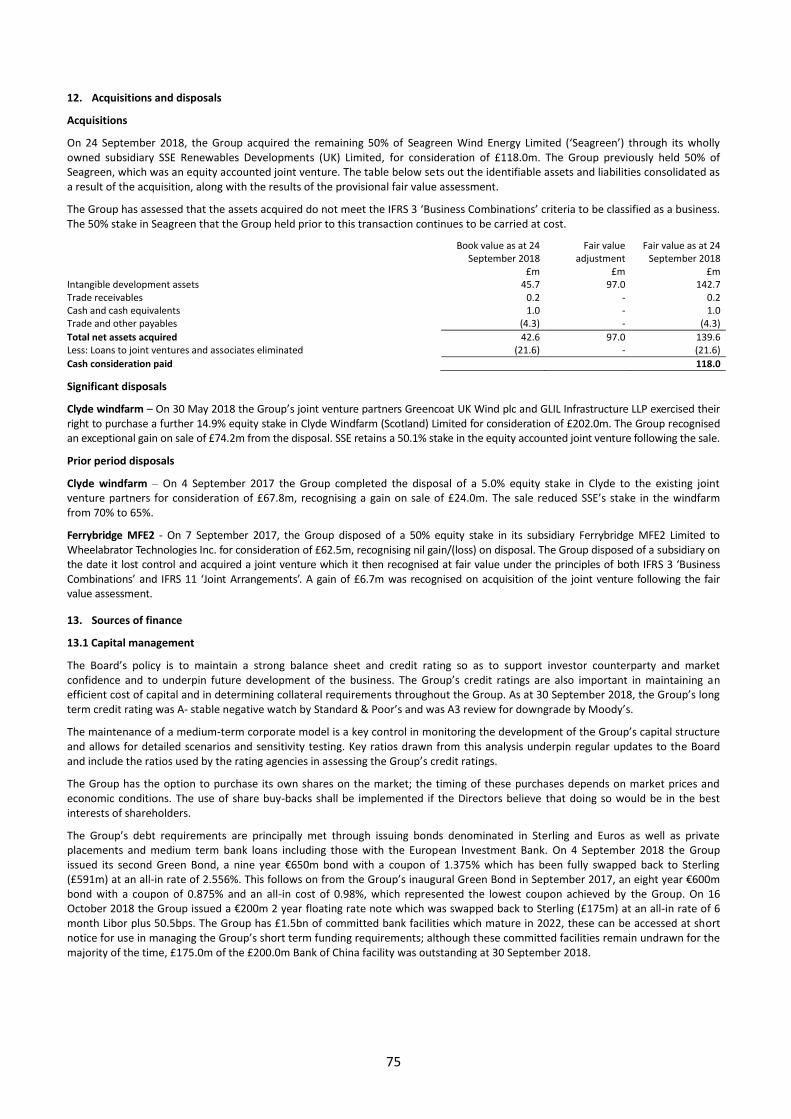
75
12. Acquisitions and disposals
Acquisitions
On 24 September 2018, the Group acquired the remaining 50% of Seagreen Wind Energy Limited (‘Seagreen’) through its wholly owned subsidiary SSE Renewables Developments (UK) Limited, for consideration of £118.0m. The Group previously held 50% of Seagreen, which was an equity accounted joint venture. The table below sets out the identifiable assets and liabilities consolidated as a result of the acquisition, along with the results of the provisional fair value assessment.
The Group has assessed that the assets acquired do not meet the IFRS 3 ‘Business Combinations’ criteria to be classified as a business. The 50% stake in Seagreen that the Group held prior to this transaction continues to be carried at cost.
Book value as at 24
September 2018 Fair value
adjustment Fair value as at 24
September 2018 £m £m £m Intangible development assets 45.7 97.0 142.7 Trade receivables 0.2 - 0.2 Cash and cash equivalents 1.0 - 1.0 Trade and other payables (4.3) - (4.3)
Total net assets acquired 42.6 97.0 139.6 Less: Loans to joint ventures and associates eliminated (21.6) - (21.6)
Cash consideration paid 118.0
Significant disposals
Clyde windfarm – On 30 May 2018 the Group’s joint venture partners Greencoat UK Wind plc and GLIL Infrastructure LLP exercised their right to purchase a further 14.9% equity stake in Clyde Windfarm (Scotland) Limited for consideration of £202.0m. The Group recognised an exceptional gain on sale of £74.2m from the disposal. SSE retains a 50.1% stake in the equity accounted joint venture following the sale.
Prior period disposals
Clyde windfarm – On 4 September 2017 the Group completed the disposal of a 5.0% equity stake in Clyde to the existing joint venture partners for consideration of £67.8m, recognising a gain on sale of £24.0m. The sale reduced SSE’s stake in the windfarm from 70% to 65%.
Ferrybridge MFE2 - On 7 September 2017, the Group disposed of a 50% equity stake in its subsidiary Ferrybridge MFE2 Limited to Wheelabrator Technologies Inc. for consideration of £62.5m, recognising nil gain/(loss) on disposal. The Group disposed of a subsidiary on the date it lost control and acquired a joint venture which it then recognised at fair value under the principles of both IFRS 3 ‘Business Combinations’ and IFRS 11 ‘Joint Arrangements’. A gain of £6.7m was recognised on acquisition of the joint venture following the fair value assessment.
13. Sources of finance
13.1 Capital management
The Board’s policy is to maintain a strong balance sheet and credit rating so as to support investor counterparty and market confidence and to underpin future development of the business. The Group’s credit ratings are also important in maintaining an efficient cost of capital and in determining collateral requirements throughout the Group. As at 30 September 2018, the Group’s long term credit rating was A- stable negative watch by Standard & Poor’s and was A3 review for downgrade by Moody’s.
The maintenance of a medium-term corporate model is a key control in monitoring the development of the Group’s capital structure and allows for detailed scenarios and sensitivity testing. Key ratios drawn from this analysis underpin regular updates to the Board and include the ratios used by the rating agencies in assessing the Group’s credit ratings.
The Group has the option to purchase its own shares on the market; the timing of these purchases depends on market prices and economic conditions. The use of share buy-backs shall be implemented if the Directors believe that doing so would be in the best interests of shareholders.
The Group’s debt requirements are principally met through issuing bonds denominated in Sterling and Euros as well as private placements and medium term bank loans including those with the European Investment Bank. On 4 September 2018 the Group issued its second Green Bond, a nine year €650m bond with a coupon of 1.375% which has been fully swapped back to Sterling (£591m) at an all-in rate of 2.556%. This follows on from the Group’s inaugural Green Bond in September 2017, an eight year €600m bond with a coupon of 0.875% and an all-in cost of 0.98%, which represented the lowest coupon achieved by the Group. On 16 October 2018 the Group issued a €200m 2 year floating rate note which was swapped back to Sterling (£175m) at an all-in rate of 6 month Libor plus 50.5bps. The Group has £1.5bn of committed bank facilities which mature in 2022, these can be accessed at short notice for use in managing the Group’s short term funding requirements; although these committed facilities remain undrawn for the majority of the time, £175.0m of the £200.0m Bank of China facility was outstanding at 30 September 2018.
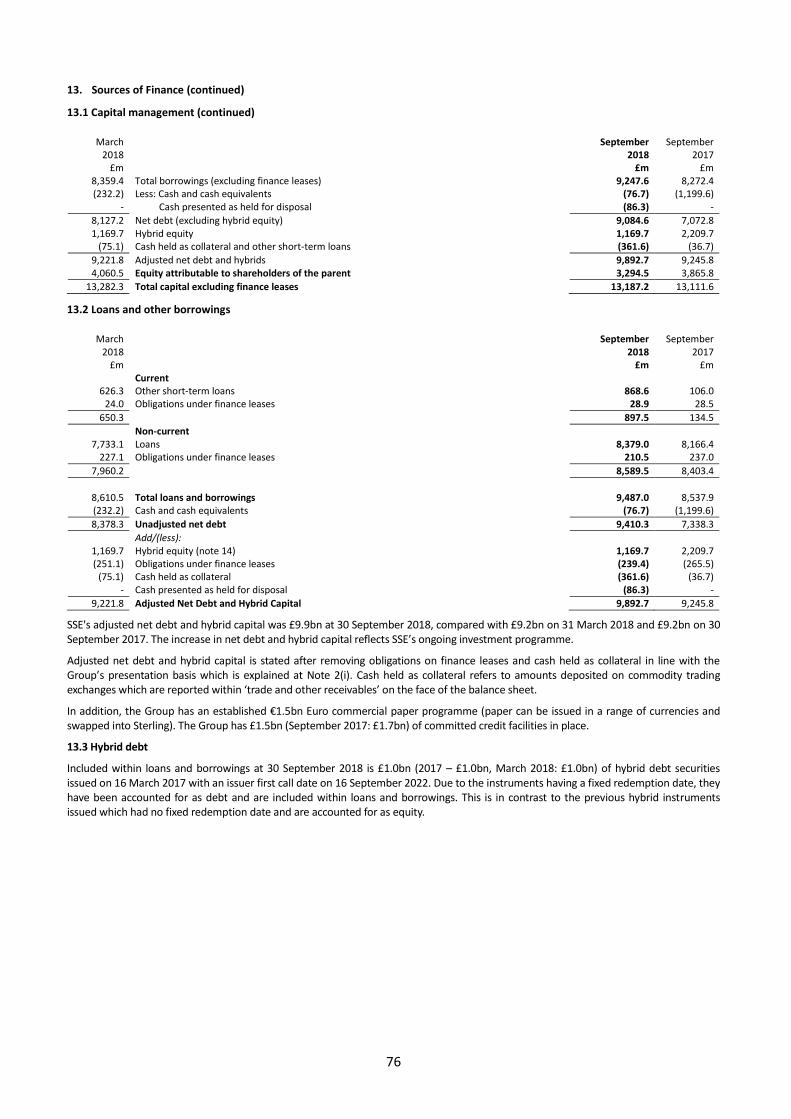
76
13. Sources of Finance (continued)
13.1 Capital management (continued)
March 2018
September 2018
September 2017
£m £m £m 8,359.4 Total borrowings (excluding finance leases) 9,247.6 8,272.4 (232.2) Less: Cash and cash equivalents (76.7) (1,199.6)
- Cash presented as held for disposal (86.3) -
8,127.2 Net debt (excluding hybrid equity) 9,084.6 7,072.8 1,169.7 Hybrid equity 1,169.7 2,209.7
(75.1) Cash held as collateral and other short-term loans (361.6) (36.7)
9,221.8 Adjusted net debt and hybrids 9,892.7 9,245.8 4,060.5 Equity attributable to shareholders of the parent 3,294.5 3,865.8
13,282.3 Total capital excluding finance leases 13,187.2 13,111.6
13.2 Loans and other borrowings
March 2018
September 2018
September 2017
£m £m £m Current
626.3 Other short-term loans 868.6 106.0 24.0 Obligations under finance leases 28.9 28.5
650.3 897.5 134.5
Non-current 7,733.1 Loans 8,379.0 8,166.4
227.1 Obligations under finance leases 210.5 237.0
7,960.2 8,589.5 8,403.4
8,610.5 Total loans and borrowings 9,487.0 8,537.9 (232.2) Cash and cash equivalents (76.7) (1,199.6)
8,378.3 Unadjusted net debt 9,410.3 7,338.3
Add/(less): 1,169.7 Hybrid equity (note 14) 1,169.7 2,209.7 (251.1) Obligations under finance leases (239.4) (265.5)
(75.1) Cash held as collateral (361.6) (36.7) - Cash presented as held for disposal (86.3) -
9,221.8 Adjusted Net Debt and Hybrid Capital 9,892.7 9,245.8
SSE's adjusted net debt and hybrid capital was £9.9bn at 30 September 2018, compared with £9.2bn on 31 March 2018 and £9.2bn on 30 September 2017. The increase in net debt and hybrid capital reflects SSE’s ongoing investment programme.
Adjusted net debt and hybrid capital is stated after removing obligations on finance leases and cash held as collateral in line with the Group’s presentation basis which is explained at Note 2(i). Cash held as collateral refers to amounts deposited on commodity trading exchanges which are reported within ‘trade and other receivables’ on the face of the balance sheet.
In addition, the Group has an established €1.5bn Euro commercial paper programme (paper can be issued in a range of currencies and swapped into Sterling). The Group has £1.5bn (September 2017: £1.7bn) of committed credit facilities in place.
13.3 Hybrid debt
Included within loans and borrowings at 30 September 2018 is £1.0bn (2017 – £1.0bn, March 2018: £1.0bn) of hybrid debt securities issued on 16 March 2017 with an issuer first call date on 16 September 2022. Due to the instruments having a fixed redemption date, they have been accounted for as debt and are included within loans and borrowings. This is in contrast to the previous hybrid instruments issued which had no fixed redemption date and are accounted for as equity.
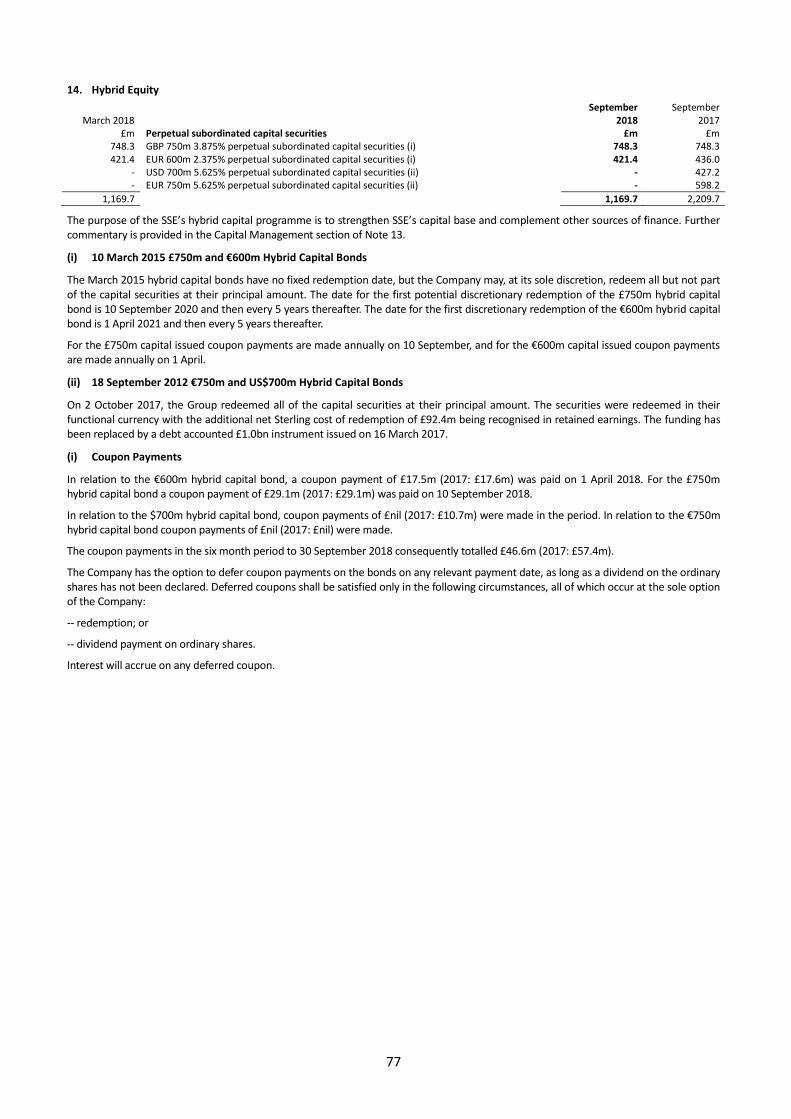
77
14. Hybrid Equity
March 2018 September
2018 September
2017 £m Perpetual subordinated capital securities £m £m
748.3 GBP 750m 3.875% perpetual subordinated capital securities (i) 748.3 748.3 421.4 EUR 600m 2.375% perpetual subordinated capital securities (i) 421.4 436.0
- USD 700m 5.625% perpetual subordinated capital securities (ii) - 427.2 - EUR 750m 5.625% perpetual subordinated capital securities (ii) - 598.2
1,169.7 1,169.7 2,209.7
The purpose of the SSE’s hybrid capital programme is to strengthen SSE’s capital base and complement other sources of finance. Further commentary is provided in the Capital Management section of Note 13.
(i) 10 March 2015 £750m and €600m Hybrid Capital Bonds
The March 2015 hybrid capital bonds have no fixed redemption date, but the Company may, at its sole discretion, redeem all but not part of the capital securities at their principal amount. The date for the first potential discretionary redemption of the £750m hybrid capital bond is 10 September 2020 and then every 5 years thereafter. The date for the first discretionary redemption of the €600m hybrid capital bond is 1 April 2021 and then every 5 years thereafter.
For the £750m capital issued coupon payments are made annually on 10 September, and for the €600m capital issued coupon payments are made annually on 1 April.
(ii) 18 September 2012 €750m and US$700m Hybrid Capital Bonds
On 2 October 2017, the Group redeemed all of the capital securities at their principal amount. The securities were redeemed in their functional currency with the additional net Sterling cost of redemption of £92.4m being recognised in retained earnings. The funding has been replaced by a debt accounted £1.0bn instrument issued on 16 March 2017.
(i) Coupon Payments
In relation to the €600m hybrid capital bond, a coupon payment of £17.5m (2017: £17.6m) was paid on 1 April 2018. For the £750m hybrid capital bond a coupon payment of £29.1m (2017: £29.1m) was paid on 10 September 2018.
In relation to the $700m hybrid capital bond, coupon payments of £nil (2017: £10.7m) were made in the period. In relation to the €750m hybrid capital bond coupon payments of £nil (2017: £nil) were made.
The coupon payments in the six month period to 30 September 2018 consequently totalled £46.6m (2017: £57.4m).
The Company has the option to defer coupon payments on the bonds on any relevant payment date, as long as a dividend on the ordinary shares has not been declared. Deferred coupons shall be satisfied only in the following circumstances, all of which occur at the sole option of the Company:
-- redemption; or
-- dividend payment on ordinary shares.
Interest will accrue on any deferred coupon.
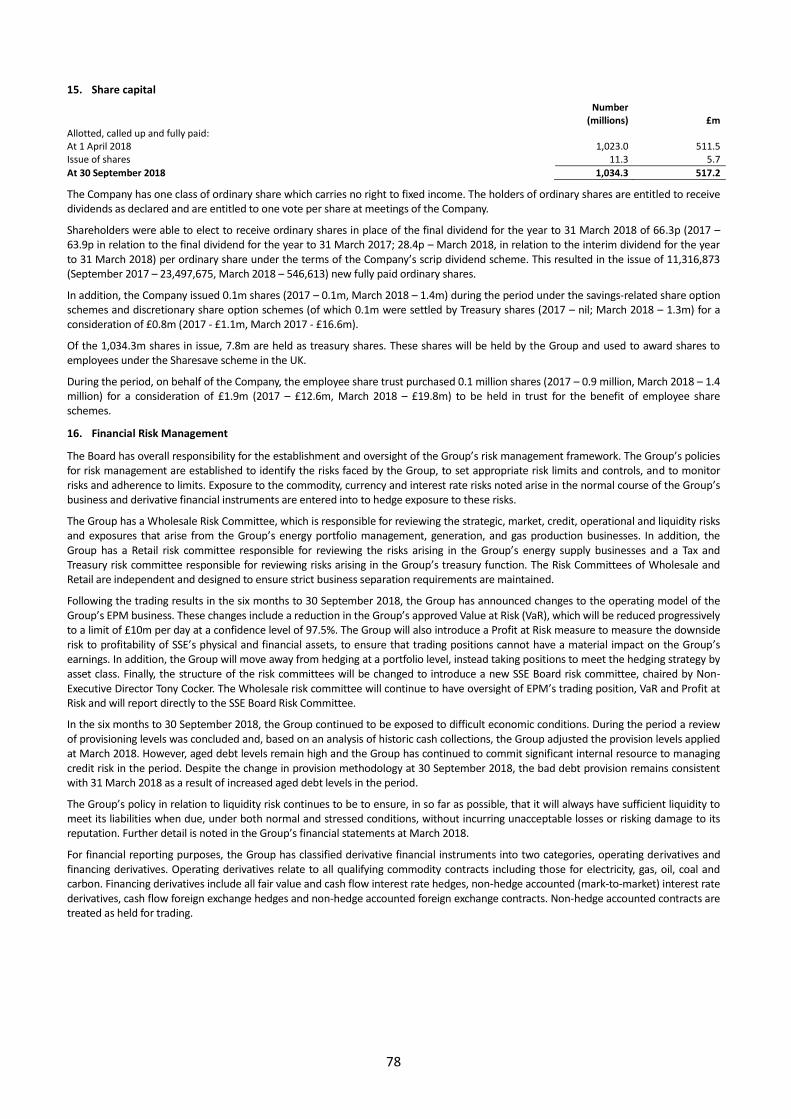
78
15. Share capital
Number
(millions) £m Allotted, called up and fully paid: At 1 April 2018 1,023.0 511.5 Issue of shares 11.3 5.7
At 30 September 2018 1,034.3 517.2
The Company has one class of ordinary share which carries no right to fixed income. The holders of ordinary shares are entitled to receive dividends as declared and are entitled to one vote per share at meetings of the Company.
Shareholders were able to elect to receive ordinary shares in place of the final dividend for the year to 31 March 2018 of 66.3p (2017 – 63.9p in relation to the final dividend for the year to 31 March 2017; 28.4p – March 2018, in relation to the interim dividend for the year to 31 March 2018) per ordinary share under the terms of the Company’s scrip dividend scheme. This resulted in the issue of 11,316,873 (September 2017 – 23,497,675, March 2018 – 546,613) new fully paid ordinary shares.
In addition, the Company issued 0.1m shares (2017 – 0.1m, March 2018 – 1.4m) during the period under the savings-related share option schemes and discretionary share option schemes (of which 0.1m were settled by Treasury shares (2017 – nil; March 2018 – 1.3m) for a consideration of £0.8m (2017 - £1.1m, March 2017 - £16.6m).
Of the 1,034.3m shares in issue, 7.8m are held as treasury shares. These shares will be held by the Group and used to award shares to employees under the Sharesave scheme in the UK.
During the period, on behalf of the Company, the employee share trust purchased 0.1 million shares (2017 – 0.9 million, March 2018 – 1.4 million) for a consideration of £1.9m (2017 – £12.6m, March 2018 – £19.8m) to be held in trust for the benefit of employee share schemes.
16. Financial Risk Management
The Board has overall responsibility for the establishment and oversight of the Group’s risk management framework. The Group’s policies for risk management are established to identify the risks faced by the Group, to set appropriate risk limits and controls, and to monitor risks and adherence to limits. Exposure to the commodity, currency and interest rate risks noted arise in the normal course of the Group’s business and derivative financial instruments are entered into to hedge exposure to these risks.
The Group has a Wholesale Risk Committee, which is responsible for reviewing the strategic, market, credit, operational and liquidity risks and exposures that arise from the Group’s energy portfolio management, generation, and gas production businesses. In addition, the Group has a Retail risk committee responsible for reviewing the risks arising in the Group’s energy supply businesses and a Tax and Treasury risk committee responsible for reviewing risks arising in the Group’s treasury function. The Risk Committees of Wholesale and Retail are independent and designed to ensure strict business separation requirements are maintained.
Following the trading results in the six months to 30 September 2018, the Group has announced changes to the operating model of the Group’s EPM business. These changes include a reduction in the Group’s approved Value at Risk (VaR), which will be reduced progressively to a limit of £10m per day at a confidence level of 97.5%. The Group will also introduce a Profit at Risk measure to measure the downside risk to profitability of SSE’s physical and financial assets, to ensure that trading positions cannot have a material impact on the Group’s earnings. In addition, the Group will move away from hedging at a portfolio level, instead taking positions to meet the hedging strategy by asset class. Finally, the structure of the risk committees will be changed to introduce a new SSE Board risk committee, chaired by Non-Executive Director Tony Cocker. The Wholesale risk committee will continue to have oversight of EPM’s trading position, VaR and Profit at Risk and will report directly to the SSE Board Risk Committee.
In the six months to 30 September 2018, the Group continued to be exposed to difficult economic conditions. During the period a review of provisioning levels was concluded and, based on an analysis of historic cash collections, the Group adjusted the provision levels applied at March 2018. However, aged debt levels remain high and the Group has continued to commit significant internal resource to managing credit risk in the period. Despite the change in provision methodology at 30 September 2018, the bad debt provision remains consistent with 31 March 2018 as a result of increased aged debt levels in the period.
The Group’s policy in relation to liquidity risk continues to be to ensure, in so far as possible, that it will always have sufficient liquidity to meet its liabilities when due, under both normal and stressed conditions, without incurring unacceptable losses or risking damage to its reputation. Further detail is noted in the Group’s financial statements at March 2018.
For financial reporting purposes, the Group has classified derivative financial instruments into two categories, operating derivatives and financing derivatives. Operating derivatives relate to all qualifying commodity contracts including those for electricity, gas, oil, coal and carbon. Financing derivatives include all fair value and cash flow interest rate hedges, non-hedge accounted (mark-to-market) interest rate derivatives, cash flow foreign exchange hedges and non-hedge accounted foreign exchange contracts. Non-hedge accounted contracts are treated as held for trading.
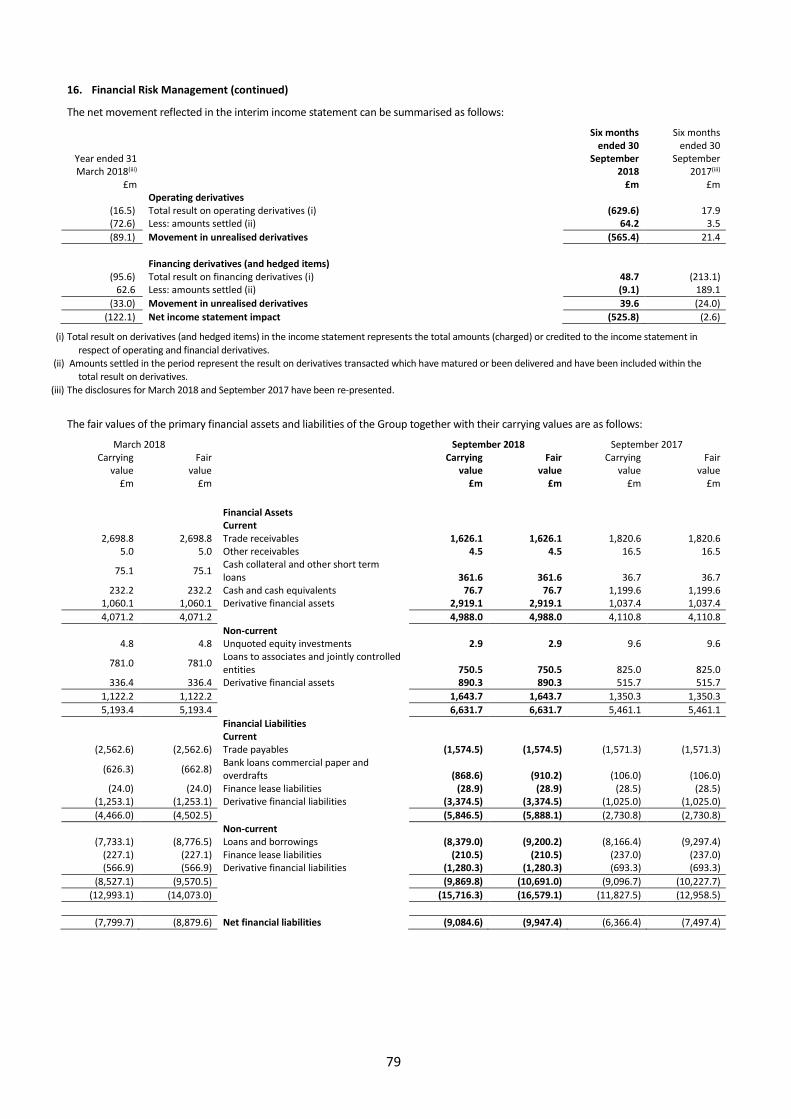
79
16. Financial Risk Management (continued)
The net movement reflected in the interim income statement can be summarised as follows:
Year ended 31 March 2018(iii)
£m
Six months ended 30
September 2018
£m
Six months ended 30
September 2017(iii)
£m Operating derivatives
(16.5) Total result on operating derivatives (i) (629.6) 17.9 (72.6) Less: amounts settled (ii) 64.2 3.5
(89.1) Movement in unrealised derivatives (565.4) 21.4
Financing derivatives (and hedged items)
(95.6) Total result on financing derivatives (i) 48.7 (213.1) 62.6 Less: amounts settled (ii) (9.1) 189.1
(33.0) Movement in unrealised derivatives 39.6 (24.0)
(122.1) Net income statement impact (525.8) (2.6)
(i) Total result on derivatives (and hedged items) in the income statement represents the total amounts (charged) or credited to the income statement in
respect of operating and financial derivatives. (ii) Amounts settled in the period represent the result on derivatives transacted which have matured or been delivered and have been included within the
total result on derivatives.
(iii) The disclosures for March 2018 and September 2017 have been re-presented.
The fair values of the primary financial assets and liabilities of the Group together with their carrying values are as follows:
March 2018 September 2018 September 2017 Carrying
value £m
Fair value
£m
Carrying value
£m
Fair value
£m
Carrying value
£m
Fair value
£m
Financial Assets
Current 2,698.8 2,698.8 Trade receivables 1,626.1 1,626.1 1,820.6 1,820.6
5.0 5.0 Other receivables 4.5 4.5 16.5 16.5
75.1 75.1 Cash collateral and other short term loans 361.6 361.6 36.7 36.7
232.2 232.2 Cash and cash equivalents 76.7 76.7 1,199.6 1,199.6 1,060.1 1,060.1 Derivative financial assets 2,919.1 2,919.1 1,037.4 1,037.4
4,071.2 4,071.2 4,988.0 4,988.0 4,110.8 4,110.8
Non-current 4.8 4.8 Unquoted equity investments 2.9 2.9 9.6 9.6
781.0 781.0 Loans to associates and jointly controlled entities 750.5 750.5 825.0 825.0
336.4 336.4 Derivative financial assets 890.3 890.3 515.7 515.7
1,122.2 1,122.2 1,643.7 1,643.7 1,350.3 1,350.3
5,193.4 5,193.4 6,631.7 6,631.7 5,461.1 5,461.1
Financial Liabilities Current
(2,562.6) (2,562.6) Trade payables (1,574.5) (1,574.5) (1,571.3) (1,571.3)
(626.3) (662.8) Bank loans commercial paper and overdrafts (868.6) (910.2) (106.0) (106.0)
(24.0) (24.0) Finance lease liabilities (28.9) (28.9) (28.5) (28.5) (1,253.1) (1,253.1) Derivative financial liabilities (3,374.5) (3,374.5) (1,025.0) (1,025.0)
(4,466.0) (4,502.5) (5,846.5) (5,888.1) (2,730.8) (2,730.8)
Non-current (7,733.1) (8,776.5) Loans and borrowings (8,379.0) (9,200.2) (8,166.4) (9,297.4)
(227.1) (227.1) Finance lease liabilities (210.5) (210.5) (237.0) (237.0) (566.9) (566.9) Derivative financial liabilities (1,280.3) (1,280.3) (693.3) (693.3)
(8,527.1) (9,570.5) (9,869.8) (10,691.0) (9,096.7) (10,227.7)
(12,993.1) (14,073.0) (15,716.3) (16,579.1) (11,827.5) (12,958.5)
(7,799.7) (8,879.6) Net financial liabilities (9,084.6) (9,947.4) (6,366.4) (7,497.4)
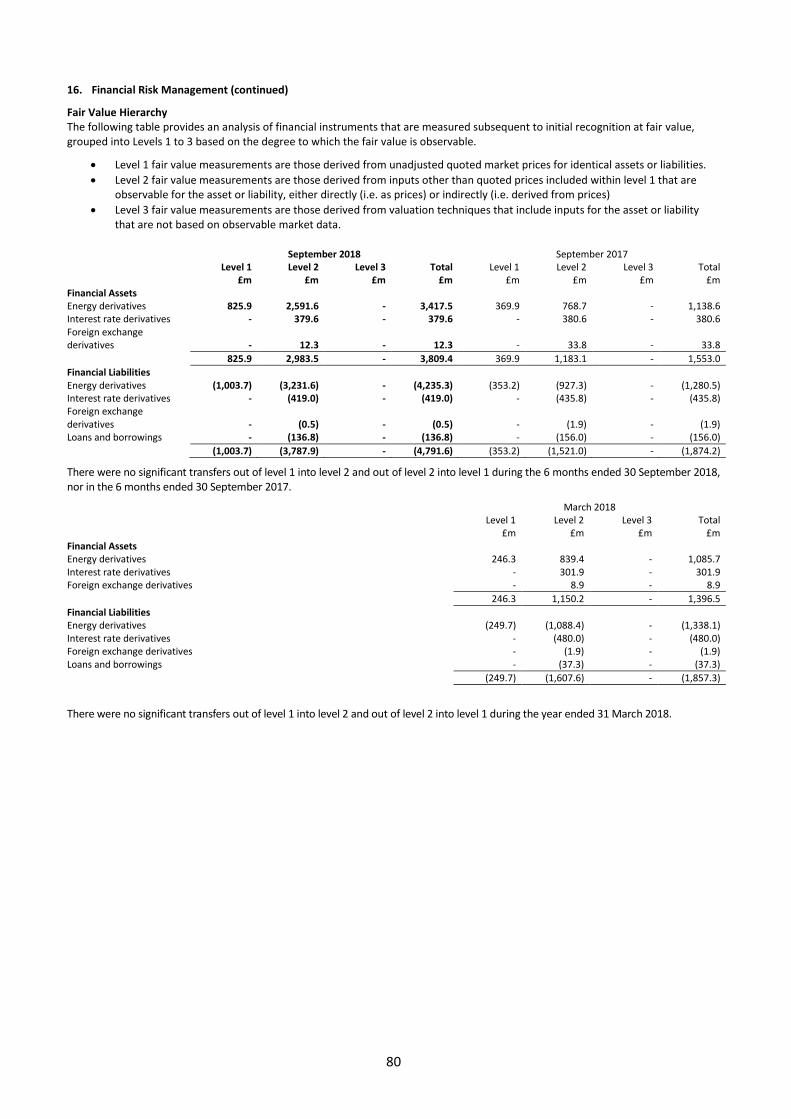
80
16. Financial Risk Management (continued)
Fair Value Hierarchy The following table provides an analysis of financial instruments that are measured subsequent to initial recognition at fair value, grouped into Levels 1 to 3 based on the degree to which the fair value is observable.
• Level 1 fair value measurements are those derived from unadjusted quoted market prices for identical assets or liabilities.
• Level 2 fair value measurements are those derived from inputs other than quoted prices included within level 1 that are observable for the asset or liability, either directly (i.e. as prices) or indirectly (i.e. derived from prices)
• Level 3 fair value measurements are those derived from valuation techniques that include inputs for the asset or liability that are not based on observable market data.
September 2018 September 2017 Level 1 Level 2 Level 3 Total Level 1 Level 2 Level 3 Total £m £m £m £m £m £m £m £m Financial Assets Energy derivatives 825.9 2,591.6 - 3,417.5 369.9 768.7 - 1,138.6 Interest rate derivatives - 379.6 - 379.6 - 380.6 - 380.6 Foreign exchange derivatives - 12.3 - 12.3 - 33.8 - 33.8
825.9 2,983.5 - 3,809.4 369.9 1,183.1 - 1,553.0
Financial Liabilities Energy derivatives (1,003.7) (3,231.6) - (4,235.3) (353.2) (927.3) - (1,280.5) Interest rate derivatives - (419.0) - (419.0) - (435.8) - (435.8) Foreign exchange derivatives - (0.5) - (0.5) - (1.9) - (1.9) Loans and borrowings - (136.8) - (136.8) - (156.0) - (156.0)
(1,003.7) (3,787.9) - (4,791.6) (353.2) (1,521.0) - (1,874.2)
There were no significant transfers out of level 1 into level 2 and out of level 2 into level 1 during the 6 months ended 30 September 2018, nor in the 6 months ended 30 September 2017.
March 2018 Level 1 Level 2 Level 3 Total £m £m £m £m Financial Assets Energy derivatives 246.3 839.4 - 1,085.7 Interest rate derivatives - 301.9 - 301.9 Foreign exchange derivatives - 8.9 - 8.9
246.3 1,150.2 - 1,396.5
Financial Liabilities Energy derivatives (249.7) (1,088.4) - (1,338.1) Interest rate derivatives - (480.0) - (480.0) Foreign exchange derivatives - (1.9) - (1.9) Loans and borrowings - (37.3) - (37.3)
(249.7) (1,607.6) - (1,857.3)
There were no significant transfers out of level 1 into level 2 and out of level 2 into level 1 during the year ended 31 March 2018.
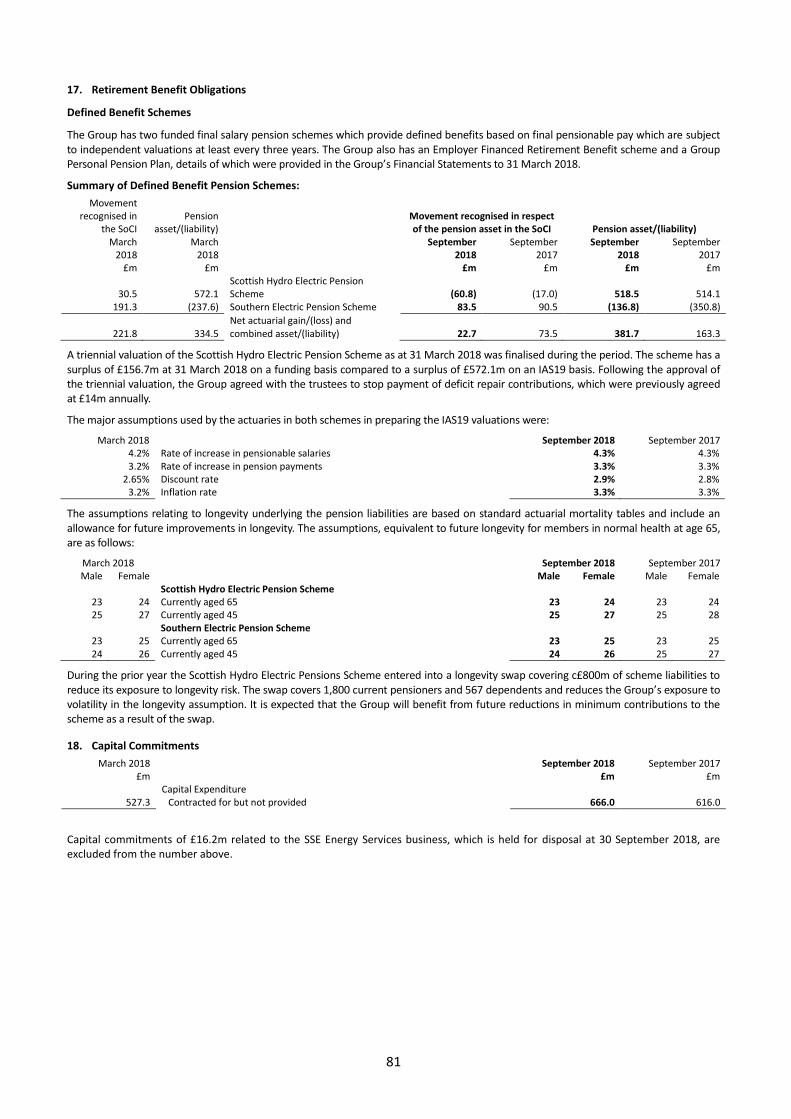
81
17. Retirement Benefit Obligations
Defined Benefit Schemes
The Group has two funded final salary pension schemes which provide defined benefits based on final pensionable pay which are subject to independent valuations at least every three years. The Group also has an Employer Financed Retirement Benefit scheme and a Group Personal Pension Plan, details of which were provided in the Group’s Financial Statements to 31 March 2018.
Summary of Defined Benefit Pension Schemes:
Movement recognised in
the SoCI Pension
asset/(liability) Movement recognised in respect of the pension asset in the SoCI Pension asset/(liability)
March 2018
March 2018
September 2018
September 2017
September 2018
September 2017
£m £m £m £m £m £m
30.5 572.1 Scottish Hydro Electric Pension Scheme (60.8) (17.0) 518.5 514.1
191.3 (237.6) Southern Electric Pension Scheme 83.5 90.5 (136.8) (350.8)
221.8 334.5 Net actuarial gain/(loss) and combined asset/(liability) 22.7 73.5 381.7 163.3
A triennial valuation of the Scottish Hydro Electric Pension Scheme as at 31 March 2018 was finalised during the period. The scheme has a surplus of £156.7m at 31 March 2018 on a funding basis compared to a surplus of £572.1m on an IAS19 basis. Following the approval of the triennial valuation, the Group agreed with the trustees to stop payment of deficit repair contributions, which were previously agreed at £14m annually.
The major assumptions used by the actuaries in both schemes in preparing the IAS19 valuations were:
March 2018 September 2018 September 2017 4.2% Rate of increase in pensionable salaries 4.3% 4.3% 3.2% Rate of increase in pension payments 3.3% 3.3%
2.65% Discount rate 2.9% 2.8% 3.2% Inflation rate 3.3% 3.3%
The assumptions relating to longevity underlying the pension liabilities are based on standard actuarial mortality tables and include an allowance for future improvements in longevity. The assumptions, equivalent to future longevity for members in normal health at age 65, are as follows:
March 2018 September 2018 September 2017 Male Female Male Female Male Female
Scottish Hydro Electric Pension Scheme 23 24 Currently aged 65 23 24 23 24 25 27 Currently aged 45 25 27 25 28
Southern Electric Pension Scheme 23 25 Currently aged 65 23 25 23 25 24 26 Currently aged 45 24 26 25 27
During the prior year the Scottish Hydro Electric Pensions Scheme entered into a longevity swap covering c£800m of scheme liabilities to reduce its exposure to longevity risk. The swap covers 1,800 current pensioners and 567 dependents and reduces the Group’s exposure to volatility in the longevity assumption. It is expected that the Group will benefit from future reductions in minimum contributions to the scheme as a result of the swap.
18. Capital Commitments
March 2018 £m
September 2018 £m
September 2017 £m
527.3 Capital Expenditure
Contracted for but not provided 666.0 616.0
Capital commitments of £16.2m related to the SSE Energy Services business, which is held for disposal at 30 September 2018, are excluded from the number above.
82
19. Related Party Transactions
The following trading transactions took place during the period between the Group and entities which are related to the Group, but which are not members of the Group. Related parties are defined as those in which the Group has joint control or significant influence over.
Sale of goods and
services
Purchase of goods and
services Amounts
owed from Amounts owed to
Sale of goods and
services
Purchase of goods and
services Amounts
owed from Amounts owed to
Sep 2018 Sep 2018 Sep 2018 Sep 2018 Sep 2017 Sep 2017 Sep 2017 Sep 2017
Equity accounted joint ventures: £m £m £m £m £m £m £m £m
Scotia Gas Networks Ltd 26.1 (71.2) 0.6 16.1 24.9 (59.4) 0.8 -
Seabank Power Ltd 16.2 (28.7) 0.1 8.7 6.0 (88.0) 0.1 22.2
Marchwood Power Ltd 5.4 (62.4) 0.4 17.3 5.4 (74.9) 0.9 14.2
Clyde Windfarm (Scotland) Ltd 1.7 (55.4) 4.7 30.0 2.5 (43.2) 1.1 24.0
Other Joint Ventures 7.3 (30.6) 9.5 5.0 5.8 - 2.3 -
Associates - (17.2) - 4.3 1.4 (26.5) 3.0 7.3
The Group’s gas supply activity incurs gas distribution charges from Scotia Gas Networks while the Group also provides services to Scotia Gas Networks in the form of a management service agreement for corporate services and stock procurement services. The transactions with Seabank Power Limited and Marchwood Power Limited relate to the contracts for the provision of energy or the tolling of energy under power purchase arrangements. The amounts outstanding are trading balances, are unsecured and will be settled in cash. The transactions with Clyde Windfarm (Scotland) Limited relate to contracts for the provisions of energy under power purchase agreements. This related party was previously wholly owned by the Group. No guarantees have been given or received. No provisions have been made for doubtful debts in respect of the amounts owed by related parties.
In addition to the above trading transactions the Group was owed the following loans from its principal joint ventures and associates: Scotia Gas Networks £109.2m (2017 - £177.8m, March 2018 - £109.1m), Ferrybridge MFE Limited £116.7m (2017 - £201.8m, March 2018 - £128.2m), Ferrybridge MFE2 Limited £120.0m (2017 - £54.0m, March 2018 - £110.0m) Marchwood Power Limited £76.6m (2017 - £85.2m, March 2018 – £79.8m) and Clyde Windfarm (Scotland) Limited £264.1m (2017 - £372.1m, March 2018 - £357.5m).
20. Seasonality of operations
Certain activities of the Group are affected by weather and temperature conditions and seasonal market price fluctuations. As a result of this, the amounts reported for the interim period may not be indicative of the amounts that will be reported for the full year due to seasonal fluctuations in customer demand for gas, electricity and services, the impact of weather on demand, renewable generation output and commodity prices, market changes in commodity prices and changes in retail tariffs. In Networks, the volumes of electricity and gas distributed or transmitted across network assets are dependent on levels of customer demand which are generally higher in winter months. In Retail, notable seasonal effects include the impact on customer demand of warmer temperatures in the first half of the financial year. In Wholesale, there is the impact of lower customer demand on commodity prices, the weather impact on renewable generation such as hydro and wind and other seasonal effects. The impact of temperature on customer demand for gas is more volatile than the equivalent demand for electricity.
During the six months ended 30 September 2018 the UK experienced a prolonged period of warm temperatures which have reduced consumer demand for gas and electricity in the period. As a result, the Group’s interim results are more affected by the seasonality of operations than in prior years.
21. Post balance sheet events
21.1 CMA announcement
On 10 October, subsequent to the balance sheet date, the Competition and Markets Agency (‘CMA’) announced its findings in relation to the potential threats to competition in the UK domestic energy supply market posed by the Group’s proposed transaction with innogy SE (‘innogy’). The CMA’s review found that the proposed transaction posed no threat to competition and cleared the transaction. The Group remains committed to the transaction and significant work has taken place, and is ongoing, to progress the transaction. On 8 November 2018 the Group announced that it had entered into discussions with innogy regarding potential changes to the commercial terms of the proposed combination and stated it was likely the proposed combination would be delayed beyond Q1 2019. However, all work to seek to achieve the formation and listing of the company continues, therefore the assets and liabilities remain presented as held for disposal.
21.2 Guaranteed Minimum Pension (‘GMP’) equalisation
On 26 October, the High Court finalised a judgement in the case of Lloyds Banking Group Pensions Trustees Limited v Lloyds Bank plc. The ruling has potential consequences for the accrued liabilities of defined benefit pension schemes in the UK and is likely to lead to an increase in the liabilities of SSE’s defined benefit pension schemes. The judgement concluded that pension schemes should be amended to equalise pension benefits for men and women in relation to guaranteed minimum pension benefits. In the second half of 2018/19 SSE will engage with the trustees of its pension schemes, its actuaries and legal advisers, to estimate the impact of this judgement on SSE’s pension schemes.
21.3 Indigo Pipelines disposal by the Environmental Capital Fund
On 5 November 2018, the Environmental Capital Fund (in which SSE has a 48% stake) agreed the sale of Indigo Pipelines to Arjun Infrastructure Partners. SSE expects that a distribution of £53m will be received in the second half of 2018/19 following the sale.
Statement of directors’ responsibilities in respect of the Condensed Interim Statements
83
We confirm that to the best of our knowledge:
i) the condensed set of financial statements has been prepared in accordance with IAS 34 Interim Financial Reporting as adopted by the EU;
ii) the interim management report includes a fair review of the information required by:
(a) DTR 4.2.7R of the Disclosure and Transparency Rules, being an indication of important events that have occurred during the first six months of the financial year and their impact on the condensed set of financial statements; and a description of the principal risks and uncertainties for the remaining six months of the year; and
(b) DTR 4.2.8R of the Disclosure and Transparency Rules, being related party transactions that have taken place in the first six months of the current financial year that have materially affected the financial position or performance of the entity during that period; and any changes in the related party transactions described in the last annual report that could do so.
For and on behalf of the Board
Alistair Phillips-Davies Gregor Alexander
Chief Executive Finance Director
London
13 November 2018
84
Conclusion
We have been engaged by the Company to review the condensed set of financial statements in the half-yearly financial report for the six months ended 30 September 2018 which comprises Consolidated and Condensed Income Statement, the Consolidated and Condensed Statement of Comprehensive Income, the Consolidated and Condensed Balance Sheet, the Consolidated and Condensed Statement of Changes in Equity, the Consolidated and Condensed Cash Flow Statement and the related explanatory notes.
Based on our review, nothing has come to our attention that causes us to believe that the condensed set of financial statements in the half-yearly financial report for the six months ended 30 September 2018 is not prepared, in all material respects, in accordance with IAS 34 Interim Financial Reporting as adopted by the EU and the Disclosure Guidance and Transparency Rules (“the DTR”) of the UK’s Financial Conduct Authority (“the UK FCA”).
Scope of review
We conducted our review in accordance with International Standard on Review Engagements (UK and Ireland) 2410 Review of Interim Financial Information Performed by the Independent Auditor of the Entity issued by the Auditing Practices Board for use in the UK. A review of interim financial information consists of making enquiries, primarily of persons responsible for financial and accounting matters, and applying analytical and other review procedures. We read the other information contained in the half-yearly financial report and consider whether it contains any apparent misstatements or material inconsistencies with the information in the condensed set of financial statements.
A review is substantially less in scope than an audit conducted in accordance with International Standards on Auditing (UK) and consequently does not enable us to obtain assurance that we would become aware of all significant matters that might be identified in an audit. Accordingly, we do not express an audit opinion.
Directors’ responsibilities
The half-yearly financial report is the responsibility of, and has been approved by, the directors. The directors are responsible for preparing the half-yearly financial report in accordance with the DTR of the UK FCA.
As disclosed in note 2, the annual financial statements of the Group are prepared in accordance with International Financial Reporting Standards as adopted by the EU. The directors are responsible for preparing the condensed set of financial statements included in the half-yearly financial report in accordance with IAS 34 as adopted by the EU.
Our responsibility
Our responsibility is to express to the company a conclusion on the condensed set of financial statements in the half-yearly financial report based on our review.
The purpose of our review work and to whom we owe our responsibilities
This report is made solely to the company in accordance with the terms of our engagement to assist the company in meeting the requirements of the DTR of the UK FCA. Our review has been undertaken so that we might state to the company those matters we are required to state to it in this report and for no other purpose. To the fullest extent permitted by law, we do not accept or assume responsibility to anyone other than the company for our review work, for this report, or for the conclusions we have reached.
William Meredith
for and on behalf of KPMG LLP
Chartered Accountants
319 St Vincent Street
Glasgow
G2 5AS
13 November 2018