Embed Size (px)
Citation preview

DISCLAIMER
This project was conducted with financial assistance from a grant from the Metropolitan Water
District of Southern California (Metropolitan), the U.S. Bureau of Reclamation, the Central
Arizona Project, and the Southern Nevada Water Authority through Metropolitan’s Innovative
Conservation Program (ICP). The ICP provides funding for research to help document water
savings and reliability of innovative water savings devices, technologies, and strategies. The
findings of this project, summarized in this report, are solely from the project proponent.
Metropolitan and the ICP funding partners do not endorse any particular product, service, or
company, including those discussed in this report. The information provided within this report
is not certified by Metropolitan and any party referencing this report should verify information
as needed for its own purpose.

1
University of Arizona ICP Agreement Number 143539
Final Report Date: October 30, 2015 Project Title: Development of an Interactive Website for Scheduling Landscape Drip Principal Investigator: Ursula Schuch, School of Plant Sciences University of Arizona, Tucson AZ 85721 [email protected] Reporting Period: September 2014 – October 2015 Summary This project was based on the hypothesis that the proposed irrigation scheduler based on soil texture, ETo, crop coefficents, and measured on-site irrigation delivery rates will result in optimal irrigation applications for plant health and potential water savings compared to current irrigation scheduling. The irrigation scheduler will be available as an interactive website to landscape professionals and home owners. The project was initiated in September 2014 shortly after the contract between the Metropolitan Water District of Southern California and the University of Arizona was signed. Deliverables of the project:
1. A survey to capture the knowledge and current practices used by professional landscapers in scheduling drip irrigation on commercially managed properties in the southwestern low desert.
2. Case studies of irrigation scheduling of representative commercial landscapes with large scale drip irrigation systems managed by professional landscapers in comparison to the proposed irrigation scheduler.
3. On-site irrigation scheduling comparisons of commercial or institutional landscapes with similar plant materials in two irrigation zones. One zone will be irrigated based on current practices and the other zone will be irrigated based on the proposed schedule. Water use and plant health of selected species will be compared.
4. The interactive website to schedule irrigation based on reference evapotranspiration, soil texture, crop coefficients, and on site plant material and existing emitters.

2
1. Survey of current irrigation practices of scheduling drip irrigation Introduction and methods An irrigation survey with 25 questions was designed to determine current practices in managing and maintaining drip irrigation systems in landscapes. The objective was to learn from landscapers what their current practices are and what would help them to improve irrigation efficiency. The survey instrument had 25 questions some of which required a single answer, some allowed multiple answers, and some were open-ended questions. Questions asked about where the respondent was employed, the number and type of properties they maintained, and about their responsibility related to drip irrigation. The survey asked questions about how irrigation schedules are developed, when they are changed, about the system hardware, and common system maintenance practices. The survey instrument is attached to the final report as a separate document. The survey was distributed at one educational event hosted by the University of Arizona and attended by professional landscapers and we collected 28 responses in February 2015. An invitation to complete the survey on a website using an online surveymonkey instrument was distributed by e-mail in April 2015 to members of the Arizona Landscape Contractors’ Association. We received 124 responses between April 6 and May 28, 2015. In total we received 151 responses that were used for analysis. Survey responses All respondents were employed in Arizona with the great majority from the greater Phoenix and Tucson Metropolitan areas. Respondent demographics. The majority of respondents were employed by a commercial landscape company (50), followed by self -employed independent contractors (39) and municipal Parks and Rec employees (28). Less than 10 respondents were employed by schools, property management companies, or a golf course. All respondents were involved in the landscape or nursery trade. Respondents could indicate more than one job responsibility. Responsibilities in decreasing frequency included: supervisor or manager function (106), mowing, pruning and general landscaping (82), irrigation scheduling (81), irrigation system design (65), construction (55), and spraying (47). Property types. Respondents maintained the following types of properties: residential, single family (76), commercial, business (75), commercial, multi-family (52), sports field (47), roadside right-of-way (37), and golf courses (12). Respondents had the option to choose multiple categories from this question. When asked how many properties they maintained, 61% maintained more than 10, 17% two to five, 14% one, and 8% six to nine. The size of property they maintained ranged from less than 0.5 acres to more than 10 acres. Irrigation types and application. Of all respondents 134 maintained sites that use drip or microirrigation to water trees, shrubs and annuals. When asked what percentage of properties they maintained are drip irrigated, 40% answered all of the properties, 28% answered three quarter to almost all, and only 23% answered that half or less of the properties they managed used drip irrigation. It is not surprising that the majority of landscapers in the low desert urban communities in Arizona manage irrigation of trees and shrubs via drip irrigation which is considered the most economical way to apply water to these plants. When asked whether they set the drip schedule, only 14% of respondents never set the drip irrigation schedule whereas 48% always set the schedule.

3
More than half of the respondents reported that trees and shrubs were on separate drip zones while 42% reported they were not on separate drip zones. When on the same zone, 85% of respondents indicated that trees have either more emitters, or more emitters with a greater flowrate. When asked about the type of microirrigation they used to water trees and shrubs, 95 used emitters attached to lateral tubing, 77 used emitters attached to a multi-port device. Point source, microsprays, and line source each received only between 22 and 16 responses. Irrigation scheduling and controllers. When asked how drip irrigation schedules are developed, 85 responses were by experience and personal preferences, 37 based on irrigation systems performance data, 32 by supervisor preference, 29 by smart controllers, and 13 by client input. This indicates that many irrigation controllers are not set based on quantitative data, but on a person’s experience. In the other, open ended section to this question one cited ‘Guidelines for Landscape Drip Irrigation Systems by the Arizona Landscape Irrigation Guidelines Committee, (http://www.amwua.org/pdfs/drip_irrigation_guide.pdf), and one the Water Use it Wisely recommendation by AMWUA (http://wateruseitwisely.com/100-ways-to-conserve/landscape-watering-guide/). Asked how many times a year the drip irrigation schedule is changed, only 4% answered never, 25% more than 5 times, 30% one to two times, and 41% three to five times. It is encouraging that two thirds of controllers are changed three or more times a year to accommodate the fluctuating seasonal evaporative demand of landscape plants. This can maintain healthy plants while conserving water. It would be useful to learn why one third of respondents change the controller less than twice a year. Understanding the barriers can help to develop educational resources to encourage a more frequent changing of controllers. When asked what percentage of the system they maintained had a mix of different plant materials, 71 respondents answered that 51% or more of the properties they managed had a mix of plant materials. If people managed properties with trees and shrubs on the same zone 85% reported that the trees had more emitters or more emitters with higher flow rates. Respondents were asked to rank the importance of 21 factors in developing a drip irrigation schedule. The following chart displays the answers. Type of plant material and time of year and season received the highest rankings for developing irrigation schedules. Information from the internet and other landscapers received the lowest ranking.

4
Irrigation system maintenance. Questions about system maintenance revealed that 59% of respondents never measured the output of an irrigation emitter. When asked how they determined the amount of water to apply, about 43% set the time based on the estimated amount of gallons a plant should receive at ach irrigation, 39% set a run time, and 18% use ET information. When asked about the type of controllers they used, 63% answered conventional controllers, 26% used smart controllers, 7% used soil moisture sensors, and 5% used smart controllers with moisture sensors. Sixty-one respondents said they did not trust soil moisture sensors to schedule irrigation events and 21 answered that they did trust the sensors to schedule irrigation events. Respondents used many different practices when maintaining their irrigation system. The one used the most is to inspect the filters, clean and flush as needed (79), flush the lateral lines annually (61), and add more emitters to adjust for plant growth (60). Most respondents operate older irrigation systems. One third each reported their system to be 6-9 years or more than 10 years, and 27% reported their irrigation system to be between 0-5 years old. The most common repairs required are lateral line breaks, missing emitters, and vandalism or animal damage. Less common were calcification, pinched laterals or root intrusion, and aging poly tube. When asked whether they installed drip irrigation systems 83% of respondents answered yes. Following are the responses to the two open-ended questions. Question 24: What are the greatest challenges you face in maintaining your microirrigation systems for trees and shrubs? Categories with more than 10 respondents listed the following issues: design and installation of
0% 50% 100%
Type of plant material
Size of plant material
Plants thriving
Plants surviving
Soil type and texture
Water holding capacity of the soils
Infiltration rate of the soil, time it takes to wet the profile
Time of year, season
The depth of soil that is watered in one cycle
Weather conditions in the past month
Current and future weather conditions
Overall performance of the irrigation system (uniformity)
Microclimate of the site
Slope of the site
Client expectations
Requests from supervisor
Water conservation
Information from other landscapers
Information from the internet
Information from educational seminars or workshops
Information from University of Arizona Cooperative…
How important are the following factors in developing a drip schedule?
not important
a littleimportant
somewhatimportant
very important

5
irrigation system, routine system maintenance, client and worker education, adjustments for plant aging such as moving emitters, different water needs in one zone, and infrastructure age and system age. Question 25: If you could change three things about your microirrigation system that would improve how you can maintain it, what would that be? Replace poly tube with PVC or improve the quality of the poly, update irrigation clocks with modern controllers or smart timers and controllers, separate zones for different plant types, improve design and installation of systems, maintain irrigation systems, have more durable and better performing components. Conclusions. Answers to the open ended questions and many of the other questions indicate that many landscapers are aware of the shortcomings of the irrigation hardware infrastructure, irrigation system design, and a desire to avoid regular irrigation system maintenance. The current practice for many urban landscapes is that new irrigation systems are installed with or without regard to different plant water needs. Maintenance of irrigation systems is often not scheduled or performed to accommodate for aging components, growing plants, or the removal or new planting of trees or shrubs. When greater incentives for water conservation are offered, landscape personnel will be less hampered by poor infrastructure, system design and a reluctance to schedule regular irrigation system maintenance. Survey responses show that landscapers are aware of the most important factors that affect plant water use. However, few collect relevant data to calculate how much water is necessary and what quantity should be applied to refill the plant root zone in a timely manner. This requires detailed knowledge of the soil properties for each irrigation zone. Respondents to this survey either participated in an educational workshop or are members of the Arizona Landscape Contractors’ Association, suggesting that they are interested in education and motivated to improve their technical knowledge. Not all landscape businesses operate with the benefit of well trained personnel. Educational efforts from Cooperative Extension or trade organizations often do not reach this audience because they lack the time or resources to participate in training sessions or do not have access to training materials. Educating both landscapers and consumers of landscape services about the benefits of a well-designed, installed, and maintained irrigation system can help to shift towards greater water conservation in drip irrigated landscapes.

6
2. Case studies of irrigation scheduling of representative properties comparing existing versus proposed irrigation schedules This study evaluated the new drip irrigation scheduling method using theoretical comparisons of currently used schedules versus the proposed schedule. Drip irrigation data from ten commercial sites such as apartment complexes and churches was collected from October 2014 to July 2015. Data collected included the number of drip emitters per plant and the flow rate, the type of plant, rooting depths and soil samples. The current schedule used to irrigate the plants at the time of testing was also recorded. Relevant data was entered into the new drip scheduling program and used to compare current water use and potential savings with the new schedule (Table 1.). Comparisons of the existing schedule to those developed using three levels of crop coefficient (Kc) are listed in Table 1. The three levels of Kc represent low (30%), medium (50%) and high (75%) evapotranspiration (ET) water replacement regimes. The irrigation method used by the new program calculates a ‘set’ runtime and recommends an interval between each irrigation event based on long-term historical ET. Runtime minutes are determined by the rooting depth and the wetted surface area of every drip emitter associated with each individual plant. Soil texture is used to calculate the available soil-water holding capacity. Based on comparing actual irrigation schedules of 10 commercial sites to calculated proposed schedules, significant water savings can be achieved varying by month and site. The average percent reduction in water use was 82, 67, and 47 when crop coefficients of 30%, 50%, or 75% were used to calculate the schedules with the program of the new website. Proposed runtimes for an irrigation event ranged from 28 to 110 minutes for the different sites. Differences reflect the type of plant material and the average rooting depth of all plants within each zone, not the time of year. Intervals or days between irrigation events are listed under each of the three watering regimes. Intervals reflect the evaporative demand for the month in which each schedule was developed. For example, during the month of December, if using the lowest water regime of 30% ET replacement, the schedule may recommend that no irrigation is required as the interval between irrigations would be greater than 31 days. In contrast, the schedules developed for the month of June indicate an interval of three to four days between irrigation events when using a Kc of 70%. Potential reductions in water use were determined by multiplying the runtimes by the frequencies of the existing schedules to those recommended by the new scheduling method. Percent reductions are listed for the three levels of Kc for which schedules were developed. In all instances with the exception of a single case, there are potential water savings. As expected, the greatest savings are realized when using the lowest Kc with average reduction in water use of 82%. Even when comparing the potential water use at the highest Kc of 75% there is an average reduction of 47%. Runtime minutes used by the irrigation managers at three sites are longer than the proposed runtime of the new schedule. It is possible that too much water is applied during a single irrigation event and excess water may be moving past the root zone and become unavailable to the plants. This type of scheduling reduces the application efficiency of the system. Adjusting the maximum runtime to reflect the root depth and soil water holding capacity is another source of potential water savings. Fair comparisons could only be made for the month in which each system was tested. Responses from the survey conducted earlier suggest that not all irrigation managers change their schedules on a regular basis. Thus, potential water savings could be much greater than those listed.

7
Table 1. Comparison of existing versus proposed irrigation schedules from ten commercial sites.
Interval days
Percent reduction in water application at 3 levels of Kc
Soil Available in.
-- Existing schedule -- Proposed Kc
Month texture soil-water
Runtime minutes
Days / week
runtime minutes 30% 50% 75%
30% 50% 75%
Sabino Vista Hills October SL 0.51
21 6 101 12 7 4
48 5 -54
Mountain Vista October SL 0.42
45 3 41 10 5 3
76 55 29
Las Palomitas December SCL 0.75
60 2 85 - 31 17
95 83 67
La Hacienda March SL 0.62
45 3 32 16 8 5
88 78 65 Pavilions at Pantano March SL 0.56
40 7 45 13 7 4
90 82 71
St. Francis April SCL 0.74
120 4 28 14 7 5
97 94 90
Las Colinas June SCL 0.98
45 5 52 10 6 4
82 70 54
Little Chapel June SL 0.78
90 5 110 8 5 3
76 60 39
San Mateo June SCL 0.71
45 7 42 7 4 3
86 76 63
Harrison Estates July SL 0.50
90 4 60 8 4 3
85 69 50
Average
0.66 60.1 4.6 59.6 9.8 8.4 5.1
82.3 67.2 47.4
*based on wetted volume of soil
-------- New schedule ------------

8
3. On-Site Irrigation Scheduling Comparisons This empirical study compared the outcome from implementing a drip irrigation schedule from spring to fall 2015. In selecting the potential sites for use in the empirical test, many locations were visited before the final locations were confirmed. The ideal site needed to have two or more relatively identical zones (stations) that had similar plant material and could be scheduled to irrigate differently. The idea was to have one of the two stations remain under the management of the landscape contractor, while the irrigation for the second station would be scheduled using the new methodology. Finding sites with these parameters proved to more challenging than originally anticipated. Obstacles that hindered the participation of landscapers included that their irrigation controllers do not have the advanced scheduling capabilities to perform the experiment, their irrigation was not functioning properly, or they were unwilling to share their current irrigation schedules and management practices. Site selection. In the end, two locations were selected that met the conditions needed to conduct a fair comparison of the new drip scheduling procedure. One site was maintained by the City of Tucson and consisted of trees and shrubs along a right-of-way. This site was attractive as the plants were installed only two years ago and had a well maintained and functioning drip system. A fairly sophisticated Calsense controller is used to schedule the watering at this site. The site has four zones under each schedule, two of them irrigate shrub zones and two irrigate tree zones. The two tree zones have 206 trees and the two shrub zones have 255 shrubs on the irrigation system. The proposed new schedule programmed by the website would result in 105 hours less runtime over the course of one year compared to the traditional current schedule programmed by the cooperator. This would accumulate to water savings of 346,194 gallons per year for these zones. Soon after starting the test it became evident that the city site would be problematic. There were numerous power outages during summer storms that resulted in clearing the programmed schedule from memory. This required weekly vigilance to monitor this controller and was especially important after every thunderstorm. Even if no measurable rain fell, there was the potential for this controller to lose its programming. This controller also had monitoring capabilities to measure the flow through the system. Any excess flow would result in shutting down the mainline. This type of problem did occur and required repairs to ‘clear’ the error. City maintenance was not as responsive to these issues as we would have hoped and as a result this site was abandoned. The other site was located at the Tucson International Airport maintained by the Tucson Airport Authority (TAA). This landscape was also two years old and had very well maintained plants and a well-functioning irrigation system. The superintendent initiated the schedule manually for the two drip zones using the new schedule according to the website scheduler and allowing the onsite controller to water two additional zones with the existing schedule. Materials and methods. Beginning in April 2015, two drip zones at Tucson International Airport consisting of parking lot islands with trees, shrubs, vines, cactus and groundcover received irrigation based on the new scheduling regime. Plant material growing at the site is listed in Table 2. Two similar zones remained under the existing irrigation management and were used as controls for comparison with the new schedule. Infrared temperatures of plants and background were collected as well as visual assessments of plant health to quantify the effects from the two irrigation regimes. Infrared temperatures of the canopy (leafs) can indicate whether a plant has sufficient water for transpiration. If the availability of water is limiting, the canopy temperatures will be higher than those of plants with adequate water. Since the two tested irrigation regimes will apply different amounts of water at different frequencies, the use of

9
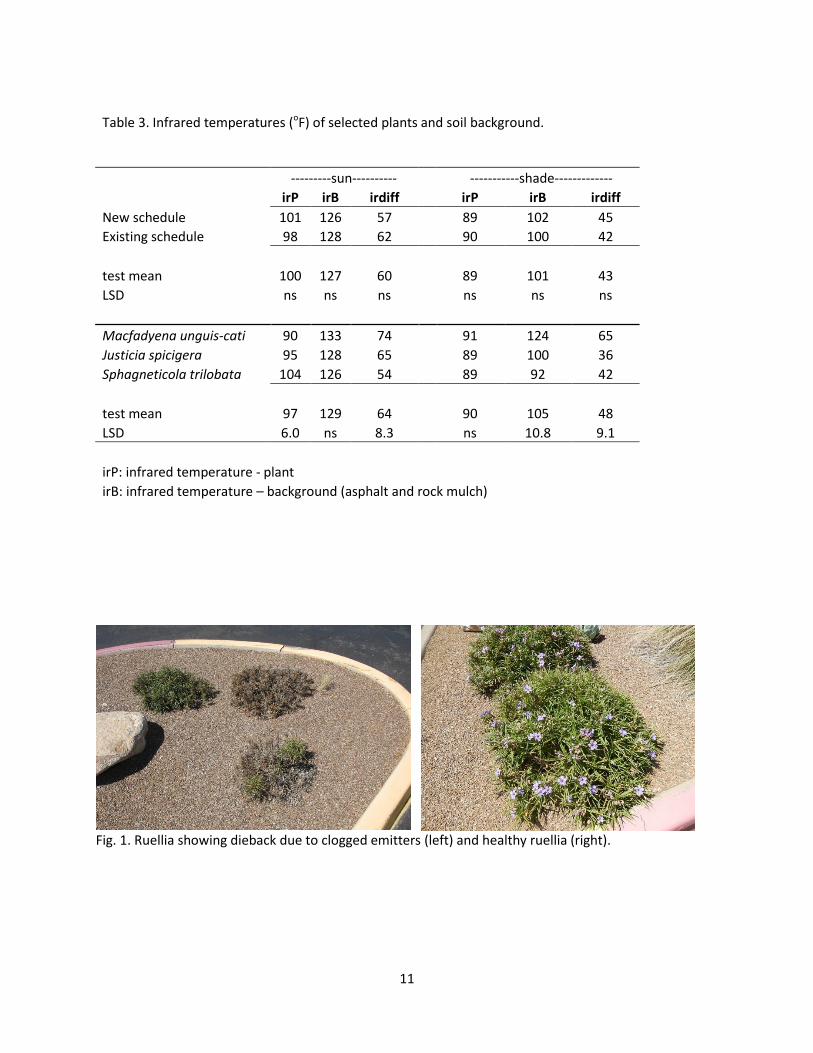
canopy temperatures provides a reliable and quantifiable means to evaluate the effect of irrigation scheduling on plant health. Results. The first visual assessment of the plants was taken in June 2015. Signs of stress could be seen in some of the Ruellia peninsularis (Baja Ruellia) (Fig. 1). There was notable die-back in select plants while another plant of the same type growing within three feet of the stressed plant looked fine. Recent rains in late May had promoted lush growth and when temperatures increased consistently over 100°F in June, these plants relied solely on drip irrigation. It was later discovered that the emitters on these plants were clogged and therefore the stress could not be attributed entirely to the irrigation scheduling. Problems with the drip irrigation were also responsible for the stress observed on Salvia x greggii (autumn sage). In this case the emitters farthest from the valve had reduced flow compared to emitters close to the zone valve and therefore were more prone to calcification. These emitters eventually clogged and did not provide adequate irrigation. Minerals in the irrigation water such as calcium can physically clog emitters, especially when the flow rate is low, and explain some of the stresses observed with some plants. In all the above cases the design of the drip system may have played a role. For every plant there was only a single emitter provided. All emitters had the same flow rate, one gallon per hour, regardless of the type of plant or size. With only one emitter, any clogging would immediately begin to stress the associated plant. The use of at least two emitters per plant would be recommended in all cases and would greatly decrease the potential of losing plants due to clogged emitters. The ground cover Wedelia trilobata (wedelia) was expected to have the most difficulty with the new schedule as it has the most shallow root zone and largest leaf area of all the plants within each zone. In June, wedelia was stressed regardless of whether it was watered under the new or existing schedule. However, plants growing in more shaded areas showed much less visual stress than those exposed to full sun all day. Also apparent was the reduction in the amount of vegetative growth produced by the ground cover when watered using the new schedule (Fig. 2). Plant growth was reduced but the foliage was still healthy. Less growth reduces the amount of trimming needed, saving labor cost. Infrared canopy temperatures were taken in August. Statistical analysis showed no significant difference in plant responses to water management practiced by maintenance personnel at TAA versus the new schedule developed for this site (Table 3.). However, differences were observed between plants growing in the sun or shade. Infrared canopy temperatures (irP) between the ground cover wedelia and the vine are apparent in sunny locations, but not when growing in the shade. This is expected as the vines which were vertically oriented on trellises and surrounded by relatively cooler air (100oF) compared to the groundcover which was next to rock mulch with temperatures of 126 degrees F. Background temperatures between the three plants (irB) in the shade follow the same trends but are statistically significantly different. Wedelia trilobata was much healthier when growing in shaded areas. As a result, there is a more complete canopy cover and much less impact from the rock mulch. Larger differences (irDiff) between the canopy and background temperatures may indicate greater evaporative losses or evaporative cooling effects. This can be seen in the large temperature difference recorded between the vine (irP) and the background (irB), independent of whether growing in the sun or shade. This can also imply that water was not limiting to these vines regardless of the water regime used. Comparing a two-year-old landscape with xeriscape plants in Tucson Arizona, the potential water savings with the proposed new schedule was 13% or 10,600 gallons for the time period from April to mid-September. Plant health was maintained under the new, proposed versus the existing schedule and was more affected by design shortcomings than by the amount of water intended to be applied to the plants.
10
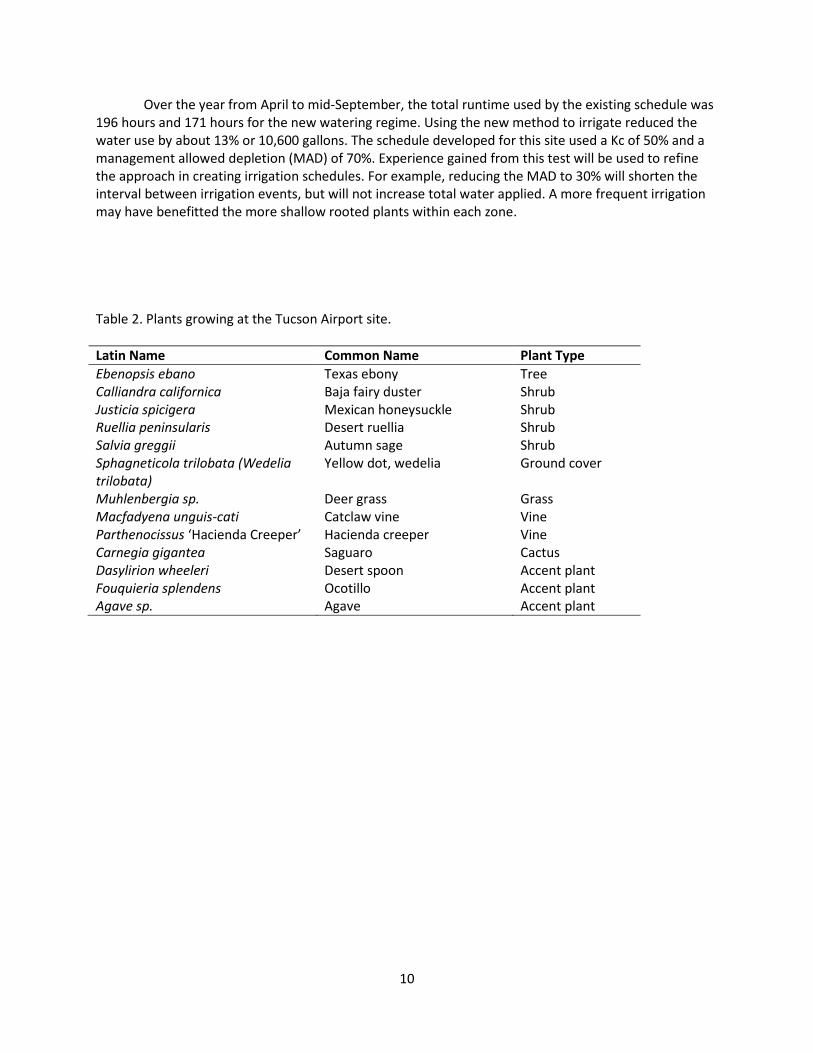
Over the year from April to mid-September, the total runtime used by the existing schedule was 196 hours and 171 hours for the new watering regime. Using the new method to irrigate reduced the water use by about 13% or 10,600 gallons. The schedule developed for this site used a Kc of 50% and a management allowed depletion (MAD) of 70%. Experience gained from this test will be used to refine the approach in creating irrigation schedules. For example, reducing the MAD to 30% will shorten the interval between irrigation events, but will not increase total water applied. A more frequent irrigation may have benefitted the more shallow rooted plants within each zone. Table 2. Plants growing at the Tucson Airport site.
Latin Name Common Name Plant Type
Ebenopsis ebano Texas ebony Tree Calliandra californica Baja fairy duster Shrub Justicia spicigera Mexican honeysuckle Shrub Ruellia peninsularis Desert ruellia Shrub Salvia greggii Autumn sage Shrub Sphagneticola trilobata (Wedelia trilobata)
Yellow dot, wedelia Ground cover
Muhlenbergia sp. Deer grass Grass Macfadyena unguis-cati Catclaw vine Vine Parthenocissus ‘Hacienda Creeper’ Hacienda creeper Vine Carnegia gigantea Saguaro Cactus Dasylirion wheeleri Desert spoon Accent plant Fouquieria splendens Ocotillo Accent plant Agave sp. Agave Accent plant
11
Table 3. Infrared temperatures (oF) of selected plants and soil background.
---------sun----------
-----------shade-------------
irP irB irdiff
irP irB irdiff
New schedule 101 126 57
89 102 45
Existing schedule 98 128 62
90 100 42
test mean 100 127 60
89 101 43
LSD ns ns ns
ns ns ns
Macfadyena unguis-cati 90 133 74
91 124 65
Justicia spicigera 95 128 65
89 100 36
Sphagneticola trilobata 104 126 54
89 92 42
test mean 97 129 64
90 105 48
LSD 6.0 ns 8.3
ns 10.8 9.1
irP: infrared temperature - plant irB: infrared temperature – background (asphalt and rock mulch)
Fig. 1. Ruellia showing dieback due to clogged emitters (left) and healthy ruellia (right).

12
Fig. 2. Wedelia under the new irrigation regime (left) is still healthy and requires less trimming than wedelia under the existing irrigation schedule.
Fig. 3. Collecting data to develop new schedule before the test was started (left) and collecting infrared temperatures of a tree canopy (right).
Fig. 4. Vines growing in full sun (middle) and partial shade (left and right).

13
4. Interactive website to schedule landscape drip irrigation The purpose of the interactive website scheduler is to calculate a watering schedule appropriate to the plant material and the existing drip emitters. The website is functional for computers, tablets, and cell phones.
http://cals.arizona.edu/dripirrigation/
Navigating the Site. The three vertical bars in the top left access a menu bar that contains tables for My Properties, Help/ FAQ’s, About, Contact, Home, and My Account. In the Help/FAQ’s the user learns how to get started entering data for a property and calculating a water wise schedule. The second questions addresses ‘How to determine soil types’ and gives users directions to other websites that assist in determining the soil texture. Other FAQ’s are:
If I have a drip emitter with a gallon output that is not listed, how can I get the scheduling? Is there a limit to the number of zones I can have in a property? How many plants can I have in a single zone? Where is my data stored and who looks at it? How long will my data remain on the website? Will it expire if not used after a certain time?
The FAQ sections will be expanded once we have more users direct questions to us. The About page features the reason for developing the website and the methodology used to develop the scheduling calculations. “The idea for this website came from observations and audits of numerous landscape drip irrigation systems. In interviews with water managers it became apparent that there was a lack of an easy to use science-based resource to schedule drip irrigation for trees, shrubs,

14
groundcovers and accent plants. We hope this website will help water managers create more data driven drip irrigation schedules that promote healthy landscapes and conserve water. The program assigns each plant a crop coefficient of low, medium or high. If plants with different crop coefficients are located within the same zone, then the program uses the average crop coefficient of all plants. Schedules produced using minimal crop coefficients will apply enough water to maintain all plants within a single zone without creating excessive growth. This will result in both water and labor savings requiring less pruning and trimming of trees and shrubs. No attempt is made to ‘fix’ the existing irrigation system. Instead, the scheduling will work on each irrigation zone or station ‘as-is’. Schedules will accommodate a mixture of flow rates and plants within each zone. Since there may be instances where both trees and shrubs occur within the same zone, some plants may receive more or less water than optimal. If this is the case, an ‘indicator’ plant(s) or the plant with the shortest rooting depth and highest crop coefficient, within the zone can be designated to drive the interval between irrigation events. Well-designed systems with trees and shrubs in separate zones will perform best. Water amounts are based on the existing emitters and not on the plant size. As plants grow and mature, additional emitters will be needed to supply sufficient quantities of water. The program uses a Management Allowed Depletion (MAD) of 30% on the more shallow rooted plants. This reduces the volume of soil that needs to be re-filled during each watering event and will improve deeper water movement within the root zone. This MAD impacts the interval between irrigation events, but does not increase the overall water applied over time.” The first page also quickly explains the three steps how
When clicking on the Learn more it explains the three steps in more detail.

15
Getting started to develop a water wise schedule first a new property is added, address, type of controller and helpful notes are then put into the program. Next a zone is started with zone name, soil type, and then individual plant species are added, categorized by soil type, whether they are native or non-native.
Next the number of emitters with specific flow rates are added and the number of plants of that species growing in the zone.

16
The final step is a printable water wise schedule that lists the length of time the irrigation has to be and the calendar dates for a whole year from January 1 to December 31 for each site. It also lists the

17
monthly average and the yearly application in gallons. The schedule can also be printed in a small format to be pasted into an irrigation controller. Acknowledgements: Jeffrey Gilbert, School of Plant Sciences CCT Web and Mobile Development Unit, College of Agriculture and Life Sciences We gratefully acknowledge funding for this project by the Metropolitan Water District of Southern
California, the Bureau of Reclamation, Southern Nevada Water Authority, and Central Arizona Project.