Embed Size (px)
Citation preview

Discerning Background Sources Discerning Background Sources from Vapor Intrusionfrom Vapor Intrusion
Jeffrey Kurtz, Ph.D. and David Folkes, PE
EnviroGroup LimitedDenver Boston Albuquerque SeattleDenver Boston Albuquerque Seattle
Colorado Bar Association – October 26, 2005
Proliferation of Vapor Intrusion Proliferation of Vapor Intrusion GuidanceGuidance
• At least 14 states, as well as the EPA, have developed Vapor Intrusion Guidance in the past few years.
• These documents vary widely in their approach to, and discussion of, background indoor air.

New Risk Levels for 1,1-DCE and New Risk Levels for 1,1-DCE and TCETCE
• Recently the EPA, and several states, have implemented new risk levels for 1,1-DCE and TCE.
• TCE is now the risk driver at many sites.
• TCE is a trace to major component of many common consumer products.

Consumer Product ExamplesConsumer Product Examples
• correction fluids• paints & varnishes & removers• glues, adhesives and sealants• spot removers & laundry aids• rug cleaning fluids• metal cleaners• lubricants• pesticides
Approach for Separating Indoor Approach for Separating Indoor and Subsurface Sourcesand Subsurface Sources
• Experience at several large sites led to “lines of evidence” approach for separating indoor & subsurface sources.
• Accepted by CDPHE and applied at several Colorado sites.

ApplicationApplication
Lines of Evidence approach can be used to:
• Identify false positives
• Limit unnecessary mitigation
• Limit indoor air sampling
• Identify indoor air COCs
• Limit continued sampling & mitigation

VOC Ratio MethodVOC Ratio Method
• Principal line of evidence relies on basic chemical properties of the chlorinated volatile organic compounds (VOCs).
• This line of evidence requires at least 2 chlorinated VOCs in the subsurface.
VOC Chemical PropertiesVOC Chemical Properties
• Relative volatility (expressed as Henry’s Law Constant). Factor of 50 range for common chlorinated VOCs.
• Relative soil sorption (Koc) – similar for most chlorinated VOCs.
• Relative degradability – similar for most chlorinated VOCs.

Groundwater SourcesGroundwater Sources
• Calculate VOC ratios
• Evaluate ratio trends over time
• Evaluate spatial variation of ratios
• Adjust for relative volatility of VOCs (Henry’s Law Constants)
• Map predicted soil vapor ratios
• Predict indoor air ratios and TCE concentrations

Soil Vapor SourcesSoil Vapor Sources
• Calculate VOC ratios• Evaluate ratio trends over time• Evaluate spatial variation of ratios• Map measured soil vapor ratios• Predict indoor air ratios and TCE concentrations
• High quality, reproducible soil vapor data essential
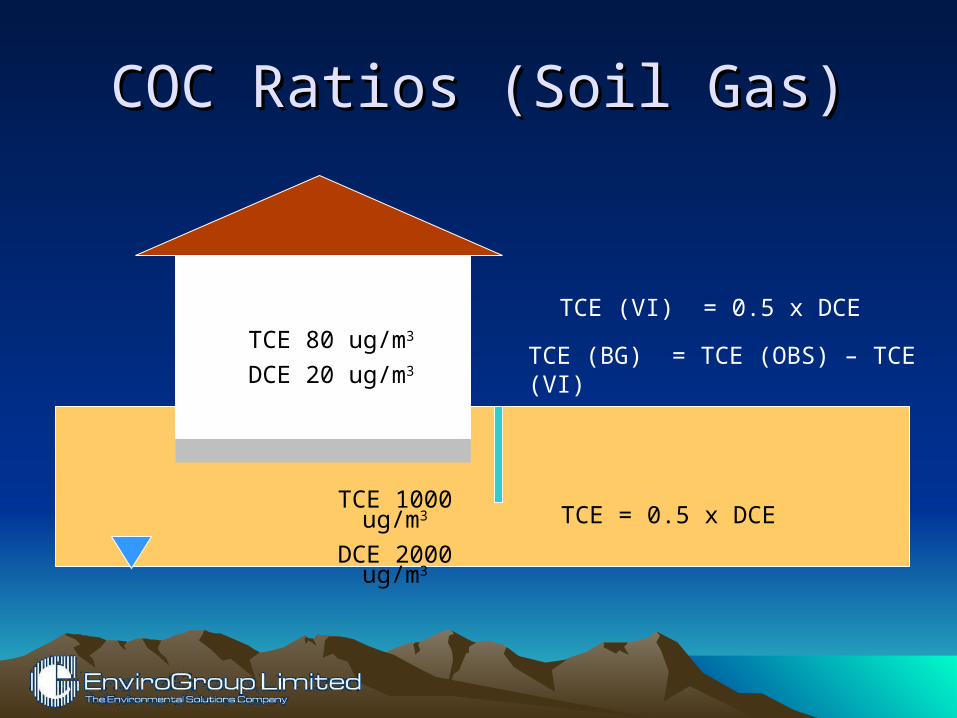
COC Ratios (Soil Gas)COC Ratios (Soil Gas)
TCE 80 ug/m3
DCE 20 ug/m3
TCE 1000 ug/m3
DCE 2000 ug/m3TCE = 0.5 x DCE
TCE (VI) = 0.5 x DCE
TCE (BG) = TCE (OBS) – TCE (VI)
Ideal CaseIdeal Case
• Denominator is a VOC with no, or very low, indoor air background (e.g. 1,1-DCE).
• Indoor air concentration of denominator VOC is direct measure of vapor intrusion.
• Ratio directly predicts vapor intrusion concentration of other COCs.
Typical CaseTypical Case• Use a VOC with the lowest indoor air
background as the denominator in the ratio (e.g. TCE).
• Indoor air concentration of the denominator VOC is an upper limit measure of vapor intrusion.
• Can estimate predicted upper limit vapor intrusion concentration of other COCs from the ratio.

Case StudyCase Study
• A Colorado site with a large chlorinated solvent groundwater plume.
• Groundwater COCs are TCE; 1,1-DCE; PCE and 1,1,1-TCA.
• Hundreds of single family residences overlying the plume.
• Documented vapor intrusion based on indoor air 1,1-DCE.

Case StudyCase Study
• Change in 1,1-DCE and TCE action levels required re-evaluation of indoor air data.
• Decision needed on new extent of vapor intrusion exceeding action levels.
• Indoor air background TCE caused numerous “false” exceedances of action level.

Case StudyCase Study
• Background varies on a “house-by-house” basis.
• Statistics from homes outside plume and from post-mitigation indicate 15% of homes in area would exceed action level due to background.
• Household chemical surveys generally fail to identify all indoor sources.

Case StudyCase Study
• Groundwater COCs present in relatively consistent proportions spatially.
• Little variation (or predictable trend) over time in TCE/DCE in groundwater.
• Adjust groundwater ratios for relative volatility (Henry’s Law Constants).
• Predict soil vapor TCE/DCE ratio.

Estimated DCE Plume Boundary (7 ug/L)
TCE/DCE > 0.5 (Henry’s Law Corrected)
TCE/DCE 0.4 – 0.5
Interpolation Boundary
TCE/DCE 0.3 – 0.4
TCE/DCE 0.2 – 0.3
TCE/DCE 0.1 – 0.2
TCE/DCE 0.01 – 0.1
Predicted TCE/DCE Ratio in Soil Vapor

Case StudyCase Study
• Map predicted soil vapor TCE/DCE ratio.
• Compare to measured indoor air TCE/DCE ratio.
• Generally excellent agreement, with some prominent exceptions due to background.
• Edge of groundwater plume clearly marked.

Estimated TCE 5 µg/L Contour in Groundwater
0.01 – 0.3
0.31 – 1.0
1.01 – 5.0
> 5.0
TCE DETECTED/ DCE NOT DETECTED
TCE AND DCE NOT DETECTED
TCE NOT DETECTED / DCE DETECTED
TCE / DCE Ratios in Pre Mitigation and Unmitigated Indoor Air

Spatial PatternsSpatial Patterns
• General correlation with plume
• Absolute concentrations within plume can be more variable and hard to correlate
• Indoor air COC ratios often indicate anomalies

Spatial Patterns (IA Ratios)Spatial Patterns (IA Ratios)
TCE/DCE
0.30
TCE/DCE
0.29
TCE/DCE
0.35
TCE/DCE
0.41
TCE/DCE
6.2
TCE/DCE
0.27
TCE/DCE
0.38
TCE/DCE
0.17
TCE/DCE
0.58

Estimated TCE 5 µg/L Contour in Groundwater
Predominately Vapor Intrusion Derived TCE
Predominately Indoor Source (background) TCE
TCE Source Attribution from Multi-media Ratio Comparison
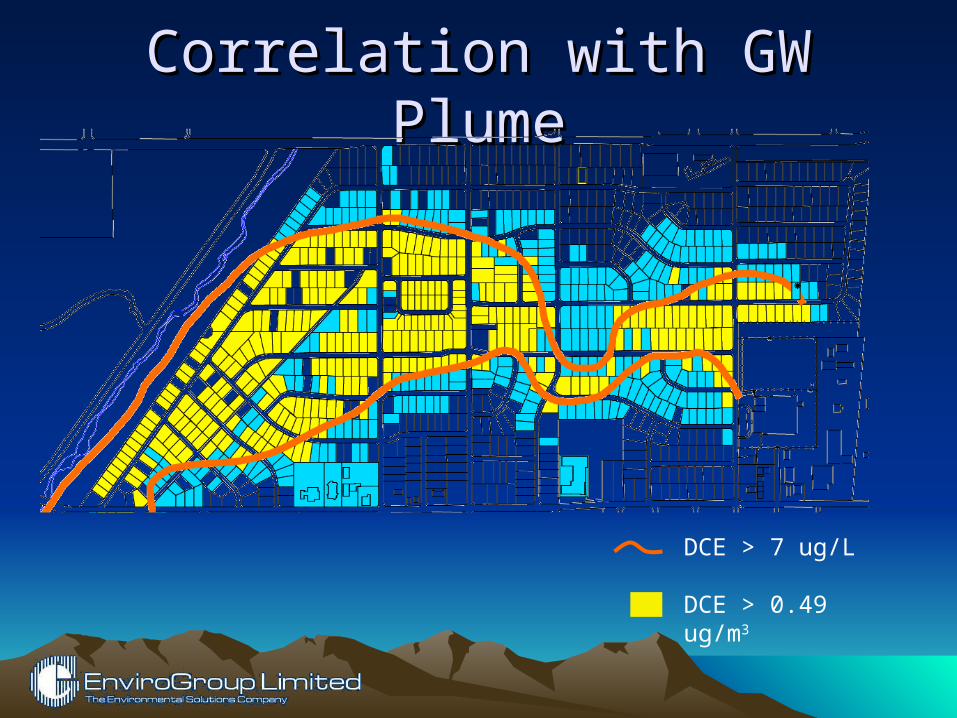
Correlation with GW PlumeCorrelation with GW Plume
DCE > 0.49 ug/m3
DCE > 7 ug/L

Case Study ResultsCase Study Results
• TCE/DCE ratio pattern distinctly marks edge of vapor intrusion – limits indoor air sampling to define “extent”.
• TCE/DCE ratio for indoor air compared to groundwater clearly shows locations with “anomalously high” background TCE.
• TCE/DCE ratio allows direct determination of maximum potential vapor intrusion derived TCE.

ImplicationsImplications
• COC ratios for chlorinated VOCs can provide an accurate method to separate background from vapor intrusion.
• Can use ratios from groundwater, soil vapor, or mitigation system emissions.
• Useful when at least two chlorinated VOCs are present in the subsurface source.

Line of EvidenceLine of EvidenceSecondary FactorsSecondary Factors
• Building survey
• Indoor air background databases

Building SurveyBuilding Survey
• Identify potential background sources– Household products– Resident activities
• Options– Delay testing– Remove and test
• Residual impacts?

Residual Background ImpactsResidual Background ImpactsHouse 1300 Indoor Air Concentration Trend
0.01
0.1
1
10
100
1000
11
/10
/20
00
1/9
/20
01
3/1
0/2
00
1
5/9
/20
01
7/8
/20
01
9/6
/20
01
11
/5/2
00
1
1/4
/20
02
3/5
/20
02
5/4
/20
02
7/3
/20
02
9/1
/20
02
10
/31
/20
02
12
/30
/20
02
2/2
8/2
00
3
4/2
9/2
00
3
6/2
8/2
00
3
8/2
7/2
00
3
10
/26
/20
03
12
/25
/20
03
2/2
3/2
00
4
4/2
3/2
00
4
6/2
2/2
00
4
8/2
1/2
00
4
10
/20
/20
04
Date
Co
nce
ntr
atio
n (
ug
/m3)
.
DCE PCE TCA TCE 0.8 ug/L Line 1.6 ug/L Line DCE ND @ DL
New Owner 12/1/2003Begin process of remodeling/cleaning

Residual Background ImpactsResidual Background ImpactsHouse 1829 Indoor Air Concentration Trend
0.01
0.1
1
10
100
10003/
26/1
998
5/25
/199
8
7/24
/199
89/
22/1
998
11/2
1/19
98
1/20
/199
9
3/21
/199
95/
20/1
999
7/19
/199
9
9/17
/199
9
11/1
6/19
991/
15/2
000
3/15
/200
0
5/14
/200
0
7/13
/200
09/
11/2
000
11/1
0/20
00
1/9/
2001
3/10
/200
15/
9/20
01
7/8/
2001
9/6/
2001
11/5
/200
11/
4/20
02
3/5/
2002
5/4/
2002
7/3/
2002
9/1/
2002
10/3
1/20
02
12/3
0/20
02
2/28
/200
34/
29/2
003
6/28
/200
3
8/27
/200
3
10/2
6/20
0312
/25/
2003
2/23
/200
4
4/23
/200
4
6/22
/200
48/
21/2
004
10/2
0/20
04
12/1
9/20
04
Date
Co
nc
en
tra
tio
n (
ug
/m3
) .
DCE PCE TCA TCE 0.8 ug/L Line 1.6 ug/L Line
UpgradeStart Tenants 11/1/1999 Shellac used

Background DatabasesBackground Databases
• Compare IA concentrations to “typical” levels in published surveys
• Concentrations within typical ranges may support other background LOE’s

1,2-DCA
DCM
PC E
TC E
C omparison o f Va rious M easures o f M ean Background Indoor Air
ug/m3
0.04
0.08
0.30
0.70
2.00
6.00
10.00
E PA (1998)M ADEP (1998)
E PA (1991)S haw& Singh
Foste r et al.(2002)Kurtz&Folke s(2002)

Databases IssuesDatabases Issues
• Data sparse for many compounds
• Comparability issues– Building type and use differences– Regional differences– Time period differences
• Extremes often removed from databases

Site-specific backgroundSite-specific background
• Control and/or mitigated buildings may not be available
• Background study may be impractical, especially for small sites
• Large number of samples required to achieve required statistical confidence

Other Lines of EvidenceOther Lines of Evidence
• Radon system emission levels/ratios
• Temporal patterns

Radon System Emission RatiosRadon System Emission Ratios
M in -M ax
25%-75%
M e d ian valu e
TCE/DCE in Curre nt Single Family Home Syste m EmissionsData from Jan 2001-June 2002 w ith DCE>1.0 ug/m3
R E S C O D E
TCE/
DC
E
0.0
0.4
0.8
1.2
1.6
2.011
25D
A11
65D
A12
05D
A12
25D
A12
35D
A12
45D
A12
85D
A12
95D
A13
05C
L13
15C
L13
19C
L46
01L
O48
00A
Z48
00K
A48
05A
Z48
05K
A48
15A
Z48
20A
Z48
25A
Z48
35A
Z
Temporal PatternsTemporal Patterns
• Requires indoor air tests over time
• Post versus pre-mitigation concentrations
• Change in resident
• Correlation with activities
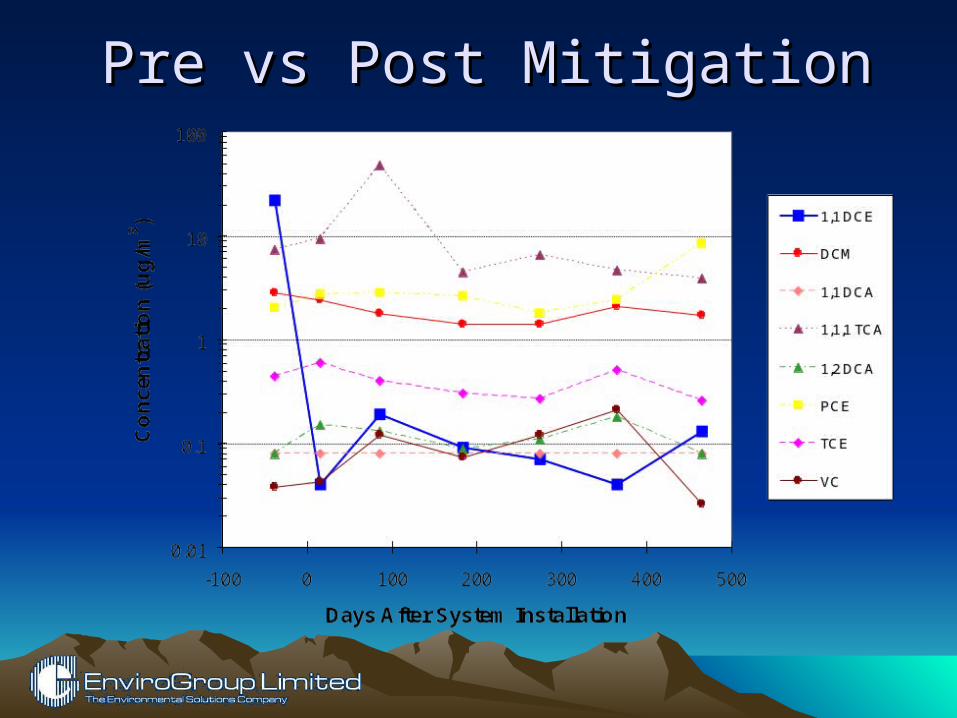
Pre vs Post MitigationPre vs Post Mitigation

Impact of ResidentImpact of ResidentHouse 1170 Indoor Air Concentration Trend
0.01
0.1
1
10
100
9/1
1/2
000
11/1
0/2
000
1/9
/2001
3/1
0/2
001
5/9
/2001
7/8
/2001
9/6
/2001
11/5
/2001
1/4
/2002
3/5
/2002
5/4
/2002
7/3
/2002
9/1
/2002
10/3
1/2
002
12/3
0/2
002
2/2
8/2
003
4/2
9/2
003
6/2
8/2
003
8/2
7/2
003
10/2
6/2
003
12/2
5/2
003
2/2
3/2
004
4/2
3/2
004
6/2
2/2
004
8/2
1/2
004
10/2
0/2
004
12/1
9/2
004
Date
Co
nc
en
tra
tio
n (
ug
/m3
) .
DCE PCE TCA TCE 0.8 ug/L Line 1.6 ug/L Line DCE ND @ DL
System Start
New Owner 11/21/2002
33
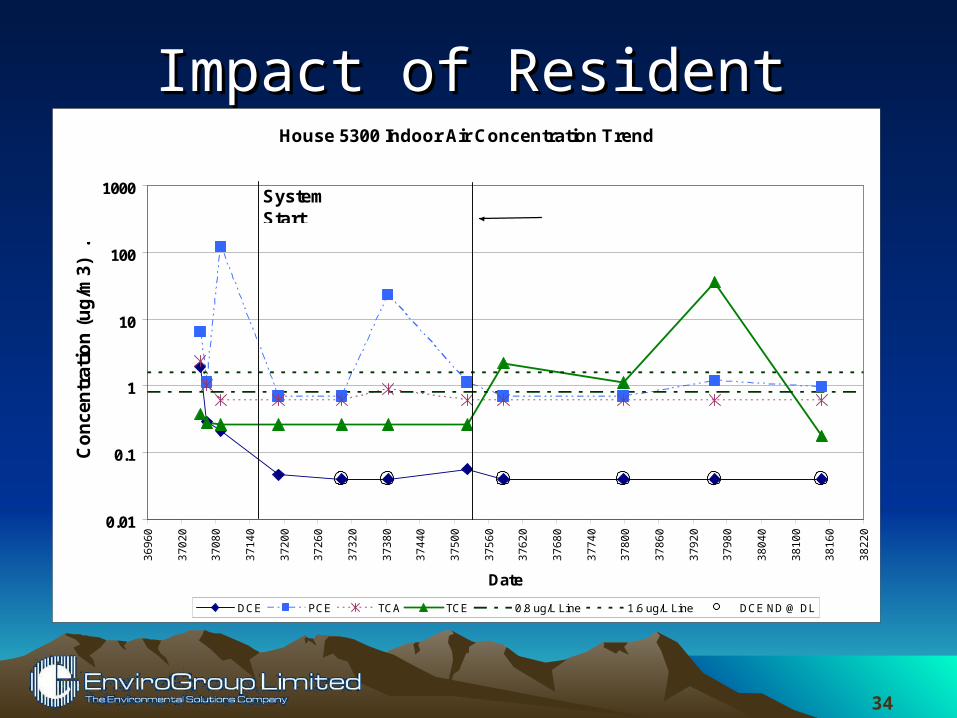
Impact of ResidentImpact of ResidentHouse 5300 Indoor Air Concentration Trend
0.01
0.1
1
10
100
1000
36
96
0
37
02
0
37
08
0
37
14
0
37
20
0
37
26
0
37
32
0
37
38
0
37
44
0
37
50
0
37
56
0
37
62
0
37
68
0
37
74
0
37
80
0
37
86
0
37
92
0
37
98
0
38
04
0
38
10
0
38
16
0
38
22
0
Date
Co
nce
ntr
atio
n (
ug
/m3)
.
DCE PCE TCA TCE 0.8 ug/L Line 1.6 ug/L Line DCE ND @ DL
System Start
New Owner 10/01/2002
34

SummarySummary
• Several lines of evidence may be needed to separate background from vapor intrusion sources of indoor air VOCs
• Comparison of COC ratios in various media is often the most compelling LOE
• If available, temporal and spatial patterns are also useful lines of evidence

ConclusionsConclusions
• VOC ratios can provide more definitive answers than assumed sub-slab to indoor air attenuation factors or the JE Model.
• VOC ratios can discriminate background on a “house-by-house” basis.
• VOC ratios can prevent the need for “background sampling”.

Information ResourcesInformation Resources
• www.envirogroup.com– Vapor Intrusion Newsletter signup– Links by state and by topic
• [email protected]– Questions