Embed Size (px)
Citation preview
DiSC® Classic Validation Report

VALIDATION REPORT
©2008 by Inscape Publishing, Inc. All Rights Reserved. Copyright secured in the US and foreign countries. “DiSC,” “Inscape Publishing,” and the Inscape logo are registered trademarks of Inscape Publishing, Inc.
DISC® Classic Validation Report Table of Contents
Introduction to the DiSC® Model ......................................................................................................3 The Validation Process....................................................................................................................4 Reliability .........................................................................................................................................5 Validity .............................................................................................................................................7
Construct Validity .........................................................................................................................7 Scale Intercorrelations .................................................................................................................7 Multidimensional Scaling of the DiSC Scales...............................................................................8 Factor Analysis of the DiSC® Items..............................................................................................9 Correlations with Other Instruments.............................................................................................9 Comparing Scale Scores with Respondent Self-Perceptions.....................................................12 Comparing Scale Scores with Respondent Attitudes.................................................................13
Norms and Group Comparisons ....................................................................................................17 Scoring of the DiSC® Profile ..........................................................................................................20 Appendix 1.....................................................................................................................................23 Appendix 2.....................................................................................................................................24 Appendix 3.....................................................................................................................................27 Appendix 4.....................................................................................................................................28 Appendix 5.....................................................................................................................................29 References ....................................................................................................................................30

VALIDATION REPORT
©2008 by Inscape Publishing, Inc. All Rights Reserved. Copyright secured in the US and foreign countries. “DiSC,” “Inscape Publishing,” and the Inscape logo are registered trademarks of Inscape Publishing, Inc.
VALIDATION REPORT
©2008 by Inscape Publishing, Inc. All Rights Reserved. Copyright secured in the US and foreign countries. “DiSC,” “Inscape Publishing,” and the Inscape logo are registered trademarks of Inscape Publishing, Inc.
3
INTRODUCTION TO THE DISC® MODEL
The DiSC® assessment is designed to measure traits that are described by the DiSC model (Marston, 1928). These traits are discussed as “styles” and are summarized briefly below.
Dominance (D): direct, strong-willed, and forceful
Influence (i): sociable, talkative, and lively
Steadiness (S): gentle, accommodating, and even-tempered
Conscientiousness (C): reserved, analytical, and logical
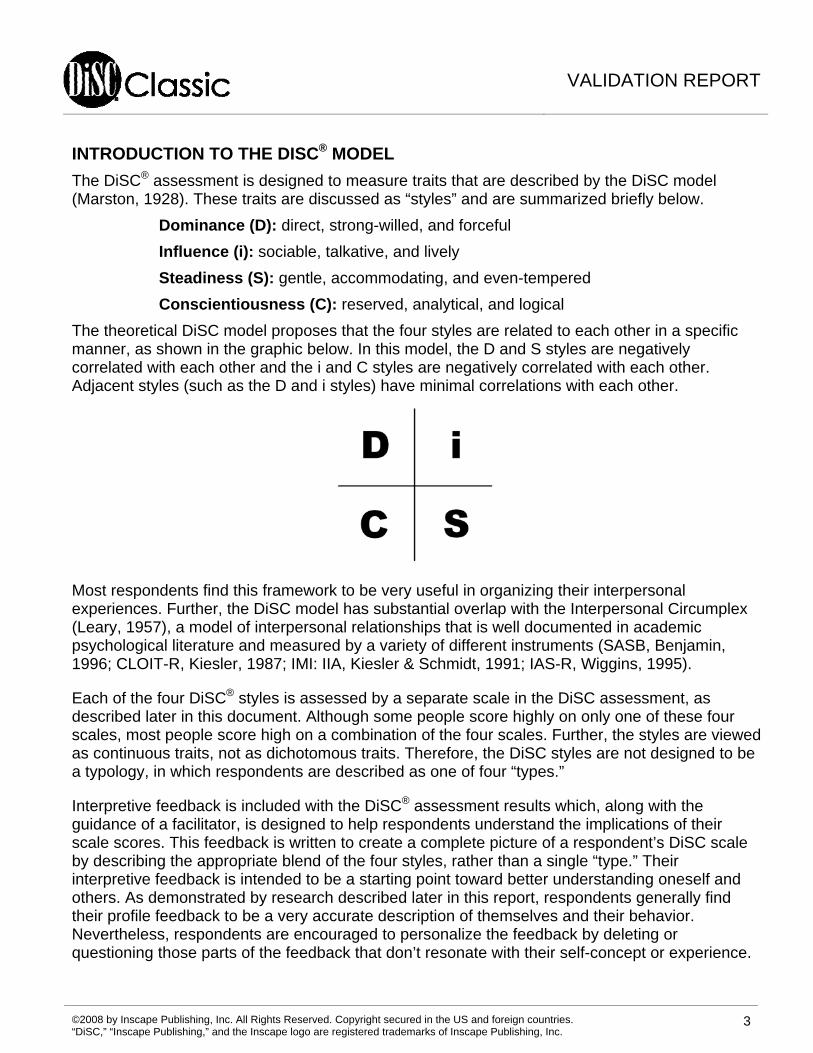
The theoretical DiSC model proposes that the four styles are related to each other in a specific manner, as shown in the graphic below. In this model, the D and S styles are negatively correlated with each other and the i and C styles are negatively correlated with each other. Adjacent styles (such as the D and i styles) have minimal correlations with each other.
Most respondents find this framework to be very useful in organizing their interpersonal experiences. Further, the DiSC model has substantial overlap with the Interpersonal Circumplex (Leary, 1957), a model of interpersonal relationships that is well documented in academic psychological literature and measured by a variety of different instruments (SASB, Benjamin, 1996; CLOIT-R, Kiesler, 1987; IMI: IIA, Kiesler & Schmidt, 1991; IAS-R, Wiggins, 1995).
Each of the four DiSC® styles is assessed by a separate scale in the DiSC assessment, as described later in this document. Although some people score highly on only one of these four scales, most people score high on a combination of the four scales. Further, the styles are viewed as continuous traits, not as dichotomous traits. Therefore, the DiSC styles are not designed to be a typology, in which respondents are described as one of four “types.”
Interpretive feedback is included with the DiSC® assessment results which, along with the guidance of a facilitator, is designed to help respondents understand the implications of their scale scores. This feedback is written to create a complete picture of a respondent’s DiSC scale by describing the appropriate blend of the four styles, rather than a single “type.” Their interpretive feedback is intended to be a starting point toward better understanding oneself and others. As demonstrated by research described later in this report, respondents generally find their profile feedback to be a very accurate description of themselves and their behavior. Nevertheless, respondents are encouraged to personalize the feedback by deleting or questioning those parts of the feedback that don’t resonate with their self-concept or experience.
VALIDATION REPORT
©2008 by Inscape Publishing, Inc. All Rights Reserved. Copyright secured in the US and foreign countries. “DiSC,” “Inscape Publishing,” and the Inscape logo are registered trademarks of Inscape Publishing, Inc.
4
THE VALIDATION PROCESS
Psychological instruments are used to measure abstract qualities that we can’t touch or see. These are characteristics like intelligence, dominance, or honesty. So how do researchers evaluate these instruments? How do we know whether such tools are actually providing accurate information about these characteristics or just generating haphazard feedback that sounds believable? Simply put, if an instrument is indeed useful and accurate, it should meet a variety of different standards that have been established by the scientific community throughout the years. Validation is the process through which researchers assess the quality of a psychological instrument by testing the tool against these different standards. This paper is designed to help you understand these different standards and see how Inscape’s DiSC instruments perform under examination. Note that the research referenced here has been done on the DiSC Classic instrument. Because it uses the same response page, this research is equally relevant to the DiSC PPSS instrument.
Validation asks two fundamental questions:
1. How reliable is the tool? That is, researchers ask if an instrument measures in a way that is consistent and dependable. If the results from a tool contain a lot of random variation, it will be deemed less reliable.
2. How valid is the tool? That is, researchers ask if an instrument measures accurately. The more that a tool measures what it proposes to measure, the more valid the tool is.
The following analogy usually helps people understand the importance of reliability and validity. Imagine that you get on your bathroom scale today and weigh yourself. Tomorrow you do the same thing, only to discover that your weight has dropped by 30%. Although you may be delighted at first, reality will eventually set in. Your weight didn’t change, the scale did. Would you trust such a scale? No. It’s not reliable.
But now let’s imagine a second instance in which you weighed yourself twice and both times the scale shows that you weigh about half of what you expected. So although you may have a reliable scale, it’s reliably wrong. The scale doesn’t measure what it proposes to measure: your weight. It’s not valid.
In the first instance, the scale is neither reliable nor valid. That is, the scale can’t be a valid measurement of your weight if it fluctuates randomly and unreliably in its results. Therefore, an instrument cannot be valid if it is not reliable. In the second instance, however, we have a scale that is reliable but not valid. It does measure consistently (i.e., reliably), but that measurement is not accurate (i.e., valid.)
Note that no psychometric tool is perfectly reliable or perfectly valid. All psychological instruments are subject to various sources of error. Reliability and validity are seen as matters of degree on continuous scales, rather than reliable/unreliable and valid/invalid on dichotomous scales. Consequently, it is more appropriate to ask, “How much evidence is there for the reliability/validity of this tool?” than “Is this tool reliable/valid?”
VALIDATION REPORT
©2008 by Inscape Publishing, Inc. All Rights Reserved. Copyright secured in the US and foreign countries. “DiSC,” “Inscape Publishing,” and the Inscape logo are registered trademarks of Inscape Publishing, Inc.
5
RELIABILITY
When we talk of reliability in relation to profiles such as Inscape Publishing’s DiSC® assessments, then we are referring partly to the tool’s stability and partly to its internal consistency.
Stability refers to the tool’s ability to yield the same measurements over a period of time. This is generally tested by having the same people fill out the tool’s questionnaire twice, with a suitable time interval between the two measurements (the so-called test-retest.) The results are then compared to determine how strongly they relate to each other (or correlate). If a person’s DiSC style has remained unchanged, a stable tool should produce results that are quite similar between two different administrations. In reality, however, it is almost impossible to obtain perfect test-retest reliability on any sophisticated psychological test, even if the individual in question does not change on the measured attribute. This is because test results are influenced by a variety of extraneous factors that are unrelated to the characteristics that the test intends to measure. For instance, someone who is tired during one testing will answer differently than she will on a second testing when she is well rested. Similarly, another person will respond to a test differently depending on the mood he is in. Generally speaking, the longer the interval between two test administrations, the greater the chance that these random variables can artificially lower the test-retest reliability of an instrument. In other words, the longer the time period between two testings, the lower we would expect the test-retest reliability to be.
In practical terms, the stability of DiSC (i.e., test-retest reliability) is measured by asking a group of respondents to take a DiSC instrument on one occasion and then asking those same respondents to take the same test again at a later time. If the instrument is stable, the results of the instrument shouldn’t change much. This stability can be quantified in the form of a reliability coefficient, which is a statistic that is generated by looking at the mathematical relationship between a group’s initial scores on an instrument and their subsequent scores. Reliability coefficients range between -1 and +1. The closer that a correlation coefficient is to +1, the more stable the instrument is considered to be. Researchers generally use the following guidelines to help them interpret these test-retest reliability coefficients: coefficients above .70 are considered acceptable, and coefficients above .80 are considered very good.
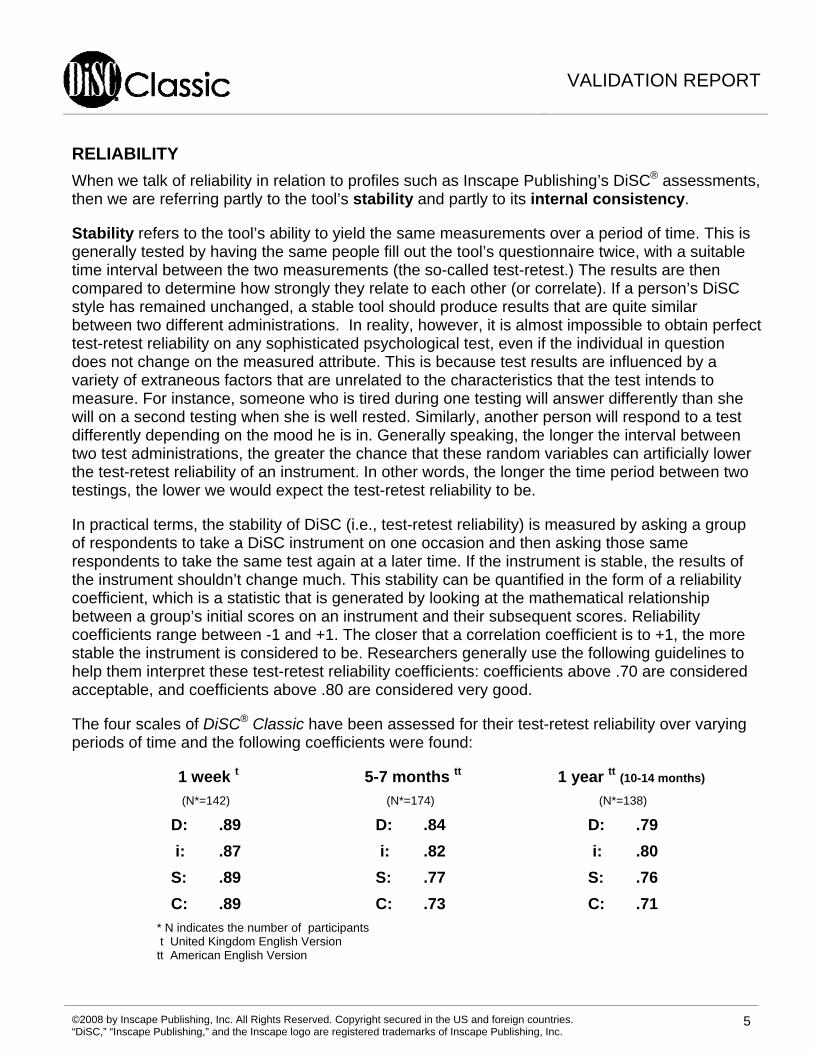
The four scales of DiSC® Classic have been assessed for their test-retest reliability over varying periods of time and the following coefficients were found:
1 week t 5-7 months tt 1 year tt (10-14 months)
(N*=142) (N*=174) (N*=138)
D: .89 D: .84 D: .79
i: .87 i: .82 i: .80
S: .89 S: .77 S: .76
C: .89 C: .73 C: .71
* N indicates the number of participants t United Kingdom English Version tt American English Version
VALIDATION REPORT
©2008 by Inscape Publishing, Inc. All Rights Reserved. Copyright secured in the US and foreign countries. “DiSC,” “Inscape Publishing,” and the Inscape logo are registered trademarks of Inscape Publishing, Inc.
6
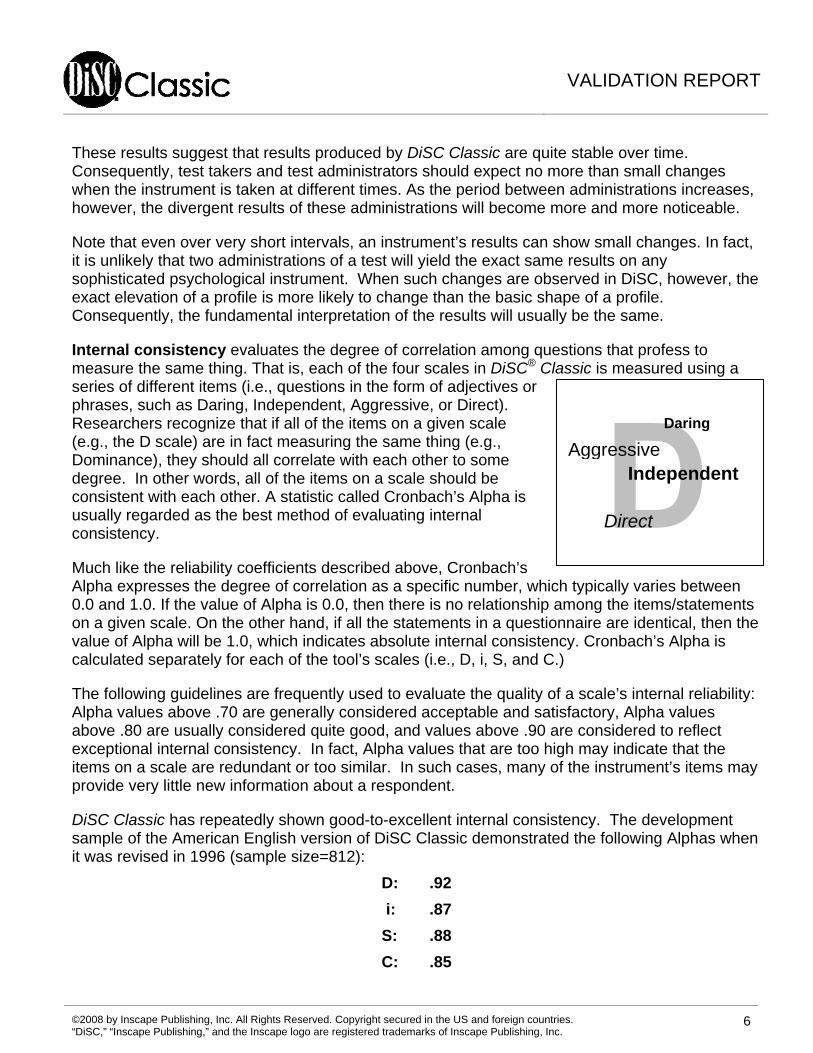
Daring
Aggressive
Direct
Independent
These results suggest that results produced by DiSC Classic are quite stable over time. Consequently, test takers and test administrators should expect no more than small changes when the instrument is taken at different times. As the period between administrations increases, however, the divergent results of these administrations will become more and more noticeable.
Note that even over very short intervals, an instrument’s results can show small changes. In fact, it is unlikely that two administrations of a test will yield the exact same results on any sophisticated psychological instrument. When such changes are observed in DiSC, however, the exact elevation of a profile is more likely to change than the basic shape of a profile. Consequently, the fundamental interpretation of the results will usually be the same.
Internal consistency evaluates the degree of correlation among questions that profess to measure the same thing. That is, each of the four scales in DiSC® Classic is measured using a series of different items (i.e., questions in the form of adjectives or phrases, such as Daring, Independent, Aggressive, or Direct). Researchers recognize that if all of the items on a given scale (e.g., the D scale) are in fact measuring the same thing (e.g., Dominance), they should all correlate with each other to some degree. In other words, all of the items on a scale should be consistent with each other. A statistic called Cronbach’s Alpha is usually regarded as the best method of evaluating internal consistency.
Much like the reliability coefficients described above, Cronbach’s Alpha expresses the degree of correlation as a specific number, which typically varies between 0.0 and 1.0. If the value of Alpha is 0.0, then there is no relationship among the items/statements on a given scale. On the other hand, if all the statements in a questionnaire are identical, then the value of Alpha will be 1.0, which indicates absolute internal consistency. Cronbach’s Alpha is calculated separately for each of the tool’s scales (i.e., D, i, S, and C.)
The following guidelines are frequently used to evaluate the quality of a scale’s internal reliability: Alpha values above .70 are generally considered acceptable and satisfactory, Alpha values above .80 are usually considered quite good, and values above .90 are considered to reflect exceptional internal consistency. In fact, Alpha values that are too high may indicate that the items on a scale are redundant or too similar. In such cases, many of the instrument’s items may provide very little new information about a respondent.
DiSC Classic has repeatedly shown good-to-excellent internal consistency. The development sample of the American English version of DiSC Classic demonstrated the following Alphas when it was revised in 1996 (sample size=812):
D: .92
i: .87
S: .88
C: .85
VALIDATION REPORT
©2008 by Inscape Publishing, Inc. All Rights Reserved. Copyright secured in the US and foreign countries. “DiSC,” “Inscape Publishing,” and the Inscape logo are registered trademarks of Inscape Publishing, Inc.
7
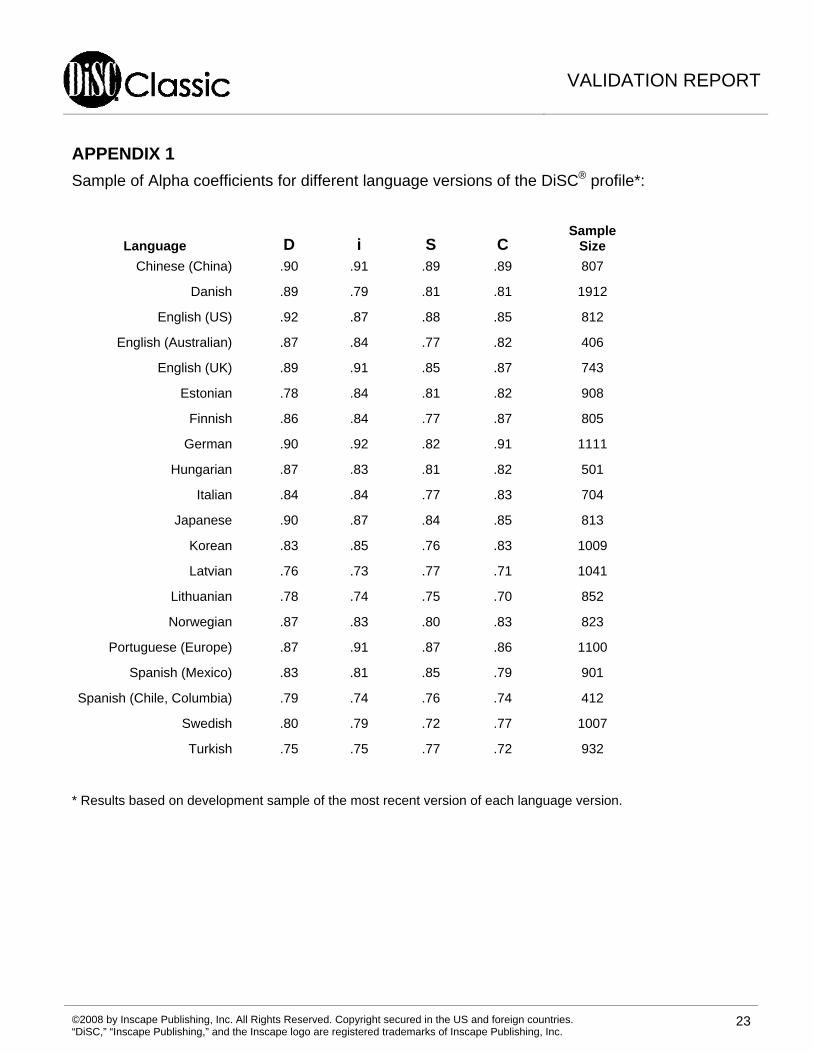
Repeated research since that time has produced similar Alpha coefficients on the US English version, as well as on other language versions that have been developed throughout the world. Appendix 1 contains a sample of the Alpha coefficients for different language versions of DiSC Classic. All of these coefficients are above the .70 cutoff and the majority of them are well above this cutoff. Demographic characteristics of the US English 1996 development sample are shown in Appendix 2.
VALIDITY
As already mentioned, validity indicates the degree to which a tool measures that which it has been designed to measure. Assessing the validity of a psychological tool that measures abstract qualities (like intelligence, dominance, or honesty) can be tricky. There are, however, a number of basic strategies that researchers use to answer the question, “How well is this instrument measuring what it says it’s measuring?” The validation strategies that will be discussed here fall under the heading of construct validity.
Construct Validity
Construct validity examines the validity of a tool on a highly theoretical level. A construct is an abstract idea or concept (such as intelligence, dominance, or honesty) that is used to make sense of our experience. The D scale of DiSC®, for example, measures the construct of dominance. This construct of dominance, in turn, is theoretically related to a variety of other constructs. For instance, it is reasonable to assume that someone who is very dominant will be rated as more aggressive by their peers. Thus, dominance and peer ratings of aggressiveness are theoretically linked. Consequently, if our measure of dominance has high validity, it should correlate highly with peer ratings of aggressiveness. This is essentially what researchers do when they examine construct validity. First, they specify a series of theoretical relationships (e.g., the construct of dominance is theoretically rated to the constructs of X, Y, and Z). Then they test these theoretical relationships empirically to see if the relationships actually exist. If the proposed relationships do exist, the instrument is thought to have higher validity.
Scale Intercorrelations
As you might imagine, there are a variety of different ways to test construct validity. First, we can examine the validity of an instrument as a whole. Instruments like DiSC® propose an underlying model in which the scales within the tool have a specific relationship to each other. Researchers examine the actual relationship among the scales to see if they reflect the theoretical relationship proposed by the model.
The DiSC model proposes that adjacent scales (e.g., C/S or C/D) will have weak to moderate correlations. That is, these correlations should be considerably smaller than the Alpha reliabilities of the individual scales. For example, the correlation between the D and i scales (-.11) should be substantially lower than the alpha reliability of the D scale (.87). On the other hand, complementary scales (e.g., D/S or C/i) are theoretically opposite and so they should have strong negative correlations. Table 1 shows data obtained from a 2002 sample of 7,038 respondents who completed the US English version of DiSC Classic. The correlations among the D, i, S, and C scales do support this model. That is, strong negative correlations are observed between C and
VALIDATION REPORT
©2008 by Inscape Publishing, Inc. All Rights Reserved. Copyright secured in the US and foreign countries. “DiSC,” “Inscape Publishing,” and the Inscape logo are registered trademarks of Inscape Publishing, Inc.
8
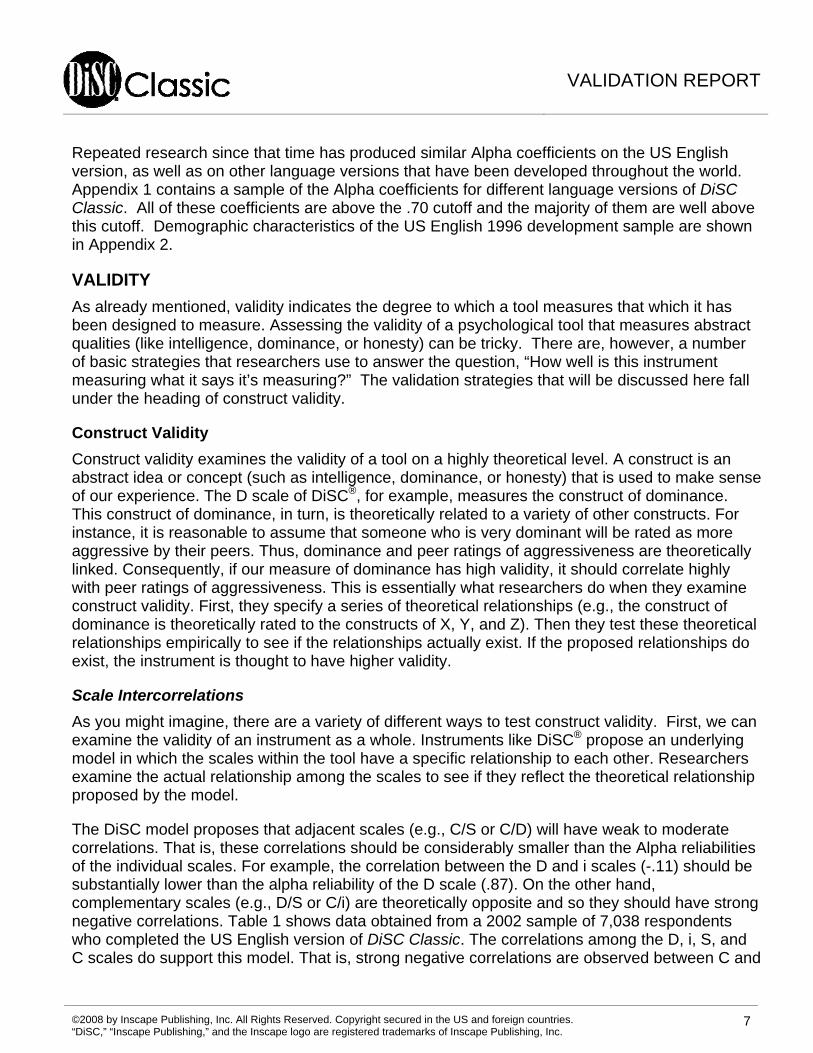
i, and between S and D. Further, weak to moderate correlations are observed between adjacent pairs of scales.
Table 1. Intercorrelations among the DiSC® Classic Scales
D i S C
D .87
i -.11 .81
S -.82 -.22 .82
C -.37 -.71 .30 .77
Cronbach’s Alpha reliabilities are shown in bold along the diagonal, and the correlation coefficients among scales are shown within the body of the table. Correlation coefficients range from -1 to +1. A correlation of +1 indicates that two variables are perfectly positively correlated such that as one variable increases, the other variable increases by a proportional amount. A correlation of -1 indicates that two variables are perfectly negatively correlated, such that as one variable increases, the other variable decreases by a proportional amount. A correlation of 0 indicates that two variables are completely unrelated. The following guidelines can help you interpret the relative strength of these correlation coefficients (both positive and negative): very weak correlations range from 0.0 to .2, weak correlations range from .2 to .4, moderate correlations range from .4 to .6, strong correlations range from .6 to .8, and very strong correlations range from .8 to 1.0.
Multidimensional Scaling of the DiSC Scales
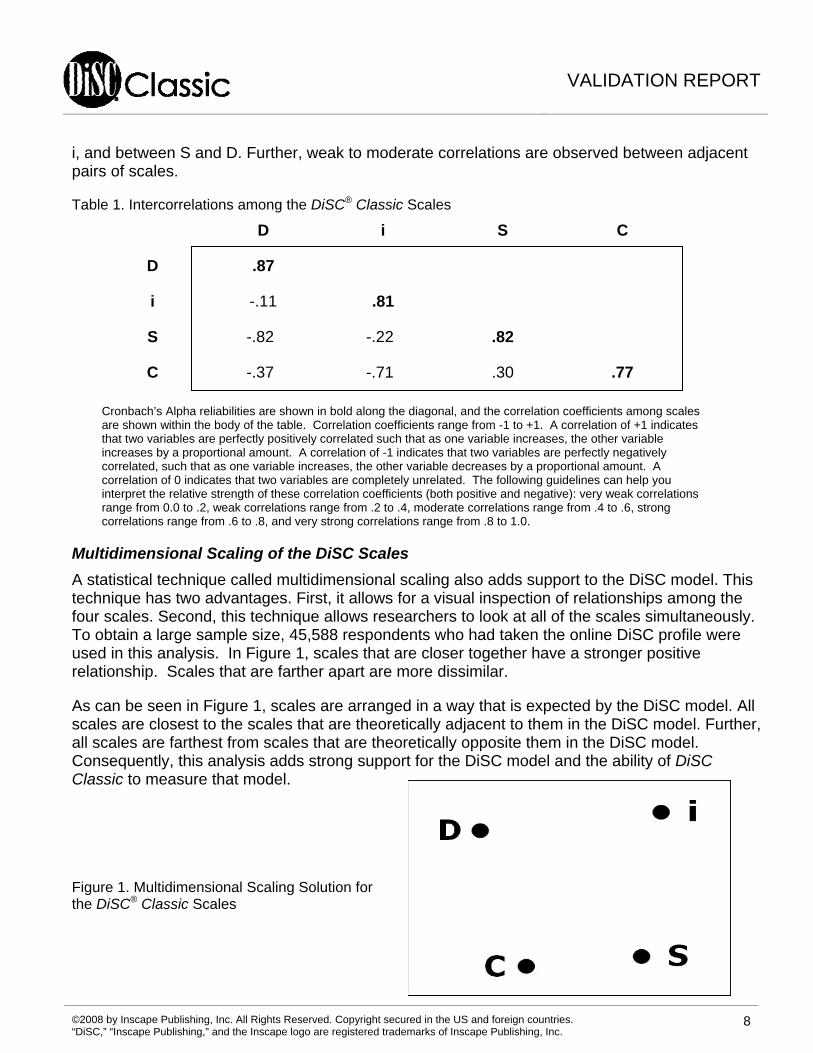
A statistical technique called multidimensional scaling also adds support to the DiSC model. This technique has two advantages. First, it allows for a visual inspection of relationships among the four scales. Second, this technique allows researchers to look at all of the scales simultaneously. To obtain a large sample size, 45,588 respondents who had taken the online DiSC profile were used in this analysis. In Figure 1, scales that are closer together have a stronger positive relationship. Scales that are farther apart are more dissimilar.
As can be seen in Figure 1, scales are arranged in a way that is expected by the DiSC model. All scales are closest to the scales that are theoretically adjacent to them in the DiSC model. Further, all scales are farthest from scales that are theoretically opposite them in the DiSC model. Consequently, this analysis adds strong support for the DiSC model and the ability of DiSC Classic to measure that model.
Figure 1. Multidimensional Scaling Solution for the DiSC® Classic Scales
VALIDATION REPORT
©2008 by Inscape Publishing, Inc. All Rights Reserved. Copyright secured in the US and foreign countries. “DiSC,” “Inscape Publishing,” and the Inscape logo are registered trademarks of Inscape Publishing, Inc.
9
Factor Analysis of the DiSC® Items
Another method used to assess the validity of DiSC Classic is factor analysis. Unlike the correlational analysis and multidimensional scaling analysis described above, the factor analysis described here was used to examine the DiSC® instrument at the level of items rather than at the level of scales.
Generally speaking, factor analysis helps researchers understand which items are highly correlated and thus group together to form a scale. This statistical technique takes into account the correlations among all of the items within a test and identifies independent factors (or dimensions) that explain those correlations. The DiSC model proposes that two primary factors (or dimensions) underlie the four DiSC scales. If this model is sufficiently measured by DiSC Classic, a factor analysis should identify two independent dimensions. Further, items on the i and C scales should correlate highly with one factor and items on the D and S scales should correlate highly with the other factor. In summary, factor analysis was used to confirm: 1) the two-dimensional structure of the DiSC model as measured by DiSC Classic; and 2) confirm that items were assigned to the appropriate scale.
The results of a factor analysis on 812 participants in the DiSC Classic developmental sample demonstrated that for each of the DiSC scales, items grouped together in the expected fashion. Two clear factors emerged in the analysis that reflected the two dimensions proposed in the DiSC® model (i.e., one factor with D and S items and one factor with i and C items). In addition, the vast majority of the DiSC items were most strongly correlated with their expected factor. In a subsequent analysis, using a sample size of 45,588, the 112 DiSC items were submitted to factor analysis using a Varimax rotation. A two-factor solution was specified. In the rotated solution, over 90% of the items loaded most highly on the appropriate factor. That is, D and S items loaded most highly on the first factor and I and C items loaded most highly on the second factor. These results support the appropriateness of the DiSC Classic items to measure the two dimensions within the DiSC model.
Correlations with Other Instruments
When validating an instrument, test developers recognize that it is important to understand the relationship that a given instrument (e.g., DiSC) has with other psychological tools in the field. In particular, researchers identify instruments that measure constructs (such as aggressiveness, playfulness, or emotional stability) that are theoretically related to constructs measured by the instrument in question (such as Dominance, Influence, or Steadiness.) For instance, the Influence scale of DiSC is theoretically related to the construct of extraversion. Consequently, the Influence scale should correlate highly with scales on other tools that measure extraversion. This type of construct validity is often called convergent validity.
The 16PF One of the instruments with which DiSC has been correlated is the Cattell 16 Personality Factor Questionnaire (16PF). This instrument was developed by Raymond Cattell in the 1940s using a largely factor analytic methodology. It proposes to measure 16 traits that represent the major dimensions of differences within human personality. These traits describe a person's individual
VALIDATION REPORT
©2008 by Inscape Publishing, Inc. All Rights Reserved. Copyright secured in the US and foreign countries. “DiSC,” “Inscape Publishing,” and the Inscape logo are registered trademarks of Inscape Publishing, Inc.
10
style of perceiving, thinking, and acting in a wide variety of situations over a relatively extended period of time.
For the purposes of DiSC validation, we are only interested in those scales that are theoretically related to the constructs measured by DiSC. A group of 103 participants were asked to take both the DiSC instrument and the 16PF. (The DiSC instrument used was the predecessor to the current DiSC Classic.) The scales of the two instruments were then correlated. The following paragraphs describe a series of hypothesized correlations based on the theoretical DiSC model, along with the empirical support for these hypotheses.
The Dominance scale of the 16PF should be positively correlated with the D scale of DiSC and negatively correlated with the S scale of DiSC. Analyses confirmed that the Dominance scale of the 16PF was strongly and positively correlated with the D scale of the DiSC instrument (r= .62) and strongly and negatively correlated with the S scale (r= -.52).
The Liveliness scale of the 16PF should be positively correlated with the i scale of the DiSC® instrument. Data supports this hypothesis and shows a strong positive relationship between these two scales (r= .61). The Liveliness scale also demonstrated a moderate negative correlation with the C scale of DiSC (r= -.45).
The Sensitivity scale of the 16PF measures people on a continuum that ranges from utilitarian, unsentimental, and tough-minded on the low end to sensitive, sentimental, and tender-minded on the high end. This sensitivity construct is touched upon in the D and S scales of DiSC, but only indirectly. Therefore, the D scale of DiSC should show a negative but moderate correlation with the Sensitivity scale and the S scale should show a positive but moderate relationship. The data support this hypothesis. The D scale demonstrated a negative and moderate, but statistically significant relationship with the Sensitivity scale. The S scale showed a positive correlation with the Sensitivity scale, although this relationship was not statistically significant.
The Rule Consciousness scale of the 16PF measures people on a continuum that ranges from self-indulgent and rule-disregarding on the low end to dutiful and rule-conscious on the high end. This rule-consciousness construct is measured indirectly by the C scale of DiSC, and so we would expect a positive, but moderate relationship between these two scales. The data indicate a small but statistically significant relationship between the C scale of DiSC and the Rule Consciousness scale of the 16PF.
The Social Boldness scale of the 16PF measures people on a continuum that ranges from shy and threat-sensitive on the low end to bold and adventurous on the high end. From a theoretical perspective, this Social Boldness scales should correlate moderately with each of the four DiSC scales. The S and C scales should show moderate negative correlations and the D and i scales should show moderate positive relationships. The data support three of these four hypothesized correlations. The S and C scales both showed negative, statistically significant correlations with this scale. In addition, the i scale showed a positive, statistically significant correlation with the scale. Although the D scale did have
VALIDATION REPORT
©2008 by Inscape Publishing, Inc. All Rights Reserved. Copyright secured in the US and foreign countries. “DiSC,” “Inscape Publishing,” and the Inscape logo are registered trademarks of Inscape Publishing, Inc.
11
a positive correlation with the Social Boldness scale as expected, this correlation was smaller than theorized.
The Privateness scale of the 16PF measures people on a continuum that ranges from forthright and open on the low end to discreet and non-disclosing on the high end. The DiSC scales touch indirectly on this construct. Specifically, we would expect that the i scale of DiSC would have a negative, but moderate relationship with this scale. Further, we would expect that the C scale would have a positive, but moderate relationship with privateness. The data support these hypotheses. The i scale showed a moderately negative correlation with the Privateness scale that was statistically significant. As well, the C scale showed a moderately positive correlation with the Privateness scale that was statistically significant.
The MBTI® The Myers-Briggs Type Indicator® (MBTI) is a personality inventory based on the theoretical work of Carl Jung. It proposes to measure an individual’s stable, personal preferences on four primary scales (i.e., Introversion/Extraversion, Sensing/Intuition, Thinking/Feeling, and Judging/Perceiving). Based on the theoretical DiSC® model, only one of the MBTI scales (i.e., Introversion/Extraversion) was proposed to have a strong relationship with the scales of the DiSC profile. Another MBTI scale (i.e., Thinking/Feeling), however, was expected to have moderate or weak relationship with the scales of the DiSC profile. To examine the relationship between these two instruments, 103 people were asked to take both the MBTI and DiSC profile. (The DiSC instrument used was the predecessor to the current DiSC Classic.) The following paragraphs describe the research hypotheses in more detail and document the results that were found.
The Introversion/Extraversion scale (I/E) of the MBTI proposes to measure the source of one’s personal energy. Introverts (i.e., those who score low on this scale) are thought to derive their energy from reflecting on an inner world of information, ideas, or concepts. People who receive low scores on the I/E scale are often described as contained, reflective, or quiet. These same adjectives are frequently used to describe individuals who score highly on the C scale of the DiSC profile. Consequently, we should expect a negative correlation between these two scales. On the other hand, Extraverts (i.e., those who score highly on this scale) are thought to derive their energy from interaction with the outer world of people or things. People who score highly on this scale are often described as expressive, gregarious, or enthusiastic. These same adjectives are often also used to describe people who score highly on the i scale of the DiSC profile. Consequently, these two scales should be positively correlated. The data support these hypotheses. The i scale of the DiSC profile correlated strongly and positively (r=.65) with the I/E scale. The C scale demonstrated a negative correlation with the I/E scale (r=-.35), although this correlation was more moderate in strength. Both correlations were statistically significant.
The Thinking/Feeling scale (T/F) of the MBTI proposes to measure the method in which a person makes decisions or draws conclusions. Those who make decisions based on objective, logical analysis are described as Thinking. This is indicated by a low score on the T/F scale. Similarly, the D and C styles within the DiSC model are also proposed to make frequent decisions based on these criteria. Consequently, we would expect weak-to-
VALIDATION REPORT
©2008 by Inscape Publishing, Inc. All Rights Reserved. Copyright secured in the US and foreign countries. “DiSC,” “Inscape Publishing,” and the Inscape logo are registered trademarks of Inscape Publishing, Inc.
12
moderate negative correlations between the T/F scale and both the D and C scales of the DiSC profile. Those who make decisions based on personal values for the purpose of creating harmony are described as Feeling. This is indicated by a high score on the T/F scale. In the DiSC model, the i and S styles are also proposed to make frequent decisions based on these criteria. Therefore, we would expect to see weak-to-moderate positive correlations between the T/F scale and both the i and S scales of the DiSC profile. The results of the data analysis show that the T/F scale did, in fact, have a negative correlation with the D scale, but had a slightly positive correlation with the C scale. (This correlation, however, was not statistically significant). The i and S scales of the DiSC profile, however, did demonstrate the expected positive correlations with the T/F scale.
Comparing Scale Scores with Respondent Self-Perceptions
The DiSC® assessment includes not only scale scores, but also narrative feedback designed to help respondents interpret those scale scores and understand the implications of their results. For more than 35 years, anecdotal evidence has suggested that the feedback within the DiSC report resonates with the vast majority of DiSC assessment takers, who find it to be an accurate description of themselves. Psychologists, however, recognize that respondents will often “read into” their assessment results and agree with a very broad range of scale interpretations, particularly if they are positive (i.e., the Forer effect (Forer, 1949)). Consequently, it is necessary to empirically evaluate how well psychological scales and the interpretation of those scales represent the characteristics of the respondent.
A group of 3,398 participants were asked to take the DiSC assessment. They then read four paragraphs (such as the one below), and after reading each one they rated how well each paragraph described them on a seven-point scale ranging from Doesn’t describe me at all (1) to Describes me very well (7). Each of the four paragraphs reflected one of the four DiSC styles.
Sample Paragraph: Describing the D Style
My determination and insistence keeps things moving and helps me get real results. I’m fairly direct and candid and may even be seen as blunt by others. I don’t usually sugarcoat my opinions, and I’m straightforward and frank with my feedback even if it’s not what the other person wants to hear. I can also come across as dominant or forceful when I have a clear sense of how things should be. I may become a little aggressive, persistent, or even demanding if I know it will get the job done.
(All four paragraphs used in this research project are included in Appendix 3).
Responses to the four paragraphs were correlated with the four DiSC scales, as shown in parentheses on Table 2. Response bias, such as social desirability or responding toward the middle, can distort the accuracy of participant paragraph ratings. For instance, a participant who wants to appear in a favorable light may give high ratings to all paragraphs. In such a case, her ratings are artificially inflated by the response bias of social desirability, and consequently, her responses are a less accurate reflection of her true behavior and tendencies. To control for
VALIDATION REPORT
©2008 by Inscape Publishing, Inc. All Rights Reserved. Copyright secured in the US and foreign countries. “DiSC,” “Inscape Publishing,” and the Inscape logo are registered trademarks of Inscape Publishing, Inc.
13
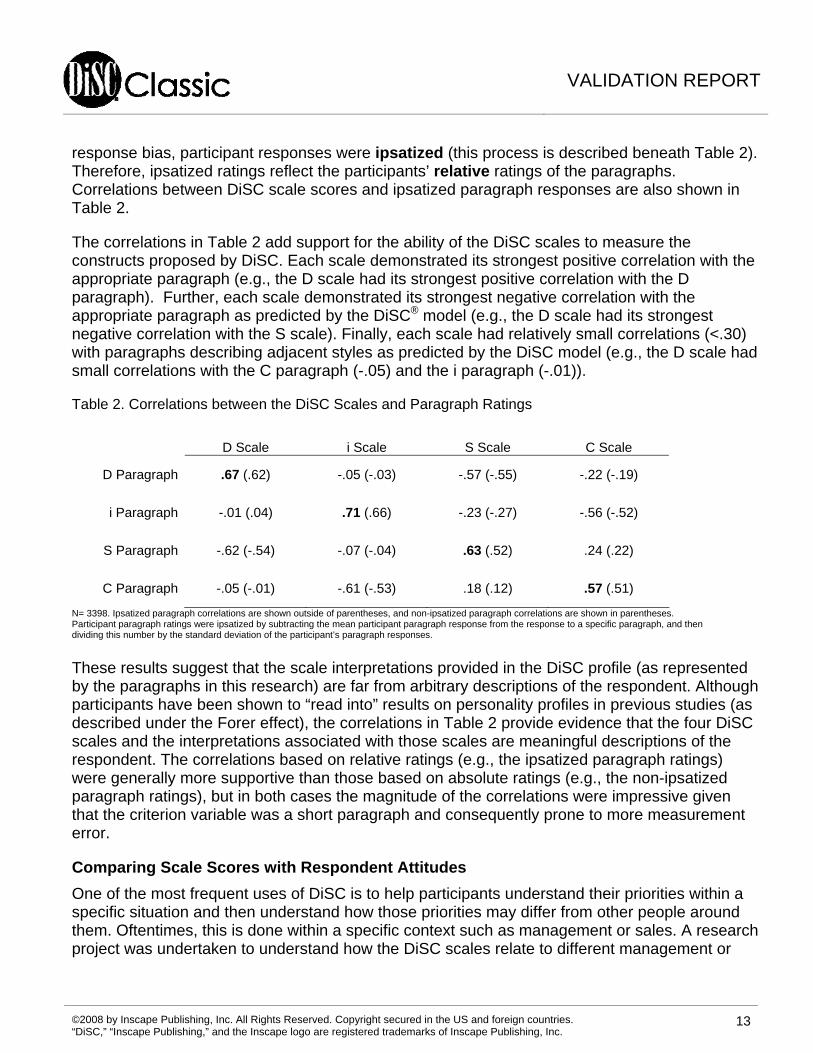
response bias, participant responses were ipsatized (this process is described beneath Table 2). Therefore, ipsatized ratings reflect the participants’ relative ratings of the paragraphs. Correlations between DiSC scale scores and ipsatized paragraph responses are also shown in Table 2.
The correlations in Table 2 add support for the ability of the DiSC scales to measure the constructs proposed by DiSC. Each scale demonstrated its strongest positive correlation with the appropriate paragraph (e.g., the D scale had its strongest positive correlation with the D paragraph). Further, each scale demonstrated its strongest negative correlation with the appropriate paragraph as predicted by the DiSC® model (e.g., the D scale had its strongest negative correlation with the S scale). Finally, each scale had relatively small correlations (<.30) with paragraphs describing adjacent styles as predicted by the DiSC model (e.g., the D scale had small correlations with the C paragraph (-.05) and the i paragraph (-.01)).
Table 2. Correlations between the DiSC Scales and Paragraph Ratings
D Scale i Scale S Scale C Scale
D Paragraph .67 (.62) -.05 (-.03) -.57 (-.55) -.22 (-.19)
i Paragraph -.01 (.04) .71 (.66) -.23 (-.27) -.56 (-.52)
S Paragraph -.62 (-.54) -.07 (-.04) .63 (.52) .24 (.22)
C Paragraph -.05 (-.01) -.61 (-.53) .18 (.12) .57 (.51)
N= 3398. Ipsatized paragraph correlations are shown outside of parentheses, and non-ipsatized paragraph correlations are shown in parentheses. Participant paragraph ratings were ipsatized by subtracting the mean participant paragraph response from the response to a specific paragraph, and then dividing this number by the standard deviation of the participant’s paragraph responses.
These results suggest that the scale interpretations provided in the DiSC profile (as represented by the paragraphs in this research) are far from arbitrary descriptions of the respondent. Although participants have been shown to “read into” results on personality profiles in previous studies (as described under the Forer effect), the correlations in Table 2 provide evidence that the four DiSC scales and the interpretations associated with those scales are meaningful descriptions of the respondent. The correlations based on relative ratings (e.g., the ipsatized paragraph ratings) were generally more supportive than those based on absolute ratings (e.g., the non-ipsatized paragraph ratings), but in both cases the magnitude of the correlations were impressive given that the criterion variable was a short paragraph and consequently prone to more measurement error.
Comparing Scale Scores with Respondent Attitudes
One of the most frequent uses of DiSC is to help participants understand their priorities within a specific situation and then understand how those priorities may differ from other people around them. Oftentimes, this is done within a specific context such as management or sales. A research project was undertaken to understand how the DiSC scales relate to different management or
VALIDATION REPORT
©2008 by Inscape Publishing, Inc. All Rights Reserved. Copyright secured in the US and foreign countries. “DiSC,” “Inscape Publishing,” and the Inscape logo are registered trademarks of Inscape Publishing, Inc.
14
sales priorities. This project was also used to explore how various management or sales priorities relate to each other.
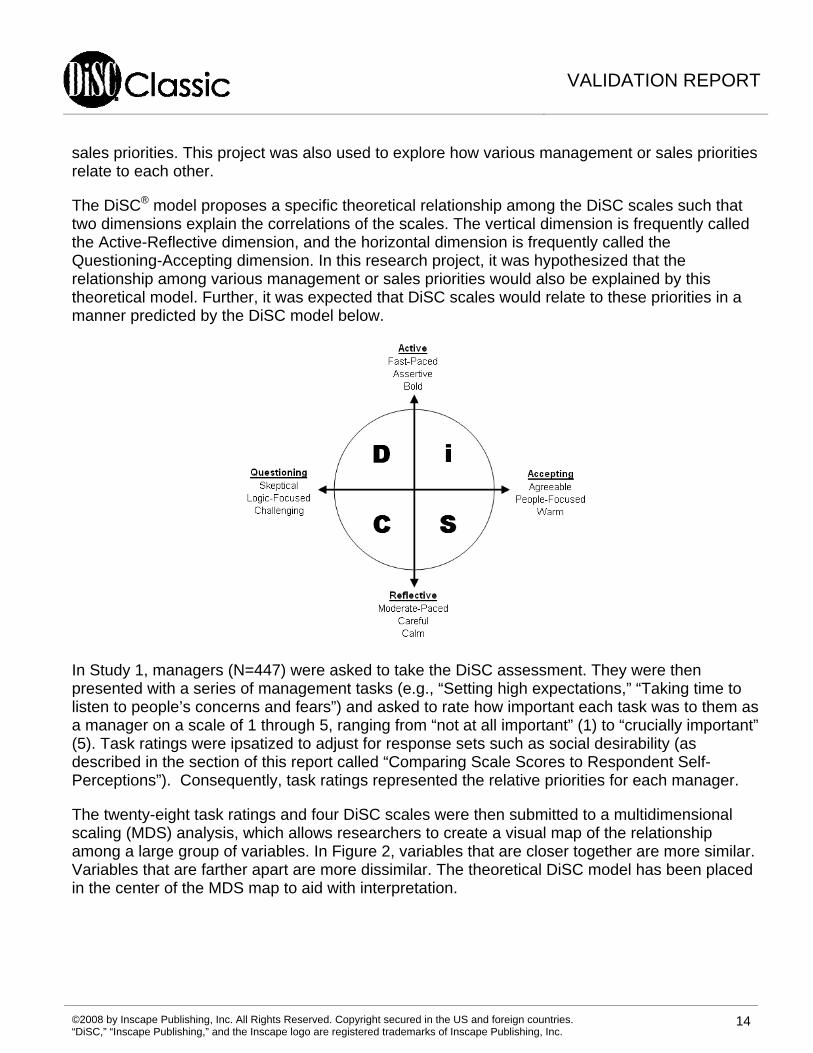
The DiSC® model proposes a specific theoretical relationship among the DiSC scales such that two dimensions explain the correlations of the scales. The vertical dimension is frequently called the Active-Reflective dimension, and the horizontal dimension is frequently called the Questioning-Accepting dimension. In this research project, it was hypothesized that the relationship among various management or sales priorities would also be explained by this theoretical model. Further, it was expected that DiSC scales would relate to these priorities in a manner predicted by the DiSC model below.
In Study 1, managers (N=447) were asked to take the DiSC assessment. They were then presented with a series of management tasks (e.g., “Setting high expectations,” “Taking time to listen to people’s concerns and fears”) and asked to rate how important each task was to them as a manager on a scale of 1 through 5, ranging from “not at all important” (1) to “crucially important” (5). Task ratings were ipsatized to adjust for response sets such as social desirability (as described in the section of this report called “Comparing Scale Scores to Respondent Self-Perceptions”). Consequently, task ratings represented the relative priorities for each manager.
The twenty-eight task ratings and four DiSC scales were then submitted to a multidimensional scaling (MDS) analysis, which allows researchers to create a visual map of the relationship among a large group of variables. In Figure 2, variables that are closer together are more similar. Variables that are farther apart are more dissimilar. The theoretical DiSC model has been placed in the center of the MDS map to aid with interpretation.
VALIDATION REPORT
©2008 by Inscape Publishing, Inc. All Rights Reserved. Copyright secured in the US and foreign countries. “DiSC,” “Inscape Publishing,” and the Inscape logo are registered trademarks of Inscape Publishing, Inc.
15
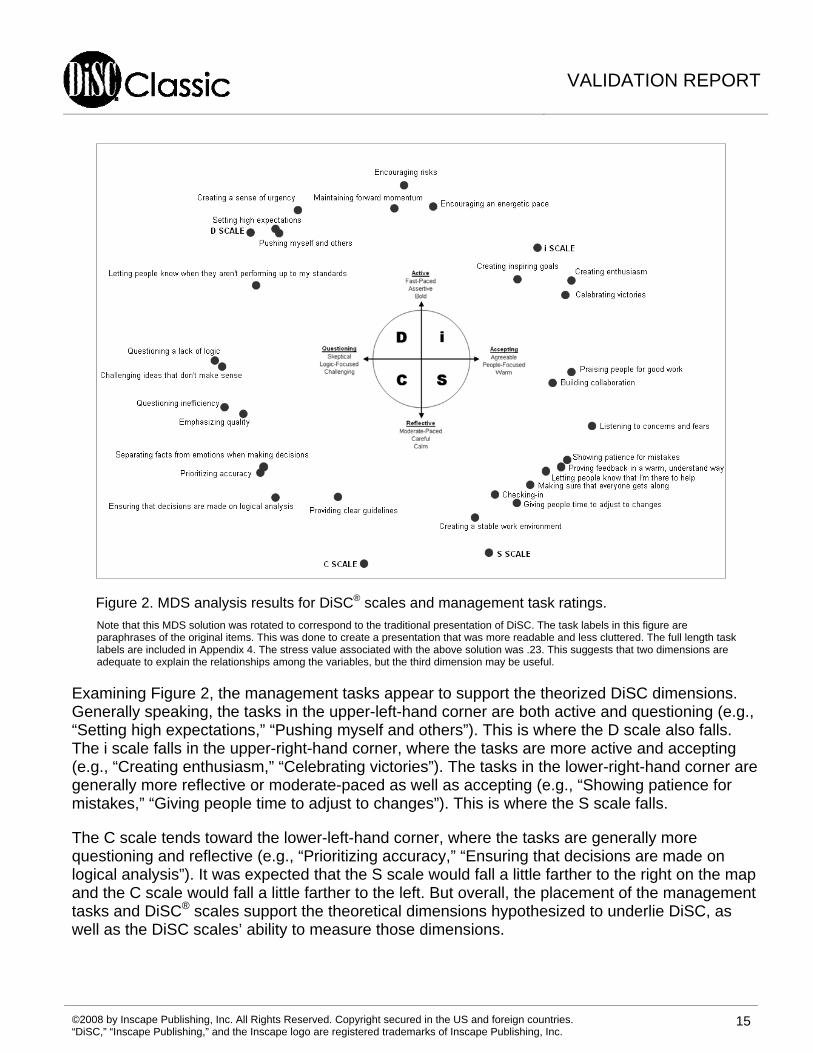
Figure 2. MDS analysis results for DiSC® scales and management task ratings.
Note that this MDS solution was rotated to correspond to the traditional presentation of DiSC. The task labels in this figure are paraphrases of the original items. This was done to create a presentation that was more readable and less cluttered. The full length task labels are included in Appendix 4. The stress value associated with the above solution was .23. This suggests that two dimensions are adequate to explain the relationships among the variables, but the third dimension may be useful.
Examining Figure 2, the management tasks appear to support the theorized DiSC dimensions. Generally speaking, the tasks in the upper-left-hand corner are both active and questioning (e.g., “Setting high expectations,” “Pushing myself and others”). This is where the D scale also falls. The i scale falls in the upper-right-hand corner, where the tasks are more active and accepting (e.g., “Creating enthusiasm,” “Celebrating victories”). The tasks in the lower-right-hand corner are generally more reflective or moderate-paced as well as accepting (e.g., “Showing patience for mistakes,” “Giving people time to adjust to changes”). This is where the S scale falls.
The C scale tends toward the lower-left-hand corner, where the tasks are generally more questioning and reflective (e.g., “Prioritizing accuracy,” “Ensuring that decisions are made on logical analysis”). It was expected that the S scale would fall a little farther to the right on the map and the C scale would fall a little farther to the left. But overall, the placement of the management tasks and DiSC® scales support the theoretical dimensions hypothesized to underlie DiSC, as well as the DiSC scales’ ability to measure those dimensions.
VALIDATION REPORT
©2008 by Inscape Publishing, Inc. All Rights Reserved. Copyright secured in the US and foreign countries. “DiSC,” “Inscape Publishing,” and the Inscape logo are registered trademarks of Inscape Publishing, Inc.
16
In Study 2, participants with professional sales experience (N=696) were asked to take the DiSC assessment. They were then presented with fourteen sales tasks related to customer interactions (e.g., “Listening patiently and warmly to the customer’s needs,” “Explaining the quality of your product/service”) and asked to rate how important each task was to them when they work with a customer on a scale of 1 through 5, ranging from “Not at all important” (1) to “Crucially important” (5). Task ratings were ipsatized to adjust for response sets such as social desirability (as described in the section of this report called “Comparing Scale Scores with Respondent Self-Perceptions”). Consequently, task ratings represented the relative priorities for each salesperson.
The task ratings and DiSC scale scores were then submitted to an MDS analysis. In Figure 3, variables that are closer together are more similar. Variables that are farther apart are more dissimilar. The theoretical DiSC model has been placed in the center of the MDS map to aid with interpretation.
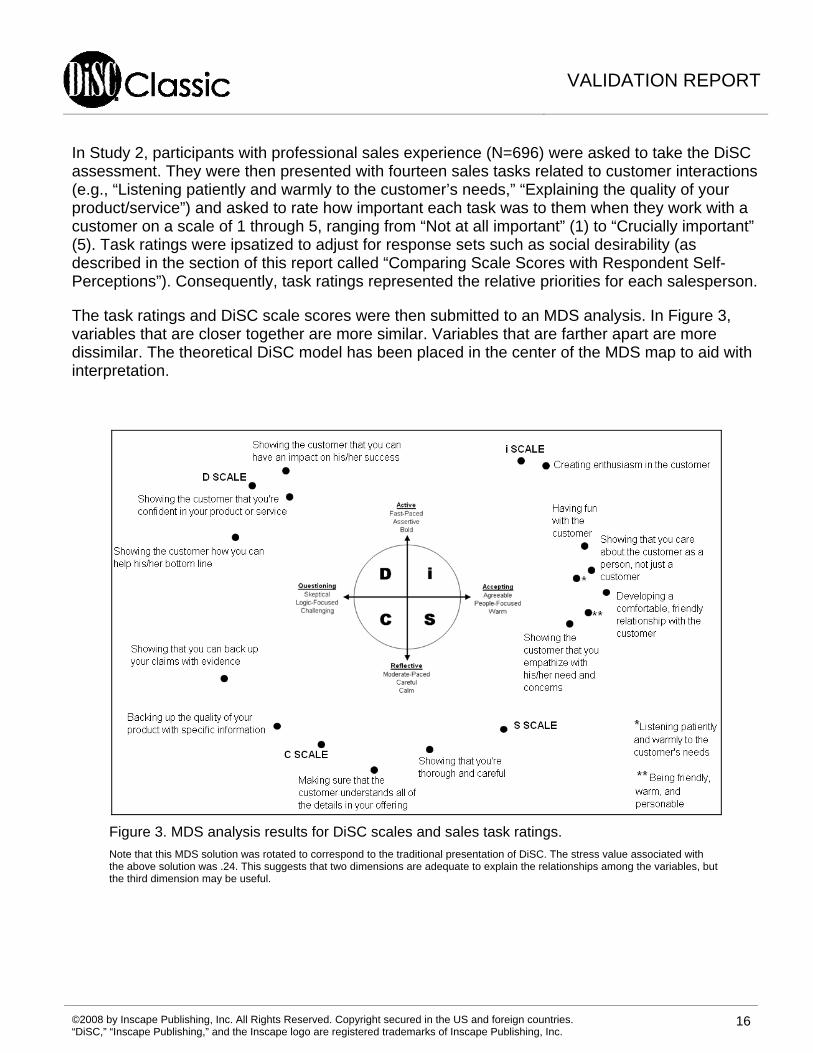
Figure 3. MDS analysis results for DiSC scales and sales task ratings.
Note that this MDS solution was rotated to correspond to the traditional presentation of DiSC. The stress value associated with the above solution was .24. This suggests that two dimensions are adequate to explain the relationships among the variables, but the third dimension may be useful.
VALIDATION REPORT
©2008 by Inscape Publishing, Inc. All Rights Reserved. Copyright secured in the US and foreign countries. “DiSC,” “Inscape Publishing,” and the Inscape logo are registered trademarks of Inscape Publishing, Inc.
17
The results from Study 2, shown in Figure 3, again support the dimensions theorized to underlie the four DiSC® scales. The D scale is located in the upper-left-hand corner of the MDS map. Because people who score high on this scale have a fast pace, they are hypothesized to care less about details or specifics and more about bottom-line results. And because these same people are more questioning or skeptical by nature, they are often hypothesized to skip social niceties and, again, focus their efforts on results. The MDS map supports these hypotheses, indicating that the D scale is most highly related to tasks such as showing confidence, helping the customer’s bottom line, and affecting the customer’s success.
The i scale is located in the upper-right-hand corner and is closest to tasks such as creating enthusiasm and having fun with the customer. Both of these tasks reflect an active pace and a more accepting nature. The S scale is located in the lower-right-hand corner. This scale is hypothesized to combine an accepting nature with a slower, more reflective pace. The two tasks closest to this scale support this hypothesis. The S scale is close to the task, “Showing that you’re thorough and careful,” which reflects the cautious, slower paced aspects of this scale. The S scale is also close to the task, “Showing the customer that you empathize with his/her needs and concerns,” which reflects a more accepting nature. A cluster of tasks fall between the i and S scales, all of which reflect an accepting, people-focused disposition.
The C scale falls in the lower-left-hand corner of the MDS map. The tasks that fall in this region reflect an assumption that the customer is careful, detail-oriented, and questioning, such as “Showing that you can back up your claims with evidence” and “Backing up the quality of your product with specific information.” As with Study 1, the overall results of Study 2 provide strong support for the theoretical dimensions hypothesized to underlie DiSC, as well as the DiSC scales’ ability to measure those dimensions.
NORMS AND GROUP COMPARISONS
Norms are an important concept in psychological testing. They allow you to compare your results on a test to the average person within a given population (e.g., your country, your age group, your occupational group.) And from this, norms allow us to understand what scores should be considered average, what scores should be considered high, and what scores should be considered low. This section will take a brief look at the use and relevance of norms on the DiSC profile.
When people take a psychological test, they receive what is called a raw score. This usually involves adding the number of items answered in a certain way and/or subtracting the number of items that are answered in a different way. For example, Graph III raw scores on DiSC Classic are derived by adding the number of a participant’s “most” responses and subtracting the number of a participant’s “least” responses. The raw score on each DiSC scale that ranges from roughly -28 to 28 on Graph III of the profile. This range may be smaller depending on the language version of the instrument (see Scoring of the DiSC Profile for more information.) Test designers need some way, however, to interpret the meaning of that raw score. That is, what does a score of 9 mean in practical terms? Is it high? Is it low? Consequently, tests are "referenced" so that test designers can make sense of raw scores and attach some practical meaning to the results.
VALIDATION REPORT
©2008 by Inscape Publishing, Inc. All Rights Reserved. Copyright secured in the US and foreign countries. “DiSC,” “Inscape Publishing,” and the Inscape logo are registered trademarks of Inscape Publishing, Inc.
18
There are a variety of ways to reference a test. DiSC® is "norm-referenced," which means that a person's raw scores (ranging from roughly -28 to 28) are interpreted relative to how everyone else in the population scores on that scale. This is a very common way to reference a psychological instrument. So, for example, if the average person in a population receives a raw score of -6 on a scale, a raw score of +5 may be considered quite high.
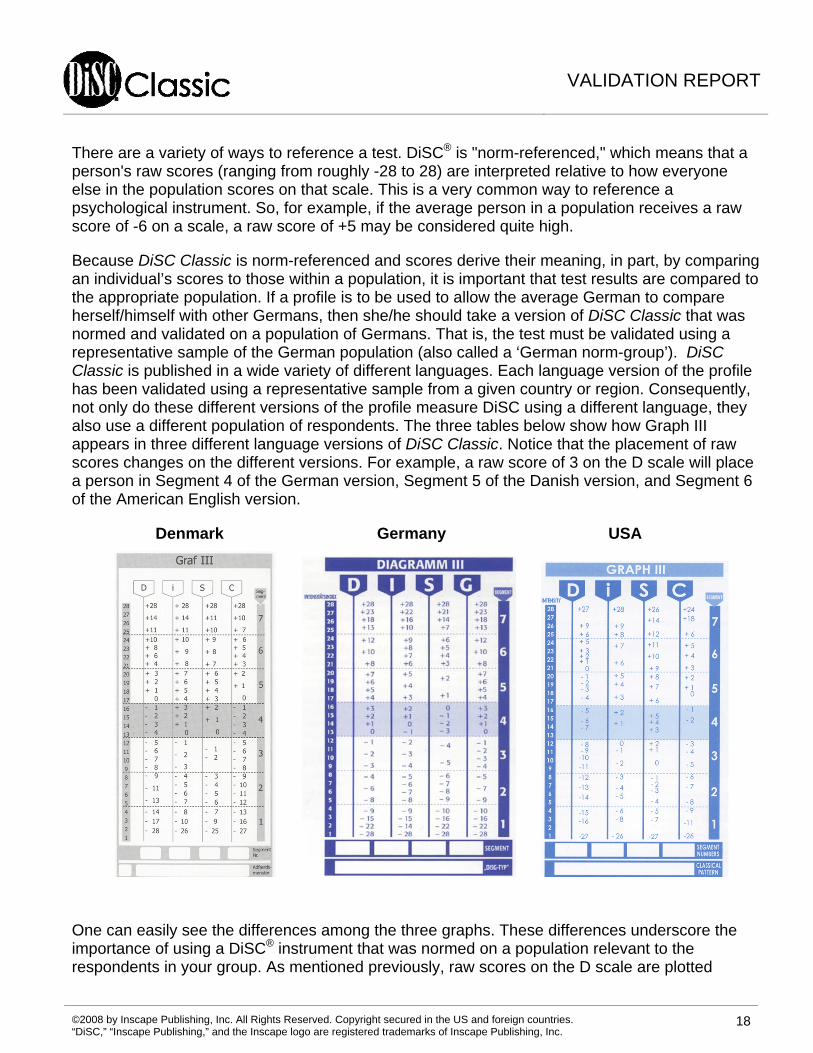
Because DiSC Classic is norm-referenced and scores derive their meaning, in part, by comparing an individual’s scores to those within a population, it is important that test results are compared to the appropriate population. If a profile is to be used to allow the average German to compare herself/himself with other Germans, then she/he should take a version of DiSC Classic that was normed and validated on a population of Germans. That is, the test must be validated using a representative sample of the German population (also called a ‘German norm-group’). DiSC Classic is published in a wide variety of different languages. Each language version of the profile has been validated using a representative sample from a given country or region. Consequently, not only do these different versions of the profile measure DiSC using a different language, they also use a different population of respondents. The three tables below show how Graph III appears in three different language versions of DiSC Classic. Notice that the placement of raw scores changes on the different versions. For example, a raw score of 3 on the D scale will place a person in Segment 4 of the German version, Segment 5 of the Danish version, and Segment 6 of the American English version.
Denmark Germany USA
One can easily see the differences among the three graphs. These differences underscore the importance of using a DiSC® instrument that was normed on a population relevant to the respondents in your group. As mentioned previously, raw scores on the D scale are plotted
VALIDATION REPORT
©2008 by Inscape Publishing, Inc. All Rights Reserved. Copyright secured in the US and foreign countries. “DiSC,” “Inscape Publishing,” and the Inscape logo are registered trademarks of Inscape Publishing, Inc.
19
differently on each of the three graphs. Consequently, the behaviors that are perceived as Dominant in one culture may be seen differently in another culture. If we were to measure a person’s DiSC style using a language version of DiSC Classic that was not developed on the appropriate norm group, the accuracy of measurement and feedback is likely to go down.
Cross-cultural comparisons using the DiSC profile, however, are difficult because profile norm differences could be due to number of different factors. For instance, differences in profile level or shape can be due to differences in the population (e.g., Danish citizens could actually have a higher average level of Dominance in their behavior and emotion than Americans.) It is equally likely, however, that differences between cultures on the graphs are due to the social desirability of the words involved in the measurement. That is, even if we attempt to use the same translated word in both countries (and sometimes the words themselves change), these words will have slightly different flavors in each country. The words we use to measure Dominance, for instance, may be more socially desirable in Denmark compared to the words used to measure that scale in the US, even if the two populations actually have the same average level of Dominance. Consequently, it might be tempting to conclude that the United States has fewer high-D individuals than Denmark, even though this is only one of many possible explanations for the differences in profile norms.
When, however, comparisons are made among cultural groups within the same larger population (using the same language version of the DiSC profile), few significant results are found. For example, comparisons of ethnic groups within the US show that there are no meaningful differences among the traditionally defined ethnic groups (i.e., Asian American, African American, Caucasian, Hispanic, or Native American.) In statistical terms, the percent of variance accounted for race (i.e., eta squared) in the US population on any given DiSC style is well below 1%. What does this mean in practical terms? Knowing a person’s ethnic classification will tell you next to nothing about their DiSC style.
In addition, internal reliability coefficients were calculated for homogeneous samples of African Americans, Asian Americans, Caucasian Americans, Hispanic Americans, and Native Americans and are included in Appendix 5. Results show that Alpha coefficients were well above .70 for all scales across all ethic groups. This suggests that the internal consistency of the DiSC scales was appropriately high within each of these groups.
Analyses have also been performed to examine the relationship between education level and the DiSC® scales. Internal reliability coefficients were calculated for groups of participants with different levels of education. As shown in Appendix 5, the reliability for all four DiSC scales was appropriately high within each educational group.
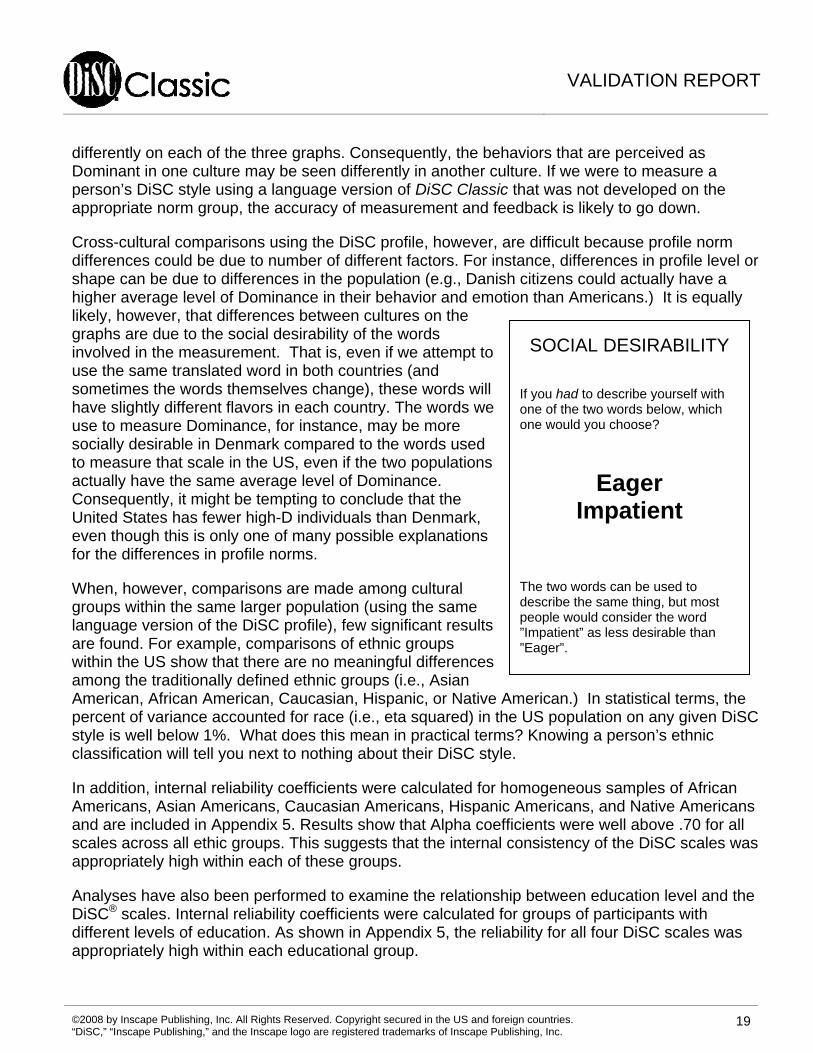
SOCIAL DESIRABILITY If you had to describe yourself with one of the two words below, which one would you choose?
Eager Impatient
The two words can be used to describe the same thing, but most people would consider the word ”Impatient” as less desirable than ”Eager”.
VALIDATION REPORT
©2008 by Inscape Publishing, Inc. All Rights Reserved. Copyright secured in the US and foreign countries. “DiSC,” “Inscape Publishing,” and the Inscape logo are registered trademarks of Inscape Publishing, Inc.
20
Similarly, people’s DiSC patterns do not appear to be significantly related to their age. In the US English version, age differences appear to be largest on the i scale of the DiSC profile, but even on this scale those differences are small. A data analysis of 7,038 respondents to the US English version showed that older respondents had slightly lower scores on the i scale, but these age differences accounted for only about 1% of the variation in scores. Differences on the other scales were substantially smaller. Although this pattern of results does change slightly from culture to culture, research suggests that sizable and important age-related differences on DiSC Classic are rare across all language versions. Even the largest age-related differences are usually less than one segment apart.
Gender-related differences on DiSC Classic have also been explored. Women and men do seem to show small but noticeable group differences on two of the four DiSC scales in the US English version. Using the data set described above, women showed higher scores than men on the S scale and men showed higher scores than women on the D scale. In both cases, however, gender differences were less than one segment score and accounted for less than 3% of the variation in DiSC scores. Although men and women differ as a group on the D and S scales, these results suggest that a person’s gender will tell you very little about their expected DiSC profile. Other analyses showed that although women scored higher than men on the i scale, this difference was not practically meaningful. In addition, women and men, on average, received almost identical scores on the C scale. This general pattern of gender-related results is similar across a variety of different language versions of DiSC Classic (e.g., German, Danish, UK English), although slight variations are sometimes observed. Internal reliability coefficients were calculated separately for females and males across all four DiSC scales. As shown in Appendix 5, reliability coefficients were well above .70 for both genders across all scales.
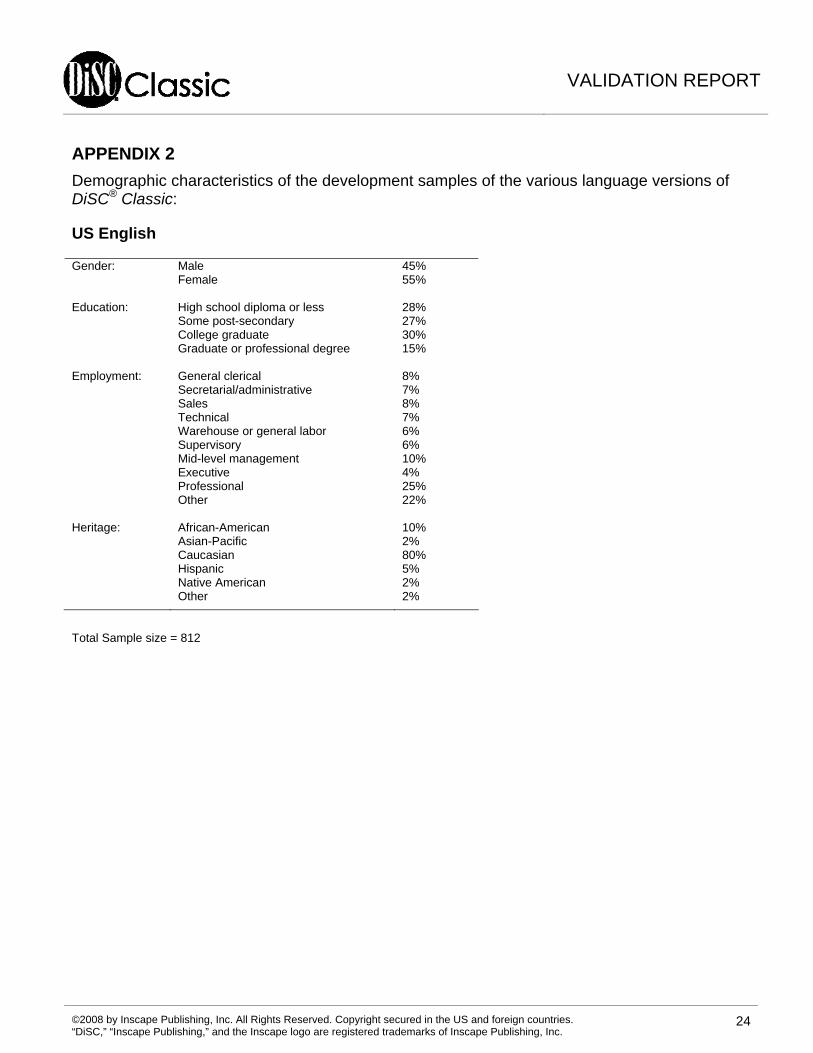
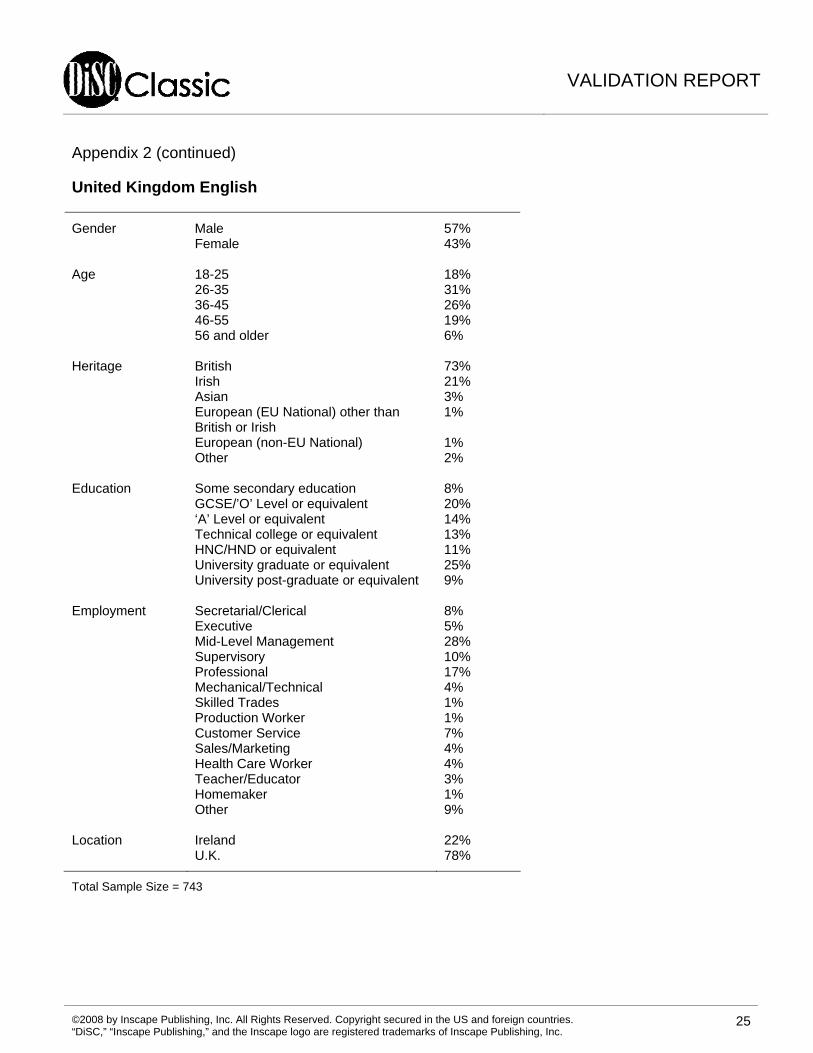
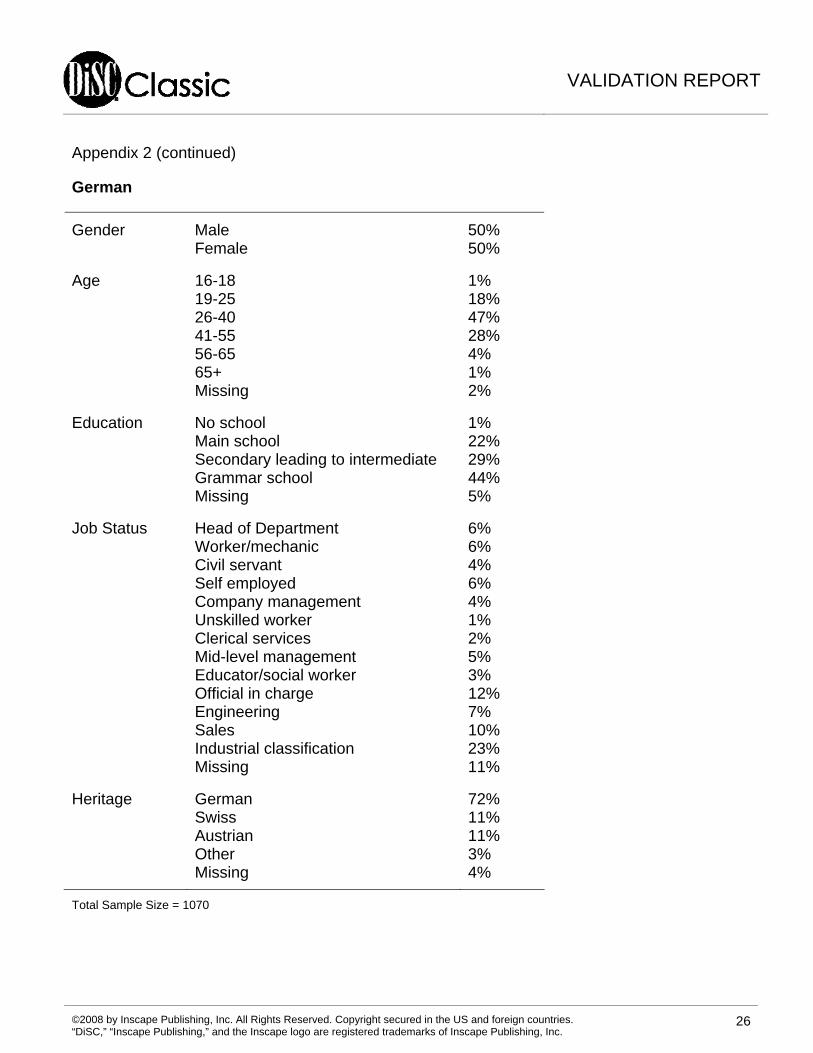
For reference purposes, Appendix 2 provides a sample of the demographic makeup of three different DiSC Classic language versions (US English, UK English, and German). The demographics within these samples are designed to provide a rough reflection of the actual demographics within the larger population. Subsequent analyses on larger datasets support the validity and reliability that were found in these developmental samples. For instance, a sample of over 7000 respondents took the US English version of DiSC Classic. These respondents were roughly equivalent to the developmental sample on all major demographic categories. As mentioned above, analyses of this newer, larger sample provide continued support for the reliability and validity of the instrument.
SCORING OF THE DISC® PROFILE
DiSC® Classic uses a measurement technique that is referred to as “forced-choice.” Within DiSC Classic, this forced-choice format means that respondents are presented with four adjectives (or phrases in some language versions) and asked to choose one that is most like them and one that is least like them. The primary advantage of this format is that it reduces social desirability of responding. Social scientists have long recognized that when most people take a psychological instrument, they tend to respond in a way that makes them look good. This isn’t necessarily a conscious attempt to deceive the instrument or test administrator. Rather, it is a natural desire to
VALIDATION REPORT
©2008 by Inscape Publishing, Inc. All Rights Reserved. Copyright secured in the US and foreign countries. “DiSC,” “Inscape Publishing,” and the Inscape logo are registered trademarks of Inscape Publishing, Inc.
21
think about oneself and present oneself in the most positive light. This is true of most psychologically healthy adults, across almost all cultures. The forced-choice format reduces the influence of this tendency by forcing them to choose only one of many socially desirable choices. For instance, the first response box in the US English version of DiSC Classic asks people to choose between the words enthusiastic, daring, diplomatic, and satisfied. Each of these words is a positive quality and therefore socially desirable. DiSC respondents, however, can only choose one that is most like them. Further, they also are forced to choose one that is least like them. Consequently, they cannot choose every positive quality, but rather must choose their relative highs and lows.
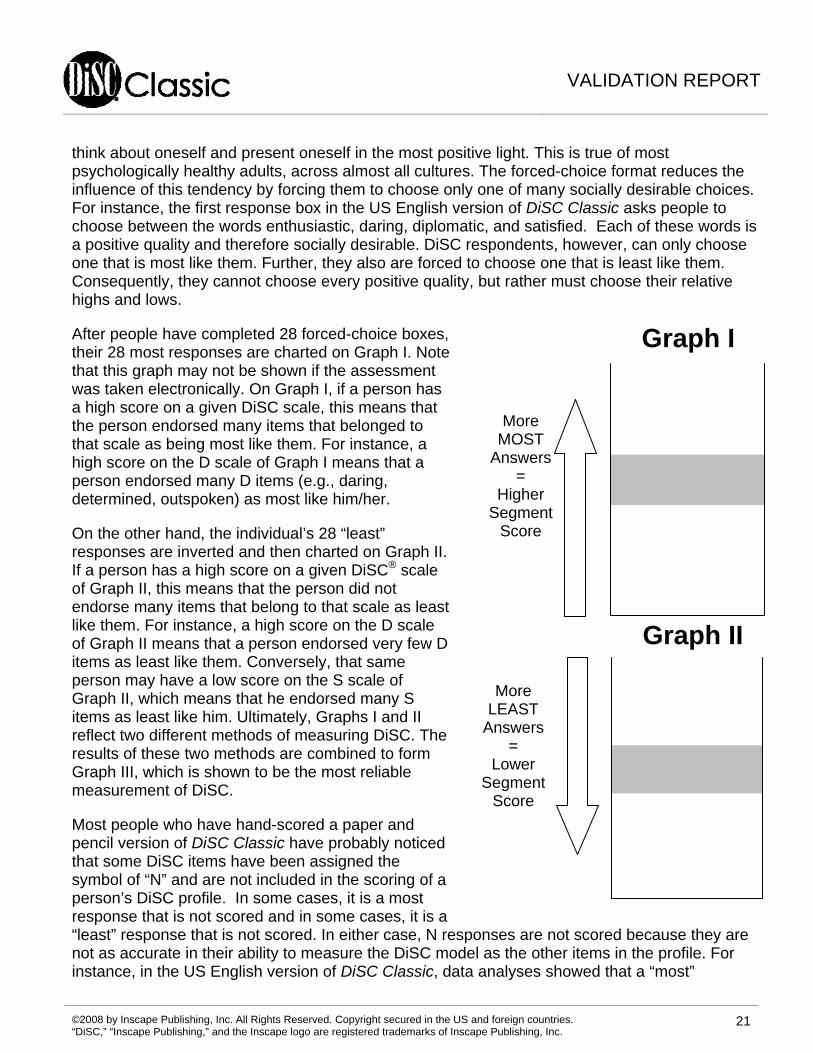
After people have completed 28 forced-choice boxes, their 28 most responses are charted on Graph I. Note that this graph may not be shown if the assessment was taken electronically. On Graph I, if a person has a high score on a given DiSC scale, this means that the person endorsed many items that belonged to that scale as being most like them. For instance, a high score on the D scale of Graph I means that a person endorsed many D items (e.g., daring, determined, outspoken) as most like him/her.
On the other hand, the individual’s 28 “least” responses are inverted and then charted on Graph II. If a person has a high score on a given DiSC® scale of Graph II, this means that the person did not endorse many items that belong to that scale as least like them. For instance, a high score on the D scale of Graph II means that a person endorsed very few D items as least like them. Conversely, that same person may have a low score on the S scale of Graph II, which means that he endorsed many S items as least like him. Ultimately, Graphs I and II reflect two different methods of measuring DiSC. The results of these two methods are combined to form Graph III, which is shown to be the most reliable measurement of DiSC.
Most people who have hand-scored a paper and pencil version of DiSC Classic have probably noticed that some DiSC items have been assigned the symbol of “N” and are not included in the scoring of a person’s DiSC profile. In some cases, it is a most response that is not scored and in some cases, it is a “least” response that is not scored. In either case, N responses are not scored because they are not as accurate in their ability to measure the DiSC model as the other items in the profile. For instance, in the US English version of DiSC Classic, data analyses showed that a “most”
More
MOST Answers
= Higher
Segment Score
Graph I
More
LEAST Answers
= Lower
Segment Score
Graph II
VALIDATION REPORT
©2008 by Inscape Publishing, Inc. All Rights Reserved. Copyright secured in the US and foreign countries. “DiSC,” “Inscape Publishing,” and the Inscape logo are registered trademarks of Inscape Publishing, Inc.
22
response to the word “observant” was a good measure of the C scale, but a “least” response to that same word was not a good enough measure within the DiSC model. Consequently, a “most” response to “observant” is scored, but a “least” response is not scored (and is treated as an N-response.)
N-responses also have implications for the range of raw scores on the DiSC Graphs. For example, if you look at the D scale on Graph III of the US English version, you will see that the range of raw scores goes from -27 to +27. On the i scale, however, the raw scores range from -26 to +28. This discrepancy occurs because the D scale and i scales have a different arrangement of N-responses. More specifically, the D scale has one “most” response that is not scored and so the highest possible score on the D scale is +27 (i.e., 28 “most” responses minus the one N-response that is not scored). The i scale, however, has no “most” responses that are not scored and consequently, the highest possible score is +28.
VALIDATION REPORT
©2008 by Inscape Publishing, Inc. All Rights Reserved. Copyright secured in the US and foreign countries. “DiSC,” “Inscape Publishing,” and the Inscape logo are registered trademarks of Inscape Publishing, Inc.
23
APPENDIX 1
Sample of Alpha coefficients for different language versions of the DiSC® profile*:
Language D i S C Sample
Size
Chinese (China) .90 .91 .89 .89 807
Danish .89 .79 .81 .81 1912
English (US) .92 .87 .88 .85 812
English (Australian) .87 .84 .77 .82 406
English (UK) .89 .91 .85 .87 743
Estonian .78 .84 .81 .82 908
Finnish .86 .84 .77 .87 805
German .90 .92 .82 .91 1111
Hungarian .87 .83 .81 .82 501
Italian .84 .84 .77 .83 704
Japanese .90 .87 .84 .85 813
Korean .83 .85 .76 .83 1009
Latvian .76 .73 .77 .71 1041
Lithuanian .78 .74 .75 .70 852
Norwegian .87 .83 .80 .83 823
Portuguese (Europe) .87 .91 .87 .86 1100
Spanish (Mexico) .83 .81 .85 .79 901
Spanish (Chile, Columbia) .79 .74 .76 .74 412
Swedish .80 .79 .72 .77 1007
Turkish .75 .75 .77 .72 932
* Results based on development sample of the most recent version of each language version.
VALIDATION REPORT
©2008 by Inscape Publishing, Inc. All Rights Reserved. Copyright secured in the US and foreign countries. “DiSC,” “Inscape Publishing,” and the Inscape logo are registered trademarks of Inscape Publishing, Inc.
24
APPENDIX 2
Demographic characteristics of the development samples of the various language versions of DiSC® Classic:
US English
Gender: Male 45% Female 55% Education: High school diploma or less 28% Some post-secondary 27% College graduate 30% Graduate or professional degree 15% Employment: General clerical 8% Secretarial/administrative 7% Sales 8% Technical 7% Warehouse or general labor 6% Supervisory 6% Mid-level management 10% Executive 4% Professional 25% Other 22% Heritage: African-American 10% Asian-Pacific 2% Caucasian 80% Hispanic 5% Native American 2% Other 2%
Total Sample size = 812
VALIDATION REPORT
©2008 by Inscape Publishing, Inc. All Rights Reserved. Copyright secured in the US and foreign countries. “DiSC,” “Inscape Publishing,” and the Inscape logo are registered trademarks of Inscape Publishing, Inc.
25
Appendix 2 (continued)
United Kingdom English
Gender Male 57% Female 43% Age
18-25
18%
26-35 31% 36-45 26% 46-55 19% 56 and older 6% Heritage
British
73%
Irish 21% Asian 3% European (EU National) other than 1% British or Irish European (non-EU National) 1% Other 2% Education
Some secondary education
8%
GCSE/’O’ Level or equivalent 20% ‘A’ Level or equivalent 14% Technical college or equivalent 13% HNC/HND or equivalent 11% University graduate or equivalent 25% University post-graduate or equivalent 9% Employment
Secretarial/Clerical
8%
Executive 5% Mid-Level Management 28% Supervisory 10% Professional 17% Mechanical/Technical 4% Skilled Trades 1% Production Worker 1% Customer Service 7% Sales/Marketing 4% Health Care Worker 4% Teacher/Educator 3% Homemaker 1% Other 9% Location
Ireland
22%
U.K. 78%
Total Sample Size = 743
VALIDATION REPORT
©2008 by Inscape Publishing, Inc. All Rights Reserved. Copyright secured in the US and foreign countries. “DiSC,” “Inscape Publishing,” and the Inscape logo are registered trademarks of Inscape Publishing, Inc.
26
Appendix 2 (continued)
German
Gender Male 50% Female 50%
Age 16-18 1% 19-25 18% 26-40 47% 41-55 28% 56-65 4% 65+ 1% Missing 2%
Education No school 1% Main school 22% Secondary leading to intermediate 29% Grammar school 44% Missing 5%
Job Status Head of Department 6% Worker/mechanic 6% Civil servant 4% Self employed 6% Company management 4% Unskilled worker 1% Clerical services 2% Mid-level management 5% Educator/social worker 3% Official in charge 12% Engineering 7% Sales 10% Industrial classification 23% Missing 11%
Heritage German 72% Swiss 11% Austrian 11% Other 3% Missing 4%
Total Sample Size = 1070
VALIDATION REPORT
©2008 by Inscape Publishing, Inc. All Rights Reserved. Copyright secured in the US and foreign countries. “DiSC,” “Inscape Publishing,” and the Inscape logo are registered trademarks of Inscape Publishing, Inc.
27
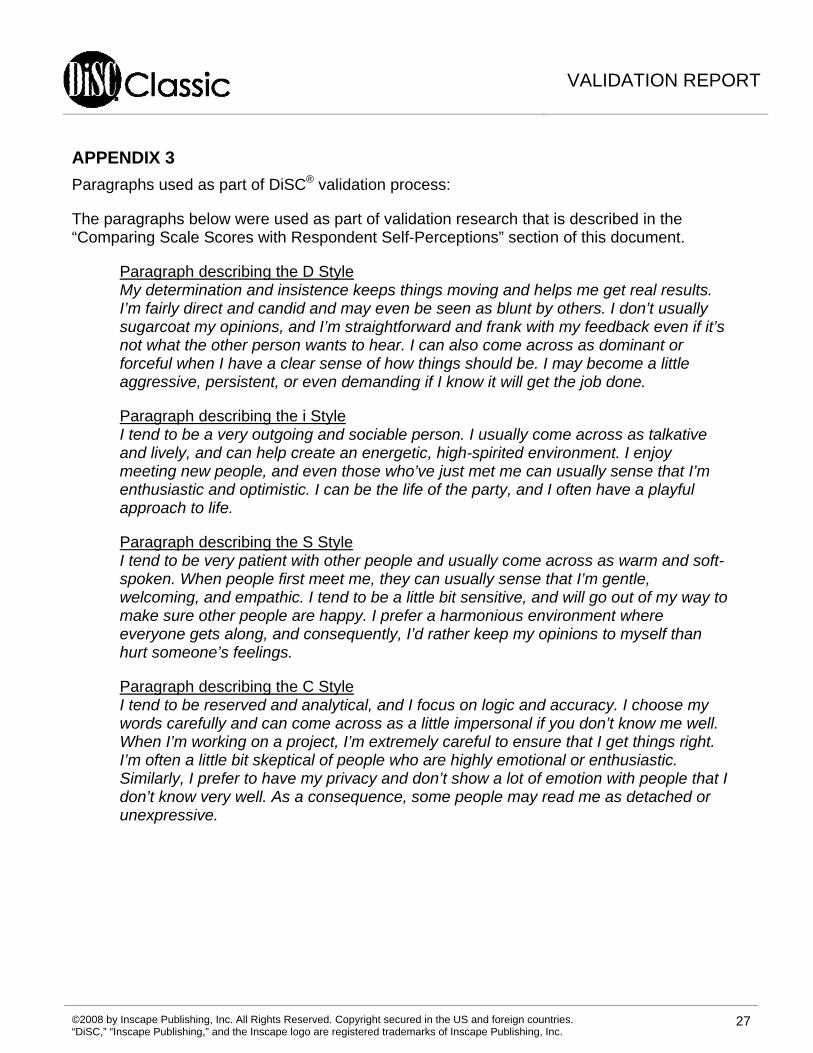
APPENDIX 3
Paragraphs used as part of DiSC® validation process:
The paragraphs below were used as part of validation research that is described in the “Comparing Scale Scores with Respondent Self-Perceptions” section of this document.
Paragraph describing the D Style My determination and insistence keeps things moving and helps me get real results. I’m fairly direct and candid and may even be seen as blunt by others. I don’t usually sugarcoat my opinions, and I’m straightforward and frank with my feedback even if it’s not what the other person wants to hear. I can also come across as dominant or forceful when I have a clear sense of how things should be. I may become a little aggressive, persistent, or even demanding if I know it will get the job done.
Paragraph describing the i Style I tend to be a very outgoing and sociable person. I usually come across as talkative and lively, and can help create an energetic, high-spirited environment. I enjoy meeting new people, and even those who’ve just met me can usually sense that I’m enthusiastic and optimistic. I can be the life of the party, and I often have a playful approach to life.
Paragraph describing the S Style I tend to be very patient with other people and usually come across as warm and soft-spoken. When people first meet me, they can usually sense that I’m gentle, welcoming, and empathic. I tend to be a little bit sensitive, and will go out of my way to make sure other people are happy. I prefer a harmonious environment where everyone gets along, and consequently, I’d rather keep my opinions to myself than hurt someone’s feelings.
Paragraph describing the C Style I tend to be reserved and analytical, and I focus on logic and accuracy. I choose my words carefully and can come across as a little impersonal if you don’t know me well. When I’m working on a project, I’m extremely careful to ensure that I get things right. I’m often a little bit skeptical of people who are highly emotional or enthusiastic. Similarly, I prefer to have my privacy and don’t show a lot of emotion with people that I don’t know very well. As a consequence, some people may read me as detached or unexpressive.
VALIDATION REPORT
©2008 by Inscape Publishing, Inc. All Rights Reserved. Copyright secured in the US and foreign countries. “DiSC,” “Inscape Publishing,” and the Inscape logo are registered trademarks of Inscape Publishing, Inc.
28
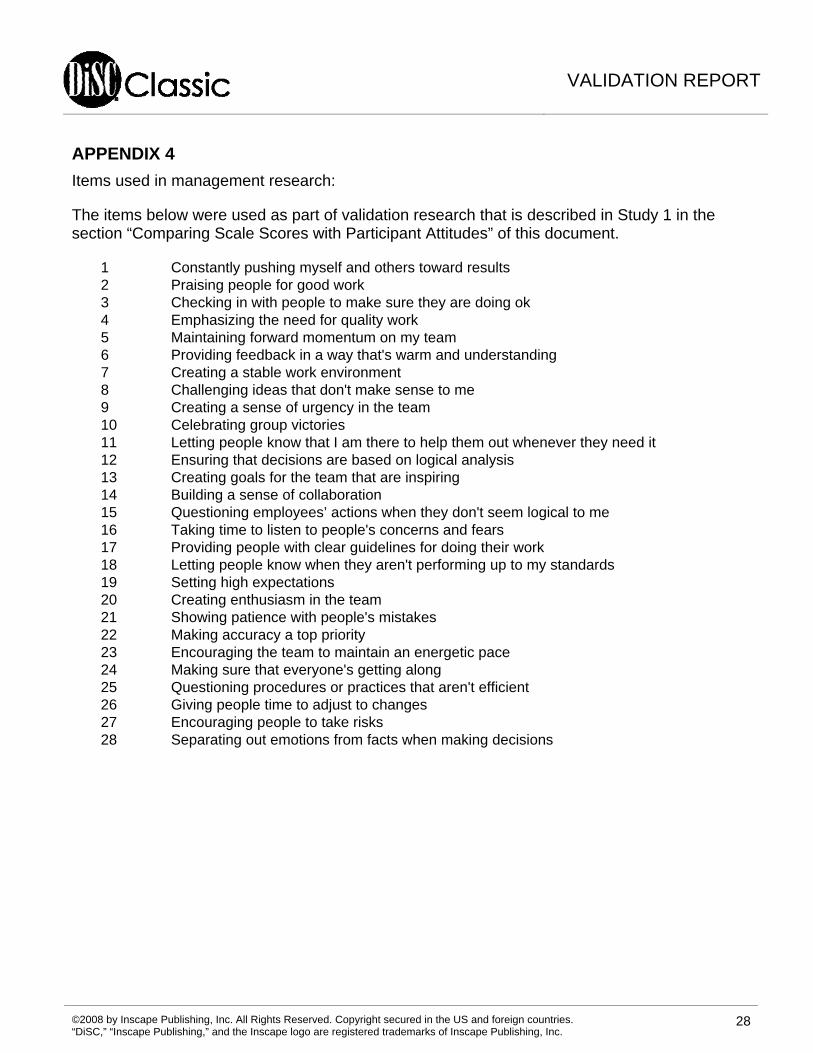
APPENDIX 4
Items used in management research:
The items below were used as part of validation research that is described in Study 1 in the section “Comparing Scale Scores with Participant Attitudes” of this document.
1 Constantly pushing myself and others toward results 2 Praising people for good work 3 Checking in with people to make sure they are doing ok 4 Emphasizing the need for quality work 5 Maintaining forward momentum on my team 6 Providing feedback in a way that's warm and understanding 7 Creating a stable work environment 8 Challenging ideas that don't make sense to me 9 Creating a sense of urgency in the team 10 Celebrating group victories 11 Letting people know that I am there to help them out whenever they need it 12 Ensuring that decisions are based on logical analysis 13 Creating goals for the team that are inspiring 14 Building a sense of collaboration 15 Questioning employees’ actions when they don't seem logical to me 16 Taking time to listen to people's concerns and fears 17 Providing people with clear guidelines for doing their work 18 Letting people know when they aren't performing up to my standards 19 Setting high expectations 20 Creating enthusiasm in the team 21 Showing patience with people's mistakes 22 Making accuracy a top priority 23 Encouraging the team to maintain an energetic pace 24 Making sure that everyone's getting along 25 Questioning procedures or practices that aren't efficient 26 Giving people time to adjust to changes 27 Encouraging people to take risks 28 Separating out emotions from facts when making decisions
VALIDATION REPORT
©2008 by Inscape Publishing, Inc. All Rights Reserved. Copyright secured in the US and foreign countries. “DiSC,” “Inscape Publishing,” and the Inscape logo are registered trademarks of Inscape Publishing, Inc.
29
APPENDIX 5
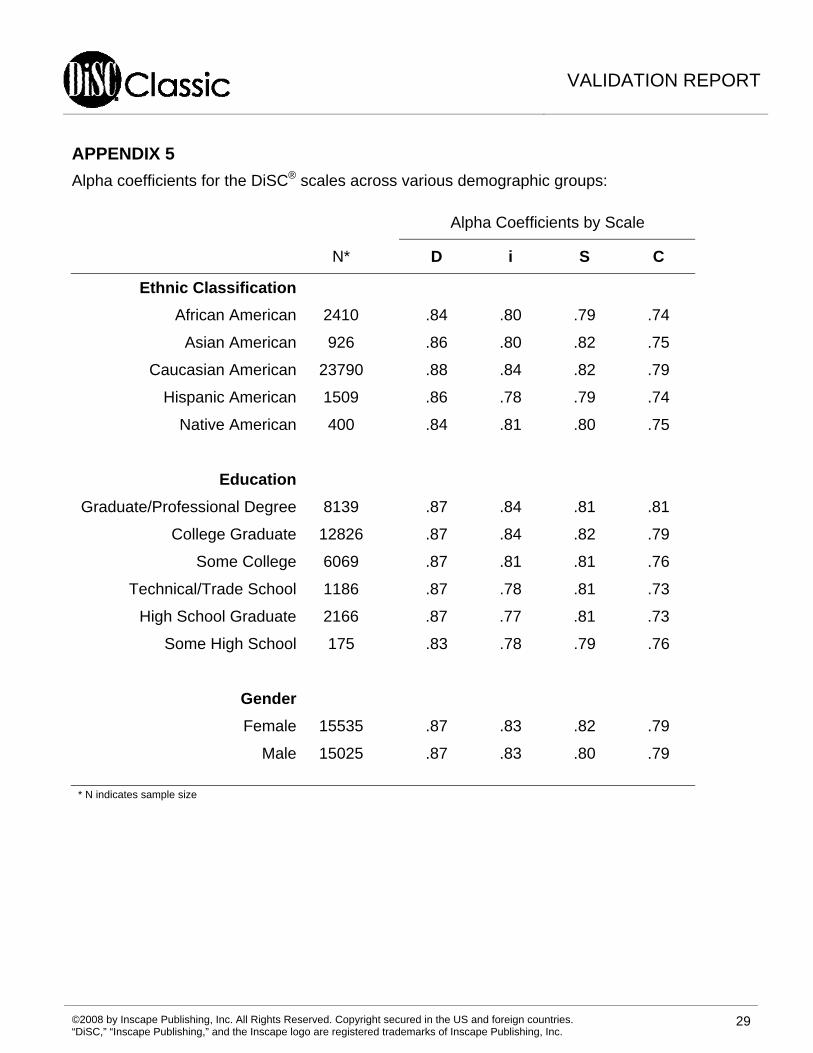
Alpha coefficients for the DiSC® scales across various demographic groups:
Alpha Coefficients by Scale
N* D i S C
Ethnic Classification
African American 2410 .84 .80 .79 .74
Asian American 926 .86 .80 .82 .75
Caucasian American 23790 .88 .84 .82 .79
Hispanic American 1509 .86 .78 .79 .74
Native American 400 .84 .81 .80 .75
Education
Graduate/Professional Degree 8139 .87 .84 .81 .81
College Graduate 12826 .87 .84 .82 .79
Some College 6069 .87 .81 .81 .76
Technical/Trade School 1186 .87 .78 .81 .73
High School Graduate 2166 .87 .77 .81 .73
Some High School 175 .83 .78 .79 .76
Gender
Female 15535 .87 .83 .82 .79
Male 15025 .87 .83 .80 .79
* N indicates sample size
VALIDATION REPORT
©2008 by Inscape Publishing, Inc. All Rights Reserved. Copyright secured in the US and foreign countries. “DiSC,” “Inscape Publishing,” and the Inscape logo are registered trademarks of Inscape Publishing, Inc.
30
REFERENCES
Benjamin, L. S. (1996). A clinician-friendly version of the Interpersonal Circumplex: Structural Analysis of Social Behavior (SASB). Journal of Personality Assessment, 66, 248-266.
Forer, B. R. (1949). The fallacy of personal validation: a classroom demonstration of gullibility. Journal of Abnormal and Social Psychology, 44, 118-123.
Kiesler, D. J. (1987). The Check List of Interpersonal Transactions—Revised (CLOIT-R). Richmond, VA: Virginia Commonwealth University.
Kiesler, D. J., & Schmidt, J. A. (1991). The Impact Message Inventory: Form IIA Octant Scale Version. Richmond, VA: Virginia Commonwealth University.
Leary, T. (1957). Interpersonal Diagnosis of Personality. New York: Ronald Press.
Marston, W. M. (1928). The Emotions of Normal People. New York: Harcourt Brace and Company.
Wiggins, J. S. (1995). Interpersonal Adjective Scales: Professional Manual. Odessa, FL: Psychological Assessment Resources, Inc.