Embed Size (px)
Citation preview
Regional Committee of United Nations Global Geospatial
Information Management for Asia and the Pacific
(UN-GGIM-AP)
Established by a United Nations Resolution
Working Group 2
Disaster Risk Management
Activity Report
(October, 2015- November, 2018)
for
UN-GGIM-AP 7th Plenary Meeting
Deqing, China
22 November, 2018
Chair
Mr. Toru Nagayama, Japan, [email protected]
Vice Chairs
Dr. Tang Xinming, China, [email protected]
Mr. Adi Rusmanto, Indonesia, [email protected]
Mr. Peyman Baktash, Iran, [email protected]
Mrs. Munkhtsetseg Dalkhaa, Mongolia, [email protected]
Mr. Rob Deakin, New Zealand, [email protected]
Mr. John SF Fabic, Philippines, [email protected]
- 1 -
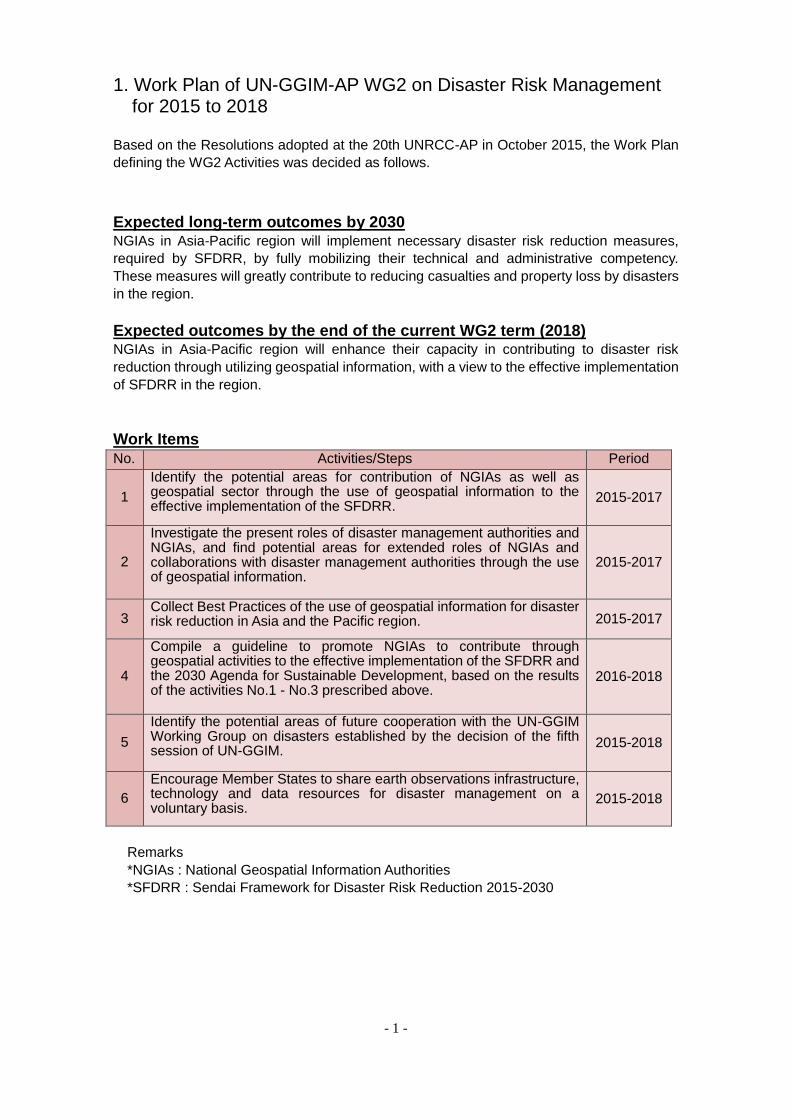
1. Work Plan of UN-GGIM-AP WG2 on Disaster Risk Management for 2015 to 2018
Based on the Resolutions adopted at the 20th UNRCC-AP in October 2015, the Work Plan
defining the WG2 Activities was decided as follows.
Expected long-term outcomes by 2030 NGIAs in Asia-Pacific region will implement necessary disaster risk reduction measures,
required by SFDRR, by fully mobilizing their technical and administrative competency.
These measures will greatly contribute to reducing casualties and property loss by disasters
in the region.
Expected outcomes by the end of the current WG2 term (2018) NGIAs in Asia-Pacific region will enhance their capacity in contributing to disaster risk
reduction through utilizing geospatial information, with a view to the effective implementation
of SFDRR in the region.
Work Items No. Activities/Steps Period
1
Identify the potential areas for contribution of NGIAs as well as geospatial sector through the use of geospatial information to the effective implementation of the SFDRR.
2015-2017
2
Investigate the present roles of disaster management authorities and NGIAs, and find potential areas for extended roles of NGIAs and collaborations with disaster management authorities through the use of geospatial information.
2015-2017
3 Collect Best Practices of the use of geospatial information for disaster risk reduction in Asia and the Pacific region. 2015-2017
4
Compile a guideline to promote NGIAs to contribute through geospatial activities to the effective implementation of the SFDRR and the 2030 Agenda for Sustainable Development, based on the results of the activities No.1 - No.3 prescribed above.
2016-2018
5
Identify the potential areas of future cooperation with the UN-GGIM Working Group on disasters established by the decision of the fifth session of UN-GGIM.
2015-2018
6
Encourage Member States to share earth observations infrastructure, technology and data resources for disaster management on a voluntary basis.
2015-2018
Remarks
*NGIAs : National Geospatial Information Authorities
*SFDRR : Sendai Framework for Disaster Risk Reduction 2015-2030
- 2 -
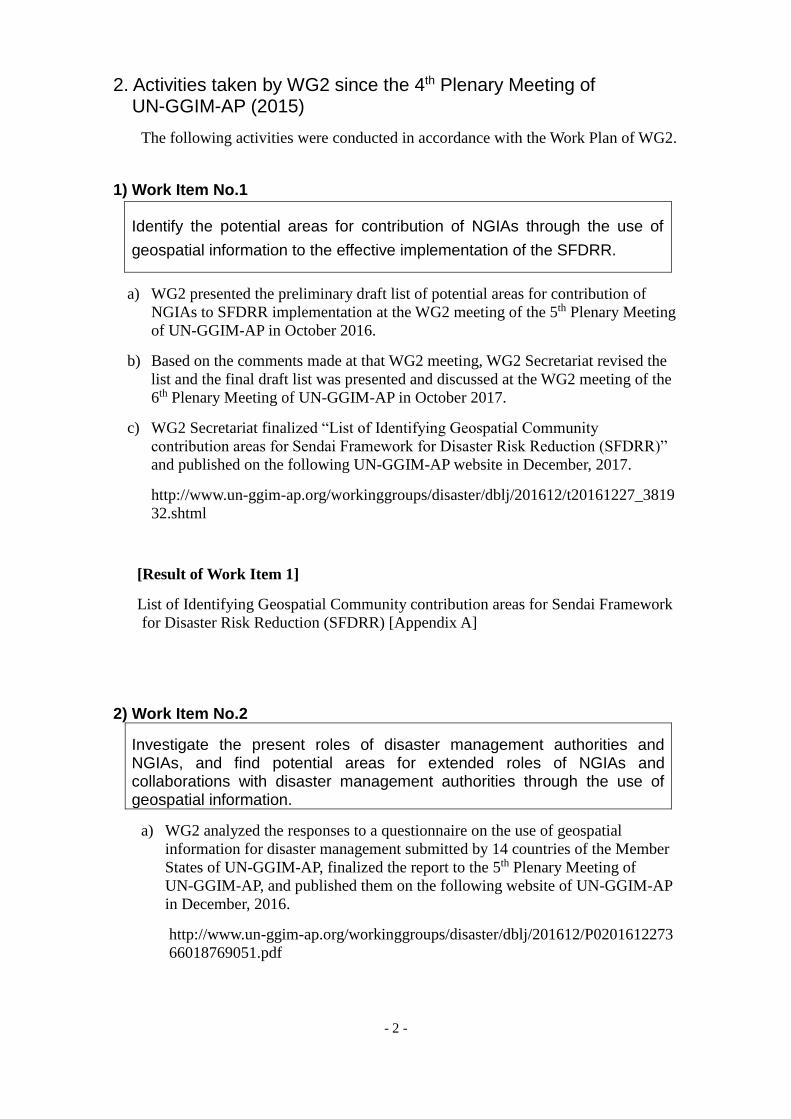
2. Activities taken by WG2 since the 4th Plenary Meeting of UN-GGIM-AP (2015)
The following activities were conducted in accordance with the Work Plan of WG2.
1) Work Item No.1
Identify the potential areas for contribution of NGIAs through the use of
geospatial information to the effective implementation of the SFDRR.
a) WG2 presented the preliminary draft list of potential areas for contribution of
NGIAs to SFDRR implementation at the WG2 meeting of the 5th Plenary Meeting
of UN-GGIM-AP in October 2016.
b) Based on the comments made at that WG2 meeting, WG2 Secretariat revised the
list and the final draft list was presented and discussed at the WG2 meeting of the
6th Plenary Meeting of UN-GGIM-AP in October 2017.
c) WG2 Secretariat finalized “List of Identifying Geospatial Community
contribution areas for Sendai Framework for Disaster Risk Reduction (SFDRR)”
and published on the following UN-GGIM-AP website in December, 2017.
http://www.un-ggim-ap.org/workinggroups/disaster/dblj/201612/t20161227_3819
32.shtml
[Result of Work Item 1]
List of Identifying Geospatial Community contribution areas for Sendai Framework
for Disaster Risk Reduction (SFDRR) [Appendix A]
2) Work Item No.2
Investigate the present roles of disaster management authorities and NGIAs, and find potential areas for extended roles of NGIAs and collaborations with disaster management authorities through the use of geospatial information.
a) WG2 analyzed the responses to a questionnaire on the use of geospatial
information for disaster management submitted by 14 countries of the Member
States of UN-GGIM-AP, finalized the report to the 5th Plenary Meeting of
UN-GGIM-AP, and published them on the following website of UN-GGIM-AP
in December, 2016.
http://www.un-ggim-ap.org/workinggroups/disaster/dblj/201612/P0201612273
66018769051.pdf
- 3 -
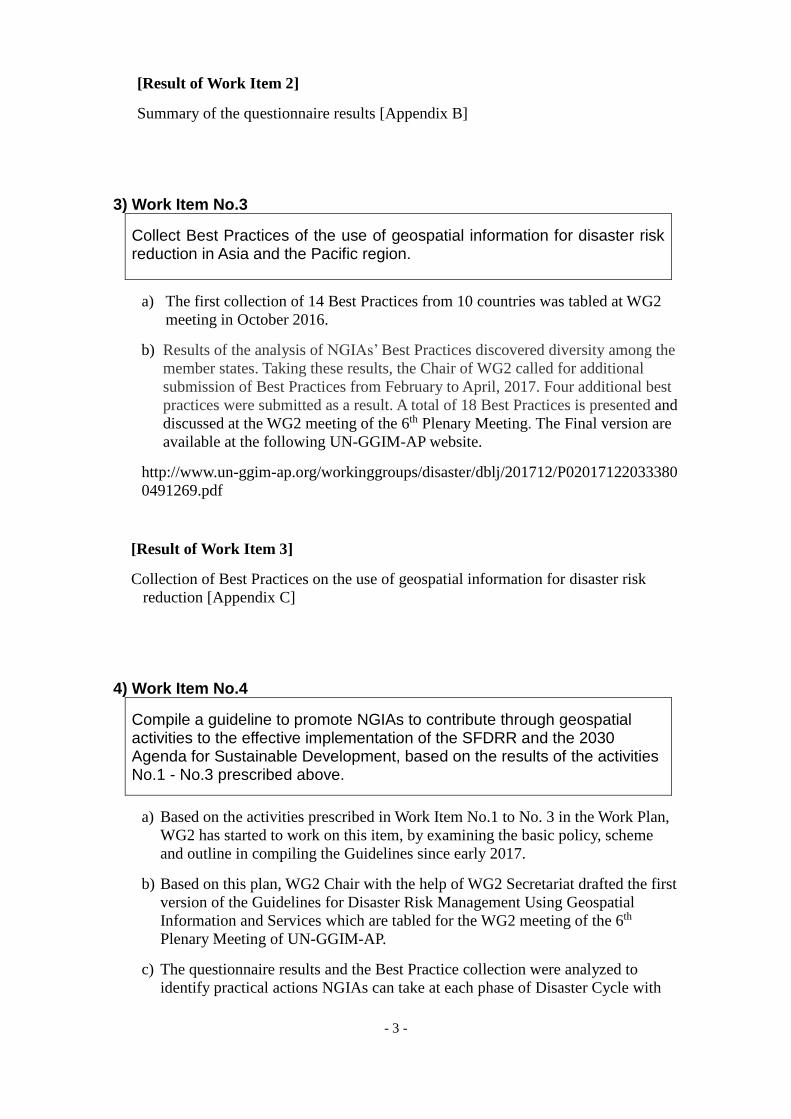
[Result of Work Item 2]
Summary of the questionnaire results [Appendix B]
3) Work Item No.3
Collect Best Practices of the use of geospatial information for disaster risk reduction in Asia and the Pacific region.
a) The first collection of 14 Best Practices from 10 countries was tabled at WG2
meeting in October 2016.
b) Results of the analysis of NGIAs’ Best Practices discovered diversity among the
member states. Taking these results, the Chair of WG2 called for additional
submission of Best Practices from February to April, 2017. Four additional best
practices were submitted as a result. A total of 18 Best Practices is presented and
discussed at the WG2 meeting of the 6th Plenary Meeting. The Final version are
available at the following UN-GGIM-AP website.
http://www.un-ggim-ap.org/workinggroups/disaster/dblj/201712/P02017122033380
0491269.pdf
[Result of Work Item 3]
Collection of Best Practices on the use of geospatial information for disaster risk
reduction [Appendix C]
4) Work Item No.4
Compile a guideline to promote NGIAs to contribute through geospatial activities to the effective implementation of the SFDRR and the 2030 Agenda for Sustainable Development, based on the results of the activities No.1 - No.3 prescribed above.
a) Based on the activities prescribed in Work Item No.1 to No. 3 in the Work Plan,
WG2 has started to work on this item, by examining the basic policy, scheme
and outline in compiling the Guidelines since early 2017.
b) Based on this plan, WG2 Chair with the help of WG2 Secretariat drafted the first
version of the Guidelines for Disaster Risk Management Using Geospatial
Information and Services which are tabled for the WG2 meeting of the 6th
Plenary Meeting of UN-GGIM-AP.
c) The questionnaire results and the Best Practice collection were analyzed to
identify practical actions NGIAs can take at each phase of Disaster Cycle with
- 4 -
geospatial information technology.
d) The outcomes of the Special Session of the 6th Plenary Meeting of
UN-GGIM-AP, which discussed the potential roles of NGIAs by analyzing a
specific case of what Geospatial Information Authority of Japan (GSI) did in
response to 2016 Kumamoto Earthquake, were incorporated into the Guidelines
(Draft).
e) Furthermore, the comments made by the members of WG2 as well as
UN-GGIM-AP member NGIAs were incorporated into the Guidelines (Draft).
[Result of Work Item 4]
Guidelines for Disaster Risk Management Using Geospatial Information and
Services [Appendix D]
5) Work Item No.5
Identify the potential areas of future cooperation with the UN-GGIM Working Group on disasters to be established in accordance with the decision of the fifth session of UN-GGIM.
a) WG2 shared the final report of questionnaire results and the Collection of Best
Practices with UN-GGIM WG-Disasters.
b) WG2 Chair made a presentation about the WG2 activities and its linkage to the
Strategic Framework on Geospatial Information and Services at the side event
“Geospatial Information and Services for Disasters” of the 7th Session of
UN-GGIM, on 31 July 2017.
6) Work Item No.6
Encourage Member States to share earth observations infrastructure,
technology and data resources for disaster management on a voluntary
basis.
a) At every reports of the Plenary Meetings and the Executive Board Meetings,
WG2 invited Member States of the UN-GGIM-AP to voluntarily share the earth
observation infrastructure, technology and data resources.
- 5 -
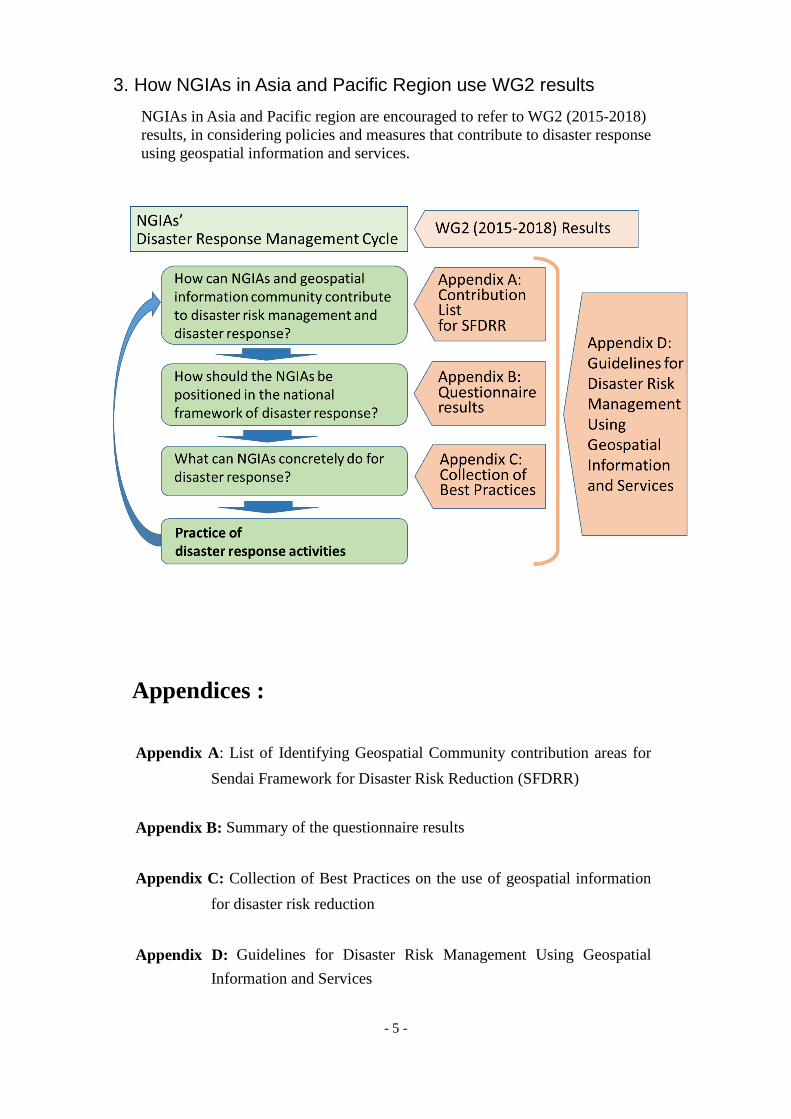
3. How NGIAs in Asia and Pacific Region use WG2 results
NGIAs in Asia and Pacific region are encouraged to refer to WG2 (2015-2018)
results, in considering policies and measures that contribute to disaster response
using geospatial information and services.
Appendices :
Appendix A: List of Identifying Geospatial Community contribution areas for
Sendai Framework for Disaster Risk Reduction (SFDRR)
Appendix B: Summary of the questionnaire results
Appendix C: Collection of Best Practices on the use of geospatial information
for disaster risk reduction
Appendix D: Guidelines for Disaster Risk Management Using Geospatial
Information and Services
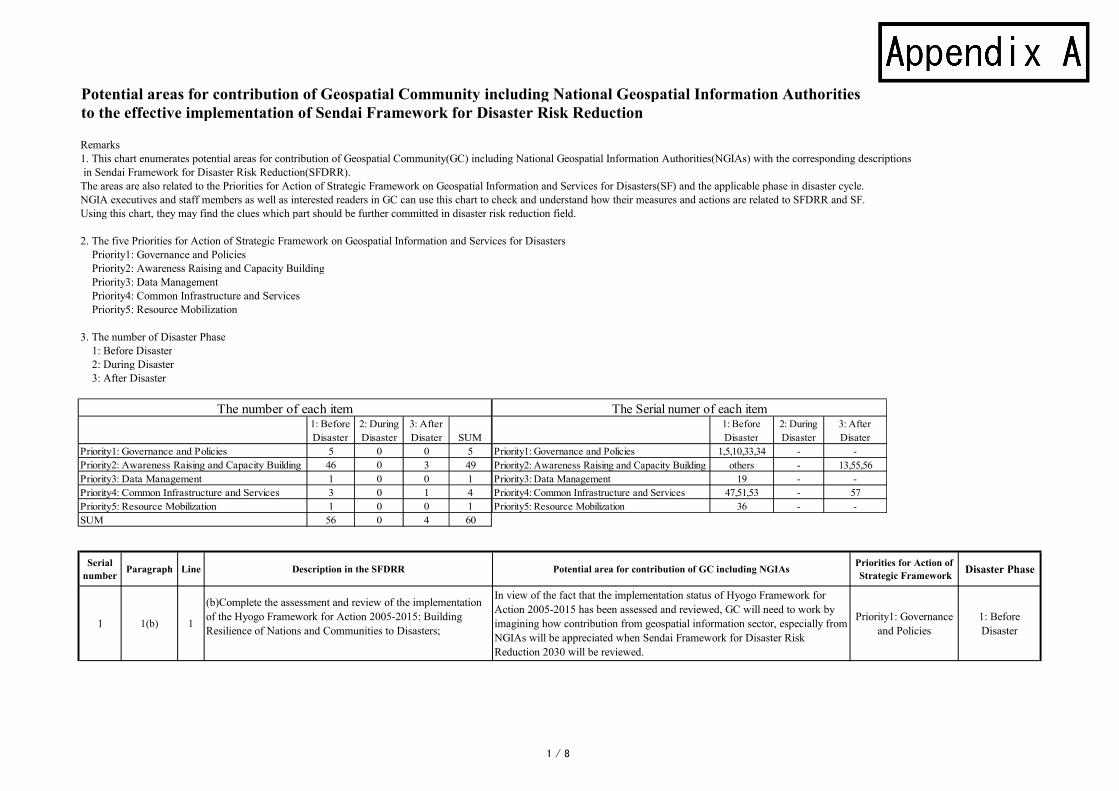
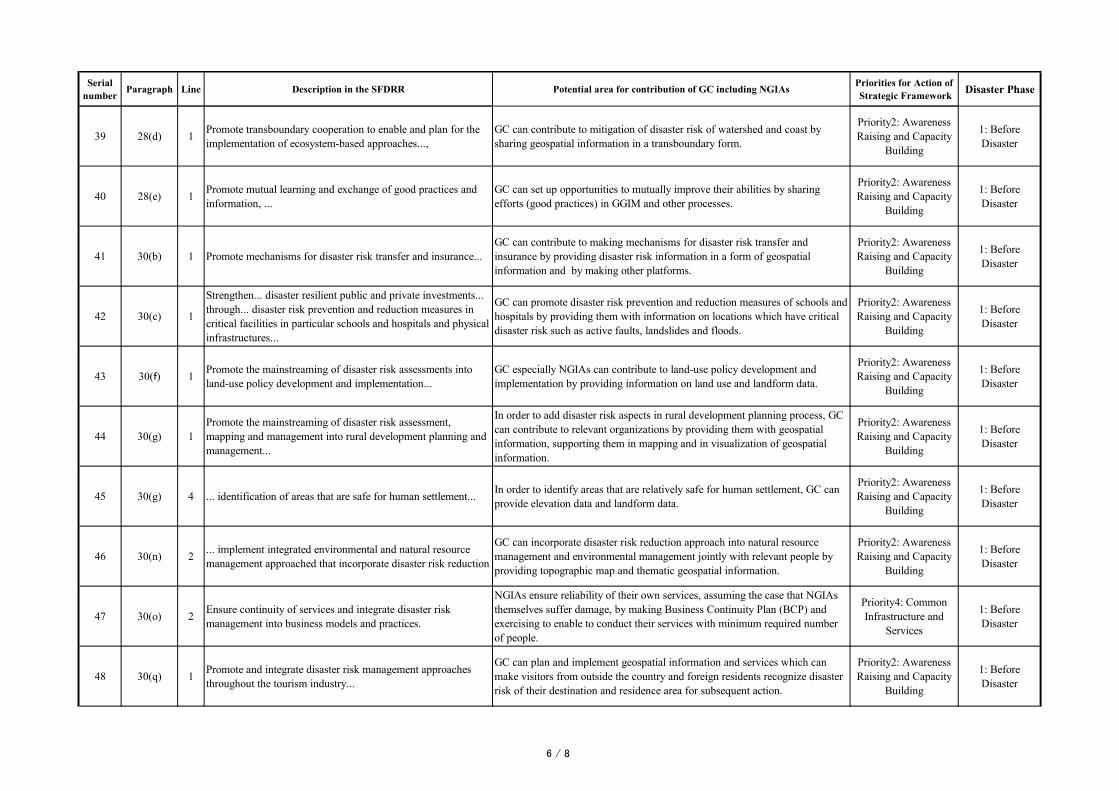
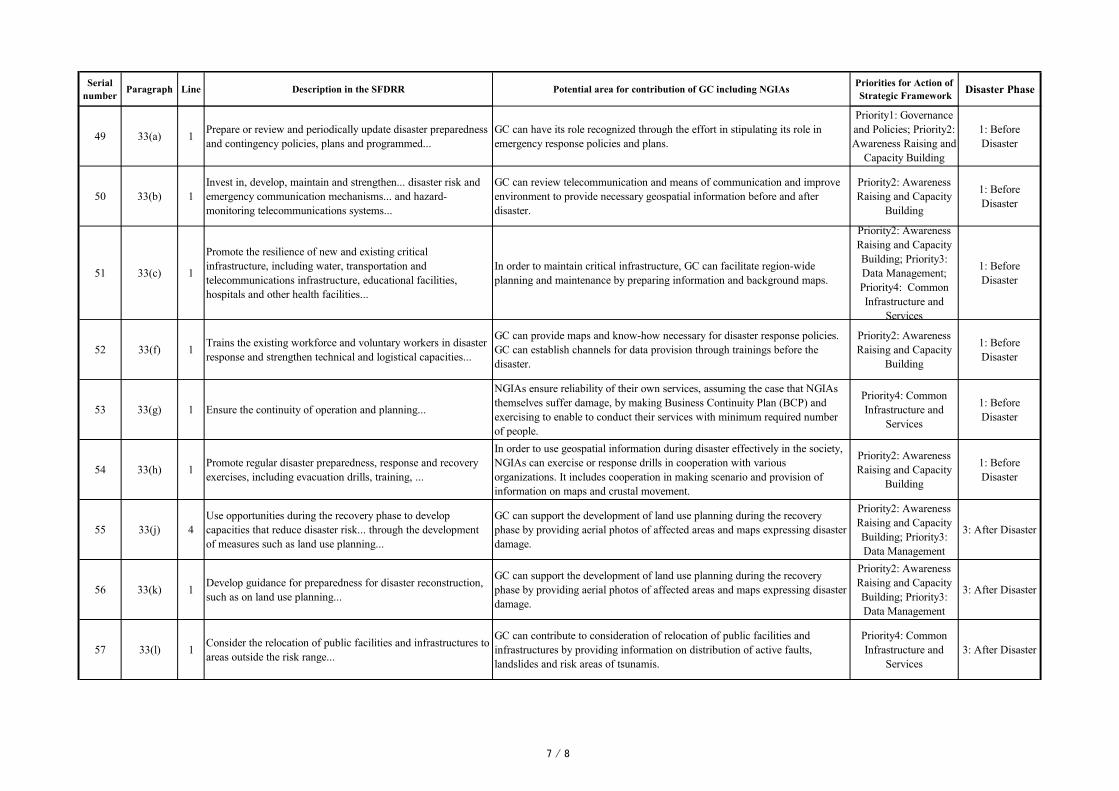
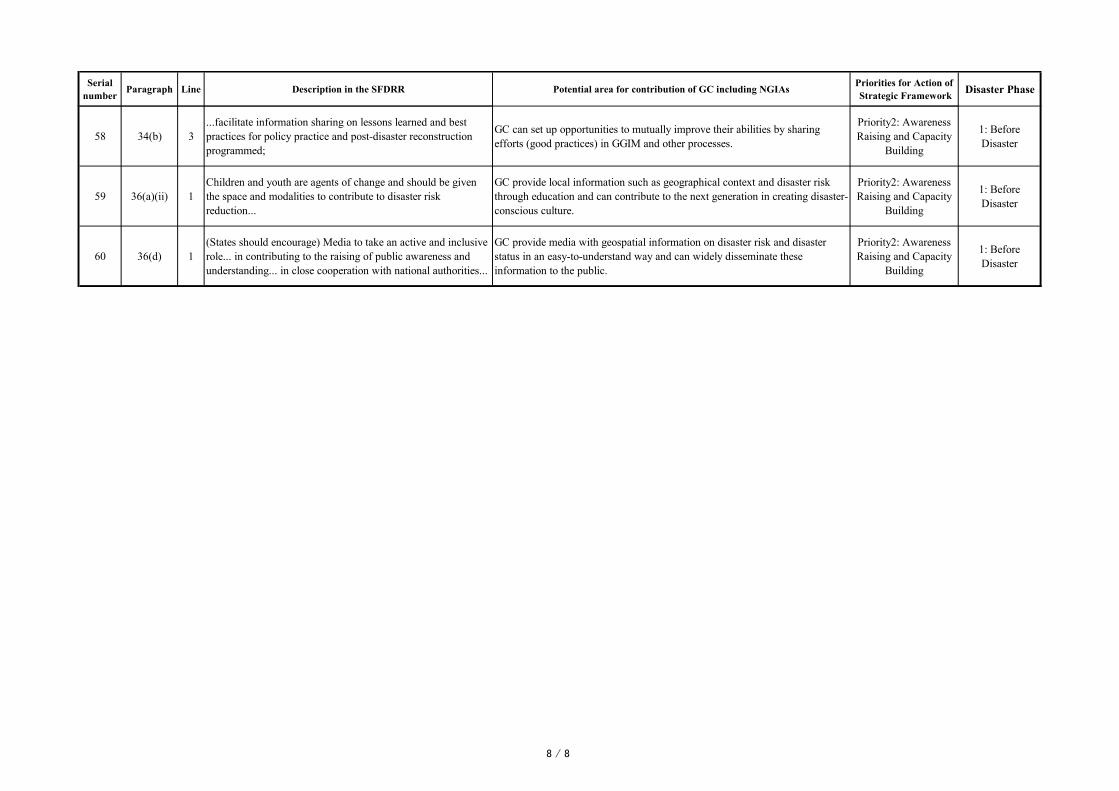
Potential areas for contribution of Geospatial Community including National Geospatial Information Authorities to the effective implementation of Sendai Framework for Disaster Risk Reduction
Remarks1. This chart enumerates potential areas for contribution of Geospatial Community(GC) including National Geospatial Information Authorities(NGIAs) with the corresponding descriptions in Sendai Framework for Disaster Risk Reduction(SFDRR).The areas are also related to the Priorities for Action of Strategic Framework on Geospatial Information and Services for Disasters(SF) and the applicable phase in disaster cycle.NGIA executives and staff members as well as interested readers in GC can use this chart to check and understand how their measures and actions are related to SFDRR and SF.Using this chart, they may find the clues which part should be further committed in disaster risk reduction field.
2. The five Priorities for Action of Strategic Framework on Geospatial Information and Services for Disasters Priority1: Governance and Policies Priority2: Awareness Raising and Capacity Building Priority3: Data Management Priority4: Common Infrastructure and Services Priority5: Resource Mobilization
3. The number of Disaster Phase 1: Before Disaster 2: During Disaster 3: After Disaster
Serialnumber Paragraph Line Description in the SFDRR Potential area for contribution of GC including NGIAs Priorities for Action of
Strategic Framework Disaster Phase
1 1(b) 1
(b)Complete the assessment and review of the implementationof the Hyogo Framework for Action 2005-2015: BuildingResilience of Nations and Communities to Disasters;
In view of the fact that the implementation status of Hyogo Framework forAction 2005-2015 has been assessed and reviewed, GC will need to work byimagining how contribution from geospatial information sector, especially fromNGIAs will be appreciated when Sendai Framework for Disaster RiskReduction 2030 will be reviewed.
Priority1: Governanceand Policies
1: BeforeDisaster
1: BeforeDisaster
2: DuringDisaster
3: AfterDisater SUM
Priority1: Governance and Policies 5 0 0 5Priority2: Awareness Raising and Capacity Building 46 0 3 49Priority3: Data Management 1 0 0 1Priority4: Common Infrastructure and Services 3 0 1 4Priority5: Resource Mobilization 1 0 0 1SUM 56 0 4 60
The number of each item1: BeforeDisaster
2: DuringDisaster
3: AfterDisater
Priority1: Governance and Policies 1,5,10,33,34 - -Priority2: Awareness Raising and Capacity Building others - 13,55,56Priority3: Data Management 19 - -Priority4: Common Infrastructure and Services 47,51,53 - 57Priority5: Resource Mobilization 36 - -
The Serial numer of each item
1 / 8

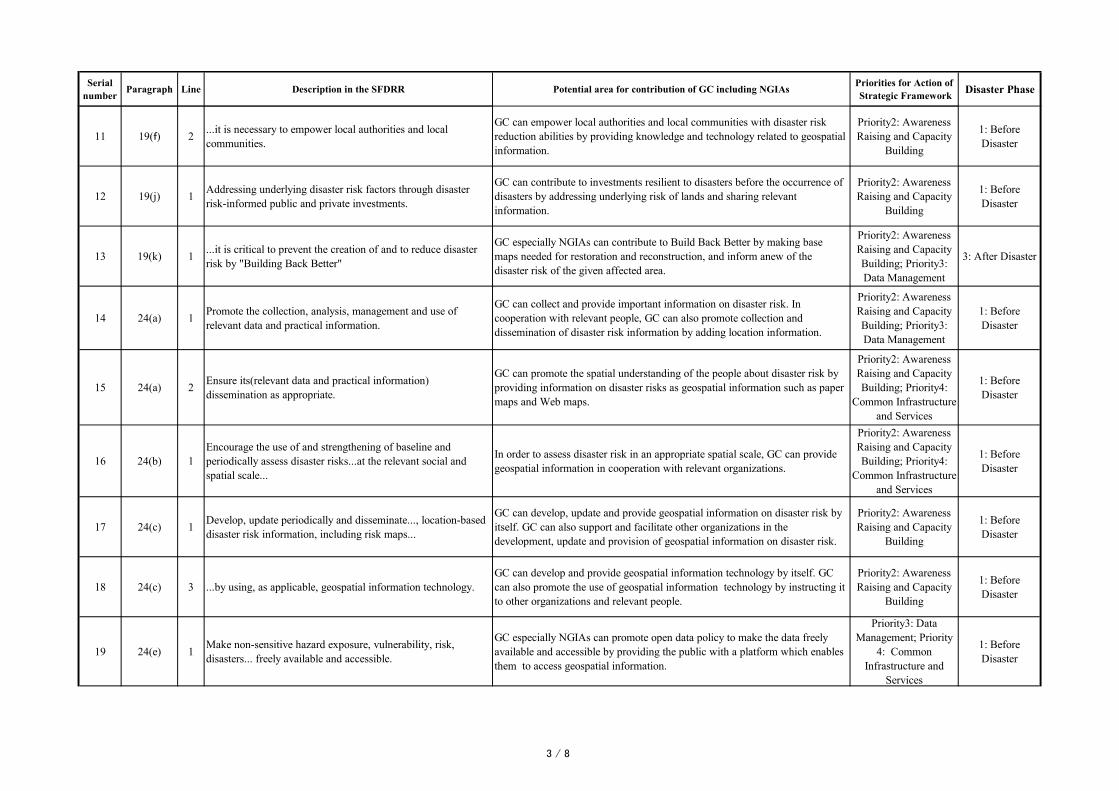
Serialnumber Paragraph Line Description in the SFDRR Potential area for contribution of GC including NGIAs Priorities for Action of
Strategic Framework Disaster Phase
2 6 3...needs to be focused on tackling underlying disaster riskdrivers, such as...unplanned and rapid urbanization, poor landmanagement...
Unsustainable use of natural resources as a result of unplanned and rapidurbanization and insufficient land administration will cause disaster risk. Theiraggravation can be prevented by administration in understanding the situationusing geospatial information provided by GC.
Priority2: AwarenessRaising and Capacity
Building
1: BeforeDisaster
3 14 2 ...monitoring, assessing and understanding disaster risk... GC especially NGIAs can inform of disaster risk by providing crustalmovement and landform information through map expressions.
Priority2: AwarenessRaising and Capacity
Building
1: BeforeDisaster
4 14 8 ...enhancing multi-hazard early warning systems... GC can make a platform and provide geospatial information in coordinationwith relevant organizations to create early warning systems.
Priority2: AwarenessRaising and CapacityBuilding; Priority4:
Common Infrastructureand Services
1: BeforeDisaster
5 16 6
...the present framework aims to achieve the followingoutcome over the next 15 years: The substantial reduction ofdisaster risk and losses in lives, livelihoods and health and inthe economic, physical, social, cultural and environmentalassets of persons, businesses, communities and countries
GC need to be conscious of how their efforts employed lead to the SFDRRoutcome through what kind of value chains to be build.
Priority1: Governanceand Policies
1: BeforeDisaster
6 18(e) 1 ...increase the number of counties with national and localdisaster risk reduction strategies by 2020
GC can contribute to making good disaster risk reduction strategies byproviding information on location of important infrastructures and vulnerabilityto disasters.
Priority2: AwarenessRaising and Capacity
Building
1: BeforeDisaster
7 18(e) 1 ...increase the number of counties with national and localdisaster risk reduction strategies by 2020
GC can contribute to national disaster risk reduction and disaster riskmitigation by incorporating GC's own work into national disaster risk reductionstrategies.
Priority2: AwarenessRaising and Capacity
Building
1: BeforeDisaster
8 18(f) 1 ...substantially enhance international cooperation to developingcountries...
By joining cooperation activities and the network of GGIM, GGIM WG-Disasters and GGIM-AP, GC can mutually enhance its abilities.
Priority2: AwarenessRaising and Capacity
Building
1: BeforeDisaster
9 18(g) 1...substantially increase the availability of and access to multi-hazard early warning systems and disaster risk information andassessments.
GC can exercise its leadership in geospatial information aspect by providingearly warning systems and disaster risk information and assessments, therebycontributing to enhancing their availability.
Priority2: AwarenessRaising and Capacity
Building
1: BeforeDisaster
10 19(b) 1 ...responsibilities be shared by central governments and relevantnational authorities.
NGIAs bear part of the responsibility in public administration related togeospatial information towards mitigating disaster risk at national level.
Priority1: Governanceand Policies
1: BeforeDisaster
2 / 8
Serialnumber Paragraph Line Description in the SFDRR Potential area for contribution of GC including NGIAs Priorities for Action of
Strategic Framework Disaster Phase
11 19(f) 2 ...it is necessary to empower local authorities and localcommunities.
GC can empower local authorities and local communities with disaster riskreduction abilities by providing knowledge and technology related to geospatialinformation.
Priority2: AwarenessRaising and Capacity
Building
1: BeforeDisaster
12 19(j) 1 Addressing underlying disaster risk factors through disasterrisk-informed public and private investments.
GC can contribute to investments resilient to disasters before the occurrence ofdisasters by addressing underlying risk of lands and sharing relevantinformation.
Priority2: AwarenessRaising and Capacity
Building
1: BeforeDisaster
13 19(k) 1 ...it is critical to prevent the creation of and to reduce disasterrisk by "Building Back Better"
GC especially NGIAs can contribute to Build Back Better by making basemaps needed for restoration and reconstruction, and inform anew of thedisaster risk of the given affected area.
Priority2: AwarenessRaising and CapacityBuilding; Priority3:Data Management
3: After Disaster
14 24(a) 1 Promote the collection, analysis, management and use ofrelevant data and practical information.
GC can collect and provide important information on disaster risk. Incooperation with relevant people, GC can also promote collection anddissemination of disaster risk information by adding location information.
Priority2: AwarenessRaising and CapacityBuilding; Priority3:Data Management
1: BeforeDisaster
15 24(a) 2 Ensure its(relevant data and practical information)dissemination as appropriate.
GC can promote the spatial understanding of the people about disaster risk byproviding information on disaster risks as geospatial information such as papermaps and Web maps.
Priority2: AwarenessRaising and CapacityBuilding; Priority4:
Common Infrastructureand Services
1: BeforeDisaster
16 24(b) 1Encourage the use of and strengthening of baseline andperiodically assess disaster risks...at the relevant social andspatial scale...
In order to assess disaster risk in an appropriate spatial scale, GC can providegeospatial information in cooperation with relevant organizations.
Priority2: AwarenessRaising and CapacityBuilding; Priority4:
Common Infrastructureand Services
1: BeforeDisaster
17 24(c) 1 Develop, update periodically and disseminate..., location-baseddisaster risk information, including risk maps...
GC can develop, update and provide geospatial information on disaster risk byitself. GC can also support and facilitate other organizations in thedevelopment, update and provision of geospatial information on disaster risk.
Priority2: AwarenessRaising and Capacity
Building
1: BeforeDisaster
18 24(c) 3 ...by using, as applicable, geospatial information technology.GC can develop and provide geospatial information technology by itself. GCcan also promote the use of geospatial information technology by instructing itto other organizations and relevant people.
Priority2: AwarenessRaising and Capacity
Building
1: BeforeDisaster
19 24(e) 1 Make non-sensitive hazard exposure, vulnerability, risk,disasters... freely available and accessible.
GC especially NGIAs can promote open data policy to make the data freelyavailable and accessible by providing the public with a platform which enablesthem to access geospatial information.
Priority3: DataManagement; Priority
4: CommonInfrastructure and
Services
1: BeforeDisaster
3 / 8

Serialnumber Paragraph Line Description in the SFDRR Potential area for contribution of GC including NGIAs Priorities for Action of
Strategic Framework Disaster Phase
20 24(f) 1Promote real-time access to reliable data, make use of space andin situ information, including geographic information systems(GIS)...
In order to promote data access using GIS, GC can provide relevant real-timemaps such as background map and crustal movement map by itself or incooperation with other organizations.
Priority2: AwarenessRaising and CapacityBuilding; Priority3:Data Management;Priority4: CommonInfrastructure and
Services
1: BeforeDisaster
21 24(g) 1Build the knowledge of government officials at all levels, civilsociety, ... through... training and education on disaster riskreduction.
GC can cultivate the knowledge of government officials and civil society ondisaster risks from the viewpoint of geospatial information through training andeducation, etc.
Priority2: AwarenessRaising and Capacity
Building
1: BeforeDisaster
22 24(g) 1Build the knowledge of government officials at all levels, civilsociety, ... through... training and education on disaster riskreduction.
GC can provide government officials at all levels and civil society withpractical knowledge on geospatial information technology.
Priority2: AwarenessRaising and Capacity
Building
1: BeforeDisaster
23 24(h) 1 Promote and improve dialogue and cooperation amongscientific and technological communities...
GC can improve abilities of works on geospatial information for mitigatingdisaster risk by understanding and acquiring the most up-to-date trend ofscientific technology.
Priority2: AwarenessRaising and Capacity
Building
1: BeforeDisaster
24 24(i) 1 Ensure the use of traditional, indigenous and local knowledgeand practices.
It is important to ensure the use of traditional, indigenous and local knowledgeand practices. GC can support systems to express these knowledge andpractices on maps by adding location information and contribute to the societyby sharing them.
Priority2: AwarenessRaising and Capacity
Building
1: BeforeDisaster
25 24(k) 1Promote investments in innovation and technology developmentin long-term, multi-hazard and solution-drive research indisaster risk management.
GC especially NGIAs can provide information on crustal movement caused byplate movement, volcanic activity and landform. GC can contribute topromoting communication between the public and experts through employingsophisticated cartography, as a communication medium.
Priority2: AwarenessRaising and Capacity
Building
1: BeforeDisaster
26 24(k) 1 Promote the incorporation of disaster risk knowledge,... informal and non-formal education.
In order to disseminate disaster risk reduction knowledge based on mapping,surveying and geospatial information effort through education, GC can supporteducational administration agencies, teachers and students.
Priority2: AwarenessRaising and Capacity
Building
1: BeforeDisaster
27 24(m) 1 Promote national strategies to strengthen public education andawareness in disaster risk reduction...
For lifetime education, GC can enter into communities and raise the people'sawareness of disaster risk through visiting lectures, lecture meetings, and fieldexcursion on landform and the environment.
Priority2: AwarenessRaising and Capacity
Building
1: BeforeDisaster
28 24(o) 1 Enhance collaboration among people at the local level todisseminate disaster risk information, ...
To local communities and NGOs, GC especially NGIAs can providetopographic maps, map-related materials to indicate disaster risk and know-how to fully use them. This enables to support disaster risk reduction effortsrooted in local community.
Priority2: AwarenessRaising and Capacity
Building
1: BeforeDisaster
4 / 8
Serialnumber Paragraph Line Description in the SFDRR Potential area for contribution of GC including NGIAs Priorities for Action of
Strategic Framework Disaster Phase
29 25(a) 1Enhance the development and dissemination of science-basedmethodologies and tools... to strengthen disaster risk modelling,assessment, mapping, ...
GC especially NGIAs can set up opportunities to mutually improve its abilitiesby sharing efforts (good practices) in GGIM and other processes.
Priority2: AwarenessRaising and Capacity
Building
1: BeforeDisaster
30 25(b) 1Promote the conduction of comprehensive surveys on multi-hazard disaster risks and the development of regional disasterrisk assessments and maps, ...
GC can contribute to multi-hazard disaster risk survey by providing data andgetting involved in mapping.
Priority2: AwarenessRaising and Capacity
Building
1: BeforeDisaster
31 25(f) 7...to promote a culture of disaster prevention, resilience andresponsible citizenship, generate understanding of disaster risk,support mutual learning, share experiences...
GC can play a role in a campaign to promote understanding of disaster risk incooperation with other organizations and stakeholders.
Priority2: AwarenessRaising and Capacity
Building
1: BeforeDisaster
32 25(g) 1
Enhance the scientific and technical work on disaster riskreduction and its mobilization ... in order to ... disseminate riskinformation with the best use of geospatial informationtechnology...
NGIAs can contribute to sharing, sending and technological development ofdisaster risk information as a custodian of fundamental national geospatialinformation and national geospatial information infrastructure.
Priority2: AwarenessRaising and Capacity
Building
1: BeforeDisaster
33 27(a) 2
Review and promote the coherence and furtherdevelopment,...of national local frameworks of laws, regulationand public policies, which, by defining roles andresponsibilities, ...
It is important to work on to firmly define the NGIA's roles and responsibilitiesin national laws, frameworks, and public policies related to disaster riskmitigation.
Priority1: Governanceand Policies
1: BeforeDisaster
34 27(b) 1 Adopt and implement national and local disaster risk reductionstrategies and plans...
NGIAs' contribution can be made public by stipulating the items which shouldbe implemented by NGIAs in strategies and plans for disaster risk mitigation.
Priority1: Governanceand Policies
1: BeforeDisaster
35 27(d) 2...ensure high levels of compliance with existing safe-enhancingprovisions of sectoral laws and regulations, including thoseaddressing land use and urban planning...
GC can contribute to integration of policies by providing related organizationswith geospatial information, and data on landform and geodesy needed to betterconsider disaster risk related to land use and urban planning.
Priority2: AwarenessRaising and Capacity
Building
1: BeforeDisaster
36 27(i) 1 Encourage parliamentarians to support the implementation ofdisaster risk reduction...
NGIAs can explain the importance of geospatial information related to disasterrisk also to the members of the national parliament and make a point oflegitimacy of budget allocation.
Priority5: ResourceMobilization
1: BeforeDisaster
37 27(j) 1 Promote the development of quality standards, such ascertifications and awards for disaster risk management...
NGIAs can get publicity of the public by awarding excellent practices in usinggeospatial information, especially those related to the use of geospatialinformation to mitigate disaster risk.
Priority2: AwarenessRaising and Capacity
Building
1: BeforeDisaster
38 27(k) 1Formulate public policies... aimed at addressing the issues ofprevention or relocation... of human settlements of in disasterrisk zones.
In prevention and relocation of human settlements in high disaster risk zone,geospatial information related to disaster risk is important. Better decision-making can be facilitated by GC's and especially NGIAs' positively providingthese geospatial information.
Priority2: AwarenessRaising and CapacityBuilding; Priority3:Data Management
1: BeforeDisaster
5 / 8
Serialnumber Paragraph Line Description in the SFDRR Potential area for contribution of GC including NGIAs Priorities for Action of
Strategic Framework Disaster Phase
39 28(d) 1 Promote transboundary cooperation to enable and plan for theimplementation of ecosystem-based approaches...,
GC can contribute to mitigation of disaster risk of watershed and coast bysharing geospatial information in a transboundary form.
Priority2: AwarenessRaising and Capacity
Building
1: BeforeDisaster
40 28(e) 1 Promote mutual learning and exchange of good practices andinformation, ...
GC can set up opportunities to mutually improve their abilities by sharingefforts (good practices) in GGIM and other processes.
Priority2: AwarenessRaising and Capacity
Building
1: BeforeDisaster
41 30(b) 1 Promote mechanisms for disaster risk transfer and insurance...GC can contribute to making mechanisms for disaster risk transfer andinsurance by providing disaster risk information in a form of geospatialinformation and by making other platforms.
Priority2: AwarenessRaising and Capacity
Building
1: BeforeDisaster
42 30(c) 1
Strengthen... disaster resilient public and private investments...through... disaster risk prevention and reduction measures incritical facilities in particular schools and hospitals and physicalinfrastructures...
GC can promote disaster risk prevention and reduction measures of schools andhospitals by providing them with information on locations which have criticaldisaster risk such as active faults, landslides and floods.
Priority2: AwarenessRaising and Capacity
Building
1: BeforeDisaster
43 30(f) 1 Promote the mainstreaming of disaster risk assessments intoland-use policy development and implementation...
GC especially NGIAs can contribute to land-use policy development andimplementation by providing information on land use and landform data.
Priority2: AwarenessRaising and Capacity
Building
1: BeforeDisaster
44 30(g) 1Promote the mainstreaming of disaster risk assessment,mapping and management into rural development planning andmanagement...
In order to add disaster risk aspects in rural development planning process, GCcan contribute to relevant organizations by providing them with geospatialinformation, supporting them in mapping and in visualization of geospatialinformation.
Priority2: AwarenessRaising and Capacity
Building
1: BeforeDisaster
45 30(g) 4 ... identification of areas that are safe for human settlement... In order to identify areas that are relatively safe for human settlement, GC canprovide elevation data and landform data.
Priority2: AwarenessRaising and Capacity
Building
1: BeforeDisaster
46 30(n) 2 ... implement integrated environmental and natural resourcemanagement approached that incorporate disaster risk reduction
GC can incorporate disaster risk reduction approach into natural resourcemanagement and environmental management jointly with relevant people byproviding topographic map and thematic geospatial information.
Priority2: AwarenessRaising and Capacity
Building
1: BeforeDisaster
47 30(o) 2 Ensure continuity of services and integrate disaster riskmanagement into business models and practices.
NGIAs ensure reliability of their own services, assuming the case that NGIAsthemselves suffer damage, by making Business Continuity Plan (BCP) andexercising to enable to conduct their services with minimum required numberof people.
Priority4: CommonInfrastructure and
Services
1: BeforeDisaster
48 30(q) 1 Promote and integrate disaster risk management approachesthroughout the tourism industry...
GC can plan and implement geospatial information and services which canmake visitors from outside the country and foreign residents recognize disasterrisk of their destination and residence area for subsequent action.
Priority2: AwarenessRaising and Capacity
Building
1: BeforeDisaster
6 / 8
Serialnumber Paragraph Line Description in the SFDRR Potential area for contribution of GC including NGIAs Priorities for Action of
Strategic Framework Disaster Phase
49 33(a) 1 Prepare or review and periodically update disaster preparednessand contingency policies, plans and programmed...
GC can have its role recognized through the effort in stipulating its role inemergency response policies and plans.
Priority1: Governanceand Policies; Priority2:Awareness Raising and
Capacity Building
1: BeforeDisaster
50 33(b) 1Invest in, develop, maintain and strengthen... disaster risk andemergency communication mechanisms... and hazard-monitoring telecommunications systems...
GC can review telecommunication and means of communication and improveenvironment to provide necessary geospatial information before and afterdisaster.
Priority2: AwarenessRaising and Capacity
Building
1: BeforeDisaster
51 33(c) 1
Promote the resilience of new and existing criticalinfrastructure, including water, transportation andtelecommunications infrastructure, educational facilities,hospitals and other health facilities...
In order to maintain critical infrastructure, GC can facilitate region-wideplanning and maintenance by preparing information and background maps.
Priority2: AwarenessRaising and CapacityBuilding; Priority3:Data Management;Priority4: CommonInfrastructure and
Services
1: BeforeDisaster
52 33(f) 1 Trains the existing workforce and voluntary workers in disasterresponse and strengthen technical and logistical capacities...
GC can provide maps and know-how necessary for disaster response policies.GC can establish channels for data provision through trainings before thedisaster.
Priority2: AwarenessRaising and Capacity
Building
1: BeforeDisaster
53 33(g) 1 Ensure the continuity of operation and planning...
NGIAs ensure reliability of their own services, assuming the case that NGIAsthemselves suffer damage, by making Business Continuity Plan (BCP) andexercising to enable to conduct their services with minimum required numberof people.
Priority4: CommonInfrastructure and
Services
1: BeforeDisaster
54 33(h) 1 Promote regular disaster preparedness, response and recoveryexercises, including evacuation drills, training, ...
In order to use geospatial information during disaster effectively in the society,NGIAs can exercise or response drills in cooperation with variousorganizations. It includes cooperation in making scenario and provision ofinformation on maps and crustal movement.
Priority2: AwarenessRaising and Capacity
Building
1: BeforeDisaster
55 33(j) 4Use opportunities during the recovery phase to developcapacities that reduce disaster risk... through the developmentof measures such as land use planning...
GC can support the development of land use planning during the recoveryphase by providing aerial photos of affected areas and maps expressing disasterdamage.
Priority2: AwarenessRaising and CapacityBuilding; Priority3:Data Management
3: After Disaster
56 33(k) 1 Develop guidance for preparedness for disaster reconstruction,such as on land use planning...
GC can support the development of land use planning during the recoveryphase by providing aerial photos of affected areas and maps expressing disasterdamage.
Priority2: AwarenessRaising and CapacityBuilding; Priority3:Data Management
3: After Disaster
57 33(l) 1 Consider the relocation of public facilities and infrastructures toareas outside the risk range...
GC can contribute to consideration of relocation of public facilities andinfrastructures by providing information on distribution of active faults,landslides and risk areas of tsunamis.
Priority4: CommonInfrastructure and
Services3: After Disaster
7 / 8
Serialnumber Paragraph Line Description in the SFDRR Potential area for contribution of GC including NGIAs Priorities for Action of
Strategic Framework Disaster Phase
58 34(b) 3...facilitate information sharing on lessons learned and bestpractices for policy practice and post-disaster reconstructionprogrammed;
GC can set up opportunities to mutually improve their abilities by sharingefforts (good practices) in GGIM and other processes.
Priority2: AwarenessRaising and Capacity
Building
1: BeforeDisaster
59 36(a)(ii) 1Children and youth are agents of change and should be giventhe space and modalities to contribute to disaster riskreduction...
GC provide local information such as geographical context and disaster riskthrough education and can contribute to the next generation in creating disaster-conscious culture.
Priority2: AwarenessRaising and Capacity
Building
1: BeforeDisaster
60 36(d) 1(States should encourage) Media to take an active and inclusiverole... in contributing to the raising of public awareness andunderstanding... in close cooperation with national authorities...
GC provide media with geospatial information on disaster risk and disasterstatus in an easy-to-understand way and can widely disseminate theseinformation to the public.
Priority2: AwarenessRaising and Capacity
Building
1: BeforeDisaster
8 / 8
1 / 14
Regional Committee of United Nations Global Geospatial
Information Management for Asia and the Pacific (UN-GGIM-AP)
Established by a United Nations Resolution
Summary of the questionnaire results(Final report)
Based on its workplan established in October 2015 at the UN-GGIM-AP 4th meeting, UN-GGIM-AP WG2 on Disaster Risk Management sent out a questionnaire to member states. The purpose of the questionnaire survey is to investigate the present roles of disaster management authorities and NGIAs, and to find potential areas for extended roles of NGIAs and collaboration with disaster management authorities through the use of geospatial areas. Of the 56 member countries of UN-GGIM-AP, we received responses from the following 14 countries (as of the end of March). To the respondent countries, we thank them very much for their cooperation despite their busy schedules. We are extremely grateful, as we were able to collect valuable feedback thanks to their generous support.
Sub Regions Respondent countries Central Asia (0) No Countries answered. Eastern Asia (5) China/ Hong Kong, China/ Japan/ Macau, China/
Mongolia. Northern Asia (0) No Countries answered. Southern Asia (2) Bangladesh/ Sri Lanka. South-Eastern Asia (5) Indonesia/ Malaysia/ Philippines/ Singapore/ Viet Nam. Western Asia (0) No Countries answered. Oceania (2) Australia/ Fiji.
Questionnaire - summary results Section1
Regarding the types of major natural disasters, landslides (12 countries) and floods (12 countries) were identified the most, followed by earthquakes (9 countries), storm surges (9 countries) and wind and water hazards by a typhoon etc. (9 countries).
Of the 14 countries, it was understood that 12 have disaster risk management organizations and 7 maintained laws to govern disaster risk management policies in their countries. As well, 13 of the 14countries, much of the information pertaining to disaster risk management organizations and policies is posted on the websites and can easily be accessed.
2 / 14
Section2 (Targeting the 12 respondent countries that their organization engages in practices and services prior to disasters.)
It was understood that the countries whose NGIAs engage in practices and services in case of disasters (12 countries), engage in various activities prior to, during and post disasters.
Six countries have national laws and/or bylaws, which lay the foundation of disaster risk reduction activities in their organization.
Four countries responded that their organization has a section, which is mainly responsible for disaster risk reduction and/or management, and engage in various activities to conduct capacity building for the staff.
Most of the countries (11 countries/12 countries) that have disaster risk management organizations, suggested in their replies that there is a strong collaboration between NGIAs and the disaster risk management organizations, including in data sharing and joint drills, etc.
Section3 (Targeting the 12 respondent countries that their organization engages in practices and services prior to disasters.)
Regarding the NGIAs that replied to the questionnaire, it was understood that they have various geospatial information products used in case of disasters.
Regarding the geospatial information products used in case of disasters, eight countries responded that they also provide paper-based materials to the disaster management organizations, etc., in addition to digital data.
83% of the respondents (10 countries/12 countries) said the geospatial information products used in case of disasters are used by disaster management functions in local governments, making up a large ratio like those that said disaster management functions in national governments.
Section4 (Targeting the 12 respondent countries that their organization engages in practices and services prior to disasters.)
Of the many NGIAs whose responses we received, it was understood that the provision of trustworthy, timely geospatial information is recognized as a challenge in managing geospatial information for disaster risk reduction.
Proposals of collaborations between related organizations, international cooperation and the structuring of databases were identified as solutions to the challenge.
3 / 14
When asked what roles they think are required for NGIAs, prior to, during, and post disasters, and the approaches they are planning in the future, the respondent countries brought up plans such as the creation of rules to effectively transmit data, the creation of hazard maps, and the utilization of satellite images and UAV (Unmanned Aerial Vehicle).
Section5
14 best practices were provided by 10 of the countries. Section6 (Targeting the two respondent countries that said their organization does not engage in practices and services for disasters.)
NGIAs that are not currently engaged in activities for disaster risk reduction, brought up challenges in engaging in disaster risk management, such as making 3D earth models more minute, and connecting to the NSDI web portal.
Demands like the sharing of other countries’ legal documents containing the types of products/emergency measures provided to manage disaster risk management, and sharing of the best practices were identified as expected activities of UN-GGIM-AP-WG2.
4 / 14
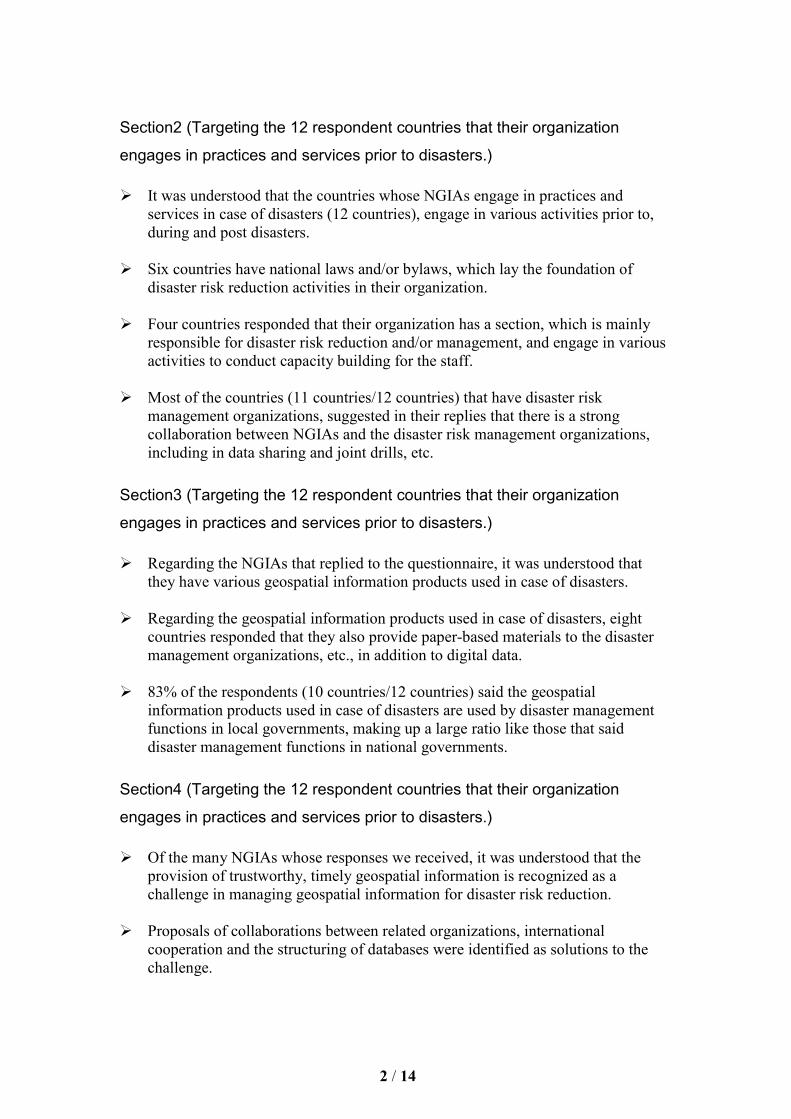
1.1. Total results of each country’s major natural disasters
*Percentage of countries checked within responded 13 countries Regarding what kinds of major natural disasters their country has, landslides (12 countries) and floods (12 countries) were identified the most, followed by earthquakes (9 countries), storm surges (9 countries) and wind and water hazards by a typhoon etc. (9 countries). Among the disasters identified in “Others,” were adhoc flash floods (Singapore), peat fires and smog (Malaysia), sea level rise (Viet Nam) and tsunamis (Australia, Indonesia, Japan) etc. As well, it can be conjectured that these disasters reflect the potential needs of geospatial information for disaster countermeasures in the entire Asia-Pacific region.
1.2. When questioned about the installation of disaster prevention organizations, almost all of the respondent countries (12 countries/14 countries) said that they are installed in their country. It is believed that the result shows each country recognizes disaster risk reduction as one of the important policy issues. 1.2.1 When questioned if there are English documents or an English URL regarding disaster prevention organizations, although no countries provided English documents, 13 of the 14 countries responded with a website URL. Almost all the respondent countries recognized the disaster risk reduction URL, and a means to acquire information through the Internet has been established. As well, it was understood that because it is disseminated in not just their native language but English as well, the information is easily attainable by the international society.
50%
21%
21%
29%
43%
50%
57%
64%
64%
64%
86%
86%
0% 10% 20% 30% 40% 50% 60% 70% 80% 90%100%
Others
Tremendous snowfall
Tornado
Volcanic eruption
Forest fire
Torrential rain
Drought
Wind and water hazard by a typhoon, etc.
Storm surge
Earthquake
Flood
Landslide
SECTION I. GENERAL ISSUES ON DISASTER RISK REDUCTION
5 / 14
1.3. When asked about the laws governing disaster risk reduction policies in their countries, seven of the 14 countries have laws governing disaster risk reduction policies, with a legal framework regarding disaster management in place. Among the respondent countries, there was also a country (Sri Lanka) that does not have laws, but disaster risk reduction policies governed by disaster management policies. Also, Australia responded to the effect that a legal framework establishing the roles of the government and local government exists.
1.3.1 When asked if there were English documents or an English URL regarding laws governing disaster risk reduction policies, while none of the countries provided English documents, seven of the 14 countries responded with a website URL. It was understood that in most of the countries, English translations were disseminated to the international society through the Internet.
SECTION II. ACTIVITIES OF YOUR ORGANIZATION FOR DISASTER RISK REDUCTION 2. When asked if their organizations engages in practices and services prior to,
during, and post disasters, 11 of the 14 countries responded to the effect that they engage in practices and services in case of disasters.
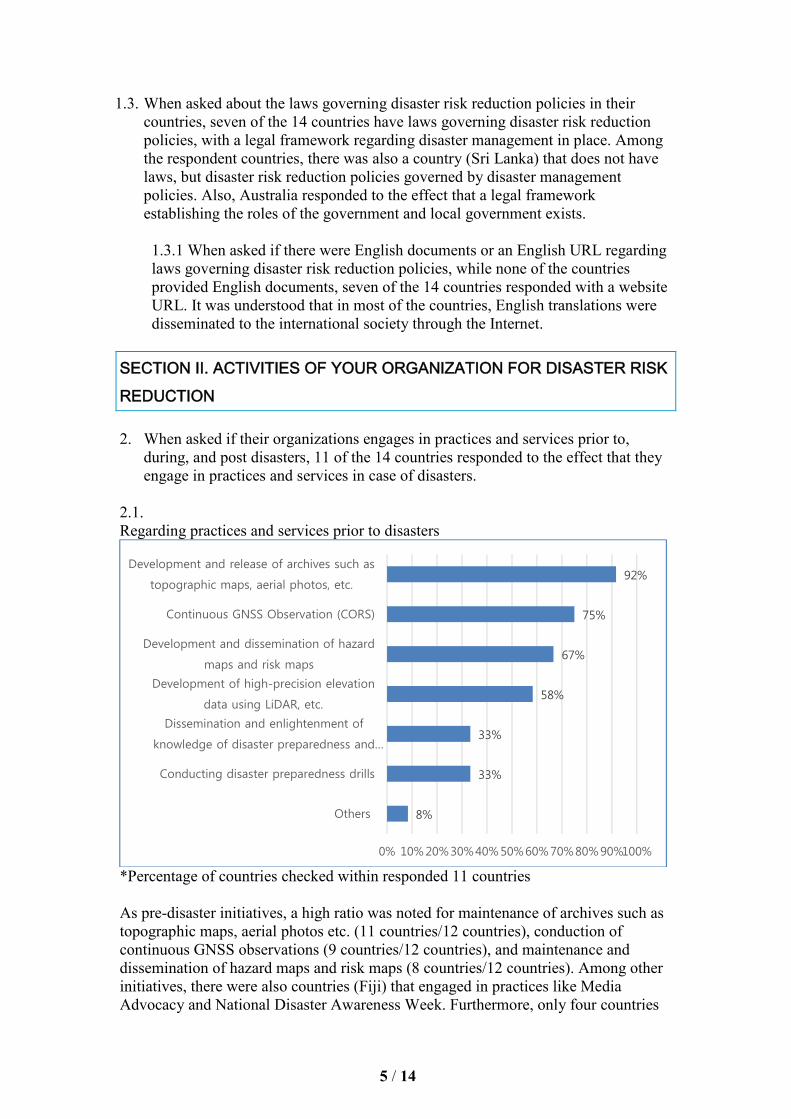
2.1. Regarding practices and services prior to disasters
*Percentage of countries checked within responded 11 countries As pre-disaster initiatives, a high ratio was noted for maintenance of archives such as topographic maps, aerial photos etc. (11 countries/12 countries), conduction of continuous GNSS observations (9 countries/12 countries), and maintenance and dissemination of hazard maps and risk maps (8 countries/12 countries). Among other initiatives, there were also countries (Fiji) that engaged in practices like Media Advocacy and National Disaster Awareness Week. Furthermore, only four countries
8%
33%
33%
58%
67%
75%
92%
0% 10%20%30%40%50%60%70%80%90%100%
Others
Conducting disaster preparedness drills
Dissemination and enlightenment of
knowledge of disaster preparedness and…
Development of high-precision elevation
data using LiDAR, etc.
Development and dissemination of hazard
maps and risk maps
Continuous GNSS Observation (CORS)
Development and release of archives such as
topographic maps, aerial photos, etc.
6 / 14
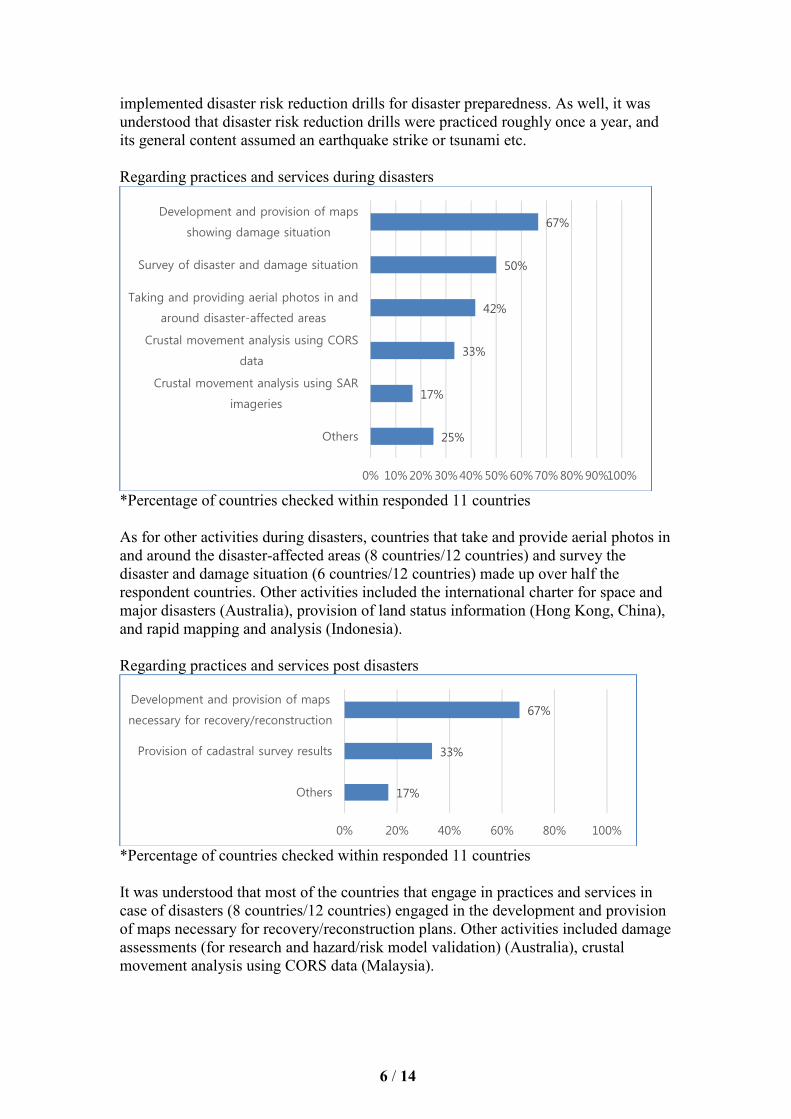
implemented disaster risk reduction drills for disaster preparedness. As well, it was understood that disaster risk reduction drills were practiced roughly once a year, and its general content assumed an earthquake strike or tsunami etc. Regarding practices and services during disasters
*Percentage of countries checked within responded 11 countries As for other activities during disasters, countries that take and provide aerial photos in and around the disaster-affected areas (8 countries/12 countries) and survey the disaster and damage situation (6 countries/12 countries) made up over half the respondent countries. Other activities included the international charter for space and major disasters (Australia), provision of land status information (Hong Kong, China), and rapid mapping and analysis (Indonesia). Regarding practices and services post disasters
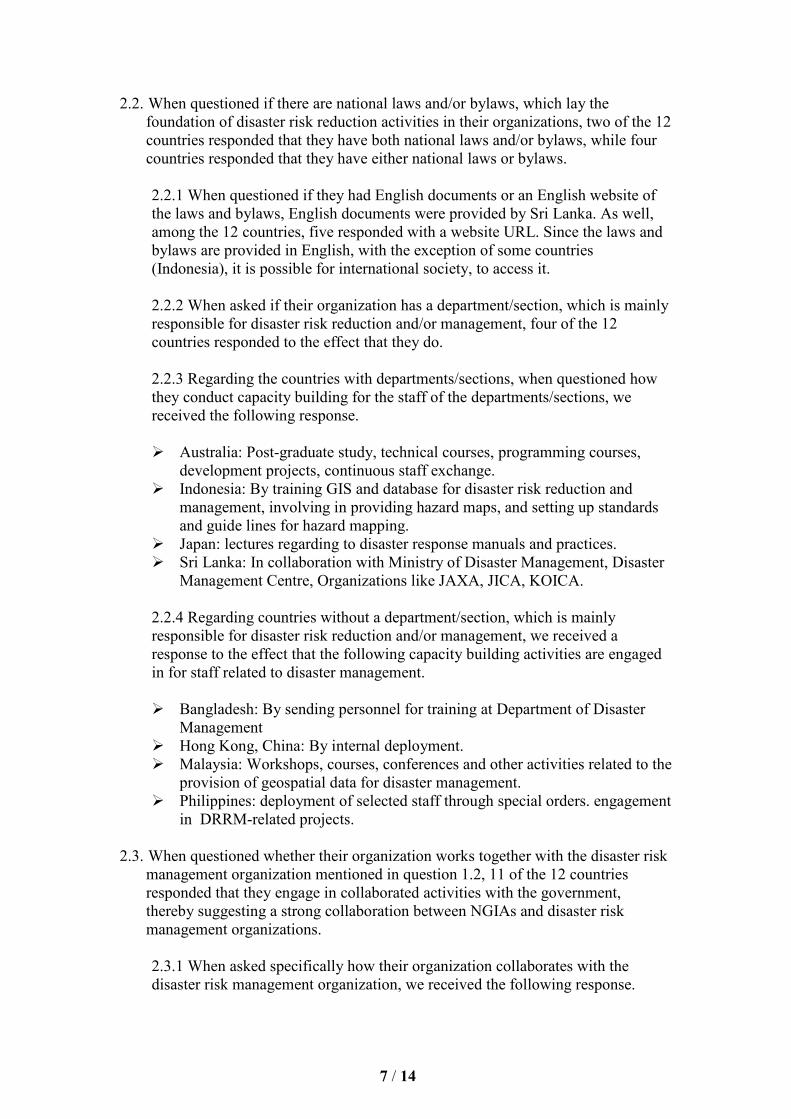
*Percentage of countries checked within responded 11 countries It was understood that most of the countries that engage in practices and services in case of disasters (8 countries/12 countries) engaged in the development and provision of maps necessary for recovery/reconstruction plans. Other activities included damage assessments (for research and hazard/risk model validation) (Australia), crustal movement analysis using CORS data (Malaysia).
25%
17%
33%
42%
50%
67%
0% 10%20%30%40%50%60%70%80%90%100%
Others
Crustal movement analysis using SAR
imageries
Crustal movement analysis using CORS
data
Taking and providing aerial photos in and
around disaster-affected areas
Survey of disaster and damage situation
Development and provision of maps
showing damage situation
17%
33%
67%
0% 20% 40% 60% 80% 100%
Others
Provision of cadastral survey results
Development and provision of maps
necessary for recovery/reconstruction
7 / 14
2.2. When questioned if there are national laws and/or bylaws, which lay the foundation of disaster risk reduction activities in their organizations, two of the 12 countries responded that they have both national laws and/or bylaws, while four countries responded that they have either national laws or bylaws. 2.2.1 When questioned if they had English documents or an English website of the laws and bylaws, English documents were provided by Sri Lanka. As well, among the 12 countries, five responded with a website URL. Since the laws and bylaws are provided in English, with the exception of some countries (Indonesia), it is possible for international society, to access it.
2.2.2 When asked if their organization has a department/section, which is mainly responsible for disaster risk reduction and/or management, four of the 12 countries responded to the effect that they do. 2.2.3 Regarding the countries with departments/sections, when questioned how they conduct capacity building for the staff of the departments/sections, we received the following response.
Australia: Post-graduate study, technical courses, programming courses, development projects, continuous staff exchange.
Indonesia: By training GIS and database for disaster risk reduction and management, involving in providing hazard maps, and setting up standards and guide lines for hazard mapping.
Japan: lectures regarding to disaster response manuals and practices. Sri Lanka: In collaboration with Ministry of Disaster Management, Disaster
Management Centre, Organizations like JAXA, JICA, KOICA.
2.2.4 Regarding countries without a department/section, which is mainly responsible for disaster risk reduction and/or management, we received a response to the effect that the following capacity building activities are engaged in for staff related to disaster management.
Bangladesh: By sending personnel for training at Department of Disaster Management
Hong Kong, China: By internal deployment. Malaysia: Workshops, courses, conferences and other activities related to the
provision of geospatial data for disaster management. Philippines: deployment of selected staff through special orders. engagement
in DRRM-related projects.
2.3. When questioned whether their organization works together with the disaster risk management organization mentioned in question 1.2, 11 of the 12 countries responded that they engage in collaborated activities with the government, thereby suggesting a strong collaboration between NGIAs and disaster risk management organizations.
2.3.1 When asked specifically how their organization collaborates with the disaster risk management organization, we received the following response.
8 / 14
Information and Data sharing (7 countries): Australia/ Bangladesh/ China/ Indonesia/ Malaysia/ Philippines/ Sri Lanka.
Joint drills (4 countries): Australia/ Fiji/ Hong Kong, China/ Japan. Personnel exchange (1 country): Japan
Regarding other activities, we received the following response. Philippines: personnel engagement, education and communication (IEC) campaigns. Sri Lanka: Preparing Maps, Technology transfer, Capacity building. Viet Nam: Provide geospatial data.
SECTION III. GEOSPATIAL INFORMATION MANAGEMENT FOR DISASTER RISK REDUCTION (DRR)? 3.1. When questioned what are the major geospatial information products for disaster
risk reduction, it was understood that each NGIAs has many geospatial information products for disaster risk reduction as follows. geospatial information products
Answer countries
Topographic map / Information
7 countries: Bangladesh, China/ Hong Kong, China/ Japan/ Malaysia/ Philippines/ Sri Lanka/ Viet Nam
DEM (Digital Elevation Model)
4 countries: Bangladesh/ Japan/ Philippines/ Sri Lanka
Aerial photos 4 countries: Bangladesh/ Hong Kong, China/ Japan/ Philippines
Database for NSDI 3 countries: Bangladesh/ Sri Lanka/ Viet Nam Geodetic Data 2 countries: Bangladesh/ Malaysia Land condition data 2 countries: Hong Kong, China/ Japan Each type of hazard map 2 countries: Indonesia/ Sri Lanka
For other products, Malaysia identified numerical cadaster DB, underground installation DB, CORS data, Tidal Information etc.
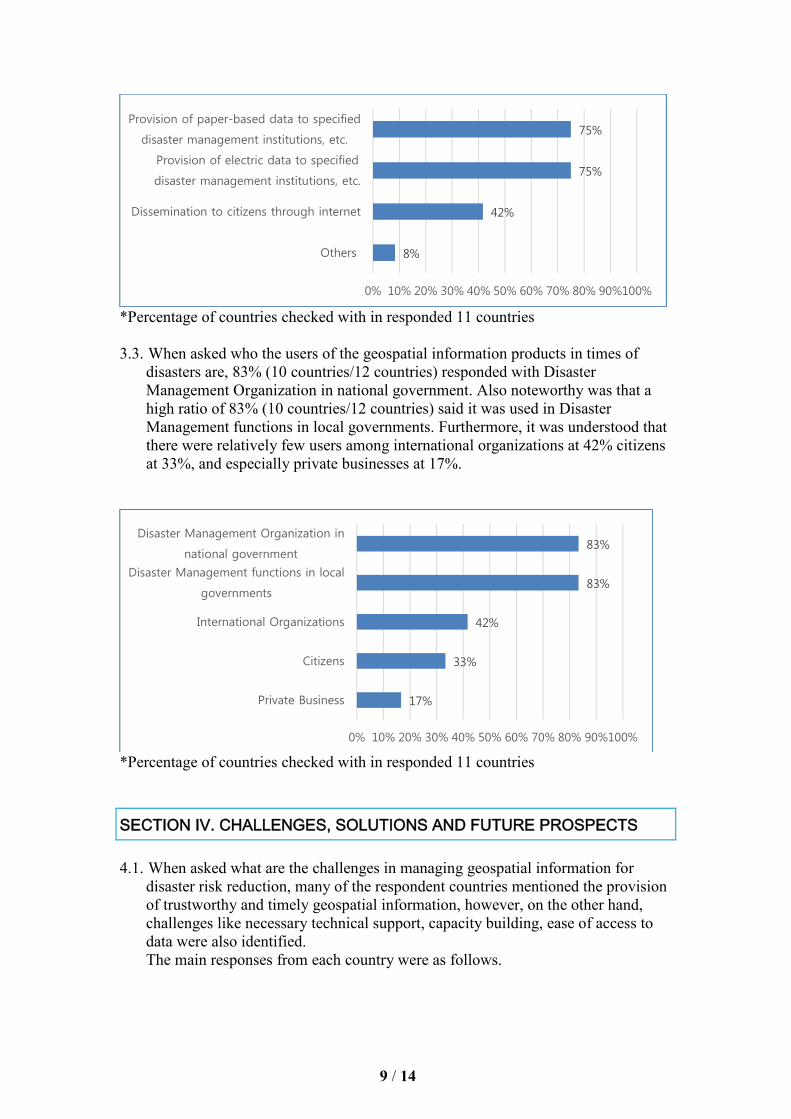
3.2. When questioned what kind of channels are used for geospatial information
products provision in case of disasters, the provision of digital data along with the provision of paper-based data to specified disaster management institutions etc., was the response received by the majority of countries (8 countries/12 countries). There was only one country that provided only electric data or paper-based data, respectively. Furthermore, only five countries provided information to citizens through the Internet.
9 / 14
*Percentage of countries checked with in responded 11 countries 3.3. When asked who the users of the geospatial information products in times of
disasters are, 83% (10 countries/12 countries) responded with Disaster Management Organization in national government. Also noteworthy was that a high ratio of 83% (10 countries/12 countries) said it was used in Disaster Management functions in local governments. Furthermore, it was understood that there were relatively few users among international organizations at 42% citizens at 33%, and especially private businesses at 17%.
*Percentage of countries checked with in responded 11 countries
SECTION IV. CHALLENGES, SOLUTIONS AND FUTURE PROSPECTS 4.1. When asked what are the challenges in managing geospatial information for
disaster risk reduction, many of the respondent countries mentioned the provision of trustworthy and timely geospatial information, however, on the other hand, challenges like necessary technical support, capacity building, ease of access to data were also identified. The main responses from each country were as follows.
8%
42%
75%
75%
0% 10% 20% 30% 40% 50% 60% 70% 80% 90%100%
Others
Dissemination to citizens through internet
Provision of electric data to specified
disaster management institutions, etc.
Provision of paper-based data to specified
disaster management institutions, etc.
17%
33%
42%
83%
83%
0% 10% 20% 30% 40% 50% 60% 70% 80% 90%100%
Private Business
Citizens
International Organizations
Disaster Management functions in local
governments
Disaster Management Organization in
national government
10 / 14
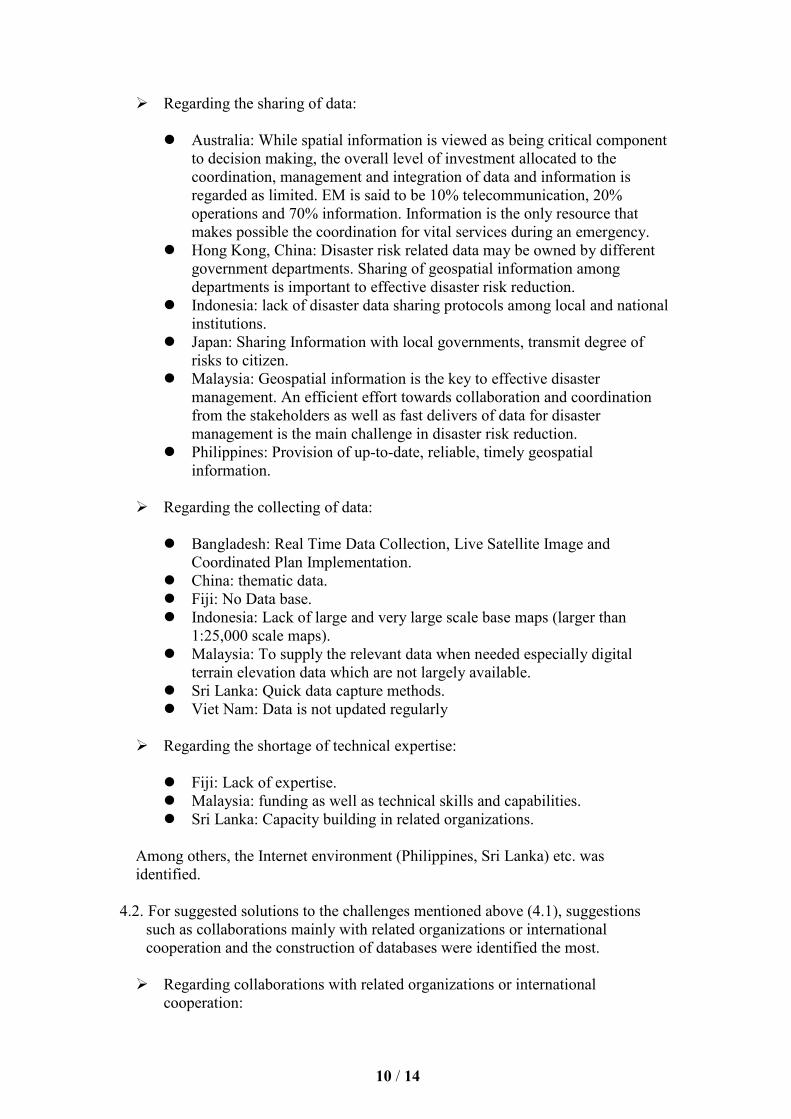
Regarding the sharing of data:
Australia: While spatial information is viewed as being critical component to decision making, the overall level of investment allocated to the coordination, management and integration of data and information is regarded as limited. EM is said to be 10% telecommunication, 20% operations and 70% information. Information is the only resource that makes possible the coordination for vital services during an emergency.
Hong Kong, China: Disaster risk related data may be owned by different government departments. Sharing of geospatial information among departments is important to effective disaster risk reduction.
Indonesia: lack of disaster data sharing protocols among local and national institutions.
Japan: Sharing Information with local governments, transmit degree of risks to citizen.
Malaysia: Geospatial information is the key to effective disaster management. An efficient effort towards collaboration and coordination from the stakeholders as well as fast delivers of data for disaster management is the main challenge in disaster risk reduction.
Philippines: Provision of up-to-date, reliable, timely geospatial information.
Regarding the collecting of data:
Bangladesh: Real Time Data Collection, Live Satellite Image and Coordinated Plan Implementation.
China: thematic data. Fiji: No Data base. Indonesia: Lack of large and very large scale base maps (larger than
1:25,000 scale maps). Malaysia: To supply the relevant data when needed especially digital
terrain elevation data which are not largely available. Sri Lanka: Quick data capture methods. Viet Nam: Data is not updated regularly
Regarding the shortage of technical expertise:
Fiji: Lack of expertise. Malaysia: funding as well as technical skills and capabilities. Sri Lanka: Capacity building in related organizations.
Among others, the Internet environment (Philippines, Sri Lanka) etc. was identified.
4.2. For suggested solutions to the challenges mentioned above (4.1), suggestions
such as collaborations mainly with related organizations or international cooperation and the construction of databases were identified the most. Regarding collaborations with related organizations or international
cooperation:
11 / 14
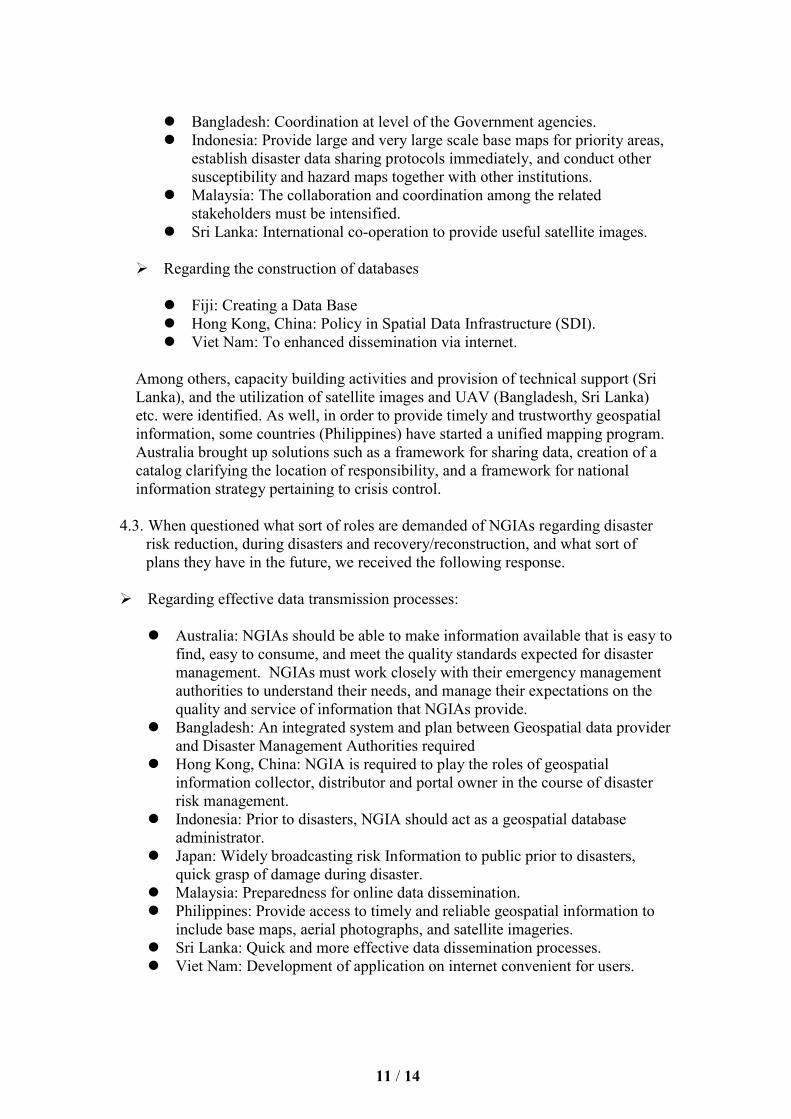
Bangladesh: Coordination at level of the Government agencies. Indonesia: Provide large and very large scale base maps for priority areas,
establish disaster data sharing protocols immediately, and conduct other susceptibility and hazard maps together with other institutions.
Malaysia: The collaboration and coordination among the related stakeholders must be intensified.
Sri Lanka: International co-operation to provide useful satellite images.
Regarding the construction of databases
Fiji: Creating a Data Base Hong Kong, China: Policy in Spatial Data Infrastructure (SDI). Viet Nam: To enhanced dissemination via internet.
Among others, capacity building activities and provision of technical support (Sri Lanka), and the utilization of satellite images and UAV (Bangladesh, Sri Lanka) etc. were identified. As well, in order to provide timely and trustworthy geospatial information, some countries (Philippines) have started a unified mapping program. Australia brought up solutions such as a framework for sharing data, creation of a catalog clarifying the location of responsibility, and a framework for national information strategy pertaining to crisis control.
4.3. When questioned what sort of roles are demanded of NGIAs regarding disaster
risk reduction, during disasters and recovery/reconstruction, and what sort of plans they have in the future, we received the following response.
Regarding effective data transmission processes:
Australia: NGIAs should be able to make information available that is easy to
find, easy to consume, and meet the quality standards expected for disaster management. NGIAs must work closely with their emergency management authorities to understand their needs, and manage their expectations on the quality and service of information that NGIAs provide.
Bangladesh: An integrated system and plan between Geospatial data provider and Disaster Management Authorities required
Hong Kong, China: NGIA is required to play the roles of geospatial information collector, distributor and portal owner in the course of disaster risk management.
Indonesia: Prior to disasters, NGIA should act as a geospatial database administrator.
Japan: Widely broadcasting risk Information to public prior to disasters, quick grasp of damage during disaster.
Malaysia: Preparedness for online data dissemination. Philippines: Provide access to timely and reliable geospatial information to
include base maps, aerial photographs, and satellite imageries. Sri Lanka: Quick and more effective data dissemination processes. Viet Nam: Development of application on internet convenient for users.
12 / 14
Regarding the creation of hazard maps:
Bangladesh: Preparation of disaster risk and hazard maps for the Disaster
Management Agencies. Fiji: Hazard Mapping of vulnerable communities. Indonesia: NGIA should conduct crustal movement monitoring, and provide
geospatial information concerning all disaster susceptibility maps, disaster risk maps, and disaster contingency plan maps/disaster evacuation route maps.
Japan: Publicizing the risk information according to each type of hazard.
Regarding the utilization of satellite images and UAV
Sri Lanka: Capture information on disaster situations / Satellite images / UAV
Malaysia: To provide aerial photo using UAV during and after disaster for relief and recovery purposes.
Among the other responses, post-disaster evaluations (Indonesia), the mechanization of the cooperation and creation of laws (China) and the creation of GEO portals (Philippines) etc. were identified.
SECTION V. BEST PRACTICES USING GEOSPATIAL INFORMATION IN THE FIELD OF DISASTER RISK REDUCTION There were provisions of best practices from many countries. The respondent country and title is as follows (details shown separately) 1. Australia
Real Time Crisis Response Mapping for Government Officials 2. Bangladesh
Use of Geospatial information for DRR in Asia and the Pacific region 3. China
earthquake 4. Fiji
Tropical Cyclone, Flooding 5. Hong Kong, China
Contingency Plan for Natural Disasters 6. Indonesia
Rapid Mapping of Kelud Mountain 7. Japan
Floods as a result of heavy rain 2011 Great East Japan Earthquake
8. Malaysia The Use Of Unmanned Aerial Vehicle (UAV) To Monitor The Flood And Its
Impact in Malaysia Earthquake Struck Ranau In Sabah, Malaysia
13 / 14
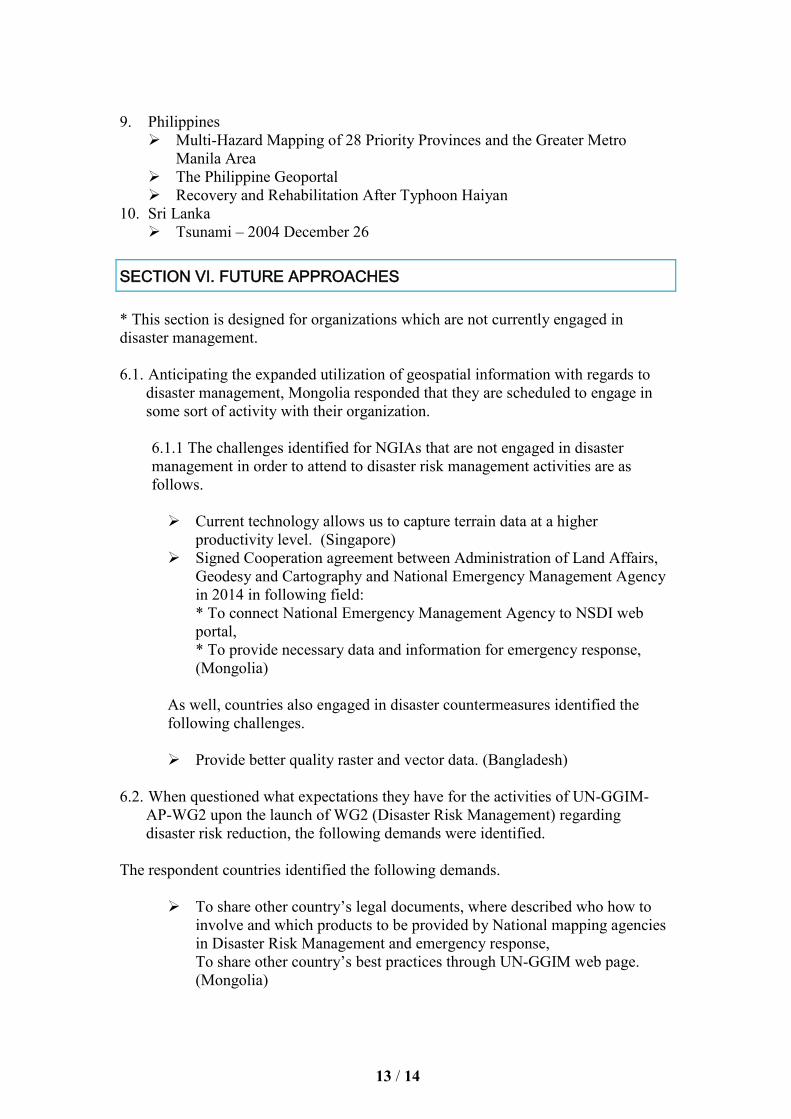
9. Philippines
Multi-Hazard Mapping of 28 Priority Provinces and the Greater Metro Manila Area
The Philippine Geoportal Recovery and Rehabilitation After Typhoon Haiyan
10. Sri Lanka Tsunami – 2004 December 26
SECTION VI. FUTURE APPROACHES * This section is designed for organizations which are not currently engaged in disaster management. 6.1. Anticipating the expanded utilization of geospatial information with regards to
disaster management, Mongolia responded that they are scheduled to engage in some sort of activity with their organization. 6.1.1 The challenges identified for NGIAs that are not engaged in disaster management in order to attend to disaster risk management activities are as follows.
Current technology allows us to capture terrain data at a higher productivity level. (Singapore)
Signed Cooperation agreement between Administration of Land Affairs, Geodesy and Cartography and National Emergency Management Agency in 2014 in following field: * To connect National Emergency Management Agency to NSDI web portal, * To provide necessary data and information for emergency response, (Mongolia)
As well, countries also engaged in disaster countermeasures identified the following challenges.
Provide better quality raster and vector data. (Bangladesh)
6.2. When questioned what expectations they have for the activities of UN-GGIM-AP-WG2 upon the launch of WG2 (Disaster Risk Management) regarding disaster risk reduction, the following demands were identified.
The respondent countries identified the following demands.
To share other country’s legal documents, where described who how to involve and which products to be provided by National mapping agencies in Disaster Risk Management and emergency response, To share other country’s best practices through UN-GGIM web page. (Mongolia)
14 / 14
As well, countries also engaged in disaster countermeasures identified the following demands.
data sharing system internationally. (China) Guidelines to be developed are expected to be actionable, especially for
those low- and middle-income countries. (Macau, China) An integrated, comprehensive and coordinated plan including contingency
plan for prior to, just after and post disaster. (Bangladesh) Using geographic data before, during and after disasters is essential.
Geographic data with accurate and current will help agencies and the people to build recovery plans. UNGGIM-AP should propose the United Nations to make recommendations to government of member countries to further promote the application of geographic data for management of natural disasters. Promoting the development of disaster management geoportal of Asian and Pacific Ocean. (Viet Nam)
Others Regarding the contents of this questionnaire, the respondent countries left the following comments.
This questionnaire is very difficult to fill in. wish to simplify it. Thank you very much for initiating this type of importance issue. It will
definitely help us to prepare disaster plan. In this regard we will try to contribute as per your requirement in future. It’s a great pleasure for us for contributing in UN-GGIM-AP-Working Group 2 on Disaster Risk Management.
We do provide geospatial information to the departments responsible for disaster risk management. The geospatial information provided has a wide range of uses inclusive of disaster risk reduction.
Final Report
Collection of Best Practices on the use of
geospatial information for disaster risk
reduction
UN-GGIM-AP WG2
October 2017
Regional Committee of United Nations Global Geospatial
Information Management for Asia and the Pacific
(UN-GGIM-AP)
Contents
1. Overview of the Best Practice survey 1
2. Key findings of the Best Practice cases 1
3. Conclusion
2
4. Summary list of Best Practices introduced 3
5. Best Practice cases
4
1
1. Overview of the Best Practice survey
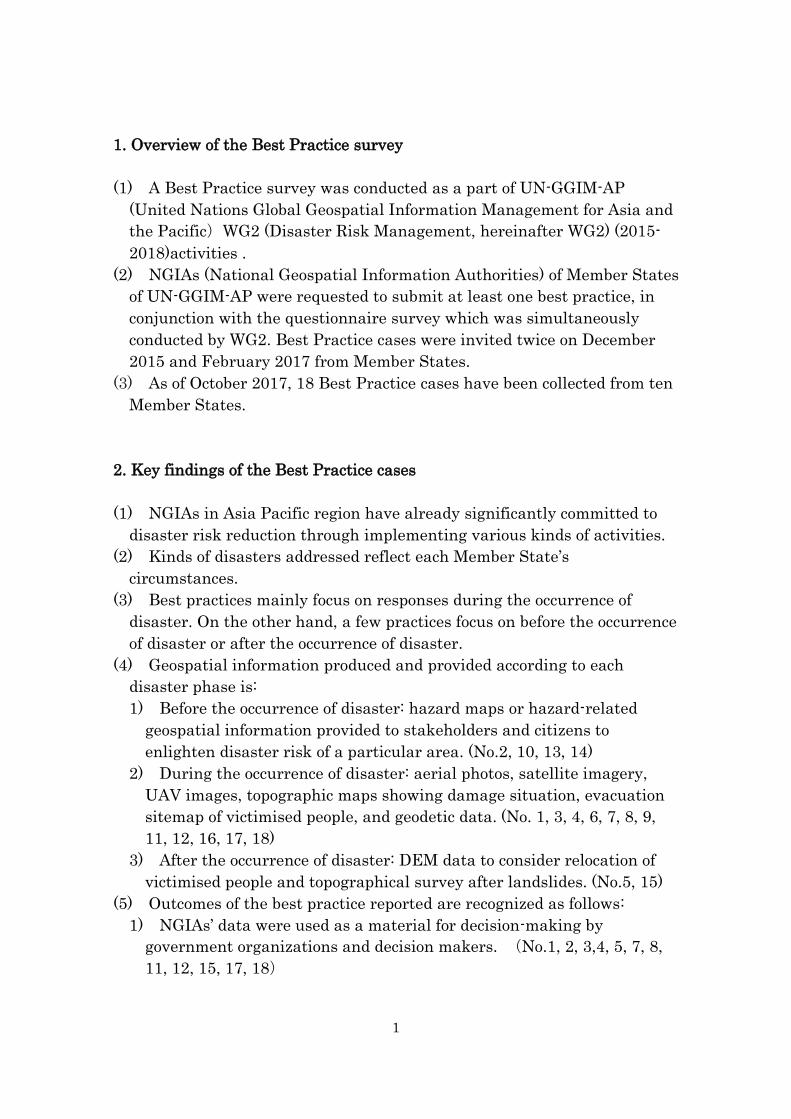
(1) A Best Practice survey was conducted as a part of UN-GGIM-AP
(United Nations Global Geospatial Information Management for Asia and
the Pacific)WG2 (Disaster Risk Management, hereinafter WG2) (2015-
2018)activities .
(2) NGIAs (National Geospatial Information Authorities) of Member States
of UN-GGIM-AP were requested to submit at least one best practice, in
conjunction with the questionnaire survey which was simultaneously
conducted by WG2. Best Practice cases were invited twice on December
2015 and February 2017 from Member States.
(3) As of October 2017, 18 Best Practice cases have been collected from ten
Member States.
2. Key findings of the Best Practice cases
(1) NGIAs in Asia Pacific region have already significantly committed to
disaster risk reduction through implementing various kinds of activities.
(2) Kinds of disasters addressed reflect each Member State’s
circumstances.
(3) Best practices mainly focus on responses during the occurrence of
disaster. On the other hand, a few practices focus on before the occurrence
of disaster or after the occurrence of disaster.
(4) Geospatial information produced and provided according to each
disaster phase is:
1) Before the occurrence of disaster: hazard maps or hazard-related
geospatial information provided to stakeholders and citizens to
enlighten disaster risk of a particular area. (No.2, 10, 13, 14)
2) During the occurrence of disaster: aerial photos, satellite imagery,
UAV images, topographic maps showing damage situation, evacuation
sitemap of victimised people, and geodetic data. (No. 1, 3, 4, 6, 7, 8, 9,
11, 12, 16, 17, 18)
3) After the occurrence of disaster: DEM data to consider relocation of
victimised people and topographical survey after landslides. (No.5, 15)
(5) Outcomes of the best practice reported are recognized as follows:
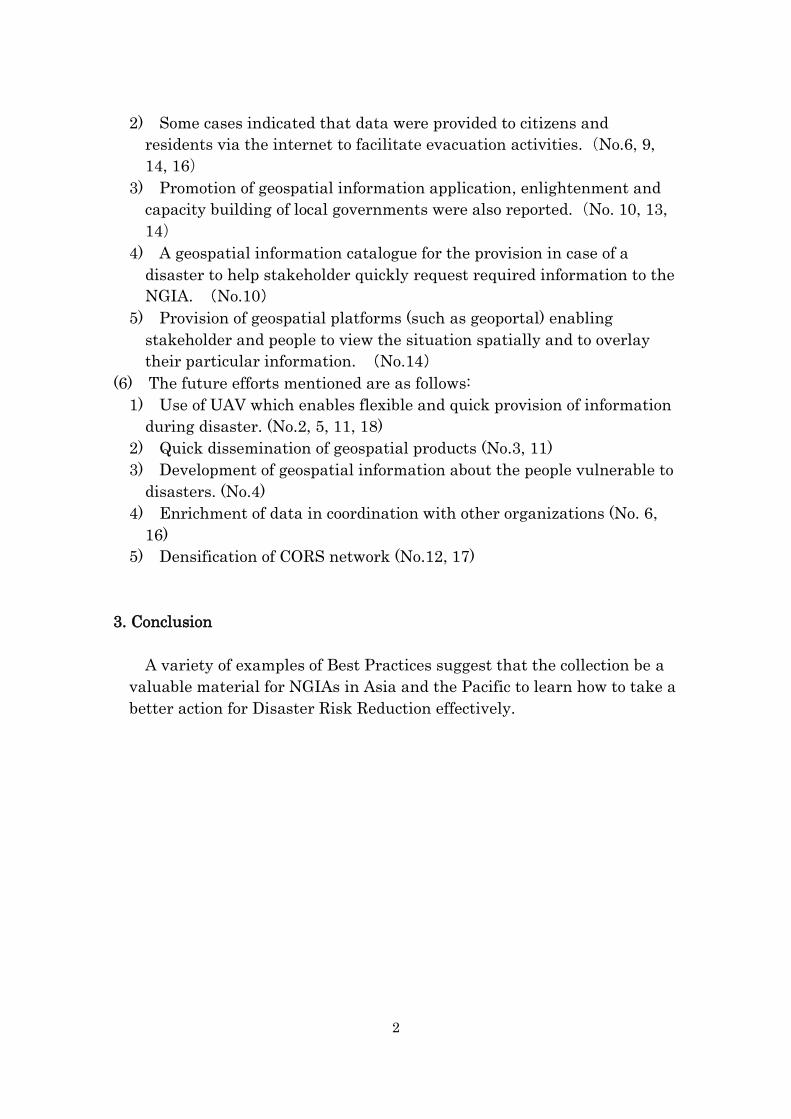
1) NGIAs’ data were used as a material for decision-making by
government organizations and decision makers. (No.1, 2, 3,4, 5, 7, 8,
11, 12, 15, 17, 18)
2
2) Some cases indicated that data were provided to citizens and
residents via the internet to facilitate evacuation activities.(No.6, 9,
14, 16)
3) Promotion of geospatial information application, enlightenment and
capacity building of local governments were also reported.(No. 10, 13,
14)
4) A geospatial information catalogue for the provision in case of a
disaster to help stakeholder quickly request required information to the
NGIA. (No.10)
5) Provision of geospatial platforms (such as geoportal) enabling
stakeholder and people to view the situation spatially and to overlay
their particular information. (No.14)
(6) The future efforts mentioned are as follows:
1) Use of UAV which enables flexible and quick provision of information
during disaster. (No.2, 5, 11, 18)
2) Quick dissemination of geospatial products (No.3, 11)
3) Development of geospatial information about the people vulnerable to
disasters. (No.4)
4) Enrichment of data in coordination with other organizations (No. 6,
16)
5) Densification of CORS network (No.12, 17)
3. Conclusion
A variety of examples of Best Practices suggest that the collection be a
valuable material for NGIAs in Asia and the Pacific to learn how to take a
better action for Disaster Risk Reduction effectively.
3
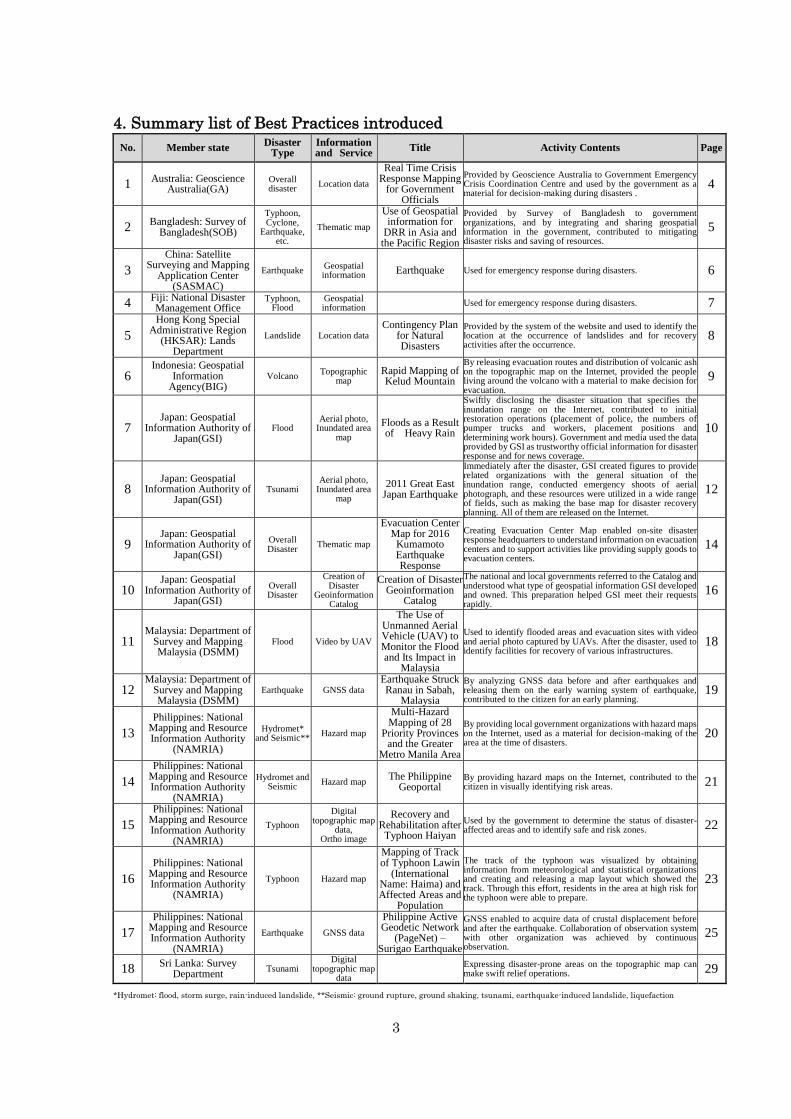
4. Summary list of Best Practices introduced
No. Member state Disaster
Type Information and Service
Title Activity Contents Page
1 Australia: Geoscience
Australia(GA) Overall disaster
Location data
Real Time Crisis Response Mapping
for Government Officials
Provided by Geoscience Australia to Government Emergency Crisis Coordination Centre and used by the government as a material for decision-making during disasters .
4
2 Bangladesh: Survey of
Bangladesh(SOB)
Typhoon, Cyclone,
Earthquake, etc.
Thematic map
Use of Geospatial information for
DRR in Asia and the Pacific Region
Provided by Survey of Bangladesh to government organizations, and by integrating and sharing geospatial information in the government, contributed to mitigating disaster risks and saving of resources.
5
3
China: Satellite Surveying and Mapping
Application Center (SASMAC)
Earthquake Geospatial information
Earthquake Used for emergency response during disasters. 6
4 Fiji: National Disaster Management Office
Typhoon, Flood
Geospatial information
Used for emergency response during disasters. 7
5
Hong Kong Special Administrative Region
(HKSAR): Lands Department
Landslide Location data Contingency Plan
for Natural Disasters
Provided by the system of the website and used to identify the location at the occurrence of landslides and for recovery activities after the occurrence.
8
6 Indonesia: Geospatial
Information Agency(BIG)
Volcano Topographic
map Rapid Mapping of Kelud Mountain
By releasing evacuation routes and distribution of volcanic ash on the topographic map on the Internet, provided the people living around the volcano with a material to make decision for evacuation.
9
7 Japan: Geospatial
Information Authority of Japan(GSI)
Flood Aerial photo,
Inundated area map
Floods as a Result of Heavy Rain
Swiftly disclosing the disaster situation that specifies the inundation range on the Internet, contributed to initial restoration operations (placement of police, the numbers of pumper trucks and workers, placement positions and determining work hours). Government and media used the data provided by GSI as trustworthy official information for disaster response and for news coverage.
10
8 Japan: Geospatial
Information Authority of Japan(GSI)
Tsunami Aerial photo,
Inundated area map
2011 Great East Japan Earthquake
Immediately after the disaster, GSI created figures to provide related organizations with the general situation of the inundation range, conducted emergency shoots of aerial photograph, and these resources were utilized in a wide range of fields, such as making the base map for disaster recovery planning. All of them are released on the Internet.
12
9 Japan: Geospatial
Information Authority of Japan(GSI)
Overall Disaster
Thematic map
Evacuation Center Map for 2016
Kumamoto Earthquake Response
Creating Evacuation Center Map enabled on-site disaster response headquarters to understand information on evacuation centers and to support activities like providing supply goods to evacuation centers.
14
10 Japan: Geospatial
Information Authority of Japan(GSI)
Overall Disaster
Creation of Disaster
Geoinformation Catalog
Creation of Disaster Geoinformation
Catalog
The national and local governments referred to the Catalog and understood what type of geospatial information GSI developed and owned. This preparation helped GSI meet their requests rapidly.
16
11 Malaysia: Department of
Survey and Mapping Malaysia (DSMM)
Flood Video by UAV
The Use of Unmanned Aerial Vehicle (UAV) to Monitor the Flood and Its Impact in
Malaysia
Used to identify flooded areas and evacuation sites with video and aerial photo captured by UAVs. After the disaster, used to identify facilities for recovery of various infrastructures.
18
12 Malaysia: Department of
Survey and Mapping Malaysia (DSMM)
Earthquake GNSS data Earthquake Struck Ranau in Sabah,
Malaysia
By analyzing GNSS data before and after earthquakes and releasing them on the early warning system of earthquake, contributed to the citizen for an early planning.
19
13
Philippines: National Mapping and Resource Information Authority
(NAMRIA)
Hydromet* and Seismic**
Hazard map
Multi-Hazard Mapping of 28
Priority Provinces and the Greater
Metro Manila Area
By providing local government organizations with hazard maps on the Internet, used as a material for decision-making of the area at the time of disasters.
20
14
Philippines: National Mapping and Resource Information Authority
(NAMRIA)
Hydromet and Seismic
Hazard map The Philippine
Geoportal By providing hazard maps on the Internet, contributed to the citizen in visually identifying risk areas. 21
15
Philippines: National Mapping and Resource Information Authority
(NAMRIA)
Typhoon
Digital topographic map
data, Ortho image
Recovery and Rehabilitation after
Typhoon Haiyan
Used by the government to determine the status of disaster-affected areas and to identify safe and risk zones. 22
16
Philippines: National Mapping and Resource Information Authority
(NAMRIA)
Typhoon Hazard map
Mapping of Track of Typhoon Lawin
(International Name: Haima) and Affected Areas and
Population
The track of the typhoon was visualized by obtaining information from meteorological and statistical organizations and creating and releasing a map layout which showed the track. Through this effort, residents in the area at high risk for the typhoon were able to prepare.
23
17
Philippines: National Mapping and Resource Information Authority
(NAMRIA)
Earthquake GNSS data
Philippine Active Geodetic Network
(PageNet) – Surigao Earthquake
GNSS enabled to acquire data of crustal displacement before and after the earthquake. Collaboration of observation system with other organization was achieved by continuous observation.
25
18 Sri Lanka: Survey
Department Tsunami
Digital topographic map
data
Expressing disaster-prone areas on the topographic map can make swift relief operations. 29
*Hydromet: flood, storm surge, rain-induced landslide, **Seismic: ground rupture, ground shaking, tsunami, earthquake-induced landslide, liquefaction
4
5. Best Practice cases
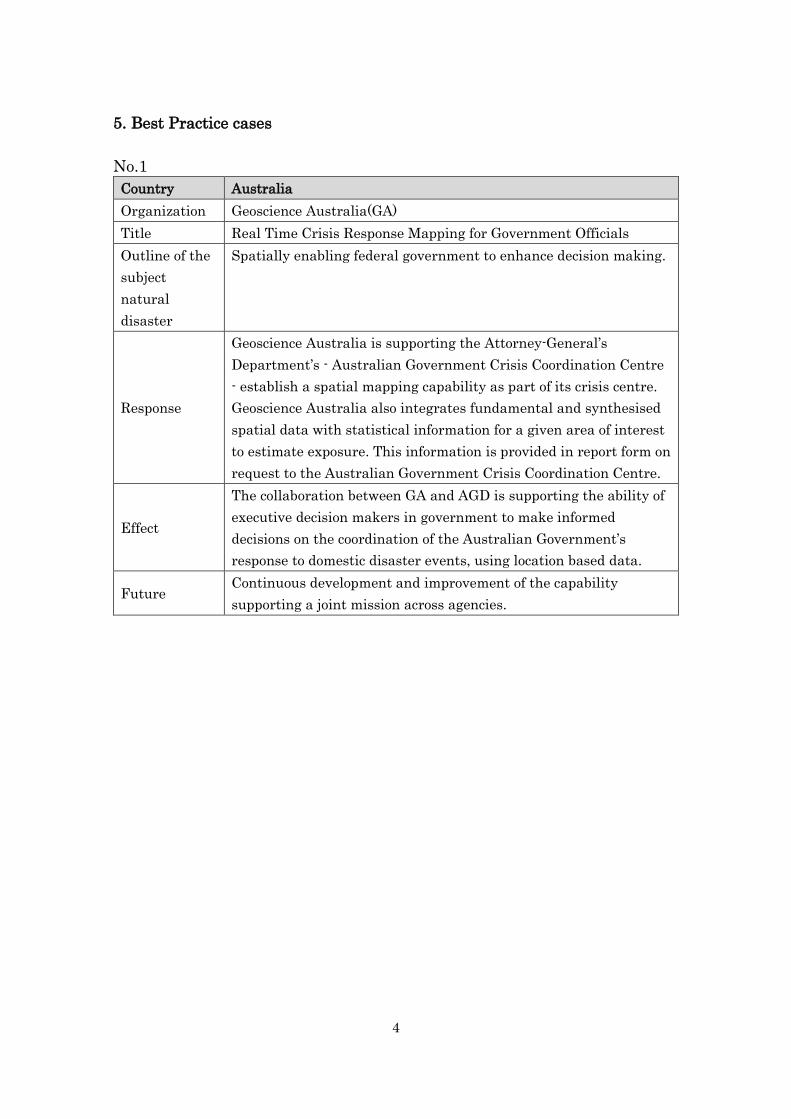
No.1
Country Australia
Organization Geoscience Australia(GA)
Title Real Time Crisis Response Mapping for Government Officials
Outline of the
subject
natural
disaster
Spatially enabling federal government to enhance decision making.
Response
Geoscience Australia is supporting the Attorney-General’s
Department’s - Australian Government Crisis Coordination Centre
- establish a spatial mapping capability as part of its crisis centre.
Geoscience Australia also integrates fundamental and synthesised
spatial data with statistical information for a given area of interest
to estimate exposure. This information is provided in report form on
request to the Australian Government Crisis Coordination Centre.
Effect
The collaboration between GA and AGD is supporting the ability of
executive decision makers in government to make informed
decisions on the coordination of the Australian Government’s
response to domestic disaster events, using location based data.
Future Continuous development and improvement of the capability
supporting a joint mission across agencies.
5
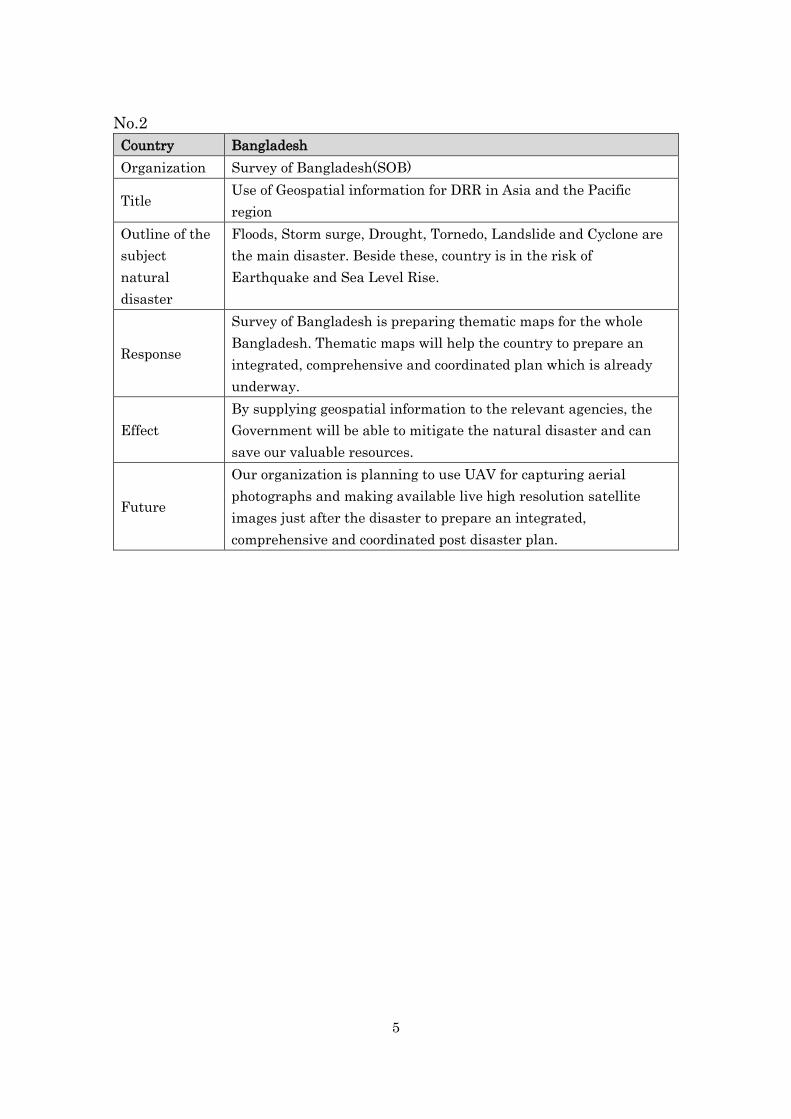
No.2
Country Bangladesh
Organization Survey of Bangladesh(SOB)
Title Use of Geospatial information for DRR in Asia and the Pacific
region
Outline of the
subject
natural
disaster
Floods, Storm surge, Drought, Tornedo, Landslide and Cyclone are
the main disaster. Beside these, country is in the risk of
Earthquake and Sea Level Rise.
Response
Survey of Bangladesh is preparing thematic maps for the whole
Bangladesh. Thematic maps will help the country to prepare an
integrated, comprehensive and coordinated plan which is already
underway.
Effect
By supplying geospatial information to the relevant agencies, the
Government will be able to mitigate the natural disaster and can
save our valuable resources.
Future
Our organization is planning to use UAV for capturing aerial
photographs and making available live high resolution satellite
images just after the disaster to prepare an integrated,
comprehensive and coordinated post disaster plan.
6
No.3
Country China
Organization Satellite Surveying and Mapping Application Center (SASMAC)
Title Earthquake
Outline of the
subject
natural
disaster
In China, earthquakes happen quite often, In almost all
earthquakes, SBSM provides the maps after earthquakes including
previous, in situ, and after maps
Response The response of emergency mechanism of government
Effect good
Future Accelerate the speed of response including all kinds of disasters
such as storm, flooding. etc
7
No.4
Country Fiji
Organization National Disaster Management Office
Title
Outline of the
subject
natural
disaster
Tropical Cyclone, Flooding
Response The information provided by geospatial information assists in the
coordination our response.
Effect It really assists in the effectiveness and efficiency of response
efforts.
Future Improve geospatial information
Mapping of people with disability
8
No.5
Country Hong Kong Special Administrative Region (HKSAR)
Organization Lands Department
Title Contingency Plan for Natural Disasters
Outline of the
subject
natural
disaster
A landslip is occurred affecting life and property.
Response
Lands Department (LandsD) is responsible for emergency and
urgent repair works to landslips occurring on registered man-made
slopes maintained by LandsD and to landslips that occur on man-
made slopes on unleased and unallocated Government land not
maintained by other departments and affecting life and property.
LandsD works in conjunction with the Civil Engineering and
Development Department (CEDD) in determining maintenance
responsibilities of registered man-made slopes. The maintenance
responsibilities of slopes having been determined are contained in
the Slope Maintenance Responsibility Information System (SMRIS)
and publicized on the LandsD’s website
(http://www.slope.landsd.gov.hk/smris/) and on CEDD’s Slope
Information System (SIS) accessible from http://hkss.cedd.gov.hk.
LandsD will assist as necessary in emergency situations. The
Survey and Mapping Office (SMO) of LandsD is responsible for
providing existing maps, plans and aerial photos of the scene in
conjunction with Government Flying Services (GFS) in an
emergency situation. The SMO will also conduct topographical
surveys after the disaster if necessary.
Effect
Location and maintenance responsibility of the landslip are
identified in the first instance. Geospatial information of the
disaster scene is captured for investigation and restoration
purposes.
Future
UAV will be deployed as a part of the emergency survey operation
in future disaster incidents.
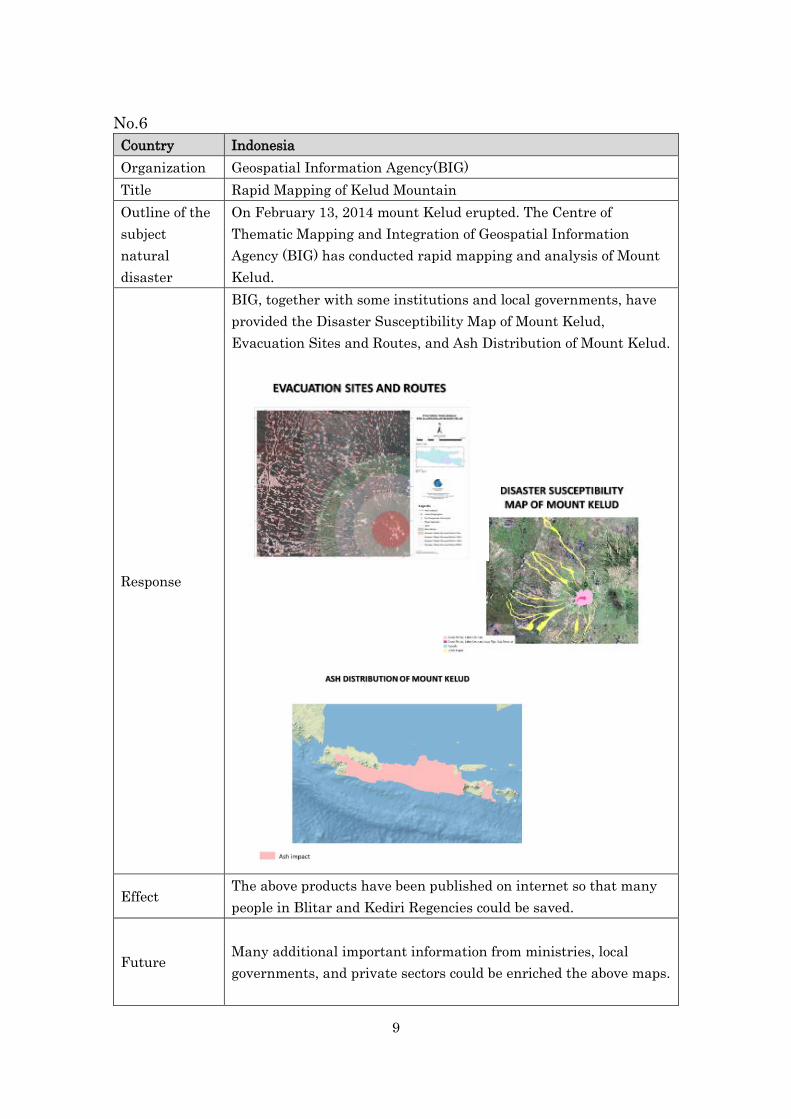
9
No.6
Country Indonesia
Organization Geospatial Information Agency(BIG)
Title Rapid Mapping of Kelud Mountain
Outline of the
subject
natural
disaster
On February 13, 2014 mount Kelud erupted. The Centre of
Thematic Mapping and Integration of Geospatial Information
Agency (BIG) has conducted rapid mapping and analysis of Mount
Kelud.
Response
BIG, together with some institutions and local governments, have
provided the Disaster Susceptibility Map of Mount Kelud,
Evacuation Sites and Routes, and Ash Distribution of Mount Kelud.
Effect The above products have been published on internet so that many
people in Blitar and Kediri Regencies could be saved.
Future
Many additional important information from ministries, local
governments, and private sectors could be enriched the above maps.
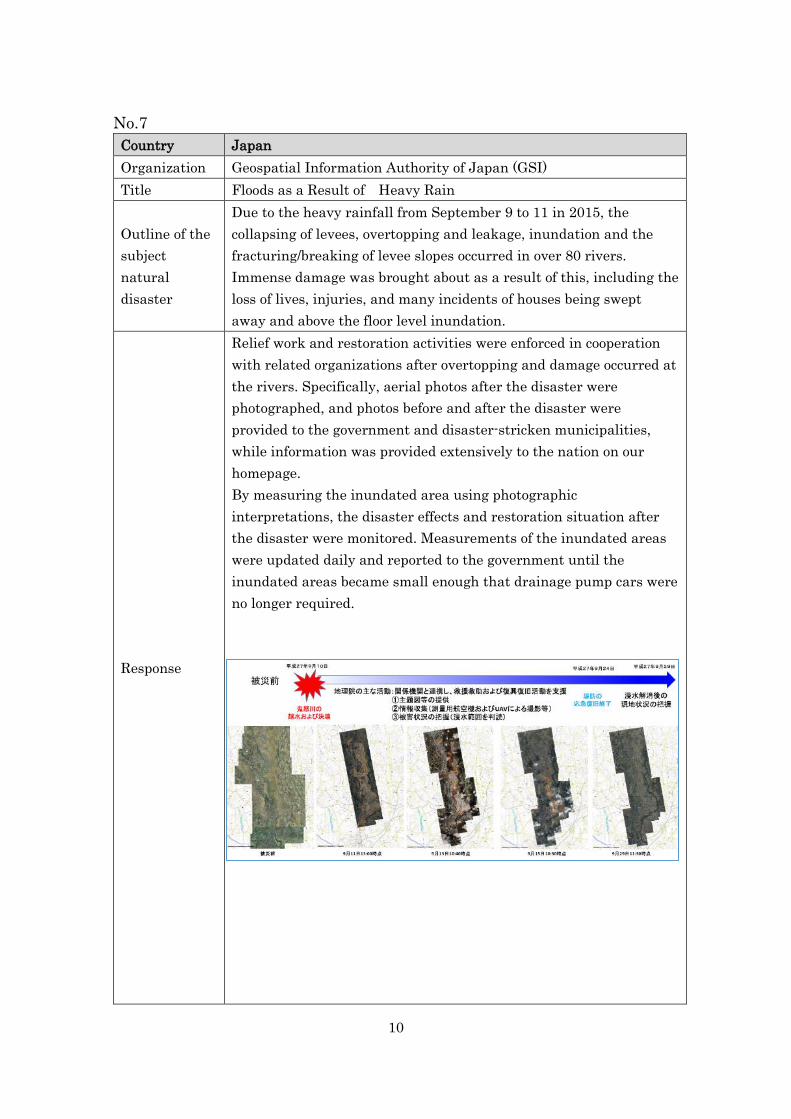
10
No.7
Country Japan
Organization Geospatial Information Authority of Japan (GSI)
Title Floods as a Result of Heavy Rain
Outline of the
subject
natural
disaster
Due to the heavy rainfall from September 9 to 11 in 2015, the
collapsing of levees, overtopping and leakage, inundation and the
fracturing/breaking of levee slopes occurred in over 80 rivers.
Immense damage was brought about as a result of this, including the
loss of lives, injuries, and many incidents of houses being swept
away and above the floor level inundation.
Response
Relief work and restoration activities were enforced in cooperation
with related organizations after overtopping and damage occurred at
the rivers. Specifically, aerial photos after the disaster were
photographed, and photos before and after the disaster were
provided to the government and disaster-stricken municipalities,
while information was provided extensively to the nation on our
homepage.
By measuring the inundated area using photographic
interpretations, the disaster effects and restoration situation after
the disaster were monitored. Measurements of the inundated areas
were updated daily and reported to the government until the
inundated areas became small enough that drainage pump cars were
no longer required.
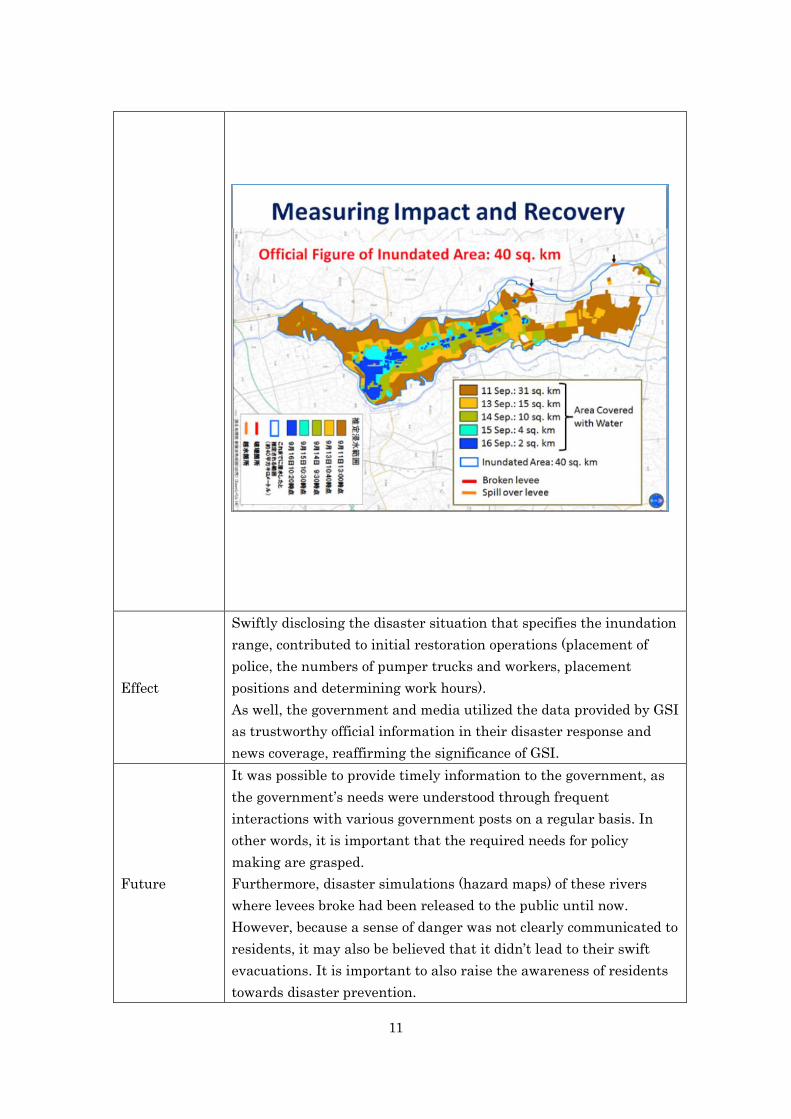
11
Effect
Swiftly disclosing the disaster situation that specifies the inundation
range, contributed to initial restoration operations (placement of
police, the numbers of pumper trucks and workers, placement
positions and determining work hours).
As well, the government and media utilized the data provided by GSI
as trustworthy official information in their disaster response and
news coverage, reaffirming the significance of GSI.
Future
It was possible to provide timely information to the government, as
the government’s needs were understood through frequent
interactions with various government posts on a regular basis. In
other words, it is important that the required needs for policy
making are grasped.
Furthermore, disaster simulations (hazard maps) of these rivers
where levees broke had been released to the public until now.
However, because a sense of danger was not clearly communicated to
residents, it may also be believed that it didn’t lead to their swift
evacuations. It is important to also raise the awareness of residents
towards disaster prevention.
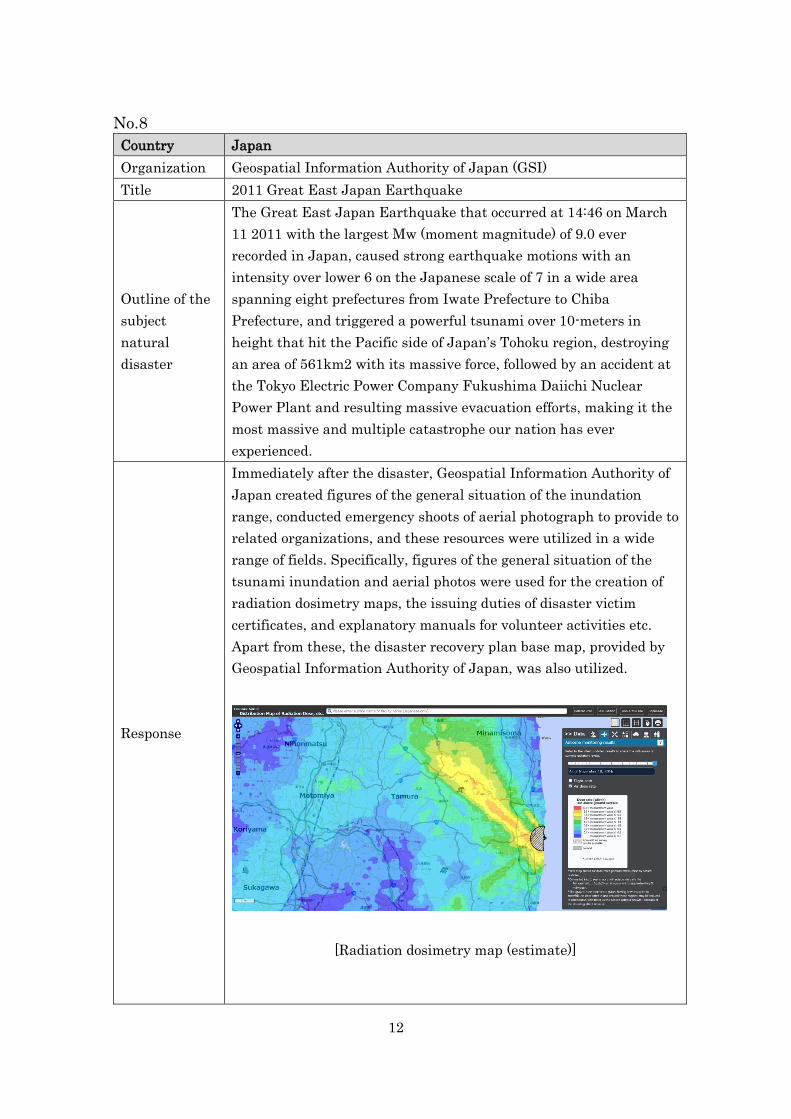
12
No.8
Country Japan
Organization Geospatial Information Authority of Japan (GSI)
Title 2011 Great East Japan Earthquake
Outline of the
subject
natural
disaster
The Great East Japan Earthquake that occurred at 14:46 on March
11 2011 with the largest Mw (moment magnitude) of 9.0 ever
recorded in Japan, caused strong earthquake motions with an
intensity over lower 6 on the Japanese scale of 7 in a wide area
spanning eight prefectures from Iwate Prefecture to Chiba
Prefecture, and triggered a powerful tsunami over 10-meters in
height that hit the Pacific side of Japan’s Tohoku region, destroying
an area of 561km2 with its massive force, followed by an accident at
the Tokyo Electric Power Company Fukushima Daiichi Nuclear
Power Plant and resulting massive evacuation efforts, making it the
most massive and multiple catastrophe our nation has ever
experienced.
Response
Immediately after the disaster, Geospatial Information Authority of
Japan created figures of the general situation of the inundation
range, conducted emergency shoots of aerial photograph to provide to
related organizations, and these resources were utilized in a wide
range of fields. Specifically, figures of the general situation of the
tsunami inundation and aerial photos were used for the creation of
radiation dosimetry maps, the issuing duties of disaster victim
certificates, and explanatory manuals for volunteer activities etc.
Apart from these, the disaster recovery plan base map, provided by
Geospatial Information Authority of Japan, was also utilized.
[Radiation dosimetry map (estimate)]

13
[Figure of the general situation of the inundation range]
Effect
Various resources to serve restoration/recovery were created and
provided using the map provided by Geospatial Information
Authority of Japan as its base. For example, in areas where massive
emigration was conducted, the time and cost spent on the move was
significantly reduced using the results of the cadastral survey
results.
Future
Though most of the three months after the disaster was spent for
grasping the damage situation, because the information gets
complicated, the swift disclosure of “trustworthy maps” issued by the
nation is indispensable for grasping damage situations towards their
recovery. In the future, Geospatial Information Authority of Japan
will continue to seriously maintain and provide geospatial
information for restoration/recovery, and promote the utilization of
information, while understanding the needs of each field.
14
No.9
Country Japan
Organization Geospatial Information Authority of Japan(GIS)
Title Evacuation Center Map for 2016 Kumamoto Earthquake Response
Outline of the
subject natural
disaster
A Mw 6.2 earthquake occurred in Kumamoto district in southern Japan on April 14, 2016 at 21:26 (pre-
shock). Subsequently, a Mw 7.0 earthquake occurred on April 16 (main shock) at 1:25. These earthquakes are
referred to as “The 2016 Kumamoto Earthquake.” The earthquake left 98 people dead, 830 severely injured
and 1,491 slightly injured, as well as 8,198 buildings totally collapsed, 29,761 half-collapsed and 138,102
partially damaged. The earthquake hit Kumamoto city with the population of 730 thousand and its suburban
municipalities, causing 180 thousand people to be evacuated at peak period.
Response
・Affected people who took precautions against possible aftershocks and people whose houses were totally
collapsed took shelter in evacuation centers. As a result, the number of evacuees far exceeded the capacity of
evacuation centers. Additionally, some evacuation centers themselves were too damaged to use. Because of
these, many people had to stay and sleep outside or in their own car.
・On April 17, the following day of the main shock, evacuees' living conditions became worse and their fatigue
peaked due to rain and disruption of relief goods supply. However, the on-site disaster response headquarters,
set up by the national government, did not have enough information about the location of the evacuation centers
and the number of evacuees, which made the relief goods supply extremely difficult.
・Thus, the next day, on April 18, head of the on-site disaster response headquarters directed Geospatial
Information Authority of Japan (GSI) to create a distribution map which showed the locations of the evacuation
centers. In response, GSI mobilized disaster response staff, organized and compiled on-site information and
existing materials, and created Evacuation Center Map (Figure 1).
On April 20, GSI completed and provided the first map for the on-site disaster response headquarters.
Effects
Evacuation Center Map significantly contributed to the on-site disaster response headquarters for accessing
evacuation centers and for assisting in relief supply. Since evacuation centers were re-organized and closed
according to the change of number of evacuees, GSI had updated the map once a week for four months since
the earthquake, until August 2016. The map played an important role in the operation and environmental
management of the evacuation centers.
Future
The Basic Act on Disaster Control Measures of Japan (revised in 2013) stipulates that mayors of
municipalities designate the emergency evacuation areas*1 and evacuation centers *2. Public facilities such as
schools are often designated as such evacuation facilities. Since designation of the facilities is subject to
change as appropriate, their location information needs to be updated on a regular basis. GSI prepared the
location information of emergency evacuation areas by establishing a framework of cooperation with Cabinet
Office and Fire and Disaster Management Agency, as well as collaborating with prefectures, municipalities
and the like. The location information of emergency evacuation areas became publicly available on GSI web
map in February 2017, and GSI will continue to update the information (Figure 2).
*1 Emergency evacuation area: A place to evacuate residents and other people at immediate risk caused by tsunami,
flood or other disasters, in order to secure safety of their lives
*2 Evacuation center: Facilities to accommodate residents and other people who have escaped from disaster up until
there is no further disaster risk, or to temporally accommodate those who cannot return home due to disaster.
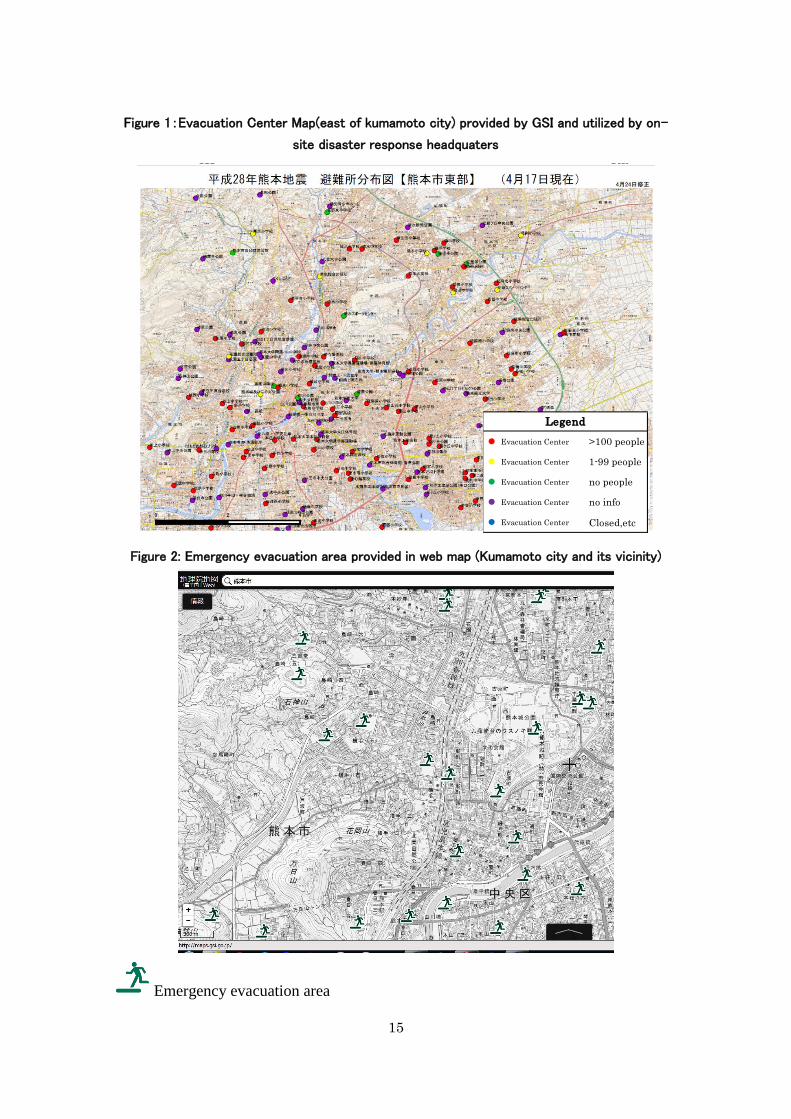
15
Figure 1:Evacuation Center Map(east of kumamoto city) provided by GSI and utilized by on-
site disaster response headquaters
Figure 2: Emergency evacuation area provided in web map (Kumamoto city and its vicinity)
Emergency evacuation area
PPP PSU
PTG
● Evacuation Center >100 people
● Evacuation Center 1-99 people
● Evacuation Center no people
● Evacuation Center no info
● Evacuation Center Closed,etc
Legend
16
No.10
Country Japan
Organization Geospatial Information Authority of Japan(GIS)
Title Creation of Disaster Geoinformation Catalog
Outline of
the response
to natural
disaster
Geospatial Information Authority of Japan (GSI) compiles and provides
a catalog of disaster geoinformation, including type of geospatial
information as well as timing of provision and data format, featured as
"Disaster Geoinformation Catalog." This catalog aims at facilitating
national and Local governments effectively utilizing disaster
geoinformation provided by GSI.
Response
Japan experienced various natural disasters such as earthquakes,
volcanic eruptions and floods. During these disasters, the national and
local governments referred to the Catalog and requested GSI to
provide geospatial information according to their particular needs for
disaster response.
Effects
The national and local governments referred to the Catalog and
understood what type of geospatial information GSI developed and
owned. This preparation helped GSI meet their requests rapidly.
Future
Since the geospatial information developed and owned by GSI are
expected to become more varied and wide-ranging, GSI intends to
update the Catalog regularly and provide it for the related
organizations.

17
Disaster Geoinformation Catalog (excerpt)
Cover Page No.5 Volcanic land condition map
No.12 Crustal displacement map No.16 Unmanned aerial vehicle
PPP PSU
PTG
(Disaster Geoinformation Catalog)
(As of 1.March 2016)
(Available Disaster Geoinformation to be
provided by GSI at disaster occasions)
18
No.11
Country Malaysia
Organization Department of Survey and Mapping Malaysia (DSMM)
Title The Use of Unmanned Aerial Vehicle (UAV) to Monitor the Flood
and Its Impact in Malaysia
Outline of the
subject
natural
disaster
Floods are the major natural disaster threat facing Malaysia. The
2014-year end downpour and floods has been the worst ever in the
country’s history, affecting more than half a million people. Damage
to infrastructure alone was estimated RM2.851 billion. Areas that
have never experienced floods before were also inundated and
floodwater rose at an unprecedented level.
Response
The video and aerial photo captured using UAV have been used to
provide information about the areas that were susceptible to the
floods and locations where people can be evacuated to. The data
have been used for making post flood damage assessments and
identifying the facilities need to be repaired urgently such as roads,
bridges, water treatment plant, etc.
Effect
The process to search and rescue flood victims were expedited by
using the UAV data. Besides that the refurbishment and
reconstruction of damaged facilities were expedited to ease the
transportation links in moving people and goods to the affected
area. The use of UAV also has saved the operational cost due to its
flexibility and cheap flying operation with less constraint on time
and human resources.
Future
To provide UAV data during and after disaster for relief and
recovery purposes particularly on the remote area.
Efficient dissemination of information
19
No.12
Country Malaysia
Organization Department of Survey and Mapping Malaysia (DSMM)
Title Earthquake Struck Ranau in Sabah, Malaysia
Outline of the
subject
natural
disaster
A magnitude 5.9 earthquake struck near Mount Kinabalu killing 18
and stranding more than a hundred people on the peak. The quake
damaged roads and buildings, including schools and a hospital on
Sabah’s west coast. Geospatial information also plays a big role to
monitor the crustal and surface motion by using Continuously
Operating Reference Station (CORS) data.
Response
The earthquake that occurred in Ranau on 5th June 2015 which is
near to Mount Kinabalu had caused massive landslides around the
mountain and nearby area as well. The data before and after
earthquake from CORS stations (MyRTKnet) and 11 GNSS
monuments were analysed and has indicated the surface motion on
the area is between 36 to 53 cm. The output reflected the benefit to
monitor the progress of motion so that the early warning for
earthquake can be disseminated to alert the surrounding people.
Effect
The data from CORS stations (MyRTKnet) and 11 GNSS
monuments has contributed significant information for an early
warning system for earthquake in order to expedite the necessary
evacuation of people from the hazard area. Also important in the
following cases:
Overall picture and extent of damage caused
Indication of ground displacement
Planning and distribution of aids
Future To densify the CORS stations (MyRTKnet) throughout the country

20
No.13
Country Republic of the Philippines
Organization National Mapping and Resource Information Authority (NAMRIA)
Title Multi-Hazard Mapping of 28 Priority Provinces and the Greater
Metro Manila Area
Outline of the
subject natural
disaster
The Philippines is consistently visited by tropical disturbances
exposing communities to hydrometeorological hazards such as
strong winds, storm surge floods/flashfloods, and rain-induced
landslides. The country, being located in the Pacific ring of fire, is
likewise exposed to seismological hazards such as ground shaking,
ground rupture, earthquake-induced landslide, and liquefaction.
Aiming to have a safer and disaster resilient communities, multi-
hazard mapping of the 28 high risk provinces was implemented to
map out areas exposed to natural hazards. The output of this
activity will facilitate evidence-based decision-making by local and
national authorities.
Response The Agency provided base maps, capacitated LGUs on the use of
GIS technology, engaged technical staff in the integration of
hazard maps for use by the local government units and national
government agencies, and participated in the conduct of
information and education campaign (IEC) in the communities
primarily exposed to hazards.
Effect 1. Raised awareness on the impending hazards confronting the
exposed communities in the provinces.
2. Hazard maps are increasingly used in the formulation of land
use and physical development plans.
3. Hazard maps used in the formulation of local DRRM plans.
4. Increasing number of LGUs expressing interest in the use of
GIS for DRRM
Future
21
No.14
Country Republic of the Philippines
Organization National Mapping and Resource Information Authority (NAMRIA)
Title The Philippine Geoportal
Outline of the
subject natural
disaster
The Philippine Geoportal is envisioned to provide a comprehensive
and consistent geospatial information of the country. It aims to
support the geospatial information needs of users in various
disciplines by providing access to such information.
In the aftermath of Tropical Storm Ketsana (Ondoy) which left
Metro Manila and 30% of the provinces in the Philippines under
state of calamity, geohazard maps were prepared for the 28 high
risk areas in the country. These maps were made accessible to
the public through the Philippine Geoportal.
Response Developed in the Philippine Geoportal is a DRRM application
which provides a visual appreciation of the hydrometeorological
and seismological hazards in the high risk areas of the country.
Effect 1. Increased awareness of the public on the hazards faced by the
community.
2. Hazard maps are increasingly used in the formulation of land
use and physical development plans.
3. Hazard maps used in the formulation of local DRRM plans.
Future

22
No.15
Country Republic of the Philippines
Organization National Mapping and Resource Information Authority (NAMRIA)
Title Recovery and Rehabilitation after Typhoon Haiyan
Outline of the
subject natural
disaster
The harrowing impact of typhoon Haiyan left about 4 million
people homeless. This prompted the Philippine government to
ensure the safety of the affected communities, moving them away
from the seashore to more suitable relocation sites. In focusing
on the recovery and rehabilitation phase, the immediate objective
is to identify areas suitable for relocation of those left homeless by
the typhoon.
Response NAMRIA provided technical assistance with the provision of IfSAR
data which includes digital terrain models (DTM), digital surface
models (DSM), and orthorectified images used in the identification
of suitable relocation sites for the affected communities.
Effect The government was able to advance and fast track the
identification of safe and unsafe zones in the Haiyan-affected
areas.
Future

23
No.16
Country Philippines
Organization National Mapping and Resource Information Authority (NAMRIA)
Title Mapping of Track of Typhoon Lawin (International Name: Haima) and
Affected Areas and Population
Outline of the
subject natural
disaster
In 19 October 2016, Typhoon Lawin (Haima) classified as extremely
dangerous by the state’s weather agency affected the provinces in the northern
part of the country. As it intensified into a super typhoon, destructive floods
and massive landslides were expected to be brought by moderate to heavy
rains within its 800-km diameter.
Response
NAMRIA prepared a map layout showing the track of Typhoon Lawin
(Haima), the likely affected provinces and population. NAMRIA integrated
data from various sources such as Philippine Atmospheric Geophysical and
Astronomical Services Administration (PAGASA) and the Philippine
Statistics Authority (PSA). The map was made public via NAMRIA’s
website for download by other DRR agencies, local government units, and
other interested parties.
Effects
The public is able to visualize the track of the typhoon and is made aware of
the areas and population likely to be affected by it. This increased awareness
of the residents in the likely affected areas to prepare for the impending
typhoon.
Future
Strengthen coordination with DRR and other agencies providing statistical
data relevant to disaster preparedness.

24
Map showing the track of Typhoon Lawin and likely affected areas. The map was made
available for public download at NAMRIA’s website.
25
No.17
Country Philippines
Organization National Mapping and Resource Information Authority (NAMRIA)
Title Philippine Active Geodetic Network (PageNet) – Surigao Earthquake
Outline of the
subject natural
disaster
The Province of Surigao del Norte in northeastern Mindanao was struck by a
magnitude (MS) 6.7 earthquake on 10 February 2017. The earthquake was
generated by the movement of the Philippine Fault-Surigao segment. The
groundshaking was felt at PHIVOLCS Earthquake Intensity Scale (PEIS) VII
in Surigao City and San Francisco.
Liquefaction and earthquake-induced landslide were documented as well as
collapsed bridge, damages to buildings, ports, roads, and bridges. As of 15
February 2017, there were 202 reported injuries and 8 reported casualties.
Response
NAMRIA measured the displacement of PageNet stations as a result of the
M6.7 Surigao Earthquake on 10 February 2017. The recent earthquake
caused a 2D shift in the coordinates1 by as much as 12.9 cm in the north-west
direction. This displacement (10.1 cm to North, 8.0 cm to West, and 2.8 cm
Down) was measured from 9 to 11 February 2017 from the active geodetic
station (AGS) PSUR of PageNET, which is located in Surigao City, 14km
from the earthquake’s epicenter. The next nearest AGS PTGO in Tagoloan,
Misamis Oriental, which is 158 km from the epicenter, showed no significant
shift in its position.
The data from PSUR was processed using Bernese GNSS Software from 01 to
20 February 2017 (10 days before and after the event) using the best available
products (e.g. orbits, clocks) from the International GNSS Service (IGS).
The displacements measured are not fixed to a stable tectonic plate and are
just based solely on the change in position in the ITRF. The reference
coordinates of the stations are based on the May 2015 monthly solution from
Bernese.
Continuous monitoring of the stations is ongoing for post-earthquake events.
Coordinates in the International Terrestrial Reference Frame
(ITRF) 2008
Effects
Results of the measurements and continuous monitoring of the stations will be
made available to the Philippine Institute of Volcanology and Seismology
(PHIVOLCS) in support of the Agency’s (PHIVOLCS) assessment and
analysis related to the recent seismic activity.
Future
Strengthen partnership with PHIVOLCS and other DRR agencies such as
Philippine Atmospheric Geophysical and Astronomical Services
Administration (PAGASA) to promote the use of AGS data for seismological,
meteorological, and other potential applications.
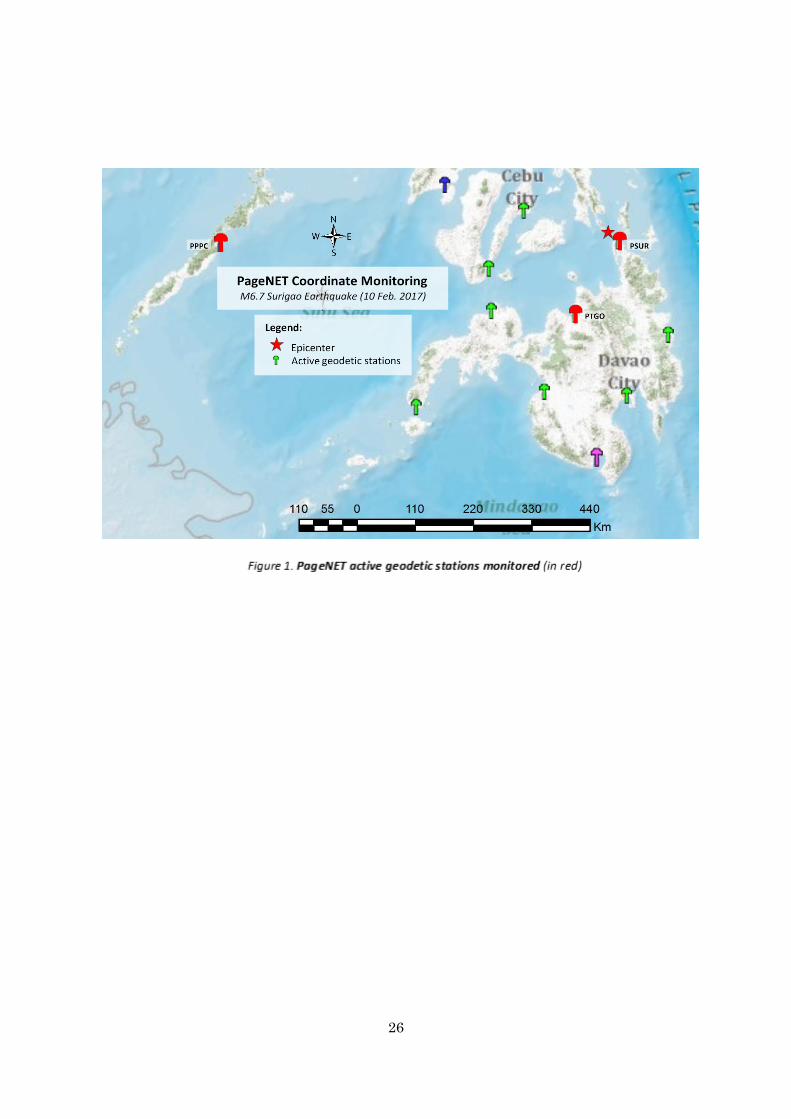
26
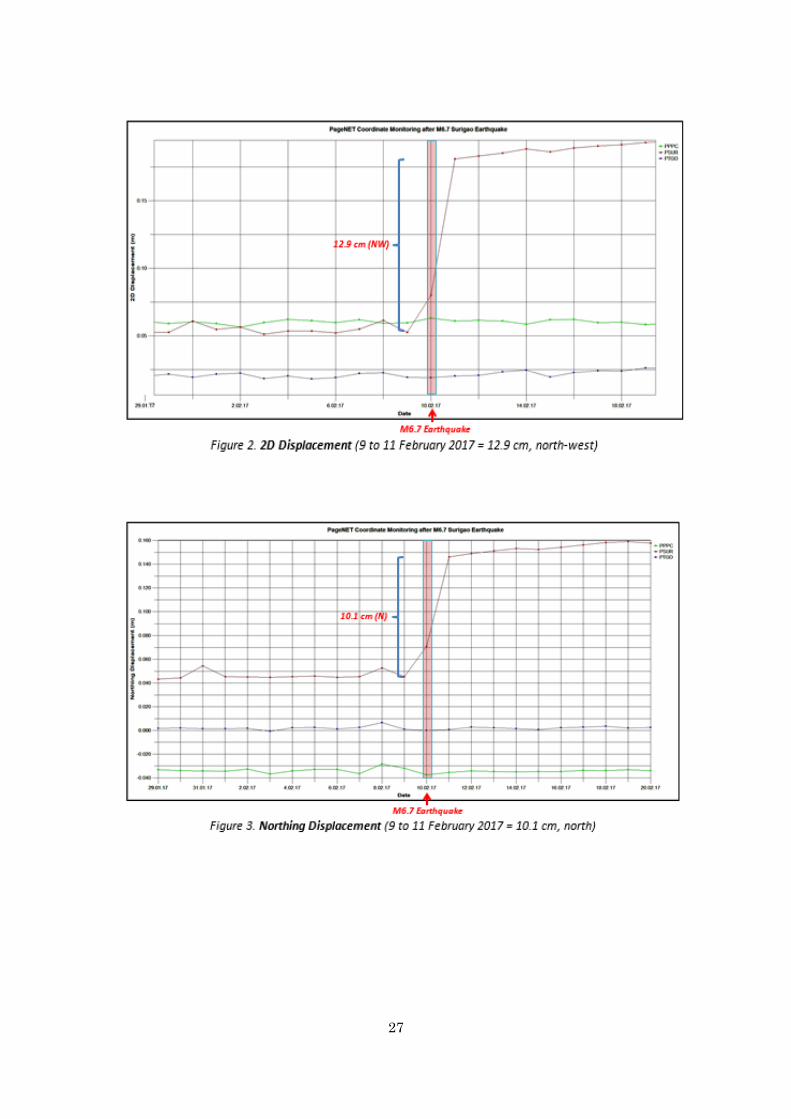
27
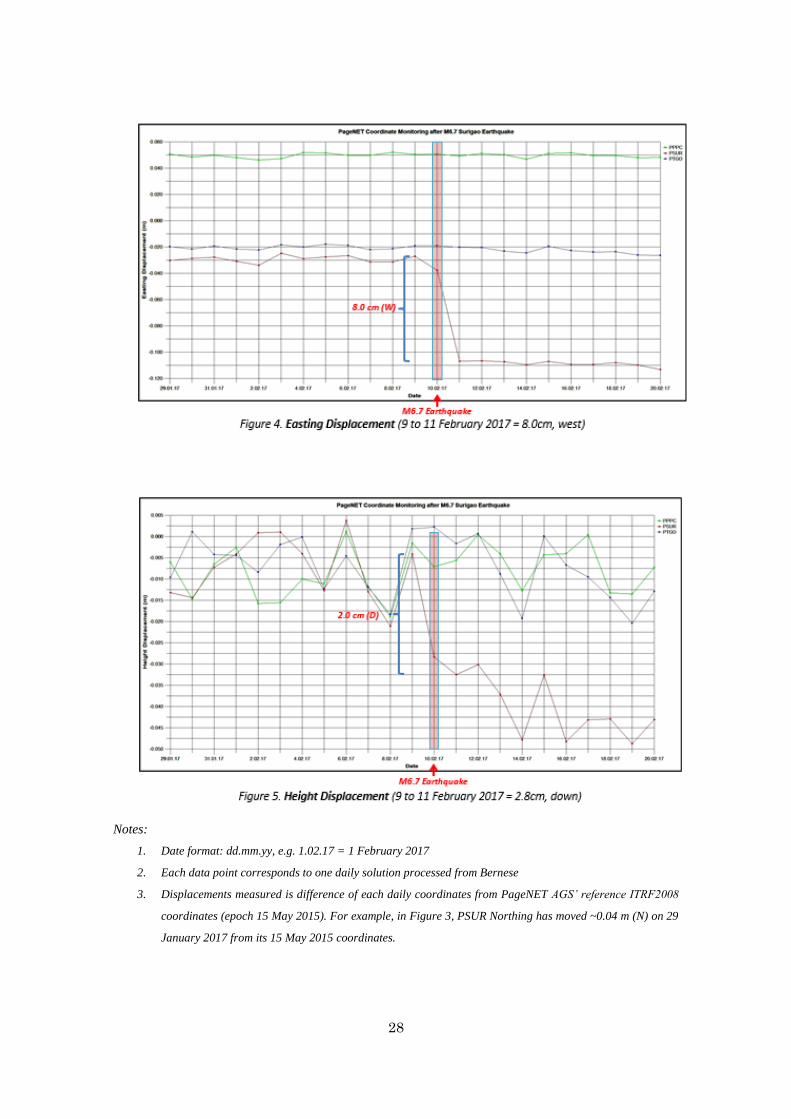
28
Notes:
1. Date format: dd.mm.yy, e.g. 1.02.17 = 1 February 2017
2. Each data point corresponds to one daily solution processed from Bernese
3. Displacements measured is difference of each daily coordinates from PageNET AGS’ reference ITRF2008
coordinates (epoch 15 May 2015). For example, in Figure 3, PSUR Northing has moved ~0.04 m (N) on 29
January 2017 from its 15 May 2015 coordinates.
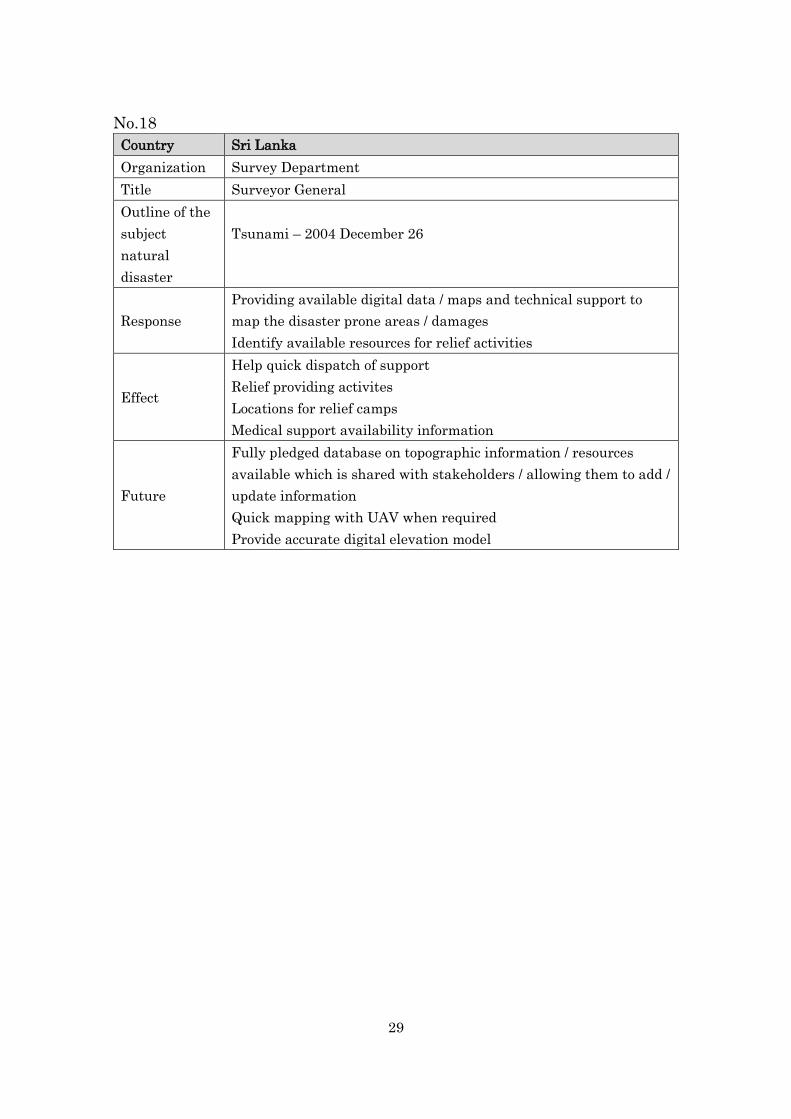
29
No.18
Country Sri Lanka
Organization Survey Department
Title Surveyor General
Outline of the
subject
natural
disaster
Tsunami – 2004 December 26
Response
Providing available digital data / maps and technical support to
map the disaster prone areas / damages
Identify available resources for relief activities
Effect
Help quick dispatch of support
Relief providing activites
Locations for relief camps
Medical support availability information
Future
Fully pledged database on topographic information / resources
available which is shared with stakeholders / allowing them to add /
update information
Quick mapping with UAV when required
Provide accurate digital elevation model

Guidelines for Disaster Risk Management Using
Geospatial Information and Services
(Draft)
Eruption of Pinatubo Volcano (left) and Pinatubo Crater at normal time (upper and lower right)
Photos by PHIVOLCS-DOST, the Philippines
Working Group on Disaster Risk Management (WG2)
UN-GGIM-AP
(as of July 2018)
i
Preface
This document was prepared by Working Group on Disaster Risk Management (WG2) of the
Regional Committee of United Nations Global Geospatial Information Management for Asia and
the Pacific (UN-GGIM-AP) to assist National Geospatial Information Authorities (NGIAs) in the
Asia-Pacific region as their Guidelines in contributing to disaster risk reduction through taking
practical actions against natural disasters by fully employing geospatial information technology.
I am very grateful to all members of WG2 for their extensive contribution in preparing this
document, and sincerely hope, on their behalf, that these Guidelines will contribute to disaster
risk reduction in the region through active engagement of NGIAs with relevant applications of
geospatial information technology.
Day & Month, 2018
Toru Nagayama
Chair, UN-GGIM-AP WG2
ii
Table of Contents
Chapter 1: Introduction .................................................................................................................. 1
1-1) International Context ................................................................................................................ 1
1-2) About the Guidelines ................................................................................................................. 2
Chapter 2: Roles of Geospatial Information Technology and NGIAs in DRM ........... 5
2-1) Roles of Geospatial Information Technology and NGIAs .................................................... 5
2-2) Disaster cycle phases ................................................................................................................ 8
Chapter 3: NGIAs’ measures before disasters ..................................................................... 11
3-1) Development, update and dissemination of geospatial databases ...................................... 12
3-1-1) Development of geospatial databases ......................................................................... 12
3-1-2) Update of geospatial databases ................................................................................... 13
3-1-3) Web maps for sharing the latest geospatial information.......................................... 14
3-2) Policy development and organizational arrangements ......................................................... 15
3-2-1) Policy development within national framework ....................................................... 15
3-2-2) Policy and Organizational arrangements within NGIAs ......................................... 15
3-3) Building cooperative relationships and partnerships ........................................................... 17
3-3-1) Building cooperative relationships with disaster management entities ................ 17
3-3-2) Building partnerships with stakeholders ................................................................... 18
3-4) Drilling within NGIAs ........................................................................................................... 19
3-5) Raising awareness .................................................................................................................. 20
3-5-1) Introduction of geospatial products to decision makers of stakeholders ................ 20
3-5-2) Participating in drills of relevant stakeholders ......................................................... 20
3-5-3) Public relations and educational activities ................................................................ 21
Chapter 4: NGIAs’ measures during disasters .................................................................... 22
4-1) Launching of disaster response activities............................................................................... 22
4-1-1) Determination of engagement level ............................................................................ 23
4-1-2) Setting up the first headquarters meeting ............................................................... 23
4-1-3) Safety check of staff members ............................................................................... 24
4-2) Headquarters meeting for DRM ........................................................................................... 25
4-2-1) Agenda of the first headquarters meeting for DRM ................................................. 25
4-2-2) Subsequent headquarters meetings during disasters ............................................... 26
iii
4-3) Liaising with different stakeholders and conducting outreach activities ........................... 26
4-3-1) Liaising with different stakeholders ............................................................................. 26
4-3-2) Conducting outreach activities ..................................................................................... 27
4-4) Acquisition of the latest geospatial information on disaster situations ............................... 28
4-4-1) Imaging of the ground with optical sensors ................................................................. 28
a) Satellites .............................................................................................................................. 29
b) Aircrafts .............................................................................................................................. 29
c) Helicopters .......................................................................................................................... 30
d) Unmanned aerial vehicles (UAVs) .................................................................................... 30
e) Hand-held devices ............................................................................................................ 31
4-4-2) Imaging of the ground with radar sensors ................................................................... 32
4-4-3) Measuring topographic changes with airborne laser ranging systems ..................... 33
4-4-4) Interpretation and analysis of aerial photographs ...................................................... 33
4-4-5) Preparation of thematic maps describing disaster situation ...................................... 34
4-4-6) Analysis of Continuously Operating Reference Station (CORS) data ...................... 35
4-5) Dissemination of geospatial information .............................................................................. 36
Chapter 5: NGIAs’ measures after disasters ........................................................................ 37
5-1) Geospatial information for restoration and reconstruction ............................................... 38
5-1-1) Revision of the coordinates of geodetic control points after large earthquakes ... 38
5-1-2) Preparation of ortho-rectified image maps of affected areas ................................. 38
5-1-3) Preparation of basic maps of affected areas ............................................................ 38
5-2) Review of activities for future improvement ....................................................................... 39
References .......................................................................................................................................... 41
Annex 1: List of UN-GGIM-AP WG2 Members (2015-2018)
Annex 2: Collection of Best Practices on the use of geospatial information for
disaster risk reduction (compiled by UN-GGIM-AP WG2, October 2017)
Annex 3: How did the Geospatial Information Authority of Japan Respond to the
2016 Kumamoto Earthquake? –A Case Story-

iv
List of Columns
Column 1 Providing man-made slope distribution through webmap services (Hong Kong) ... 13
Column 2 Multi-hazard mapping of 28 priority provinces and the greater metro Manila area
(Philippines) ............................................................................................................... 18
Column 3 International Charter on Space and Major Disasters ............................................ 19
Column 4 Real Time Crisis Response Mapping for Government Officials (Australia) .......... 27
Column 5 The Use of Unmanned Aerial Vehicle (UAV) to Monitor the Flood and Its Impact
(Malaysia) .................................................................................................................... 31
Column 6 Rapid Mapping of Kelud Volcanic Mountain (Indonesia) ....................................... 34
Column 7 Mapping of Track of Typhoon Lawin (Haima) (Philippines) .................................. 35
Column 8 Case example of the Great East Japan Earthquake for “Build Back Better” (Japan)
..................................................................................................................................... 39
List of Figures
Figure 1 Relationships between the Guidelines and the relevant frameworks and activities
......................................................................................................................................................... 3
Figure 2 Diagram for geospatial communication between NGIA and stakeholders .......... 7
Figure 3 Disaster cycle .............................................................................................................. 8
Figure 4 NGIAs’ measures to be taken before disasters ..................................................... 11
Figure 5 NGIAs’ measures to be taken during disasters ..................................................... 22
Figure 6 An image of the headquarters meeting .................................................................. 24
Figure 7 Teleconference ......................................................................................................... 24
Figure 8 Safety check service for NGIA staff and their family members .......................... 24
Figure 9 Outreach activities of NGIAs to different stakeholders ....................................... 28
Figure 10 Images acquired by aircraft .................................................................................. 30
Figure 11 Surveying aircraft .................................................................................................. 30
Figure 12 Example of interferometric SAR analysis of crustal movement caused by an
earthquake ............................................................................................................... 33
Figure 13 An example of airphoto interpretation ................................................................ 34
Figure 14 Photo of CORS ....................................................................................................... 35
Figure 15 Example of crustal movement analysis ................................................................ 35
Figure 16 NGIAs’ measures to be taken after disasters ...................................................... 37
Figure 17 Large-scale ortho-rectified image map ................................................................ 39
Figure 18 Large-scale basic map ........................................................................................... 39
Figure 19 A model of NGIA disaster management cycle .................................................... 40
List of Tables
Table 1 Impacts of natural disasters by region 2016 .................................................................. 1
Table 2 DRM measures before, during and after disasters ..................................................... 8
v
Acronyms and Abbreviations
CORS Continuously Operating Reference Station
DRM Disaster Risk Management
ESCAP Economic and Social Commission for Asia and the Pacific
GIS Geographic Information Systems
GNSS Global Navigation Satellite System
ICT Information and Communication Technology
NGIAs National Geospatial Information Authorities
SAR Synthetic Aperture Radar
SDGs Sustainable Development Goals
SFDRR Sendai Framework for Disaster Risk Reduction 2015-2030
SFGISD Strategic Framework on Geospatial Information and Services for Disasters
SNS Social Network Service
UAVs Unmanned Aerial Vehicles
UN-GGIM United Nations Committee of Experts on Global Geospatial Information
Management
UN-GGIM-AP Regional Committee of United Nations Global Geospatial Information Management
for Asia and the Pacific
UNISDR United Nations Secretariat for International Strategy for Disaster Reduction
WG2 UN-GGIM-AP Working Group on Disaster Risk Management
WG-Disasters Working Group on Geospatial Information and Services for Disasters
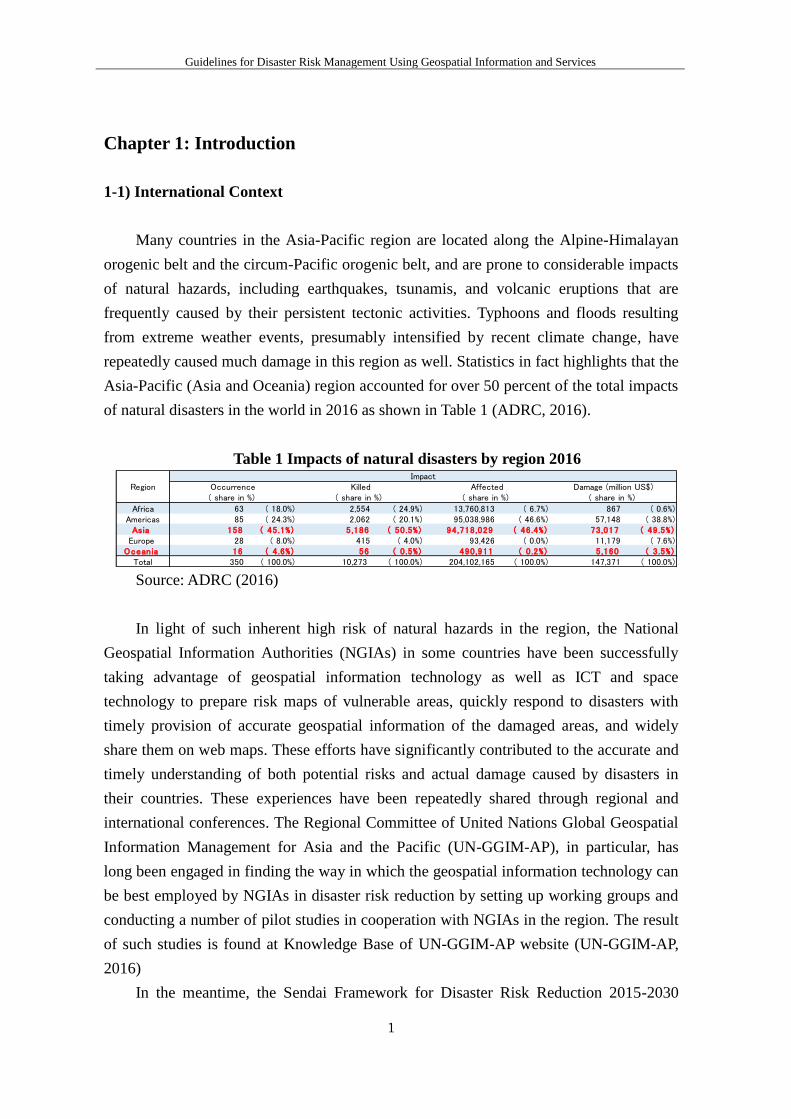
Guidelines for Disaster Risk Management Using Geospatial Information and Services
1
Chapter 1: Introduction
1-1) International Context
Many countries in the Asia-Pacific region are located along the Alpine-Himalayan
orogenic belt and the circum-Pacific orogenic belt, and are prone to considerable impacts
of natural hazards, including earthquakes, tsunamis, and volcanic eruptions that are
frequently caused by their persistent tectonic activities. Typhoons and floods resulting
from extreme weather events, presumably intensified by recent climate change, have
repeatedly caused much damage in this region as well. Statistics in fact highlights that the
Asia-Pacific (Asia and Oceania) region accounted for over 50 percent of the total impacts
of natural disasters in the world in 2016 as shown in Table 1 (ADRC, 2016).
Table 1 Impacts of natural disasters by region 2016
Source: ADRC (2016)
In light of such inherent high risk of natural hazards in the region, the National
Geospatial Information Authorities (NGIAs) in some countries have been successfully
taking advantage of geospatial information technology as well as ICT and space
technology to prepare risk maps of vulnerable areas, quickly respond to disasters with
timely provision of accurate geospatial information of the damaged areas, and widely
share them on web maps. These efforts have significantly contributed to the accurate and
timely understanding of both potential risks and actual damage caused by disasters in
their countries. These experiences have been repeatedly shared through regional and
international conferences. The Regional Committee of United Nations Global Geospatial
Information Management for Asia and the Pacific (UN-GGIM-AP), in particular, has
long been engaged in finding the way in which the geospatial information technology can
be best employed by NGIAs in disaster risk reduction by setting up working groups and
conducting a number of pilot studies in cooperation with NGIAs in the region. The result
of such studies is found at Knowledge Base of UN-GGIM-AP website (UN-GGIM-AP,
2016)
In the meantime, the Sendai Framework for Disaster Risk Reduction 2015-2030
Africa 63 ( 18.0%) 2,554 ( 24.9%) 13,760,813 ( 6.7%) 867 ( 0.6%)Americas 85 ( 24.3%) 2,062 ( 20.1%) 95,038,986 ( 46.6%) 57,148 ( 38.8%)
Asia 158 ( 45.1%) 5,186 ( 50.5%) 94,718,029 ( 46.4%) 73,017 ( 49.5%)Europe 28 ( 8.0%) 415 ( 4.0%) 93,426 ( 0.0%) 11,179 ( 7.6%)
Oceania 16 ( 4 .6%) 56 ( 0 .5%) 490,911 ( 0 .2%) 5,160 ( 3 .5%)Total 350 ( 100.0%) 10,273 ( 100.0%) 204,102,165 ( 100.0%) 147,371 ( 100.0%)
RegionImpact
Occurrence Killed Affected Damage (million US$)( share in %) ( share in %) ( share in %) ( share in %)
Guidelines for Disaster Risk Management Using Geospatial Information and Services
2
(SFDRR) was adopted at the Third United Nations World Conference on Disaster Risk
Reduction in 2015 (UNISDR, 2015). SFDRR recognizes that “Disasters, many of which
are exacerbated by climate change and which are increasing in frequency and intensity,
significantly impede progress towards sustainable development.” (paragraph 4), and aims
to achieve the outcome of “The substantial reduction of disaster risk and losses in lives,
livelihoods and health and in the economic, physical, social, cultural and environmental
assets of persons, businesses, communities and countries” (paragraph 16) by 2030. In
order to attain this outcome, SFDRR lists a number of key actions for disaster risk
reduction and requests the member States and other relevant stakeholders to implement
them. One of the outstanding features included in these actions is the application of
geospatial information technology in disaster risk reduction.
In response to this call, the United Nations Committee of Experts on Global
Geospatial Information Management (UN-GGIM) established the Working Group on
Geospatial Information and Services for Disasters (WG-Disasters) in 2015 to discuss the
overall framework of the application of geospatial information and services for disaster
risk reduction. As one of its outcomes, WG-Disasters drafted a Strategic Framework on
Geospatial Information and Services for Disasters (SFGISD), which was adopted at the
seventh session of UN-GGIM in August 2017 (WG-Disasters, 2017). The resolution of
SFGISD was adopted by the Economic and Social Council (ECOSOC) on 2 July 2018 as
a guide for Member States to ensure the availability and accessibility of quality geospatial
information and services across all phases of disaster risk reduction and management
(ECOSOC, 2018).
1-2) About the Guidelines
In parallel to abovementioned global endeavor for disaster risk reduction with
geospatial information technology, and given the fact that the Asia-Pacific region is
especially prone to natural disasters, UN-GGIM-AP established the Working Group on
Disaster Risk Management (WG2) at its fourth plenary meeting in 2015 to explore
potential roles of NGIAs in disaster risk reduction. The primary goal of WG2, during its
three-year term (2015-2018), is to develop guidelines that assist NGIAs in the region in
applying the geospatial information technology for disaster risk reduction.
Figure 1 shows the conceptual relationship between the Guidelines and the relevant
frameworks and activities. The Guidelines, which introduces specific geospatial activities
for NGIAs, complements SFGISD which is a policy guidance document for applying
geospatial information and services for disaster risk reduction. With the help of these two
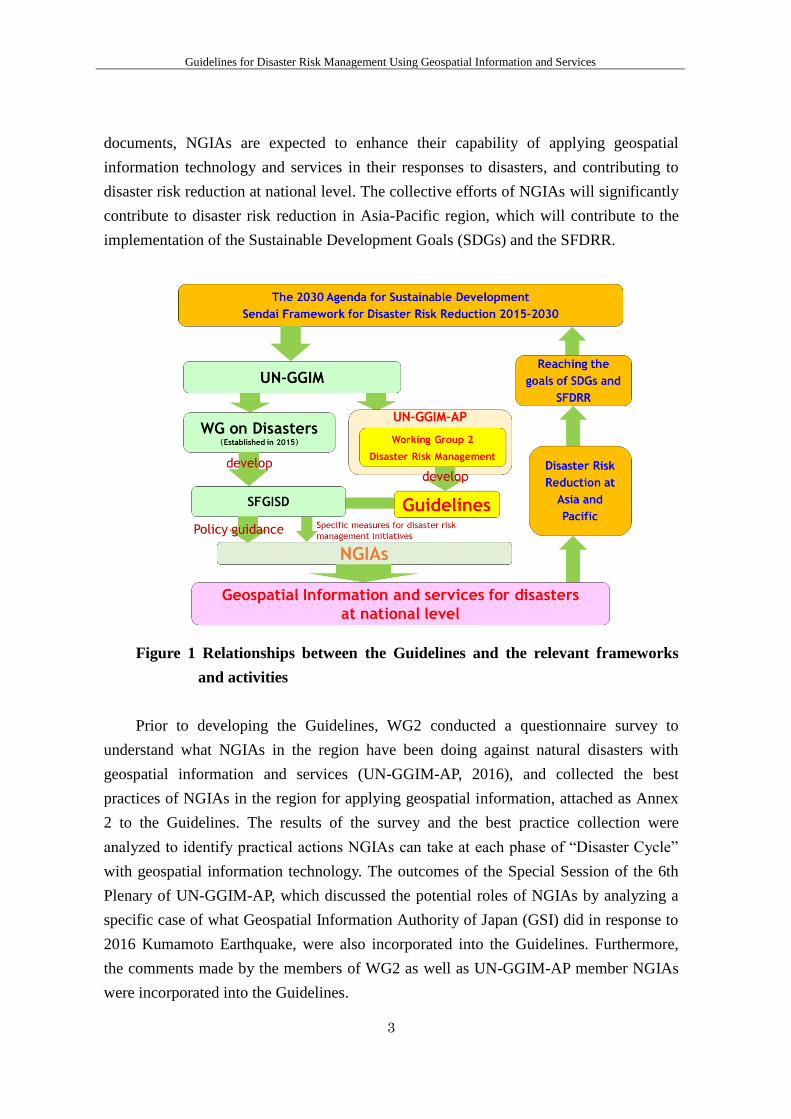
Guidelines for Disaster Risk Management Using Geospatial Information and Services
3
documents, NGIAs are expected to enhance their capability of applying geospatial
information technology and services in their responses to disasters, and contributing to
disaster risk reduction at national level. The collective efforts of NGIAs will significantly
contribute to disaster risk reduction in Asia-Pacific region, which will contribute to the
implementation of the Sustainable Development Goals (SDGs) and the SFDRR.
Figure 1 Relationships between the Guidelines and the relevant frameworks
and activities
Prior to developing the Guidelines, WG2 conducted a questionnaire survey to
understand what NGIAs in the region have been doing against natural disasters with
geospatial information and services (UN-GGIM-AP, 2016), and collected the best
practices of NGIAs in the region for applying geospatial information, attached as Annex
2 to the Guidelines. The results of the survey and the best practice collection were
analyzed to identify practical actions NGIAs can take at each phase of “Disaster Cycle”
with geospatial information technology. The outcomes of the Special Session of the 6th
Plenary of UN-GGIM-AP, which discussed the potential roles of NGIAs by analyzing a
specific case of what Geospatial Information Authority of Japan (GSI) did in response to
2016 Kumamoto Earthquake, were also incorporated into the Guidelines. Furthermore,
the comments made by the members of WG2 as well as UN-GGIM-AP member NGIAs
were incorporated into the Guidelines.
Guidelines for Disaster Risk Management Using Geospatial Information and Services
4
WG2 also worked closely with WG-Disasters of UN-GGIM and incorporated the
priority policy of SFGISD into the Guidelines to make them assist NGIAs in
implementing SFGISD’s goals so that they will facilitate the adaptation of SFGISD in
each country as illustrated in Figure 1.
The Guidelines consist of the following chapters. Following this introductory
chapter (Chapter 1), Chapter 2 describes the roles of geospatial information and NGIAs
in disaster risk management. Then, Chapters 3, 4 and 5 introduce measures before, during
and after disasters, respectively. These measures would be potentially engaged by NGIAs
based on the roles described in Chapter 2. In addition, there are three annexes. Annex 1 is
the list of WG2 members. Annex 2 is the summary of the best practices on the use of
geospatial information for disaster risk reduction. Annex 3 includes the GSI’s case story
of response activities to 2016 Kumamoto Earthquake.
Targeted readers of the Guidelines are primarily senior staff members of NGIAs.
However, the Guidelines will also benefit other users of geospatial information who work
for disaster risk reduction in both public and private sectors. In this sense the Guidelines
are expected to develop a common understanding on the benefit of employing geospatial
information technology between NGIAs and relevant stakeholders that engage in disaster
risk reduction.
While there are a number of different types of natural hazards in the region, most
methodologies of applying geospatial information technology in disaster risk
management by NGIAs are commonly applicable to different types of hazards. Therefore,
the Guidelines do not address specific geospatial information technologies that are only
applicable for a specific type of hazard. Rather, the Guidelines, mainly in Chapter 4,
focus on how different types of geospatial information technology can be applied in
disaster risk reduction in general. In addition, since the Guidelines are intended to cover
as many measures for NGIAs as possible, some of them may not be suitable or practical
for specific disasters or in some countries. NGIAs, therefore, are requested to select those
measures that are applicable in their countries, and modify them, if needed, so that they
may be best suited for their needs in disaster risk management.
Guidelines for Disaster Risk Management Using Geospatial Information and Services
5
Chapter 2: Roles of Geospatial Information Technology and NGIAs in
DRM
2-1) Roles of Geospatial Information Technology and NGIAs
Disaster Risk Management (DRM) refers to the application of disaster risk reduction
policies and strategies to prevent new disaster risk, reduce existing disaster risk and
manage residual risk, contributing to the strengthening of resilience and reduction of
disaster losses (UN General Assembly Resolution A/RES/69/283). While many different
measures are to be employed in DRM, SFGISD stresses that geospatial information has
been widely recognized as an important aspect of DRM, and that the availability and
accessibility of quality geospatial data and information from authoritative sources ensure
decision makers and other concerned stakeholders of an accurate common operational
picture of critical scenarios before, during and after disasters (paragraph 2 of SFGISD).
Based on this understanding, SFGISD aims to achieve the following outcome:
The human, socioeconomic and environmental risks and impacts of disasters are
prevented or reduced through the use of geospatial information and services (paragraph
8).
In order to attain this outcome, the following goal is set in SFGISD to take full
advantage of the geospatial information technology:
Quality geospatial information and services are available and accessible in a timely
and coordinated way to support decision-making and operations within and across all
sectors and phases of disaster risk management (paragraph 9).
Furthermore, SFGISD proposes the following targets to achieve the above outcome
and goal (paragraph 10):
Guidelines for Disaster Risk Management Using Geospatial Information and Services
6
a. Awareness is raised among policy makers and concerned entities on the
importance of geospatial information and services to the DRM process; regular
assessment, monitoring and evaluation of risks and disaster situations are
conducted; and a comprehensive plan is developed to implement the five priorities
for action identified in this framework;
b. Policies on collaboration, coordination and sharing are established, issued and
implemented;
c. Geospatial databases and information products are developed, maintained and
updated based on common standards, protocols and processes as important tools in
every decision-making process across all phases of the DRM;
d. Common geospatial information facilities and services are established for all key
stakeholders to have a common operational picture of disaster events;
e. Information, education and communications capacities and mechanisms are built
and strengthened; and
f. Resources are made available to sustain all the activities for the enhancement of the
use of geospatial information in DRM.
SFGISD proposes major activities to achieve its outcome and goal, taking into
account of the fact finding analysis of existing policy frameworks in the world. The
activities are classified into one of the following five priorities for action.
Priority 1: Governance and Policies;
Priority 2: Awareness Raising and Capacity Building;
Priority 3: Data Management;
Priority 4: Common Infrastructure and Services; and
Priority 5: Resource Mobilization.
Among many organizations which conduct DRM activities, it is obvious that NGIAs
should take a central role in promoting geospatial information for effective DRM, by
communicating and collaborating with the other organizations. NGIAs have a unique
position in national institutional framework, by providing authoritative geospatial
information as framework data to the society, advocating and promoting appropriate
and/or state-of-the-art geospatial information technology to solve the problems that are
common in DRM operations by relevant organizations.
In order to confirm the roles and function of the NGIA within national DRM
framework, the NGIA, particularly its senior officials are recommended to check the
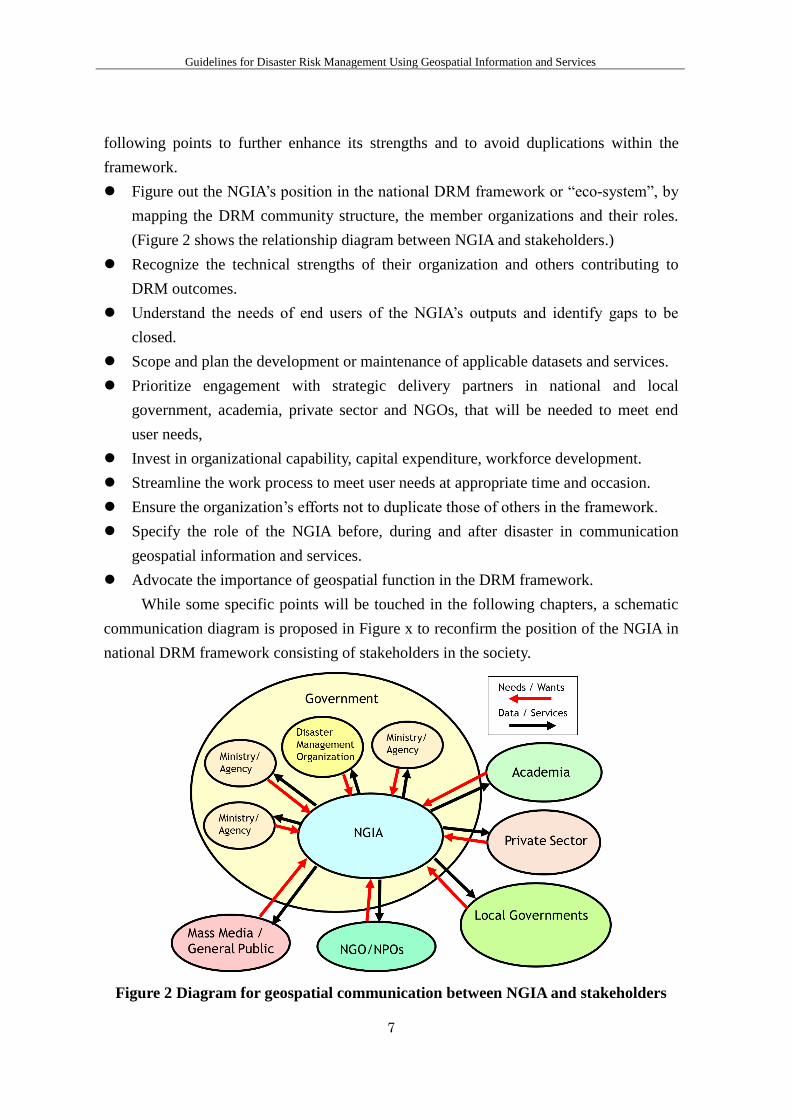
Guidelines for Disaster Risk Management Using Geospatial Information and Services
7
following points to further enhance its strengths and to avoid duplications within the
framework.
Figure out the NGIA’s position in the national DRM framework or “eco-system”, by
mapping the DRM community structure, the member organizations and their roles.
(Figure 2 shows the relationship diagram between NGIA and stakeholders.)
Recognize the technical strengths of their organization and others contributing to
DRM outcomes.
Understand the needs of end users of the NGIA’s outputs and identify gaps to be
closed.
Scope and plan the development or maintenance of applicable datasets and services.
Prioritize engagement with strategic delivery partners in national and local
government, academia, private sector and NGOs, that will be needed to meet end
user needs,
Invest in organizational capability, capital expenditure, workforce development.
Streamline the work process to meet user needs at appropriate time and occasion.
Ensure the organization’s efforts not to duplicate those of others in the framework.
Specify the role of the NGIA before, during and after disaster in communication
geospatial information and services.
Advocate the importance of geospatial function in the DRM framework.
While some specific points will be touched in the following chapters, a schematic
communication diagram is proposed in Figure x to reconfirm the position of the NGIA in
national DRM framework consisting of stakeholders in the society.
Figure 2 Diagram for geospatial communication between NGIA and stakeholders
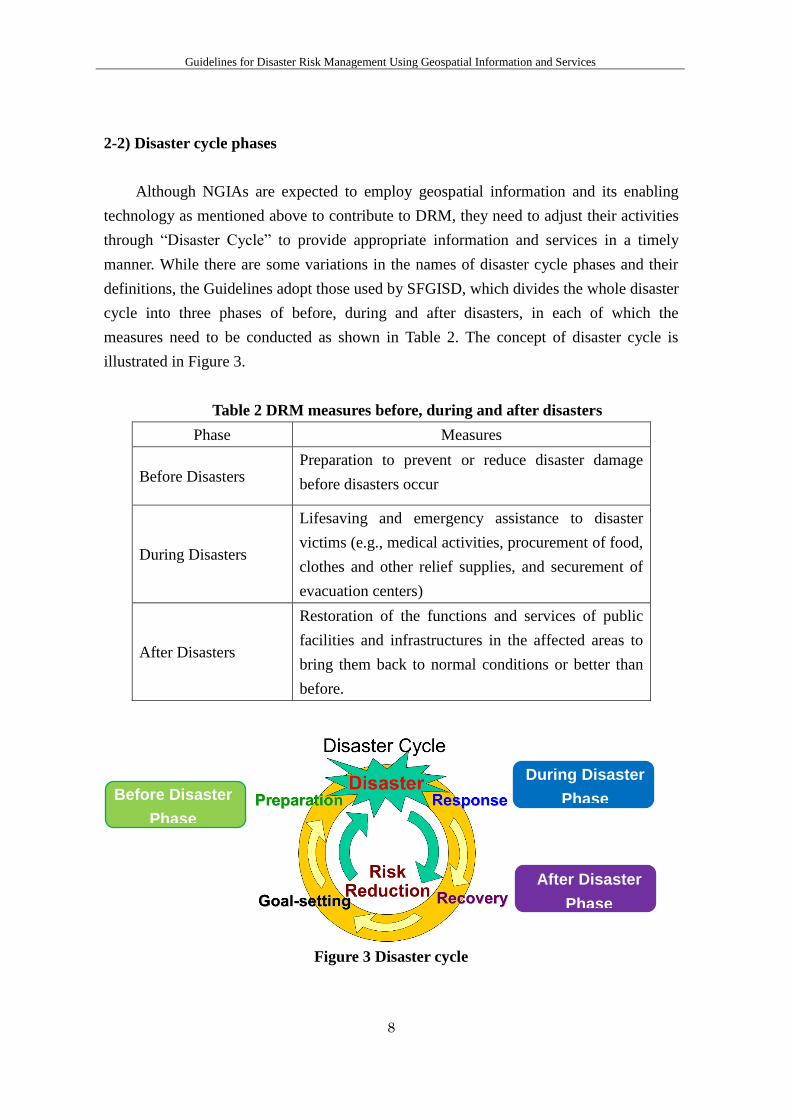
Guidelines for Disaster Risk Management Using Geospatial Information and Services
8
2-2) Disaster cycle phases
Although NGIAs are expected to employ geospatial information and its enabling
technology as mentioned above to contribute to DRM, they need to adjust their activities
through “Disaster Cycle” to provide appropriate information and services in a timely
manner. While there are some variations in the names of disaster cycle phases and their
definitions, the Guidelines adopt those used by SFGISD, which divides the whole disaster
cycle into three phases of before, during and after disasters, in each of which the
measures need to be conducted as shown in Table 2. The concept of disaster cycle is
illustrated in Figure 3.
Table 2 DRM measures before, during and after disasters
Phase Measures
Before Disasters Preparation to prevent or reduce disaster damage
before disasters occur
During Disasters
Lifesaving and emergency assistance to disaster
victims (e.g., medical activities, procurement of food,
clothes and other relief supplies, and securement of
evacuation centers)
After Disasters
Restoration of the functions and services of public
facilities and infrastructures in the affected areas to
bring them back to normal conditions or better than
before.
Figure 3 Disaster cycle
Before Disaster
Phase
During Disaster
Phase
After Disaster
Phase
Guidelines for Disaster Risk Management Using Geospatial Information and Services
9
In order to contribute to implementing DRM measures throughout the disaster cycle,
shown in Table 2, NGIAs should engage in the following activities at each of the phases1:
Before disasters:
i) Development and update of geospatial databases of the country to enable all
stakeholders to easily get access to the latest geospatial information including
disaster risk information before disasters take place;
ii) Policy development and organizational arrangements at national level and
within NGIAs, defining the roles and activities of NGIAs throughout the
disaster cycle.
iii) Building cooperative relationships with stakeholders that potentially benefit
from the applications of geospatial information in their response to disasters
so that they will be able to use the latest geospatial information, and to
provide NGIAs with the information on their needs, including feature
attribution quality requirement, and so that NGIAs will be able to build
partnerships with the industry and international bodies to meet the sudden
surge of demand at the outbreak of disasters;
iv) Conducting regular drills within NGIAs to quickly respond to emergency
situations with adequate resources and capacity; and
v) Raising awareness among relevant stakeholders by explaining policy makers
about the usefulness of products NGIAs can provide, participating in their
disaster response drills, conducting public relations and educational activities.
During disasters:
i) Launching initial response activities including the assessment of disaster
impacts to set the level of priority and engagement of the organization; setting
up the disaster management meeting; and safety check of the NGIA staff
members.
ii) Convening the first and the subsequent disaster management meetings to
mobilize necessary resources and personnel to implement the determined
measures;
iii) Activation of cooperative relationships and partnerships with relevant
1 In addition to the three phases in the disaster emergency cycle, disaster mitigation
policy and measures are one of the major field for geospatial application. The guidelines,
however, does not touch upon geospatial application for mitigation due to lack of best
practice examples and available information.

Guidelines for Disaster Risk Management Using Geospatial Information and Services
10
stakeholders to inquire their needs and provide the latest geospatial
information that shows disaster situations in a timely manner; and
iv) Dissemination of the latest geospatial information that shows disaster
situations to the relevant organization as well as the general public.
After disasters:
i) Developing and disseminating the latest geospatial information of the affected
areas for recovery and reconstruction activities, underlined by full
communications with relevant stakeholders, particularly the public works
organizations, to understand the requirements and extent of geospatial
information; and
ii) Review of the whole process starting from the preparatory work through the
provision of geospatial information for recovery operations to find any
difficulties and incidents that have caused negative impacts on the NGIAs
operations and to make necessary improvements and revisions in the NGIAs’
measures including their policy, organizational arrangements and
methodologies.
The recommended specific measures that may be taken by NGIAs on DRM will be
presented in Chapter 3 (before disasters), Chapter 4 (during disasters) and Chapter 5
(after disasters).
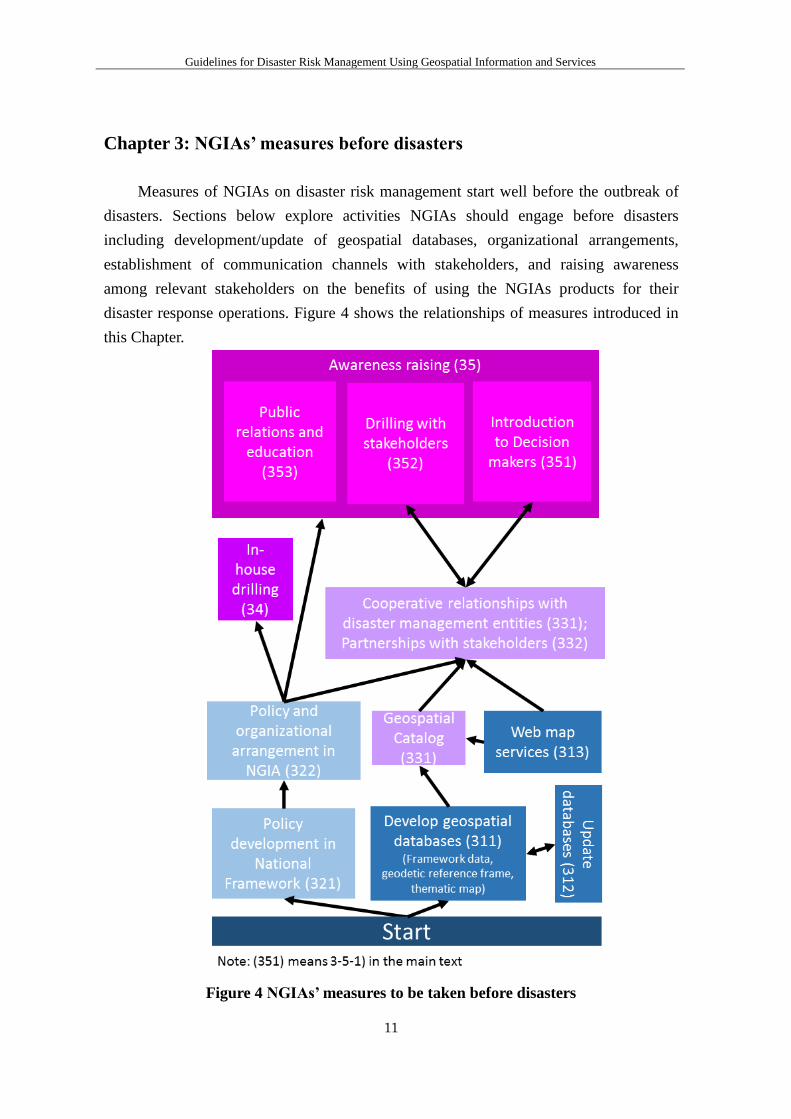
Guidelines for Disaster Risk Management Using Geospatial Information and Services
11
Chapter 3: NGIAs’ measures before disasters
Measures of NGIAs on disaster risk management start well before the outbreak of
disasters. Sections below explore activities NGIAs should engage before disasters
including development/update of geospatial databases, organizational arrangements,
establishment of communication channels with stakeholders, and raising awareness
among relevant stakeholders on the benefits of using the NGIAs products for their
disaster response operations. Figure 4 shows the relationships of measures introduced in
this Chapter.
Figure 4 NGIAs’ measures to be taken before disasters
Guidelines for Disaster Risk Management Using Geospatial Information and Services
12
3-1) Development, update and dissemination of geospatial databases
The following measures are regularly conducted by NGIAs, and are not recognized
as specific activities solely for disaster risk management. However, it is important to
understand that the continuous implementation of these measures is the prerequisite for
NGIAs’ successful contribution to DRM, particularly during disasters.
3-1-1) Development of geospatial databases
Developing geospatial databases of the country and making them accessible by the
government and the general public are the “raison d’être” of an NGIA. This responsibility
becomes even more prominent when the government agencies and relevant stakeholders
are engaged in emergency response activities in the affected areas hit by a large disaster.
If the geospatial databases do not exist or are not made readily available, people will have
much difficulty in even knowing and sharing important information on disasters,
including the location where disasters have taken place and the number of people who
live in the affected areas, and in making timely responses to them. Therefore, the
geospatial databases need to be prepared well before disasters take place and widely
made available in the country. Particularly, the fundamental geospatial databases
produced by NGIAs are prerequisite to support risk / impact analyses either at local,
provisional or national scales, for mitigation purposes. NGIA may also be able to provide
suite of ‘standby’ static maps to end users that mirror the basic layers available in a web
mapping application may be a useful contingency in case of disruptions to utilities during
emergencies upon consultation with the users.
It goes without saying that a geodetic reference frame is to be established and well
maintained for the whole country before developing geospatial databases. This is
particularly important when the country is located in a region of active tectonic
movement. In the current era of accurate satellite positioning, increasing amount of
locational information for various location-based services is acquired through the signals
from Global Navigation Satellite System (GNSS) while the country itself keeps slowly
moving due to the tectonic movement. Such locational information always needs to be
accurately overlaid on existing geospatial databases by adjusting the location in
accordance with the tectonic movement. Therefore, NGIAs need to provide
transformation parameters between different epochs of GNSS to ensure that GNSS
measurements fit accurately in their geospatial databases.
Some NGIAs are mandated to prepare thematic geospatial information based on
hazard history and potential risk of hazards for disaster risk reduction, including the
Guidelines for Disaster Risk Management Using Geospatial Information and Services
13
extent of lavas formed in the past volcanic eruptions and the location of active faults, as
well as the location of shelters. It is desirable that such information is integrated in the
basic geospatial databases and widely shared with other organizations before disasters.
If NGIAs do not have full coverage of national geospatial databases, VGI (voluntary
geographic information) may be an option for DRM application by the end users or
NGIAs themselves. While VGI sometimes include valuable information for effective
disaster response activities, the data should be applied carefully because they are not
authoritative ones and their accuracy and quality are not usually officially validated.
Column 1 Providing man-made slope distribution through webmap services
(Hong Kong)
Lands Department (LandsD) in Hong Kong Special Administrative Region (HK)
provides registered man-made slopes through a website
(http://www1.slope.landsd.gov.hk/smris/map) in cooperation with Civil Engineering and
Development Department (CEDD). This map enables readers to identify location,
responsible party, maintenance agent and others of the specific slope. Location and
maintenance responsibility of the landslip are identified in the first instance. Geospatial
information of the disaster scene is captured for investigation and restoration purposes.
(For details, please see Best Practice No.5 in Annex 2)
3-1-2) Update of geospatial databases
Keeping the geospatial databases as current as possible is also crucial for successful
preparation for disasters in order to enable the users to know the latest features on the
ground, particularly transportation networks. In case of large disasters, the local public
organizations often become dysfunctional and incapable of making appropriate responses
by themselves as they themselves might have been affected by the disasters. That means
that many people including rescue teams, who would be deployed to the affected areas,
might not be familiar with the local geography and would heavily depend on available
geospatial databases even to find the suitable route to get there. If the transportation
networks are not well updated, however, they may take an unnecessary detour to reach
the affected areas by, for example, not being able to take advantage of the newly built
road networks. Since disasters may take place anytime and anywhere, NGIAs need to
make sure that their databases are updated and usable even in case of disasters.
Another important aspect of updating geospatial databases is that they provide the
basic information that shows the situations before the disaster to be compared with those
acquired after the disaster. Most people who are involved in disaster operations may not

Guidelines for Disaster Risk Management Using Geospatial Information and Services
14
be familiar with the areas affected by the disaster, which sometimes means that many
people may not fully understand the impact of disaster by just looking only at the
geospatial information acquired after the disaster. However, if people can compare the
geospatial information between before and after the disaster, they can easily and quickly
comprehend the impact by simply comparing the information acquired at two occasions.
3-1-3) Web maps for sharing the latest geospatial information
Once disasters take place, the geospatial information that shows the disaster
situations of the affected areas need to be instantly shared in the government and with the
general public to facilitate the timely response activities by relevant organizations. When
printed maps were the primary media of geospatial information, preparation of the
geospatial information of affected areas required a number of days before the disaster
information is actually shared with other organizations. While printed maps are still
useful and important media for keeping the records of what has happened in disasters,
they cannot meet the immediate need of other organizations that need to know the latest
disaster situations to appropriately respond to them in a timely manner, including to save
people’s lives and properties and to rebuild damaged infrastructures.
Distributing data in digital form via the internet is another way of sharing the latest
geospatial information with other organizations. In most cases, however, other
organizations are so busy for their response activities that they have no time to access the
data and virtually no capacity/tools to process it by themselves. In such cases, the
geospatial information prepared by NGIAs may not contribute much to their activities at
the early phase of disasters.
Web maps, however, provide a very convenient way of instantaneously sharing a lot
of different layers of geospatial information on the same basic map on the web without
employing additional tools to process the data and building the capacity to use them.
Furthermore, many organization has introduced decision support tools for emergency
planning and response, which requires the latest geospatial information provided by
NGIAs via the Internet in many cases. In this connection, it is recommended that NGIAs
develop a web map service based on NGIAs’ geospatial databases for relevant
organizations and the general public before disasters. Services that are operated at normal
time will allow NGIAs to seamlessly distribute geospatial information even in case of
disasters, contributing much to disaster risk reduction.

Guidelines for Disaster Risk Management Using Geospatial Information and Services
15
3-2) Policy development and organizational arrangements
3-2-1) Policy development within national framework
Without appropriate disaster risk management policies that define the role and
proper implementation strategy, the NGIA’s activities will be easily disarrayed and may
not be able to contribute well to the overall disaster risk management of the country, even
though the NGIA is capable of employing sophisticated geospatial information
technology and have capable staff members and adequate resources to provide timely
geospatial information to other organizations.
The first and important thing for the NGIA to do is to incorporate its disaster
response policy into the national policy framework on disaster risk management.
Usually, the framework is provided in a legal document that defines how the
government bodies should prepare and respond to disasters. The NGIA needs to make its
disaster response policy be consistent with the national framework through cooperation
with other government institutions, particularly the disaster management organization.
Since many other organizations need to engage in disaster risk management, the policies
of NGIAs should be harmonized with those of other organizations.
3-2-2) Policy and Organizational arrangements within NGIAs
Based on the national framework in which NGIAs’ disaster response policy is
incorporated, the NGIAs should arrange its policy and organization in preparation for
disasters. Normally, this arrangement is summarized in in-house documents like disaster
management plan and/or disaster response manual. Two kinds of documents may be
formulated: one for policy guidance and the other for operational manual.
Although the circumstances around NGIAs are different by countries, the following
points are provided as important options of organizational arrangements for the disaster
response activities of NGIAs. Applicable options out of these points should be well
incorporated into the documents that govern the disaster response activities of NGIAs.
a) Disaster response measures and activities need to be developed for each of three
disaster cycle phases, namely, before, during and after disasters, for their
effective implementation.
b) The organizational structure that is to be set up to oversee disaster response
activities should be defined. Responsibility of the members within the structure
should also be made clear. A special team composed of senior staff members
should be designated to manage disaster response activities (This team is called
“the headquarters” throughout these Guidelines).
Guidelines for Disaster Risk Management Using Geospatial Information and Services
16
c) The level of engagement of the organization, depending on the severity of the
magnitude and impact of disasters, needs to be specified. The triggering criteria
determining the level of engagement may be different according to hazard types
including earthquake, tsunami, volcanic eruption, drought and flood.
d) Once a disaster happens, finding the safety status of their staff members and the
family is also a priority for the NGIA. In this connection, it is often helpful to
have a service of automatically inquiring the well-being of the staff members and
their families via their pre-registered mobile devices including cell phones and
smartphones to quickly find who needs help and is available for service.
e) At the outbreak of a disaster, the NGIA needs to be immediately ready for setting
up a disaster risk management meeting of the senior management (the
headquarters meeting). The primary role of the meeting is to share the
information on the latest disaster situations among the senior management and to
make decisions on the activities the NGIA should engage with clear priority.
f) Designation of special teams under the headquarters needs to be defined
beforehand. The responsibility of designated teams may vary depending on the
role of the NGIA in the government, and may include provision of latest
geospatial information to other organizations, communications with relevant
organizations on their specific geospatial information needs, preparation of map
products, and public relations.
g) Communication arrangement is also an important element. In order to quickly
initiate the disaster risk management activities and arrange the necessary
structure in the organization, it is very important that all senior staff members are
immediately informed of the disaster outbreak and summoned to participate in
the first headquarters meeting during office hours or tele/video conference
meeting during non-office hours in order to put them all on the same page.
Therefore, arrangements should be made before disasters so that every senior
staff member always carries a mobile phone and can be informed of emergencies
anytime even during non-office hours.
h) In case a disaster hits the main office and/or the regional branch offices, NGIAs
need to be ready for implementing its business continuation plan that has been
developed before disasters to ensure that their minimum services are continually
in operation, and a minimum number of staff members are available to respond
to the disaster.
i) The policies and organizational arrangements should be reviewed and revised as
needed once a series of disaster risk management activities are completed for a
Guidelines for Disaster Risk Management Using Geospatial Information and Services
17
particular disaster or when some changes are made on the mandate and other
responsibilities.
Once the organizational structure is arranged before disasters, the staff members
need to be frequently reminded of their responsibilities and how they need to respond in
case of a disaster. Regular drills, described in 3-4), are also effective and prerequisite to
make the arrangements quickly in case of a disaster.
3-3) Building cooperative relationships and partnerships
3-3-1) Building cooperative relationships with disaster management entities
Geospatial information, which shows the latest disaster situations, is valuable per se
to understand the impacts of disasters including quantitative analyses of the size of
flooded areas and the volume of land mass moved by a landslide. At the same time,
however, geospatial information will be also useful for other organizations that engage in
disaster response activities including rescuing people from the affected areas, distributing
water and foods to the people in shelters, and the repairing of damaged infrastructures.
These organizations, mostly public ones, have their own specific needs on the timing of
acquisition and the extent of data that is provided by NGIAs.
In this connection, it is important for NGIAs to build good cooperative relationships
with these organizations before disasters to understand their needs so that NGIAs will be
able to acquire geospatial information that meets them once disasters take place. Since
their needs may be subject to change as the situations move from one phase to another in
disaster cycle, it is important for NGIAs to always keep the good relationships with them.
Possible partner organizations for emergency response activities include; a) civil
defense force and police; b) national and local governments; c) private sector which
assesses their damage; and d) mass media. While possible partner organizations for
impact and risk analysis include: a) science or technical agencies; b) academia and
experts; c) administrative agencies; d) the agency responsible for the analyses.
Preparing a catalog of geospatial information and products prepared by NGIAs in
the past disasters will help the staff of disaster management organizations understand
when and what types of geospatial information will be made available to them and make
them ready to incorporate such products in making their decisions. The description of the
catalog should be as easy as possible, because the readers may not be familiar with
technical terms of geospatial information. It is also important that the catalog will clarify
what types of media or format are to be used for dissemination or delivery.

Guidelines for Disaster Risk Management Using Geospatial Information and Services
18
Column 2 Multi-hazard mapping of 28 priority provinces and the greater metro
Manila area (Philippines)
Aiming to have a safer and disaster resilient communities, National Mapping and
Resource Information Authority (NAMRIA) implemented multi-hazard mapping of the
28 high risk provinces to map out areas exposed to natural hazards. NAMRIA provided
base maps, capacitated local government units on the use of GIS technology, engaged
technical staff in the integration of hazard maps for use by the local government units and
national government agencies. The output of this activity will facilitate evidence-based
decision-making by local and national authorities (For details, please see Best Practice
No.13 in Annex 2)
3-3-2) Building partnerships with stakeholders
The typical timeframe of ordinary activities of NGIAs including the development
and update of geospatial databases is mostly months and years, not hours or days, which
means that NGIAs usually may not have adequate resources to meet the surge of demand,
including mobilizing a number of survey teams in the affected areas and sending many
airplanes to take their aerial photographs, immediately after the outbreak of disasters.
Obviously, NGIAs need to depend on outside resources to meet such a sudden surge of
demand of surveying and mapping.
One way to overcome such a challenge is to build a partnership with the surveying
and mapping industry before disasters, including signing a memorandum of cooperation,
to enable NGIAs to request the industry at the outbreak of disasters to deploy their
resources to the affected areas to acquire their latest geospatial information without going
through a formal bidding process. Such partnership arrangements have to be made before
disasters and need to be tested through regular drills to see if they work well.
If sufficient resources are not available domestically, it may be necessary to request
assistance through bilateral or multilateral cooperation programs supported by
international organizations including aid agencies. In this respect, it is noteworthy that
there are prominent international frameworks, including the International Charter on
Space and Major Disasters (Charter on Cooperation to Achieve the Coordinated Use of
Space Facilities in the Event of Natural or Technological Disasters) (See Column 3), and
Sentinel Asia (International cooperative project aiming for the online sharing of
disaster-related information in the Asia-Pacific region obtained by earth observation
satellites and other space technologies, thereby preventing and mitigating damage caused
by natural disasters), both of which enable NGIAs to acquire latest earth observation data
provided by space agencies in the world. These international assistance frameworks also

Guidelines for Disaster Risk Management Using Geospatial Information and Services
19
need to be tested before disasters to see how they work in reality through drills.
Column 3 International Charter on Space and Major Disasters
The International Charter on Space and Major Disasters is an international collaboration
between the owners and operators of earth observation missions and the data users to
provide rapid access to satellite data to assist rescue authorities in the event of a natural or
man-made disaster. Although its mandate only requires the provision of satellite data
quickly and at no cost, the members of the Charter often collaborate with other
value-adding agencies for data analysis and interpretation. Each member organization has
committed its resources to supporting the provisions of the Charter and thus is helping to
mitigate the effects of disasters on human life and property. (ESCAP, 2017)
The relevant websites are:
International Charter on Space and Major Disasters
https://disasterscharter.org/en/web/guest/home
Sentinel Asia https://sentinel.tksc.jaxa.jp/sentinel2/topControl.jsp
The following guidelines published by ESCAP are also helpful in applying space
application to geospatial support activities in DRM.
Innovations in Disaster Rapid Assessment: a Framework for Early Recovery in
ASEAN Countries
http://www.unescap.org/publications/innovations-disaster-rapid-assessment-framew
ork-early-recovery-asean-countries
Specific Hazards: Handbook on Geospatial Decision Support in ASEAN Countries
http://www.unescap.org/publications/specific-hazards-handbook-geospatial-decision
-support-asean-countries-0
Sharing Space-based Information: Procedural Guidelines for Disaster Emergency
Response in ASEAN Countries
http://www.unescap.org/publications/sharing-space-based-information-procedural-g
uidelines-disaster-emergency-response-asean
3-4) Drilling within NGIAs
It is very important that policy and organizational arrangement, described in 3-2-2),
are shared among all staff members of NGIAs. More specifically, all relevant staff
members are needed to be frequently reminded of their responsibilities and how they
need to respond in case of a disaster. In this connection, NGIAs should have a program of
conducting regular drills on DRM to ensure their planned activities are flawlessly carried
Guidelines for Disaster Risk Management Using Geospatial Information and Services
20
out. The possible menu of drills are: safety check response drill; tele/video conference
participation drill; the first disaster management meeting setting up drill; imagery
acquisition, processing, and interpretation drill; and web-map publishing drill. Regular
drills are particularly important for those NGIAs that have frequent personnel changes, so
that all staff members are always kept updated on their roles in disaster risk management.
It is also recommended that an annual drilling plan be established to sustain the capability
of staff members for disaster response and to prepare them for seasonal disasters like
typhoons and heavy rains.
Participation in drills conducted by other organizations is described in 3-5-2).
3-5) Raising awareness
3-5-1) Introduction of geospatial products to decision makers of stakeholders
Some policy makers and decision makers of other government organizations are often
unaware of the potential role of geospatial information in their disaster responses and
what NGIAs can provide throughout the disaster cycle. They may also have difficulty in
keeping up with the emerging new geospatial information technologies including
airborne laser scanning, Synthetic Aperture Radar (SAR) and Continuously Operating
Reference Station (CORS) network that detect very minute changes of ground surface
caused by earthquakes and volcanic activities and delineate flooded areas even under
uncooperative weather. This means that even if NGIAs successfully provide the latest
disaster situations in a timely manner to these important people, they may understand
neither what the information means for them nor how it can assist them in making their
decisions.
In this connection, it is very important for NGIAs to reach out to these people before
disasters to inform them of the geospatial products NGIAs will be able to provide
throughout disaster cycle. Geospatial catalog described in 3-3-1) as well as examples of
geospatial information which were effective at past disasters can be used to keep decision
makers and senior officials well informed of the real value and the effectiveness of
geospatial information.
3-5-2) Participating in drills of relevant stakeholders
In addition to decision makers, the staff of relevant organizations are to be informed
of the geospatial products of NGIAs as they will be the ones who actually use the
products in their respective response operations. While explaining them about the catalog
mentioned in above section is helpful, participating in their drills will give more practical
Guidelines for Disaster Risk Management Using Geospatial Information and Services
21
opportunity for NGIAs to demonstrate how geospatial products they provide will help the
staff in taking advantage of geospatial information in their operations. Most organizations
use maps in some way or other once disasters take place. However, they may not be
familiar with taking advantage of digital map data and web map in their operations in
sharing the latest situations within their organization and with other organizations. Such
interaction will also benefit NGIAs in getting deeper insight on the need of other
organizations and on the improvement NGIAs may need to make for their future
products.
3-5-3) Public relations and educational activities
The general public is another important user of NGIA products throughout the
disaster cycle as they should be well aware of potential risk and damage caused by
disasters of where they live and work. The question is how best NGIAs can reach out to
them. While NGIAs may have capacity to visit them, including local community schools
to provide lectures and even organize a seminar for the local community, the most
effective way is to use existing news media including TV and newspapers as well as
commonly used Social Network Services (SNSs). It is important for NGIAs to have
opportunities to brief media about the latest products and services so that the general
public will be widely informed of the information they can depend on before future
disasters. Comments returned from the followers of SNSs will also be helpful for NGIAs
to better understand the user needs to improve their products and services.
Another category of people to whom NGIAs may want to reach out is school
children. Generally speaking, school children are more receptive than adults in learning
new concepts and new type of information and applying them in their real life. On the
other hand, school teachers may not be keeping up well with the latest geospatial
information technology and new products of NGIAs that are useful for reducing disaster
risk of school children. It is, therefore, helpful for both school children and their teachers
that NGIA staff members visit and show and tell them how the geospatial products of
NGIAs will help reduce their future disaster risk as well as how the geospatial
information technology benefits their daily life.
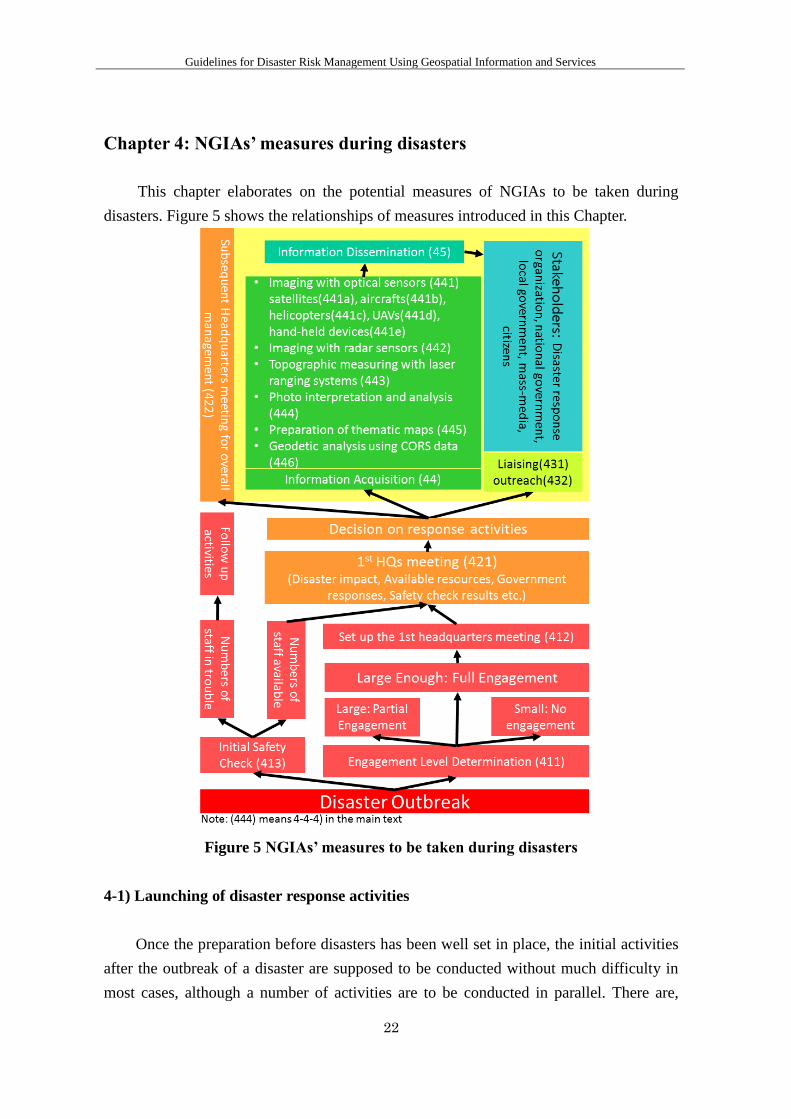
Guidelines for Disaster Risk Management Using Geospatial Information and Services
22
Chapter 4: NGIAs’ measures during disasters
This chapter elaborates on the potential measures of NGIAs to be taken during
disasters. Figure 5 shows the relationships of measures introduced in this Chapter.
Figure 5 NGIAs’ measures to be taken during disasters
4-1) Launching of disaster response activities
Once the preparation before disasters has been well set in place, the initial activities
after the outbreak of a disaster are supposed to be conducted without much difficulty in
most cases, although a number of activities are to be conducted in parallel. There are,
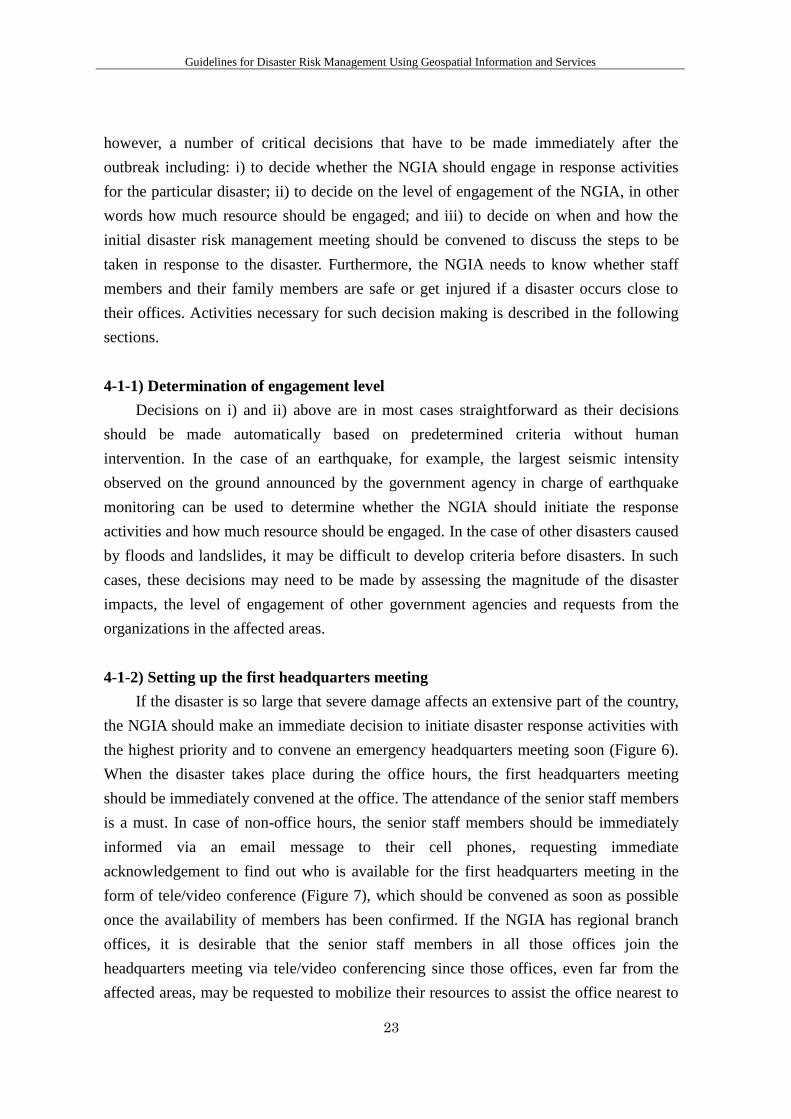
Guidelines for Disaster Risk Management Using Geospatial Information and Services
23
however, a number of critical decisions that have to be made immediately after the
outbreak including: i) to decide whether the NGIA should engage in response activities
for the particular disaster; ii) to decide on the level of engagement of the NGIA, in other
words how much resource should be engaged; and iii) to decide on when and how the
initial disaster risk management meeting should be convened to discuss the steps to be
taken in response to the disaster. Furthermore, the NGIA needs to know whether staff
members and their family members are safe or get injured if a disaster occurs close to
their offices. Activities necessary for such decision making is described in the following
sections.
4-1-1) Determination of engagement level
Decisions on i) and ii) above are in most cases straightforward as their decisions
should be made automatically based on predetermined criteria without human
intervention. In the case of an earthquake, for example, the largest seismic intensity
observed on the ground announced by the government agency in charge of earthquake
monitoring can be used to determine whether the NGIA should initiate the response
activities and how much resource should be engaged. In the case of other disasters caused
by floods and landslides, it may be difficult to develop criteria before disasters. In such
cases, these decisions may need to be made by assessing the magnitude of the disaster
impacts, the level of engagement of other government agencies and requests from the
organizations in the affected areas.
4-1-2) Setting up the first headquarters meeting
If the disaster is so large that severe damage affects an extensive part of the country,
the NGIA should make an immediate decision to initiate disaster response activities with
the highest priority and to convene an emergency headquarters meeting soon (Figure 6).
When the disaster takes place during the office hours, the first headquarters meeting
should be immediately convened at the office. The attendance of the senior staff members
is a must. In case of non-office hours, the senior staff members should be immediately
informed via an email message to their cell phones, requesting immediate
acknowledgement to find out who is available for the first headquarters meeting in the
form of tele/video conference (Figure 7), which should be convened as soon as possible
once the availability of members has been confirmed. If the NGIA has regional branch
offices, it is desirable that the senior staff members in all those offices join the
headquarters meeting via tele/video conferencing since those offices, even far from the
affected areas, may be requested to mobilize their resources to assist the office nearest to
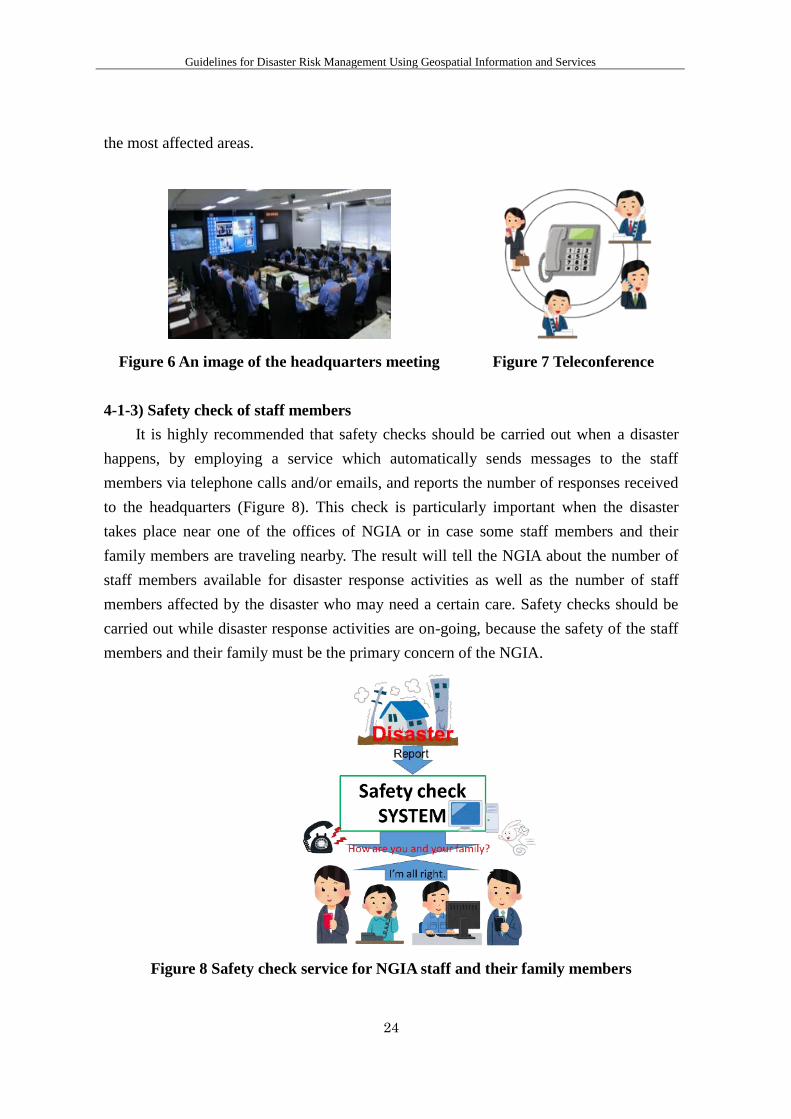
Guidelines for Disaster Risk Management Using Geospatial Information and Services
24
the most affected areas.
Figure 6 An image of the headquarters meeting Figure 7 Teleconference
4-1-3) Safety check of staff members
It is highly recommended that safety checks should be carried out when a disaster
happens, by employing a service which automatically sends messages to the staff
members via telephone calls and/or emails, and reports the number of responses received
to the headquarters (Figure 8). This check is particularly important when the disaster
takes place near one of the offices of NGIA or in case some staff members and their
family members are traveling nearby. The result will tell the NGIA about the number of
staff members available for disaster response activities as well as the number of staff
members affected by the disaster who may need a certain care. Safety checks should be
carried out while disaster response activities are on-going, because the safety of the staff
members and their family must be the primary concern of the NGIA.
Figure 8 Safety check service for NGIA staff and their family members
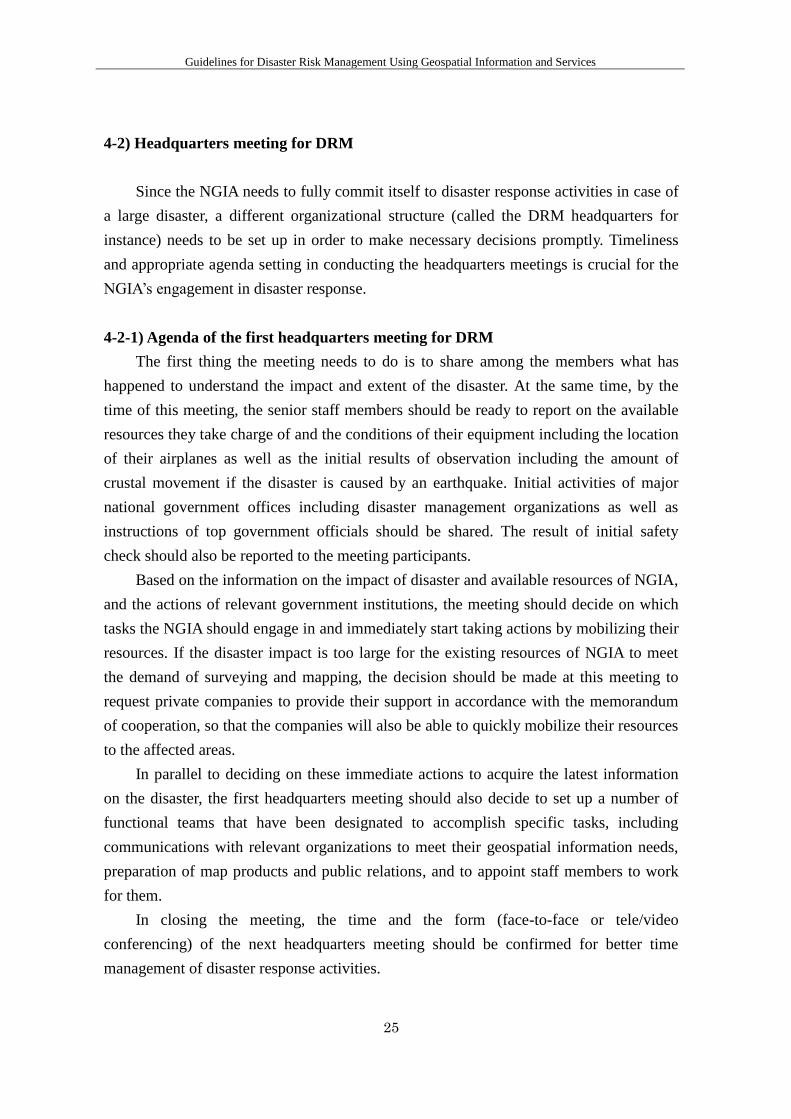
Guidelines for Disaster Risk Management Using Geospatial Information and Services
25
4-2) Headquarters meeting for DRM
Since the NGIA needs to fully commit itself to disaster response activities in case of
a large disaster, a different organizational structure (called the DRM headquarters for
instance) needs to be set up in order to make necessary decisions promptly. Timeliness
and appropriate agenda setting in conducting the headquarters meetings is crucial for the
NGIA’s engagement in disaster response.
4-2-1) Agenda of the first headquarters meeting for DRM
The first thing the meeting needs to do is to share among the members what has
happened to understand the impact and extent of the disaster. At the same time, by the
time of this meeting, the senior staff members should be ready to report on the available
resources they take charge of and the conditions of their equipment including the location
of their airplanes as well as the initial results of observation including the amount of
crustal movement if the disaster is caused by an earthquake. Initial activities of major
national government offices including disaster management organizations as well as
instructions of top government officials should be shared. The result of initial safety
check should also be reported to the meeting participants.
Based on the information on the impact of disaster and available resources of NGIA,
and the actions of relevant government institutions, the meeting should decide on which
tasks the NGIA should engage in and immediately start taking actions by mobilizing their
resources. If the disaster impact is too large for the existing resources of NGIA to meet
the demand of surveying and mapping, the decision should be made at this meeting to
request private companies to provide their support in accordance with the memorandum
of cooperation, so that the companies will also be able to quickly mobilize their resources
to the affected areas.
In parallel to deciding on these immediate actions to acquire the latest information
on the disaster, the first headquarters meeting should also decide to set up a number of
functional teams that have been designated to accomplish specific tasks, including
communications with relevant organizations to meet their geospatial information needs,
preparation of map products and public relations, and to appoint staff members to work
for them.
In closing the meeting, the time and the form (face-to-face or tele/video
conferencing) of the next headquarters meeting should be confirmed for better time
management of disaster response activities.
Guidelines for Disaster Risk Management Using Geospatial Information and Services
26
4-2-2) Subsequent headquarters meetings during disasters
Once initial decisions are made, the NGIA needs to convene subsequent
headquarters meetings to monitor the progress of the activities as well as to share the
latest situations among the senior staff members, and to adjust the activities to respond to
new situations. The frequency of meetings may be initially as high as even three or four
times a day to catch up with rapidly changing situations, and then it becomes lower as the
disaster response operations are shifting from the initial emergency phase to the recovery
phase that focuses on the rebuilding of the damaged areas.
4-3) Liaising with different stakeholders and conducting outreach activities
4-3-1) Liaising with different stakeholders
The central government generally conducts disaster response management when a
large disaster takes place. The NGIA is supposed to be a part of the government-wide
disaster management framework and play specific roles as a national institution. For
example, the NGIA may be requested to report its activities and outcomes to the disaster
management meetings convened by the government. Attending these meetings is also
important just after the outbreak of the disaster to get the latest information on the disaster.
Generally, available information on the impact and extent of the disaster, usually brought
by news media, may be very limited. Therefore, NGIAs should make sure to attend these
meetings to get necessary information for better decision making and resource
mobilization.
The Government may also set up a local office to liaise with the local governments
to provide timely support to the local people and facilitate the recovery from the damage.
The NGIA has an important role in such a local office by meeting their geospatial needs,
including printing large format maps for rescue operations and food delivery to shelters.
Cooperative relationships that have been built before disasters with relevant
organizations including local governments assist the NGIA in receiving the latest
information on the disaster situations and understanding specific needs they have on
geospatial information. Being knowledgeable about specific geospatial needs of
stakeholders, the NGIA can make necessary adjustments in its activities during disasters
to better meet user needs in a timely manner. In this connection, it is important that the
NGIA contacts other organizations, particularly local governments that are hit by the
disaster, soon after the outbreak to keep good communications with them. When it
becomes practical, deploying its staff members to these organizations to liaise with them
will further facilitate the communications. For concerted communication activities, it is
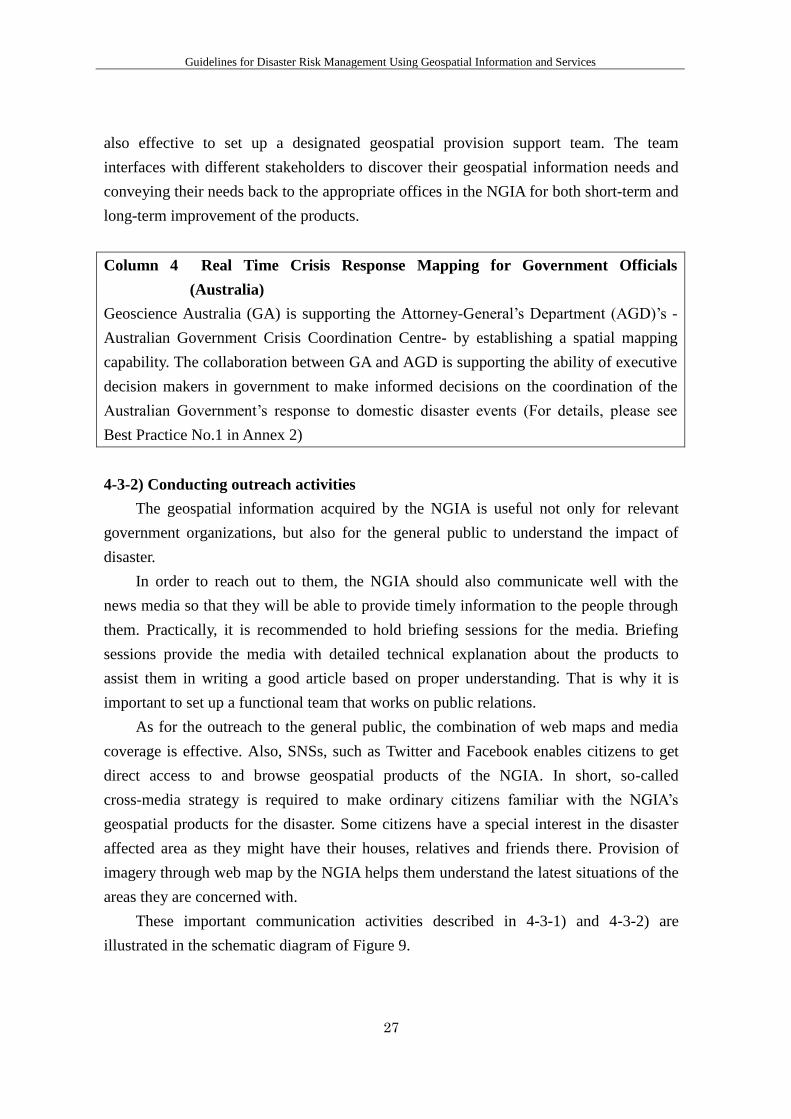
Guidelines for Disaster Risk Management Using Geospatial Information and Services
27
also effective to set up a designated geospatial provision support team. The team
interfaces with different stakeholders to discover their geospatial information needs and
conveying their needs back to the appropriate offices in the NGIA for both short-term and
long-term improvement of the products.
Column 4 Real Time Crisis Response Mapping for Government Officials
(Australia)
Geoscience Australia (GA) is supporting the Attorney-General’s Department (AGD)’s -
Australian Government Crisis Coordination Centre- by establishing a spatial mapping
capability. The collaboration between GA and AGD is supporting the ability of executive
decision makers in government to make informed decisions on the coordination of the
Australian Government’s response to domestic disaster events (For details, please see
Best Practice No.1 in Annex 2)
4-3-2) Conducting outreach activities
The geospatial information acquired by the NGIA is useful not only for relevant
government organizations, but also for the general public to understand the impact of
disaster.
In order to reach out to them, the NGIA should also communicate well with the
news media so that they will be able to provide timely information to the people through
them. Practically, it is recommended to hold briefing sessions for the media. Briefing
sessions provide the media with detailed technical explanation about the products to
assist them in writing a good article based on proper understanding. That is why it is
important to set up a functional team that works on public relations.
As for the outreach to the general public, the combination of web maps and media
coverage is effective. Also, SNSs, such as Twitter and Facebook enables citizens to get
direct access to and browse geospatial products of the NGIA. In short, so-called
cross-media strategy is required to make ordinary citizens familiar with the NGIA’s
geospatial products for the disaster. Some citizens have a special interest in the disaster
affected area as they might have their houses, relatives and friends there. Provision of
imagery through web map by the NGIA helps them understand the latest situations of the
areas they are concerned with.
These important communication activities described in 4-3-1) and 4-3-2) are
illustrated in the schematic diagram of Figure 9.
Guidelines for Disaster Risk Management Using Geospatial Information and Services
28
Figure 9 Outreach activities of NGIAs to different stakeholders
4-4) Acquisition of the latest geospatial information on disaster situations
There are a number of techniques the NGIA can employ to acquire the latest
geospatial information of the areas affected by the disaster. Although they are
complementary to each other, some of them are suitable for particular types of disasters
and others are more fitted to different ones. Since each of the techniques has both
advantages and disadvantages, the NGIA needs to select the suitable techniques or
combine different techniques to acquire valuable information as quickly as possible by
assessing the disaster situations. This section lists some of the commonly used techniques
by NGIAs with their brief descriptions, including their advantages and disadvantages.
4-4-1) Imaging of the ground with optical sensors
Imaging the ground with optical sensors such as optical cameras is one of the most
commonly used techniques to acquire the geospatial information of the areas affected by
disasters, including the areas inundated by floods or tsunamis, those devastated by
landslides and those damaged by earthquakes. Recent digital processing technology has
streamlined the acquisition, processing (including the development of ortho-rectified
imagery), analysis and timely dissemination of acquired data including ortho-rectified
imagery to different stakeholders including the general public via the internet. Having
had the long history and been widely used in different applications, these images allow
most people to visually and easily understand the disaster situations. When compared
with those images taken before the disaster, the impact and extent of the disaster will
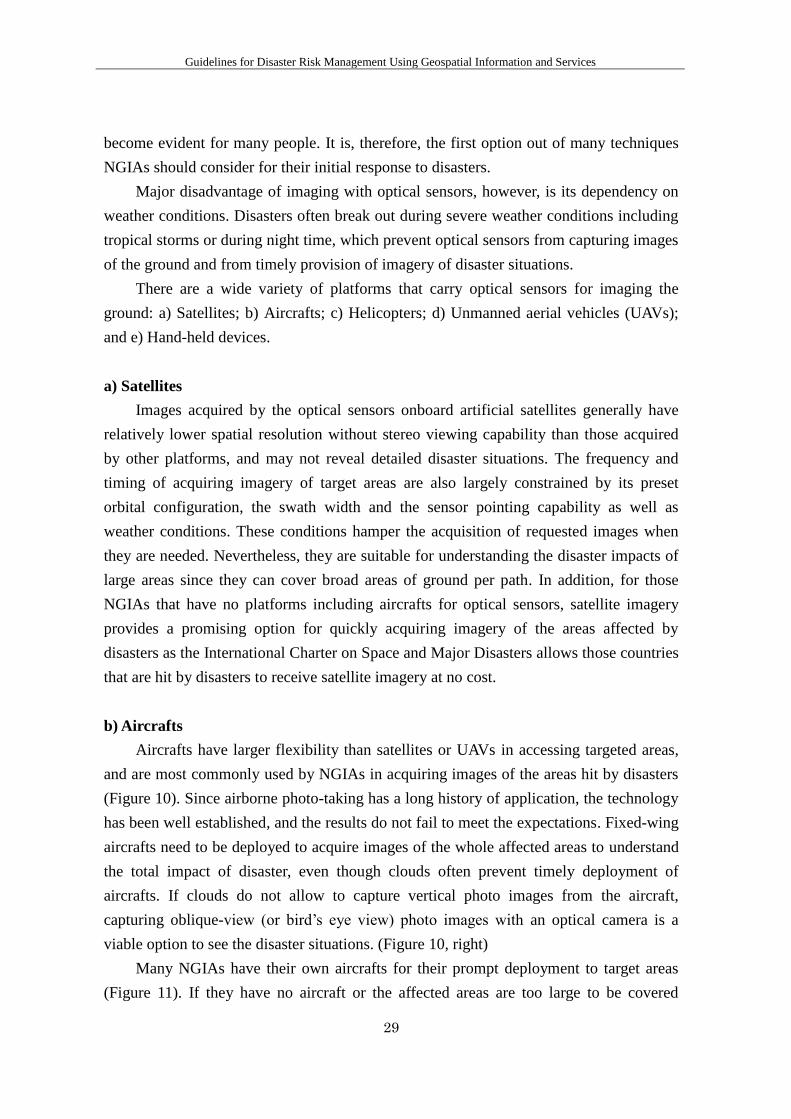
Guidelines for Disaster Risk Management Using Geospatial Information and Services
29
become evident for many people. It is, therefore, the first option out of many techniques
NGIAs should consider for their initial response to disasters.
Major disadvantage of imaging with optical sensors, however, is its dependency on
weather conditions. Disasters often break out during severe weather conditions including
tropical storms or during night time, which prevent optical sensors from capturing images
of the ground and from timely provision of imagery of disaster situations.
There are a wide variety of platforms that carry optical sensors for imaging the
ground: a) Satellites; b) Aircrafts; c) Helicopters; d) Unmanned aerial vehicles (UAVs);
and e) Hand-held devices.
a) Satellites
Images acquired by the optical sensors onboard artificial satellites generally have
relatively lower spatial resolution without stereo viewing capability than those acquired
by other platforms, and may not reveal detailed disaster situations. The frequency and
timing of acquiring imagery of target areas are also largely constrained by its preset
orbital configuration, the swath width and the sensor pointing capability as well as
weather conditions. These conditions hamper the acquisition of requested images when
they are needed. Nevertheless, they are suitable for understanding the disaster impacts of
large areas since they can cover broad areas of ground per path. In addition, for those
NGIAs that have no platforms including aircrafts for optical sensors, satellite imagery
provides a promising option for quickly acquiring imagery of the areas affected by
disasters as the International Charter on Space and Major Disasters allows those countries
that are hit by disasters to receive satellite imagery at no cost.
b) Aircrafts
Aircrafts have larger flexibility than satellites or UAVs in accessing targeted areas,
and are most commonly used by NGIAs in acquiring images of the areas hit by disasters
(Figure 10). Since airborne photo-taking has a long history of application, the technology
has been well established, and the results do not fail to meet the expectations. Fixed-wing
aircrafts need to be deployed to acquire images of the whole affected areas to understand
the total impact of disaster, even though clouds often prevent timely deployment of
aircrafts. If clouds do not allow to capture vertical photo images from the aircraft,
capturing oblique-view (or bird’s eye view) photo images with an optical camera is a
viable option to see the disaster situations. (Figure 10, right)
Many NGIAs have their own aircrafts for their prompt deployment to target areas
(Figure 11). If they have no aircraft or the affected areas are too large to be covered
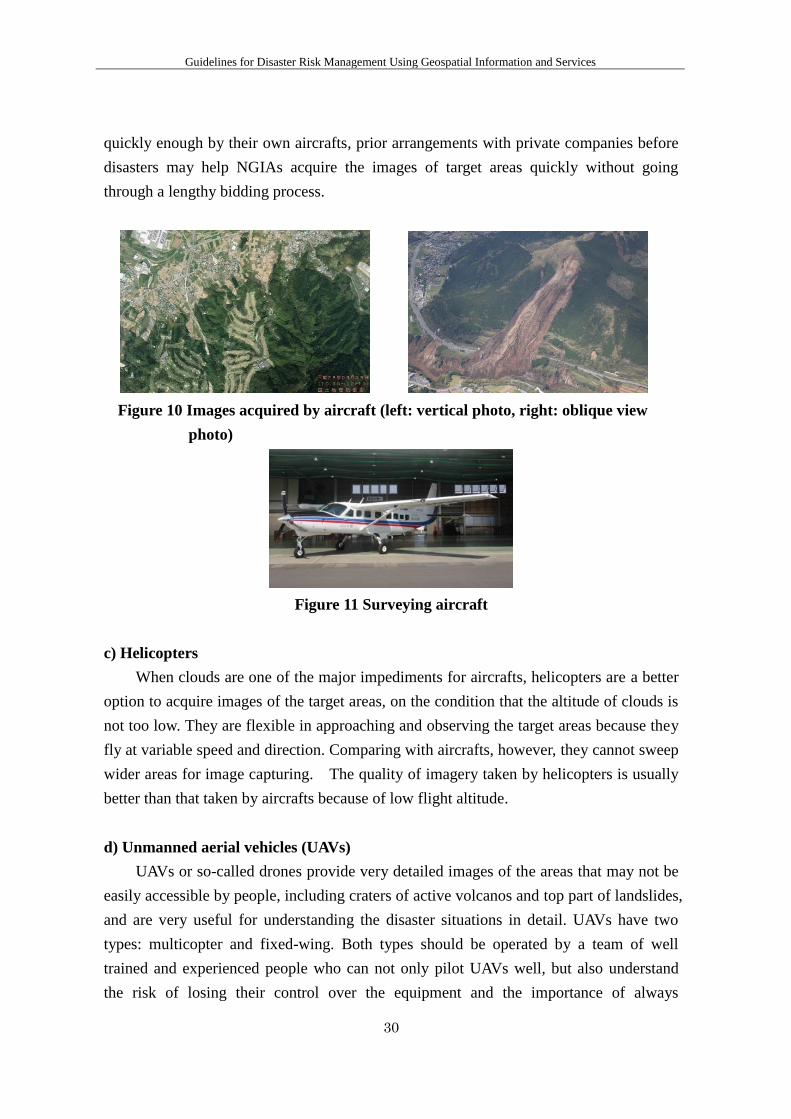
Guidelines for Disaster Risk Management Using Geospatial Information and Services
30
quickly enough by their own aircrafts, prior arrangements with private companies before
disasters may help NGIAs acquire the images of target areas quickly without going
through a lengthy bidding process.
Figure 10 Images acquired by aircraft (left: vertical photo, right: oblique view
photo)
Figure 11 Surveying aircraft
c) Helicopters
When clouds are one of the major impediments for aircrafts, helicopters are a better
option to acquire images of the target areas, on the condition that the altitude of clouds is
not too low. They are flexible in approaching and observing the target areas because they
fly at variable speed and direction. Comparing with aircrafts, however, they cannot sweep
wider areas for image capturing. The quality of imagery taken by helicopters is usually
better than that taken by aircrafts because of low flight altitude.
d) Unmanned aerial vehicles (UAVs)
UAVs or so-called drones provide very detailed images of the areas that may not be
easily accessible by people, including craters of active volcanos and top part of landslides,
and are very useful for understanding the disaster situations in detail. UAVs have two
types: multicopter and fixed-wing. Both types should be operated by a team of well
trained and experienced people who can not only pilot UAVs well, but also understand
the risk of losing their control over the equipment and the importance of always

Guidelines for Disaster Risk Management Using Geospatial Information and Services
31
prioritizing the safety of the team.
Multicopters allow the pilots to have flexible maneuvering to capture images of the
areas they would like to see, though they may not be operable under the conditions of
strong winds and/or interfering radio waves. Their limited battery capacity is also another
constraint that prevents long flights. As the result, the pilot needs to be deployed very
close to the target areas such as landslide sites and flooded areas, which may not be easily
accessible, and much care needs to be taken on the safety of the deployed team.
Fixed-wing UAVs fly along pre-programmed flight paths in an autonomous manner,
and do not allow the pilots to have control over where they go while flying. Since
fixed-wing UAVs have a longer flight range than multicopters, they can be operated from
safer areas that are not affected by disasters to acquire images of very remote and
inaccessible areas like a remote active volcano island more than 100km away from the
nearest land.
It is important to note that the technology associated with UAVs has been and will
be improving very rapidly and the current technical capabilities of UAVs may be quickly
outdated. NGIAs are encouraged to keep an eye on their technical development and make
necessary adjustments to their strategy of employing UAVs for their disaster risk
management activities.
In addition, many countries have different regulations on the use of UAVs, and
NGIAs need to study the latest regulations and always comply with them.
Column 5 The Use of Unmanned Aerial Vehicle (UAV) to Monitor the Flood and
Its Impact (Malaysia)
The 2014-year end downpour and floods has been the worst ever in the country’s history,
affecting more than half a million people. The video and aerial photo captured using UAV
have been used to provide information about the areas that were susceptible to the floods
and locations where people can be evacuated to. The data have been used for making post
flood damage assessments and identifying the facilities need to be repaired urgently such
as roads, bridges, water treatment plant, etc. (For details, please see Best Practice No.11
in Annex 2)
e) Hand-held devices
The capability of commercially available hand-held digital cameras, including their
spatial resolution, has evolved significantly during the last decade, and the high quality of
images taken by these cameras greatly assists NGIAs in quickly providing the latest
disaster situations including landslides and floods, when they are taken from aircrafts.
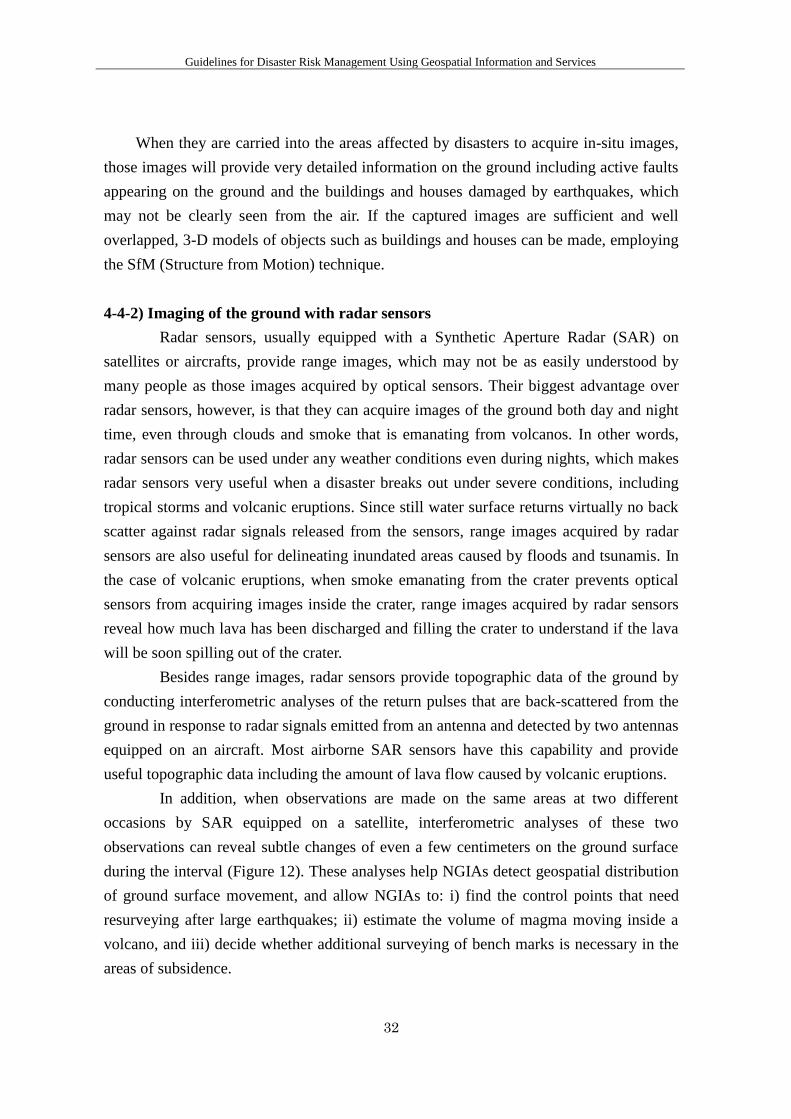
Guidelines for Disaster Risk Management Using Geospatial Information and Services
32
When they are carried into the areas affected by disasters to acquire in-situ images,
those images will provide very detailed information on the ground including active faults
appearing on the ground and the buildings and houses damaged by earthquakes, which
may not be clearly seen from the air. If the captured images are sufficient and well
overlapped, 3-D models of objects such as buildings and houses can be made, employing
the SfM (Structure from Motion) technique.
4-4-2) Imaging of the ground with radar sensors
Radar sensors, usually equipped with a Synthetic Aperture Radar (SAR) on
satellites or aircrafts, provide range images, which may not be as easily understood by
many people as those images acquired by optical sensors. Their biggest advantage over
radar sensors, however, is that they can acquire images of the ground both day and night
time, even through clouds and smoke that is emanating from volcanos. In other words,
radar sensors can be used under any weather conditions even during nights, which makes
radar sensors very useful when a disaster breaks out under severe conditions, including
tropical storms and volcanic eruptions. Since still water surface returns virtually no back
scatter against radar signals released from the sensors, range images acquired by radar
sensors are also useful for delineating inundated areas caused by floods and tsunamis. In
the case of volcanic eruptions, when smoke emanating from the crater prevents optical
sensors from acquiring images inside the crater, range images acquired by radar sensors
reveal how much lava has been discharged and filling the crater to understand if the lava
will be soon spilling out of the crater.
Besides range images, radar sensors provide topographic data of the ground by
conducting interferometric analyses of the return pulses that are back-scattered from the
ground in response to radar signals emitted from an antenna and detected by two antennas
equipped on an aircraft. Most airborne SAR sensors have this capability and provide
useful topographic data including the amount of lava flow caused by volcanic eruptions.
In addition, when observations are made on the same areas at two different
occasions by SAR equipped on a satellite, interferometric analyses of these two
observations can reveal subtle changes of even a few centimeters on the ground surface
during the interval (Figure 12). These analyses help NGIAs detect geospatial distribution
of ground surface movement, and allow NGIAs to: i) find the control points that need
resurveying after large earthquakes; ii) estimate the volume of magma moving inside a
volcano, and iii) decide whether additional surveying of bench marks is necessary in the
areas of subsidence.
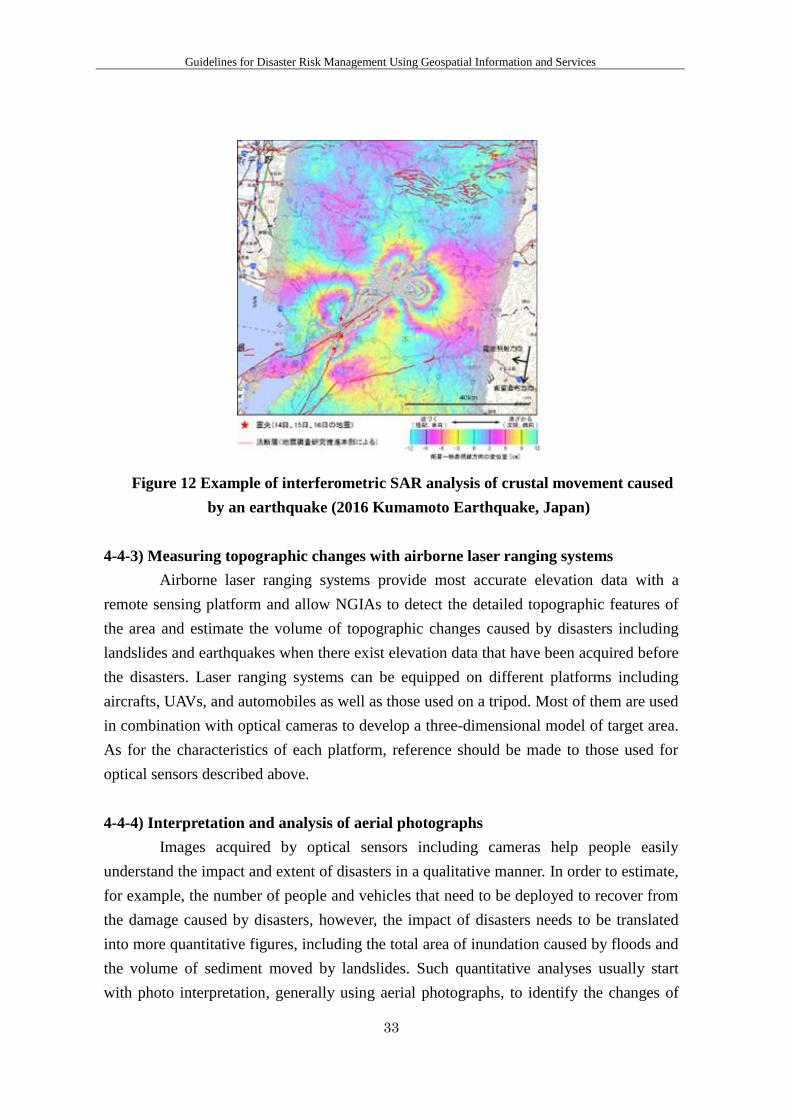
Guidelines for Disaster Risk Management Using Geospatial Information and Services
33
Figure 12 Example of interferometric SAR analysis of crustal movement caused
by an earthquake (2016 Kumamoto Earthquake, Japan)
4-4-3) Measuring topographic changes with airborne laser ranging systems
Airborne laser ranging systems provide most accurate elevation data with a
remote sensing platform and allow NGIAs to detect the detailed topographic features of
the area and estimate the volume of topographic changes caused by disasters including
landslides and earthquakes when there exist elevation data that have been acquired before
the disasters. Laser ranging systems can be equipped on different platforms including
aircrafts, UAVs, and automobiles as well as those used on a tripod. Most of them are used
in combination with optical cameras to develop a three-dimensional model of target area.
As for the characteristics of each platform, reference should be made to those used for
optical sensors described above.
4-4-4) Interpretation and analysis of aerial photographs
Images acquired by optical sensors including cameras help people easily
understand the impact and extent of disasters in a qualitative manner. In order to estimate,
for example, the number of people and vehicles that need to be deployed to recover from
the damage caused by disasters, however, the impact of disasters needs to be translated
into more quantitative figures, including the total area of inundation caused by floods and
the volume of sediment moved by landslides. Such quantitative analyses usually start
with photo interpretation, generally using aerial photographs, to identify the changes of
Guidelines for Disaster Risk Management Using Geospatial Information and Services
34
geospatial features and man-made structures caused by disasters. Since photo
interpretation still heavily relies on skilled photo interpreters who need to manually look
at images, the time required to complete the interpretation and analyses of all acquired
images depends on the number of skilled interpreters (Figure 13).
Figure 13 An example of airphoto interpretation (Left: ortho-rectified image; Right:
interpretation (red: landslides, blue: debris flows) for floods in July 2017 in
Fukuoka prefecture, Japan.)
4-4-5) Preparation of thematic maps describing disaster situation
Understanding the geospatial context of disaster affected areas is useful for
better response activities. Taking advantage of being specialized in cartography and
geography, the NGIA may prepare thematic maps that describe the geospatial context and
disaster damages (including predicted ones) to provide the geospatial perspective of the
affected area to relevant organizations and the general public. Besides paper maps, 3-D
landform models made by 3-D printer may help people understand the geospatial context.
The NGIA needs to keep assessing the geospatial needs of the stakeholders in order to
make valuable thematic maps at the appropriate timing.
Column 6 Rapid Mapping of Kelud Volcanic Mountain (Indonesia)
On February 13, 2014 Mount Kelud erupted. The Centre of Thematic Mapping and
Integration of Geospatial Information Agency (BIG), together with some institutions and
local governments, have provided the Disaster Susceptibility Map of Mount Kelud,
Evacuation Sites and Routes, and Ash Distribution of Mount Kelud. The above products
have been published on internet so that many people in Blitar and Kediri Regencies could
be saved. (For details, please see Best Practice No.6 in Annex 2)
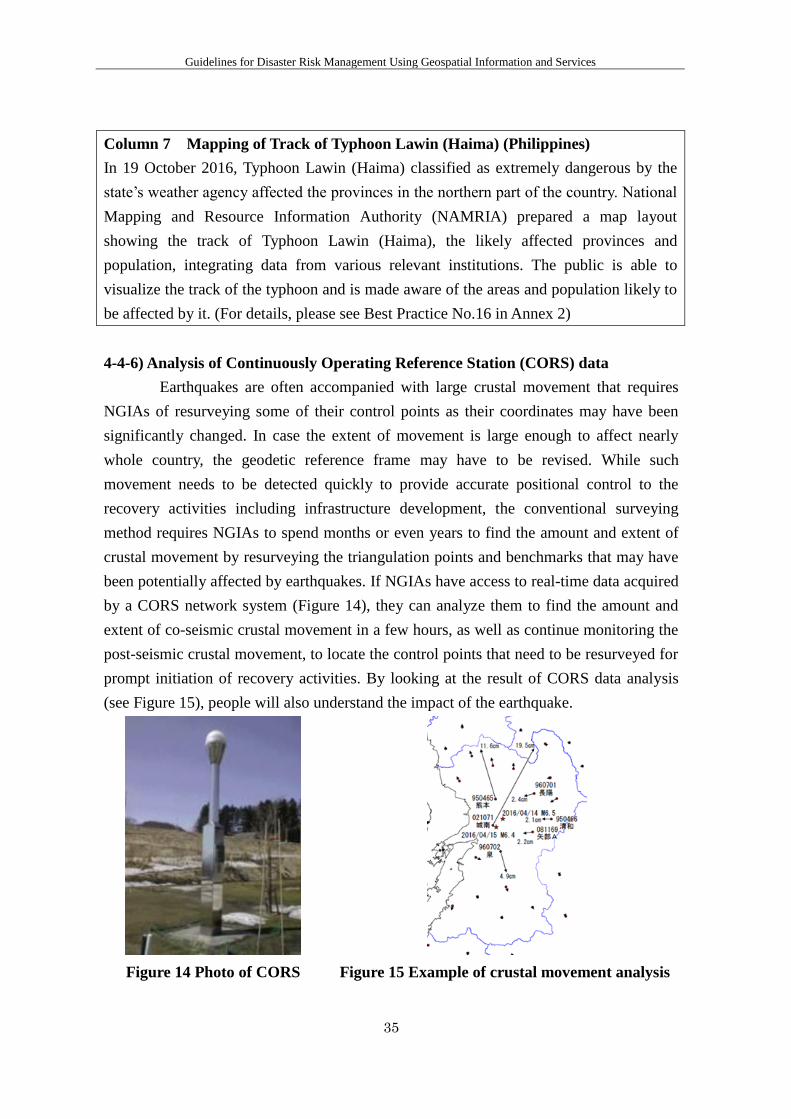
Guidelines for Disaster Risk Management Using Geospatial Information and Services
35
Column 7 Mapping of Track of Typhoon Lawin (Haima) (Philippines)
In 19 October 2016, Typhoon Lawin (Haima) classified as extremely dangerous by the
state’s weather agency affected the provinces in the northern part of the country. National
Mapping and Resource Information Authority (NAMRIA) prepared a map layout
showing the track of Typhoon Lawin (Haima), the likely affected provinces and
population, integrating data from various relevant institutions. The public is able to
visualize the track of the typhoon and is made aware of the areas and population likely to
be affected by it. (For details, please see Best Practice No.16 in Annex 2)
4-4-6) Analysis of Continuously Operating Reference Station (CORS) data
Earthquakes are often accompanied with large crustal movement that requires
NGIAs of resurveying some of their control points as their coordinates may have been
significantly changed. In case the extent of movement is large enough to affect nearly
whole country, the geodetic reference frame may have to be revised. While such
movement needs to be detected quickly to provide accurate positional control to the
recovery activities including infrastructure development, the conventional surveying
method requires NGIAs to spend months or even years to find the amount and extent of
crustal movement by resurveying the triangulation points and benchmarks that may have
been potentially affected by earthquakes. If NGIAs have access to real-time data acquired
by a CORS network system (Figure 14), they can analyze them to find the amount and
extent of co-seismic crustal movement in a few hours, as well as continue monitoring the
post-seismic crustal movement, to locate the control points that need to be resurveyed for
prompt initiation of recovery activities. By looking at the result of CORS data analysis
(see Figure 15), people will also understand the impact of the earthquake.
Figure 14 Photo of CORS Figure 15 Example of crustal movement analysis
Guidelines for Disaster Risk Management Using Geospatial Information and Services
36
4-5) Dissemination of geospatial information
Once the latest geospatial information on the disaster situations is collected and
analyzed, it needs to be promptly distributed to and shared with relevant organizations in
the Government and local authorities for their immediate applications of the data. The
same information, except the one that may need clearance from the Government, should
also disseminated to the general public including news media to facilitate their proper
understanding of the impact of the disaster. Otherwise, the efforts made by NGIAs during
the disaster may be considered only meaningful for future archives, not for disaster
response operations by other organizations.
Dissemination of geospatial information can take a number of different forms
and formats, including printed maps and digital map data stored in digital media. In order
to promptly provide disaster related information simultaneously to wider audience and
share the information with the stakeholders and the general public, however, a web
mapping system is the most useful platform. It also allows users to overlay different map
layers including risk information, ortho-rectified images, and results of photo
interpretation and interferometric SAR analyses.
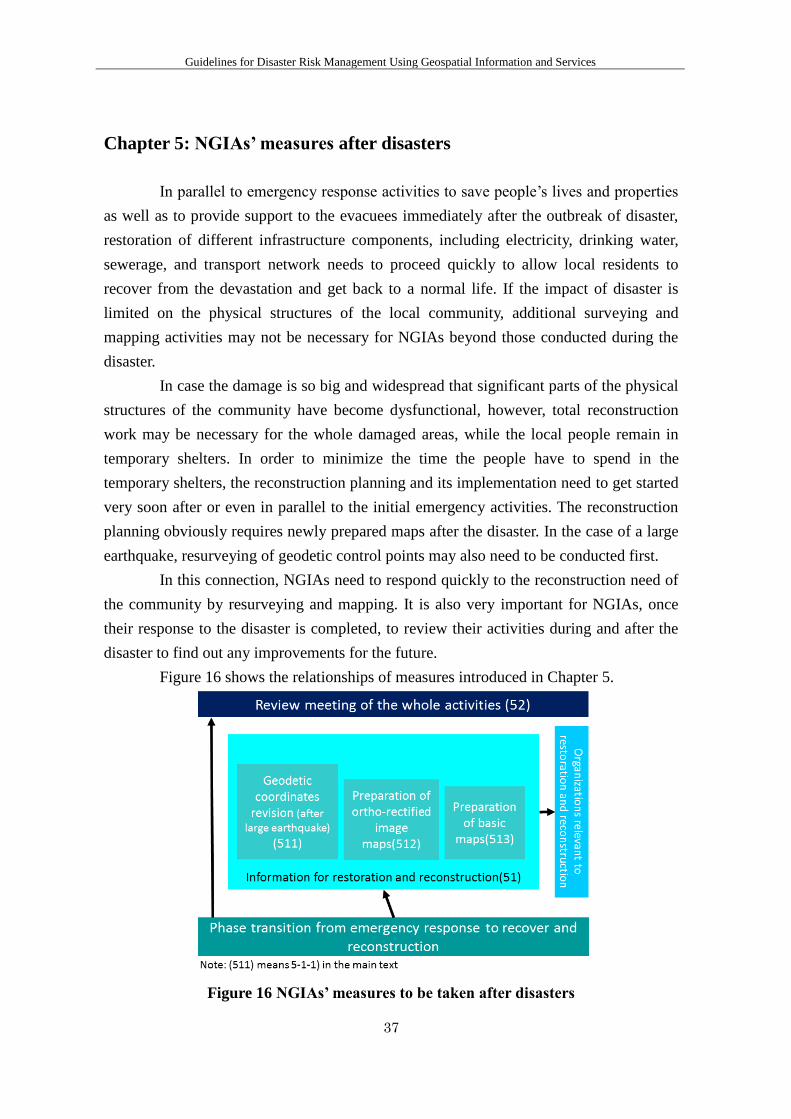
Guidelines for Disaster Risk Management Using Geospatial Information and Services
37
Chapter 5: NGIAs’ measures after disasters
In parallel to emergency response activities to save people’s lives and properties
as well as to provide support to the evacuees immediately after the outbreak of disaster,
restoration of different infrastructure components, including electricity, drinking water,
sewerage, and transport network needs to proceed quickly to allow local residents to
recover from the devastation and get back to a normal life. If the impact of disaster is
limited on the physical structures of the local community, additional surveying and
mapping activities may not be necessary for NGIAs beyond those conducted during the
disaster.
In case the damage is so big and widespread that significant parts of the physical
structures of the community have become dysfunctional, however, total reconstruction
work may be necessary for the whole damaged areas, while the local people remain in
temporary shelters. In order to minimize the time the people have to spend in the
temporary shelters, the reconstruction planning and its implementation need to get started
very soon after or even in parallel to the initial emergency activities. The reconstruction
planning obviously requires newly prepared maps after the disaster. In the case of a large
earthquake, resurveying of geodetic control points may also need to be conducted first.
In this connection, NGIAs need to respond quickly to the reconstruction need of
the community by resurveying and mapping. It is also very important for NGIAs, once
their response to the disaster is completed, to review their activities during and after the
disaster to find out any improvements for the future.
Figure 16 shows the relationships of measures introduced in Chapter 5.
Figure 16 NGIAs’ measures to be taken after disasters
Guidelines for Disaster Risk Management Using Geospatial Information and Services
38
5-1) Geospatial information for restoration and reconstruction
5-1-1) Revision of the coordinates of geodetic control points after large earthquakes
Large earthquakes are often accompanied by large crustal movement, which requires
NGIAs to revise the coordinates of geodetic control points and even the geodetic
reference frame. Since most reconstruction work starts with surveying for the
reconstruction planning of the damaged areas, resurveying of geodetic control points is
one of the earliest activities that need to be conducted after the disaster. The challenge the
NGIA face when a big earthquake hits the country, however, is that the amount and extent
of the crustal movement are not self-evident immediately after the earthquake until the
geodetic control points are resurveyed.
If the NGIA has access to the data of a CORS network system, it can identify the
amount of movement and the areas where geodetic control points need to resurveyed, and
decide on when the resurvey should be conducted by monitoring the post-seismic
movement with the CORS data. The result of the resurvey need to be widely informed to
the relevant organizations in the Government and the local community so that the
reconstruction plan is implemented based on the revised coordinates of geodetic control
points.
5-1-2) Preparation of ortho-rectified image maps of affected areas
Large-scale ortho-rectified image maps are useful for most people to understand the
latest situations of the areas damaged by the disaster (Figure 17). In addition, they are
prepared earlier than basic maps (or line maps) that require map compilation. It is also
important the once prepared, they are distributed quickly to the relevant organizations and
local governments to assist them in their reconstruction planning.
5-1-3) Preparation of basic maps of affected areas
Large-scale basic maps are useful for post-disaster city planning and extensive
reconstruction programs (Figure 18). For example, it will help city planners determine
where to relocate public facilities that had been located in high risk areas and discuss
countermeasures against potential disasters such as tsunamis and high tide water. NGIAs
can contribute to the implementation of “Build Back Better” policy mentioned in SFDRR
through the provision of basic maps for restoration and reconstruction.
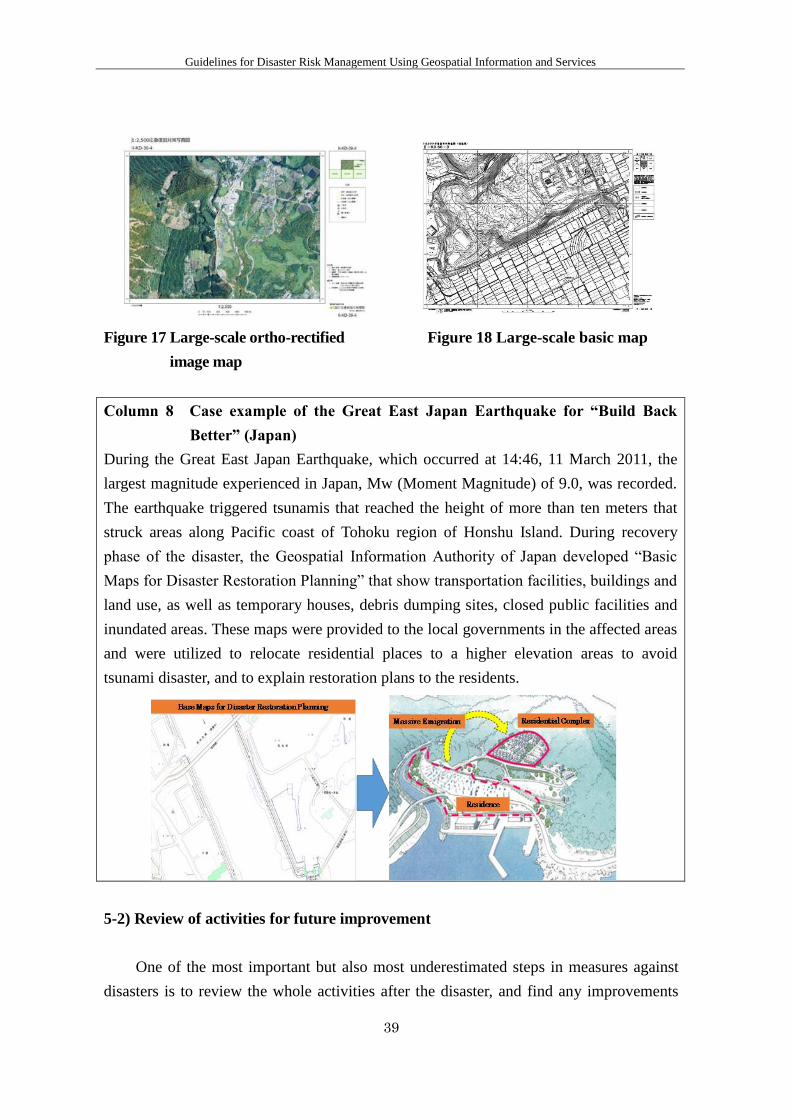
Guidelines for Disaster Risk Management Using Geospatial Information and Services
39
Figure 17 Large-scale ortho-rectified
image map
Figure 18 Large-scale basic map
Column 8 Case example of the Great East Japan Earthquake for “Build Back
Better” (Japan)
During the Great East Japan Earthquake, which occurred at 14:46, 11 March 2011, the
largest magnitude experienced in Japan, Mw (Moment Magnitude) of 9.0, was recorded.
The earthquake triggered tsunamis that reached the height of more than ten meters that
struck areas along Pacific coast of Tohoku region of Honshu Island. During recovery
phase of the disaster, the Geospatial Information Authority of Japan developed “Basic
Maps for Disaster Restoration Planning” that show transportation facilities, buildings and
land use, as well as temporary houses, debris dumping sites, closed public facilities and
inundated areas. These maps were provided to the local governments in the affected areas
and were utilized to relocate residential places to a higher elevation areas to avoid
tsunami disaster, and to explain restoration plans to the residents.
5-2) Review of activities for future improvement
One of the most important but also most underestimated steps in measures against
disasters is to review the whole activities after the disaster, and find any improvements
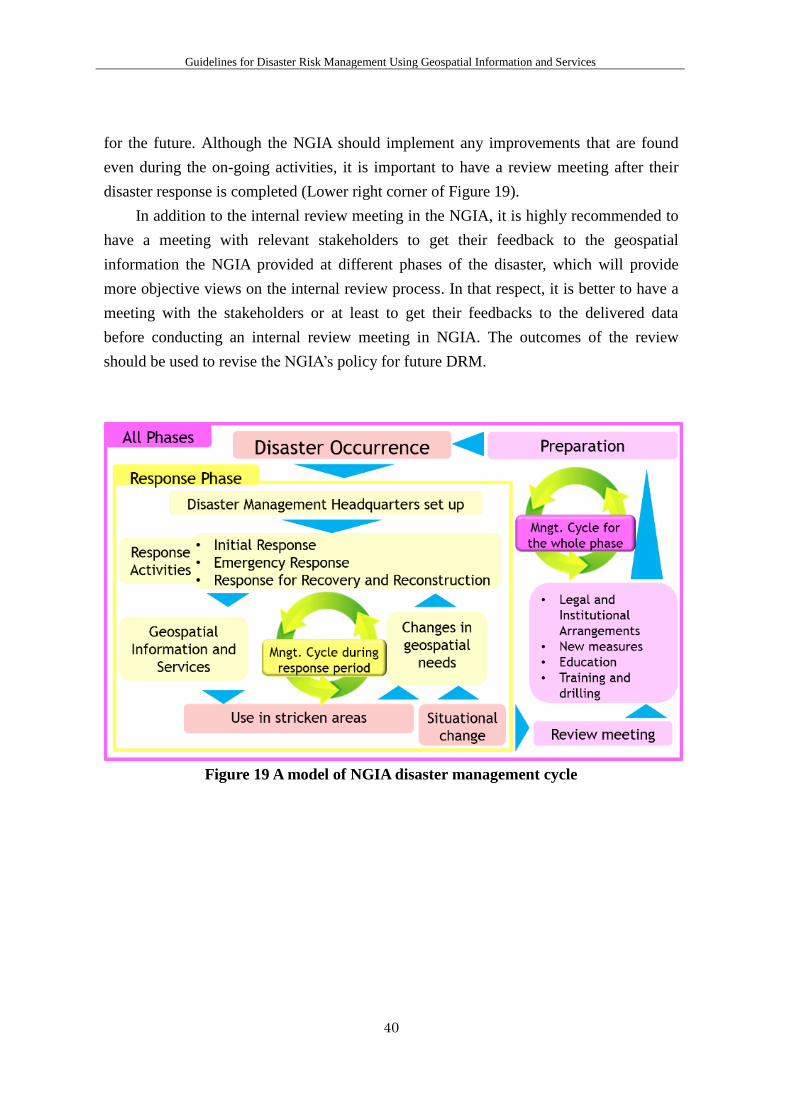
Guidelines for Disaster Risk Management Using Geospatial Information and Services
40
for the future. Although the NGIA should implement any improvements that are found
even during the on-going activities, it is important to have a review meeting after their
disaster response is completed (Lower right corner of Figure 19).
In addition to the internal review meeting in the NGIA, it is highly recommended to
have a meeting with relevant stakeholders to get their feedback to the geospatial
information the NGIA provided at different phases of the disaster, which will provide
more objective views on the internal review process. In that respect, it is better to have a
meeting with the stakeholders or at least to get their feedbacks to the delivered data
before conducting an internal review meeting in NGIA. The outcomes of the review
should be used to revise the NGIA’s policy for future DRM.
Figure 19 A model of NGIA disaster management cycle
Guidelines for Disaster Risk Management Using Geospatial Information and Services
41
References
ADRC (2015): Natural Disasters Data Book - 2016, Asian Disaster Reduction Center,
http://www.adrc.asia/publications/databook/DB2016_e.html. (Accessed July 2, 2018)
ECOSOC (2018): Draft resolution “Strategic Framework on Geospatial Information and
Services for Disasters”,
http://ggim.un.org/documents/English_N1819004.pdf (Accessed September 5, 2018)
ESCAP (2017): Sharing Space-based Information: Procedural Guidelines for Disaster
Emergency Response in ASEAN Countries, United Nations Economic and Social
Commission for Asia and the Pacific,
http://www.unescap.org/resources/sharing-space-based-information-procedural-guideline
s-disaster-emergency-response-asean. (Accessed July 2, 2018)
UN-GGIM-AP (2016): Knowledge Base, Regional Committee of United Nations Global
Geospatial Information Management for Asia and the Pacific,
http://www.un-ggim-ap.org/article/Information/knowledge/#Disaster%20Management
(Accessed July 2, 2018)
http://www.un-ggim-ap.org/article/Information/knowledge/#NGIAs'%20roles%20in%20s
uccessful%20disaster%20response (Accessed July 2, 2018)
UN-GGIM-AP (2016): Summary of the questionnaire results (Final report), Regional
Committee of United Nations Global Geospatial Information Management for Asia and
the Pacific,
http://un-ggim-ap.org/workinggroups/disaster/dblj/201612/P020161227366018769051.pd
f. (Accessed July 2, 2018)
UNISDR (2015): Sendai Framework for Disaster Risk Reduction 2015 – 2030, The
United Nations Office for Disaster Risk Reduction,
http://www.unisdr.org/files/43291_sendaiframeworkfordrren.pdf. (Accessed July 2, 2018)
Unites Nations (2015): Resolution adopted by the General Assembly on 3 June 2015, The
United Nations
http://www.un.org/en/ga/search/view_doc.asp?symbol=A/RES/69/283. (Accessed July 2,
2018)
WG-Disasters (2017): Strategic Framework on Geospatial Information and Services for
Disasters, Working Group on Geospatial Information and Services for Disasters
(WG-GISD), The United Nations Committee of Experts on Global Geospatial
Information Management, (UN-GGIM),

Guidelines for Disaster Risk Management Using Geospatial Information and Services
42
http://ggim.un.org/documents/UN-GGIM_Strategic_Framework_Disasters_final.pdf.
(Accessed July 2, 2018)
Annex1-1
Annex 1
List of UN-GGIM-AP WG2 Members (2015-2018)
Chair; Japan
Mr. Toru Nagayama
Director of Planning Division
Geospatial Information Authority of Japan
Vice-Chair; China
Dr. Tang Xinming
Deputy Director General
Satellite Surveying and Mapping Application Center, NASG
Vice-Chair; Indonesia
Mr. Adi Rusmanto
Centre for Standardization and Institutional Aspect of Geospatial Information
Geospatial Information Agency (BIG)
Vice-Chair; Mongolia
Mrs. Munkhtsetseg Dalkhaa
Senior specialist of Administration and Cooperation Department, ALAGaC
Vice-Chair; New Zealand
Mr. Rob Deakin
Chief Steward, National Spatial Data Infrastructure
New Zealand Geospatial Office
Vice-Chair; Iran
Mr. Peyman Baktash
Deputy Director General's office, Public Relations and International Affairs Department
National Cartographic Center (NCC) of Iran
Vice-Chair; Philippines
Mr. John SF Fabic
Director, Geospatial Information System Management Branch
National Mapping and Resource Information Authority
Annex 2
Final Report
Collection of Best Practices on the use of
geospatial information for disaster risk
reduction
UN-GGIM-AP WG2
October 2017
Regional Committee of United Nations Global Geospatial
Information Management for Asia and the Pacific
(UN-GGIM-AP)

Contents
1. Overview of the Best Practice survey 1
2. Key findings of the Best Practice cases 1
3. Conclusion
2
4. Summary list of Best Practices introduced 3
5. Best Practice cases
4
Annex2-1
1. Overview of the Best Practice survey
(1) A Best Practice survey was conducted as a part of UN-GGIM-AP
(United Nations Global Geospatial Information Management for Asia and
the Pacific)WG2 (Disaster Risk Management, hereinafter WG2) (2015-
2018)activities .
(2) NGIAs (National Geospatial Information Authorities) of Member States
of UN-GGIM-AP were requested to submit at least one best practice, in
conjunction with the questionnaire survey which was simultaneously
conducted by WG2. Best Practice cases were invited twice on December
2015 and February 2017 from Member States.
(3) As of October 2017, 18 Best Practice cases have been collected from ten
Member States.
2. Key findings of the Best Practice cases
(1) NGIAs in Asia Pacific region have already significantly committed to
disaster risk reduction through implementing various kinds of activities.
(2) Kinds of disasters addressed reflect each Member State’s
circumstances.
(3) Best practices mainly focus on responses during the occurrence of
disaster. On the other hand, a few practices focus on before the occurrence
of disaster or after the occurrence of disaster.
(4) Geospatial information produced and provided according to each
disaster phase is:
1) Before the occurrence of disaster: hazard maps or hazard-related
geospatial information provided to stakeholders and citizens to
enlighten disaster risk of a particular area. (No.2, 10, 13, 14)
2) During the occurrence of disaster: aerial photos, satellite imagery,
UAV images, topographic maps showing damage situation, evacuation
sitemap of victimised people, and geodetic data. (No. 1, 3, 4, 6, 7, 8, 9,
11, 12, 16, 17, 18)
3) After the occurrence of disaster: DEM data to consider relocation of
victimised people and topographical survey after landslides. (No.5, 15)
(5) Outcomes of the best practice reported are recognized as follows:
1) NGIAs’ data were used as a material for decision-making by
government organizations and decision makers. (No.1, 2, 3,4, 5, 7, 8,
11, 12, 15, 17, 18)

Annex2-2
2) Some cases indicated that data were provided to citizens and
residents via the internet to facilitate evacuation activities.(No.6, 9,
14, 16)
3) Promotion of geospatial information application, enlightenment and
capacity building of local governments were also reported.(No. 10, 13,
14)
4) A geospatial information catalogue for the provision in case of a
disaster to help stakeholder quickly request required information to the
NGIA. (No.10)
5) Provision of geospatial platforms (such as geoportal) enabling
stakeholder and people to view the situation spatially and to overlay
their particular information. (No.14)
(6) The future efforts mentioned are as follows:
1) Use of UAV which enables flexible and quick provision of information
during disaster. (No.2, 5, 11, 18)
2) Quick dissemination of geospatial products (No.3, 11)
3) Development of geospatial information about the people vulnerable to
disasters. (No.4)
4) Enrichment of data in coordination with other organizations (No. 6,
16)
5) Densification of CORS network (No.12, 17)
3. Conclusion
A variety of examples of Best Practices suggest that the collection be a
valuable material for NGIAs in Asia and the Pacific to learn how to take a
better action for Disaster Risk Reduction effectively.

Annex2-3
4. Summary list of Best Practices introduced
No. Member state Disaster
Type Information and Service
Title Activity Contents Page
1 Australia: Geoscience
Australia(GA) Overall disaster
Location data
Real Time Crisis Response Mapping
for Government Officials
Provided by Geoscience Australia to Government Emergency Crisis Coordination Centre and used by the government as a material for decision-making during disasters .
4
2 Bangladesh: Survey of
Bangladesh(SOB)
Typhoon, Cyclone,
Earthquake, etc.
Thematic map
Use of Geospatial information for
DRR in Asia and the Pacific Region
Provided by Survey of Bangladesh to government organizations, and by integrating and sharing geospatial information in the government, contributed to mitigating disaster risks and saving of resources.
5
3
China: Satellite Surveying and Mapping
Application Center (SASMAC)
Earthquake Geospatial information
Earthquake Used for emergency response during disasters. 6
4 Fiji: National Disaster Management Office
Typhoon, Flood
Geospatial information
Used for emergency response during disasters. 7
5
Hong Kong Special Administrative Region
(HKSAR): Lands Department
Landslide Location data Contingency Plan
for Natural Disasters
Provided by the system of the website and used to identify the location at the occurrence of landslides and for recovery activities after the occurrence.
8
6 Indonesia: Geospatial
Information Agency(BIG)
Volcano Topographic
map Rapid Mapping of Kelud Mountain
By releasing evacuation routes and distribution of volcanic ash on the topographic map on the Internet, provided the people living around the volcano with a material to make decision for evacuation.
9
7 Japan: Geospatial
Information Authority of Japan(GSI)
Flood Aerial photo,
Inundated area map
Floods as a Result of Heavy Rain
Swiftly disclosing the disaster situation that specifies the inundation range on the Internet, contributed to initial restoration operations (placement of police, the numbers of pumper trucks and workers, placement positions and determining work hours). Government and media used the data provided by GSI as trustworthy official information for disaster response and for news coverage.
10
8 Japan: Geospatial
Information Authority of Japan(GSI)
Tsunami Aerial photo,
Inundated area map
2011 Great East Japan Earthquake
Immediately after the disaster, GSI created figures to provide related organizations with the general situation of the inundation range, conducted emergency shoots of aerial photograph, and these resources were utilized in a wide range of fields, such as making the base map for disaster recovery planning. All of them are released on the Internet.
12
9 Japan: Geospatial
Information Authority of Japan(GSI)
Overall Disaster
Thematic map
Evacuation Center Map for 2016
Kumamoto Earthquake Response
Creating Evacuation Center Map enabled on-site disaster response headquarters to understand information on evacuation centers and to support activities like providing supply goods to evacuation centers.
14
10 Japan: Geospatial
Information Authority of Japan(GSI)
Overall Disaster
Creation of Disaster
Geoinformation Catalog
Creation of Disaster Geoinformation
Catalog
The national and local governments referred to the Catalog and understood what type of geospatial information GSI developed and owned. This preparation helped GSI meet their requests rapidly.
16
11 Malaysia: Department of
Survey and Mapping Malaysia (DSMM)
Flood Video by UAV
The Use of Unmanned Aerial Vehicle (UAV) to Monitor the Flood and Its Impact in
Malaysia
Used to identify flooded areas and evacuation sites with video and aerial photo captured by UAVs. After the disaster, used to identify facilities for recovery of various infrastructures.
18
12 Malaysia: Department of
Survey and Mapping Malaysia (DSMM)
Earthquake GNSS data Earthquake Struck Ranau in Sabah,
Malaysia
By analyzing GNSS data before and after earthquakes and releasing them on the early warning system of earthquake, contributed to the citizen for an early planning.
19
13
Philippines: National Mapping and Resource Information Authority
(NAMRIA)
Hydromet* and Seismic**
Hazard map
Multi-Hazard Mapping of 28
Priority Provinces and the Greater
Metro Manila Area
By providing local government organizations with hazard maps on the Internet, used as a material for decision-making of the area at the time of disasters.
20
14
Philippines: National Mapping and Resource Information Authority
(NAMRIA)
Hydromet and Seismic
Hazard map The Philippine
Geoportal By providing hazard maps on the Internet, contributed to the citizen in visually identifying risk areas. 21
15
Philippines: National Mapping and Resource Information Authority
(NAMRIA)
Typhoon
Digital topographic map
data, Ortho image
Recovery and Rehabilitation after
Typhoon Haiyan
Used by the government to determine the status of disaster-affected areas and to identify safe and risk zones. 22
16
Philippines: National Mapping and Resource Information Authority
(NAMRIA)
Typhoon Hazard map
Mapping of Track of Typhoon Lawin
(International Name: Haima) and Affected Areas and
Population
The track of the typhoon was visualized by obtaining information from meteorological and statistical organizations and creating and releasing a map layout which showed the track. Through this effort, residents in the area at high risk for the typhoon were able to prepare.
23
17
Philippines: National Mapping and Resource Information Authority
(NAMRIA)
Earthquake GNSS data
Philippine Active Geodetic Network
(PageNet) – Surigao Earthquake
GNSS enabled to acquire data of crustal displacement before and after the earthquake. Collaboration of observation system with other organization was achieved by continuous observation.
25
18 Sri Lanka: Survey
Department Tsunami
Digital topographic map
data
Expressing disaster-prone areas on the topographic map can make swift relief operations. 29
*Hydromet: flood, storm surge, rain-induced landslide, **Seismic: ground rupture, ground shaking, tsunami, earthquake-induced landslide, liquefaction

Annex2-4
5. Best Practice cases
No.1
Country Australia
Organization Geoscience Australia(GA)
Title Real Time Crisis Response Mapping for Government Officials
Outline of the
subject
natural
disaster
Spatially enabling federal government to enhance decision making.
Response
Geoscience Australia is supporting the Attorney-General’s
Department’s - Australian Government Crisis Coordination Centre
- establish a spatial mapping capability as part of its crisis centre.
Geoscience Australia also integrates fundamental and synthesised
spatial data with statistical information for a given area of interest
to estimate exposure. This information is provided in report form on
request to the Australian Government Crisis Coordination Centre.
Effect
The collaboration between GA and AGD is supporting the ability of
executive decision makers in government to make informed
decisions on the coordination of the Australian Government’s
response to domestic disaster events, using location based data.
Future Continuous development and improvement of the capability
supporting a joint mission across agencies.

Annex2-5
No.2
Country Bangladesh
Organization Survey of Bangladesh(SOB)
Title Use of Geospatial information for DRR in Asia and the Pacific
region
Outline of the
subject
natural
disaster
Floods, Storm surge, Drought, Tornedo, Landslide and Cyclone are
the main disaster. Beside these, country is in the risk of
Earthquake and Sea Level Rise.
Response
Survey of Bangladesh is preparing thematic maps for the whole
Bangladesh. Thematic maps will help the country to prepare an
integrated, comprehensive and coordinated plan which is already
underway.
Effect
By supplying geospatial information to the relevant agencies, the
Government will be able to mitigate the natural disaster and can
save our valuable resources.
Future
Our organization is planning to use UAV for capturing aerial
photographs and making available live high resolution satellite
images just after the disaster to prepare an integrated,
comprehensive and coordinated post disaster plan.

Annex2-6
No.3
Country China
Organization Satellite Surveying and Mapping Application Center (SASMAC)
Title Earthquake
Outline of the
subject
natural
disaster
In China, earthquakes happen quite often, In almost all
earthquakes, SBSM provides the maps after earthquakes including
previous, in situ, and after maps
Response The response of emergency mechanism of government
Effect good
Future Accelerate the speed of response including all kinds of disasters
such as storm, flooding. etc
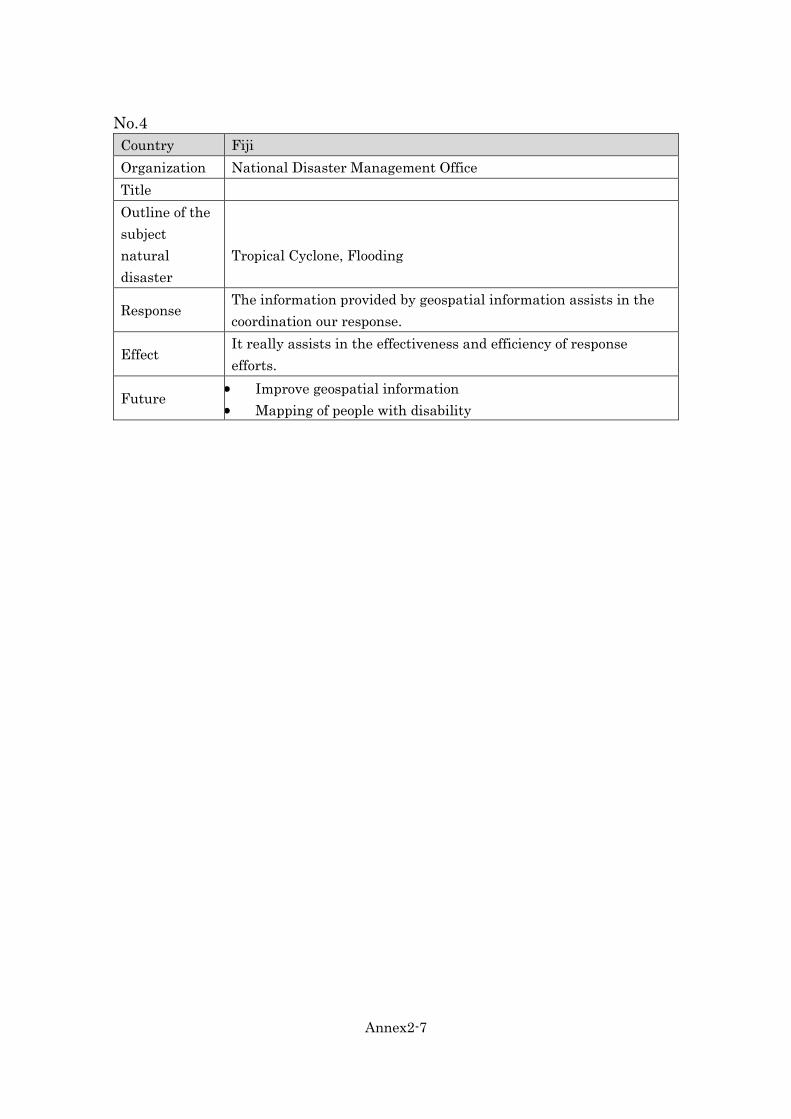
Annex2-7
No.4
Country Fiji
Organization National Disaster Management Office
Title
Outline of the
subject
natural
disaster
Tropical Cyclone, Flooding
Response The information provided by geospatial information assists in the
coordination our response.
Effect It really assists in the effectiveness and efficiency of response
efforts.
Future Improve geospatial information
Mapping of people with disability
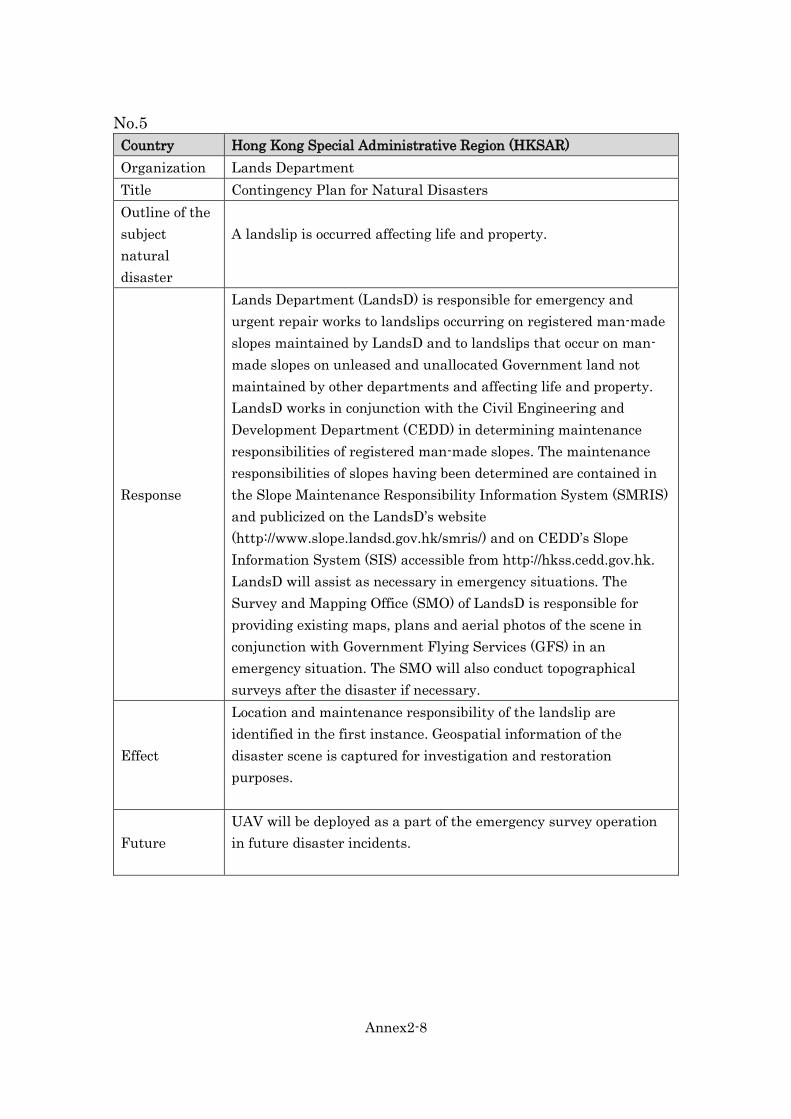
Annex2-8
No.5
Country Hong Kong Special Administrative Region (HKSAR)
Organization Lands Department
Title Contingency Plan for Natural Disasters
Outline of the
subject
natural
disaster
A landslip is occurred affecting life and property.
Response
Lands Department (LandsD) is responsible for emergency and
urgent repair works to landslips occurring on registered man-made
slopes maintained by LandsD and to landslips that occur on man-
made slopes on unleased and unallocated Government land not
maintained by other departments and affecting life and property.
LandsD works in conjunction with the Civil Engineering and
Development Department (CEDD) in determining maintenance
responsibilities of registered man-made slopes. The maintenance
responsibilities of slopes having been determined are contained in
the Slope Maintenance Responsibility Information System (SMRIS)
and publicized on the LandsD’s website
(http://www.slope.landsd.gov.hk/smris/) and on CEDD’s Slope
Information System (SIS) accessible from http://hkss.cedd.gov.hk.
LandsD will assist as necessary in emergency situations. The
Survey and Mapping Office (SMO) of LandsD is responsible for
providing existing maps, plans and aerial photos of the scene in
conjunction with Government Flying Services (GFS) in an
emergency situation. The SMO will also conduct topographical
surveys after the disaster if necessary.
Effect
Location and maintenance responsibility of the landslip are
identified in the first instance. Geospatial information of the
disaster scene is captured for investigation and restoration
purposes.
Future
UAV will be deployed as a part of the emergency survey operation
in future disaster incidents.
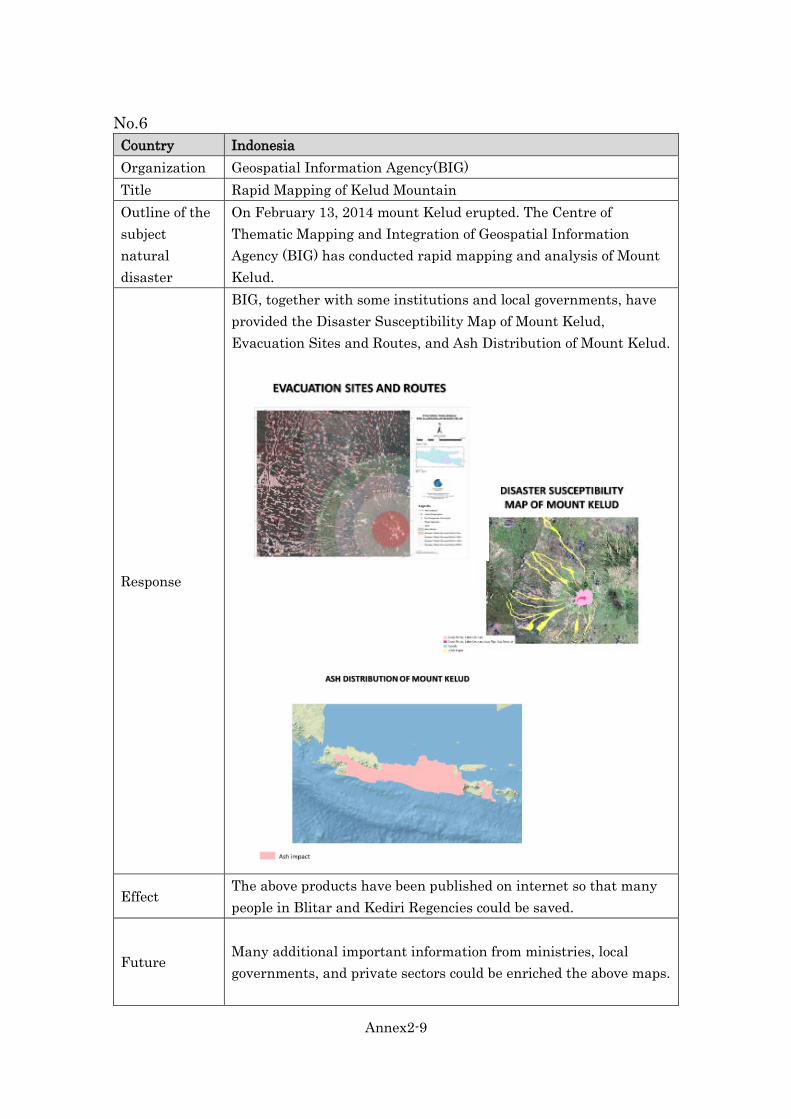
Annex2-9
No.6
Country Indonesia
Organization Geospatial Information Agency(BIG)
Title Rapid Mapping of Kelud Mountain
Outline of the
subject
natural
disaster
On February 13, 2014 mount Kelud erupted. The Centre of
Thematic Mapping and Integration of Geospatial Information
Agency (BIG) has conducted rapid mapping and analysis of Mount
Kelud.
Response
BIG, together with some institutions and local governments, have
provided the Disaster Susceptibility Map of Mount Kelud,
Evacuation Sites and Routes, and Ash Distribution of Mount Kelud.
Effect The above products have been published on internet so that many
people in Blitar and Kediri Regencies could be saved.
Future
Many additional important information from ministries, local
governments, and private sectors could be enriched the above maps.

Annex2-10
No.7
Country Japan
Organization Geospatial Information Authority of Japan (GSI)
Title Floods as a Result of Heavy Rain
Outline of the
subject
natural
disaster
Due to the heavy rainfall from September 9 to 11 in 2015, the
collapsing of levees, overtopping and leakage, inundation and the
fracturing/breaking of levee slopes occurred in over 80 rivers.
Immense damage was brought about as a result of this, including the
loss of lives, injuries, and many incidents of houses being swept
away and above the floor level inundation.
Response
Relief work and restoration activities were enforced in cooperation
with related organizations after overtopping and damage occurred at
the rivers. Specifically, aerial photos after the disaster were
photographed, and photos before and after the disaster were
provided to the government and disaster-stricken municipalities,
while information was provided extensively to the nation on our
homepage.
By measuring the inundated area using photographic
interpretations, the disaster effects and restoration situation after
the disaster were monitored. Measurements of the inundated areas
were updated daily and reported to the government until the
inundated areas became small enough that drainage pump cars were
no longer required.

Annex2-11
Effect
Swiftly disclosing the disaster situation that specifies the inundation
range, contributed to initial restoration operations (placement of
police, the numbers of pumper trucks and workers, placement
positions and determining work hours).
As well, the government and media utilized the data provided by GSI
as trustworthy official information in their disaster response and
news coverage, reaffirming the significance of GSI.
Future
It was possible to provide timely information to the government, as
the government’s needs were understood through frequent
interactions with various government posts on a regular basis. In
other words, it is important that the required needs for policy
making are grasped.
Furthermore, disaster simulations (hazard maps) of these rivers
where levees broke had been released to the public until now.
However, because a sense of danger was not clearly communicated to
residents, it may also be believed that it didn’t lead to their swift
evacuations. It is important to also raise the awareness of residents
towards disaster prevention.

Annex2-12
No.8
Country Japan
Organization Geospatial Information Authority of Japan (GSI)
Title 2011 Great East Japan Earthquake
Outline of the
subject
natural
disaster
The Great East Japan Earthquake that occurred at 14:46 on March
11 2011 with the largest Mw (moment magnitude) of 9.0 ever
recorded in Japan, caused strong earthquake motions with an
intensity over lower 6 on the Japanese scale of 7 in a wide area
spanning eight prefectures from Iwate Prefecture to Chiba
Prefecture, and triggered a powerful tsunami over 10-meters in
height that hit the Pacific side of Japan’s Tohoku region, destroying
an area of 561km2 with its massive force, followed by an accident at
the Tokyo Electric Power Company Fukushima Daiichi Nuclear
Power Plant and resulting massive evacuation efforts, making it the
most massive and multiple catastrophe our nation has ever
experienced.
Response
Immediately after the disaster, Geospatial Information Authority of
Japan created figures of the general situation of the inundation
range, conducted emergency shoots of aerial photograph to provide to
related organizations, and these resources were utilized in a wide
range of fields. Specifically, figures of the general situation of the
tsunami inundation and aerial photos were used for the creation of
radiation dosimetry maps, the issuing duties of disaster victim
certificates, and explanatory manuals for volunteer activities etc.
Apart from these, the disaster recovery plan base map, provided by
Geospatial Information Authority of Japan, was also utilized.
[Radiation dosimetry map (estimate)]
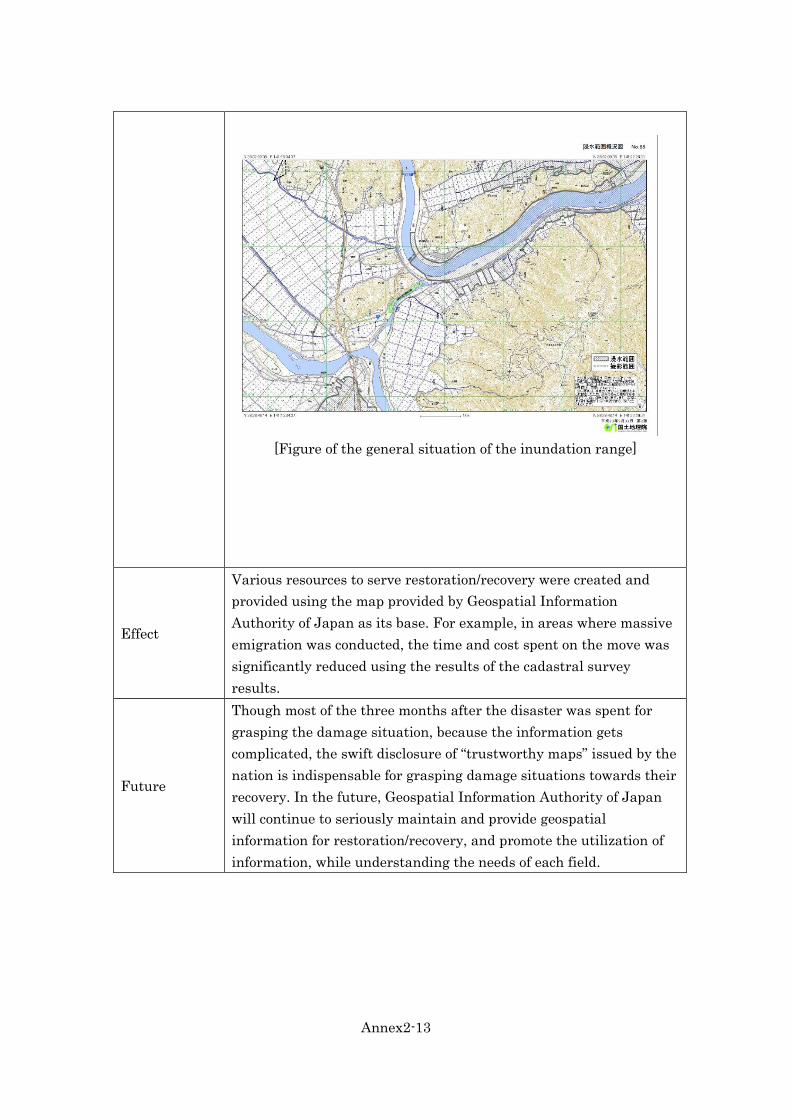
Annex2-13
[Figure of the general situation of the inundation range]
Effect
Various resources to serve restoration/recovery were created and
provided using the map provided by Geospatial Information
Authority of Japan as its base. For example, in areas where massive
emigration was conducted, the time and cost spent on the move was
significantly reduced using the results of the cadastral survey
results.
Future
Though most of the three months after the disaster was spent for
grasping the damage situation, because the information gets
complicated, the swift disclosure of “trustworthy maps” issued by the
nation is indispensable for grasping damage situations towards their
recovery. In the future, Geospatial Information Authority of Japan
will continue to seriously maintain and provide geospatial
information for restoration/recovery, and promote the utilization of
information, while understanding the needs of each field.

Annex2-14
No.9
Country Japan
Organization Geospatial Information Authority of Japan(GIS)
Title Evacuation Center Map for 2016 Kumamoto Earthquake Response
Outline of the
subject natural
disaster
A Mw 6.2 earthquake occurred in Kumamoto district in southern Japan on April 14, 2016 at 21:26 (pre-
shock). Subsequently, a Mw 7.0 earthquake occurred on April 16 (main shock) at 1:25. These earthquakes are
referred to as “The 2016 Kumamoto Earthquake.” The earthquake left 98 people dead, 830 severely injured
and 1,491 slightly injured, as well as 8,198 buildings totally collapsed, 29,761 half-collapsed and 138,102
partially damaged. The earthquake hit Kumamoto city with the population of 730 thousand and its suburban
municipalities, causing 180 thousand people to be evacuated at peak period.
Response
・Affected people who took precautions against possible aftershocks and people whose houses were totally
collapsed took shelter in evacuation centers. As a result, the number of evacuees far exceeded the capacity of
evacuation centers. Additionally, some evacuation centers themselves were too damaged to use. Because of
these, many people had to stay and sleep outside or in their own car.
・On April 17, the following day of the main shock, evacuees' living conditions became worse and their fatigue
peaked due to rain and disruption of relief goods supply. However, the on-site disaster response headquarters,
set up by the national government, did not have enough information about the location of the evacuation centers
and the number of evacuees, which made the relief goods supply extremely difficult.
・Thus, the next day, on April 18, head of the on-site disaster response headquarters directed Geospatial
Information Authority of Japan (GSI) to create a distribution map which showed the locations of the evacuation
centers. In response, GSI mobilized disaster response staff, organized and compiled on-site information and
existing materials, and created Evacuation Center Map (Figure 1).
On April 20, GSI completed and provided the first map for the on-site disaster response headquarters.
Effects
Evacuation Center Map significantly contributed to the on-site disaster response headquarters for accessing
evacuation centers and for assisting in relief supply. Since evacuation centers were re-organized and closed
according to the change of number of evacuees, GSI had updated the map once a week for four months since
the earthquake, until August 2016. The map played an important role in the operation and environmental
management of the evacuation centers.
Future
The Basic Act on Disaster Control Measures of Japan (revised in 2013) stipulates that mayors of
municipalities designate the emergency evacuation areas*1 and evacuation centers *2. Public facilities such as
schools are often designated as such evacuation facilities. Since designation of the facilities is subject to
change as appropriate, their location information needs to be updated on a regular basis. GSI prepared the
location information of emergency evacuation areas by establishing a framework of cooperation with Cabinet
Office and Fire and Disaster Management Agency, as well as collaborating with prefectures, municipalities
and the like. The location information of emergency evacuation areas became publicly available on GSI web
map in February 2017, and GSI will continue to update the information (Figure 2).
*1 Emergency evacuation area: A place to evacuate residents and other people at immediate risk caused by tsunami,
flood or other disasters, in order to secure safety of their lives
*2 Evacuation center: Facilities to accommodate residents and other people who have escaped from disaster up until
there is no further disaster risk, or to temporally accommodate those who cannot return home due to disaster.
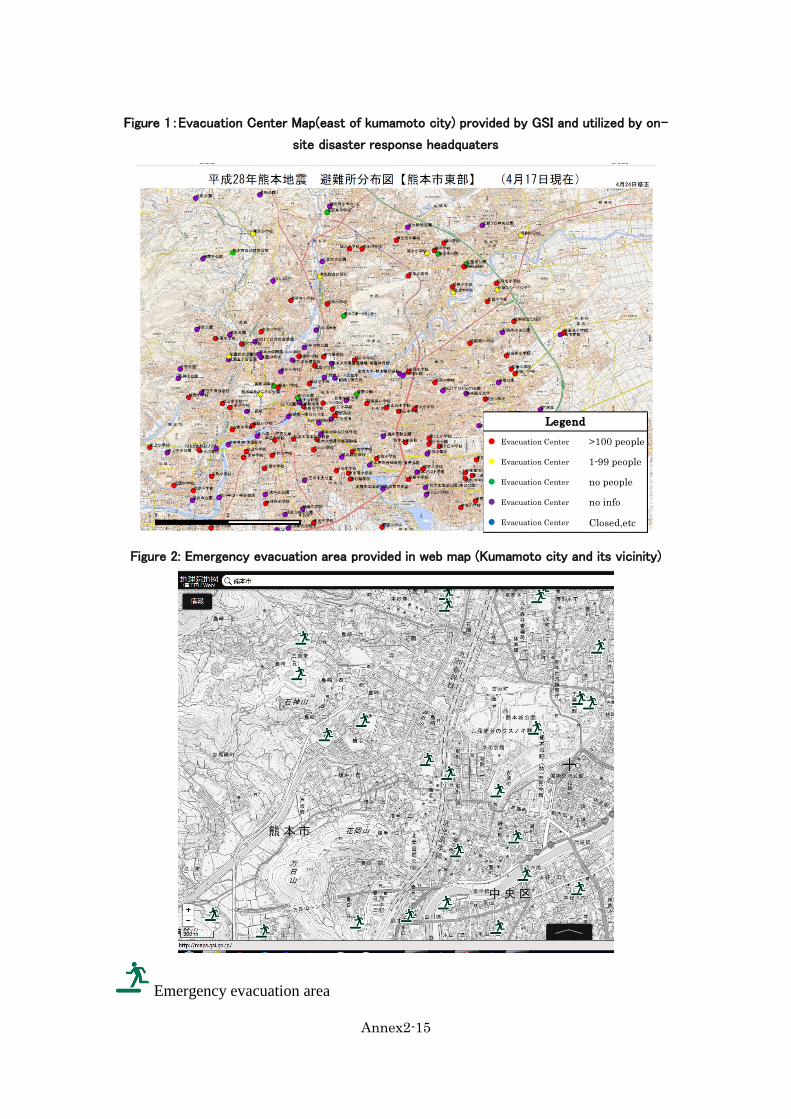
Annex2-15
Figure 1:Evacuation Center Map(east of kumamoto city) provided by GSI and utilized by on-
site disaster response headquaters
Figure 2: Emergency evacuation area provided in web map (Kumamoto city and its vicinity)
Emergency evacuation area
PPP PSU
PTG
● Evacuation Center >100 people
● Evacuation Center 1-99 people
● Evacuation Center no people
● Evacuation Center no info
● Evacuation Center Closed,etc
Legend
Annex2-16
No.10
Country Japan
Organization Geospatial Information Authority of Japan(GIS)
Title Creation of Disaster Geoinformation Catalog
Outline of
the response
to natural
disaster
Geospatial Information Authority of Japan (GSI) compiles and provides
a catalog of disaster geoinformation, including type of geospatial
information as well as timing of provision and data format, featured as
"Disaster Geoinformation Catalog." This catalog aims at facilitating
national and Local governments effectively utilizing disaster
geoinformation provided by GSI.
Response
Japan experienced various natural disasters such as earthquakes,
volcanic eruptions and floods. During these disasters, the national and
local governments referred to the Catalog and requested GSI to
provide geospatial information according to their particular needs for
disaster response.
Effects
The national and local governments referred to the Catalog and
understood what type of geospatial information GSI developed and
owned. This preparation helped GSI meet their requests rapidly.
Future
Since the geospatial information developed and owned by GSI are
expected to become more varied and wide-ranging, GSI intends to
update the Catalog regularly and provide it for the related
organizations.
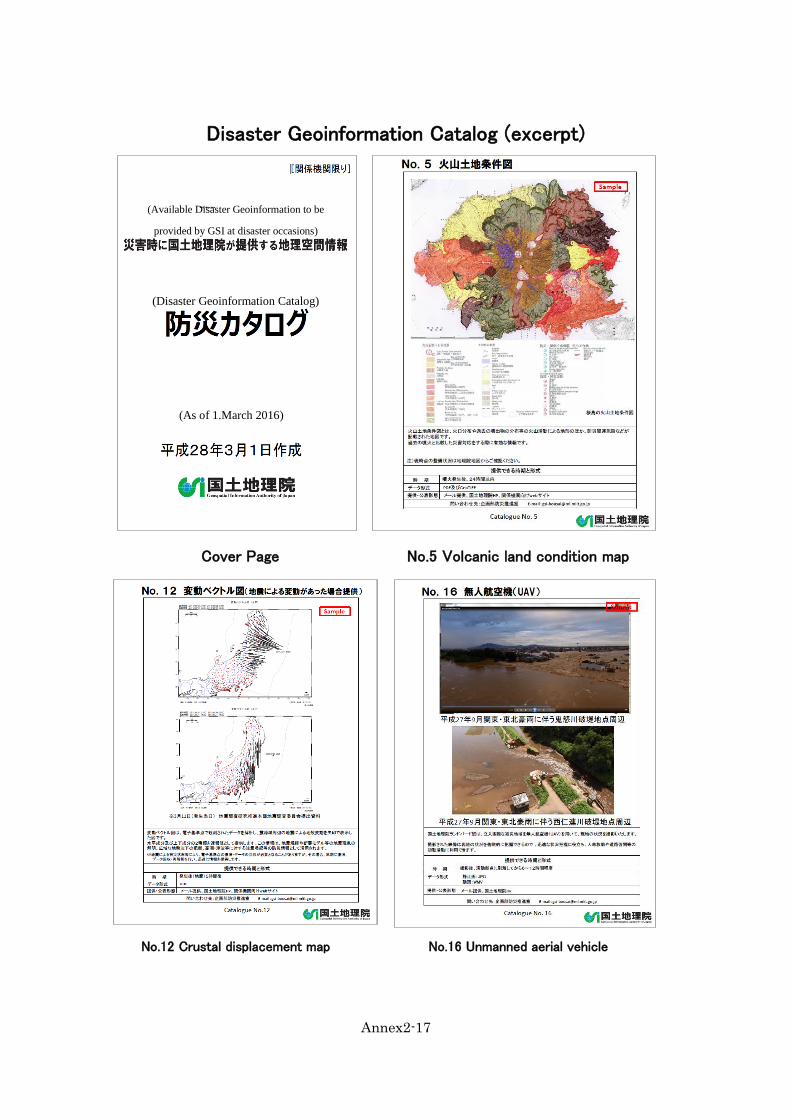
Annex2-17
Disaster Geoinformation Catalog (excerpt)
Cover Page No.5 Volcanic land condition map
No.12 Crustal displacement map No.16 Unmanned aerial vehicle
PPP PSU
PTG
(Disaster Geoinformation Catalog)
(As of 1.March 2016)
(Available Disaster Geoinformation to be
provided by GSI at disaster occasions)

Annex2-18
No.11
Country Malaysia
Organization Department of Survey and Mapping Malaysia (DSMM)
Title The Use of Unmanned Aerial Vehicle (UAV) to Monitor the Flood
and Its Impact in Malaysia
Outline of the
subject
natural
disaster
Floods are the major natural disaster threat facing Malaysia. The
2014-year end downpour and floods has been the worst ever in the
country’s history, affecting more than half a million people. Damage
to infrastructure alone was estimated RM2.851 billion. Areas that
have never experienced floods before were also inundated and
floodwater rose at an unprecedented level.
Response
The video and aerial photo captured using UAV have been used to
provide information about the areas that were susceptible to the
floods and locations where people can be evacuated to. The data
have been used for making post flood damage assessments and
identifying the facilities need to be repaired urgently such as roads,
bridges, water treatment plant, etc.
Effect
The process to search and rescue flood victims were expedited by
using the UAV data. Besides that the refurbishment and
reconstruction of damaged facilities were expedited to ease the
transportation links in moving people and goods to the affected
area. The use of UAV also has saved the operational cost due to its
flexibility and cheap flying operation with less constraint on time
and human resources.
Future
To provide UAV data during and after disaster for relief and
recovery purposes particularly on the remote area.
Efficient dissemination of information
Annex2-19
No.12
Country Malaysia
Organization Department of Survey and Mapping Malaysia (DSMM)
Title Earthquake Struck Ranau in Sabah, Malaysia
Outline of the
subject
natural
disaster
A magnitude 5.9 earthquake struck near Mount Kinabalu killing 18
and stranding more than a hundred people on the peak. The quake
damaged roads and buildings, including schools and a hospital on
Sabah’s west coast. Geospatial information also plays a big role to
monitor the crustal and surface motion by using Continuously
Operating Reference Station (CORS) data.
Response
The earthquake that occurred in Ranau on 5th June 2015 which is
near to Mount Kinabalu had caused massive landslides around the
mountain and nearby area as well. The data before and after
earthquake from CORS stations (MyRTKnet) and 11 GNSS
monuments were analysed and has indicated the surface motion on
the area is between 36 to 53 cm. The output reflected the benefit to
monitor the progress of motion so that the early warning for
earthquake can be disseminated to alert the surrounding people.
Effect
The data from CORS stations (MyRTKnet) and 11 GNSS
monuments has contributed significant information for an early
warning system for earthquake in order to expedite the necessary
evacuation of people from the hazard area. Also important in the
following cases:
Overall picture and extent of damage caused
Indication of ground displacement
Planning and distribution of aids
Future To densify the CORS stations (MyRTKnet) throughout the country
Annex2-20
No.13
Country Republic of the Philippines
Organization National Mapping and Resource Information Authority (NAMRIA)
Title Multi-Hazard Mapping of 28 Priority Provinces and the Greater
Metro Manila Area
Outline of the
subject natural
disaster
The Philippines is consistently visited by tropical disturbances
exposing communities to hydrometeorological hazards such as
strong winds, storm surge floods/flashfloods, and rain-induced
landslides. The country, being located in the Pacific ring of fire, is
likewise exposed to seismological hazards such as ground shaking,
ground rupture, earthquake-induced landslide, and liquefaction.
Aiming to have a safer and disaster resilient communities, multi-
hazard mapping of the 28 high risk provinces was implemented to
map out areas exposed to natural hazards. The output of this
activity will facilitate evidence-based decision-making by local and
national authorities.
Response The Agency provided base maps, capacitated LGUs on the use of
GIS technology, engaged technical staff in the integration of
hazard maps for use by the local government units and national
government agencies, and participated in the conduct of
information and education campaign (IEC) in the communities
primarily exposed to hazards.
Effect 1. Raised awareness on the impending hazards confronting the
exposed communities in the provinces.
2. Hazard maps are increasingly used in the formulation of land
use and physical development plans.
3. Hazard maps used in the formulation of local DRRM plans.
4. Increasing number of LGUs expressing interest in the use of
GIS for DRRM
Future
Annex2-21
No.14
Country Republic of the Philippines
Organization National Mapping and Resource Information Authority (NAMRIA)
Title The Philippine Geoportal
Outline of the
subject natural
disaster
The Philippine Geoportal is envisioned to provide a comprehensive
and consistent geospatial information of the country. It aims to
support the geospatial information needs of users in various
disciplines by providing access to such information.
In the aftermath of Tropical Storm Ketsana (Ondoy) which left
Metro Manila and 30% of the provinces in the Philippines under
state of calamity, geohazard maps were prepared for the 28 high
risk areas in the country. These maps were made accessible to
the public through the Philippine Geoportal.
Response Developed in the Philippine Geoportal is a DRRM application
which provides a visual appreciation of the hydrometeorological
and seismological hazards in the high risk areas of the country.
Effect 1. Increased awareness of the public on the hazards faced by the
community.
2. Hazard maps are increasingly used in the formulation of land
use and physical development plans.
3. Hazard maps used in the formulation of local DRRM plans.
Future
Annex2-22
No.15
Country Republic of the Philippines
Organization National Mapping and Resource Information Authority (NAMRIA)
Title Recovery and Rehabilitation after Typhoon Haiyan
Outline of the
subject natural
disaster
The harrowing impact of typhoon Haiyan left about 4 million
people homeless. This prompted the Philippine government to
ensure the safety of the affected communities, moving them away
from the seashore to more suitable relocation sites. In focusing
on the recovery and rehabilitation phase, the immediate objective
is to identify areas suitable for relocation of those left homeless by
the typhoon.
Response NAMRIA provided technical assistance with the provision of IfSAR
data which includes digital terrain models (DTM), digital surface
models (DSM), and orthorectified images used in the identification
of suitable relocation sites for the affected communities.
Effect The government was able to advance and fast track the
identification of safe and unsafe zones in the Haiyan-affected
areas.
Future

Annex2-23
No.16
Country Philippines
Organization National Mapping and Resource Information Authority (NAMRIA)
Title Mapping of Track of Typhoon Lawin (International Name: Haima) and
Affected Areas and Population
Outline of the
subject natural
disaster
In 19 October 2016, Typhoon Lawin (Haima) classified as extremely
dangerous by the state’s weather agency affected the provinces in the northern
part of the country. As it intensified into a super typhoon, destructive floods
and massive landslides were expected to be brought by moderate to heavy
rains within its 800-km diameter.
Response
NAMRIA prepared a map layout showing the track of Typhoon Lawin
(Haima), the likely affected provinces and population. NAMRIA integrated
data from various sources such as Philippine Atmospheric Geophysical and
Astronomical Services Administration (PAGASA) and the Philippine
Statistics Authority (PSA). The map was made public via NAMRIA’s
website for download by other DRR agencies, local government units, and
other interested parties.
Effects
The public is able to visualize the track of the typhoon and is made aware of
the areas and population likely to be affected by it. This increased awareness
of the residents in the likely affected areas to prepare for the impending
typhoon.
Future
Strengthen coordination with DRR and other agencies providing statistical
data relevant to disaster preparedness.
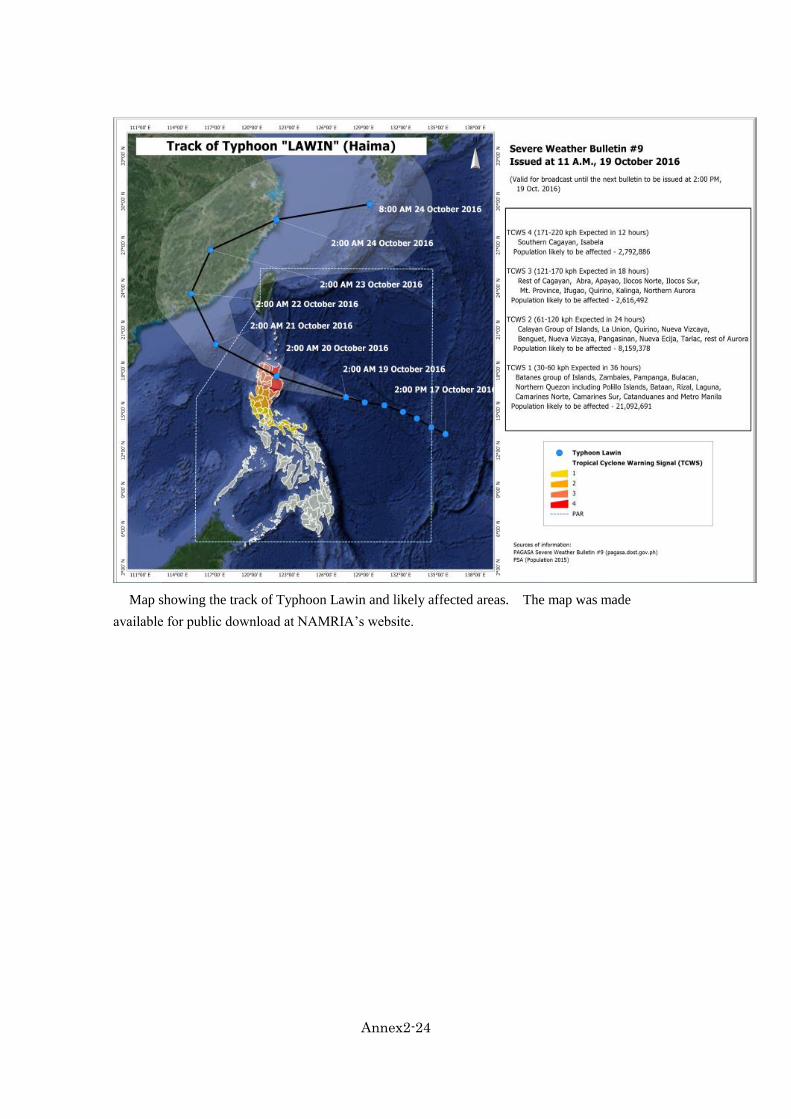
Annex2-24
Map showing the track of Typhoon Lawin and likely affected areas. The map was made
available for public download at NAMRIA’s website.

Annex2-25
No.17
Country Philippines
Organization National Mapping and Resource Information Authority (NAMRIA)
Title Philippine Active Geodetic Network (PageNet) – Surigao Earthquake
Outline of the
subject natural
disaster
The Province of Surigao del Norte in northeastern Mindanao was struck by a
magnitude (MS) 6.7 earthquake on 10 February 2017. The earthquake was
generated by the movement of the Philippine Fault-Surigao segment. The
groundshaking was felt at PHIVOLCS Earthquake Intensity Scale (PEIS) VII
in Surigao City and San Francisco.
Liquefaction and earthquake-induced landslide were documented as well as
collapsed bridge, damages to buildings, ports, roads, and bridges. As of 15
February 2017, there were 202 reported injuries and 8 reported casualties.
Response
NAMRIA measured the displacement of PageNet stations as a result of the
M6.7 Surigao Earthquake on 10 February 2017. The recent earthquake
caused a 2D shift in the coordinates1 by as much as 12.9 cm in the north-west
direction. This displacement (10.1 cm to North, 8.0 cm to West, and 2.8 cm
Down) was measured from 9 to 11 February 2017 from the active geodetic
station (AGS) PSUR of PageNET, which is located in Surigao City, 14km
from the earthquake’s epicenter. The next nearest AGS PTGO in Tagoloan,
Misamis Oriental, which is 158 km from the epicenter, showed no significant
shift in its position.
The data from PSUR was processed using Bernese GNSS Software from 01 to
20 February 2017 (10 days before and after the event) using the best available
products (e.g. orbits, clocks) from the International GNSS Service (IGS).
The displacements measured are not fixed to a stable tectonic plate and are
just based solely on the change in position in the ITRF. The reference
coordinates of the stations are based on the May 2015 monthly solution from
Bernese.
Continuous monitoring of the stations is ongoing for post-earthquake events.
Coordinates in the International Terrestrial Reference Frame
(ITRF) 2008
Effects
Results of the measurements and continuous monitoring of the stations will be
made available to the Philippine Institute of Volcanology and Seismology
(PHIVOLCS) in support of the Agency’s (PHIVOLCS) assessment and
analysis related to the recent seismic activity.
Future
Strengthen partnership with PHIVOLCS and other DRR agencies such as
Philippine Atmospheric Geophysical and Astronomical Services
Administration (PAGASA) to promote the use of AGS data for seismological,
meteorological, and other potential applications.

Annex2-26
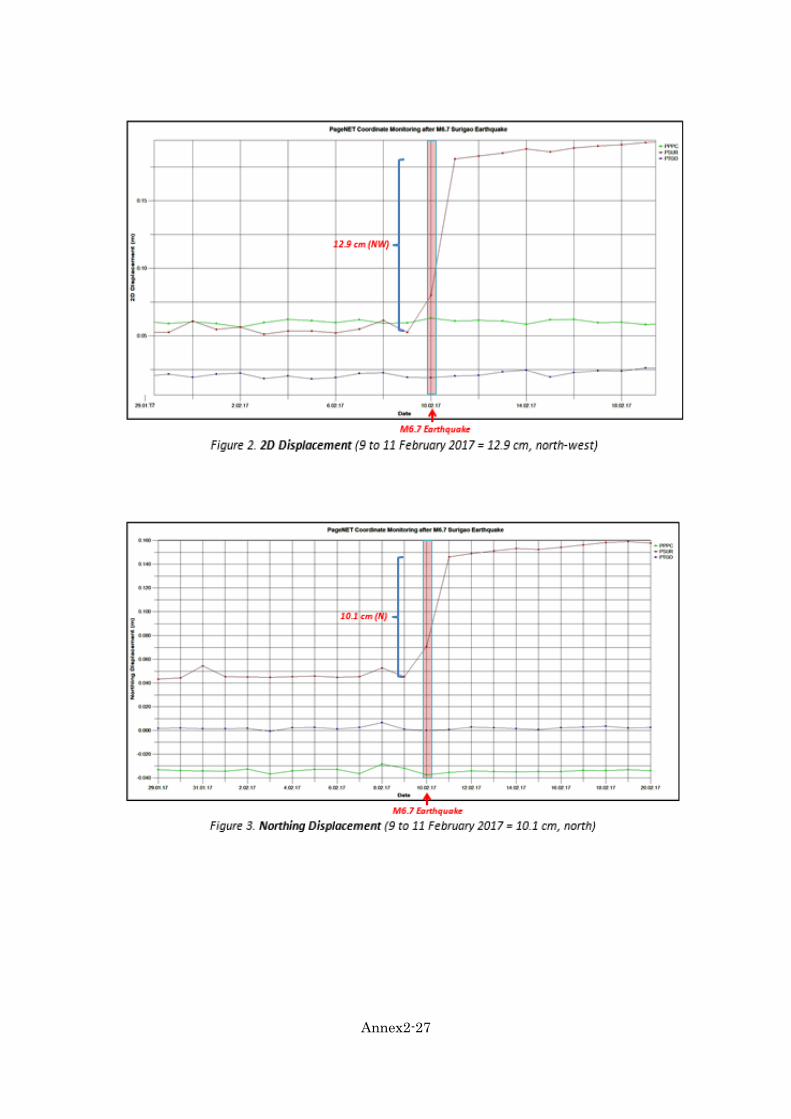
Annex2-27
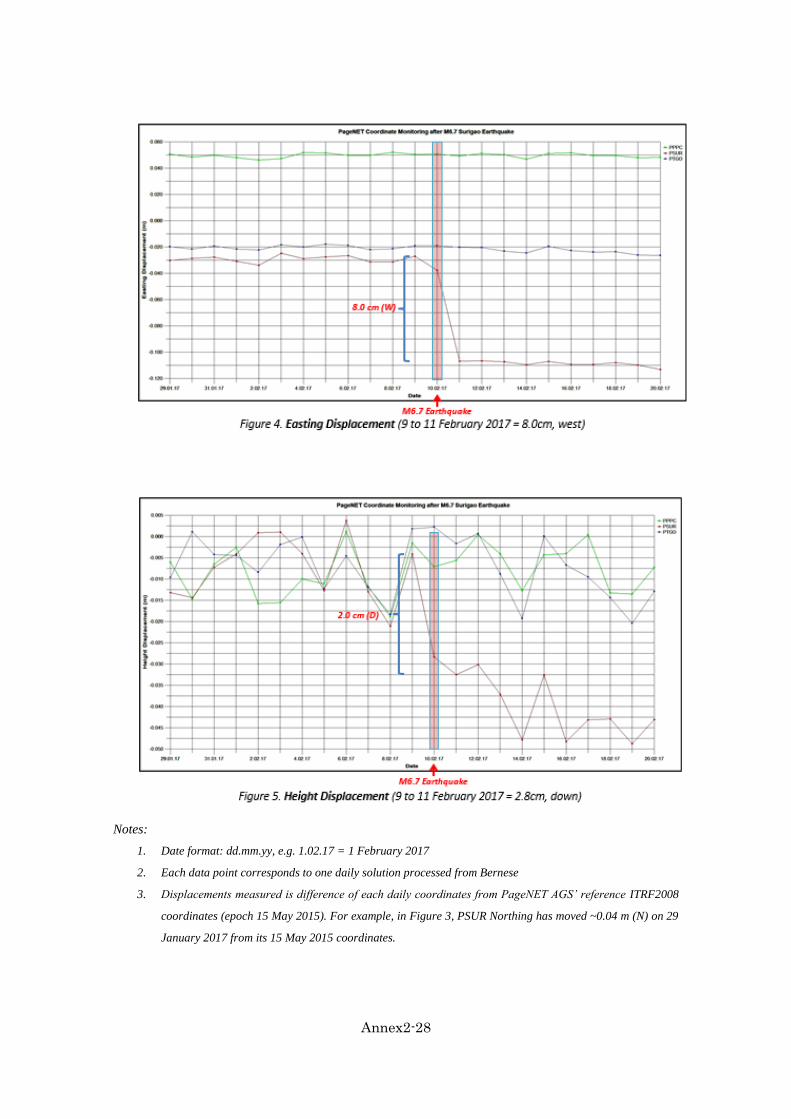
Annex2-28
Notes:
1. Date format: dd.mm.yy, e.g. 1.02.17 = 1 February 2017
2. Each data point corresponds to one daily solution processed from Bernese
3. Displacements measured is difference of each daily coordinates from PageNET AGS’ reference ITRF2008
coordinates (epoch 15 May 2015). For example, in Figure 3, PSUR Northing has moved ~0.04 m (N) on 29
January 2017 from its 15 May 2015 coordinates.

Annex2-29
No.18
Country Sri Lanka
Organization Survey Department
Title Surveyor General
Outline of the
subject
natural
disaster
Tsunami – 2004 December 26
Response
Providing available digital data / maps and technical support to
map the disaster prone areas / damages
Identify available resources for relief activities
Effect
Help quick dispatch of support
Relief providing activites
Locations for relief camps
Medical support availability information
Future
Fully pledged database on topographic information / resources
available which is shared with stakeholders / allowing them to add /
update information
Quick mapping with UAV when required
Provide accurate digital elevation model
Annex 3
How did the Geospatial Information Authority of Japan
Respond to the 2016 Kumamoto Earthquake?
-A Case Story-
October 2017
Geospatial Information Authority of Japan
Contents
Introduction ········································································ 1
Role of Geospatial Information in Disaster Risk Reduction ····················· 1
Activities of UN-GGIM on Disasters ················································· 1
Activities of UN-GGIM-AP on Disasters ············································ 2
Special Session at the Sixth Plenary Meeting of UN-GGIM-AP ················· 2
1 Background ································································· 4
1.1 Japanese Geography and Natural Disasters ·········································· 4
1.2 Policy and Legal Frameworks on Disaster Risk Reduction ······················· 5
1.2.1 Legal Framework ········································································ 5
1.2.2 Policy Development and Enforcement at the Time of Disaster ··················· 6
1.2.3 Role of Local Communities ···························································· 7
1.3 GSI’s Role in the Government ························································· 8
1.3.1 Core Responsibilities of GSI ··························································· 8
1.3.2 GSI’s Activities on Disaster Management ··········································· 9
1.3.3 Meeting Surge of Demand for Geospatial Information ··························· 10
2 Outset of the 2016 Kumamoto Earthquake ··························· 11
2.1 Geography of Kumamoto Prefecture ················································ 11
2.2 The First Shock ········································································· 11
2.3 Initial Response of GSI after the First Shock ······································· 12
2.3.1 Starting Initial Response ······························································· 12
2.3.2 Taking Aerial Photographs ···························································· 14
2.3.3 Crustal Movement Analysis ··························································· 14
2.3.4 Cooperation with Relevant Disaster Management Organizations ··············· 15
2.4 The Second Earthquake: the Mainshock ············································ 15
2.5 Reconsideration of Disaster Management after the Mainshock ················· 16
3 Emergency Disaster Response Activities ······························ 18
3.1 Disaster Responses after the Mainshock ············································ 18
3.1.1 Assistance to Other Organizations ··················································· 18
3.1.2 Aerial Photography and Interpretation ·············································· 18
3.1.3 UAV Imagery ············································································ 19

3.1.4 Geodetic Infrastructure Management ················································ 19
3.1.5 Information Provided through the GSI Map ········································ 20
3.2 Applications of Geospatial Information to Address Secondary Disaster Risks 20
3.2.1 Concerns of Larger Landslides ······················································· 20
3.2.2 GSI Responses Addressing to Secondary Disaster Risks ························· 20
3.3 Preparation of Shelter Distribution Map ············································ 21
3.4 Meeting the Needs of Stakeholders ·················································· 22
3.4.1 Provision of Geospatial Information to Public Organizations ··················· 22
3.4.2 Provision of Geospatial Information to Mass Media and the Public ············ 23
3.4.3 Functional Teams for Provision of Geospatial Information ······················ 23
4 Activities for Recovery and Reconstruction ·························· 24
4.1 Development of a Disaster Response Plan for the Recovery Phase ············· 24
4.2 Geospatial Information Necessary for Recovery and Reconstruction ·········· 24
4.2.1 Resurvey of Control Points ··························································· 25
4.2.2 Post-earthquake Aerial Laser Survey ················································ 25
4.2.3 Basic Maps for Recovery and Reconstruction ····································· 26
4.2.4 Revision of Active Fault Maps ······················································· 26
4.3 Other Relevant Activities ······························································ 27
5 Lessons Learned from the Kumamoto Earthquake Response ······ 28
5.1 Managing Disaster Responses ························································ 28
5.2 Conclusion ··············································································· 29
List of Acronyms
ALOS-2: Advanced Land Observing Satellite
CORS: Continuously Operating Reference Station
CDMC: Central Disaster Management Council
DGO: Designated Government Organization
DMHQ: Disaster Management Headquarters
GEONET: GNSS Earth Observation Network System
GSI: Geospatial Information Authority of Japan
GSI-LB: Geospatial Information Authority-Land Bird
MLIT: Ministry of Land, Infrastructure, Transport and Tourism
NGIA: National Geospatial Information Authority
ODMHQ: On-site Disaster Management Headquarters
REGARD: Real-time GEONET Analysis system for Rapid Deformation
Monitoring
RSD: (GSI) Regional Survey Department
SAR: Synthetic Aperture Radar
SFDRR: Sendai Framework for Disaster Risk Reduction 2015-2030
SGDAS: Construction of Seismic Ground Disaster Assessment System
SI: Seismic Intensity
UAV: Unmanned Aerial Vehicle
UN-GGIM: UN Committee of Experts on Global Geospatial Information
Management
UN-GGIM-AP: The Regional Committee of United Nations Global Geospatial
Information Management for Asia and the Pacific
VLBI: Very Long Baseline Interferometry
Annex3-1
Introduction
Role of Geospatial Information in Disaster Risk Reduction
Since natural disasters take away many lives and assets, and hinder sustainable
development, disaster risk reduction has been an important international challenge.
The United Nations, having recognized the importance of disaster risk reduction,
convened in 1994 the first World Conference on Natural Disaster Reduction, and
established the United Nations Office for Disaster Risk Reduction (UNISDR) in 1999
to facilitate the implementation of the International Strategy for Disaster Reduction.
The outcomes of the subsequent efforts were consolidated at the 3rd United Nations
World Conference on Disaster Risk Reduction in 2015 into the Sendai Framework for
Disaster Risk Reduction 2015-20301 (SFDRR), which outlines the issues, policy
framework and measures to be addressed on disaster risk management up to 2030.
The resolution on SFDRR was subsequently adopted by the UN General Assembly in
the same year. It is noteworthy that SFDRR recognizes the potential role of geospatial
information in disaster risk reduction, and urges the geospatial information
community to: develop location-based disaster risk information, including risk maps,
by using, as applicable, geospatial information technology; make use of space and in
situ information, including geographic information systems (GIS); and disseminate
risk information with the best use of geospatial information technology, in its Priority
1 – Understanding disaster risk.
Activities of UN-GGIM on Disasters
Pursuant to the adoption of SFDRR, the UN Committee of Experts on Global
Geospatial Information Management (UN-GGIM) established a Working Group on
Geospatial Information and Services for Disasters (WG on Disasters) in 2015 to
discuss the optimization of geospatial information applications and services at all
levels of disaster risk management. The results of the WG on Disasters discussions
were compiled into the Strategic Framework on Geospatial Information and Services
for Disasters2, which was adopted at the seventh session of UN-GGIM in 2017. The
final goal of this Strategic Framework is that “quality geospatial information and
1 http://www.unisdr.org/we/inform/publications/43291 2 http://ggim.un.org/docs/UN-
GGIM%20Strategic%20Framework%20for%20Disasters%20(FINAL%20VERSION%20-%20UNG
GIM7%20dated%2003%20August%202017).pdf
Annex3-2
services are available and accessible in a timely and coordinated way to support
decision-making and operations within and across all sectors and phases of the
emergency cycle.” The WG on Disasters is now drafting a resolution for the adoption
of the Strategic Framework by the Economic Social Council of the United Nations,
and is developing an assessment tool to assist Member States and UN-GGIM regional
committees to evaluate and develop their respective implementation plans, and to
monitor and report progress on the implementation of the Strategic Framework.
Activities of UN-GGIM-AP on Disasters
In parallel with this global attempt to implement the SFDRR, the Regional Committee
of United Nations Global Geospatial Information Management for Asia and the
Pacific (UN-GGIM-AP) established a Working Group on Disaster Risk Management
(WG on DRM) to discuss specific activities that National Geospatial Information
Authorities (NGIAs) in the Asia-Pacific region, where the frequency and intensity of
natural disasters are very high, and to contribute to disaster risk management in
accordance with SFDRR. This Working Group has been closely cooperating with the
WG on Disasters of UN-GGIM. The WG on DRM of UN-GGIM-AP so far has been
concentrating its efforts to understand what the NGIAs and relevant disaster
management agencies of the Member States in the region have been doing on disaster
risk management, and to find out their best practices to share them in the region. One
of the goals of the WG on DRM is to develop guidelines for the NGIAs in the region
for the disaster risk management that will be consistent with the Strategic Framework,
which was also welcomed at the Seventh Session of UN-GGIM in its decision. The
guidelines are now in drafting phase and expected to be finally adopted at the UN-
GGIM-AP at its Sevenths Plenary Meeting in 2018.
Special Session at the Sixth Plenary Meeting of UN-GGIM-AP
In light of the need of thorough understanding on what NGIAs are actually doing
specifically on disaster risk reduction and of sharing them among the NGIAs in the
region, in order to develop the guidelines that are to include specific actions NGIAs
could take to assist their respective governments in better managing disaster risk in
accordance with the Strategic Framework, UN-GGIM-AP is organizing a special
session on the applications of geospatial information for disaster risk reduction
during its Sixth Plenary Meeting on 17 and 18 October 2017 in Kumamoto, Japan.
Specifically, the special session will focus on a case study of disaster responses for
the 2016 Kumamoto Earthquake that occurred in April 2016. The Geospatial
Annex3-3
Information Authority of Japan (GSI), the host of the Sixth Plenary, will provide
detailed information on the actions it took in response to the Earthquake, and will
share its experiences. The participants will also be expected to join the case study
and share their own experiences to find some common denominators on the role of
NGIAs in disaster risk management as well as other relatively unique activities that
may not be immediately applicable to some countries, but may be considered as
important options as their potential roles for the future. GSI will share its activities
and experiences for the Kumamoto Earthquake mainly on the types of geospatial
information it prepared, the cooperation with relevant authorities and stakeholders,
and how the information and data were disseminated in a timely manner. In addition,
the GSI’s activities will be shared for different phases of disaster, including,
preparation phase, onset phase, early response phase, and recovery phase. The results
of the special session discussions will be incorporated in the guidelines on the roles
of NGIAs in disaster risk management, which are scheduled to be drafted by WG on
DRM.
GSI prepared this case story document for the participants of the Special Session as
the background information. The participants are expected to read this document in
advance to get well prepared for sharing their own experiences and challenges during
the session to facilitate the development of the guidelines.
Annex3-4
Chapter 1
Background
1.1 Japanese Geography and Natural Disasters
Japan consists of several island arcs that form a part of the circum-Pacific orogenic
zone off the eastern edge of the Eurasian Continent. It consists of five relatively large
islands – Hokkaido, Honshu, Shikoku, Kyushu and Okinawa from the north, and
nearly 7,000 islands around them. Geologically, the country is situated at the eastern
end of the Eurasian Plate and the end of the North American Plate. The major parts
of archipelago are thought to have been detached from the continent and formed due
to the subduction movements of two oceanic plates (i.e. the Pacific Plate and the
Philippine Sea Plate) under the two continental plates. Since it is situated at the
convergence zone of the continental and oceanic plates, active crustal movements
cause approximately 20 % of the world’s earthquakes of magnitude 6 or higher in
and around Japan. With 110 active volcanoes, constituting nearly 7% of the global
total, Japan is also one of the most volcanically active countries in the world.
The Japanese archipelago except Hokkaido is in temperate wet monsoon climate
zone, with significant temperature variation in the year and four distinct seasons. The
annual average precipitation is approximately 1,700 to 1,800 mm. The weather is hot
and humid between June and August due to the southeast monsoon which, in
combination with typhoons, causes a large amount of rainfall. In winter between
November and March, the northwest monsoon prevails. The continental side of the
mountainous backbone of the Japanese archipelago has heavy snow that becomes
more than several meters deep in some places, while the Pacific side has a dry climate
in winter. Due to the steep and complex landform, temperature and precipitation
variations by regions and seasons are significant.
Due to its location on the earth, topographical features, weather and other natural
environmental conditions, Japan suffers many natural disasters, such as earthquakes,
tsunamis, volcanic eruptions, typhoons, local downpours and heavy snow. Between
2001 and 2010, the annual average number of earthquakes with noticeable tremors
was approximately 1,7003. It means, using a simple average, tremors large enough to
3 Source: Seismic intensity database search on the Japan Meteorological Agency website
Annex3-5
be felt by people take place approximately five times every day somewhere in the
country. Of the 1,036 earthquakes of 6.0 or greater in magnitude that occurred on the
globe in the first ten years of the 2000s (2000 – 2009), 212 (20.5%) occurred in Japan4.
On average, every year 2.6 typhoons that are born above the Pacific Ocean hit the
Japanese archipelago.
Economic loss due to such natural disasters is enormous and many precious human
lives have been lost. Since 1945, for example, the death tolls were 2,306 in the
Mikawa Earthquake and 3,756 in the Makurazaki typhoon in 1945, 3,769 in the Fukui
Earthquake in 1948, 5,098, in the floods caused by the Ise Bay typhoon, or Typhoon
Vera in 1959, 6,437 in the Great Hanshin-Awaji Earthquake in 1995 and 18,880 in
the Great East Japan Earthquake in 2011, and 84, in the landslides caused by the
torrential rain in western Japan in 2014.
1.2 Policy and Legal Frameworks on Disaster Risk Reduction
1.2.1 Legal Framework
What kinds of measures have been taken in Japan against such disasters? The Basic
Act on Disaster Control Measures was enacted in 1961 as the most fundamental law
for disaster management, after the Ise Bay typhoon tragedy in Nagoya region in 1959.
It provides the fundamentals of disaster prevention schemes and plans required for
the national and local governments, as well as of disaster management and responses5.
The Act also clearly states that it is the responsibility not only of government agencies,
but also of the entire nation to commit to the implementation of disaster management
plans, mutual cooperation and other measures. After experiencing the Great East
Japan Earthquake in 2011, the Act was amended to take advantage of geospatial
information in 2012. It is also noteworthy that the Act mandates municipalities to
prepare hazard maps for floods, landslides and tsunamis in their jurisdiction.
The national and local governments have established organizational structures and
disaster prevention plans in accordance with the Act. Specifically, the national
government has the Central Disaster Management Council (CDMC) led by the Prime
Minister with the participation by the Minister for Disaster Management and all other
4 Excerpt from the Cabinet Office White Paper on Disaster Management 2010 5 The definition of disasters by the Basic Act on Disaster Control Measures includes not only disasters
caused by earthquakes, local downpours and other abnormal natural phenomena, but also accidents
such as large-scale fires, explosions and release of radioactive substances.
Annex3-6
ministers. The Cabinet Office serves as the Council’s secretariat where the
development and implementation of Japan’s Basic Disaster Management Plan are
managed. The twenty four Designated Government Organizations (DGO), including
GSI, have developed their respective Disaster Management Operation Plans, which
are used in conjunction with the Basic Disaster Management Plan to respond
appropriately to disasters. All prefectural (forty-seven) and municipal (more than
1,700) governments have their respective Disaster Management Councils and
develop and implement their local Disaster Management Plans.
1.2.2 Policy Development and Enforcement at the Time of Disaster
The response at the time of a disaster in accordance with these disaster management
plans at national level is as follows. When a large-scale natural disaster6 is first
reported to the CDMC, the Disaster Management Office will be established in the
Prime Minister’s Office, and the members of the emergency team, consisting of staff
members of the Cabinet Secretariat and relevant ministries, and individual ministries
will be contacted immediately to begin the collection of information on the damage
and response status. Photos and videos acquired with helicopters and other platforms,
and general damage information provided from relevant ministries and public
agencies will be compiled by the emergency team at the Office of the Prime Minister.
If large scale damage is reported, Disaster Management Office will be replaced by
Disaster Management Headquarters (DMHQ). When DMHQ is established, all
cabinet members will be summoned by using all available means. The duties of the
DMHQ are: the collection of disaster information from DGOs; the prioritization of
the government’s policies based on the understanding of the overall situations; and
the enforcement of the policies on emergency disaster countermeasures and other
matters through the DGOs. When necessary, a government investigation team headed
by the Minister for Disaster Management or an initial emergency survey team will
be deployed to the stricken areas. DGOs will engage in their respective duties in
accordance with the policies adopted at DMHQ. At the same time, individual
ministries and organization establish their disaster management headquarters to take
6 A call for an emergency team is issued when an earthquake with a seismic intensity (on the Japanese
scale) of 5 or higher in the 23 special wards of Tokyo and 6 or higher occur in other areas, or when a
warning of a tsunami or Tokai Earthquake Advisory Information is announced by the Meteorological
Agency.
Seismic intensity (seismic coefficient) (SI) is a scale to indicate the strength of earthquake vibrations.
In Japan, SI means the seismic intensity scale of the Japan Meteorological Agency.
Annex3-7
necessary countermeasures in a timely and coordinated manner. These initial and
emergency responses will be made within two or three hours from the outset of the
disaster.
Meanwhile, disaster management headquarters will also be established by the local
governments of the stricken areas to collect detailed information on the damage, and
conduct rescue and first aid measures for the victims. If the national government
deems it necessary to enhance the coordination between the local governments in the
stricken areas, an On-site Disaster Management Headquarters (ODMHQ) will be
established, with the deployment of a Minister of the Cabinet Office and his or her
staff members.
1.2.3 Role of Local Communities
While emergency measures taken by the national and local governments mentioned
above including the rescue of victims, the securing of evacuation routes and means,
the prevention of secondary disasters, the establishment of shelters, and the supply
of everyday commodities are all crucial to save people’s lives and their properties, it
is often emphasized in Japan that a balanced approach is important on the
combination of Self-help, Mutual-help and Public-help. Self-help means protection
of people’s own lives through improved preparedness and appropriate responses for
disasters by the people themselves. Mutual-help means the protection of local
community and people living there through enhanced preparedness and appropriate
responses for disasters by helping each other with family members, local
communities, companies and others in the vicinity. Public-help means emergency
rescue and support, and restoration and recovery measures conducted by public
agencies, including the police and fire departments. Public-help is limited at the time
of a large-scale disaster. While Self-help is the basis of disaster responses, not all
people can protect their own lives by themselves. Thus, Mutual-help is reevaluated
and promoted to enhance the capacity of disaster responses in local communities,
particularly helping vulnerable people, including small children, senior citizens, and
disabled people.
After experiencing the Great East Japan Earthquake in 2011 and following disasters
occurring frequently throughout Japan, people have been reminded of the importance
of disaster management. Disaster drills at community, school and company levels,
and inventory of emergency goods such as portable flashlights and food stocks have
Annex3-8
become very common in local communities because of the elevated awareness of
people on the importance of Mutual-help to minimize disaster damage. Furthermore,
2,200 “disaster prevention corps” have been organized in Japanese local communities.
Along with the official fire fighters belonging to fire departments, a total of 860,000
disaster prevention corps members now engage in fire-fighting and rescue activities
at the community level, ensuring Mutual-help aspects for disaster response.
1.3 GSI’s Role in the Government
GSI, which is one of the expert organizations in the Ministry of Land, Infrastructure,
Transport and Tourism (MLIT), conducts survey administration in accordance with
the Act for Establishment of MLIT and the Survey Act. With 650 staff members and
86 million US dollars of budget (for fiscal year 2016), GSI itself conducts survey that
provides the basis of all survey works (basic survey), and give guidance and advice
on public survey conducted by other national government agencies and local
governments. As a DGO, it also acquires image data of stricken areas using airplanes,
UAV and satellites, analyzes crustal movement by GNSS surveying, and provides
acquired geospatial information to relevant government organizations and the general
public, at times of natural disasters.
1.3.1 Core Responsibilities of GSI
The three fundamental missions GSI is engaged are “Surveying,” “Portraying” and
“Safeguarding” the national land. In “Surveying,” GSI maintains the horizontal and
vertical datum in Japan using VLBI and other space surveying technologies. It runs
the GNSS Earth Observation Network System (GEONET) 7 as an infrastructure for
surveying and real-time positioning. In “Portraying,” it has developed the Digital
Japan Basic Map as the basis of all maps and provides it in a variety of media. A web-
based online map called “the GSI Map” is one of the most popular media GSI uses
to disseminate its products. The GSI Map provides aerial photo images, thematic
maps and the latest disaster information and archives (e.g., damage situation maps)
in addition to the Digital Japan Basic Map. GSI puts high priority in updating the
Digital Japan Basic Map, particularly the transportation networks as soon as they are
made available to the public, to ensure that the Map is always ready even for those
7 GEONET(GNSS Earth Observation Network System) is a continuous observation system
consisting of Continuously Operating Reference Station (CORS) at 1,300 locations throughout Japan
and the Data Analysis and Management Center at GSI Headquarters in Tsukuba. GEONET is used for
the establishment of a high-density and high-precision surveying network and monitoring of crustal
movements.
Annex3-9
who are deployed on an emergency mission to unfamiliar areas in case of disasters.
1.3.2 GSI’s Activities on Disaster Management
GSI developed the GSI Disaster Management Operation Plan in 1996 as a DGO and
as one of its missions of “Safeguarding.” It stipulates the following operations during
normal time, or preparation phase of disaster:
・ Development of guidelines and organizational arrangements for disaster
management;
・Good management of observation facilities;
・ Cooperation and communications with relevant disaster management
organizations;
・Strengthening office buildings for disaster resiliency; and
・Improvement of disaster response capacity of employees.
Specifically, GSI provides the following geospatial information and services to
improve the disaster preparedness for government organizations and individuals:
・Basic topographical maps as backdrop for creating disaster situation maps;
・Aerial photos which record pre-disaster landscape;
・GEONET data necessary for crustal deformation analysis;
・Thematic maps (e.g. active fault maps, land condition maps, volcanic land
condition maps) that serve as basic data for preparing hazard maps and for
evaluating disaster risks;
・Provision of virtually all geospatial information on web maps; and
・Management of the National Hazard Map Portal Site in cooperation with the MLIT.
The Disaster Management Operation Plan also specifies the following emergency
measures GSI should take once a disaster takes place:
・Establishment of GSI Disaster Management Headquarters;
・Confirmation of the safety of all staff members and their facilities;
・Establishment of a liaison relationship with DMHQ and relevant government
offices including MLIT;
・Preparation of geospatial information products including situation maps and their
provision to relevant government offices and to the general public; and
・Technical assistance with geospatial information to the Technical Emergency
Control Force (TEC-FORCE) of MLIT that is deployed to stricken areas for the
recovery of damaged infrastructure.
Annex3-10
More specifically, the following geospatial information and services are provided
once a disaster takes place:
・GEONET data for 24 hours a day;
・Spatial distribution of crustal deformation detected by interferometric analysis of
data acquired by the L-band Synthetic Aperture Radar (SAR) aboard the
Advanced Land Observing Satellite-2 (ALOS-2) launched by JAXA;
・Aerial photos taken before and after the disaster;
・Provision of basic topographical maps;
・Five-meter grid digital elevation models (DEM) developed by airborne laser
surveying; and
・Production and distribution of situation maps (e.g., Tsunami inundation maps).
1.3.3 Meeting Surge of Demand for Geospatial Information
GSI has a light airplane for aerial photography, which is deployed to take aerial
photographs of the stricken areas when a disaster takes place. Then GSI prepares
ortho-rectified photos and situation maps prepared by interpreting the photos, and
provides them to relevant organizations and the general public.
However, it is sometimes beyond the capacity of the single airplane to take
emergency photographs in case of a disaster that affects large areas. GSI overcomes
this difficulty by cooperating with the private sector. Since there are manyaerial
survey companies in Japan, GSI has established an agreement with the association of
these companies on the emergency photography at times of disasters. Such
government-private cooperation in photographing enables the prompt acquisition of
damage information.
Annex3-11
Chapter 2
Outset of the 2016 Kumamoto Earthquake
2.1 Geography of Kumamoto Prefecture
Kumamoto Prefecture is located at the center of Kyushu, which is one of the five main
islands constituting the Japanese Archipelago. It is 900 km west-southwest of Japan’s
capital Tokyo, and 120 km south of Fukuoka City (population: 1.56 million), which
is the largest city in the Kyushu Island. The prefecture has a population of more than
1.76 million, of which approximately 740,000 live in its capital city Kumamoto. The
main industry is agriculture, and its total agricultural products rank seventh out of 47
prefectures.
A distinctive characteristic of the region’s tectonics is the presence of a tectonic zone
called the Beppu-Shimabara Graben. Extending 200 km in length and 20 to 30 km in
width, it divides the Kyushu Island into southern and northern parts. The GSI’s
GEONET observation has revealed that the northern and southern parts of the island
are moving in opposite directions with each other at this graben. Since this graben is
lined with several active faults, consisting mainly of normal faults such as the
Futagawa fault, the potential of seismic activities is thought to be high. The
Government estimated that the probability of an earthquake whose magnitude is larger
than or equal to 6.8 is 18-27% in 30 years. However, the last number of years had seen
little seismic activities in this region, which caused the local people and the local
governments to become less concerned with the potential risk of earthquakes and to
use it as the sales talk to invite investment in the region.
2.2 The First Shock
Since the fiscal and academic years begin in April in Japan, April sees many students
who just start their schools, and many people who are newly employed or transferred
to new workplaces. Therefore, it is a season when many people are working or
studying with a fresh mind, trying to get used to the new environment. Consequently,
most schools and workplaces are not usually ready for disaster drills in April.
The people in Kumamoto Prefecture who had little anticipation of earthquakes and
little preparation for disasters were shaken by a strong earthquake that took place at
Annex3-12
9:26 pm on 14 April in 2016. Its focal depth was 11 km and magnitude (Mj) was 6.5.
The SI 7, which is the highest in the intensity scale, was observed in Mashiki Town,
10 km east of downtown Kumamoto. It was an inland earthquake caused by the
activity of the Hinagu fault that runs across the western part of the Prefecture from
southwest to northeast. The shock was so strong that people could not stay on their
feet, and refrigerators and copy machines fell down in Kumamoto City. This
earthquake was reinterpreted later as the “foreshock” of the second earthquake of Mj
7.3 that took place on 16 April in less than two days after the first one.
The Earthquake Early Warning8 terribly sounded from TVs, smartphones and mobile
phones, and alarmed people all over Japan who were ready for going to bed. The first
report of the earthquake in Kumamoto immediately reached the senior officials and
disaster response staff at GSI.
2.3 Initial Response of GSI after the First Shock
Immediately after the foreshock, GSI began its disaster responses consisting mainly
of the following:
・Emergency teleconference of senior officials;
・Assessment of damage caused by the earthquake;
・Analysis of GEONET data to detect crustal movements;
・Establishment of communication channels with relevant agencies; and
・Establishment of information management team.
2.3.1 Starting Initial Response
The senior officials and responsible staff members of GSI first set up the Disaster
Management Headquarters (Headquarters) consisting of relevant employees of GSI
to take special emergency actions collectively to respond to the disaster in a timely
manner. Since SI of 7, the highest on scale, was observed and serious damage was
expected, the establishment of the Headquarters was informed to Headquarters
members’ cell phones via email immediately after the outset of the earthquake. At the
same time, this message was used to confirm the availability of the senior officials by
asking them to acknowledge the receipt within 10 minutes, a method known as the
8 The Earthquake Early Warning (EEW) system is a system to issue a warning several to several tens
of seconds before the arrival of a large shock after the occurrence of an earthquake. It is a
forecast/warning provided mainly by the Meteorological Agency of Japan. Its partial trial operation
began in 2004, and the full-fledge operation for most of the country, except for some remote islands,
was commenced on 1 October 2007. It is the first system of its kind in the world.

Annex3-13
“10-minute rule.” 9
In parallel with the establishment of the Headquarters, the safety of all employees and
their family members was confirmed with a safety confirmation system via mobile
phones or on the internet. This system is activated in case of an earthquake of a SI of
6- or higher (SI of 5+ or higher in the 23 special wards of central Tokyo). At the time
of the Kumamoto Earthquake, the safety of the employees of the Kyushu Regional
Survey Department 100 km north of the epicenter was also confirmed with this system.
Then at 9:35 pm, nine minutes after the outset of the earthquake, the impact of the
earthquake on the ground including land slide, liquefaction and other land
deformation was estimated with SGDAS10 and shared within GSI, to have common
understanding on the magnitude of potential damage caused by the earthquake.
At 10:15 pm (49 minutes after the occurrence of the earthquake), a teleconference was
convened with the members of the Headquarters and chaired by the Director General.
Director-General of GIS reminded the members of the need to respond to the disaster
with a sense of alertness, and requested them to take necessary measures to find out
the impact of the damage, including photo shooting with the GSI’s airplane, analysis
of crustal movements using GEONET data and interferometric analyses of SAR data,
operation of DiMAPS11 and cooperation with relevant ministries and organizations
and ODMHQ. Approximately three hours after the earthquake, at 0:30 am on 15 April,
the Headquarters convened the second meeting to get the reports on the progress of
the activities and make necessary adjustments. Then the third and fourth meetings
were held at 7:30 am and 5:00 pm, respectively, on the same day. RSDs of Kyushu
9 The 10-minute rule requires that, when the person in charge of disaster management sends an e-mail
to notify the occurrence of a serious disaster to the official mobile phones and workplace PCs of the
GSI’s senior officials and persons in charge of disaster management, those who received the mail must
send a blank mail back within 10 minutes to acknowledge the receipt. 10 The Seismic Ground Disaster Assessment System (SGDAS) estimates the probability of ground
liquefaction, slope failure and other types of deformation based on the seismic intensity distribution
of an earthquake and by using preset topographical and geological data, and shows the results on maps.
At present, information is shared only within the GSI. 11 The Integrated Disaster Information Mapping System (DiMAPS) has been used by the Water and
Disaster Management Bureau of the MLIT, and GSI since September 2015. At times of earthquake,
wind, flood and other natural disasters, it can quickly collect disaster and damage information and
indicate on the GSI’s web map in an easy to understand and integrated manner. The system has been
used for collection of information from the sites of disasters, sharing of information with disaster
management-related agencies, provision of information to the general public and various other
purposes.
Annex3-14
and other regions also participated in these meetings via a web conference system.
Since the circumstances of the stricken areas kept changing after the earthquake
including the frequent aftershocks, it was important to frequently update the
Headquarters members on the progress of the activities within GSI and make
necessary adjustments. Therefore, the Headquarters meetings were held twice a day,
in the morning and early evening, and whenever else necessary during the first few
days after the outset of the earthquake.
2.3.2 Taking Aerial Photographs
When the first shock hit Kumamoto, the GSI’s airplane was stationed at Miyako
Airport in Okinawa, 1,040 km southwest of Kumamoto City in direct distance, for a
planned mission of taking aerial photos of the area. In light of the difficulty of
deploying the airplane immediately to Kumamoto area, GSI, in accordance with the
agreement on emergency photography at times of disaster, contacted the association
of private aerial survey companies at 10:30 pm immediately after the first
teleconference of the Headquarters to identify companies that will be able to deploy
their airplanes to the stricken areas to take aerial photos. Simultaneously, GSI fixed
the extent of photographing and shared that information with aerial survey companies
at 1:40 am on the next day.
After the daybreak, two affiliated companies began to take oblique photos around the
epicenter in Mashiki Town at 7:00 am. Subsequently, oblique and vertical photos of
areas assigned to each company were taken. Acquired aerial photo data were sent to
GSI, and the oblique photos were posted on the GSI map, GSI’s web based online
map, at 2:30 pm of the same day. The poor weather in Okinawa prevented the GSI’s
airplane from taking off immediately after the daybreak. However, by late morning
the weather became moderate and it was able to leave there at 11:30 am, and started
taking oblique photos around Kumamoto City starting at 3:40 pm.
In addition, the GSI Land Bird team, which was formed to use UAVs for both normal
operations and disaster responses, was deployed from the Headquarters to Kumamoto
at 10:00 am on 15 April.
2.3.3 Crustal Movement Analysis
Crustal movements that accompanied the earthquake were also analyzed with
GEONET data. The check-up of each of the GEONET stations was completed in 83
Annex3-15
minutes after the earthquake at 10:49 pm, and the Q3 analysis 12 result of the
observation data of the stricken areas was released at 7:30 am and 5:00 pm on the next
day. A model of the earthquake fault was also analyzed and released on the GSI
website at 1:15 pm. This fault model revealed that a crustal movement of
approximately 60 cm in the horizontal direction took place along the fault at the time
of the first shock.
2.3.4 Cooperation with Relevant Disaster Management Organizations
In parallel with these activities at the Headquarters of GSI, the Kyushu RSD contacted
local authorities of the stricken areas to find out their needs of geospatial information,
and provided available existing geospatial information. At 10:00 pm, 34 minutes after
the first shock, the Department provided GSI’s topographical maps of different scales
to the Kyushu Regional Development Bureau of MLIT, which manages infrastructure
development in the region, including road and river networks in the Kyushu Region.
The Government established the ODMHQ at the Kumamoto Prefectural Government
office at 10:40 am in the next morning following the earthquake, and coordinated the
efforts made by different government organizations for their efficient operations
through sharing the latest needs and ongoing activities of relevant organizations to
rescue victims and assess the impact.
For better sharing of geospatial information prepared before and after the disaster
within MLIT, GSI also began to provide available geospatial information on DiMAPS
at 10:45 pm, 79 minutes after the earthquake. Active fault maps of the Kumamoto
region and acquired aerial photos were also posted on the GSI map, which was
announced through social networks (e.g., Twitter) at 11:48 pm on 14 April.
2.4 The Second Earthquake: the Mainshock
The disaster response to the earthquake that occurred at 9:26 pm on 14 April seemed
to have been set on the right path and making progress thanks to the activities on 15
April. However, a second earthquake with bigger magnitude at midnight did not allow
the GSI staff members to have a sound sleep that night.
12 Q3 analysis is a type of GEONET analysis conducted routinely using observation data of CORSs for six hours and the IGS ultra-rapid products. It is also known as the quick solution. Q3 analysis is
conducted every three hours in GEONET.
Annex3-16
The new earthquake occurred at 1:25 am on 16 April, 28 hours after the first shock.
Due to the larger magnitude of Mj 7.3 than the first shock, the new one exceeded the
first one both in the intensity and the extent of damage. While the SI of 7 was observed
only in Mashiki Town at the first shock, the same intensity was also observed in
Nishihara Village, in addition to Mashiki Town at the second shock. This latter
earthquake was also an inland earthquake and was caused by the movement of the
Futagawa fault and the northern part of Hinagu fault that triggered the first shock.
Since the second shock was greater in both magnitude and intensity than the earlier
earthquake, it was later interpreted as the mainshock of the 2016 Kumamoto
Earthquake. Accordingly the first shock was called foreshock.
2.5 Reconsideration of Disaster Management after the Mainshock
Immediately after the main shock, SGDAS automatically assessed the potential
damage to the ground in Kumamoto region and shared the result of its analysis within
GSI at 1:34 am, nine minutes after the earthquake. The fifth Headquarters meeting
was held over telephone 54 minutes after the earthquake, at 2:19 am on 16 April. The
meeting decided to repeat the emergency procedures as those that were done for the
foreshock, including survey of the safety of employees, examination of the
functioning of facilities, and renewed arrangements for the aerial photographing by
private companies. It was found that nine CORSs in the region had lost the power due
to the power outage at that time, though they were able to continue its observation
with the battery installed in each station, which has the capacity to support the
operation for about 72 hours.
At 6:00 am on 16 April, the sixth Headquarters meeting was convened to share the
latest situation after the mainshock within GSI. Due to far greater damage caused by
the mainshock, the Director-General of GSI ordered a complete renewal of the
response strategy13 and work plan, and the development of renewed measures as
shown below.
<Renewed measures taken after the Mainshock>
1) Assignment of personnel
・ Full mobilization of available employees and their timely assignment to
additional tasks to support the sustainable response operations, including the
13 As the renewed strategy was presented in the early morning, it was nicknamed
“Dawn Policy”
Annex3-17
deployment of the personnel to RSDs in Tokyo and Kyushu to keep close
contact with relevant disaster management organizations in Tokyo and
Kumamoto.
2) Information sharing
・Understanding of the latest situations in the stricken areas and the needs of
relevant disaster management organizations.
3) Aerial photography
・Taking aerial photographs of Kumamoto, Aso, Kikuchi and Oita areas early in
the morning of 16 April by mobilizing airplane of GSI and private companies
based on the prior agreement.
4) Interpretation of aerial photographs
・Discontinuation of photo interpretation of those aerial photographs taken after
the foreshock.
・Reassignment of photo interpreters to focus on the new aerial photographs taken
after the mainshock
・Analysis of the amount of collapsed sediment caused by the earthquake.
5) CORS data analysis
・Analysis of crustal deformation with the REGARD system14, including baseline
length analysis, S3 analysis15, Q3 analysis, and vector diagrams.
6) Interferometric SAR data analysis
・Analyses of a series of SAR data observed from different satellite paths of
ALOS-2 to detect the spatial distribution of crustal deformation and to
decompose the deformation into the horizontal and vertical directions.
7) Shooting videos with drones
・Land slide areas and ruptures that have appeared on the ground surface were
videoed with drones.
8) Provision of geospatial information
・Timely preparation of maps, aerial photos, and thematic maps of the stricken
areas, and their distribution to relevant disaster management organizations.
14 The REGARD system stands for the Real-Time GEONET Analysis system for Rapid Deformation
monitoring. It is a system to detect crustal movements instantaneously using real-time data (one-
second interval) of CORSs. 15 S3 analysis is a type of GEONET analysis using hourly observation data of a random duration and
IGS ultra-rapid products and conducted mainly in emergencies. It is also known as a very quick
solution and is conducted mainly with data for three hours from the viewpoint of stability and accuracy
of analysis.
Annex3-18
Chapter 3
Emergency Disaster Response Activities
3.1 Disaster Responses after the Mainshock
Analysis of GEONET data with the REGARD system conducted immediately after
the mainshock revealed that it caused subsidence up to more than one meter deep on
the north side of the Futagawa fault and upheaval up to more than 30 cm high on the
south side of the fault. Interferometric analysis of SAR data acquired by the ALOS-2
radar satellite also revealed that, in the horizontal direction, there were lateral
dislocations of up to more than one meter long toward the east on the north side and
up to more than 50 cm long toward the west on the south side.
The area damaged by the foreshock was struck by an even greater earthquake, which
caused destruction and collapse of many houses and slopes over extensive areas and
death of 40 people. In the Tateno area of Minamiaso Village, the Aso Ohashi Bridge,
which is an arched bridge longer than 200 m in length, collapsed due to a large
landslide caused by the mainshock and cut off the main traffic route between
Kumamoto City and the Aso Caldera area. Being fully alert to this alarming situation
in Kumamoto area, GSI began its disaster response activities in accordance with the
renewed strategy. It held the 7th to 10th Headquarters meetings twice a day on the
weekend holidays of 16 (Sat.) and 17 (Sun.) April to confirm the damage caused by
the mainshock, and check and adjust their operations to the changing situations.
3.1.1 Assistance to Other Organizations
Since requests for damage-related geospatial information from relevant authorities
were increasing after the mainshock, GSI provided assistance to ODMHQ and
relevant organizations with geospatial information by deploying staff members of
RSD-Kyushu there. In order to make this assistance sustainable, staff members of
surrounding RSDs were also deployed to RSD-Kyushu as well as ODMHQ.
3.1.2 Aerial Photography and Interpretation
The flight plan of aerial photography after the foreshock was revised to cover the
larger extent of the areas possibly damaged by the mainshock. In the afternoon of 16
April, aerial photographs taken from GSI’s airplane for making vertical photograph
Annex3-19
were transmitted from the airport in Kyushu to the GSI Head Office in Tsukuba via
the internet. Aerial photographs were also taken by affiliated companies. Aerial
photography of all scheduled areas was nearly completed by 20 April. Ortho-rectified
aerial photos were consequently made public through the GSI Map website.
Concurrently, GSI aerial photo interpretation team began its work at 11:10 pm on 16
April to prepare a map of landslides caused by the earthquake, and ended at 3:25 am
on the following day. Approximately 12 hours later, at 3:00 pm on 17 April, the first
edition of the landslide distribution map was referred to the Sabo (Erosion and
Sediment Control) Department of MLIT, which is in charge of landslide disaster
management, in order to keep the integrity of government information for the public.
The final version of landslide distribution map was then released on the GSI website
late in the night of 18 April after incorporating the comments from MLIT.
3.1.3 UAV Imagery
Despite poor traffic conditions due to many unpassable roads immediately after the
earthquake, GSI-LB conducted UAV photography on 16 April at the landslide site of
the Aso Ohashi Bridge and in the other areas where faults emerged on the ground
surface. The acquired UAV videos were released on the GSI website. They were
quoted in many newspapers, including the New York Times in the US. Additional
videos of cracks on the ground surface were acquired by UAV on 18 and 20 April to
provide evidence of the extent of the earthquake faults that are longer than those that
had been known before. The result was also incorporated into the compilation of a
crack distribution map around the Futagawa Fault, which was also released on the
GSI website in the early evening of 20 April.
3.1.4 Geodetic Infrastructure Management
In order to make detailed analysis on crustal movement using GEONET data, the
operation status of CORS in the stricken areas had to be checked. The check-up was
completed by 9:30am on 16 April, eight hours after the mainshock. Although all
CORS were working, nine stations near the Futagawa Faults were initially running
with the internal auxiliary battery, which is supposed to last 72 hours only, due to grid-
power outages. While six out of nine stations regained the power very soon, the
remaining three were likely to stay powerless beyond their battery capacity. In order
to keep them operational, solar panels were installed in these three CORSs on 18 April.
Annex3-20
Due to the large crustal deformation in the stricken areas and their surroundings
caused by the earthquake, the existing survey results including the coordinates of
triangulation points, benchmarks and CORSs had to be suspended in order to avoid
errors in the surveys. The suspension was announced to government agencies and
survey companies throughout Japan at 6:00 pm on 16 April.
3.1.5 Information Provided through the GSI Map
Most geospatial information acquired and created by data analyses in the disaster
response activities, including the epicenter of the mainshock, S3 analysis results of
GEONET data and aerial photos of the stricken areas before and after the earthquake
were provided through the GSI map. When new information is uploaded on the GSI
map, it was announced through GSI website with a special banner as well as social
network services such as Twitter.
3.2 Applications of Geospatial Information to Address Secondary Disaster Risks
3.2.1 Concerns of Larger Landslides
While the areas around Kumamoto City were still frequently hit by aftershocks even
after the mainshock, they also had to endure heavy rainfall of approximately 20 mm
between the evening of 16 April and the morning of 17 April, and subsequently more
than 75 mm on 21 April. Because the ground had already been loosened by the severe
earthquakes and the subsequent aftershocks, it was seriously concerned that the rain
water that was seeping into the ground would cause much larger landslides as
secondary disasters. The areas stricken by the Kumamoto Earthquake are known to
be prone to landslides since it is covered extensively with a thick layer of pyroclastic
flows and volcanic ash, which has been accumulated over the years from the past
eruptions of Mt. Aso and other volcanoes, and tends to easily collapse with heavy
rainfall.
3.2.2 GSI Responses Addressing to Secondary Disaster Risks
Given that the earlier aerial photograph interpretation identified many landslides
caused by the earthquakes, the 14th Headquarters meeting on 21 April decided to
engage in the third mission of aerial photography of larger areas to cover the potential
land slide areas. Specifically, flight plans were developed for 23 areas by using the
GSI’s airplane and eleven airplanes of the affiliated companies, and a total of
approximately 10,000 aerial photographs were taken on 19 and 20 April.
Annex3-21
Fortunately, no secondary disasters (e.g., large-scale landslides) were identified with
the third aerial photography mission. Meanwhile, these aerial photographs were then
used by municipalities (local governments) of the stricken areas for the fast track
issuance of disaster victim certificates16 that prove the status of victims’ damaged
houses.
In the course of aerial photograph interpretation for landslides, GSI discovered some
cracks at the top of a slope in Aso City that were unknown to the rescue teams on the
ground and could potentially cause landslide. Therefore, in order to avoid the risk of
potential landslide of the slope, which could cause much damage to the community
below, GSI immediately transmitted emergency warning information to the ODMHQ
at 11:50 am on 21 April. As a result, the Aso City municipality advised the residents
of the slope area to evacuate at 2:00 pm.
3.3 Preparation of Shelter Distribution Map
Due to the two large earthquakes, 8,198 houses were destroyed completely, 29,761
were half-destroyed and 138,102 were partially destroyed (Cabinet Office, as of
September 14, 2016). Evacuees were compelled to live in shelters prepared by local
governments or in their cars. Approximately 180,000 residents were in the shelters
immediately after the mainshock. However, the national government’s ODMHQ did
not initially have adequate information on the distribution, locations and capacities of
all shelters, or their needs for supplies, and had extreme difficulty in providing
necessary relief supplies to the shelters that needed them in a timely manner, all
because it did not even know “where” the shelters were.
The Chief of the ODMHQ, Vice-Minister of the Cabinet Office at that time, took this
situation seriously, and requested GSI through its liaison official on 18 April to
prepare a shelter distribution map. In response to the request, GSI prepared a shelter
database and prepared a shelter distribution map and provided the first edition on 20
April. This map greatly contributed to the improvement of the ODMHQ’s access to
16 Disaster victim certificate: If a building is damaged by a natural disaster, the municipal government
issues a disaster victim certificate to its resident after conducting a damage certification investigation
of the building based on the request from the resident. The types of certification vary by the degree
of damage to the building (e.g., totally destroyed, mostly destroyed, half-destroyed, partially
destroyed). The certificate serves as official proof when victims receive housing-related support or
claim for earthquake or other damage insurance money.
Annex3-22
shelters and of the efficiency in supporting evacuees. Although some of the shelters
have been rearranged or abolished since then with the progress of reconstruction of
the stricken areas, GSI continued to contribute to the updating of the map based on
the latest information on shelters provided via GSI staff members deployed to
ODMHQ, until early August 2016.
3.4 Meeting the Needs of Stakeholders
NGIAs are mandated to create, manage and provide geospatial information of the
respective countries. In the course of fulfilling this important mission, it is crucial to
pay much attention to the needs of users on the products. The same thing is true in
disaster responses, and it is more challenging for NGIAs to meet user needs because
the situations of the stricken areas change rapidly over time. In the case of the
Kumamoto Earthquake, the requests for geospatial information from the ODMHQ
and other government offices actually changed much over time. In this connection, it
is important to deploy staff members to key disaster management organizations to find
out the latest user needs and respond to them in a timely manner. In addition, in order
for NGIA’s geospatial information to contribute to disaster response activities to
protect people’s lives, safety and assets, it is important to always confirm what kind
of information is transmitted to who and how, and if it is transmitted accurately and
at the best timing.
3.4.1 Provision of Geospatial Information to Public Organizations
Established in the Kumamoto prefectural government building, ODMHQ consisted
of personnel gathered from various ministries and agencies, working in the same room.
GSI deployed two staff members to ODMHQ to liaise with the other ministries and
agencies and find out and respond to their needs. They immediately recognized the
need of printers to print out maps for the rescue and recovery operations. Based on
their suggestion, GSI sent large-format printers to ODMHQ and provided map
printing services there. Also, GSI liaisons listened to the needs of the ODMHQ and
made necessary modifications to the GSI data before printing maps.
As a DGO, GSI puts the highest priority in meeting the need of the other government
offices. Whenever emergency aerial photographs and other geospatial information
were newly acquired through its disaster response operations, push-type e-mails
containing the URL of the download site were sent simultaneously to relevant
government offices, including local governments, police, and self-defense force that
Annex3-23
have been actively engaged in their operations in the stricken areas. A total of 49 e-
mail messages were sent out until 15 July. In addition, GSI responded to 40 requests
for geospatial information from public organizations. For example, GSI was asked by
the police and the Kumamoto prefectural government to calculate the volume of
debris caused by landslides by analyzing aerial photographs to estimate the amount
of work to remove the debris in the search of persons who went missing in landslides.
GSI also provided topographical maps of Kumamoto with coordinate grids through
its RSDs to the counterpart Regional Development Bureaus of MLIT that deployed
their staff members to the stricken areas in Kumamoto in order to support their
recovery operations on the damaged infrastructure.
3.4.2 Provision of Geospatial Information to Mass Media and the Public
Mass media is one of the most effective channels to disseminate information to people
in different sectors and communities in a timely manner, particularly in the case of
disasters. At the same time, the journalists working in mass media need to understand
the significance of the information before releasing it through their media to make
sure that the information will be well understood by the recipients. Since some of the
geospatial information GSI provides during its disaster response activities is often
technical and may not be easily understood by the recipients, GSI sometimes invites
journalists at a press conference to explain to them about the technical details in an
easy-to-understand manner, in addition to normal press releases.
It is also important to have other channels to reach out to the general public. Because
of the recent infiltration of social network services into the society, it is particularly
effective to provide timely information to the general public through social network
services including Twitter and YouTube. For example, GSI-LB’s UAV videos have
received significantly increased access of more than 250,000 times, once it was
tweeted in the Twitter.
3.4.3 Functional Teams for Provision of Geospatial Information
When a large disaster hits the country, the GSI’s guidelines for disaster management
stipulates the immediate establishment of specific functional teams, including
recording, public relations, information provision support, and emergency map
production as to fulfill cross-cutting tasks during the disaster. These designated teams
process the requests from relevant stakeholders by providing the geospatial
information prepared by GSI in such a way to meet their needs.
Annex3-24
Chapter 4
Activities for Recovery and Reconstruction
4.1 Development of a Disaster Response Plan for the Recovery Phase
In the stricken areas, major transportation services were gradually resumed and
recovered with the reopening of all Kyushu Shinkansen (Bullet train) lines on 27 April,
less than two weeks after the earthquake, and the restoration of expressways for
automobile in Kumamoto Prefecture was also on the right track for the reopening by
mid-May. Living conditions of residents in the stricken areas were beginning to return
to normal, with the power supply completely regained by 20 April, and 90% of water
supply recovered by 21 April. While approximately 38,000 people were still
evacuated to shelters at the end of April, the disaster operations were moving towards
recovery phase from initial emergency phase.
Emergency disaster responses were nearly completed by the end of April. Since
efforts by local governments and other organizations were expected to start in full
fledge starting from early May, GSI began to plan the preparation and provision of
geospatial information that would be useful in the recovery and reconstruction phase.
Specifically, it developed plans on the resurveying of triangulation points and
benchmarks, and the preparation and provision of maps for recovery and
reconstruction measures and elevation data.
4.2 Geospatial Information Necessary for Recovery and Reconstruction
GSI commenced the following processes in early May to prepare and provide
geospatial information necessary for the recovery and reconstruction phase in a timely
manner:
・Resurveying of triangulation points and benchmarks;
・Preparation and provision of aerial laser surveys and digital elevation models as
measures against the rainy season for the areas that underwent subsidence after
the earthquake;
・Preparation and provision of basic maps necessary for reconstruction planning;
and
・Revision of the active fault maps.
Annex3-25
4.2.1 Resurvey of Control Points
The first task that needs to be done before major reconstruction activities is the
resurvey of control points, including triangulation points and benchmarks that have
been moved by the co-seismic activities of the earthquake. However, there are two
questions that have to be answered before actually starting the resurveying project: i)
what will be the extent of the areas for resurveying or more specifically, which control
points will have to be resurveyed?; and ii) when will be the earliest time to start the
resurveying, since the ground was still moving, though slowing down, even after the
earthquake due to the post-seismic activities around the faults?
When the CORS system was not available in the past, GSI had to spend many months
to resurvey all ground control points that may have been influenced by crustal
movement. Thanks to the GEONET, however, GSI is now able to accurately monitor
the extent and amount of crustal movement in a few hours. This capability enabled
GSI to find the control points that needed to be resurveyed and anticipate when the
post-seismic activities would wane.
Based on the amount and extent of crustal movement detected by GEONET, 38
CORSs, 4,169 triangulation points and 296 benchmarks in Kumamoto and four
surrounding prefectures had been already announced to be suspended for use at 6:00
pm on 16 April. By monitoring the GEONET data, GSI decided to revise the
coordinates of 38 suspended CORSs on 16 June, two months from the mainshock,
and identified the control points that needed to be resurveyed. While all 4,169
triangulation points were found to be resurveyed, due to the inaccessibility to the
monuments, 116 points were not resurveyed and kept suspended. As for the
benchmarks, it turned out only 156 points were found to be resurveyed while the rest
did not need resurveying due to the negligible impact of the earthquake. Resurveying
works on the ground were outsourced to private survey companies, and new survey
results of almost all reference points were provided by 12 September. For those
control points that had been placed by local governments, GSI provided
transformation parameters to calculate the new coordinates from the original
coordinates.
4.2.2 Post-earthquake Aerial Laser Survey
There emerged a concern about the danger of further landslides and floods caused by
heavy rain during monsoon season in June and July prevailing Kyushu region. Since
Annex3-26
ground subsidence caused by the crustal movements of normal fault activities at the
earthquake was found in some low elevation areas of the stricken areas, some local
governments requested post-earthquake elevation data for measures against potential
floods caused by the heavy rain and typhoons. Aerial laser surveying was conducted
with a private company and completed on 8 May. A digital elevation model (DEM)
was created from the laser data. Then, the newly acquired DEM data was subtracted
from the DEM data that was developed by aerial laser surveying in 2005 to prepare
height difference data.
The height difference map that shows the height difference between before and after
the earthquake was prepared from the height difference data and presented to the
mayor of Mashiki Town, who requested the map. On 31 May, the map was also
provided and explained to the mayor of Nishihara Village, east of Mashiki town, and
other parties concerned. The map was made available on the GSI’s web map, for a
variety of applications including flood and inundation forecasts.
4.2.3 Basic Maps for Recovery and Reconstruction
Basic maps are one of the most fundamental information we need to have before
starting the reconstruction of damaged infrastructures and the communities in the
stricken areas. The maps will be used to develop a reconstruction plan, which requires
basic “backdrop map” reflecting the post-earthquake geography in the stricken areas.
Therefore, the GSI prepared 1:2,500-scale basic and photo maps to be used by the
national and local governments as their standard basic maps. These maps were
prepared using aerial photographs taken after the earthquake that show the landslides,
collapsed buildings and other damage on the ground accurately. The same type of map
was also prepared for the tsunami stricken areas after the Great East Japan Earthquake
in 2011. The final versions of ortho-photo maps and the basic maps were completed
by the end of September 2016 and the end of December 2016, respectively, after
simplified preliminary version of both types of maps were provided in June.
4.2.4 Revision of Active Fault Maps
Since new cracks that appeared on the ground after the earthquake suggested that the
existing active faults that had been mapped before actually have longer and complex
structures, it became necessary to provide the latest active fault information for future
urban planning and people’s consideration on the places to live in, GSI is currently
updating active fault maps in the stricken areas, where the original version of active
Annex3-27
fault maps was published in 2001, based on the knowledge and geomorphological
evidence of related active faults at that time.
4.3 Other Relevant Activities
The Kumamoto Earthquake severely damaged the Kumamoto Castle, one of the most
prominent symbols of Kumamoto area, of which the original premise was built around
1470. In its attempt to repair the Castle, the Kumamoto City government requested
GSI to develop a detailed 3D model of the Castle with UAVs to record the conditions
of collapsed stone walls and other damaged parts. GSI also employed a terrestrial laser
system to develop a detailed 3D model of stone walls to identify and record each stone
piece which will have to be removed from the stone walls first before the walls are to
be reconstructed. The UAV videos were made available on the GSI website and
YouTube on 19 May.
During preparation of such geospatial information necessary for recovery and
reconstruction, heavy rain exceeding a total of 500 mm that continued in the
Kumamoto region between 20 and 30 June caused many landslides as secondary
disasters. The rain also caused power outages at electronic reference points and the
situation seemed to be back to the emergency response period from the recovery
period. GSI took aerial photographs of the area where landslides occurred in
cooperation with an affiliated company in early July, and submitted the results of
extracting landslide sites in the form of a landslide distribution map to the Sabo
Department of MLIT. The map was also made available for the general public on the
GSI website with the final update on 27 July.
Annex3-28
Chapter 5
Lessons Learned from the Kumamoto Earthquake Response
5.1 Managing Disaster Responses
The Disaster Management Headquarters meetings at GSI were held every day, up to
three times a day, since the first meeting held immediately after the foreshock of the
Kumamoto Earthquake on 14 April, to keep all staff members on the same page on
the situations on the disaster, and to discuss the policies and actions to be taken by
GSI to appropriately respond to the disaster, while flexibly updating them in
accordance with the changing circumstances of the stricken areas under the leadership
of the top management. Replacement of the Director General of the GSI, who is also
the Chief of the Disaster Management Headquarters, on 21 June did not make any gap
in the leadership on the policies or activities, because the new Director General had
been working closely with the former Director General as his Deputy.
As mentioned above, in the case of large disasters, such as the Kumamoto Earthquake,
the GSI’s disaster responses have been managed by the Disaster Management
Headquarters led by the Director General. At the outset of a disaster, the latest
situations are shared, and the initial, emergency and recovery/reconstruction policies
are discussed and revised at the headquarters meetings. Disaster response activities
are conducted in accordance with the policies, and geospatial information that shows
the impact of the disaster on the ground is prepared and provided to the national and
local governments and other stakeholders for their use in disaster responses in the
stricken areas. While GSI usually starts with preparing geospatial information that it
considers necessary from the viewpoint of the provider, it is important to find out the
needs of recipients/users of the information, and when it finds it necessary, to tailor
the original geospatial information to make it meet their needs by establishing a good
communication channel with them to keep up with their changing needs.
In managing the disaster response activities, it is also important to improve the way
the disaster responses are conducted by reviewing them through the cyclic steps of
Plan, Do, Check and Action in each disaster phase and when each cycle of disaster
response is completed, by following the PDCA cycle, which is a leading management
method for quality control in business activities. It is also useful to find out how the
Annex3-29
GSI’s products have been used in different government offices for the future
improvements of disaster responses.
Most GSI’s disaster responses for the Kumamoto Earthquake, which started with the
foreshock on 14 April, were found to be completed at the 42nd Headquarters meeting
on 25 July. In order to find out the potential areas of improvement in the disaster
response activities and policies while the memory of the staff members are still fresh,
a meeting to review the emergency responses was held on 8 July in advance of the
42nd meeting, in which staff members involved in the disaster responses presented
issues and areas for improvements in disaster response operations and procedures.
These specific points are to be reflected on future improvement in disaster responses.
When a large-scale natural disaster occurs, it becomes a concern not only of the
victims but also of the entire nation, and its progress is covered extensively by TV
and other mass media. Under such circumstances, there are high expectations for
timely provision of appropriate geospatial information to respond to the needs of the
stricken areas and relevant authorities. It is the responsibility of NGIAs to provide the
latest situations of the land promptly and present it to the society, while continuously
improving its operations in their timeliness and accuracies.
5.2 Conclusion
The above mentioned activities are just one example of disaster responses conducted
by GSI. Just after the end of major responses to the Kumamoto Earthquake, three
typhoons hit the Japanese archipelago in August caused river flooding and landslides
that required another disaster responses.
Although it is impossible to prevent all natural disasters, there are still many things
that NGIAs can do to minimize the damage at times of disaster, through preparation
and provision of geospatial information. GSI will continue to take thoroughgoing
measures based on its experience and lessons learned in past disaster responses while
learning best practices of the other countries.