Embed Size (px)
Citation preview

Disaster Relief Fund: Monthly Report Through November 30, 2013 December 5, 2013 Fiscal Year 2014 Report to Congress
Federal Emergency Management Agency

i
Foreword from the AdministratorDecember 5, 2013
I am pleased to present the following “Disaster Relief Fund: Monthly Report,” which has been prepared by the Federal Emergency Management Agency (FEMA).
In response to language set forth in the Fiscal Year (FY) 2014Continuing Appropriations Act (P.L. 113-46), which continues the terms and reporting requirements of theFY 2013 DHS Appropriations Act (P.L. 113-6), the report provides details on funding activities for the Disaster Relief Fund (DRF) through November 30, 2013.
Pursuant to congressional requirements, this report is being provided to the following Members of Congress:
The Honorable John R. CarterChairman, House Appropriations Subcommittee on Homeland Security
The Honorable David E. PriceRanking Member, House Appropriations Subcommittee on Homeland Security
The Honorable Mary L. LandrieuChairman, Senate Appropriations Subcommittee on Homeland Security
The Honorable Daniel CoatsRanking Member, Senate Appropriations Subcommittee on Homeland Security
Inquiries relating to this report may be directed to me at (202) 646-3900 or to the Department’s acting Chief Financial Officer, Chip Fulghum, at (202) 447-0441.
Sincerely,
W. Craig FugateAdministratorFederal Emergency Management Agency

1
Disaster Relief Fund:Monthly Report through November 30, 2013
Table of ContentsI. Legislative Language ......................................................................................................... 2
II. Background ........................................................................................................................ 3
Appendix A: DRF Appropriations Summary ............................................................................ 4
Appendix B: DRF Funding Activity .......................................................................................... 5
Appendix C: Hurricane Sandy FY 2013 Estimates ................................................................... 11
Appendix D: Allocations, Obligations, & Expenditures ........................................................... 12
Appendix E: Estimate of Fund Exhaustion Date ....................................................................... 16

2
I. Legislative Language
This document has been compiled pursuant to language set forth in the FY 2014 ContinuingAppropriations Act (P.L. 113-46), which continues the terms and reporting requirements of the FY 2013 DHS Appropriations Act (P.L. 113-6). The language in P.L. 113-6 states:
Provided further, That the Administrator of the Federal Emergency Management Agency shall submit to the Committees on Appropriations of the Senate and the House of Representatives the following reports, including a specific description of the methodology and the source data used in developing such reports …
(2) an estimate or actual amounts, if available, of the following for the current fiscal year shall be submitted not later than the fifth day of each month:
(A) a summary of the amount of appropriations made available by source, the transfers executed, the previously allocated funds recovered, and the commitments, allocations, and obligations made;
(B) a table of disaster relief activity delineated by month, including—(i) the beginning and ending balances;(ii) the total obligations to include amounts obligated for fire
assistance, emergencies, surge, and disaster support activities;(iii) the obligations for catastrophic events delineated by event and
by State; and(iv) the amount of previously obligated funds that are recovered;
(C) a summary of allocations, obligations, and expenditures for catastrophic events delineated by event; and
(D) the date on which funds appropriated will be exhausted.
This report covers activities through November 30, 2013.

3
II. Background
P.L. 113-46, which continues the terms and reporting requirements of P.L. 113-6, requires that the FEMA Administrator provide a report by the 5th day of each month on the DRF, which includes a funding summary, a table delineating the DRF funding activities each month by state and event, a summary of the funding for the catastrophic events, and an estimate of the date on which the funds will be exhausted.
Consequently, the following report elements are included herein:
1. Appendix A is an appropriations summary that includes a synopsis of the amount of appropriations made available by source, the transfers executed, the previously allocated funds recovered, and the commitments, allocations, and obligations.
2. Details on the DRF funding activities delineated by month are presented in Appendix B.
3. Hurricane Sandy FY 2013 estimates by spending categories per P.L. 113-2 are presented in Appendix C.
4. Funding summaries for the current active catastrophic events including the allocations, obligations, and expenditures are contained in Appendix D.
5. An estimate of the fund exhaustion date, or end of fiscal year balance, is provided in Appendix E.

APPENDIX A: DRF Appropriations Summary
Department of Homeland Security - Federal Emergency Management Agency
Disaster Relief Fund Congressional Monthly Report
FY 2014 Activity
Through 11/30/13
Dollars in Millions
Change Since Status of Obligations: Major Declarations Base Total Last Report
FY 2014 APPROPRIATION /CR (1) 6,076 577 6,653 0
FY 2013 Emergency Funding 0 0 0 0
FY 2014 Supplemental 0 0 0 0
Prior Years Deobligations (Recoveries) 103 83 186 72
Prior Years Carryover 6,682 1,810 8,492 0
Transfers (2) 0 -24 -24 0
FY 2014 APPROPRIATION AVAILABLE (3) 12,861 2,445 15,307 72
Less: TOTAL OBLIGATIONS 802 24 827 519
UNOBLIGATED BALANCE: 12,059 2,421 14,480 -447
Status of Commitments:Less: TOTAL COMMITMENTS 816 36 852 529
UNCOMMITTED BALANCE: 12,045 2,409 14,455 -457
Status of Allocations:TOTAL ALLOCATION 817 154 971 534
Less: TOTAL OBLIGATIONS 802 24 827 519
UNOBLIGATED ALLOCATION: 15 130 144 15
Amount Undistributed/Unallocated 12,044 2,291 14,336 -461
NOTES:
(1) Pursuant to Sec. 110 of P.L. 113-46, OMB apportioned funding at a rate of operations equal to 29.32%, which has been made available for use thru 1-15-2014 ($1,944M)(2) Transfer to DHS OIG
(3) Transfer authority into the Base is capped at 10% of Base Appropriation (currently estimated at $244 M)
Source of financial information is the Integrated Financial Management Information System (IFMIS)
Totals that have minor discrepancies are due to roundingDRF Monthly Report
Appropriation Summary4

APPENDIX B: DRF FUNDING ACTIVITY
Disaster Relief Fund Estimated Monthly Obligations FY2014Appropriation Funding, Catastrophic and Non-Catastrophic Spending, and Recoveries
( $ in millions)Through 11/30/13
Oct-13 Nov-13 Dec-13 Jan-14 Feb-14 Mar-14 Apr-14 May-14 Jun-14 Jul-14 Aug-14 Sep-14 TotalBeginning of Month DRF Balance $8,492 $14,927 $14,480 $14,480 $14,480 $14,480 $14,480 $14,480 $14,480 $14,480 $14,480 $14,480
(1)FY 2014 Continuing Resolution $6,653OIG Transfer (24)
Emergencies $ (0.2) $ (0.1) $ - $ - $ - $ - $ - $ - $ - $ - $ - $ - $ (0.2) Fire Management $ (0.1) $ (1.0) $ - $ - $ - $ - $ - $ - $ - $ - $ - $ - $ (1.0) Surge $ (0.4) $ (1.0) $ - $ - $ - $ - $ - $ - $ - $ - $ - $ - $ (1.4)Disaster Support Activities $ (1.0) $ (20.8) $ - $ - $ - $ - $ - $ - $ - $ - $ - $ - $
$ (21.8) (24.4) Total Base Funding $ (1.7) $ (22.8) $ - $ - $ - $ - $ - $ - $ - $ - $ - $ -
Non Catastrophic DR Obligations $ (130.0) $ (164.0) $ - $ - $ - $ - $ - $ - $ - $ - $ - $ - $ (294.0)
Catastrophic DR Obligations $ (176.0) $ (332.0) $ - $ - $ - $ - $ - $ - $ - $ - $ - $ - $ $
(508.0) (802.0) Total Disaster (DR) Funding $ (306.0) $ (496.0) $ - $ - $ - $ - $ - $ - $ - $ - $ - $ -
Total DRF Obligations $ (307.7) $ (518.8) $ - $ - $ - $ - $ - $ - $ - $ - $ - $ - $ (826.5)
Recoveries of Previous Years De-Obligations $ 114 $ 72 $ - $ - $ - $ - $ - $ - $ - $ - $ - $ - $ 186
End of Month Balance (Including Recoveries) $ 14,927 $ 14,480 $14,480 $14,480 $14,480 $14,480 $14,480 $14,480 $14,480 $14,480 $14,480 $14,480
(1) FY 2014 Continuing Resolution (less OIG transfer)
Obligations data obtained from the Integrated Financial Information Management System (IFMIS)Totals that have minor discrepancies are due to rounding Summary5

APPENDIX B: DRF Funding ActivityDisaster Relief Fund Estimated Monthly Obligations FY2014
DRF Monthly Spend Plan (FY 2014)( $ in millions)Through 11/30/13
Beginning of Month DRF Balance (1) FY 2014 Continuing Resolution (2)
DHS OIG Transfer
Total Available Beginning of Month Major Declarations Base
Oct-13$8,492$6,653
($24)
$15,121$12,758
$2,363
Nov-13$14,927
$14,927$12,529
$2,398
Dec-13$14,480
$14,480$12,059
$2,421
Jan-14$13,807
$13,807$11,467
$2,340
Feb-14$12,870
$12,870$10,611
$2,259
Mar-14$11,823
$11,823$9,645$2,177
Apr-14$10,542
$10,542$8,446$2,096
May-14$9,738
$9,738$7,723$2,015
Jun-14$9,073
$9,073$7,139$1,934
Jul-14$8,426
$8,426$6,573$1,853
Aug-14$7,796
$7,796$6,025$1,772
Sep-14$7,332
$7,332$5,642$1,691
Total
DRF Base Activities (3)Emergencies Monthly Actual/Estimated Obligations
Fire Management Monthly Actual/Estimated Obligations
Surge Monthly Actual/Estimated Obligations
Disaster Support & Other Activities Monthly Actual/Estimated Obligations
Estimated/Actual Base Obligations
($0.2)
($0.1)
($0.4)
($1.0)
($1.7)
($0.1)
($1.0)
($1.0)
($20.8)
($22.8)
($28)
($9)
($10)
($35)
($81)
($28)
($9)
($10)
($35)
($81)
($28)
($9)
($10)
($35)
($81)
($28)
($9)
($10)
($35)
($81)
($28)
($9)
($10)
($35)
($81)
($28)
($9)
($10)
($35)
($81)
($28)
($9)
($10)
($35)
($81)
($28)
($9)
($10)
($35)
($81)
($28)
($9)
($10)
($35)
($81)
($28)
($9)
($10)
($35)
($81)
($276)
($88)
($99)
($372)
($836)
DRF DR Activities
Average Monthly Major DR Activity (Non-Cat.)
GustavInitial FY 14 Spend Plan Monthly Actual/Estimated Obligations
IkeInitial FY 14 Spend Plan Monthly Actual/Estimated Obligations
Katrina Rita WilmaInitial FY 14 Spend Plan Monthly Actual/Estimated Obligations
Midwest FloodsInitial FY 14 Spend Plan Monthly Actual/Estimated Obligations
TN FloodsInitial FY 14 Spend Plan Monthly Actual/Estimated Obligations 2011 Spring TornadosInitial FY 14 Spend Plan Monthly Actual/Estimated Obligations 2011 Spring FloodsInitial FY 14 Spend Plan Monthly Actual/Estimated Obligations
($130)
($0)($0.4)
($0)($0.4)
($22)($21.8)
($4)($3.6)
($1)($1.1)
($4)($4.4)
($4)($3.6)
($164)
($1)($2)
($2)($3)
($119)($115)
($11)($4)
($1)($1)
($10)($10)
($8)($2)
($260)
($0)($0)
($11)($34)
($134)($75)
($6)($6)
($1)($1)
($14)($7)
($1)($4)
($260)
($3)($1)
($71)($5)
($103)($78)
($2)($6)
$0$0
($11)($13)
($1)($2)
($260)
($0)($1)
($25)($37)
($91)($105)
($1)($1)
$0($0)
($7)($10)
($2)($0)
($260)
($4)($4)
($8)($34)
($70)($83)
($0)($0)
$0$0
($3)($3)
($0)($0)
($260)
($3)($3)
($2)($23)
($83)($68)
($0)($0)
$0$0
($27)($27)
($2)($2)
($260)
($3)($3)
($8)($29)
($42)($83)
($1)($1)
$0$0
($4)($4)
($0)($0)
($260)
($0)($2)
($10)($10)
($79)($67)
($1)($1)
$0$0
($3)($3)
($2)($2)
($260)
($4)($4)
($40)($36)
($61)($74)
($0)($0)
$0$0
($5)($5)
($35)($35)
($260)
($2)($2)
($6)($6)
($49)($58)
($0)($0)
$0$0
($0)($0)
($0)($1)
($260)
($3)($3)
($3)($3)
($156)($136)
($3)($3)
$0$0
($9)($9)
($6)($6)
`($2,894)
($24)($26)
($187)($220)
($1,009)($965)
($29)($27)
($3)($3)
($97)($95)
($61)($59)
Estimates based on Nov. 2013 FEMA Spend PlansTotals that have minor discrepancies are due to rounding
6

APPENDIX B: DRF Funding ActivityDisaster Relief Fund Estimated Monthly Obligations FY2014
DRF Monthly Spend Plan (FY 2014)( $ in millions)Through 11/30/13
Oct-13 Nov-13 Dec-13 Jan-14 Feb-14 Mar-14 Apr-14 May-14 Jun-14 Jul-14 Aug-14 Sep-14 Total
IreneInitial FY 14 Spend Plan ($9) ($8) ($11) ($27) ($2) ($21) ($12) ($1) ($10) ($1) ($8) ($47) ($158) Monthly Actual/Estimated Obligations ($9.4) ($9) ($4) ($27) ($4) ($40) ($9) ($2) ($26) ($1) ($24) ($15) ($172)
LeeInitial FY 14 Spend Plan ($26) ($23) ($10) ($7) ($1) ($46) ($7) ($0) ($8) ($1) ($7) $15 ($122) Monthly Actual/Estimated Obligations ($26.0) ($5) ($4) ($4) ($2) ($48) ($8) ($0) ($9) ($1) ($7) ($9) ($122)
IsaacInitial FY 14 Spend Plan ($4) ($12) ($24) ($31) ($5) ($21) ($1) ($0) ($20) ($2) $0 ($15) ($135) Monthly Actual/Estimated Obligations ($4.3) ($4) ($2) ($49) ($15) ($30) ($1) ($0) ($13) ($2) $0 ($15) ($134)
SandyInitial FY 14 Spend Plan ($101) ($236) ($312) ($383) ($477) ($744) ($378) ($322) ($237) ($199) ($90) ($179) ($3,657) Monthly Actual/Estimated Obligations ($100.9) ($176) ($262) ($479) ($598) ($763) ($388) ($269) ($240) ($196) ($91) ($180) ($3,743)
Total DR Obligations ($306) ($496) ($659) ($923) ($1,033) ($1,266) ($790) ($651) ($633) ($615) ($450) ($639) ($8,460)
Estimated Monthly Recoveries $114 $72 $67 $67 $67 $67 $67 $67 $67 $67 $67 $67 $856 Major declarations $12 $10 $0 $0 $0 $0 $0 $0 $0 $0 $0 $0 $22 Sandy Supplemental $65 $16 $0 $0 $0 $0 $0 $0 $0 $0 $0 $0 $81 Base $36 $46 $0 $0 $0 $0 $0 $0 $0 $0 $0 $0 $83
Minimum Threshold for No-Notice Event ($1,000)
Estimated DRF Available at End of Month (Including Recoveries) $14,927 $14,480 $13,807 $12,870 $11,823 $10,542 $9,738 $9,073 $8,426 $7,796 $7,332 $5,680
Actual recoveries cumulative to date $114 $186 $186 $186 $186 $186 $186 $186 $186 $186 $186 $186
ActualEstimate
(1) FEMA plans to reassess all spend plans and projected spending at least quarterly and will update estimates and obligations based on new data. As we continue to work with the State
of NY Sandy estimates are likely to be adjusted upward
(2) Pursuant to Sec. 110 of P.L. 113-46, OMB apportioned funding at a rate of operations equal to 29.32%, which has been made available for use thru 1-15-2014 ($1,944M)
(3) Month-to-month projections for Base activities (excluding DRS) are based on historical averages
Estimates based on Nov. 2013 FEMA Spend PlansTotals that have minor discrepancies are due to rounding
7

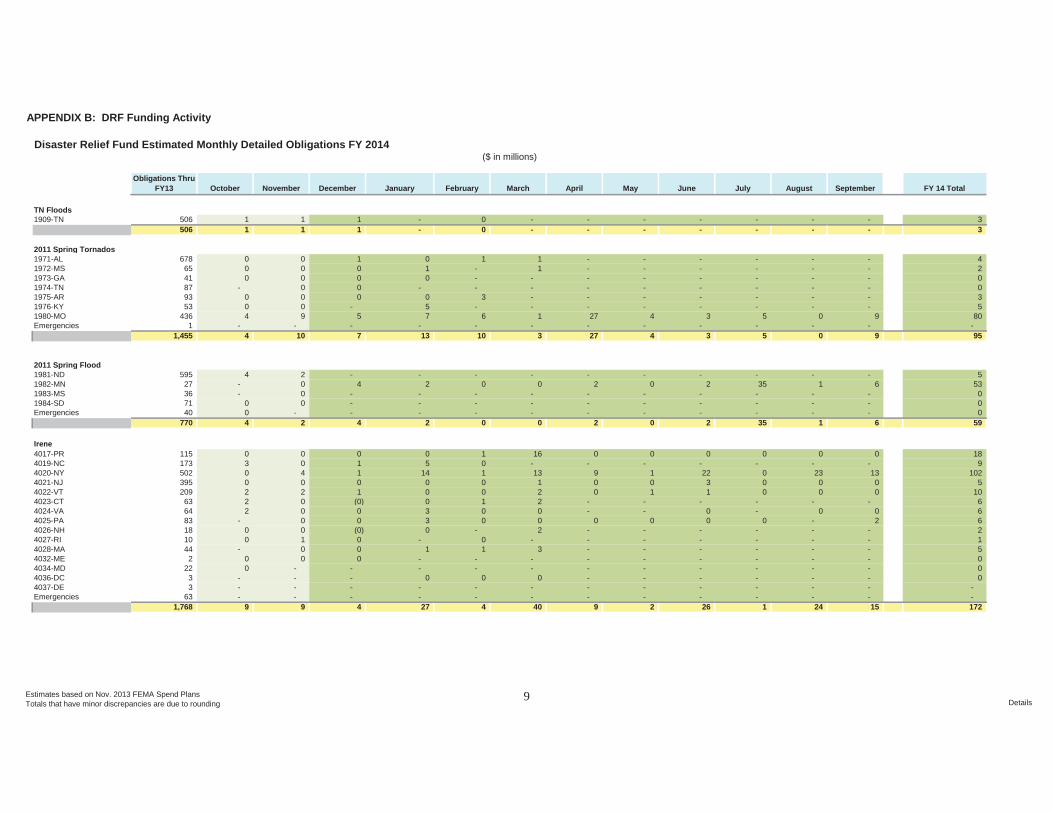
APPENDIX B: DRF Funding Activity
Disaster Relief Fund Estimated Monthly Detailed Obligations FY 2014($ in millions)
Cumula
Obligations
tive
Thru
FY13 October November December January February March April May June July August September FY 14 Total
Gustav Actual Actual Estimate Estimate Estimate Estimate Estimate Estimate Estimate Estimate Estimate Estimate
1786-LA 1,544 0 2 0 1 1 4 3 3 2 4 2 3 26
1789-AL 19 - - - - - - - - - - - - -
1793-AR 6 - - - - - - - - - - - - -
1794-MS 47 - 0 - - - - - - - - - - 0
1806-FL 8 - - - - - - - - - - - - -
Emergencies 67 - - - - - - - - - - - - -
1,690 0 2 0 1 1 4 3 3 2 4 2 3 26
Ike1791-TX 4,178 0 2 33 2 34 33 22 27 7 34 3 0 198
1792-LA 329 0 0 1 2 3 2 2 2 3 2 3 2 22
1797-AL 15 - - - - - - - - - - - - -
1802-KY 24 - - - - - - - - - - - - -
1804-AR 3 - - - - - - - - - - - - -
1805-OH 58 - 0 - - - - - - - - - - 0
Emergencies 45 - - - - - - - - - - - - -
4,651 0 3 34 5 37 34 23 29 10 36 6 3 220
Katrina Rita Wilma1602-FL 233 0 0 0 (0) 1 0 0 0 0 0 0 0 2
1603-LA 29,119 20 107 71 62 88 62 57 66 43 65 39 123 805
1604-MS 10,058 1 6 3 18 6 6 2 7 12 2 11 2 76
1605-AL 1,022 - 0 - - - - - - - - - - 0
1606-TX 1,900 0 1 - - - - - - - - - - 1
1607-LA 1,897 1 1 1 3 8 9 9 9 11 7 7 11 75
1609-FL 2,551 0 0 (0) (5) 2 6 0 0 0 0 0 0 6
Emergencies 805 - - - - - - - - - - - - -
47,586 22 115 75 78 105 83 68 83 67 74 58 136 965
Midwest Floods1760-MO 3 - - - - - - - - - - - - -
1763-IA 1,880 1 5 6 6 1 0 0 1 1 0 0 3 25
1765-NE 2 - - - - - - - - - - - - -
1766-IN 233 - 0 - - - - - - - - - - 0
1768-WI 163 0 0 - - - - - - - - - - 0
1770-NE 46 - - - - - - - - - - - - -
1771-IL 97 3 (1) - - - - - - - - - - 2
1772-MN 9 - - - - - - - - - - - - -
1773-MO 56 - - - - - - - - - - - - -
1774-SD 8 - - - - - - - - - - - - -
1775-OK 11 - - - - - - - - - - - - -
1776-KS 64 - - - - - - - - - - - - -
1777-MI 19 - 0 - - - - - - - - - - 0
2,590 4 4 6 6 1 0 0 1 1 0 0 3 27
Estimates based on Nov. 2013 FEMA Spend Plans
Totals that have minor discrepancies are due to rounding Details
APPENDIX B: DRF Funding Activity
Disaster Relief Fund Estimated Monthly Detailed Obligations FY 2014($ in millions)
TN Floods1909-TN
Obligations Thru FY13 October November December January February March April May June July August September FY 14 Total
506 506
11
1 1
1 1
--
0 0
--
- -
--
- -
- -
--
- -
33
2011 Spring Tornados1971-AL1972-MS1973-GA1974-TN1975-AR1976-KY1980-MOEmergencies
678 65 41 87 93 53 436 1 1,455
-
-
000
004
4
0 0 0 0 0 0 9 - 10
1 0 0 0 0 - 5 - 7
010
-057
-13
1 - - - 3 - 6 - 10
----
-
1 1
1
3
- - - - - - 27
- 27
------
-
4
4
- - - - - -
3 -
3
- - - - - -
5-
5
------
-
0
0
- - - - - - 9 - 9
420035
80-95
2011 Spring Flood1981-ND1982-MN1983-MS1984-SDEmergencies
595 27 36 71 40 770
--
4
004
2 0 0 0 - 2
- 4 - - - 4
-2
---
2
- 0 - - - 0
-
---
0
0
- 2
- - -
2
-
---
0
0
- 2
- - -
2
- 35
- - - 35
-
---
1
1
- 6 - - - 6
553000
59
Irene4017-PR4019-NC4020-NY4021-NJ4022-VT4023-CT4024-VA4025-PA4026-NH4027-RI4028-MA4032-ME4034-MD4036-DC4037-DEEmergencies
115 173 502 395 209 63 64 83 18 10 44 2 22 3 3 63 1,768
-
-
---
0300222
00
00
9
0 0 4 0 2 0 0 0 0 1 0 0 - - - - 9
0 1 1 0 1 (0) 0 0 (0) 0 0 0 - - - - 4
05
14000330
-1
--
0--27
1 0 1 0 0 1 0 0 - 0 1 - - 0 - - 4
-
-
--
--
16
13 1 2 2 0 0 2
3
0
40
0 -
9 0 0
- -
0 - - - - - - - -
9
-
--
--------
0
1 0 1
0
2
0 - 22 3 1
- 0 0
- - - - - - - - 26
0-
0 00
- -
0 - - - - - - - -
1
-
-
---------
0
2300
0
24
0 - 13 0 0 - 0 2 - - - - - - - - 15
189
1025
10666215000
--172
Estimates based on Nov. 2013 FEMA Spend PlansTotals that have minor discrepancies are due to rounding Details9

APPENDIX B: DRF Funding Activity
Disaster Relief Fund Estimated Monthly Detailed Obligations FY 2014($ in millions)
Lee4030-PA4031-NY4038-MD
Obligations Thru FY13 October November December January February March April May June July August September FY 14 Total
321 167 11
0 26 0
- -
2 3
- 0
1 3
- 0
-
1 2 0 0
1 0
- 0 1
2 46
- 0
1 7
- 0
-
0 0
- 0
1 8
- 0
0 0
- 0
1 7
- 0
2 6
- 0
12108
004039-NJ
4041-LA4045-VAEmergencies
5 6 7 2
--
- -
0 -
-
0 1
-0
- -
- -
--
-
- -
- - - -
- -
-
- -
- - -
11
- 519 26 5 4 4 2 48 8 0 9 1 7 9 122
Isaac4080-LA4081-MS4082-AL4084-FL
227 28 0 -
11 266
4 0
- 0
- 4
46 53
3 0 0 1
1 0 0 1
33 6
- 10 0
12 1 0 1 1
30 - - -
0 -
1 0
0 - - -
13 -
0 -
0 -
0 2
- - - (0)
14 - -
0
11091
141
134Emergencies
(1)Sandy 4085-NY4086-NJ4087-CT4089-RI4090-DE4091-MD4092-VA4093-WV
- - 4,318 1,903 88 13 6
1 0 0 0 0
1 -
- 4
106 67 2 0 0 0 0 0
- 2
226 36 0
- 0 0
-
49
386 82 4 2 1 2 0 0 0
15
489 98 2
- 0 0
- 0
- 30
400 357
3 0 0 2 1 0
- 1
327 57 4
- 0 0
-
- 0
183 81 3 0
- - -
1
- 13
152 81 4
- 1 2 0
- 2
118 76 1 0
- - -
1
- (0)
71 15
- -
0 2 0
- 15
167 14
- - - - -
2,6691,016
243272300
12
4095-NH4096-DC4097- MA4098-OH4099-PA
41 12 20 3 15 14 6,453
0 1
- 0
101
0 0 1 0 1
176
- - -
0 -
0 262
- 2 0 0
479
-
8 1
- 598
0 0
- 0 0
763
- - - -
0 - 388
- - -
0 0
269
- 0 0 0 0 1
240
- - -
1 - 196
- -
0 -
1 1
91
- - - - -
0 180
33
3,744
TOTAL (1) 68,353 176 332 399 663 773 1,006 530 391 373 355 190 379 5,568
(1) FEMA plans to reassess all spend plans and projected spending at least quarterly and will update estimates based on new data
Estimates based on Nov. 2013 FEMA Spend PlansTotals that have minor discrepancies are due to rounding Details10

APPENDIX C: HURRICANE SANDY FY 2014 ESTIMATES
Hurricane Sandy FY 2014 Actuals/Estimates*as of November 30, 2013
($ in Millions)
CategoryActual through
September 2013Actual /Estimated
1st QtrEstimated
2nd QtrEstimated
3rd QtrEstimated
4th QtrFiscal Year 2014
Totals
Estimated Life To Date Totals Thru
FY 14Public Assistance $3,402 $465 $1,652 $710 $298 $3,125 $6,527Individual Assistance $1,881 $16 $18 $2 $0 $36 $1,917Mitigation $90 $11 $145 $165 $150 $471 $561Operations $393 $1 $0 $0 $0 $1 $394AdministrativeTotal**
$710 $46 $25 $20 $20 $111 $821$6,476 $539 $1,840 $897 $467 $3,744 $10,220
*Additional reporting requirement per P.L. 113-2
Sandy Estimates11

APPENDIX D: ALLOCATIONS, OBLIGATIONS AND EXPENDITURES
Through 11/30/2013
0
9,000
18,000
27,000
36,000
45,000
Katrina Rita Wilma
($ m
illio
ns)
Hurricane
Allocations, Obligations and Expenditures for Katrina, Rita and Wilma (Cumulative)
AllocationsObligationsExpenditures
Allocations
Obligations
Expenditures
Katrina Rita Wilma TotalAllocations 41,935 3,815 2,551 48,301Obligations 41,926 3,815 2,551 48,292Expenditures 37,777 3,686 2,503 43,965
Source of financial information is the Integrated Financial Information Management System (IFMIS)Totals that have minor discrepancies are due to roundingTotal obligations include prior-year de-obligations
Disaster Relief FundMonthly Report
Graphical RepresentationKatrina, Rita and Wilma Allocations, Obligations and Expenditures
12

APPENDIX D: ALLOCATIONS, OBLIGATIONS AND EXPENDITURES
Through 11/30/2013
0
800
1,600
2,400
3,200
4,000
4,800
Ike Gustav 2008 Midwest Floods
($m
illi
on
s
Event
Allocations, Obligations and Expenditures for Ike, Gustav & 2008 Midwest Floods (Cumulative)
Allocations
Obligations
Expenditures
Ike Gustav 2008 Midwest Floods Total
Allocations 4,728 1,692 2,618 9,039
Obligations 4,728 1,692 2,618 9,039
Expenditures 4,097 1,530 1,968 7,595
Source of financial information is the Integrated Financial Information Management System (IFMIS)
Totals that have minor discrepancies are due to rounding
Total obligations include prior-year de-obligations
Disaster Relief Fund
Monthly Report
Graphical Representation
Ike, Gustav Midwest Floods Allocations, Obligations and Expenditures

APPENDIX D: ALLOCATIONS, OBLIGATIONS EXPENDITURES
Through 11/30/2013
Tropical Storm Lee Hurricane Sandy Hurricane Isaac TotalAllocations 754 6,673 697 8,125Obligations 754 6,672 698 8,125Expenditures 491 4,805 539 5,835
Source of financial information is the Integrated Financial Information Management System (IFMIS)Totals that have minor discrepancies are due to roundingIncludes Sandy Emergencies, not displayed on previous pages.Total obligations include prior-year de-obligations
Obligations exceed allocations for some budget object codes due to the timing of posting transactions in the financial system. This is permissible under 31 U.S.C. 1517 and does not constitute an Antideficiency Act violation.
0
800
1,600
2,400
3,200
4,000
4,800
5,600
6,400
7,200
Tropical Storm Lee Hurricane Sandy Hurricane Isaac
($ in
mill
ions
)
Event
Allocations, Obligations and Expenditures for Tropical Storm Lee and Hurricanes Sandy & Isaac (Cumulative)
AllocationsObligationsExpenditures
Disaster Relief Fund Monthly Report
Lee IsaacAllocations, Obligations Expenditures15

APPENDIX D: ALLOCATIONS, OBLIGATIONS AND EXPENDITURES
Through 11/30/2013
\
0
200
400
600
800
1,000
1,200
1,400
2010 TN Floods Irene 2011 SpringTornados
2011 Spring Floods
($m
illio
ns)
Event
Allocations, Obligations and Expenditures for 2010 TN Floods, Irene, 2011 Spring Tornados, 2011 Spring Floods (Cumulative)
Allocations
Obligations
Expenditures
Allocations
Obligations
Expenditures
2010 TN Floods Irene 2011 Spring Tornados 2011 Spring Floods TotalAllocations 517 2,255 1,547 785 5,104Obligations 517 2,255 1,547 785 5,104Expenditures 415 1,759 1,219 675 4,068
Source of financial information is the Integrated Financial Information Management System (IFMIS)Totals that have minor discrepancies are due to roundingTotal obligations include prior-year de-obligations
Disaster Relief FundMonthly Report
Graphical Representation2010 TN Floods, Irene, 2011 Spring Tornados 2011 Spring Floods Allocations, Obligations and Expenditures
14
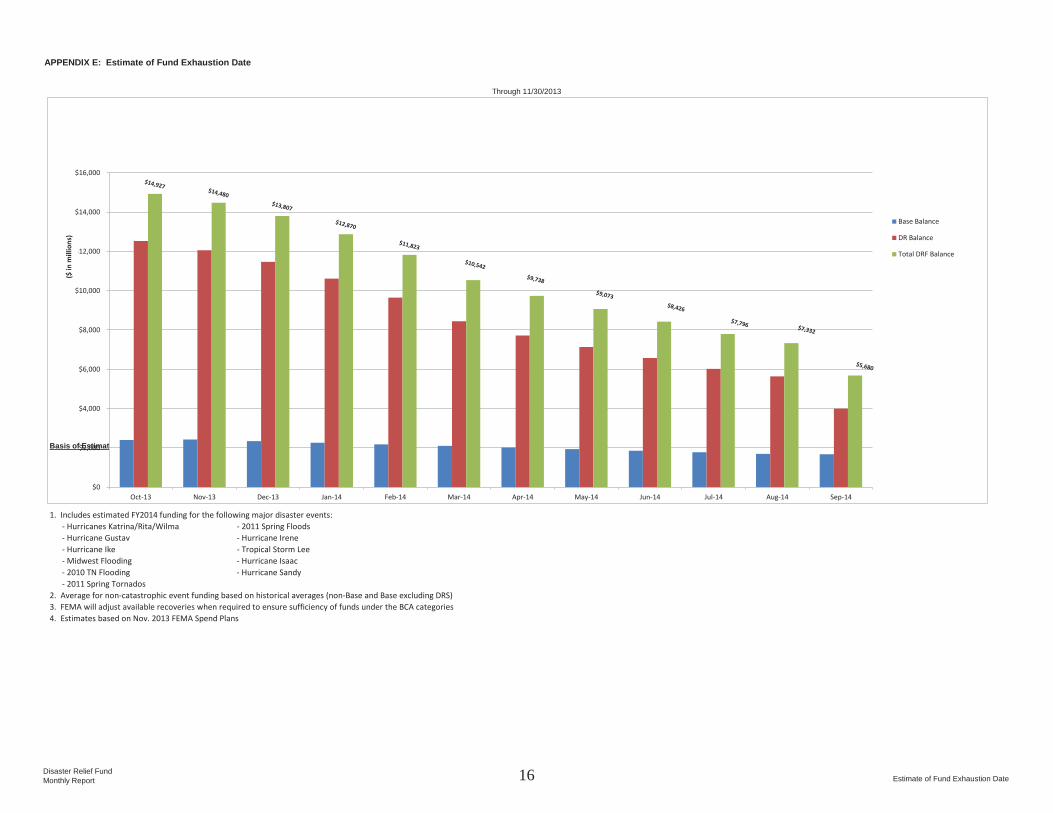
APPENDIX E: Estimate of Fund Exhaustion Date
Through 11/30/2013
DRF Estimated End of Month Balance(Based on Estimated Obligations, Recoveries and No New Catastrophic Events)
FY 2014Appropriations
Basis of Estimates:
$0
$2,000
$4,000
$6,000
$8,000
$10,000
$12,000
$14,000
$16,000
Oct-13 Nov-13 Dec-13 Jan-14 Feb-14 Mar-14 Apr-14 May-14 Jun-14 Jul-14 Aug-14 Sep-14
Base Balance
DR Balance
Total DRF Balance
($ in
mill
ions
)
1. Includes estimated FY2014 funding for the following major disaster events: - Hurricanes Katrina/Rita/Wilma - 2011 Spring Floods - Hurricane Gustav - Hurricane Irene - Hurricane Ike - Tropical Storm Lee - Midwest Flooding - Hurricane Isaac - 2010 TN Flooding - Hurricane Sandy - 2011 Spring Tornados2. Average for non-catastrophic event funding based on historical averages (non-Base and Base excluding DRS)3. FEMA will adjust available recoveries when required to ensure sufficiency of funds under the BCA categories4. Estimates based on Nov. 2013 FEMA Spend Plans
Disaster Relief FundMonthly Report Estimate of Fund Exhaustion Date16