Embed Size (px)
Citation preview

The Need for Remedies to the Disparate Loss of Instruction Experienced by Black Students with Disabilities
By Daniel J. Losen April 2018
DISABLINGPUNISHMENT:
The Center for Civil Rights Remediesat The Civil Rights Project

DISABLING PUNISHMENT
AcknowledgementsA special thank you to The California Endowment for their ongoing support for our work, especially as it relates to issues in California. We also wish to thank the Charles Hamilton Houston Institute for Race and Justice for assistance with the report dissemination. We are grateful to Dody Riggs for her thorough editing support. We also want to thank the Schott Foundation for Public Education for assistance with the report’s layout. We are always grateful to Laurie Russman, the administrative point person at The Civil Rights Project, for her assistance. Special thanks to Kacy Martin for her research assistance and for prepar-ing the accompanying spreadsheets and to Monica Stigler for her editing support. Finally, a warm thank you for the leadership, wisdom, and oversight of CRP’s co-directors, Gary Orfield and Patricia Gándara.

DISABLING PUNISHMENT
1
Schools once routinely denied students with disabilities access to public education. Federal law makes it clear that such denial is unlawful, yet some schools may still be meting out discipline in a manner that has the same effect. To suspend a student because of behavior that is a result of their disability is the equivalent of denying that student access to education. Of course, not all misbehavior is a manifestation of a student’s disability, and when it’s not, students with disabilities can be suspended in the same way as students without disabilities. However, it is well established that students with disabilities are punished far more often than their nondisabled peers. This pattern holds true for every racial group. It is hard to explain what besides disability-related behavior might cause this pattern. Although the national data on lost instruction for students without disabilities is being established this year, we know from the data we have on students with disabilities that on average they lose over 56 days of instruction for every 100
students with disabilities enrolled. From our analysis of state data reports of lost instruction by reason for suspension we know that the majority is for minor misbehaviors.1
Most disturbing is that, among students with disabilities, Black students tend to be suspended many times more often than their White peers. These disparate rates translate into many more days of lost instruction for Black students with disabilities. The difference in days of lost instruction means there are huge inequities in the opportunity to learn. Unfortunately, the impact disparate discipline has on instruction is usually overlooked in the discourse on federal and state policy. The main reason is that, although the federal government collects data on this topic annually, it does not present it clearly. Moreover, although states are legally obligated to report this information to the public each year, federal enforcement of the public reporting requirement is very weak.
Introduction

DISABLING PUNISHMENT
2
The national data on school suspension for 2014-15 and 2015-16 depict a tremendous amount of lost instruction among students with disabilities in general, and a huge disparity in lost instruction between races. Across both years examined, Black students with disabilities in grades K-12 lost 77 more days of instruction on average than White students with disabilities. Our estimates suggest that nationally, lost instruction for Black students increased slightly and as a result, the racial gap widened. This observed national trend is less certain because 4 states failed to report their
discipline removal data to the U.S. Department of Education for the 2015-16 school year.
The most disturbing finding is that, in some states, the impact suspension has on instruction is much greater than the national average. The disparities
observed in the five states with the largest Black/White racial differences in lost instruction, as depicted in Figure 2, are even more alarming.
In Nevada in 2015-16, Black students with disabilities lost 209 days of instruction per 100 enrolled, which was 153 more than the number lost by White students with disabilities. Moreover, Blacks lost more than 107 days per 100 enrolled than their White peers in each of the five states with the largest differences in lost instruction, as depicted in Figure 2.
The Growing Racial Gap in Lost Instruction
*Adjusted to reflect the fact that 4 states (AZ, IL, VT, WV) failed to report removal data in 2015-16
Source: U.S. Department of Education
209194
Nevada Nebraska Ohio Missouri Tennessee
48
146
167
50
117
194
77
117
173
65
108
56
153
250
200
150
100
50
0
White Racial GapBlack140
120
100
80
60
40
20
0
43 43
119
2014-15 2015-16
121
WhiteBlack
To correct this information gap, the Center for Civil Rights Remedies estimated the racial differences in lost instruction time due to dispa-rate discipline for students with disabilities at the national and state levels.
Figure 1: National Racial Gap in Lost Instruction for Students with Disabilities, per 100 Students with Disabilities in 2014-15 and 2015-16*2
Figure 2: The Five States with the Largest Racial Disparity in Loss of Instruction for Students with Disabilities in 2015-16

DISABLING PUNISHMENT
3
Table 1. State-Level Review of Racial Differences in Lost Instruction for Students with Disabilities, 2014-15 and 2015-16
2014-15 2015-16 Change in Racial
Gap
Blacks, days lost per 100
Whites, days lost per 100
Black-White gap
Blacks, days lost per 100
Whites, days lost per 100
Black-White gap
Nevada 182.8 54.5 128.3 Nevada 208.9 55.5 153.5 25.2Nebraska 201.2 45.7 155.5 Nebraska 194.0 48.1 145.9 -9.6Ohio 151.5 47.7 103.8 Ohio 167.3 50.1 117.2 13.4Missouri 190.1 74.6 115.5 Missouri 194.1 77.0 117.1 1.6Tennessee 163.6 59.1 104.5 Tennessee 173.0 65.0 108.0 3.5North Carolina 158.3 64.1 94.3 North Carolina 165.2 64.7 100.5 6.2Kansas 114.4 26.6 87.8 Kansas 129.7 29.2 100.4 12.6Alaska 124.9 51.2 73.7 Alaska 143.6 43.4 100.2 26.5Dist. of Columbia 132.4 18.5 113.9 Dist. of Columbia 108.8 8.8 100.0 -13.9Arkansas 144.2 61.2 83.0 Arkansas 161.2 65.7 95.5 12.5Texas 181.6 84.0 97.6 Texas 175.1 80.8 94.3 -3.3Virginia 131.7 51.4 80.3 Virginia 144.1 51.1 93.0 12.7Connecticut 128.7 38.8 89.9 Connecticut 128.6 37.0 91.6 1.7Wisconsin 126.4 30.1 96.3 Wisconsin 119.3 28.4 90.9 -5.3Minnesota 111.6 25.9 85.7 Minnesota 114.1 26.6 87.5 1.8Kentucky 124.2 51.0 73.2 Kentucky 138.9 52.4 86.6 13.4South Carolina 158.8 73.1 85.7 South Carolina 159.3 75.9 83.4 -2.3United States 119.0 43.0 76.0 United States 120.6 42.7 77.9 1.9Pennsylvania 97.1 34.9 62.2 Pennsylvania 111.4 35.0 76.3 14.1Indiana 123.7 45.6 78.1 Indiana 119.4 44.6 74.8 -3.3Iowa 105.8 32.5 73.3 Iowa 104.8 30.9 74.0 0.7Louisiana 127.5 56.2 71.3 Louisiana 124.1 51.0 73.2 1.9Washington 127.8 53.5 74.3 Washington 119.0 47.8 71.1 -3.2Georgia 130.2 60.1 70.0 Georgia 126.6 57.4 69.1 -0.9Mississippi 111.9 44.3 67.6 Mississippi 113.1 44.1 69.0 1.4Oklahoma 120.4 33.1 87.4 Oklahoma 98.3 34.7 63.6 -23.8Florida 133.1 62.5 70.6 Florida 121.9 58.3 63.5 -7.1Michigan 123.0 41.3 81.7 Michigan 100.1 37.6 62.5 -19.2Alabama 109.3 45.0 64.3 Alabama 107.9 46.0 61.8 -2.5South Dakota 81.1 32.5 48.6 South Dakota 92.9 31.9 61.0 12.4California 71.4 26.5 44.9 California 81.9 30.8 51.1 6.2Delaware 73.4 32.7 40.7 Delaware 86.7 37.6 49.1 8.4Maryland 69.5 25.9 43.5 Maryland 74.0 26.5 47.5 3.9Colorado 80.5 37.1 43.4 Colorado 80.4 35.9 44.6 1.2Montana 83.2 41.7 41.4 Montana 86.0 42.0 44.0 2.6Massachusetts 63.2 24.3 38.9 Massachusetts 65.8 23.9 41.9 3.0New Jersey 50.7 17.1 33.6 New Jersey 49.9 16.0 33.9 0.3

DISABLING PUNISHMENT
4
2014-15 2015-16 Change in Racial
Gap
Blacks, days lost per 100
Whites, days lost per 100
Black-White gap
Blacks, days lost per 100
Whites, days lost per 100
Black-White gap
New York 71.0 34.5 36.5 New York 66.5 33.2 33.3 -3.2New Mexico 45.7 16.4 29.3 New Mexico 54.0 22.0 32.0 2.8Oregon 66.6 41.1 25.5 Oregon 68.3 39.5 28.9 3.4Rhode Island 72.8 43.0 29.8 Rhode Island 62.5 38.5 24.0 -5.8North Dakota 32.8 12.2 20.7 North Dakota 25.6 8.9 16.7 -4.0Utah 20.2 7.1 13.1 Utah 21.1 6.8 14.4 1.3New Hampshire 55.6 28.2 27.4 New Hampshire 34.5 27.9 6.6 -20.8Maine 7.8 8.0 -0.3 Maine 13.6 7.1 6.4 6.7Idaho 14.9 11.7 3.2 Idaho 14.7 12.8 2.0 -1.2Wyoming 17.2 14.0 3.3 Wyoming 2.5 2.8 -0.4 -3.6Hawaii 46.2 31.0 15.1 Hawaii 29.1 32.2 -3.1 -18.2Arizona* 107.0 43.1 63.9 Arizona*Illinois* 101.2 32.3 68.8 Illinois*Vermont* 54.7 32.8 21.9 Vermont*West Virginia* 166.3 84.5 81.8 West Virginia*
Source: Based on data from the U.S. Department of Education
*States excluded from both years of analysis for non-reporting 2015-16 data: Arizona, Illinois, Vermont, West Virginia
Table 1 presents the days of lost instruction for all states (and DC). Only 46 states completed data for both 2014-15 and 2015-16. In a preliminary analysis we reported a slight decline nationally. However, when the states that failed to report disciplinary data were removed from the aggregate national average we note a slight increase for Black students with disabilities. Moreover, in 28 states the extreme racially disparate impact has increased. California was among the states showing widening racial gaps. That is noteworthy because otherwise the state has been narrowing the racial gap in suspensions, and in lost instruction in general (Losen & Whitaker, 2017). Blacks lost 50 days more than their White peers in most states, and Black students were consistently found to lose more instruction than Whites in all states that reported data, except Wyoming and Hawaii.3
It is nearly certain that district-level data within each state would show even more disturbing racial differenc-es in lost instruction than the national and statewide averages. Unfortunately, the relevant district-level data are not currently publicly reported.
The Individuals with Disabilities Education Act (IDEA) is a federal grant program that provides funds to each state that agrees to accept the conditions and require-
ments. All states are participants. As a condition of receiving the federal funds, the IDEA requires state education departments to review districts for problemat-ic racial discipline disparities, and for disproportionality in identification and placement.4 Specifically, provisions of the IDEA that require states to review racial disci-pline disparities at the district level also require the state authorities to tell the districts flagged for discipline disparities to reserve 15% of their federal Part B IDEA funds for comprehensive coordinated early intervening services (CEIS), and to attempt to find and address the underlying issue(s). The statute allows each state to select the method used to determine racial disproportionality, as well as the threshold. Districts the states identify are required to ensure that members of the overrepresented racial group benefit from CEIS.5
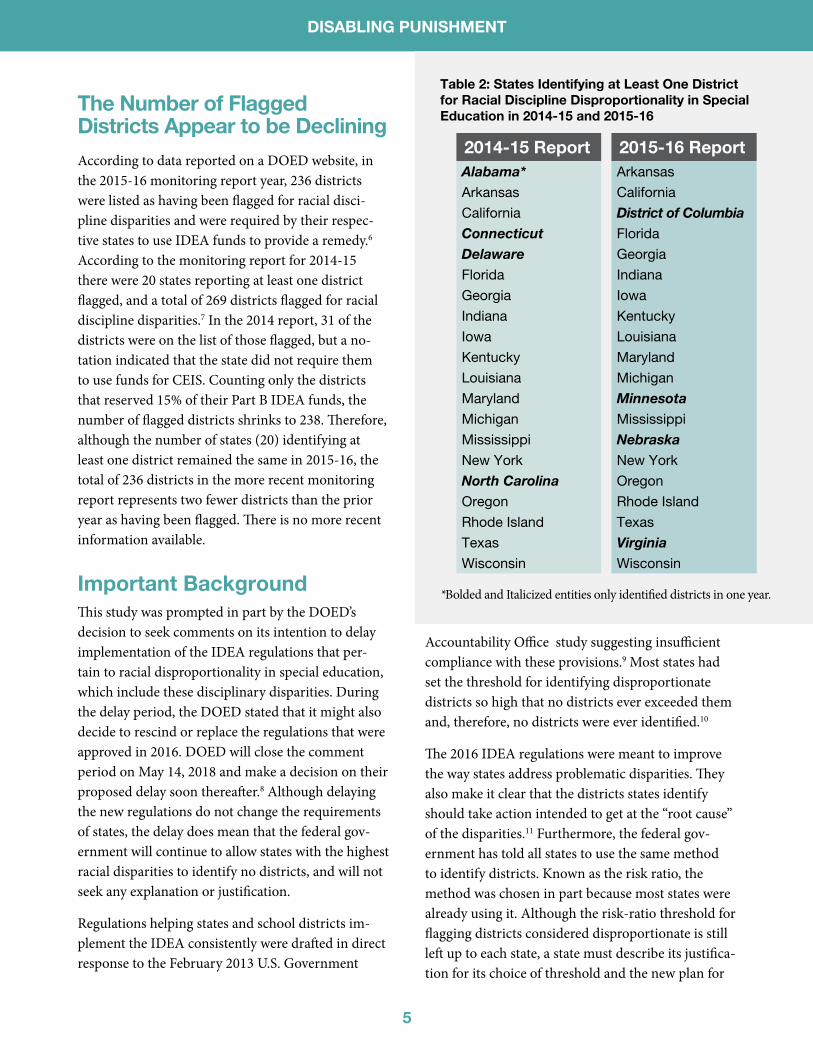
Although the IDEA requires every state to observe district-level racial disparities in discipline, the U.S. Department of Education’s (DOED) own monitoring reports over the last two years reveal that fewer than half the states identified any districts, and that those states varied little. Table 2 lists the states identified in the most recently reported years.
DISABLING PUNISHMENT
5
The Number of Flagged Districts Appear to be Declining
According to data reported on a DOED website, in the 2015-16 monitoring report year, 236 districts were listed as having been flagged for racial disci-pline disparities and were required by their respec-tive states to use IDEA funds to provide a remedy.6 According to the monitoring report for 2014-15 there were 20 states reporting at least one district flagged, and a total of 269 districts flagged for racial discipline disparities.7 In the 2014 report, 31 of the districts were on the list of those flagged, but a no-tation indicated that the state did not require them to use funds for CEIS. Counting only the districts that reserved 15% of their Part B IDEA funds, the number of flagged districts shrinks to 238. Therefore, although the number of states (20) identifying at least one district remained the same in 2015-16, the total of 236 districts in the more recent monitoring report represents two fewer districts than the prior year as having been flagged. There is no more recent information available.
Important BackgroundThis study was prompted in part by the DOED’s decision to seek comments on its intention to delay implementation of the IDEA regulations that per-tain to racial disproportionality in special education, which include these disciplinary disparities. During the delay period, the DOED stated that it might a lso decide to rescind or replace the regulations that were approved in 2016. DOED will close the comment period on May 14, 2018 and make a decision on their proposed delay soon thereafter.8 Although delaying the new regulations do not change the requirements of states, the delay does mean that the federal gov-ernment will continue to allow states with the highest racial disparities to identify no districts, and will not seek any explanation or justification.
Regulations helping states and school districts im-plement the IDEA consistently were drafted in direct response to the February 2013 U.S. Government
Accountability Office study suggesting insufficient compliance with these provisions.9 Most states had set the threshold for identifying disproportionate districts so high that no districts ever exceeded them and, therefore, no districts were ever identified.10
The 2016 IDEA regulations were meant to improve the way states address problematic disparities. They also make it clear that the districts states identify should take action intended to get at the “root cause” of the disparities.11 Furthermore, the federal gov-ernment has told all states to use the same method to identify districts. Known as the risk ratio, the method was chosen in part because most states were already using it. Although the risk-ratio threshold for flagging districts considered disproportionate is still left up to each state, a state must describe its justifica-tion for its choice of threshold and the new plan for
Table 2: States Identifying at Least One District for Racial Discipline Disproportionality in Special Education in 2014-15 and 2015-16
2014-15 Report 2015-16 ReportAlabama* Arkansas
Arkansas California
California District of ColumbiaConnecticut Florida
Delaware Georgia
Florida Indiana
Georgia Iowa
Indiana Kentucky
Iowa Louisiana
Kentucky Maryland
Louisiana Michigan
Maryland MinnesotaMichigan Mississippi
Mississippi NebraskaNew York New York
North Carolina Oregon
Oregon Rhode Island
Rhode Island Texas
Texas VirginiaWisconsin Wisconsin
*Bolded and Italicized entities only identified districts in one year.
DISABLING PUNISHMENT
6
implementation must be approved by the U.S. secre-tary of education.
The 2016 IDEA regulations also clarify that IDEA ex-penditures for CEIS should benefit the students expe-riencing disparate harm. The new regulatory language explicitly reverses a policy first introduced during the Bush administration. The old regulations prohibited students with an IEP from benefitting from the funds spent on CEIS, even when disparities triggered the mandatory expenditure of 15% of Part B funds for CEIS. For example, under the old interpretation, if Black students with IEPs were suspended far more often than all other students with IEPs, and if that dispar-ity met the state’s threshold, none of the IDEA funds triggered for CEIS could be spent for any Black students with disabilities. The new regulations make it clear that students with IEPs and those without can now bene-fit when CEIS expenditures become mandatory. The 2016 regulations provide flexibility in the use of these funds that is consistent with the statutory purpose, and with the explicit requirement that the expenditures are comprehensive and that the students whose experiences triggered the use of the funds can benefit from their expenditure. In other words, the regulations should prevent the absurd situation whereby those whose dis-parate punishment triggered a remedy could not benefit from the remedy.
Additional Push to Strip Children of Civil Rights ProtectionsThe racial disparities described in this report are also relevant to recent news that the Trump administration plans to eviscerate broader civil rights protections. Pursuant to the “disparate impact” regulations under Title VI of the Civil Rights Act of 1964 and totally independent from the IDEA statutory and regulatory scheme, the U.S. Department of Justice (DOJ) and the Office for Civil Rights (OCR) issued guidance to state and local educators to remind them that the Title VI disparate impact regulations apply to racial disparities in school discipline. Although it is not the focus of this report, analysis of the disparate impact school disci-pline has on Black children with disabilities and their
lost days of instruction speaks to the need to retain the guidance regarding school discipline contained within the “Dear Colleague” letter issued jointly by the DOJ and OCR in 2014.12
Data Source and Method for Estimating Days of Lost InstructionAlthough the disparities in this report may shock the conscience, the estimates of lost instruction time presented are very conservative. They are built on data collected annually from the DOED that describes the number of disciplined students whose cumulative loss of instruction due to disciplinary removal falls into each of the following three categories: loss of one day, loss of 2-10 days, and loss of greater than 10 days. In order to estimate the total days lost, the Center for Civ-il Rights Remedies assigned a value to each of the three ranges. For one day the value was one. For the wide range of 2-10 days, five was the assigned value because that is one day less than the average for the range.13 For greater than 10 days the value of 11 was assigned. Assigning the smallest value possible ensured that our estimate was conservative. Readers should note that the data analyzed for this report are based on students’ cumulative days of removal; therefore, many of the stu-dents represented in the “greater than 10 days” catego-ry received several suspensions of fewer than 10 days, rather than one long-term suspension.14
Once specific values were assigned to each range it was possible to calculate how many days of instruction were lost due to removal for Black students with dis-abilities and for White students with disabilities in each state. In every state reporting data (except Maine in 2014-15 and Hawaii and Wyoming in 2015-16), Black students lost more days than their White peers. There-fore, we arrived at our estimate of the racial gap in days lost by subtracting the White days lost per 100 enrolled from the Black days lost per 100 enrolled.15 To the best of my knowledge, students in most states who are sus-pended for fewer than 10 days receive no instruction, even when serving an in-school suspension.16

DISABLING PUNISHMENT
7
These data on lost instruction are rarely report-ed. Although many could guess that the racially disparate impact is large, these dramatic dispari-ties were derived from reliable publicly reported federal data, and they should be cause for alarm. Logic suggests that, if students with disabilities receive much more than classroom instruction alone, for example counseling services, occupa-tional and physical therapy and additional small group or one-on one tutoring, when they are attending school, they also are missing much more than classroom instruction when they are removed from school. That is why the huge racial difference in the amount of instruction time lost suggests that Black students with disabilities face an especially grave problem.
Several rigorous studies have established that re-moving students from instruction on disciplinary grounds is harmful in terms of increased risk for dropping out (Balfanz, 2015) and future incar-
ceration (Rumberger & Losen, 2016; Rosenbaum, 2018). Few have studied the particular impact on students with disabilities. Unfortunately, an analysis of the distinct harm done to students with disabilities besides days of lost instruction is beyond the scope of this report.
Research has well established that lost instruction negatively impacts achievement (Ginsburg, 2014; Noltemeyer, 2015). Moreover, by highlighting the degree to which suspension contributes to lost in-struction time for Black students with disabilities, we hope to make the public more aware that the discipline gap contributes to the achievement gap.
Although not focused on students with disabilities, several state-level studies controlled for addition-al factors that contribute to lower achievement, including poverty, and suggest that fewer suspen-sions would predict higher achievement. Research has shown that school suspensions account for
DiscussionThis report provides the first state-by-state estimate of lost instruction due to discipline for Black and White students with disabilities.
DISABLING PUNISHMENT
8
approximately one-fifth of Black/White racial dif-ferences in school performance (Morris & Perry, 2016). Meta-analyses have revealed a significant inverse relationship between suspension and achievement (Skiba, 2015), along with a signifi-cant positive relationship between suspension and dropout (Balfanz, 2015; Fabelo, 2011; Noltemeyer, Ward, & Mcloughlin, 2015). The West Virginia Department of Education, while exploring school discipline and academic performance in the state, found that “students with one or more discipline referrals were 2.4 times more likely to score below proficiency in math than those with no discipline referrals” (Whisman & Hammer, 2014). More recently, a rigorous 12-year longitudinal study that controlled for more than 60 variables was published in the peer-reviewed journal, Youth & Society (Rosenbaum, 2018), and confirmed not only that being suspended has negative academic outcomes but that suspension is associated with greater risk for eventual incarceration.
Given that the Trump administration is seeking to delay and possibly rescind the IDEA 2016 regu-lations (and the joint DOJ/OCR guidance), the Center for Civil Rights Remedies believes there is an urgent need to call attention to the impact on the opportunity to learn. In order to produce this report in a timely manner, the Center focused on Black/White disparities in lost instruction be-cause they are typically the most widespread and because providing a detailed and comprehensive report that covers every racial group would take much longer to produce.
Moreover, the high amount of lost instruction time and the large disparities documented in this report are large enough to suggest that at least some students with disabilities, and especially Black students with disabilities, are punished for behavior that is caused by their disability. As mentioned at the outset, punishing a student for behavior caused by the student’s disability is the equivalent of denying that student access to ed-
ucation on the basis of disability, also referred to as denying Free Appropriate Public Education, or FAPE, which violates the IDEA, as well as Section 504 of the Rehabilitation Act of 1973.
For example, students with ADHD usually fall into the broad category known as Other Health Impairment, or OHI. Symptoms of ADHD often include behavior that is considered “disruptive” including interrupting others, repeating noises, talking out of turn or when they should be silent, getting out of their seat without permission, or repeatedly failing to follow instructions. Students with emotional disturbance (ED) are often diag-nosed because they exhibit challenging behavior, such as temper tantrums, refusing to participate, inappropriate crying, and obsessive or compulsive behavior. The school environment may be par-ticularly difficult for students with mental illness, thus they may tend to be tardy or absent more often than other students.
These are just some examples of how a number of disabilities can be the cause of challenging behavior. If schools follow the law and do not suspend students with disabilities because of behavior caused by their disability, it is difficult to explain why, for example, 33% of all students with an emotional disturbance were suspended at least once in 2011-12 or why there is a disparate pattern of punishment for every racial and ethnic group (Losen et al., 2015).
It is possible that implicit biases that contribute to observed racial disparities (Okonofua, 2017) as early as preschool (Gilliam, Maupin, Reyes, Accavitti, & Shic, 2016) also exist against chil-dren with disabilities (Hehir, 2007), and that both may be contributing to the observed disparities. Determining the degree to which this is the case nationally or in any particular state or district is well beyond the scope of this report. Further-more, even if the punished behavior is not a man-ifestation of a student’s disability or a reflection

DISABLING PUNISHMENT
9
of implicit (or explicit) racial bias, an unsound discipline policy or practice that impacts students with disabilities more than others can be chal-lenged as having a potentially unlawful “disparate impact” under civil rights projections sounding in disability law17.
That said, it is also important to note that the IDEA inquiry into racial disparities is distinct. The IDEA does not call for a legal investigation, nor does the remedial action of using 15% of Part B funds for CEIS depend on the determination that a law has been violated. Where a determina-tion of unlawful discrimination is at issue, even extraordinarily wide data disparities are alone insufficient to establish that a school or district has violated civil rights law.
Fortunately, federal policy under the IDEA helps states spur on districts to find and remedy prob-lems that are indicated by very large racial dis-parities without making each instance a federal case. Congress has instead required each state to determine when disparities are so large that they call for remedial action as a matter of policy. Although it is possible that noncompliance with the IDEA or a violation of civil rights law could be found to be the root cause, there is no expectation
of a finding that a district failed to comply with the law.18 The root cause inquiry is intended to prompt district-level problem-solving and district-initiated actions to improve policies and practices in order to benefit children with and without disabilities. Unlike the remedies that may be dictated follow-ing a finding of a civil rights violation or a state or federal special education review finding non-com-pliance with the IDEA, when a state flags a district for significant disproportionality, the district—not an outside party—is expected to explore the pos-sible root cause(s) and to devise and implement a remedy that benefits all students, including but not limited to the impacted youth.
District-determined solutions are ideally driv-en by each district’s unique circumstances, and district leaders will determine how to redirect 15% of their Part B funds. In addition, the DOED for several years provided technical assistance to states to support their work with identified districts. Despite variations in federal techni-cal assistance and regardless of changes to the regulations, states’ obligation to identify districts as significantly disproportionate pursuant to the IDEA remains unchanged.

DISABLING PUNISHMENT
10
In January 2018, in response to hearing that the DOED was considering rescinding the IDEA 2016 regulations, the National Association of State Directors of Special Education (NASDSE) urged the federal government to implement the regula-tions without delay.19 We believe this is a strong signal that states are taking the issue seriously. The NASDSE endorsement is important because it suggests that state administrators and civil rights advocates fundamentally agree that the regula-tions were helpful, and are willing to use data disparities at the district level to inform investiga-
tions into the root causes of the observed disci-pline disparities described. However, the poor state-level track record among the states with the largest disparities in lost instruction suggests that not all states are willing to do the work Congress intended they do as federal grant recipients. Even without a delay, the federal regulations won’t likely be enough. Therefore, we recommend that state-level stakeholders, education policymakers, and civil rights advocates, together with groups representing parent organizations and teachers unions, join together to pursue the following:
• Identify districts in the state that have problematic racial and disability disparities in discipline and engage state-level administrators in supporting districts to conduct root-cause analyses and redirect IDEA funds toward affecting a remedy;
• Revise codes of conduct and other disciplinary practices to reduce the use of removal from the classroom, except as a measure of last resort, and provide safeguards to ensure that implementation of the changes does not implicate safety;
• Set aside the resources needed for leadership and staff training and for intervention programs that will address the excessive and disparate loss of instruction;
• Use school climate surveys, behavior incident reports, and other monitoring to ensure that school reforms are improving the conditions of learning;
• Dedicate resources to evaluating reform efforts to distinguish the effective remedies from ineffective discipline reform efforts;
• Invest in the collection and public reporting of accurate and timely data on discipline at the district and school levels, including disaggregating the days of lost instruction for all subgroups.
Recommendations

DISABLING PUNISHMENT
11
Balfanz, R., Byrnes, V., & Fox, J. (2015). Sent home and put off-track: The antecedents, disproportionalities, and consequences of being sus-pended in the ninth grade. In D.J. Losen (ed.), Closing the school discipline gap: Research for policymakers. New York: Teachers College Press.
Fabelo, T., Thompson, M., Plotkin, M., Carmichael, D., Marchbanks, M., & Booth, E. (2011). Breaking Schools’ Rules: A Statewide Study of How School Discipline Relates to Students’ Success and Juvenile Justice Involvement. New York: Council of State Governments Justice Cen-ter. Retrieved online on July 15, 2015 from: http://csgjusticecenter.org/wp-content/uploads/2012/08/Breaking_Schools_Rules_Report_Fi-nal.pdf
Gilliam, W.S., Maupin, A.N., Reyes, C.R., Accavitti, M., & Shic, F. (2016). Do early educators’ implicit biases regarding sex and race relate to behavior expectations and recommendations of preschool expulsions and suspensions? Retrieved from http://zigler-center.yale.edu/publications/Preschool%20Implicit%20Bias%20Policy%20Brief_final_9_26_276766_5379_v1.pdf
Ginsburg, A., Jordan, P., & Chang, H. (2014).Absences add up: How school attendance influences student success. Retrieved from http://www.attendanceworks.org/absenc-
es-add-up/ Hehir, T. (2007). Confronting abelism. Educational Leadership, 64, 8-14. Losen, D. J., Ee, J., Hodson, C., & Martinez, T. E. (2015). Disturbing inequities: Exploring the relationship of discipline disparities for
students with disabilities by race with gender with school outcomes. In D. J. Losen (Ed.), Closing the school discipline gap: Equitable remedies for excessive exclusion (p. 89). New York: Teachers College Press.
Losen, D. J., Sun, W. L., & Keith, M. A. (2017). Suspended education in Massachusetts: Using days of lost instruction due to suspension to eval-uate our schools. Los Angeles: Civil Rights Project-Proyecto Derechos Civiles.
Morris, E.W. & Perry, B.L. (2016). The punishment gap: School suspension and racial disparities in achievement. Social Problems, 63, 68-86. Noltemeyer, A. L., Ward, R. M., & Mcloughlin, C. (2015). Relationship between school suspension and student outcomes: A me-
ta-analysis. School Psychology Review, 44, 224-240.Okonofua, J. A., & Eberhardt, J. L. (2015). Two strikes: Race and the disciplining of young students. Psychological Science,
26, 617-624. doi:10.1177/0956797615570365
Okonofua, J. A., Paunesku, D., & Walton, G. M. (2016). Brief intervention to encourage empathic discipline cuts suspension rates in half among adolescents. Proceedings of the National Academy of Sciences, 113, 5221-5226
Rosenbaum J., (2018). Educational and Criminal Justice Outcomes 12 Years After School Suspension, Youth & Society, I-33, Sage Publica-tions….Available at https://doi.org/10.1177/0044118X17752208
Rumberger, R., & Losen D. (2016). The High Cost of Harsh Discipline and Its Disperate Impact. Retrieved from http://www.schooldiscipline-data.org/ccrr/docs/UCLA_HighCost_6-2_948.pdf
Skiba, R., Trachok, M., Chung, C. G., Baker, T., Sheya, A., & Hughes, R. (2015). Where should we intervene? Contributions of behavior, stu-dent, and school characteristics to suspension and expulsion. In D. J. Losen (Ed.), Closing the school discipline gap: Research for policymak-ers. New York: Teachers College Press.
Skiba, R. J. (2015). Interventions to address racial/ethnic disparities in school discipline: Can systems reform be race-neutral? In R. Bangs & L. E. Davis (Eds.), Race and social problems (pp. 107-124). New York: Springer.
U.S. Department of Justice (Office of Civil Rights) and U.S. Department of Education (2014). Notice of Language Assistance Dear Colleague Let-ter on the Nondiscriminatory Administration of School Discipline. Washington DC: Authors. Retrieved online on July 15, 2015 from: http://www2.ed.gov/about/offices/list/ocr/letters/colleague-201401-title-vi.html
U.S. Department of Education (Office of Civil Rights) (2014). Civil Rights Data Collection Data Snapshot: School Discipline. Issue Brief No. Retrieved online on July 15, 2015 from: http://ocrdata.ed.gov/Downloads/CRDC-School-Discipline-Snapshot.pdf
U.S. Department of Education (2008). Policy Questions on the Department of Education’s 2007 Guidance on Collecting, Maintaining and Report-ing Data by Race or Ethnicity. Retrieved on July 15, 2015 from: http://www2.ed.gov/policy/rschstat/guid/raceethnicity/questions.html
Whisman, A., & Hammer, P. C. (2014). The association between school discipline and mathematics performance: A case for positive discipline approaches. Charleston: West Virginia Department of Education, Division of Teaching and Learning, Office of Research.
References

DISABLING PUNISHMENT
12
Endnotes1 For example, in our report “Suspended Education in Massachusetts” (Losen, Sun, & Keith, 2017), we found the majority of suspensions
and days of lost instruction fell into category 18, which was a catch-all category that excluded all the reasons associated with violence or serious misbehaviors, as these were covered in the first 17 categories. In addition to their posting on the main website, all of our recent reports can be found ate our centers’ web tool at www.schooldisciplinedata.org.
2 In our preliminary analysis released in an article published by Education Next we included in the national estimate 4 states that failed to report any disciplinary removal data. Including the enrollment from those states without any discipline data artificially lowered the national averages. This graph compares a national average based on 50 states and DC in 2014-15 to a national average based on 46 states and DC in 2015-16. Although not included in the text, we re-ran the 2014-15 estimates after subtracting the same four states that failed to report their removals in 2015-16 and found that the racial gap grew by slightly over 1 point.
3 In the most recent report, 4 states, Arizona, Illinois, Vermont and West Virginia provided insufficient data. Therefore their enrollment data and disciplinary removal data were removed for our calculation of the national average. For more information and detailed source data please see the excel spreadsheet that accompanies this report.
4 The Individuals with Disabilities Education Act makes available a free appropriate public education to eligible children with disabilities throughout the nation. The provisions of the IDEA most relevant to this study are found at 20 U.S.C. §1418 and are often also referred to as Section 618.
5 The Bush administration instituted a literal interpretation of 20 U.S.C. §1418(d), such that it would prohibit the students whose dispa-rate experience triggers the required funding from coordinated early intervening services from reaping the benefits. This interpreta-tion produced the absurd result that the group that triggered the remedy was barred from receiving the remedy. The most reasonable interpretation of §1418(d), one that instead serves the purpose and preserves the integrity of the text, is that section §1418(d)’s terms removed some of the general restrictions on the permissive use of up to 15% of IDEA funds for CEIS found in 1413(f).
6 The data on use of IDEA funds for CEIS (both mandatory and voluntary) with district names are reported in the files found on the U.S. Department of Education’s website under “IDEA Section 618 Data Products: State Level Data Files, and are under the heading, ”Main-tenance of Effort and Coordinated Early Intervening Services” and are available at https://www2.ed.gov/programs/osepidea/618-data/state-level-data-files/index.html#bmoeceis
See also, Samuels C.A., Harwin, A., How to Measure Bias in Spec. Ed. Crux of Fight Over Federal Rule, (February 7. 2018) Education Week. See also interactive map available at www.edweek.org/go/disparities
7 The monitoring report year is based on data gathered from the prior year. For example, the 2015-16 “report year” is based on data detail-ing the districts that states reportedly identified in 2014-15 and is the most recent available.
8 The following is a link to the official Notice of Proposed Rule, issued on February 27, 2018. https://www.federalregister.gov/docu-ments/2018/02/27/2018-04102/assistance-to-states-for-the-education-of-children-with-disabilities-preschool-grants-for-children
9 See: http://www.gao.gov/products/GAO-13-137
10 It should be noted that the GAO report focused on states implementation of the IDEA provision as it pertained to the area of over-rep-resentation in identification, but that the problem of numerous states identifying no districts applied to placement and discipline as well.
11 The new regulations can be found at https://www.gpo.gov/fdsys/pkg/FR-2016-12-19/pdf/2016-30190.pdf. The new regulations make it clear that they were prompted by a GAO report suggesting that states were not implementing the statutory requirements. The GAO report can be found at https://www.gao.gov/products/GAO-13-137.
12 U.S. Department of Education “Dear Colleague” letter, 2014 can be found at https://www2.ed.gov/about/offices/list/ocr/letters/col-league-201401-title-vi.html
13 In conducting this analysis CCRR also checked and found that these estimates are consistent with the national estimate based on the disciplinary removals against additional data published by OSEP that provided the number of short- and long-term suspensions, but with less precision. The reports of the in- and out-of-school suspension numbers can be found at this link under discipline table 5: https://www2.ed.gov/programs/osepidea/618-data/static-tables/index.html.
14 Furthermore, students removed on grounds of dangerousness can be removed for up to 45 days. By assigning 11 days of lost instruction to all the students in the “greater than ten” category, our conservative approach helps diminish the possible over-count of lost instruc-tion, considering that we could not adjust for the students with disabilities who received one or more very lengthy suspensions but did receive instruction while removed.
DISABLING PUNISHMENT
13
15 This analysis is easily replicable, as it relies on publicly reported data from 2014-15 and 2015-16 available at (www.ideadata.org). For example, to find the total enrollment ages 3-21 for 2014-15, one must add enrollment of students with disabilities by combining the reports for ages 3-5 (U.S. Department of Education, EDFacts Data Warehouse (EDW): “IDEA Part B Child Count and Educational Environments Collection,” 2014-15. Data extracted as of July 2, 2015 from file specifications 002 and 089) with ages 6-21. Because the removal numbers come from all public school students between the ages of 3 and 21, the national totals and analyses include the states and outlying areas. Data naming the states and districts by recent CEIS expen-ditures were required can be found at another federal website. They are easy to miss because they are found where the U.S. Department of Education describes IDEA funds for CEIS (both mandatory and voluntary) as well as MOE reductions are reported in the files (https://www2.ed.gov/programs/osepidea/618-data/state-level-data-files/index.html#bmoeceis).
16 These removal rates do not distinguish between in- and out-of-school suspensions. Removals are defined by DOED as fol-lows: “Disciplinary removal—Any instance in which a child with a disability is removed from his/her educational placement for disciplinary purposes, including in-school suspension, out-of-school suspension, expulsion, removal by school personnel to an interim alternative educational setting for drug or weapon offenses or serious bodily injury, and removal by hearing officer for likely injury to the child or others.” According to the U.S. Department of Education, these estimates are based on unduplicated counts that are reported as follows:
• How are counts reported by removal length? The removal length (IDEA) is the cumulative length of removals during the school year.
• A child with less than 0.5 cumulative days should not be reported.• A child with greater than or equal to 0.5 and less than 1.5 cumulative days should be counted in the “LTOREQ1” category.• A child with greater than or equal to 1.5 and less than or equal to10.0 cumulative days should be added into the “2TO10”
category.• A child with greater than 10.0 cumulative days should be counted in the “GREATER10” category. For example, a child who
was suspended four times for three days each during the school year and who was removed 12 cumulative days would be reported once as greater than 10 days in the “GREATER10” category.”
In most states, out-of-school suspensions are far more common than in-school suspensions. Although an increasing number of districts in some states have reduced out-of-school suspensions, which are replaced by in-school suspensions, other districts have eliminated in-school suspensions as part of an overarching effort to cut down on disciplinary removal. The lack of capacity to distinguish removals that are in-school from those that are out-of-school using the OSEP data is an issue that we urge OSEP to address in future data collection. The statute clearly provides the authority and does require states to report in-school and out-of-school suspensions. On the flip side, the count of removals for students with IEPs only include removals the student received once determined eligible. Many students who wind up evaluated and eligible during the school year exhibit behavior problems and receive suspensions. Even if they occurred in the same year, the suspensions prior to eligibility were not counted according to OSEP’s instructions (https://www.ideadata.org/sites/default/files/media/documents/2017-09/discipline_data_qa_04-03-17_v2.pdf). In estimating the days lost and assigning 11 days for children removed for more than 10 days, keep in mind that these are cumulative counts of days for what could be multiple suspensions. Longer removals are far less common. According to the 2016 Report to Congress, “Only 490 children and students ages 3 through 21 served under IDEA, Part B, or 1 for every 10,000 children and students served in 2013, in the states for which data were available were re-moved to an interim alternative educational setting by a hearing officer for likely injury to themselves or others in school year 2013–14.” Moreover, removals that are considered changes of placement, such as to a more restrictive setting for behavioral reasons, even if done for disciplinary reasons, are not counted as days of removal if they are not designated as temporary and if the changed IEP treats the new disciplinary placement as a permanent change.
Note on enrollment and discipline counts: Two enrollment files were combined to create the number of students from each racial group who had an IEP and were age 3-21. These enrollment files skew discipline rates downward because they include students placed by parents as well as those placed in correctional facilities and state operated educational facilities. Private schools and restrictive settings often do a poor job of reporting discipline data.
17 In the referenced discipline guidance, footnote 4 makes it clear that disparate impact applies to civil rights protections based on disability and gender as well as race. See endnote 12 at footnote 4.
18 Because a finding of discrimination is not required pursuant to the IDEA, widely criticized findings by researcher Paul Mor-gan, who found evidence in a national sample that similarly situated students were treated differently in discipline based on race, but not based on disability, are not particularly relevant to a discussion of these IDEA regulations. One of several major flaws in Morgan’s study is that in his attempt to detect bias in how adults responded to recent behaviors, he controlled for pri-or behaviors that may have been equally influenced by racial or disability bias. Moreover, Morgan failed to consider that it is a form of unlawful discrimination to remove students with disabilities from school based on behavior that is a manifestation of their disability. In other words, the data on prior misbehavior might reflect prior discrimination based on race or disability, and should not have been used as a control.
19 For a statement of the National Association of State Directors of Special Education See: http://www.nasdse.org/LinkClick.aspx?fileticket=G8dNhd4UhPw%3d&tabid=36

The Center for Civil Rights Remediesat The Civil Rights Project