Embed Size (px)
Citation preview

Disability Service KPI’s and Statistics
2015-2016

Contents Abbreviations ............................................................................................................................ 1
Disability Service Key Performance Indicators ........................................................................................ 2
Section 1: Student data ........................................................................................................................... 2
Student journey data ................................................................................................................. 5
Registration by Disability category .................................................................................................. 7
Registrations by disability type and faculty ................................................................................... 11
Rate of increase or decrease of student registrations by disability type ...................................... 12
New first year undergraduate registrations .................................................................................. 16
Disclosures and LENS reports ........................................................................................................ 18
Examination accommodations ...................................................................................................... 20
Number of withdrawn students by disability type ........................................................................ 22
Section 2: Disability Service Delivery ..................................................................................................... 25
Disability Services and Supports ............................................................................................... 25
Use of the Respite Room ............................................................................................................... 25
Educational Support Worker Service ............................................................................................. 25
ESW Exam support ........................................................................................................................ 27
Funding Statistics ........................................................................................................................... 28
Assistive Technology Support ........................................................................................................ 31
Occupational Therapy Supports .................................................................................................... 36
Section 3: DS Website Statistics .............................................................................................. 38
Page View – Disability Website 15-16 ........................................................................................... 38

1
Abbreviations DS – Disability Service
RP – Required Points
Disability sub-groups
ADD - Attention Deficit Disorder (including ADHD Attention Deficit Hyperactivity Disorder)
ASD - Autistic Spectrum Disorder
DCD - Developmental Coordination Disorder (Dyspraxia)
Mental Health – Includes depression, anxiety, eating disorders, bi polar disorders and OCD
Neuro – Neurological, includes epilepsy, acquired brain injury, sleep disorders and stroke
Phys – Physical, includes arthritis, cerebral palsy, spinal injuries and long term injuries
Sensory – includes blind and visually impaired, Deaf and hard of hearing
SOI – Significant ongoing illness, includes diabetes, Crohn’s disease, cancer, chronic fatigue
Spld – Specific learning difficulties includes dyslexia, dysgraphia and dyscalculia

2
Disability Service Key Performance Indicators The Key Performance Indicators developed by the DS capture the breath of work carried out by the
service. Admissions KPIs capture entry numbers and routes; under service delivery we record the
number and types of services offered. Individual activities and targets are measured and reflected
through the annual staff reviews allow the DS to measure set activities and targets.
Section 1: Student data
KPI Indicator Years
08/9 09/10 10/11 11/12 12/13 13/14 14/15 15/16 Target
Number of new
UG entrants with
disabilities
entering with the
required points
(RP) / DARE3
RP
73
DARE
36
RP
91
DARE
32
RP
151
DARE
44
RP
94
DARE
77
RP
191
DARE
94
RP
82
DARE
92
RP
110
DARE
111
RP
48
DARE
125
Increase
Number of
students with
disabilities
registering with
DS3
244 296 311 348 377 331 366
336
Increase
Number of
students with
disabilities in
College3&4
585
(3.6%)
685
(4.2%)
818
(4.9%)
911
(5.4%)
1058
(6.4%)
1186
(7.1%)
1313
(7.7%)
1299
Increase
Number of needs
assessments
carried out
(disab/spld)3
251
278
(Disab
158)
(SpLD
120)
292
(Disab
148)
SpLD
144)
336
(Disab
166)
(SpLD
170)
377
(Disab
241)
(SpLD
136)
331
(Disab
231)
(SpLD
100)
357
(Disab
257)
(SpLD
100)
354
(Disab
244)
SpLD
110
Maintain
Number of
students
supported by ESF
student with
disability fund3
383 418 521 592 709 743
902
874 Increase

3
Number of
student receiving
exam
accommodations3
406 503 615 688 819 1011 945
928 Maintain
Number of
student
appointments
with Disability
Officers1
2182 1567 1285 1306 1199 1856
1094
714 Maintain
Number of
Dyslexia
Consultations5
52/34 45/29 48/29 41/28 17/13 27/19
11
12 Maintain
Number of one-
to-one ATIC
student training
appointments1
121 115 108 125 144 183 205 188 Maintain
Number of OT
appointments1 1000 1064 1477 2263 2,430 2,073
1,908
1599 Maintain
Percentage of OT
staff time
allocated to
direct student
interaction during
term time (30
weeks)6
n/a n/a n/a 98% 94% 80%*
80%
80% Maintain
Number of ALO
and
departmental
meetings1
18 16 27 18 16 24 21 16 Maintain
Public walk-ins,
students/staff1
1690/
1572
1726/
1506
1529/
1343
1803/
1526
1405/
1257
1463/
1224
1299/
1001
1304/
1093 Decrease
Email enquiries1 8765 9205 9259 10697 12101 13018 13255 13277 Increase
4
Phone enquiries
internal/external1
1648/
1513
1472/
1591
1414/
1706
1375/
1830
982/
1333
1096/
1541
825/
1202
584/
848 Decrease
Facebook total
reach from 2011
onwards
N/A N/A N/A 7,758 15,974 13,666 14,912
29,567 Increase
Unique website
page views 2 130,085
198,35
8 206,918 91,720 90,813 95,565 89,849
64,022
Maintain
YouTube visits2 N/A N/A 1,386 2,919 2,547 2,335 1513
1466
Maintain
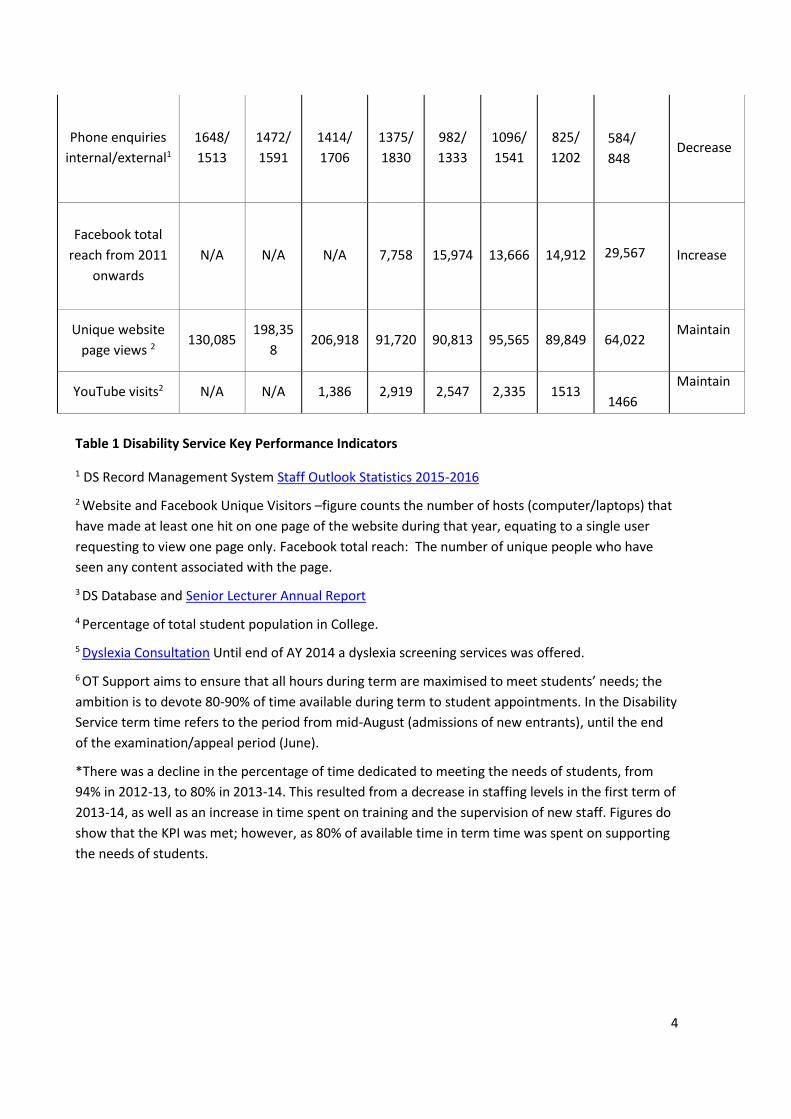
Table 1 Disability Service Key Performance Indicators
1 DS Record Management System Staff Outlook Statistics 2015-2016
2 Website and Facebook Unique Visitors –figure counts the number of hosts (computer/laptops) that
have made at least one hit on one page of the website during that year, equating to a single user
requesting to view one page only. Facebook total reach: The number of unique people who have
seen any content associated with the page.
3 DS Database and Senior Lecturer Annual Report
4 Percentage of total student population in College.
5 Dyslexia Consultation Until end of AY 2014 a dyslexia screening services was offered.
6 OT Support aims to ensure that all hours during term are maximised to meet students’ needs; the
ambition is to devote 80-90% of time available during term to student appointments. In the Disability
Service term time refers to the period from mid-August (admissions of new entrants), until the end
of the examination/appeal period (June).
*There was a decline in the percentage of time dedicated to meeting the needs of students, from
94% in 2012-13, to 80% in 2013-14. This resulted from a decrease in staffing levels in the first term of
2013-14, as well as an increase in time spent on training and the supervision of new staff. Figures do
show that the KPI was met; however, as 80% of available time in term time was spent on supporting
the needs of students.

5
Student journey data A key feature of the Disability Service strategy is the use of objective measures as part of the evidence base from which the service to students can be
evaluated and improved. Keeping track of student registrations, disability types, and changes in the rates of progression, withdrawal, and completion allow the
service to adapt to particular issues that may otherwise go unnoticed. The data in this section is presented to illustrate the main features of the student
journey. The number of students registering with the Disability Service has risen significantly since 2001. The graph in figure 1 below illustrates steady
increases in the years after the Service was established, with almost a doubling of registrations over 7 years from 222 in 2001-02, to 434 in 2007-08. In
contrast, the rate of increase accelerated from 2007-08, with the numbers more than doubling in just 4 years to 911 in 2011-12 and has continued to increase
up to 2015-16.
Figure 1: Student registrations 2001-2002 to 2015-2016

6
While student numbers in general have increased in Trinity since 2001, the rate of registrations for students with disabilities has also increased proportionately.
Table 2 below demonstrates proportionate increases approximately in line with the numbers above. In 2001-02, the proportion of TCD students registered
with DS was 1.5%, this had doubled to 3.2% by 2006-07. By 2014-15, the proportion of students registered with DS, as a percentage of the TCD student
population, had more than doubled to 7.7% with a slight fall in 2015-16, but the overall trend is showing a continuous increase. The number of postgraduates
with disabilities began to be recorded in 2010-11. The trend shows a steady rise in postgraduate students registered up to 2014-15 with a slight fall in 2015-16.
However, the registrations remain less than the undergraduate level. Table 3 reflects the number of DS students registered with Multiple Disabilities in 2015-
16.
Year 01/02 02/03 03/04 04/05 05/06 06/07 07/08 08/09 09/10 10/11 11/12 12/13
Total Students 222 285 345 365 421 420 434 585 685 818 911 1058
Undergrad Students 731 809 940
% of Total Undergrad 6.2% 6.7% 7.7%
Postgrad Students 87 102 118
% of Total Postgrad 1.8% 2.0% 2.7%
% of All Students 1.50% 1.9% 2.3% 2.4% 2.8% 3.2% 2.8% 3.6% 4.2% 4.9% 5.4% 6.4%
Table 2 Number and proportion of students registered 2001-2002 to 2015-2016
Students with Multiple Disabilities
153 12%
Total Students Registered 1299 -
Table 3 Number of DS students registered with Multiple Disabilities in 2015-2016

7
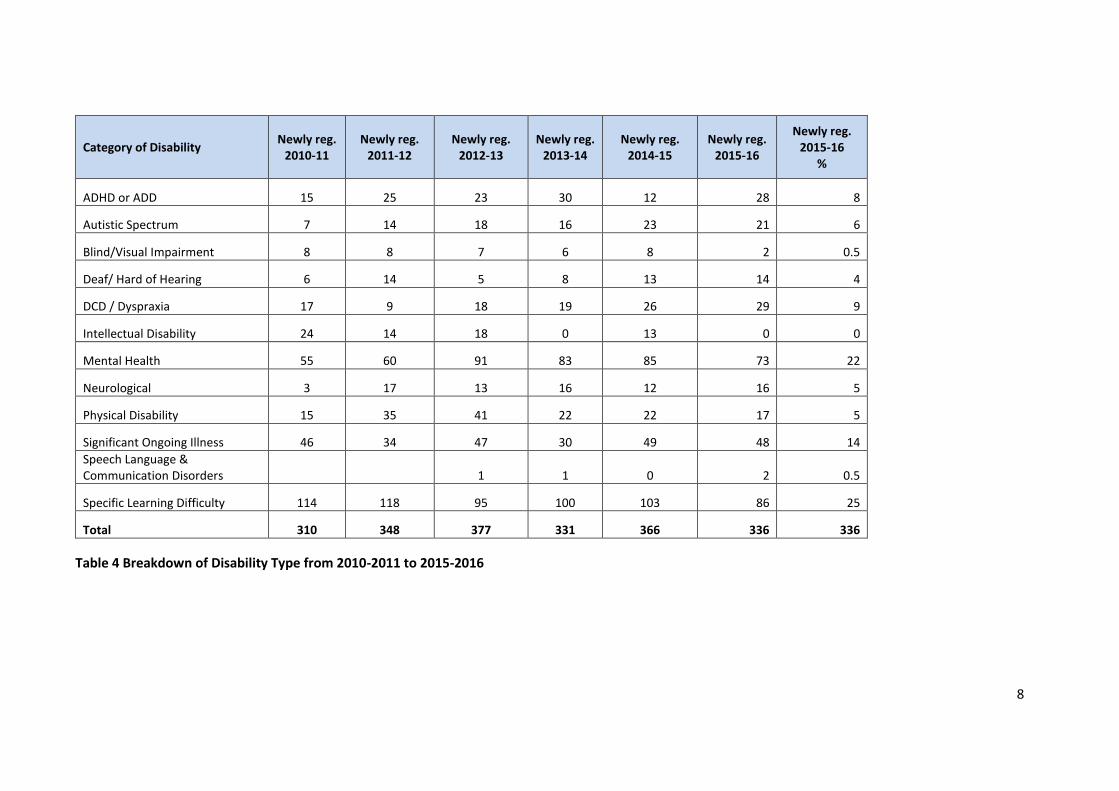
Registration by Disability category
The graph in figure 2 below illustrates, by disability type, 336 first-time students registering in the year 2015-16. Students with specific learning difficulties
(Spld) such as dyslexia, and students with Mental Health difficulties continue to register in high numbers compared with other disability types. Students with
physical and sensory disabilities, although they continue to rise in numbers, register in lower numbers and are under-represented nationally.
Figure 2 First time registrations by disability type from 2005/2006 – 2015/2016
8
Category of Disability Newly reg.
2010-11 Newly reg.
2011-12 Newly reg.
2012-13 Newly reg.
2013-14 Newly reg.
2014-15 Newly reg.
2015-16
Newly reg. 2015-16
%
ADHD or ADD 15 25 23 30 12 28 8
Autistic Spectrum 7 14 18 16 23 21 6
Blind/Visual Impairment 8 8 7 6 8 2 0.5
Deaf/ Hard of Hearing 6 14 5 8 13 14 4
DCD / Dyspraxia 17 9 18 19 26 29 9
Intellectual Disability 24 14 18 0 13 0 0
Mental Health 55 60 91 83 85 73 22
Neurological 3 17 13 16 12 16 5
Physical Disability 15 35 41 22 22 17 5
Significant Ongoing Illness 46 34 47 30 49 48 14
Speech Language & Communication Disorders 1 1 0 2 0.5
Specific Learning Difficulty 114 118 95 100 103 86 25
Total 310 348 377 331 366 336 336
Table 4 Breakdown of Disability Type from 2010-2011 to 2015-2016

9
Figure 3 below illustrates the number of all registrations by disability type in the year 2015-16. The number of categories of disability has increased from 5 to
12 over the past 8 to 10 years. Previously, the ADD, ASD, and DCD categories were considered part of the SLD or Mental Health groups. The intellectual
disability category was added when students from the Centre for Inclusion and Intellectual Disabilities enrolled on the Certificate in Contemporary Living
course. The Neurological and Speech, Language and Communication disorder categories were added following their inclusion in DARE in 2009.
Figure 3 Breakdown of first time registrations by disability type 2015-2016

10
Figure 4 Breakdown of this year’s 336 newly registered students by faculty
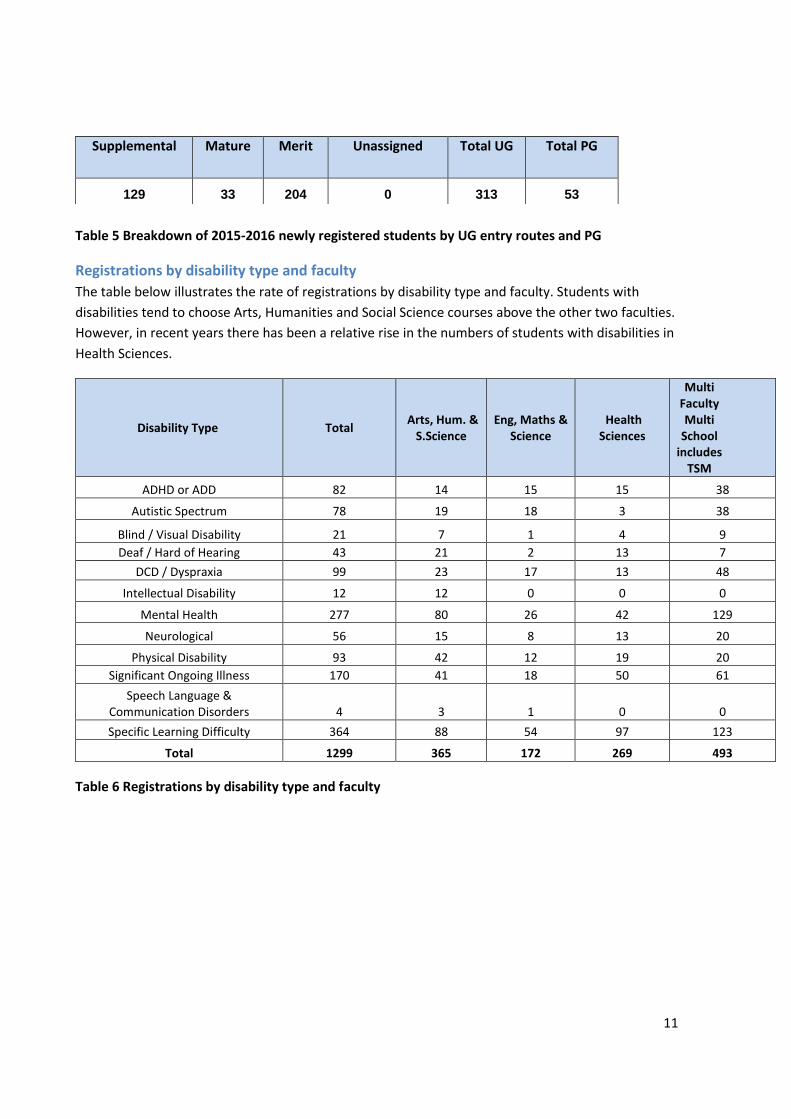
11
Table 5 Breakdown of 2015-2016 newly registered students by UG entry routes and PG
Registrations by disability type and faculty
The table below illustrates the rate of registrations by disability type and faculty. Students with
disabilities tend to choose Arts, Humanities and Social Science courses above the other two faculties.
However, in recent years there has been a relative rise in the numbers of students with disabilities in
Health Sciences.
Disability Type Total Arts, Hum. &
S.Science Eng, Maths &
Science Health
Sciences
Multi Faculty Multi
School includes
TSM
ADHD or ADD 82 14 15 15 38
Autistic Spectrum 78 19 18 3 38
Blind / Visual Disability 21 7 1 4 9
Deaf / Hard of Hearing 43 21 2 13 7
DCD / Dyspraxia 99 23 17 13 48
Intellectual Disability 12 12 0 0 0
Mental Health 277 80 26 42 129
Neurological 56 15 8 13 20
Physical Disability 93 42 12 19 20
Significant Ongoing Illness 170 41 18 50 61
Speech Language & Communication Disorders 4 3 1 0 0
Specific Learning Difficulty 364 88 54 97 123
Total 1299 365 172 269 493
Table 6 Registrations by disability type and faculty
Supplemental
Mature
Merit
Unassigned
Total UG
Total PG
129 33 204 0 313 53

12
Rate of increase or decrease of student registrations by disability type
The graphs below (figures 5A to 5H) illustrate the individual growth patterns of student registrations
by disability type over an 8-year period: 2008-16. The number of students with physical and sensory
disabilities continues to remain low and under-represented compared with other disability types.
Deaf/Hard of Hearing students enter Trinity in very low numbers. As a group they face considerable
difficulties in post-primary education, are less competitive at admissions, and are at higher risk of
withdrawal from higher education than any other group by disability type.
Figure 5A Deaf/Hard of Hearing students 2008-2016
Students who are blind or visually impaired also enter in low numbers. In contrast to those who are
deaf or hard of hearing, however, they are at low risk of withdrawal.
Figure 5B Blind/Visually Impaired students 2008-2016

13
Students with physical disabilities are under-represented in Trinity and Higher Education nationally
compared with other disability types. However, in recent years the numbers have increased
somewhat compared to those with sensory disabilities.
Figure 5C Students with physical disabilities 2008-2016
The number of students with specific learning difficulties, predominantly dyslexia, has decreased
marginally over the past 5 years. The proportionate decrease is greater. These decreases are mainly
for two reasons: firstly, the increase in the diagnosis rates of ADHD, Asperger’s Syndrome, and DCD
has lessened the numbers seeking a diagnosis specifically for dyslexia (there is a high co-morbidity
among these conditions). Secondly, the criteria for DARE ensure that only those with two or more
literacy difficulties (at or below the 10th percentile) are eligible for a points reduction at admissions.
Figure 5D Students with specific learning difficulties 2008-2016

14
Students with significant ongoing illness (SOIs) represent the most varied disability type as they are
categorised by the broadest criteria. There is no definitive list of all the medical conditions that could
be considered SOIs, but the most common conditions are cancer, chronic fatigue syndrome, Crohn’s
disease, diabetes, and multiple sclerosis. There is also overlap between some SOIs and other
categories of disability. For example, arthritic conditions vary and can be considered a physical
disability due to the impact on mobility; epilepsy has more recently been considered a neurological
condition, and mental health conditions can overlap with fatigue conditions. These discrepancies in
categorisation make it difficult to think of the SOI group in clearly defined terms.
Figure 5E Students with significant ongoing illnesses 2008-2016
Trinity has the highest number and the highest proportion of students with mental health difficulties
of any HEI in Ireland (Ahead surveys). There are a number of factors suggested to explain this. Firstly,
mental health conditions are regarded as the most prevalent of all disability types and therefore it is
likely that they are simply under diagnosed and under disclosed in other HEIs. In Trinity, there are
considerable resources available to diagnose and support students with mental health difficulties.
The Health Centre provides a Psychiatric Service and the Disability Service provides Occupational
Therapy support. There is also a College Counselling Service and tutorial service. It is suggested that
collectively, these supports also attract a higher number of students with mental health difficulties
among CAO applicants.
Figure 5F Students with mental health difficulties 2008-2016

15
The increase in students with Asperger’s Syndrome attending Trinity is significant, albeit from a very
low base, since 2007-08. Similar to the rationale suggested above for students with mental health
difficulties, there was (and maybe still is), a legacy of under diagnosis and under disclosure to ‘catch
up on’. Also, through the work of a number of staff and students in various departments over the
past decade, Trinity has gained a reputation of being a supportive environment for students with
Asperger’s Syndrome.
Figure 5G Students with Asperger’s 2008-2016
Students with ADD or ADHD are an emerging group since around 2007-08. Similar to students with
Asperger’s syndrome and DCD prior to 2007-08, as a group they were more likely to be “hidden”
among the general student population, or among those with Specific Learning Difficulties.
Figure 5H Students with ADD or ADHD 2008-2016

16
New first year undergraduate registrations
The majority of students registering in any one year are first year students. Since 2009-10, the
number of students registering as first years has averaged 193. Figure 6 below illustrates a “levelling-
off” of the number of first year students registering over a 5-year period (2009-13) followed by a 25%
increase in 2014-15 and a marginal decrease for 2015-16. Figure 7 shows new first year
undergraduate registrations by entry route.
Figure 6 First year (Junior Freshmen) registrations 2004-2005 to 2015-2016
Figure 7 New first year undergraduate registrations by entry route 2015-2016

17
When do students register with the Disability Service?
Knowing when students register with the Disability Service is useful because certain groups tend to
register early and others later. It is also useful to consider how supports and resources are ‘front
loaded’ at the start of the year. More than half the 336 students who registered with the Disability
Service in 2015-16 registered in the months of September and October (227). The remaining 109
students registered in comparatively low numbers in the other months of the year. In both years –
2014-15 and 2015-16 – patterns of student registrations with the Disability Service are similar.
Figure 8 All registrations by month in 2015-2016
18
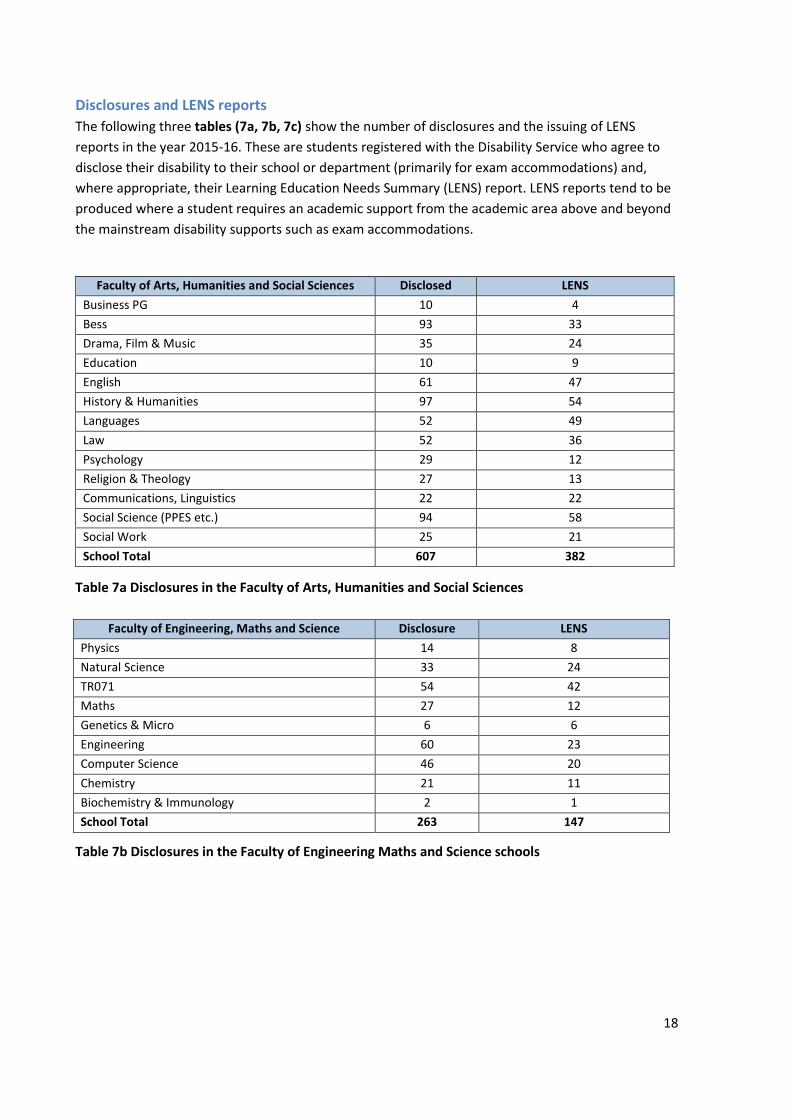
Disclosures and LENS reports
The following three tables (7a, 7b, 7c) show the number of disclosures and the issuing of LENS
reports in the year 2015-16. These are students registered with the Disability Service who agree to
disclose their disability to their school or department (primarily for exam accommodations) and,
where appropriate, their Learning Education Needs Summary (LENS) report. LENS reports tend to be
produced where a student requires an academic support from the academic area above and beyond
the mainstream disability supports such as exam accommodations.
Faculty of Arts, Humanities and Social Sciences Disclosed LENS
Business PG 10 4
Bess 93 33
Drama, Film & Music 35 24
Education 10 9
English 61 47
History & Humanities 97 54
Languages 52 49
Law 52 36
Psychology 29 12
Religion & Theology 27 13
Communications, Linguistics 22 22
Social Science (PPES etc.) 94 58
Social Work 25 21
School Total 607 382
Table 7a Disclosures in the Faculty of Arts, Humanities and Social Sciences
Faculty of Engineering, Maths and Science Disclosure LENS
Physics 14 8
Natural Science 33 24
TR071 54 42
Maths 27 12
Genetics & Micro 6 6
Engineering 60 23
Computer Science 46 20
Chemistry 21 11
Biochemistry & Immunology 2 1
School Total 263 147
Table 7b Disclosures in the Faculty of Engineering Maths and Science schools

19
Faculty of Health Sciences Disclosure LENS
Pharmacy 21 19
Nursing 71 54
Medicine 65 35
Dental Science+ 20 11
Radiation Therapy 6 6
Physiotherapy 10 5
Occupational Therapy 19 19
School Total 212 149
TAP 10 10
Total 434 308
Table 7c Disclosures in the Faculty of Health Science Schools
The graph below illustrates the rate of increase in disclosures per faculty across 4 years from 2012-13
to 2015-16. In 2013-14, the significant increase in disclosures among Health Science faculty students
was noteworthy. The increase continued marginally in 2015-16.
Figure 9 Increase in disclosures to Schools 2012-2013 to 2015-2016

20
Examination accommodations
Increase in exam accommodations from 2012-13 to 2015-16
The graph below illustrates the changes in the provision of exam accommodations over a four -year
period from 2013/14 to 2015/16. The changes reflect increases in students registering with the
Disability Service over the same period. The decreases reflected in 2014-15 is a result of more
improved accuracy in gathering data through SITS, rather than any decrease in the need for exam
accommodations.
Figure 10 DS Student Exam Accommodations from 2012-2013 to 2015-2016
DS Reg – All students registered with the Disability Service
All Exam Ac – All students with exam accommodations
Ex Time – All students with extra time
GV – All students who attend a Group Venue (alternative to the main venues)
PC – All students who use a computer in exams
Scribe/Reader – All students who have a scribe or reader in their exams
21
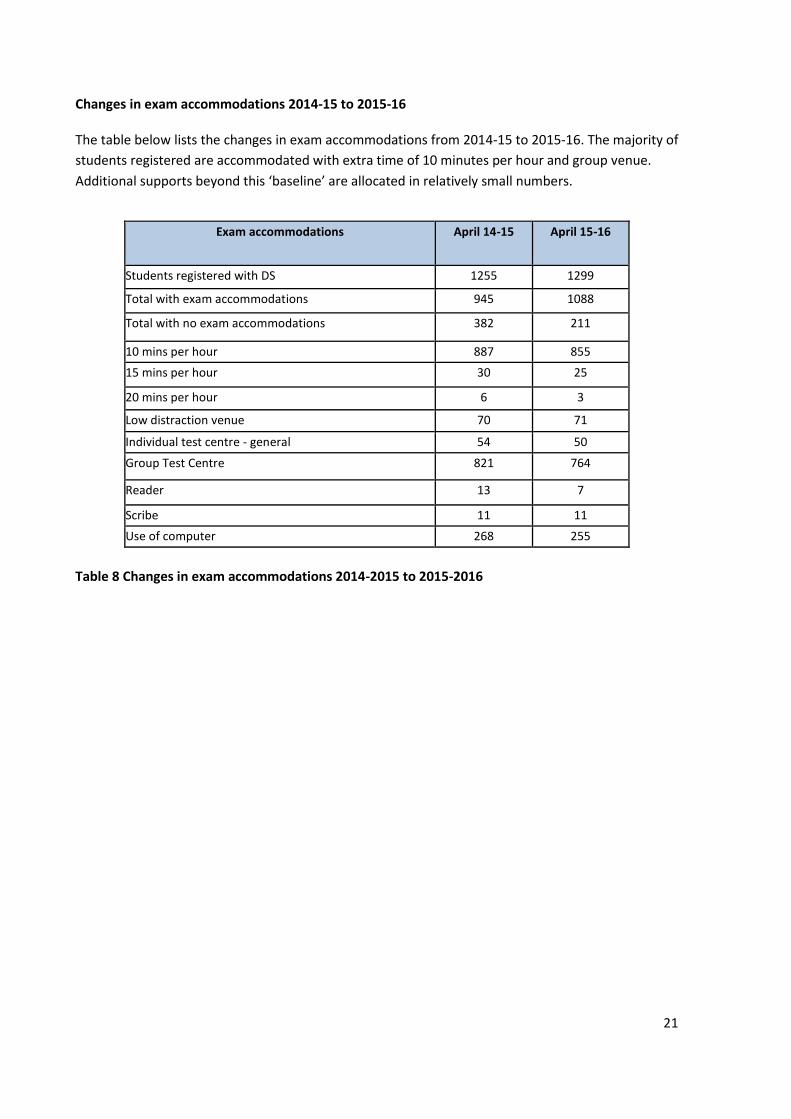
Changes in exam accommodations 2014-15 to 2015-16
The table below lists the changes in exam accommodations from 2014-15 to 2015-16. The majority of
students registered are accommodated with extra time of 10 minutes per hour and group venue.
Additional supports beyond this ‘baseline’ are allocated in relatively small numbers.
Exam accommodations April 14-15 April 15-16
Students registered with DS 1255 1299
Total with exam accommodations 945 1088
Total with no exam accommodations 382 211
10 mins per hour 887 855
15 mins per hour 30 25
20 mins per hour 6 3
Low distraction venue 70 71
Individual test centre - general 54 50
Group Test Centre 821 764
Reader 13 7
Scribe 11 11
Use of computer 268 255
Table 8 Changes in exam accommodations 2014-2015 to 2015-2016

22
Number of withdrawn students by disability type
The graph below illustrates the number of students by disability type who have withdrawn from
College since 2007. As a comparison, the current number of students by disability type is also shown.
Proportionate to the numbers registered, students with mental health difficulties and deaf/hard of
hearing students are at highest risk of leaving early. All other disability types have high retention
rates in comparison with the College average withdrawal rate of 14%.
Figure 11 Number of withdrawn students by disability type 2007 to 2013

23
Percentage of withdrawal of students with disabilities by disability type
The graph in figure 12 below illustrates the percentage rates of students who have withdrawn, listed
by disability type between the years 2007-13. Students who are deaf/hard of hearing make up 9% of
all students with disabilities who withdraw, but comprise of only 2.7% of all students with disabilities
who are registered (see figure 4 above). As a group, compared to their non-disabled peers, students
with disabilities tend to take longer to progress through their degrees and are more likely to
withdraw later. This means accurate tracking of progression and retention rates can only be done
about 6 years post entry. As a result, the data presented here represents students between 2007 and
2013.
Figure 12 Percentage of withdrawal of students with disabilities by disability type 2007-2013

24
The graph in figure 13 illustrates the number of students who graduate in four years or more,
organised by year of intake. Students with disabilities are far more likely to take longer to complete
their degrees when compared with their non-disabled peers. This is due to periods of illness, medical
repeats, and time off-books.
Figure 13 Undergraduate year of intake by year of graduation 2003-2008
Summary Points:
• More than half the students who register with the DS do so in the 6-week period between
late August and early October
• Students with specific learning difficulties such as dyslexia, and students with mental health
difficulties continue to register in high numbers compared with other disability types.
Students with physical and sensory disabilities continue to register in low numbers and
remain under-represented nationally
• Mental health and deaf/hard of hearing students are at highest risk of leaving early; all other
disability types have high retention rates
• Mature students tend to register late: typically after November from the year of intake

25
Section 2: Disability Service Delivery
Disability Services and Supports
Use of the Respite Room
When not in-use by students registered with Disability Service, the Respite Room is used for exam
scribe practice and Occupational Therapy appointments.
Figure 14 Use of respite room 2015-2016
Educational Support Worker Service
Casual employees are recruited from the postgraduate student body to work as Educational Support
Workers (ESW). There is a variety of roles available, and although the work is paid, there is a
significant sense of contribution and commitment by these workers. When a high needs student
meets with their Disability Officer (DO), the DO will assess what supports are needed and make a
referral to the Disability Service Office Manager (DSOM) for these to be put in place. ESW aptitude,
interest, and time availability is matched to disabled student requirements. The following supports
were given in 2015/16.
Referrals for Educational Support (14-15 numbers in brackets)
14 (15) students received note-taking support. All students are from the hearing impaired,
physical, or SOI cohort.
12 (11) students for library/academic assistance
1 (3) for lab assistance
4 (3) for PAs
264 students for Special Borrowing Privileges (SBPs)
803 (773) students received print credit
12 (40) students referred (average of 6 hours each used) for Subject Specific Tuition

26
Figure 15 Academic support referrals to ESWs 2014-2015 to 2015-2016
Educational Support Worker numbers
The numbers breakdown for 2015-16 was:
375 (234) on the ESW database
134 (229) available 15.16
291 (127) newly registered 15.16
45(59) worked for DS in 15.16
Figure 16 Number of registered ESWs 2014-2015 to 2015-2016

27
ESW Exam support
During the exams period, the Disability Office recruits, trains, and supplies scribes to work with
students who require this support. The scribe and student meet for a minimum of 2 sessions prior to
exams to practice pacing, etc., and to be made aware of the protocols for this work. The scribe also
becomes the invigilator for any exams held in individual venues.
12(11) students used scribes for 15-16 exam session
61 (42) individual exams covered by 14 scribes
3 x Irish Sign Language (ISL) translator sessions booked for examinations (used for occasions
where a student needs to ask questions of a non-ISL examiner) and 2 sessions for
transcription.
The payment of the scribes is an issue that has arisen over the past number of years. There is no
transparency in the payments process with the Exams Office. The scribes do not submit their own
timesheets, as is normal procedure with ESW work. The other issue is that the Scribe Invigilators
recruitment and training is not stream-lined with the Exams Office.
Figure 17 Referrals to ESW for exam support 2014-15 to 2015-2016

28
Funding Statistics
Students who are domicile in Ireland are entitled to have their supports funded by the European
Social Fund for Students with Disabilities (ESFFSD). Applications are made to this fund by the
Disability Service. The money is paid to the Service and not to the student.
The below graph in figure 18 shows the growth in applications that reflects the growth in numbers
registering.
Figure 18 Growth in applications reflecting funding trend from 2010-2011 to 2015-2016
Registered Funded Year
818 538 10-11
911 592 11-12
1058 709 12-13
1186 842 13-14
1313 902 14-15
1299 894 15-16
Table 9 ESF FSD funding for supports 2010-2011 to 2015-2016

29
The money available to the ESFFSD has not grown over the years to reflect the growing numbers of
applicants. The following tables show the diminishing amount of funding received and balance
retained. Retained balances are set against the following year of funding.
Year ESF funding Spend Surplus
10-11 €750,278 €528,818 €221,460
11-12 €754,342 €571,409 €182,933
12-13 €642,513 €465,500 €177,013
13-14 €550,000 €465,500 €84,500
14-15 €644,057 €508,360 €135,698
15-16 €529,140 €496,713 €32,427
Table 10 ESF FSD income and expenditure 2010-2011 to 2015-2016
Figure 19 ESF FSD expenditure by support type 2012-2013 to 2015-2016

30
Figure 20 ESF FSD expenditure 2010-2011 to 2015-2016
Figure 21 ESF FSD expenditure percentages 2010-2011 to 2015-2016
31
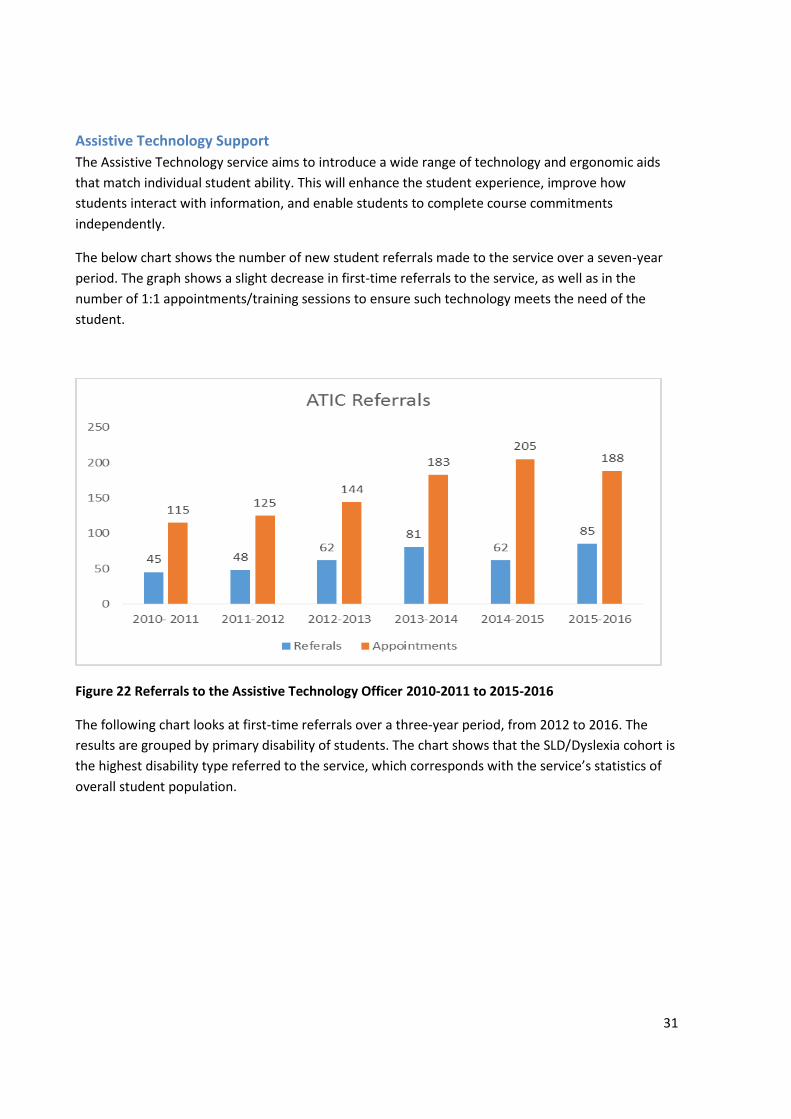
Assistive Technology Support
The Assistive Technology service aims to introduce a wide range of technology and ergonomic aids
that match individual student ability. This will enhance the student experience, improve how
students interact with information, and enable students to complete course commitments
independently.
The below chart shows the number of new student referrals made to the service over a seven-year
period. The graph shows a slight decrease in first-time referrals to the service, as well as in the
number of 1:1 appointments/training sessions to ensure such technology meets the need of the
student.
Figure 22 Referrals to the Assistive Technology Officer 2010-2011 to 2015-2016
The following chart looks at first-time referrals over a three-year period, from 2012 to 2016. The
results are grouped by primary disability of students. The chart shows that the SLD/Dyslexia cohort is
the highest disability type referred to the service, which corresponds with the service’s statistics of
overall student population.

32
Figure 23 Disability type referrals – 1:1 appointments 2012-2013 to 2015-2016
Upon meeting the student for the first time, the Assistive Technology Service carries out a needs
assessment process to ensure a correct match with the student’s needs, training, and ability. The
service offers a number of short-term loans of assistive technology hardware and software to
students; the below chart shows the number of loan agreements signed by students referred to the
service over a five-year period (2011-16):
Figure 24 Loan Agreements of technology to students 2011-2012 to 2015- 2016

33
This chart highlights the different type of student loans agreed with students over a four-year period.
Each piece of equipment is tracked and returned (as needed), to the service at the end of the
student’s academic journey.
Figure 25 Loan agreements of Assistive Technology 2013-2014 to 2015-2016
As well as meeting students via a 1:1 training, the Disability Service makes available two universally
accessible Assistive Technology computer areas. These are located in the two main libraries areas of
the college, the Ussher library and the Hamilton library.
The graph below charts the average amount of students using each AT area. This is based on the
average number of logins made, measured against all the PCs and Macs available in each AT area. In-
line with the above graphs, the Ussher library – due to its size and student population – is used more
frequently by students who referred for Assistive Technology supports.

34
Figure 26 Average user logon of AT public areas 2009-2010 to 2015-2016
35
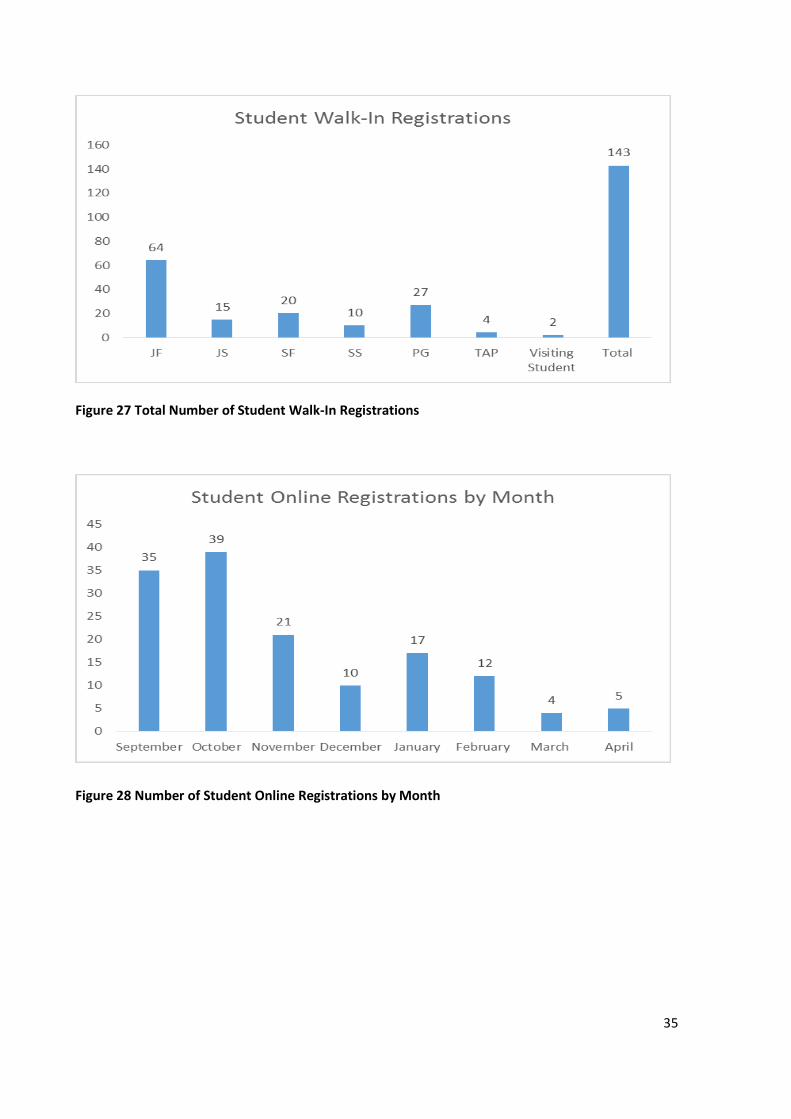
Figure 27 Total Number of Student Walk-In Registrations
Figure 28 Number of Student Online Registrations by Month

36
Occupational Therapy Supports
Occupational therapy is a confidential support for students with mental health and/or
physical/sensory disabilities. The support aims to enable students to develop practical self-
management strategies, to support them in managing the tasks of being a student at university.
For more information on the Occupational Therapy Supports, please see: DS Website Occupational
Therapy
Figure 29 Total Number of Occupational Therapy Referrals
Figure 30 Total Number of Student Appointments per year

37
Figure 31 Average number of appointments by disability in 2015-16

38
Section 3: DS Website Statistics
Page View – Disability Website 15-16
Figure 40 Visitor behaviour DS website 2015-2016

39
Figure 41 You Tube Activities 2015-2016
Figure 42 DS Facebook engagement 2015-2016