Embed Size (px)
Citation preview
DEMOGRAPHIC RESEARCH
VOLUME 39, ARTICLE 7, PAGES 209,250PUBLISHED 31 JULY 2018http://www.demographic-research.org/Volumes/Vol39/7/DOI: 10.4054/DemRes.2018.39.7
Research Article
Disability crossover: Is there a Hispanicimmigrant health advantage that reversesfrom working to old age?
Mara Getz Sheftel
Frank W. Heiland
© 2018 Mara Getz Sheftel & Frank W. Heiland.
This open-access work is published under the terms of the Creative CommonsAttribution 3.0 Germany (CC BY 3.0 DE), which permits use, reproduction,and distribution in any medium, provided the original author(s) and sourceare given credit.See https://creativecommons.org/licenses/by/3.0/de/legalcode.

Contents
1 Introduction 210
2 Data, measures, and methods 212
3 Results 2143.1 Sample descriptive statistics 2143.2 Mexican-born vs. US-born 2153.3 Mexican-born vs. other foreign-born Hispanics 2193.4 Mexican-born by age at migration 2213.5 Mexican-born by education level 2233.6 Specific disabilities 2253.6.1 Ambulatory disability 2253.6.2 Cognitive disability 2273.6.3 Difficulty with independent living 2283.6.4 Difficulty with self-care 2303.6.5 Visual disability 2313.6.6 Auditory disability 233
4 Discussion and conclusion 234
5 Acknowledgments 238
References 239
Appendix 248
Demographic Research: Volume 39, Article 7Research Article
http://www.demographic-research.org 209
Disability crossover:Is there a Hispanic immigrant health advantage that reverses
from working to old age?
Mara Getz Sheftel1
Frank W. Heiland2
Abstract
BACKGROUNDHispanic immigrants have been found to be more likely to have a disability than US-born populations. Studies have primarily focused on populations aged 60 and older;little is known about immigrant disability at younger ages.
OBJECTIVETaking a broader perspective, we investigate whether Hispanic immigrants have lowerdisability rates in midlife; if so, at what ages this health advantage reverses; and thecorrelates of this pattern.METHODSUsing American Community Survey 2010–2014 data, we estimate age-specificdisability prevalence rates by gender, nativity, education, and migration age from age40 to 80. We also present estimates by six types of disability.RESULTSCompared to non-Hispanic whites, disability prevalence among foreign-born Mexicanwomen is lower until age 53 (men: 61) and greater after 59 (66). Similar patterns holdfor other foreign-born Hispanics. Crossovers are observed in rates of ambulatory,cognitive, independent living, and self-care disability. Evidence of a steeper age–disability gradient among less-educated immigrants is found. Minimal differences arenoted by migration age, challenging an acculturation explanation for the crossover.
CONTRIBUTIONThe paper contributes to a better understanding of immigrant–native disability patternsin the United States. It is the first to systematically document a Hispanic immigrant
1 Sociology Department, CUNY Graduate Center, New York, USA. Email: [email protected] Marxe School of Public and International Affairs, The Graduate Center of CUNY (Economics), CUNYInstitute for Demographic Research, City University of New York, Baruch College, New York, USA.Email: [email protected].

Sheftel & Heiland: Is there a Hispanic immigrant health advantage that reverses from working to old age?
210 http://www.demographic-research.org
health advantage in disability that reverses from working to old age. Hispanicimmigrants (particularly foreign-born Mexican women), may face steeper risktrajectories, consistent with their greater concentration in low-skill manual occupations.We call for increased scholarly attention to this phenomenon.
1. Introduction
The Hispanic population in the United States continues to grow rapidly, and its share inthe population over age 65 is expected to more than double between 2012 and 2050,from just over 7% to over 18% (15.4 million people). Hispanics tend to bedisadvantaged socioeconomically relative to non-Hispanic whites (based on income,education, employment, and occupational status) and have lower rates of healthinsurance coverage. They are also overrepresented among the undocumented immigrantpopulation (Hummer and Hayward 2015). Rapid growth and aging of this particularlyvulnerable population will impact future health patterns in the United States. Hence,understanding how this population fares in terms of health outcomes is important toresearchers and policy makers.
Studies consistently find that foreign-born Hispanics have lower mortality ratesthan American-born Hispanics and non-Hispanic whites (Abraido-Lanza et al. 1999;Arias 2010; Eschbach, Kuo, and Goodwin 2006; Franzini, Ribble, and Keddie 2001;Markides and Coreil 1986; Markides and Eschbach 2005, 2011; Palloni and Arias 2004;Shor, Roelfs, and Vang 2017; Singh and Siahpush 2002). While there is evidence thathealth-selective return migration (the so-called “salmon bias”) and other data qualityissues contribute to the phenomenon, studies generally conclude that these sources ofbias are insufficient to explain away the Hispanic immigrant mortality advantage(Abraido-Lanza et al. 1999; Arias 2010; Akresh and Frank 2008; Crimmins et al. 2005;Elo et al. 2004; Hummer and Hayward 2015; Lariscy, Hummer, and Hayward 2015;Turra and Elo 2008). The mortality advantage is particularly pronounced amongMexican-born immigrants and at older ages (Angel et al. 2010; Elo et al. 2004;Hayward et al. 2014; Hummer et al. 2000; Lariscy 2011; Lariscy, Hummer, andHayward 2015; Markides and Eschbach 2011). Evidence of lower mortality, especiallywhen observed among low socioeconomic-status immigrants like Mexicans (Alba andFoner 2015), provides a strong challenge to widespread findings in the health literaturethat lower socioeconomic status is associated with poorer health (Hayward and Gorman2004; Masters, Hummer, and Powers 2012; Zsembik and Fennell 2005). Because it runscontrary to typical patterns of health determination, the Hispanic mortality advantage isoften referred to as an ‘epidemiological paradox’ (Markides and Coreil 1986) or the
Demographic Research: Volume 39, Article 7
http://www.demographic-research.org 211
‘Hispanic paradox’ (Abraido-Lanza et al. 1999; Franzini, Ribble, and Keddie 2001;Markides and Eschbach 2005; Palloni and Arias 2004).
Recent literature on immigrant health has broadened the scope to includedisability. The emerging evidence suggests that the Hispanic immigrant healthadvantage in mortality may not extend to disability: Several studies – using variousdisability measures and data sources – report that Hispanic immigrants, and particularlyMexicans, have higher disability rates than non-Hispanic whites at age 60 and older(Angel, Angel, and Hill 2014; Eschbach et al. 2007; Garcia et al. 2015; Hummer,Benjamins, and Rogers 2004; Markides et al. 2007; Nam, Al-Snih, and Markides 2015).
Relatively little is known about disability among Hispanic immigrants youngerthan 60. Warner and Brown (2011) estimate longitudinal models of functionallimitations using Health and Retirement Study (HRS) data and show that MexicanAmericans experience limitations at higher rates from age 53 to 75 than non-Hispanicwhites. They adjust for nativity but do not look specifically at foreign-born Mexicans.Hayward et al. (2014) show that foreign-born Hispanic men in the HRS havecomparable disability rates to non-Hispanic whites at ages 50–54, but rates increasemore rapidly among foreign-born Hispanic men at older ages. Foreign-born Hispanicwomen already have higher disability rates than white women at ages 50–54, and thisdifferential widens with age. Also using HRS data, Crimmins, Hayward, and Seeman(2004) find that foreign-born Hispanics between ages 51 and 61 are more likely to havea disability than non-Hispanic whites. Using National Health Interview Study (NHIS)data, Melvin et al. (2014) find that at midlife (ages 50–64) both male and femaleforeign-born Hispanics (with the exception of Puerto Ricans) have equal or lowerproportions of functional limitations as compared to non-Hispanic whites, but theproportions reverse by age 65 for both men and women on all measures of disability.Using American Community Survey (ACS) data, Sheftel (2017) estimates that 18–64-year-old foreign-born Mexican males and females experience lower disability rates thannon-Hispanic whites and those of Mexican origin born in the United States. However,above age 64, foreign-born Mexican males have higher disability rates than whitemales, and foreign-born Mexican females have higher rates than US-born white femalesand females of Mexican origin born in the United States.
Surveying the literature on immigrant disability, the findings – collectively –suggest a health advantage at younger ages that later reverses. This type ofphenomenon, known as a “crossover” in demography and public health, is based on twographs representing age-specific rates of two populations that narrow, intersect, andthen diverge over some age range. (See, e.g., Lariscy 2017 for a recent contribution onblack–white mortality crossovers at old age.) However, no study has systematicallyanalyzed this phenomenon, including at what age the advantage reverses, howpronounced this pattern is, and how it varies by gender, age at migration, education, and

Sheftel & Heiland: Is there a Hispanic immigrant health advantage that reverses from working to old age?
212 http://www.demographic-research.org
type of disability. Further, while a few of the studies reviewed above base their findingson age 50 and older (Crimmins, Hayward, and Seeman 2004; Hayward et al. 2014;Melvin et al. 2014; Sheftel 2017; Warner and Brown 2011), the primary focus ofresearch to date has been populations older than 60. Disablement is a process that canbegin at young ages; thus, taking a broader (life course) perspective is important tounderstanding disability onset and progression (Verbrugge and Jette 1994).
This paper attempts to fill this void by presenting results from a comprehensiveanalysis of disability patterns comparing foreign-born Mexicans and non-MexicanHispanic immigrants to US-born demographics from age 40. We use large nationallyrepresentative samples of these populations available in the 2010–2014 ACS, enablingus to determine more accurately the age-specific patterns of disability, including at whatages disability rates cross. Unlike previous studies, we estimate disability rates frommiddle working age onward (age 40 and above) and for single-year age groups. Inaddition to (unadjusted) rates of overall disability, we also present evidence stratified bygender and type of disability. Additionally, we look at patterns by educationalattainment and age at migration to evaluate explanations related to socioeconomicstatus and acculturation.
2. Data, measures, and methods
This study uses data from the 2010–2014 American Community Survey (ACS) public-use microdata sample (PUMS), which randomly sampled 5% of the Americanpopulation between 2010 and 2014 (Ruggles et al. 2015). The ACS is offered inSpanish and English and is completed by one household member on behalf of all others.
We restricted the analysis to specific groups based on race, ethnicity, and nativity,and use categories and terminology consistent with the ACS survey. The ACS asksabout Hispanic origin, race, and place of birth. Respondents of Hispanic, Latino, orSpanish origin were prompted to provide further detail. Those who indicated “Mexican,Mexican American, or Chicano” were considered to be of Mexican origin here andwere further divided by birthplace into those born in Mexico (foreign-born Mexicans)and those born in the fifty United States (US-born of Mexican origin). Non-MexicanHispanics were also divided by birthplace into those born in Central and South America(foreign-born Hispanics) and those born in the fifty United States (US-born Hispanics).Island-born Puerto Ricans were included among foreign-born Hispanics because typicalimmigrant health patterns have been shown to hold for those who migrate from PuertoRico to mainland United States (Landale, Oropesa, and Gorman 2000). Non-Hispanicwhites are those who answered ‘white’ to the race question and ‘non-Hispanic’ to the
Demographic Research: Volume 39, Article 7
http://www.demographic-research.org 213
Hispanic question. Similarly, non-Hispanic blacks are those who answered ‘black’ or‘African American’ to the race question and ‘non-Hispanic’ to the Hispanic question.
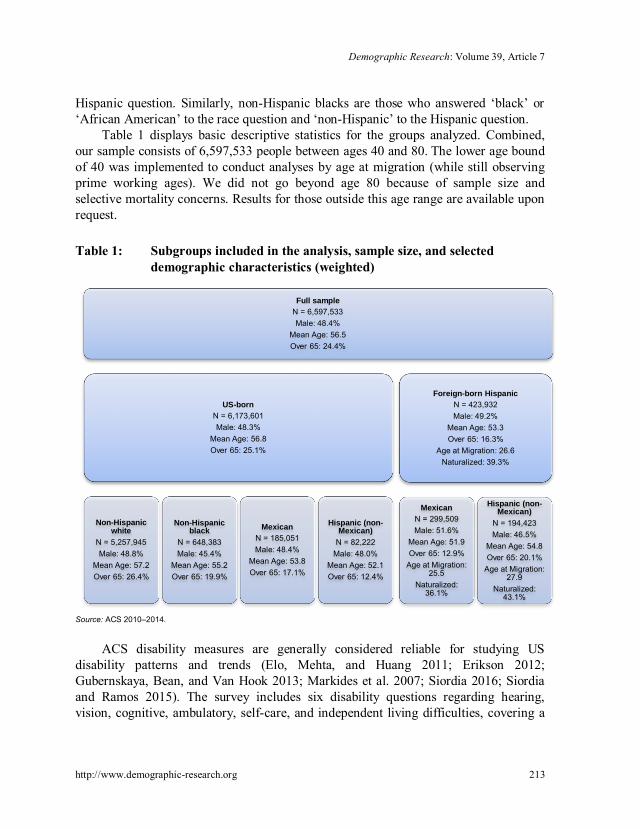
Table 1 displays basic descriptive statistics for the groups analyzed. Combined,our sample consists of 6,597,533 people between ages 40 and 80. The lower age boundof 40 was implemented to conduct analyses by age at migration (while still observingprime working ages). We did not go beyond age 80 because of sample size andselective mortality concerns. Results for those outside this age range are available uponrequest.
Table 1: Subgroups included in the analysis, sample size, and selecteddemographic characteristics (weighted)
Source: ACS 2010–2014.
ACS disability measures are generally considered reliable for studying USdisability patterns and trends (Elo, Mehta, and Huang 2011; Erikson 2012;Gubernskaya, Bean, and Van Hook 2013; Markides et al. 2007; Siordia 2016; Siordiaand Ramos 2015). The survey includes six disability questions regarding hearing,vision, cognitive, ambulatory, self-care, and independent living difficulties, covering a
Full sampleN = 6,597,533Male: 48.4%
Mean Age: 56.5Over 65: 24.4%
Foreign-born HispanicN = 423,932Male: 49.2%
Mean Age: 53.3Over 65: 16.3%
Age at Migration: 26.6Naturalized: 39.3%
Hispanic (non-Mexican)
N = 194,423Male: 46.5%
Mean Age: 54.8Over 65: 20.1%
Age at Migration:27.9
Naturalized:43.1%
MexicanN = 299,509Male: 51.6%
Mean Age: 51.9Over 65: 12.9%
Age at Migration:25.5
Naturalized:36.1%
US-bornN = 6,173,601Male: 48.3%
Mean Age: 56.8Over 65: 25.1%
Hispanic (non-Mexican)
N = 82,222Male: 48.0%
Mean Age: 52.1Over 65: 12.4%
MexicanN = 185,051Male: 48.4%
Mean Age: 53.8Over 65: 17.1%
Non-Hispanicblack
N = 648,383Male: 45.4%
Mean Age: 55.2Over 65: 19.9%
Non-Hispanicwhite
N = 5,257,945Male: 48.8%
Mean Age: 57.2Over 65: 26.4%
Sheftel & Heiland: Is there a Hispanic immigrant health advantage that reverses from working to old age?
214 http://www.demographic-research.org
wide range of activities and health-related difficulties. We constructed a binary measureof overall disability based on individuals’ responses to the six disability questions onthe ACS survey (coded 1 if the individual answered affirmative to at least one of thesesix questions).
To estimate age-specific rates of disability for various groups (by gender), theindividual-level data was aggregated by one-year age groups, using ACS providedperson weights, perwt, normalized using Stata’s analytic weight function. In addition tooverall disability prevalence rates (“any disability”), we report results from separateanalyses of the six underlying disability domains. We also analyzed total disabilityrates, calculated using the total number of disabilities reported across the six domains.
Focusing on age-specific prevalence allows us to study disability patterns adjustedfor differences in age structure across the underlying populations. Such differences doexist (see next section), and they have been shown to meaningfully affect aggregatedisability patterns based on crude rates (Sheftel 2017).
For evidence of an immigrant health advantage in disability that reverses, we lookfor crossovers in age-specific rates. Our sample sizes are generally large, but since weare reporting rates for single-year age groups (by gender) statistical precision may stillbe a concern. We report 95% confidence intervals in all graphs and comment on thestatistical significance of rates.
3. Results
3.1 Sample descriptive statistics
The final analytic sample is composed of 6,597,533 US-born non-Hispanic whites,blacks, Mexicans, and Hispanics (non-Mexican) as well as foreign-born Mexicans andHispanics (non-Mexicans). The mean age in the analytic sample is 56.5, and 24.4% ofthe sample is over the age of 65. The sample is 48.4% male and 91.7% US-born. Ourprimary focus is on the 299,509 foreign-born Mexicans in the sample since they are thelargest subpopulation. However, as we note below, the patterns found for foreign-bornMexicans generally hold for foreign-born Hispanics from other countries. Foreign-bornMexicans are considerably younger than the overall sample, with a mean age of 51.9and 12.9% over the age of 65. The mean age at migration is 25.5, and 36.1% of theseforeign-born Mexicans have become naturalized American citizens. These figures forthe entire analytic sample, as well as each subgroup, are included in Table 1.

Demographic Research: Volume 39, Article 7
http://www.demographic-research.org 215
3.2 Mexican-born vs. US-born
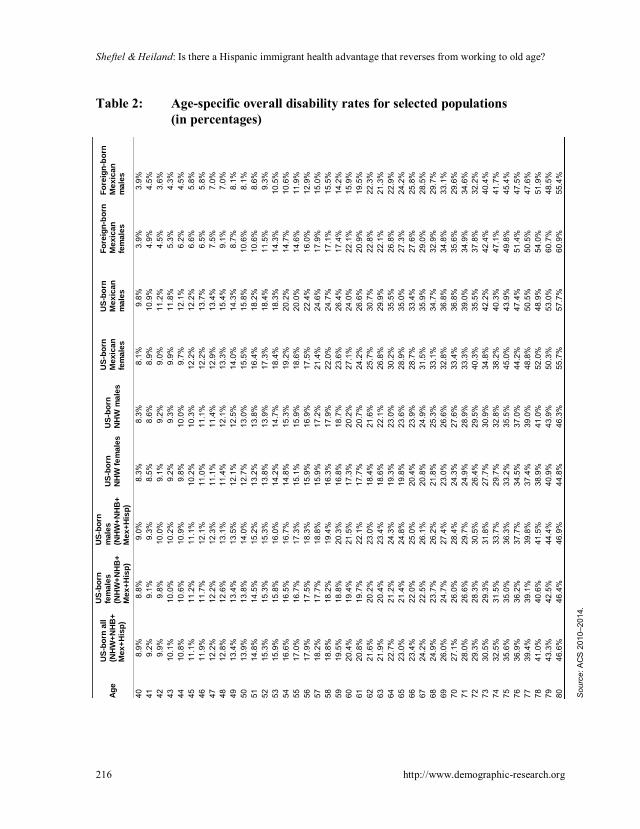
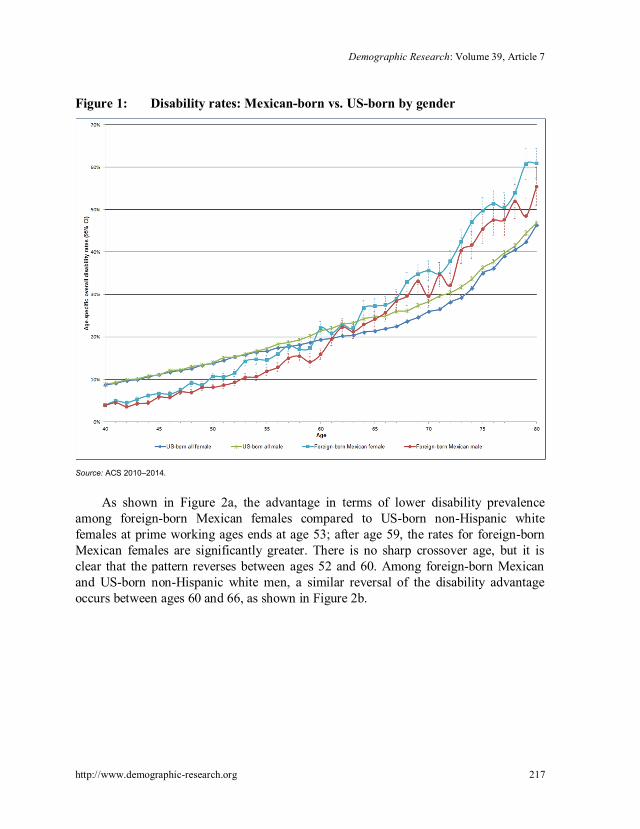
Table 2 shows age-specific prevalence rates of overall disability for selectedsubpopulations. We illustrate these results in a series of graphs. Figure 1 shows theoverall disability rate for Mexican-born males and females respectively, using all US-born males and females for comparison (including US-born of Mexican origin).
As is evident from this first illustration of disability rates, both male and femaleforeign-born Mexicans start off with an overall disability advantage. In their 40s, theyhave the lowest rates of overall disability among the subpopulations investigated here.However, that advantage starts to decline with age, and it is reversed at old age. Forexample, at age 45, the overall disability rates for foreign-born Mexican males andfemales are 5.8% and 6.3%, respectively. This is compared to 11.1% for the US-bornpopulation. In contrast, 45.5% of Mexican-born males report having a disability at age75 compared to 36.3% for US-born males. For Mexican-born females at this age, therate is even greater at 49.8%, which compares to 36.3% for US-born females. Thesedifferences by gender are statistically significant, as indicated by the 95% confidenceinterval ranges.
Careful inspection of Figure 1 shows that there are fairly distinct ages (by gender)at which the disability curves cross. For males that age is approximately 65 years; forfemales the crossover age is approximately 59 years. These points are near agestraditionally associated with retirement from the workforce (Munnell 2015). Figure 5estimates that the average retirement age in 2013 was 64 for men and 62 for women.The conclusions are similar when using only US-born non-Hispanic whites as thecomparison group.
Sheftel & Heiland: Is there a Hispanic immigrant health advantage that reverses from working to old age?
216 http://www.demographic-research.org
Table 2: Age-specific overall disability rates for selected populations(in percentages)
Age
US-
born
all
(NH
W+N
HB
+M
ex+H
isp)
US-
born
fem
ales
(NH
W+N
HB
+M
ex+H
isp)
US-
born
mal
es(N
HW
+NH
B+
Mex
+His
p)
US-
born
NH
Wfe
mal
esU
S-bo
rnN
HW
mal
esU
S-bo
rnM
exic
anfe
mal
es
US-
born
Mex
ican
mal
es
Fore
ign-
born
Mex
ican
fem
ales
Fore
ign-
born
Mex
ican
mal
es
408.
9%8.
8%9.
0%8.
3%8.
3%8.
1%9.
8%3.
9%3.
9%41
9.2%
9.1%
9.3%
8.5%
8.6%
8.9%
10.9
%4.
9%4.
5%42
9.9%
9.8%
10.0
%9.
1%9.
2%9.
0%11
.2%
4.5%
3.6%
4310
.1%
10.0
%10
.2%
9.2%
9.3%
9.9%
11.8
%5.
3%4.
3%44
10.8
%10
.6%
10.9
%9.
8%10
.0%
9.7%
12.1
%6.
2%4.
5%45
11.1
%11
.2%
11.1
%10
.2%
10.3
%12
.2%
12.2
%6.
6%5.
8%46
11.9
%11
.7%
12.1
%11
.0%
11.1
%12
.2%
13.7
%6.
5%5.
8%47
12.2
%12
.2%
12.3
%11
.1%
11.4
%12
.9%
13.4
%7.
5%7.
0%48
12.8
%12
.6%
13.1
%11
.4%
12.1
%13
.3%
15.4
%9.
1%7.
0%49
13.4
%13
.4%
13.5
%12
.1%
12.5
%14
.0%
14.3
%8.
7%8.
1%50
13.9
%13
.8%
14.0
%12
.7%
13.0
%15
.5%
15.8
%10
.6%
8.1%
5114
.8%
14.5
%15
.2%
13.2
%13
.8%
16.4
%18
.2%
10.6
%8.
6%52
15.3
%15
.3%
15.3
%13
.8%
13.9
%17
.3%
18.4
%11
.5%
9.3%
5315
.9%
15.8
%16
.0%
14.2
%14
.7%
18.4
%18
.3%
14.3
%10
.5%
5416
.6%
16.5
%16
.7%
14.8
%15
.3%
19.2
%20
.2%
14.7
%10
.6%
5517
.0%
16.7
%17
.3%
15.1
%15
.9%
18.6
%20
.0%
14.6
%11
.9%
5617
.9%
17.5
%18
.3%
15.9
%16
.9%
17.5
%22
.4%
16.0
%12
.9%
5718
.2%
17.7
%18
.8%
15.9
%17
.2%
21.4
%24
.6%
17.9
%15
.0%
5818
.8%
18.2
%19
.4%
16.3
%17
.9%
22.0
%24
.7%
17.1
%15
.5%
5919
.5%
18.8
%20
.3%
16.8
%18
.7%
23.6
%26
.4%
17.4
%14
.2%
6020
.4%
19.4
%21
.5%
17.3
%20
.2%
27.1
%24
.0%
22.1
%15
.9%
6120
.8%
19.7
%22
.1%
17.7
%20
.7%
24.2
%26
.6%
20.9
%19
.5%
6221
.6%
20.2
%23
.0%
18.4
%21
.6%
25.7
%30
.7%
22.8
%22
.3%
6321
.9%
20.4
%23
.4%
18.6
%22
.1%
26.8
%29
.9%
22.1
%21
.3%
6422
.7%
21.2
%24
.3%
19.3
%23
.0%
30.2
%35
.5%
26.8
%22
.9%
6523
.0%
21.4
%24
.8%
19.8
%23
.6%
28.9
%35
.0%
27.3
%24
.2%
6623
.4%
22.0
%25
.0%
20.4
%23
.9%
28.7
%33
.4%
27.6
%25
.8%
6724
.2%
22.5
%26
.1%
20.8
%24
.9%
31.5
%35
.9%
29.0
%28
.5%
6824
.9%
23.7
%26
.2%
21.8
%25
.3%
33.1
%34
.7%
32.9
%29
.7%
6926
.0%
24.7
%27
.4%
23.0
%26
.6%
32.8
%36
.8%
34.8
%33
.1%
7027
.1%
26.0
%28
.4%
24.3
%27
.6%
33.4
%36
.8%
35.6
%29
.6%
7128
.0%
26.6
%29
.7%
24.9
%28
.9%
33.3
%39
.0%
34.9
%34
.6%
7229
.3%
28.3
%30
.5%
26.4
%29
.5%
40.3
%35
.5%
37.8
%32
.2%
7330
.5%
29.3
%31
.8%
27.7
%30
.9%
34.8
%42
.2%
42.4
%40
.4%
7432
.5%
31.5
%33
.7%
29.7
%32
.8%
38.2
%40
.3%
47.1
%41
.7%
7535
.6%
35.0
%36
.3%
33.2
%35
.5%
45.0
%43
.9%
49.8
%45
.4%
7636
.9%
36.2
%37
.7%
34.5
%37
.0%
44.2
%47
.4%
51.4
%47
.5%
7739
.4%
39.1
%39
.8%
37.4
%39
.0%
48.8
%50
.5%
50.5
%47
.6%
7841
.0%
40.6
%41
.5%
38.9
%41
.0%
52.0
%48
.9%
54.0
%51
.9%
7943
.3%
42.5
%44
.4%
40.9
%43
.9%
50.3
%53
.0%
60.7
%48
.5%
8046
.6%
46.4
%46
.9%
44.8
%46
.3%
55.7
%57
.7%
60.9
%55
.4%
Sou
rce:
AC
S20
10–2
014.
Demographic Research: Volume 39, Article 7
http://www.demographic-research.org 217
Figure 1: Disability rates: Mexican-born vs. US-born by gender
Source: ACS 2010–2014.
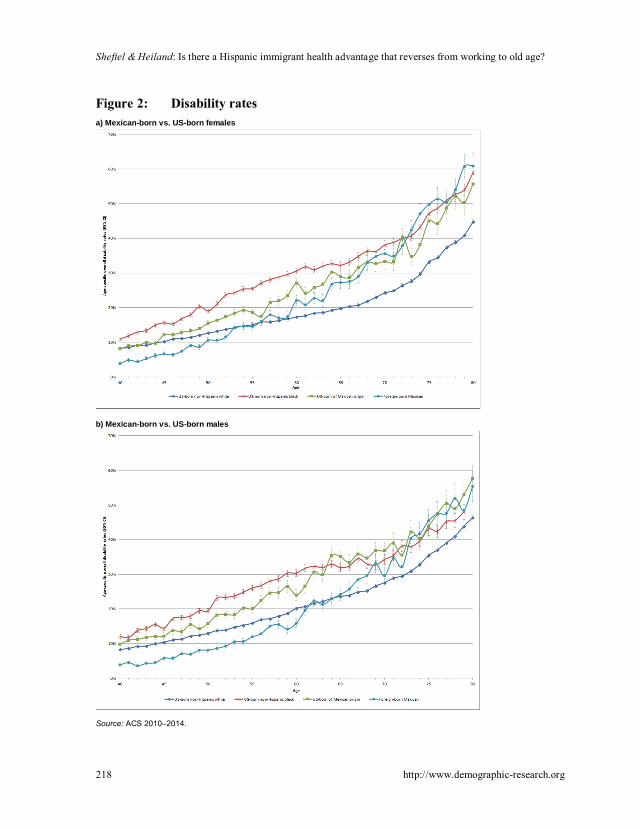
As shown in Figure 2a, the advantage in terms of lower disability prevalenceamong foreign-born Mexican females compared to US-born non-Hispanic whitefemales at prime working ages ends at age 53; after age 59, the rates for foreign-bornMexican females are significantly greater. There is no sharp crossover age, but it isclear that the pattern reverses between ages 52 and 60. Among foreign-born Mexicanand US-born non-Hispanic white men, a similar reversal of the disability advantageoccurs between ages 60 and 66, as shown in Figure 2b.
Sheftel & Heiland: Is there a Hispanic immigrant health advantage that reverses from working to old age?
218 http://www.demographic-research.org
Figure 2: Disability ratesa) Mexican-born vs. US-born females
b) Mexican-born vs. US-born males
Source: ACS 2010–2014.

Demographic Research: Volume 39, Article 7
http://www.demographic-research.org 219
In addition, Figures 2a and 2b compare foreign-born Mexicans to US-born non-Hispanic blacks. Of note is the fact that disability rates for both male and femaleforeign-born Mexicans also cross over those of blacks, albeit at older ages than they dofor non-Hispanic whites. This crossover is noticeable despite the fact that blacks areconsistently found to have significantly lower life expectancies than foreign-bornHispanics (Lariscy, Hummer, and Hayward 2015), but it is consistent with previousfindings that Mexican Americans (including foreign and US-born) have higher rates offunctional limitations than blacks (Warner and Brown 2011).
Finally, Figures 2a and 2b also show the contrast between foreign-born Mexicansand American-born Mexicans. Compared to US-born whites, US-born of Mexicanorigin display greater disability prevalence across the entire age span (age 40 to 80),and this health disadvantage tends to widen significantly up to approximately age 65,after which it remains fairly stable. This pattern is in stark contrast to foreign-bornMexicans, whose disability rates are much below those of either American-born groupat younger ages. At older ages, the disability rates of foreign-born Mexicans convergeto the levels of those of Mexican origin born in the United States and, among foreign-born Mexican females, the levels even exceed those at some ages. Like the American-born of Mexican origin, foreign-born Mexicans display a more rapid increase indisability prevalence during working ages compared to US-born whites. However,while the gap between US-born of Mexican origin and whites is fairly stable at olderages, the rate rises faster for foreign-born Mexicans between ages 60 and 80, resultingin rate convergence.
3.3 Mexican-born vs. other foreign-born Hispanics
The next set of figures adds the estimated disability rates of foreign-born (non-Mexican) Hispanics. As shown in Figure 3a, the age-specific disability rates are quitesimilar for foreign-born Mexican females and other foreign-born Hispanic females, andthey cross over US-born non-Hispanic white females at about the same age range (53–56). Other foreign-born Hispanic females tend to have slightly higher disabilityprevalence until age 53. From 53 to 66, the rates are very similar for the twopopulations, and after that the disability rates are greater among foreign-born Mexicanfemales. For men, as shown in Figure 3b, the rates are similar during the working-agelife span. However, after age 63, disability rises faster among male immigrants fromMexico compared to other male Hispanic immigrants. In fact, while the disability rateof the male immigrants from Mexico crosses over the rate of US-born white males atages 62–65, the disability rate for other male Hispanic immigrants remains at or belowthat of whites.

Sheftel & Heiland: Is there a Hispanic immigrant health advantage that reverses from working to old age?
220 http://www.demographic-research.org
Figure 3: Disability ratesa) Mexican-born vs. US-born of Mexican origin females
b) Mexican-born vs. US-born of Mexican origin males
Source: ACS 2010–2014.
Demographic Research: Volume 39, Article 7
http://www.demographic-research.org 221
3.4 Mexican-born by age at migration
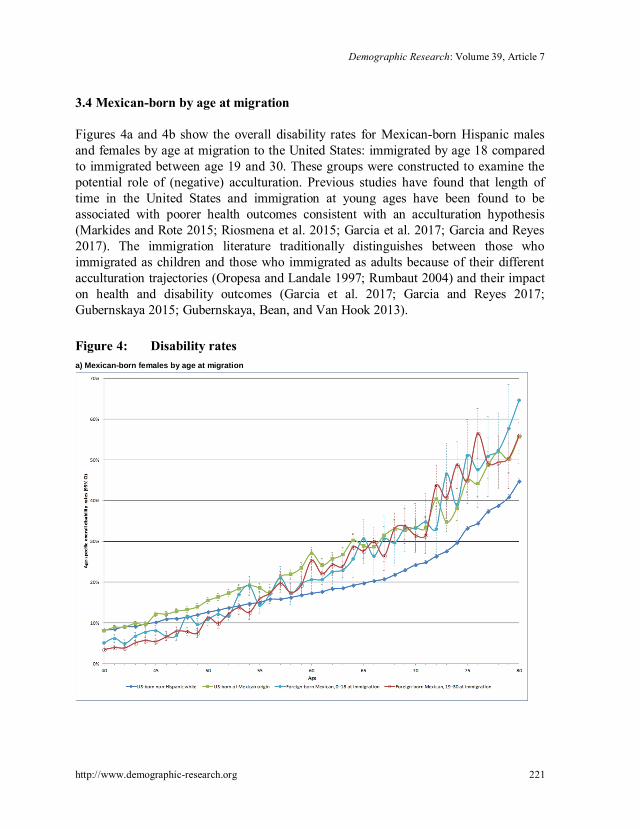
Figures 4a and 4b show the overall disability rates for Mexican-born Hispanic malesand females by age at migration to the United States: immigrated by age 18 comparedto immigrated between age 19 and 30. These groups were constructed to examine thepotential role of (negative) acculturation. Previous studies have found that length oftime in the United States and immigration at young ages have been found to beassociated with poorer health outcomes consistent with an acculturation hypothesis(Markides and Rote 2015; Riosmena et al. 2015; Garcia et al. 2017; Garcia and Reyes2017). The immigration literature traditionally distinguishes between those whoimmigrated as children and those who immigrated as adults because of their differentacculturation trajectories (Oropesa and Landale 1997; Rumbaut 2004) and their impacton health and disability outcomes (Garcia et al. 2017; Garcia and Reyes 2017;Gubernskaya 2015; Gubernskaya, Bean, and Van Hook 2013).
Figure 4: Disability ratesa) Mexican-born females by age at migration

Sheftel & Heiland: Is there a Hispanic immigrant health advantage that reverses from working to old age?
222 http://www.demographic-research.org
Figure 4: (Continued)b) Mexican-born males by age at migration
Source: ACS 2010–2014.
We see that the disability prevalence rates are fairly similar across the two age-at-migration groups. At ages 40 to 47, both female groups have lower rates of disabilitythan non-Hispanic white women and women of Mexican origin born in the UnitedStates. This health advantage is reversed after age 59. There is evidence that those whoimmigrated at older ages have (slightly) lower rates of disability at ages 40 to 45 thanthose who immigrated as children or youth. After age 45, however, rates tend to besimilar between the two immigrant groups. For men, disability rates tend to be similarfor both age-at-migration groups and lower compared to whites up to approximately age57. Past age 67, rates for both immigrant groups remain similar and tend to exceed therates of whites (but those differences are often not statistically significant).
Demographic Research: Volume 39, Article 7
http://www.demographic-research.org 223
3.5 Mexican-born by education level
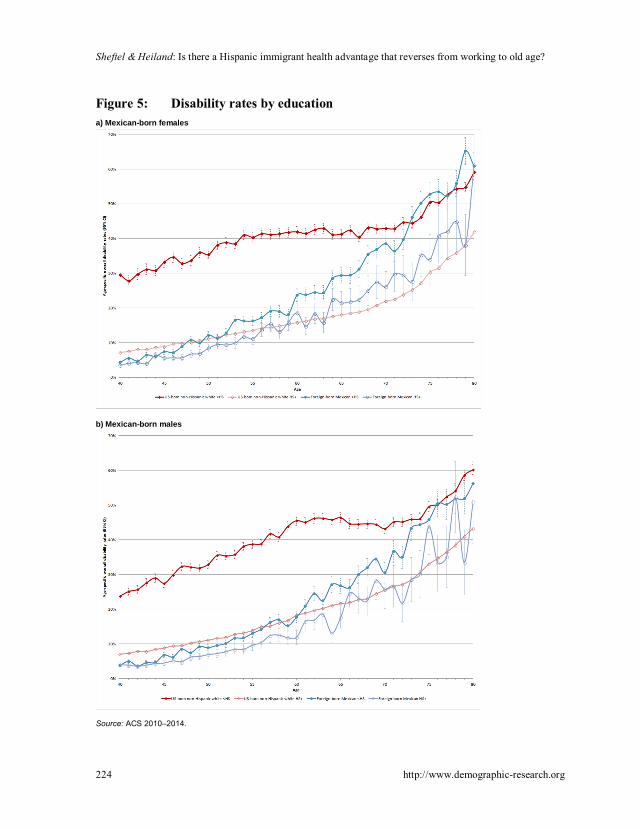
An alternative to the acculturation hypothesis is the idea that Hispanic immigrants aresubject to disproportionate exposure to occupational risk (Kochhar 2005; Toussaint-Comeau 2006; Dong and Platner 2004; Smith et al. 2005). Unfortunately, occupationdata is only available in the ACS for those individuals currently working and thereforenot for those who have retired from the work force. We use educational attainment as aproxy for occupational (risk) environment. Specifically, to evaluate the possibility thatthe over-representation of foreign-born Mexicans in high-risk occupations contributesto higher disability rates at older ages, we divide our subgroups of interest by educationlevel: those who have not completed a high school degree and those who graduatedhigh school or completed a GED or have a higher level of education. Not having a highschool degree tends to reduce the options in the labor market to more physicallydemanding occupations. If this is particularly true for foreign-born populations whoseoptions are more limited to begin with, we would expect to see a more pronouncedreversal pattern.
Figures 5a and 5b compare non-Hispanic whites to foreign-born Mexicans byeducation level (analysis by education level for additional groups available uponrequest). Figure 5a shows that foreign-born Mexican females without a high schooldegree have among the lowest disability rates at age 40, similar to their counterpartswith a high school degree or more. However, the former group crosses over non-Hispanic whites with high school degrees by age 48, whereas the latter group retains itsdisability advantage until 57. For males, as shown in Figure 5b, a similar pattern holds,although the crossover points occur at older ages: 55 for foreign-born Mexicans withouta high school degree and 66 for those with a high school degree or more.
Sheftel & Heiland: Is there a Hispanic immigrant health advantage that reverses from working to old age?
224 http://www.demographic-research.org
Figure 5: Disability rates by educationa) Mexican-born females
b) Mexican-born males
Source: ACS 2010–2014.
Demographic Research: Volume 39, Article 7
http://www.demographic-research.org 225
3.6 Specific disabilities
This section looks at the six components underlying the overall disability measure usedabove. Domain-specific analysis allows us to parse out the contribution of eachcomponent to the overall pattern and can help distinguish between differentmechanisms and explanations for crossovers. The six disability domains are (1)ambulatory (Figures 6a–b), (2) cognitive (Figures 7a–b), (3) independent living(Figures 8a–b), (4) self-care (Figures 9a–b), (5) vision (Figures 10a–b), and (6) hearing(Figures 11a–b).
Across domains, with the exception of hearing and vision disabilities, there arethree distinct features. First, the disability rates are greater for women than men.Second, foreign-born Mexicans consistently have the lowest rates at younger ages andthe highest at old age. Third, the crossover in prevalence rates between whites andforeign-born Mexicans occurs around age 60. These patterns are consistent with thefindings for overall disability prevalence shown above. There is some interestingvariation in crossover ages for the different measures that we will now discuss in turn.
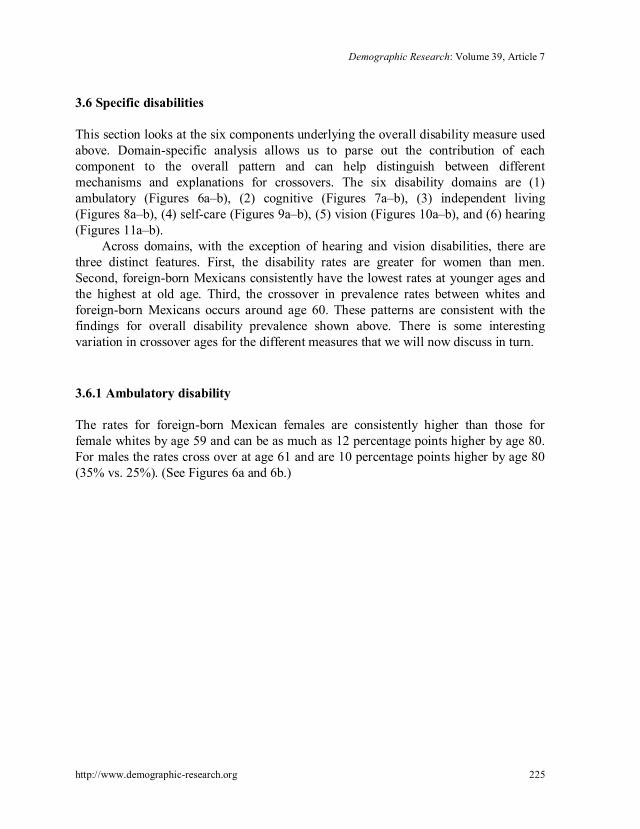
3.6.1 Ambulatory disability
The rates for foreign-born Mexican females are consistently higher than those forfemale whites by age 59 and can be as much as 12 percentage points higher by age 80.For males the rates cross over at age 61 and are 10 percentage points higher by age 80(35% vs. 25%). (See Figures 6a and 6b.)
Sheftel & Heiland: Is there a Hispanic immigrant health advantage that reverses from working to old age?
226 http://www.demographic-research.org
Figure 6: Ambulatory disability ratesa) Females
b) Males
Source: ACS 2010–2014.
Demographic Research: Volume 39, Article 7
http://www.demographic-research.org 227
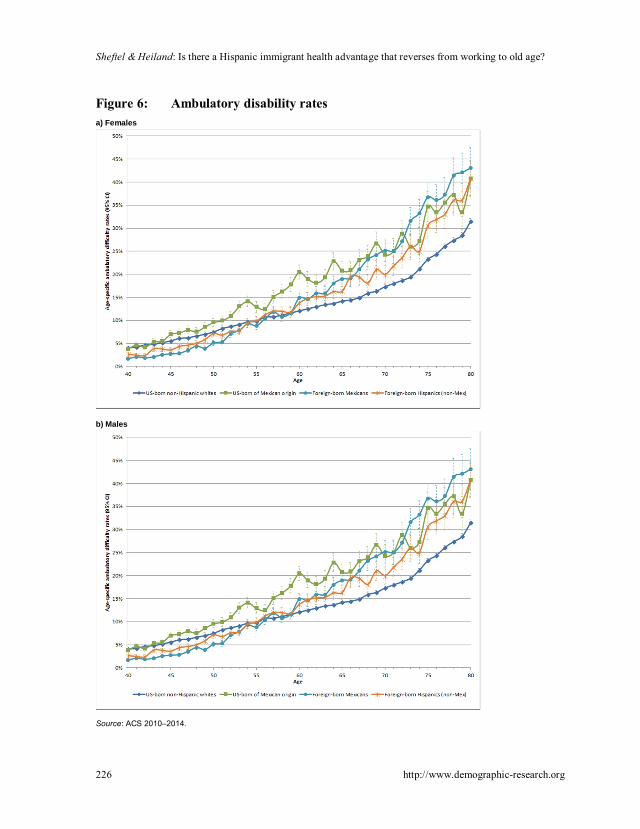
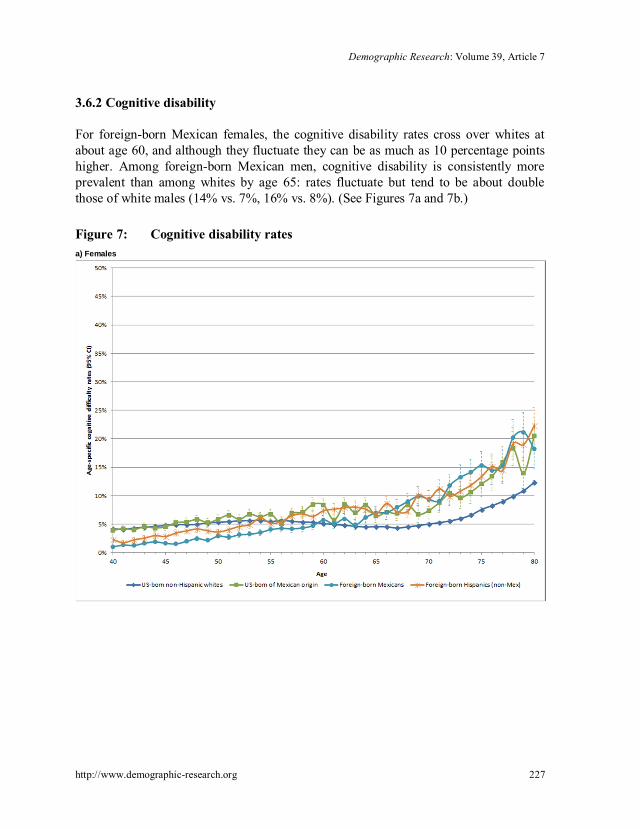
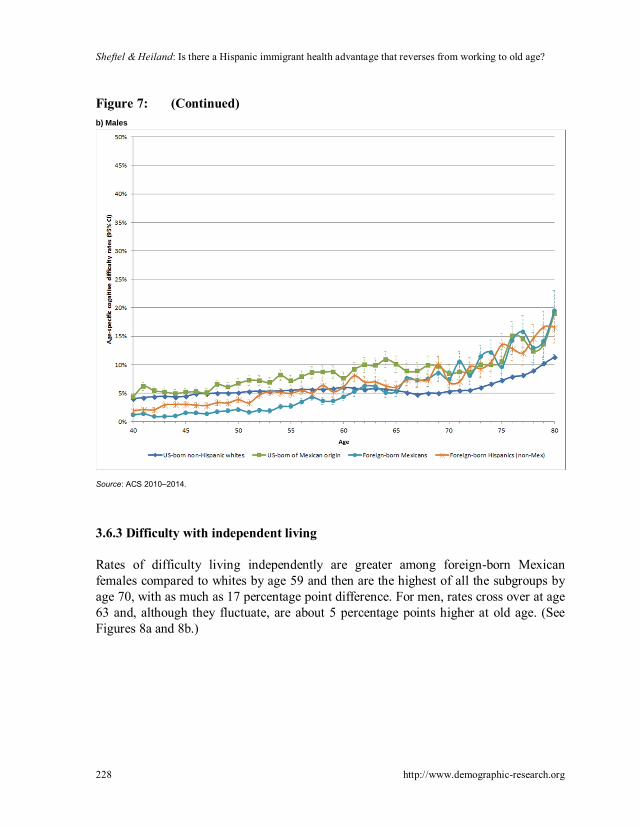
3.6.2 Cognitive disability
For foreign-born Mexican females, the cognitive disability rates cross over whites atabout age 60, and although they fluctuate they can be as much as 10 percentage pointshigher. Among foreign-born Mexican men, cognitive disability is consistently moreprevalent than among whites by age 65: rates fluctuate but tend to be about doublethose of white males (14% vs. 7%, 16% vs. 8%). (See Figures 7a and 7b.)
Figure 7: Cognitive disability ratesa) Females
Sheftel & Heiland: Is there a Hispanic immigrant health advantage that reverses from working to old age?
228 http://www.demographic-research.org
Figure 7: (Continued)b) Males
Source: ACS 2010–2014.
3.6.3 Difficulty with independent living
Rates of difficulty living independently are greater among foreign-born Mexicanfemales compared to whites by age 59 and then are the highest of all the subgroups byage 70, with as much as 17 percentage point difference. For men, rates cross over at age63 and, although they fluctuate, are about 5 percentage points higher at old age. (SeeFigures 8a and 8b.)

Demographic Research: Volume 39, Article 7
http://www.demographic-research.org 229
Figure 8: Independent living difficulty ratesa) Females
b) Males
Source: ACS 2010–2014.
Sheftel & Heiland: Is there a Hispanic immigrant health advantage that reverses from working to old age?
230 http://www.demographic-research.org
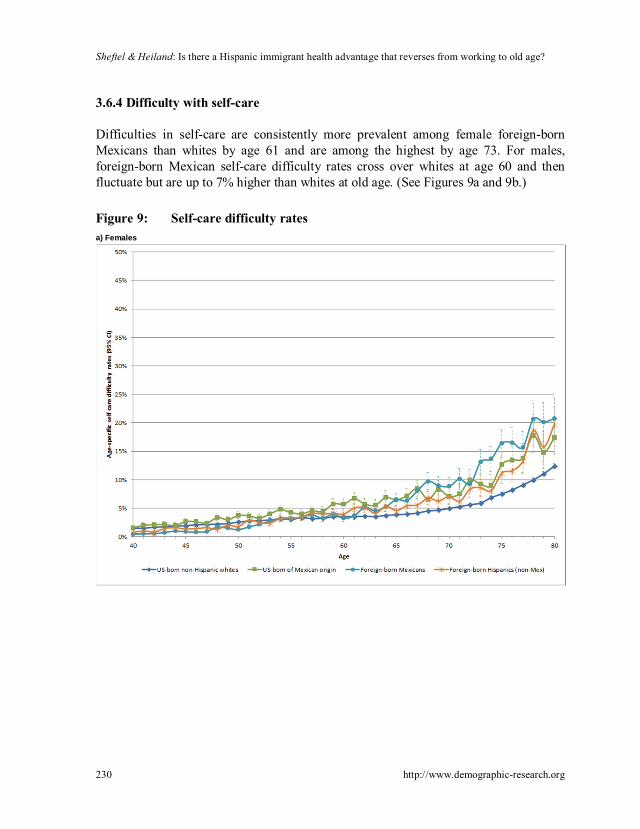
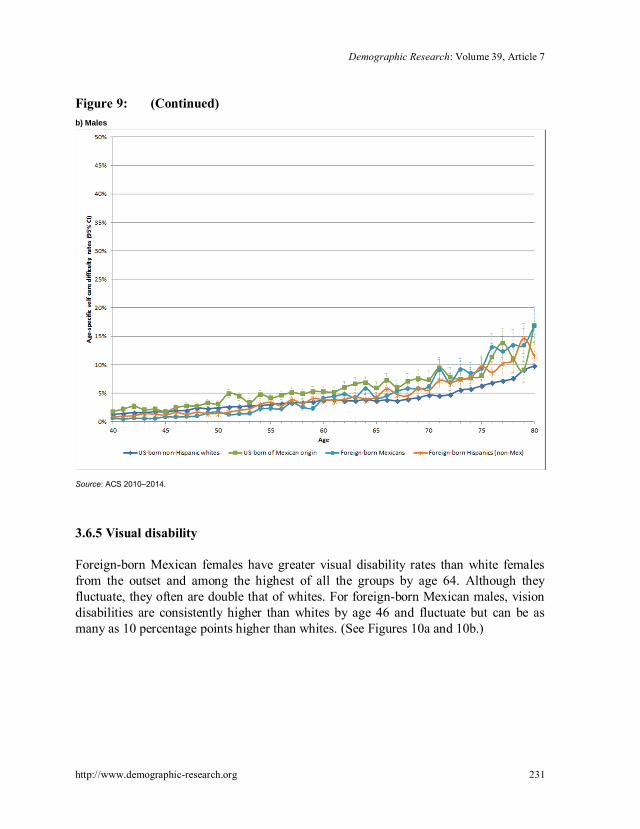
3.6.4 Difficulty with self-care
Difficulties in self-care are consistently more prevalent among female foreign-bornMexicans than whites by age 61 and are among the highest by age 73. For males,foreign-born Mexican self-care difficulty rates cross over whites at age 60 and thenfluctuate but are up to 7% higher than whites at old age. (See Figures 9a and 9b.)
Figure 9: Self-care difficulty ratesa) Females
Demographic Research: Volume 39, Article 7
http://www.demographic-research.org 231
Figure 9: (Continued)b) Males
Source: ACS 2010–2014.
3.6.5 Visual disability
Foreign-born Mexican females have greater visual disability rates than white femalesfrom the outset and among the highest of all the groups by age 64. Although theyfluctuate, they often are double that of whites. For foreign-born Mexican males, visiondisabilities are consistently higher than whites by age 46 and fluctuate but can be asmany as 10 percentage points higher than whites. (See Figures 10a and 10b.)

Sheftel & Heiland: Is there a Hispanic immigrant health advantage that reverses from working to old age?
232 http://www.demographic-research.org
Figure 10: Visual disability ratesa) Females
b) Males
Source: ACS 2010–2014.
Demographic Research: Volume 39, Article 7
http://www.demographic-research.org 233
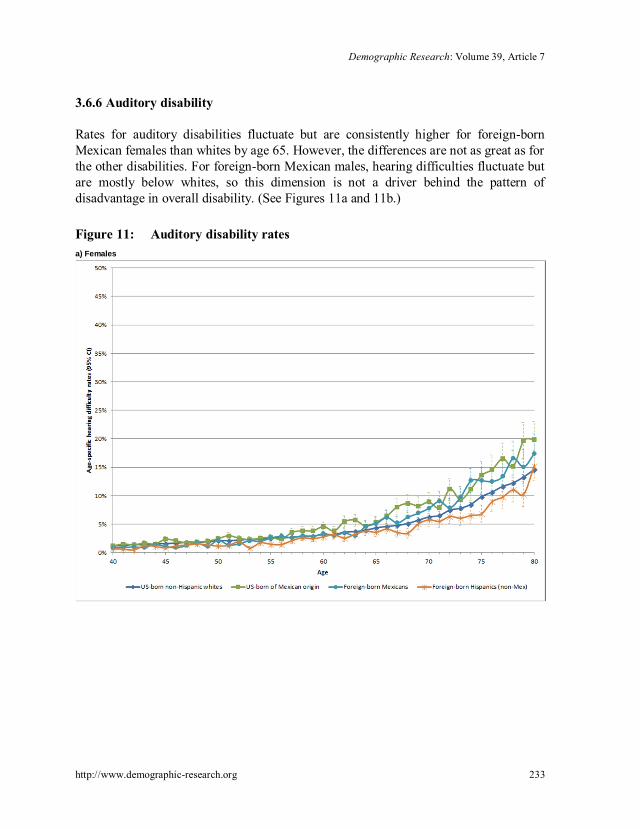
3.6.6 Auditory disability
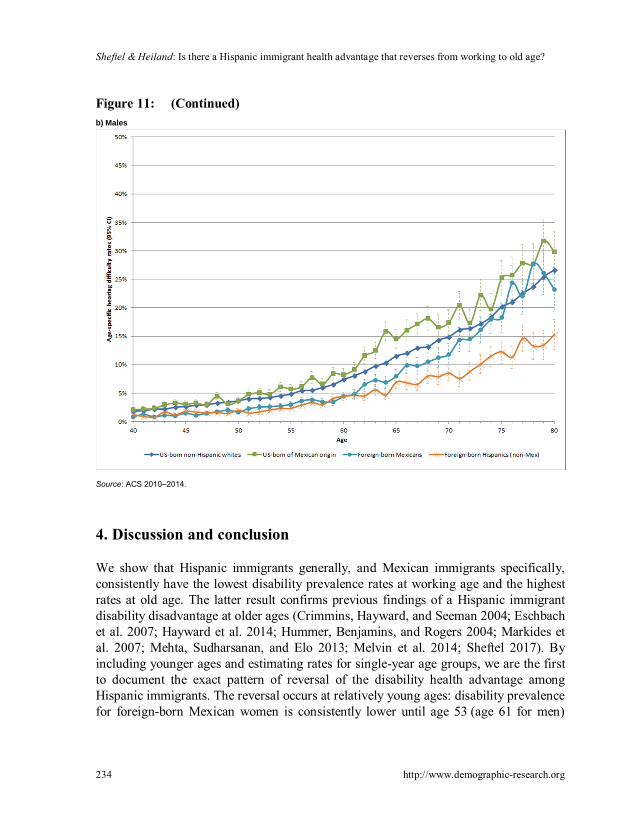
Rates for auditory disabilities fluctuate but are consistently higher for foreign-bornMexican females than whites by age 65. However, the differences are not as great as forthe other disabilities. For foreign-born Mexican males, hearing difficulties fluctuate butare mostly below whites, so this dimension is not a driver behind the pattern ofdisadvantage in overall disability. (See Figures 11a and 11b.)
Figure 11: Auditory disability ratesa) Females
Sheftel & Heiland: Is there a Hispanic immigrant health advantage that reverses from working to old age?
234 http://www.demographic-research.org
Figure 11: (Continued)b) Males
Source: ACS 2010–2014.
4. Discussion and conclusion
We show that Hispanic immigrants generally, and Mexican immigrants specifically,consistently have the lowest disability prevalence rates at working age and the highestrates at old age. The latter result confirms previous findings of a Hispanic immigrantdisability disadvantage at older ages (Crimmins, Hayward, and Seeman 2004; Eschbachet al. 2007; Hayward et al. 2014; Hummer, Benjamins, and Rogers 2004; Markides etal. 2007; Mehta, Sudharsanan, and Elo 2013; Melvin et al. 2014; Sheftel 2017). Byincluding younger ages and estimating rates for single-year age groups, we are the firstto document the exact pattern of reversal of the disability health advantage amongHispanic immigrants. The reversal occurs at relatively young ages: disability prevalencefor foreign-born Mexican women is consistently lower until age 53 (age 61 for men)

Demographic Research: Volume 39, Article 7
http://www.demographic-research.org 235
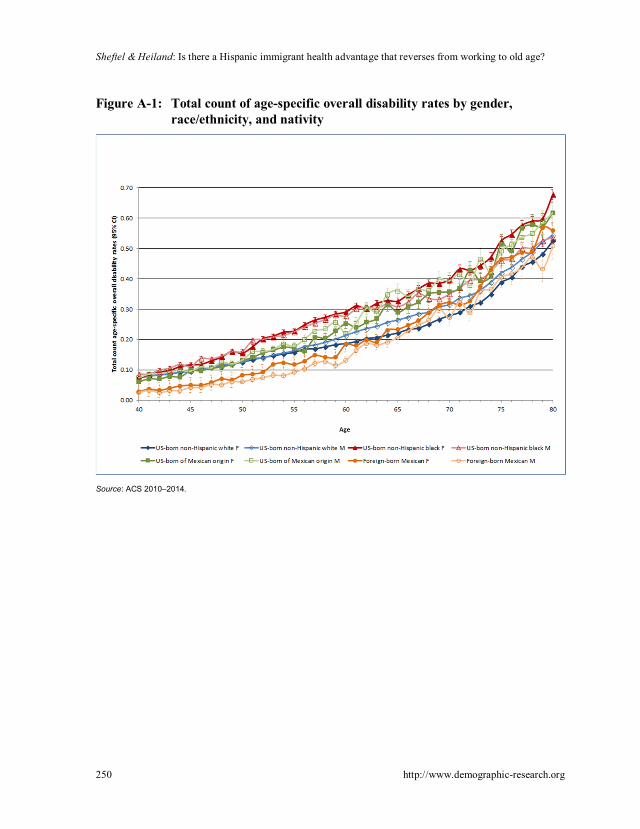
and significantly greater after age 59 (66). Within these ages, disability rates forforeign-born Mexicans cross over those for non-Hispanic whites (of their respectivegender). These “disability crossover” patterns are confirmed by additional analyses ofspecific disability domains and total number of disabilities (see Appendix Figure A-1).
The gender-stratified results reported here are consistent with the broader researchon aging of the general population, which generally finds worse health outcomes forfemales as compared to males (e.g., Arber and Cooper 1999; Warner and Brown 2011).We document greater rates of disability prevalence among older foreign-born Mexicanfemales, in aggregate as well as for specific disability domains, as compared to olderforeign-born Mexican males. Coupled with findings of lower mortality rates and longerlife expectancies, this points to an especially protracted period of disability for femaleMexican immigrants and potentially a doubly disadvantaged population.
Potential explanations for this reversal in old age are ongoing and fall into threecategories. First are those explanations that attribute the findings to the specificcomposition of immigrant populations. Specifically, there may be bias from nonrandomselection at work here. Young Mexicans with disabilities may not migrate in the firstplace for fear that disability may reduce employment opportunities and, for the samereason, those who become disabled at young ages after migrating may be more likely toreturn to their country of origin – processes that reduce the share of disabled migrants atyoung ages. This “healthy migrant hypothesis” or “salmon bias” in the Hispanic healthparadox literature has been found to partially explain the lower mortality rates ofimmigrant populations. The fact that this analysis is based on cross-sectional datafurther implicates compositional differences driven by cohort variation over time. Tosubstantiate this explanation, for Mexican immigrants born before 1960, educationalattainment in Mexico was substantially lower and work conditions in the United Stateswere harsher (Massey, Durand, and Malone 2002), both factors pointing to higher riskof disability. Given use of cross-sectional data, we cannot rule out these cohort-specifictrends. Future research using longitudinal data is needed to investigate individual age–health trajectories and test specific explanations regarding immigrant disability.
The second realm of explanations implicates health outcomes among the Mexicanimmigrant population. High rates of diabetes, obesity, and sedentary life styles foundamong this population, while not coinciding with higher mortality rates, may accountfor higher disability rates (Markides et al. 2007). Further, the “health behavior andacculturation explanation” from the Hispanic health paradox literature (Abraido-Lanza,Chao, and Florez 2005; Akresh 2007; Antecol and Bedard 2006; Cho et al. 2004;Fenelon 2013; Finch et al. 2009; Jasso et al. 2000; Kimbro 2009; Riosmena, Wong, andPalloni 2013) could be at work here. It posits that higher acculturation (measured bynativity and time in the United States) is associated with increased unhealthy behavior(drinking alcohol, smoking, diet) and worse health status (BMI) among Hispanics in the
Sheftel & Heiland: Is there a Hispanic immigrant health advantage that reverses from working to old age?
236 http://www.demographic-research.org
United States. Healthier behavior among Hispanic immigrants and acculturation isconsistent with a health advantage in disability at younger ages that subsequentlynarrows (to the extent that age proxies for time in the United States). However, ouranalysis by age at migration (see Figures 4a and 4b) finds similar disability ratesbetween the two groups, contrary to what one would expect in the presence ofimportant acculturation effects.
Finally, behavioral and environmental exposure factors make up the third categoryof explanations. Hayward et al. (2014) suggest that the apparent contradiction betweenlow mortality rates but high disability rates among the (older) Hispanic immigrantpopulation points to a decoupling of the typical connection between chronic disease anddisability. Verbrugge and Jette’s (1994) sociomedical model of the disablement process,which describes the pathway from pathology to disability, highlights personal andenvironmental factors that may exacerbate the disablement process. The concentrationof Mexicans in physically arduous and high-risk occupations (Kochhar 2005;Toussaint-Comeau 2006) with high rates of workplace injury (Dong and Platner 2004;Smith et al. 2005) is one such risk factor, and heightened disability rates among foreign-born Hispanics at older ages (Hayward et al. 2014; Melvin et al. 2014) may also reflecta cumulative effect of this risk factor.
We find evidence consistent with this third hypothesis in our analysis. Ambulatorydisability, self-care difficulty, and independent living difficulty are among the specificdrivers of the higher overall disability prevalence of Mexican immigrants at older ages.These instruments mirror the familiar ADL and IADL measures (Brault 2009) that areknown to be elevated among agricultural and construction workers. Consistent with ourage-specific patterns, Weigel, Armijos, and Beltran (2014) find elevated functionaldisability rates, specifically among middle-aged and older-aged Mexican immigrantfarmworkers as a result of workplace injury. Construction workers, anotheroccupational sector with a high concentration of Mexicans, also have elevated incidenceof disability due to occupational injury (Schwatka, Butler, and Rosecrance 2012). AsHummer and Hayward (2015) note, employment in these occupations may mean more“wear and tear” (p. 23) over the years, with a high risk of disablement but notnecessarily mortality. Our analysis of foreign-born Mexicans by educational attainment,while not directly testing exposure to occupational risk, does suggest that those foreign-born Mexicans with lower levels of education who are more likely to be employed inrisky occupations like construction cross over US-born non-Hispanic whites with highschool degrees at younger ages than their counterparts with high school degrees.However, this analysis also indicates that occupational risk, and more generallysocioeconomic status, is not the only factor contributing to the crossover pattern, sinceforeign-born Mexicans with high school degrees or more also end up with a disabilitydisadvantage later in life.

Demographic Research: Volume 39, Article 7
http://www.demographic-research.org 237
Socioeconomic and residential disadvantage, and disparities in access to healthcare and health insurance (Derose, Escarce, and Lurie 2007) are additionalenvironmental risk factors leading to a cumulative health disadvantage for lowsocioeconomic status immigrants like Mexicans (Warner and Brown 2011). Low levelsof health insurance coverage, especially among the large undocumented Mexicanpopulation, are associated with lower rates of health care utilization (Ortega et al.2007), which may exacerbate the disablement process over time. While these causalmechanisms remain in the realm of hypothesis here, they point to important directionsfor future research that would use longitudinal data to address change over time.
Taken as a whole, these potential explanatory mechanisms point to processes thatheighten the risk for disability among the Mexican immigrant population but do notnecessarily contribute to mortality. Thus, our findings are consistent with previousresearch concluding that low mortality rates together with high disability rates meanthat Mexican immigrants are living a protracted period with disability at older ages(Markides et al. 2007). Further research modeling these processes is necessary beyondthese largely descriptive findings.
The evidence presented here of a reversal in the Hispanic immigrant healthadvantage based on disability is subject to several caveats. Mortality differentialsbetween the US-born and foreign-born populations may affect our results. If mortalityis lower among older foreign-born Hispanics than natives, the most severely disabledUS-born non-Hispanic whites may die earlier, leaving a positively selected (i.e., lowerdisability) comparison group. We cannot rule out that mortality selection is acontributing factor but note that disability rates cross at relatively young ages whenmortality rates are relatively low and are similar between the two populations. Further,there is evidence that Hispanics are more health pessimistic than other demographics(Angel and Guarnaccia 1989; Bzostek, Goldman, and Pebley 2007; Hummer,Benjamins, Rogers 2004; Markides et al. 2007; Shetterly et al. 1996; Viruell-Fuentes etal. 2011). There may also be differences in self-reports based on language (Spanish vs.English) of the interview (Tirodkar et al. 2008). We note that our group comparisonswithin the Hispanic population would presumably remain valid, even in the presence ofthese types of measurement error (Chandola and Jenkinson 2000).
Despite these limitations, this research is an important step toward a morecomplete understanding of the health of immigrants. Our finding that a crossover indisability rates occurs at or even before traditional retirement ages highlights theimportance of adopting a life course perspective of the disablement process (Dannefer2003; Verbrugge and Jette 1994). Hummer and Hayward (2015) note that the Hispanicpopulation over age 65 is expected to quintuple between 2012 and 2050. Especiallycoupled with their disadvantaged socioeconomic position, disability trends are alarmingfor this rapidly growing population. Our findings suggest that Hispanic immigrants face
Sheftel & Heiland: Is there a Hispanic immigrant health advantage that reverses from working to old age?
238 http://www.demographic-research.org
comparatively larger disablement risks during their working years, even among themore highly educated sector of the population. For policy makers and service providers,this implies that measures to reduce health disparities should be focused at evenyounger ages.
5. Acknowledgements
The authors thank Neil Bennett, Marc A. Garcia, Robert Hummer, Sanders Korenman,Kyriakos Markides, Holly Reed, Lois Verbrugge, conference participants in sessions atPAA 2017 and 2018, and two anonymous referees for helpful comments andsuggestions.

Demographic Research: Volume 39, Article 7
http://www.demographic-research.org 239
References
Abraido-Lanza, A.F., Chao, M.T., and Florez, K.R. (2005). Do healthy behaviorsdecline with greater acculturation? Implications for the Latino mortality paradox.Social Science and Medicine 61(6): 1243–1255. doi:10.1016/j.socscimed.2005.01.016.
Abraido-Lanza, A.F., Dohrenwend, B.P., Ng-Mak, D.S., and Turner, J.B. (1999). TheLatino mortality paradox: A test of the ‘salmon bias’ and healthy migranthypotheses. American Journal of Public Health 89(10): 1543–1548.doi:10.2105/AJPH.89.10.1543.
Akresh, I.R. (2007). Dietary assimilation and health among Hispanic immigrants to theUnited States. Journal of Health and Social Behavior 48(4): 404–417.doi:10.1177/002214650704800405.
Akresh, I.R. and Frank, R. (2008). Health selection among new immigrants. AmericanJournal of Public Health 98(11): 2058–2064. doi:10.2105/AJPH.2006.100974.
Alba, R. and Foner, N. (2015). Strangers no more: Immigration and the challenges ofintegration in North America and Western Europe. Princeton: PrincetonUniversity Press. doi:10.1515/9781400865901.
Angel, R.J. and Guarnaccia, P.J. (1989). Mind, body, and culture: Somatization amongHispanics. Social Science and Medicine 28(12): 1229–1238. doi:10.1016/0277-9536(89)90341-9.
Angel, R.J., Angel, J.L., and Hill, T.D. (2014). Longer lives, sicker lives? Increasedlongevity and extended disability among Mexican-origin elders. Journals ofGerontology Series B: Psychological Sciences and Social Sciences 70(4): 639–649. doi:10.1093/geronb/gbu158.
Angel, R.J., Angel, J.L., Venegas, C.D., and Bonazzo, C. (2010). Shorter stay, longerlife: Age-at-migration and mortality among the older Mexican-origin population.Journal of Aging and Health 20(5): 1–18. doi:10.1177/0898264310376540.
Antecol, H. and Bedard, K. (2006). Unhealthy assimilation: Why do immigrantsconverge to American health status levels? Demography 43(2): 337–360.doi:10.1353/dem.2006.0011.
Arber, S. and Cooper, H. (1999). Gender differences in health in later life: The newparadox? Social Science and Medicine 48(1): 61–76. doi:10.1016/S0277-9536(98)00289-5.
Sheftel & Heiland: Is there a Hispanic immigrant health advantage that reverses from working to old age?
240 http://www.demographic-research.org
Arias, E. (2010). United States life tables by Hispanic origin. Washington, D.C.:National Center for Health Statistics, Vital and Health Statistics.
Brault, M.W. (2009). Review of changes to the measurement of disability in the 2008American Community Survey. Washington, D.C.: US Bureau of the Census.
Bzostek, S., Goldman, N., and Pebley, A. (2007). Why do Hispanics in the USA reportpoor health? Social Science and Medicine 65(5): 990–1003. doi:10.1016/j.socscimed.2007.04.028.
Chandola, T. and Jenkinson, C. (2000). Validating self-rated health in different ethnicgroups. Ethnicity and Health 5(2): 151–159. doi:10.1080/713667451.
Cho, Y., Frisbie, W.P., Hummer, R.A., and Rogers, R.G. (2004). Nativity, duration ofresidence, and the health of Hispanic adults in the United States. InternationalMigration Review 38(1): 184–211. doi:10.1111/j.1747-7379.2004.tb00193.x.
Crimmins, E.M., Hayward, M.D. and Seeman, T.E. (2004). Race/ethnicity,socioeconomic status, and health. In: Anderson, N.B., Bulatao, R.A., and Cohen,B. (eds.). Critical perspectives on racial and ethnic differences in health in latelife. Washington, D.C.: National Academies Press: 310–352.
Crimmins, E.M., Soldo, B.J., Kim, J.K., and Alley, D.E. (2005). Using anthropometricindicators for Mexicans in the United States and Mexico to understand theselection of migrants and the ‘Hispanic paradox.’ Social Biology 52(3–4): 164–177. doi:10.1080/19485565.2005.9989107.
Dannefer, D. (2003). Cumulative advantage/disadvantage and the life course: Cross-fertilizing age and social science theory. The Journals of Gerontology Series B:Psychological Sciences and Social Sciences 58(6): S327–S337. doi:10.1093/geronb/58.6.S327.
Derose, K.P., Escarce, J.J., and Lurie, N. (2007). Immigrants and health care: Sourcesof vulnerability. Health Affairs 26(5): 1258–1268. doi:10.1377/hlthaff.26.5.1258.
Dong, X. and Platner, J.W. (2004). Occupational fatalities of Hispanic constructionworkers from 1992 to 2000. American Journal of Industrial Medicine 45(1): 45–54. doi:10.1002/ajim.10322.
Elo, I.T., Mehta, N.K., and Huang, C. (2011). Disability among native-born andforeign-born blacks in the United States. Demography 48(1): 241–265.doi:10.1007/s13524-010-0008-x.
Demographic Research: Volume 39, Article 7
http://www.demographic-research.org 241
Elo, I.T., Turra, C.M., Kestenbaum, B., and Ferguson, B.R. (2004). Mortality amongelderly Hispanics in the United States: Past evidence and new results.Demography 41(1): 109–128. doi:10.1353/dem.2004.0001.
Erikson, W. (2012). A guide to disability statistics from the American CommunitySurvey (2008 forward). Ithaca: Cornell University Employment and DisabilityInstitute.
Eschbach, K., Al-Snih, S., Markides, K.S., and Goodwin, J.S. (2007). Disability andactive life expectancy of older US- and foreign-born Mexican Americans. In:Angel, J.L. and Whitfield, K.E. (eds.). The health of aging Hispanics. NewYork: Springer: 40–49. doi:10.1007/978-0-387-47208-9_4.
Eschbach, K., Kuo, Y., and Goodwin, J.S. (2006). Ascertainment of Hispanic ethnicityon California death certificates: Implications for the explanation of the Hispanicmortality advantage. American Journal of Public Health 96(12): 2209–2215.doi:10.2105/AJPH.2005.080721.
Fenelon, A. (2013). Revisiting the Hispanic mortality advantage in the United States:The role of smoking. Social Science and Medicine 82: 1–9. doi:10.1016/j.socscimed.2012.12.028.
Finch, B.K., Do, D.P., Frank, R., and Seeman, T. (2009). Could ‘acculturation’ effectsbe explained by latent health disadvantages among Mexican immigrants?International Migration Review 43(3): 471–495. doi:10.1111/j.1747-7379.2009.00774.x.
Franzini, L., Ribble, J.C., and Keddie, A.M. (2001). Understanding the Hispanicparadox. Ethnicity and Disease 11(3): 496–518.
Garcia, M.A., Saenz, J.L., Downer, B., Chiu, C., Rote, S., and Wong, R. (2017). Age ofmigration differentials in life expectancy with cognitive impairment: 20-yearfindings from the Hispanic-EPESE. The Gerontologist: gnx062. doi:10.1093/geront/gnx062.
Garcia, M.A., Angel, J.L., Angel, R.J., Chiu, C., and Melvin, J. (2015). Acculturation,gender, and active life expectancy in the Mexican-origin population. Journal ofAging and Health 27(7): 1247–1265. doi:10.1177/0898264315577880.
Garcia, M.A. and Reyes, A.M. (2017). Physical functioning and disability trajectoriesby age of migration among Mexican elders in the United States. The Journals ofGerontology: Series B: gbw167.
Sheftel & Heiland: Is there a Hispanic immigrant health advantage that reverses from working to old age?
242 http://www.demographic-research.org
Gubernskaya, Z. (2015). Age-at-migration and self-rated health trajectories after age50: Understanding the older immigrant health paradox. The Journals ofGerontology: Series B 70(2): 279–290.
Gubernskaya, Z., Bean, F.D., and Van Hook, J. (2013). (Un)healthy immigrant citizensnaturalization and activity limitations in older age. Journal of Health and SocialBehavior 54(4): 427–443. doi:10.1177/0022146513504760.
Hayward, M.D. and Gorman, B.K. (2004). The long arm of childhood: The influence ofearly-life social conditions on men’s mortality. Demography 41(1): 87–107.doi:10.1353/dem.2004.0005.
Hayward, M.D., Hummer, R.A., Chiu, C., González-González, C., and Wong, R.(2014). Does the Hispanic paradox in US adult mortality extend to disability?Population Research and Policy Review 33(1): 81–96. doi:10.1007/s11113-013-9312-7.
Hummer, R.A., Benjamins, M.R., and Rogers, R.G. (2004). Racial and ethnicdisparities in health and mortality among the US elderly population. In: NationalResearch Council Panel on Race, Ethnicity and Health in Later Life (ed.).Critical perspectives on racial and ethnic differences in late life. Washington,D.C.: National Academy Press: 53–94.
Hummer, R.A. and Hayward, M.D. (2015). Hispanic older adult health and longevity inthe United States: Current patterns and concerns for the future. Daedalus 144(2):20–30. doi:10.1162/DAED_a_00327.
Hummer, R.A., Rogers, R.G., Amir, S.H., Forbes, D., and Frisbie, W.P. (2000). Adultmortality differentials among Hispanic subgroups and non-Hispanic whites.Social Science Quarterly 81(1): 459–476.
Jasso, G., Massey, D.S., Rosenzweig, M.R., and Smith, J.P. (2000). The NewImmigrant Survey Pilot (NIS-P): Overview and new findings about US legalimmigrants at admission. Demography 37(1): 127–138. doi:10.2307/2648101.
Judson, D.H. and Swanson, D.A. (2011). Estimating characteristics of the foreign bornby legal status: An evaluation of data and methods. New York: Springer.
Kimbro, R.T. (2009). Acculturation in context: Gender, age-at-migration, neighborhoodethnicity, and health behaviors. Social Science Quarterly 90(5): 1145–1166.doi:10.1111/j.1540-6237.2009.00651.x.
Kochhar, R. (2005). The occupational status and mobility of Hispanics. Washington,D.C.: Pew Hispanic Center.

Demographic Research: Volume 39, Article 7
http://www.demographic-research.org 243
Landale, N.S., Oropesa, R.S., and Gorman, B.K. (2000). Migration and infant death:Assimilation or selective migration among Puerto Ricans? AmericanSociological Review 65(6): 888–909. doi:10.2307/2657518.
Lariscy, J.T. (2011). Differential record linkage by Hispanic ethnicity and age in linkedmortality studies: Implications for the epidemiologic paradox. Journal of Agingand Health 23(8): 1263–1284. doi:10.1177/0898264311421369.
Lariscy, J.T. (2017). Black–white disparities in adult mortality: Implications ofdifferential record linkage for understanding the mortality crossover. PopulationResearch and Policy Review 36(1): 137–156. doi:10.1007/s11113-016-9415-z.
Lariscy, J.T., Hummer, R.A., and Hayward, M.D. (2015). Hispanic older adultmortality in the United States: New estimates and an assessment of factorsshaping the Hispanic paradox. Demography 52(1): 1–14. doi:10.1007/s13524-014-0357-y.
Lowenthal, T.A. (2006). American Community Survey: Evaluating accuracy.Washington, D.C.: Population Reference Bureau.
Markides, K.S. and Coreil, J. (1986). The health of southwestern Hispanics: Anepidemiologic paradox. Public Health Reports 101(3): 253–265.
Markides, K.S. and Eschbach, K. (2005). Aging, migration, and mortality: Currentstatus of research on the Hispanic paradox. Journals of Gerontology:Psychological and Social Sciences 60(S2): 68–72. doi:10.1093/geronb/60.Special_Issue_2.S68.
Markides, K.S. and Eschbach, K. (2011). Hispanic paradox in adult mortality in theUnited States. In: Rogers, R.G. and Crimmins, E.M. (eds.). Internationalhandbook of adult mortality. New York: Springer: 227–240. doi:10.1007/978-90-481-9996-9_11.
Markides, K.S., Eschbach, K., Ray, L.A., and Peek, M.K. (2007). Census disabilityrates among older people by race/ethnicity and type of Hispanic origin. In:Whitfield, K.E. and Angel, J.L. (eds.). The health of aging Hispanics. NewYork: Springer: 26–39. doi:10.1007/978-0-387-47208-9_3.
Markides, K.S. and Rote, S. (2015). Immigrant health paradox. In: Scott, R. andKosslyn, S. (eds.). Emerging trends in the social and behavioral sciences. NewYork: Wiley. doi:10.1002/9781118900772.etrds0174.
Sheftel & Heiland: Is there a Hispanic immigrant health advantage that reverses from working to old age?
244 http://www.demographic-research.org
Massey, D.S., Durand, J., and Malone, N.J. (2002). Beyond smoke and mirrors:Mexican immigration in an era of economic integration. New York: RussellSage Foundation.
Masters, R.K., Hummer, R.A., and Powers, D.A. (2012). Educational differences in USadult mortality: A cohort perspective. American Sociological Review 77(4):548–572. doi:10.1177/0003122412451019.
Mehta, N.K., Sudharsanan, N., and Elo, I.T. (2013). Race/ethnicity and disabilityamong older Americans. In: Whitfield, K.E. and Baker, T. (eds.). Handbook ofminority aging. New York: Springer: 111–129. doi:10.1891/9780826109644.0008.
Melvin, J., Hummer, R.A., Elo, I.T., and Mehta, N. (2014). Age patterns ofracial/ethnic/nativity differences in disability and physical functioning in theUnited States. Demographic Research 31(17): 497–510. doi:10.4054/DemRes.2014.31.17.
Munnell, A.H. (2015). The average retirement age: An update. Center for RetirementResearch at Boston College: Issue in Brief 15(4): 1–6.
Nam, S., Al-Snih, S., and Markides, K.S. (2015). Sex, nativity, and disability in olderMexican Americans. Journal of the American Geriatrics Society 63(12): 2596–2600. doi:10.1111/jgs.13827.
Oropesa, R.S. and Landale, N.S. (1997). In search of the new second generation:Alternative strategies for identifying second generation children andunderstanding their acquisition of English. Sociological Perspectives 40(3):429–455. doi:10.2307/1389451.
Ortega, A.N., Fang, H., Perez, V.H., Rizzo, J.A., Carter-Pokras, O., Wallace, S.P., andGelberg, L. (2007). Health care access, use of services, and experiences amongundocumented Mexicans and other Latinos. Archives of Internal Medicine167(21): 2354–2360. doi:10.1001/archinte.167.21.2354.
Palloni, A. and Arias, E. (2004). Paradox lost: Explaining the Hispanic adult mortalityadvantage. Demography 41(3): 385–415. doi:10.1353/dem.2004.0024.
Passel, J.S. and Cohn, D. (2016). Overall number of US unauthorized immigrants holdssteady since 2009 [electronic resource]. Washinton, D.C.: Pew Research Center.http://www.pewhispanic.org/2016/09/20/overall-number-of-u-s-unauthorized-immigrants-holds-steady-since-2009/.
Demographic Research: Volume 39, Article 7
http://www.demographic-research.org 245
Riosmena, F., Everett, B.G., Rogers, R.G., and Dennis, J.A. (2015). Negativeacculturation and nothing more? Cumulative disadvantage and mortality duringthe immigrant adaptation process among Latinos in the United States.International Migration Review 49(2): 443–478. doi:10.1111/imre.12102.
Riosmena, F., Wong, R., and Palloni, A. (2013). Migration selection, protection, andacculturation in health: A binational perspective on older adults. Demography50(3): 1039–1064. doi:10.1007/s13524-012-0178-9.
Ruggles, S., Genadek, K., Goeken, R., Grover, J., and Sobek, M. (2015). Integratedpublic use microdata series: Version 6.0 [machine-readable database].Minneapolis: University of Minnesota.
Rumbaut, R.G. (2004). Ages, life stages, and generational cohorts: Decomposing theimmigrant first and second generations in the United States. InternationalMigration Review 38(3): 1160–1205. doi:10.1111/j.1747-7379.2004.tb00232.x.
Schwatka, N.V., Butler, L.M., and Rosecrance, J.R. (2012). An aging workforce andinjury in the construction industry. Epidemiologic Reviews 34(1): 156–167.doi:10.1093/epirev/mxr020.
Sheftel, M.G. (2017). Prevalence of disability among Hispanic immigrant populations:New evidence from the American Community Survey. Population Review 56(1).doi:10.1353/prv.2017.0000.
Shetterly, S.M., Baxter, J., Mason L.D., and Hamman, R.F. (1996). Self-rated healthamong Hispanic vs non-Hispanic white adults: The San Luis Valley Health andAging Study. American Journal of Public Health 86(12): 1798–1801.doi:10.2105/AJPH.86.12.1798.
Shor, E., Roelfs, D., and Vang, Z.M. (2017). The ‘Hispanic mortality paradox’revisited: Meta-analysis and meta-regression of life-course differentials in LatinAmerican and Caribbean immigrants’ mortality. Social Science and Medicine186: 20–33. doi:10.1016/j.socscimed.2017.05.049.
Singh, G.K. and Siahpush, M. (2002). Ethnic-immigrant differentials in healthbehaviors, morbidity, and cause-specific mortality in the United States: Ananalysis of two national data bases. Human Biology 74(1): 83–109. doi:10.1353/hub.2002.0011.
Siordia, C. (2016). Self-care and mobility disability at mid-life in lucky few, early-, andlate-baby boom birth-cohorts. Journal of Health Disparities Research andPractice 9(2): 216–228.
Sheftel & Heiland: Is there a Hispanic immigrant health advantage that reverses from working to old age?
246 http://www.demographic-research.org
Siordia, C. and Ramos, A.K. (2015). Evidence of the ‘Hispanic paradox’ from thepoverty and disability nexus in the Latino farmworker population of the UnitedStates. Global Journal of Biology, Agriculture and Health Sciences 4(3): 118–124.
Siordia, C. and Young, R. (2013). Methodological note: Allocation of disability itemsin the American Community Survey. Disability and Health Journal 6(2): 149–153. doi:10.1016/j.dhjo.2012.11.007.
Smith, G.S., Wellman, H.M., Sorock, G.S., Warner, M., Courtney, T.K., Pransky, G.S.,and Fingerhut, L.A. (2005). Injuries at work in the US adult population:Contributions to the total injury burden. American Journal of Public Health95(7): 1213–1219. doi:10.2105/AJPH.2004.049338.
Stern, S.M. (2004). Counting people with disabilities: How survey methodologyestimates influence estimates in Census 2000 and the Census 2000Supplementary Survey. Washington, D.C.: Bureau of the Census.
Tirodkar, M.A., Song, J., Chang, R.W., Dunlop, D.D., and Chang, H.J. (2008). Racialand ethnic differences in activities of daily living disability among the elderly:The case of Spanish speakers. Archives of Physical Medicine and Rehabilitation89(7): 1262–1266. doi:10.1016/j.apmr.2007.11.042.
Toussaint-Comeau, M. (2006). The occupational assimilation of Hispanic immigrantsin the US: Evidence from panel data. International Migration Review 40(3):508–536. doi:10.1111/j.1747-7379.2006.00034.x.
Turra, C.M. and Elo, I. (2008). The impact of salmon bias on the Hispanic mortalityadvantage. Population Research and Policy Review 27(5): 515–530.doi:10.1007/s11113-008-9087-4.
Van Hook, J., Bachmeier, J.D., Coffman, D.L., and Harel, O. (2015). Can we spin strawinto gold? An evaluation of immigrant legal status imputation approaches.Demography 52(1): 329–354. doi:10.1007/s13524-014-0358-x.
Verbrugge, L.M. and Jette, A.M. (1994). The disablement process. Social Science andMedicine 38(1): 1–14. doi:10.1016/0277-9536(94)90294-1.
Verbrugge, L.M. (2016). Disability experience and measurement. Journal of Aging andHealth 28(7): 1124–1158. doi:10.1177/0898264316656519.
Demographic Research: Volume 39, Article 7
http://www.demographic-research.org 247
Viruell-Fuentes, E.A., Morenoff, J.D., Williams, D.R., and House, J.S. (2011).Language of interview, self-rated health, and the other Latino health puzzle.American Journal of Public Health 101(7): 1306–1313. doi:10.2105/AJPH.2009.175455.
Warner, D.F. and Brown, T.H. (2011). Understanding how race/ethnicity and genderdefine age-trajectories of disability: An intersectionality approach. SocialScience and Medicine 72(8): 1236–1248. doi:10.1016/j.socscimed.2011.02.034.
Weigel, M.M., Armijos, R.X., and Beltran, O. (2014). Musculoskeletal injury,functional disability, and health-related quality of life in aging Mexicanimmigrant farmworkers. Journal of Immigrant and Minority Health 16(5): 904–913. doi:10.1007/s10903-013-9788-6.
Woodrow-Lafield, K.A. (2012). A sociology of official unauthorized statistics:Estimation or guesstimation? In: Hoque, N. and Swanson, D.A. (eds.).Opportunities and challenges for applied demography in the 21st century. NewYork: Springer: 49–80. doi:10.1007/978-94-007-2297-2_5.
Zsembik, B.A. and Fennell, D. (2005). Ethnic variation in health and the determinantsof health among Latinos. Social Science and Medicine 61(1): 53–63.doi:10.1016/j.socscimed.2004.11.040.

Sheftel & Heiland: Is there a Hispanic immigrant health advantage that reverses from working to old age?
248 http://www.demographic-research.org
Appendix
This appendix provides greater detail specific to the use of American CommunitySurvey (ACS) data in this paper:
1. ACS measures of disability
The six disability-related instruments measuring hearing, vision, cognitive, ambulatory,self-care, and independent living difficulty in the ACS and (comparable instrumentsfrom the Census long form) are commonly used in disability research (e.g., Elo, Mehta,and Huang 2011; Gubernskaya, Bean, and Van Hook 2013; Markides et al. 2007;Siordia and Ramos 2015; Stern 2004). They are similar to questions found in othersurveys and censuses worldwide (Verbrugge 2016). In particular, self-care andindependent living difficulty measures mirror the widely used Activities of Daily Living(ADL) and Instrumental Activities of Daily Living (IADL) measures (Brault 2009). TheACS hearing, vision, cognitive, ambulatory, and self-care disability instruments havebeen shown to provide reliable measures; the independent living instrument has beenfound to be somewhat less reliable (Stern 2004).
Following is the wording for each of the six survey questions related to disability:
∂ Hearing Difficulty: “Is this person deaf or does he/she have serious difficultyhearing?”
∂ Vision Difficulty: “Is this person blind or does he/she have serious difficultyseeing even when wearing glasses?”
∂ Cognitive Difficulty: Because of a physical, mental, or emotional condition,does this person have serious difficulty concentrating, remembering, or makingdecisions?”
∂ Ambulatory Difficulty: “Does this person have serious difficulty walking orclimbing stairs?”
∂ Self-Care Difficulty: “Does this person have difficulty dressing or bathing?”∂ Independent Living Difficulty: “Because of a physical, mental, or emotional
condition, does this person have difficulty doing errands alone such as visitinga doctor’s office or shopping?”
Demographic Research: Volume 39, Article 7
http://www.demographic-research.org 249
2. Site of ACS data collection
Data collection for the ACS takes place in individual households; institutional groupquarters, which include nursing homes, correctional facilities, and mental hospitals; andin noninstitutional group quarters, which include college dormitories, military barracks,group homes, missions, and shelters. While a separate analysis of those in nursing homefacilities specifically would be valuable for this age group, the public-use data does notallow disaggregation by individual type of institutional group quarters, precluding aseparate analysis of nursing home residents. See https://www.census.gov/topics/income-poverty/poverty/guidance/group-quarters.html for more details.
3. Underreporting of Hispanics in the ACS
There is evidence of underreporting of Hispanics in the ACS (Lowenthal 2006; Siordiaand Ramos 2015). Compounding issues of underreporting, rates of allocation(procedures used by the Census Bureau to address illogical and missing responses) ofACS data vary by race/ethnicity and disability, leading to greater uncertainty in theestimates for some subgroups and disability domains, including Mexicans (Latinos andLatinas) and Spanish-only-speaking households, as well as self-care and visiondisabilities (Siordia and Young 2013). However, undercounting by ethnicity may beless consequential here given our focus on subpopulations. Further, while there is alsoevidence of undercounting of undocumented populations (Judson and Swanson 2011;Van Hook et al. 2015; Woodrow-Lafield 2012), a population that is particularlyvulnerable to health risks, undercount rates are low for older immigrants and Mexicans,making this concern, in the context of this paper, less significant (Passel and Cohn2016).
Sheftel & Heiland: Is there a Hispanic immigrant health advantage that reverses from working to old age?
250 http://www.demographic-research.org
Figure A-1: Total count of age-specific overall disability rates by gender,race/ethnicity, and nativity
Source: ACS 2010–2014.