Embed Size (px)
Citation preview
Disability and Labor
Markets in Developing Countries
Kamal Lamichhane, Ph.DResearch [email protected]
Japan International Cooperation Agency (JICA), Research Institute
6 February 2014
Background (1) The value of work to individuals Crucial social functions of employment
include financial independence and integration into community
“Employment improves social status, provides social support, enables workers to make a contribution, and increases self-worth” (O’Day and Killeen, 2002).
Background (2)
People with disabilities continue to be under-represented in the workforce due to various barriers
Primarily employed in part-time and/or jobs that are accorded low status in that particular society
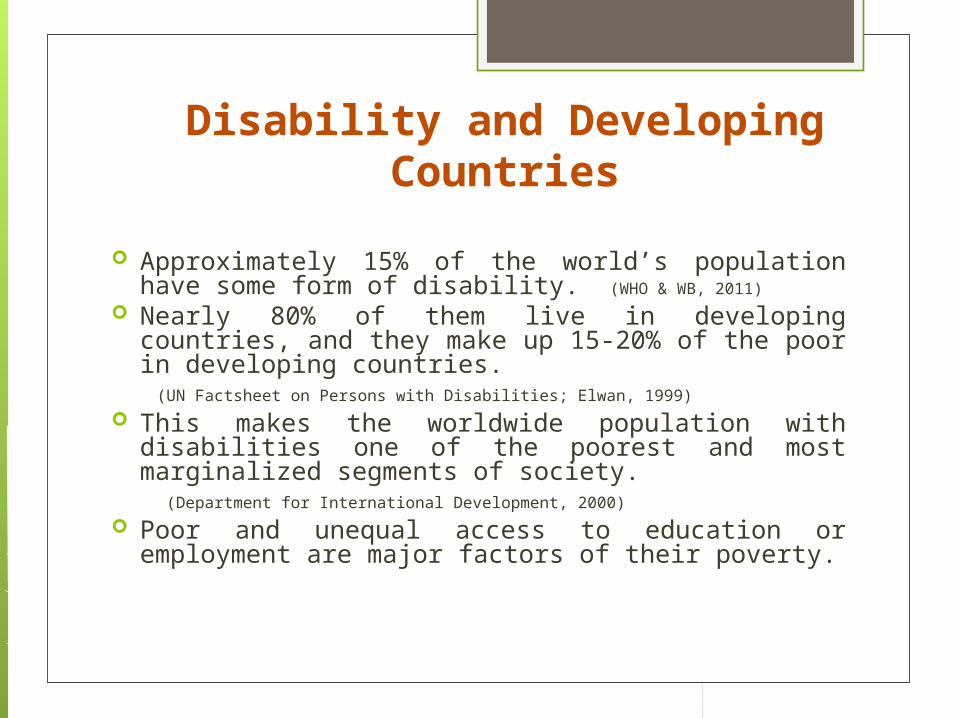
Approximately 15% of the world’s population have some form of disability. (WHO & WB, 2011)
Nearly 80% of them live in developing countries, and they make up 15-20% of the poor in developing countries.
(UN Factsheet on Persons with Disabilities; Elwan, 1999)
This makes the worldwide population with disabilities one of the poorest and most marginalized segments of society.
(Department for International Development, 2000)
Poor and unequal access to education or employment are major factors of their poverty.
Disability and Developing Countries
Global Employment Situation
OECD (2010)
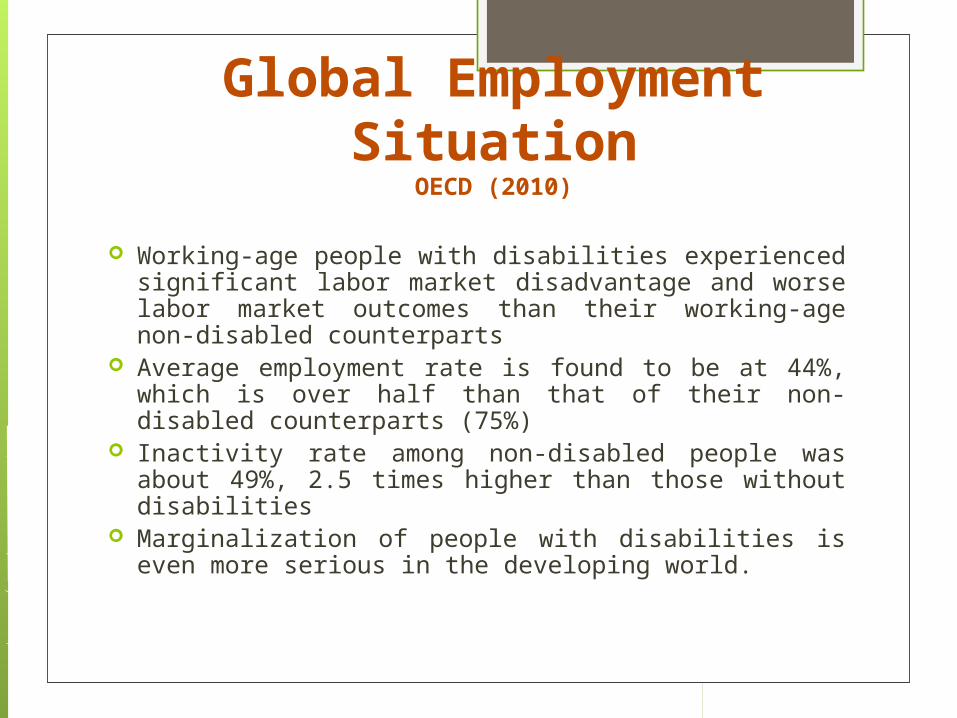
Working-age people with disabilities experienced significant labor market disadvantage and worse labor market outcomes than their working-age non-disabled counterparts
Average employment rate is found to be at 44%, which is over half than that of their non-disabled counterparts (75%)
Inactivity rate among non-disabled people was about 49%, 2.5 times higher than those without disabilities
Marginalization of people with disabilities is even more serious in the developing world.
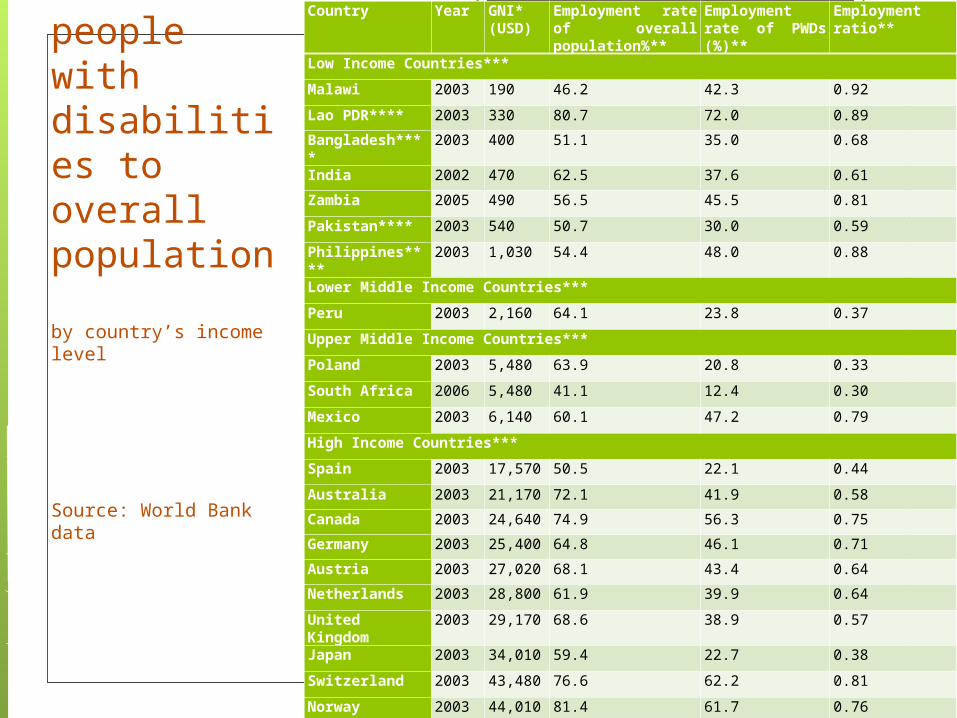
Table 1:
Employment ratio of people with disabilities to overall population by country’s income level
Source: World Bank data
Country Year GNI* (USD)
Employment rate of overall population%**
Employment rate of PWDs (%)**
Employment ratio**
Low Income Countries***
Malawi 2003 190 46.2 42.3 0.92
Lao PDR**** 2003 330 80.7 72.0 0.89
Bangladesh****
2003 400 51.1 35.0 0.68
India 2002 470 62.5 37.6 0.61
Zambia 2005 490 56.5 45.5 0.81
Pakistan**** 2003 540 50.7 30.0 0.59
Philippines****
2003 1,030 54.4 48.0 0.88
Lower Middle Income Countries***
Peru 2003 2,160 64.1 23.8 0.37
Upper Middle Income Countries***
Poland 2003 5,480 63.9 20.8 0.33
South Africa 2006 5,480 41.1 12.4 0.30
Mexico 2003 6,140 60.1 47.2 0.79
High Income Countries***
Spain 2003 17,570 50.5 22.1 0.44
Australia 2003 21,170 72.1 41.9 0.58
Canada 2003 24,640 74.9 56.3 0.75
Germany 2003 25,400 64.8 46.1 0.71
Austria 2003 27,020 68.1 43.4 0.64
Netherlands 2003 28,800 61.9 39.9 0.64
United Kingdom
2003 29,170 68.6 38.9 0.57
Japan 2003 34,010 59.4 22.7 0.38
Switzerland 2003 43,480 76.6 62.2 0.81
Norway 2003 44,010 81.4 61.7 0.76
USA 2005 44,670 73.2 38.1 0.52
Barriers to Entry into the Labor Market
Perceived low productivity Employers’s misconceptions on ability
and disability Perverse disincentive to work Wage disparity
The question remains: “What is the effect of education for the employability and occupational choice differential among people with disabilities?” Research on the nexus between disability,
education employment in developing countries more generally, is scarce.
Purpose of Study
Dataset from Nepal (1)
Two rounds of the survey were conducted in Nepal’s Kathmandu Valley in 2008.
Participants: persons with hearing, physical and visual impairments
Face-to-face interviews using carefully-structured questionnaires was conducted
Participants aged between 16 and 65 were included for the survey
Out of a total of 993 potential participants registered in the disability related organizations in Kathmandu, Bhaktapur and Lalitpur Districts, 423 respondents were randomly selected using proportionate stratified random sampling.
Socioeconomic aspects covered:- Information on impairment- demographic characteristics- education background- employment status
Dataset from Nepal (2)
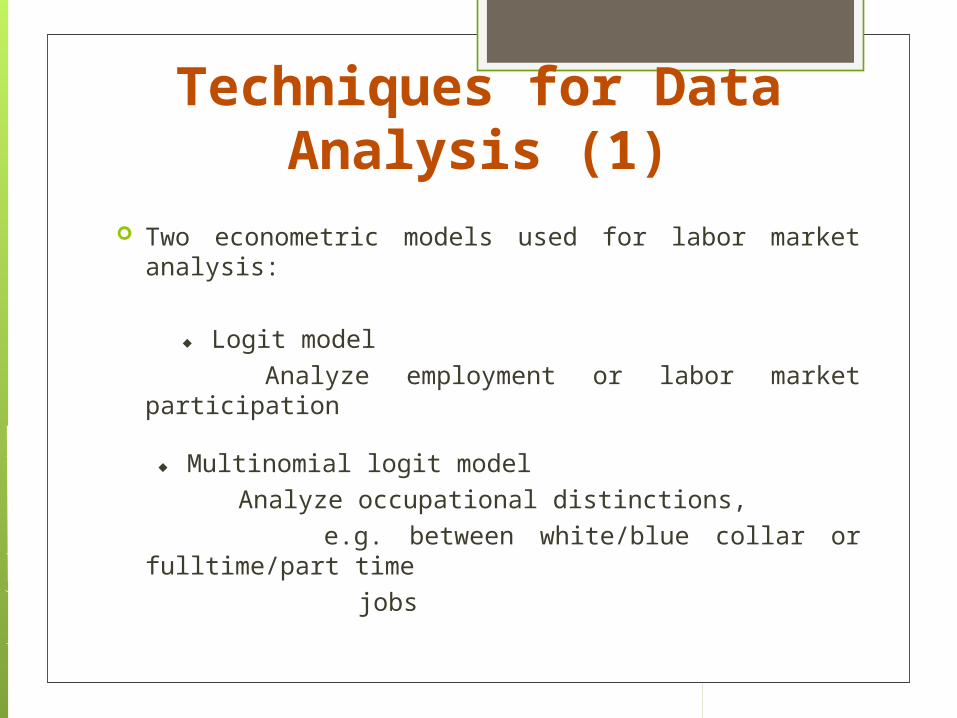
Techniques for Data Analysis (1)
Two econometric models used for labor market analysis:
◆ Logit model
Analyze employment or labor market participation
◆ Multinomial logit model
Analyze occupational distinctions,
e.g. between white/blue collar or fulltime/part time
jobs
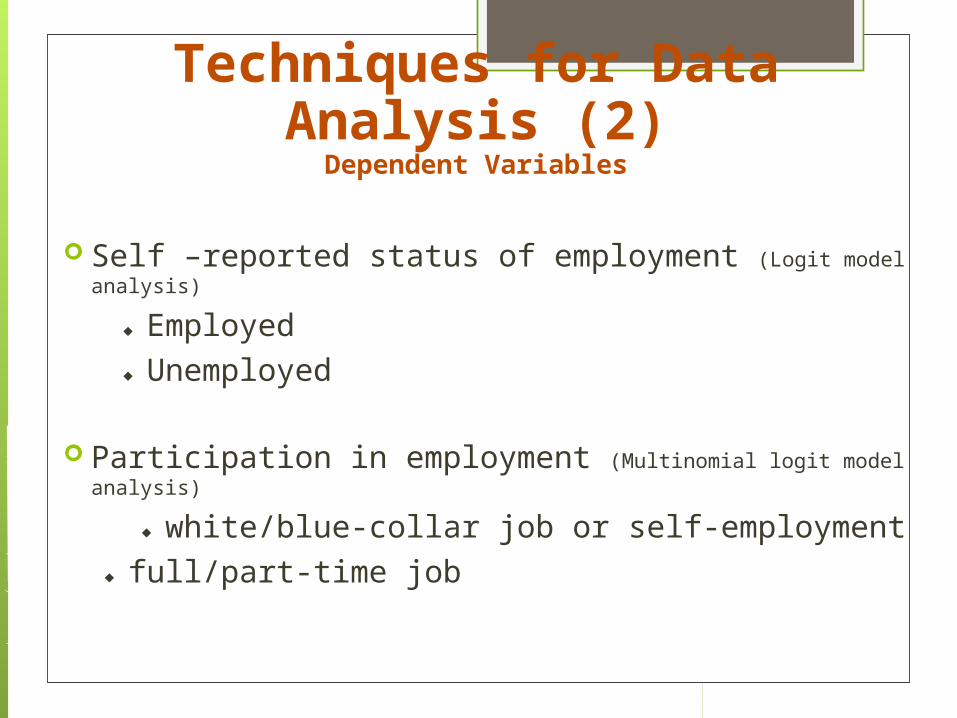
Techniques for Data Analysis (2)
Dependent Variables
Self –reported status of employment (Logit model analysis)
◆ Employed ◆ Unemployed
Participation in employment (Multinomial logit model analysis)
◆ white/blue-collar job or self-employment ◆ full/part-time job
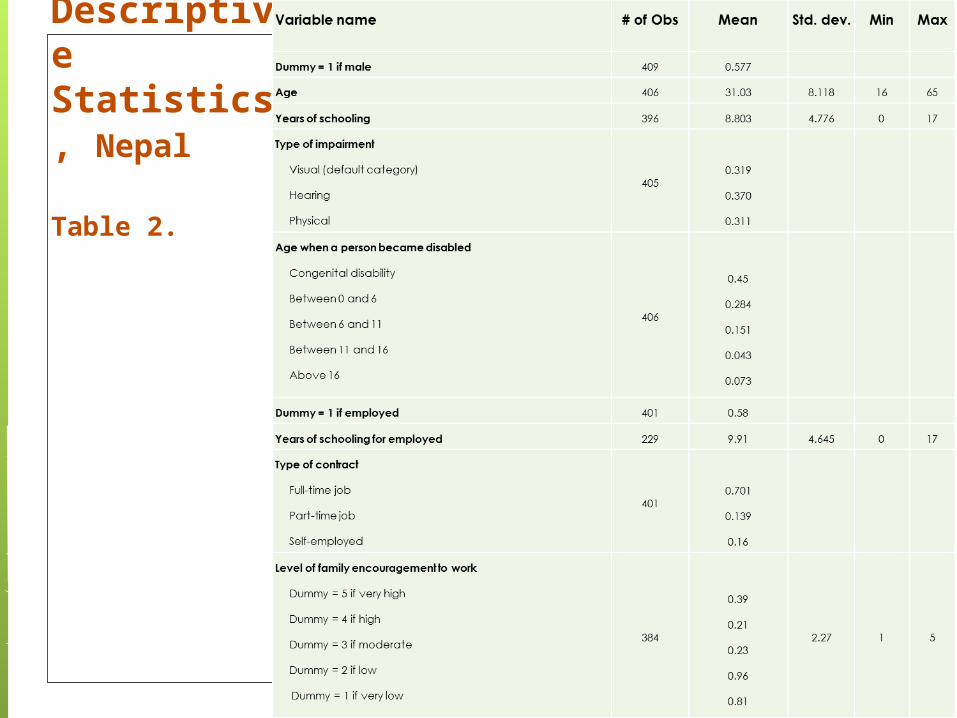
Descriptive Statistics, Nepal
Table 2.
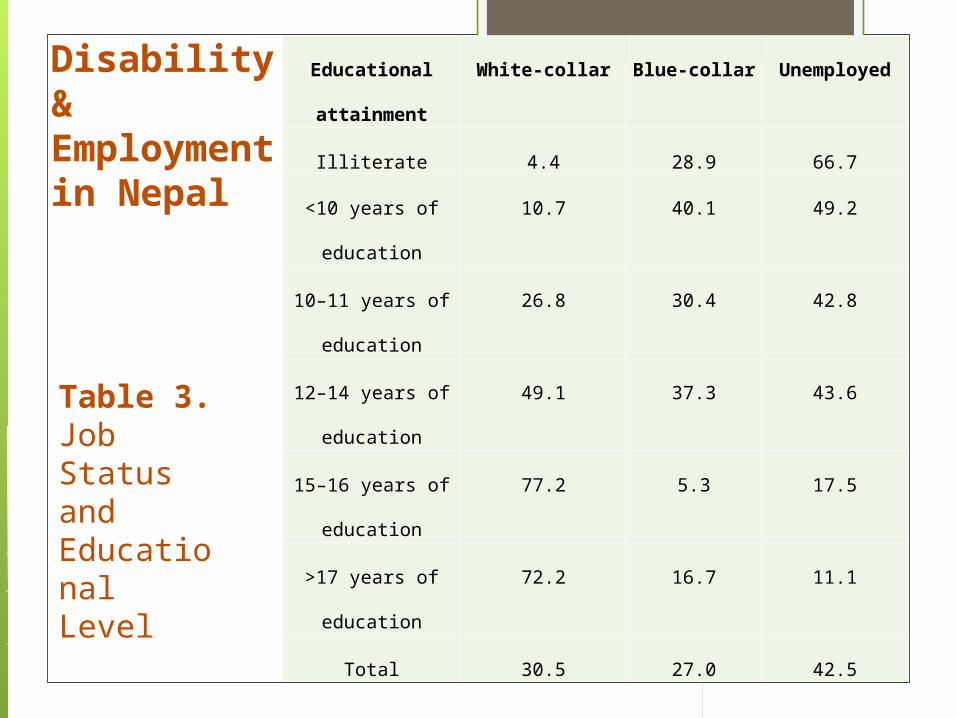
Table 3.Job Status and Educational Level
Disability & Employment in Nepal
Educational
attainment
White-collar Blue-collar Unemployed
Illiterate 4.4 28.9 66.7
<10 years of
education
10.7 40.1 49.2
10–11 years of
education
26.8 30.4 42.8
12–14 years of
education
49.1 37.3 43.6
15–16 years of
education
77.2 5.3 17.5
>17 years of
education
72.2 16.7 11.1
Total 30.5 27.0 42.5
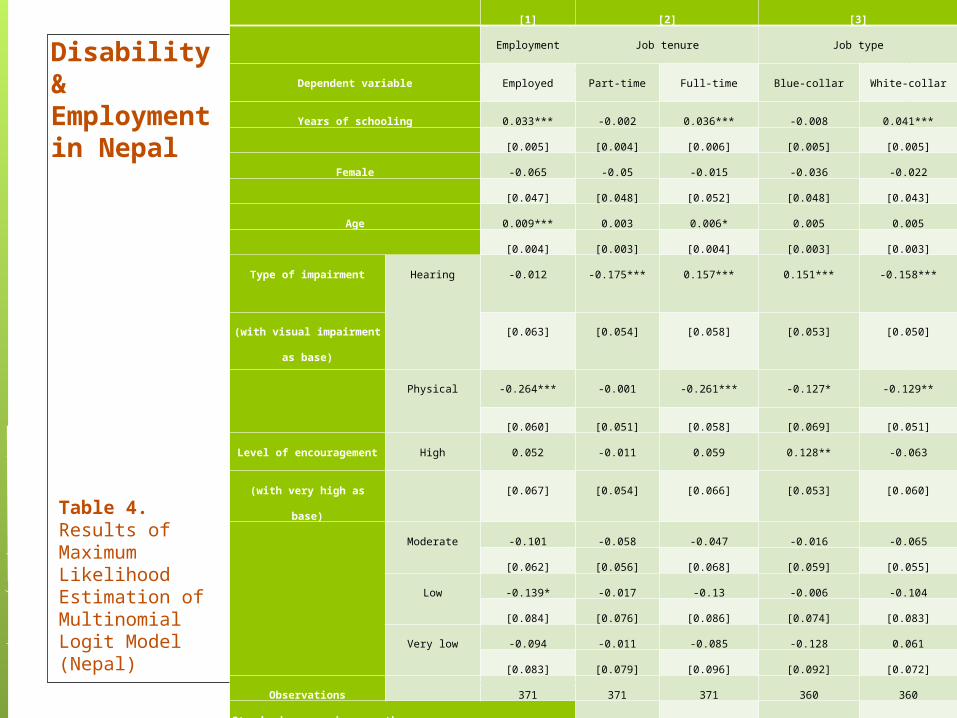
Table 4.Results of Maximum Likelihood Estimation of Multinomial Logit Model (Nepal)
[1] [2] [3]
Employment Job tenure Job type
Dependent variable Employed Part-time Full-time Blue-collar White-collar
Years of schooling 0.033*** -0.002 0.036*** -0.008 0.041***
[0.005] [0.004] [0.006] [0.005] [0.005]
Female -0.065 -0.05 -0.015 -0.036 -0.022
[0.047] [0.048] [0.052] [0.048] [0.043]
Age 0.009*** 0.003 0.006* 0.005 0.005
[0.004] [0.003] [0.004] [0.003] [0.003]
Type of impairment Hearing -0.012 -0.175*** 0.157*** 0.151*** -0.158***
(with visual impairment
as base)
[0.063] [0.054] [0.058] [0.053] [0.050]
Physical -0.264*** -0.001 -0.261*** -0.127* -0.129**
[0.060] [0.051] [0.058] [0.069] [0.051]
Level of encouragement High 0.052 -0.011 0.059 0.128** -0.063
(with very high as base) [0.067] [0.054] [0.066] [0.053] [0.060]
Moderate -0.101 -0.058 -0.047 -0.016 -0.065
[0.062] [0.056] [0.068] [0.059] [0.055]
Low -0.139* -0.017 -0.13 -0.006 -0.104
[0.084] [0.076] [0.086] [0.074] [0.083]
Very low -0.094 -0.011 -0.085 -0.128 0.061
[0.083] [0.079] [0.096] [0.092] [0.072]
Observations 371 371 371 360 360
Standard errors in parentheses
*** p<0.01, ** p<0.05, * p<0.1
Disability & Employment in Nepal
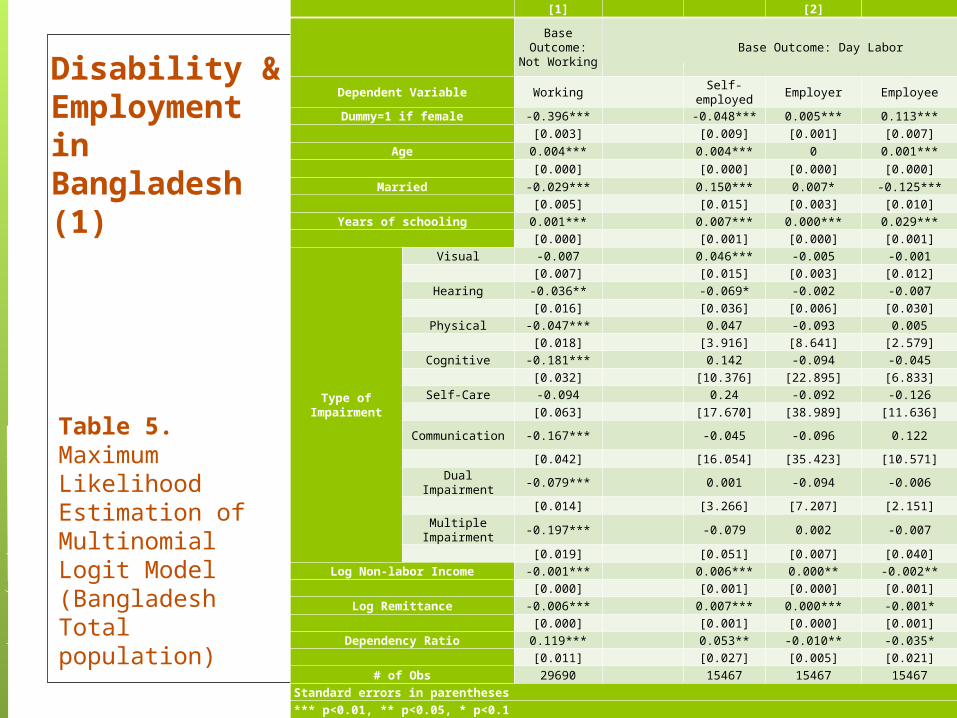
[1] [2]
Base Outcome:
Not Working
Base Outcome: Day Labor
Dependent Variable Working Self-employed
Employer Employee
Dummy=1 if female -0.396*** -0.048*** 0.005*** 0.113***
[0.003] [0.009] [0.001] [0.007]
Age 0.004*** 0.004*** 0 0.001***
[0.000] [0.000] [0.000] [0.000]
Married -0.029*** 0.150*** 0.007* -0.125*** [0.005] [0.015] [0.003] [0.010]
Years of schooling 0.001*** 0.007*** 0.000*** 0.029*** [0.000] [0.001] [0.000] [0.001]
Type of Impairment
Visual -0.007 0.046*** -0.005 -0.001 [0.007] [0.015] [0.003] [0.012]
Hearing -0.036** -0.069* -0.002 -0.007 [0.016] [0.036] [0.006] [0.030]
Physical -0.047*** 0.047 -0.093 0.005 [0.018] [3.916] [8.641] [2.579]
Cognitive -0.181*** 0.142 -0.094 -0.045 [0.032] [10.376] [22.895] [6.833]
Self-Care -0.094 0.24 -0.092 -0.126 [0.063] [17.670] [38.989] [11.636]
Communication -0.167*** -0.045 -0.096 0.122
[0.042] [16.054] [35.423] [10.571]
Dual Impairment -0.079*** 0.001 -0.094 -0.006
[0.014] [3.266] [7.207] [2.151]Multiple
Impairment-0.197*** -0.079 0.002 -0.007
[0.019] [0.051] [0.007] [0.040]Log Non-labor Income -0.001*** 0.006*** 0.000** -0.002**
[0.000] [0.001] [0.000] [0.001]Log Remittance -0.006*** 0.007*** 0.000*** -0.001*
[0.000] [0.001] [0.000] [0.001]Dependency Ratio 0.119*** 0.053** -0.010** -0.035*
[0.011] [0.027] [0.005] [0.021]# of Obs 29690 15467 15467 15467
Standard errors in parentheses *** p<0.01, ** p<0.05, * p<0.1
Table 5. Maximum Likelihood Estimation of Multinomial Logit Model (Bangladesh Total population)
Disability & Employment in Bangladesh (1)
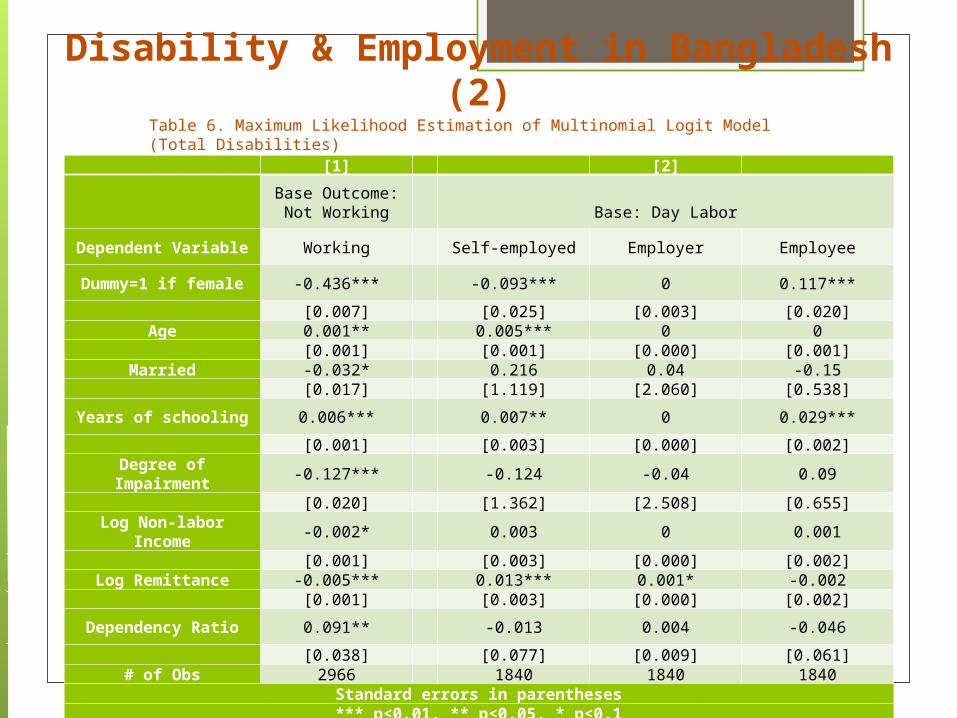
Disability & Employment in Bangladesh (2)
[1] [2]
Base Outcome: Not Working
Base: Day Labor
Dependent Variable Working Self-employed Employer Employee
Dummy=1 if female -0.436*** -0.093*** 0 0.117***
[0.007] [0.025] [0.003] [0.020]Age 0.001** 0.005*** 0 0
[0.001] [0.001] [0.000] [0.001]Married -0.032* 0.216 0.04 -0.15
[0.017] [1.119] [2.060] [0.538]
Years of schooling 0.006*** 0.007** 0 0.029***
[0.001] [0.003] [0.000] [0.002]Degree of
Impairment-0.127*** -0.124 -0.04 0.09
[0.020] [1.362] [2.508] [0.655]Log Non-labor
Income-0.002* 0.003 0 0.001
[0.001] [0.003] [0.000] [0.002]Log Remittance -0.005*** 0.013*** 0.001* -0.002
[0.001] [0.003] [0.000] [0.002]
Dependency Ratio 0.091** -0.013 0.004 -0.046
[0.038] [0.077] [0.009] [0.061]# of Obs 2966 1840 1840 1840
Standard errors in parentheses*** p<0.01, ** p<0.05, * p<0.1
Table 6. Maximum Likelihood Estimation of Multinomial Logit Model (Total Disabilities)
[1] [2]
Base: Not Working
Base: Day Labor
Dependent Variable Working Self-employed Employer Employee
Age 0 0.007*** 0 -0.001 [0.001] [0.002] [0.000] [0.001]
Married 0.207*** 0.087 0.024 -0.239 [0.027] [1.404] [2.277] [0.544]
Years of schooling 0.005** 0.007** 0 0.027***
[0.002] [0.003] [0.000] [0.002]Degree of
Impairment-0.119*** -0.099 -0.031 0.064
[0.020] [1.764] [2.868] [0.682]Log Non-labor
Income-0.003* 0.001 0.001 0
[0.002] [0.003] [0.001] [0.002]Log Remittance -0.007*** 0.014*** 0 -0.002
[0.002] [0.004] [0.000] [0.003]
Dependency Ratio 0.026 0.017 0.012 -0.091
[0.060] [0.111] [0.014] [0.087]# of Obs 1257 1050 1050 1050
Standard errors in parentheses*** p<0.01, ** p<0.05, * p<0.1
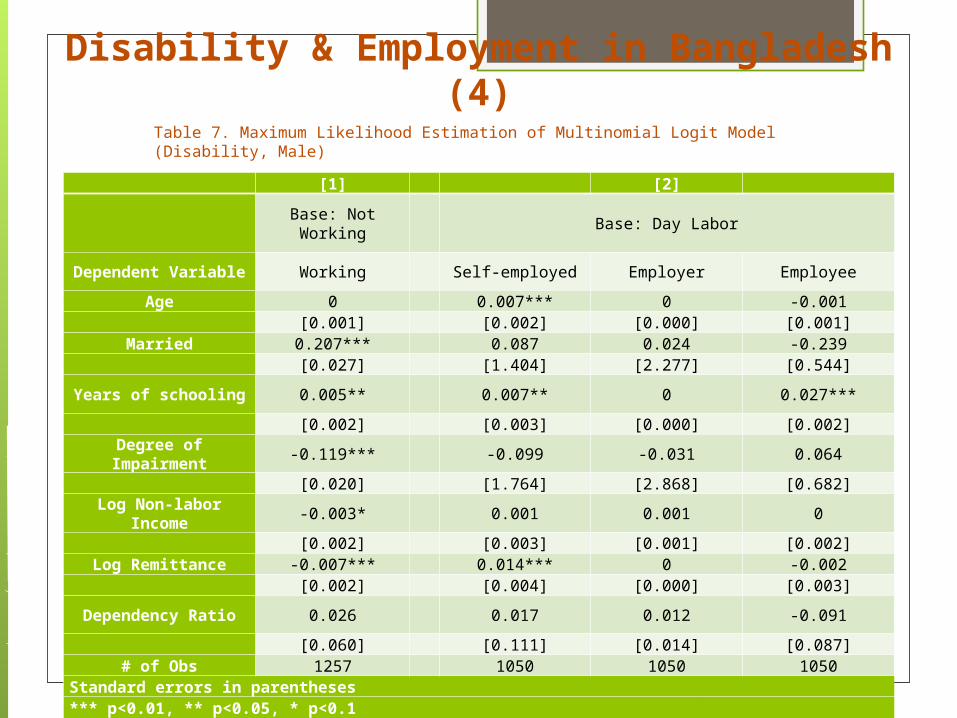
Table 7. Maximum Likelihood Estimation of Multinomial Logit Model (Disability, Male)
Disability & Employment in Bangladesh (4)
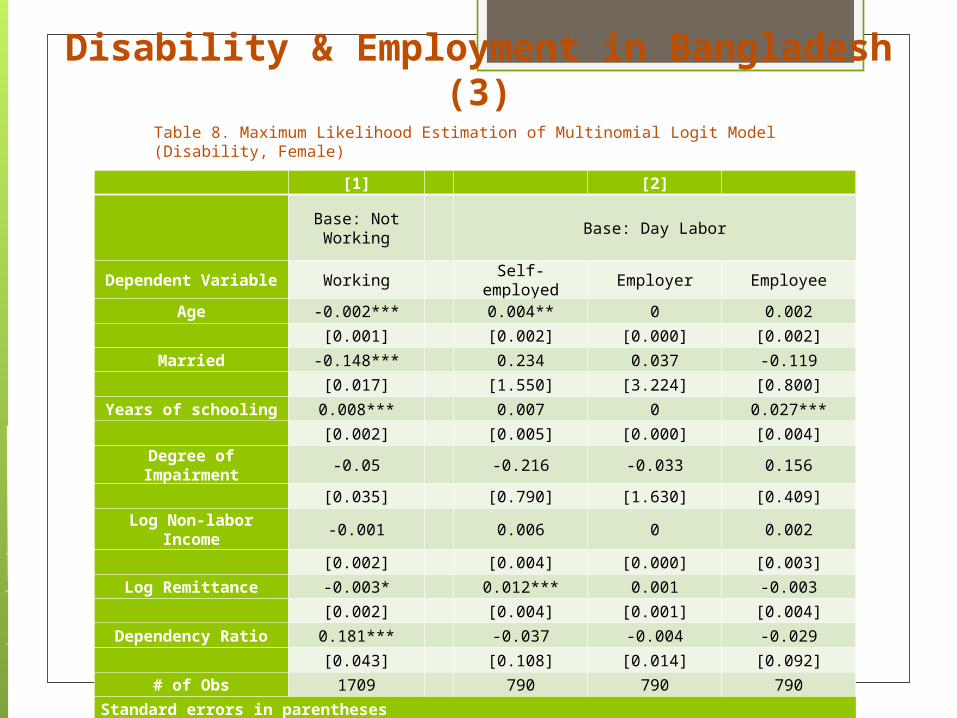
Table 8. Maximum Likelihood Estimation of Multinomial Logit Model (Disability, Female)
Disability & Employment in Bangladesh (3)
[1] [2]
Base: Not Working
Base: Day Labor
Dependent Variable Working Self-employed Employer Employee
Age -0.002*** 0.004** 0 0.002
[0.001] [0.002] [0.000] [0.002]
Married -0.148*** 0.234 0.037 -0.119
[0.017] [1.550] [3.224] [0.800]
Years of schooling 0.008*** 0.007 0 0.027***
[0.002] [0.005] [0.000] [0.004]Degree of
Impairment-0.05 -0.216 -0.033 0.156
[0.035] [0.790] [1.630] [0.409]Log Non-labor
Income-0.001 0.006 0 0.002
[0.002] [0.004] [0.000] [0.003]
Log Remittance -0.003* 0.012*** 0.001 -0.003
[0.002] [0.004] [0.001] [0.004]
Dependency Ratio 0.181*** -0.037 -0.004 -0.029
[0.043] [0.108] [0.014] [0.092]
# of Obs 1709 790 790 790
Standard errors in parentheses
*** p<0.01, ** p<0.05, * p<0.1
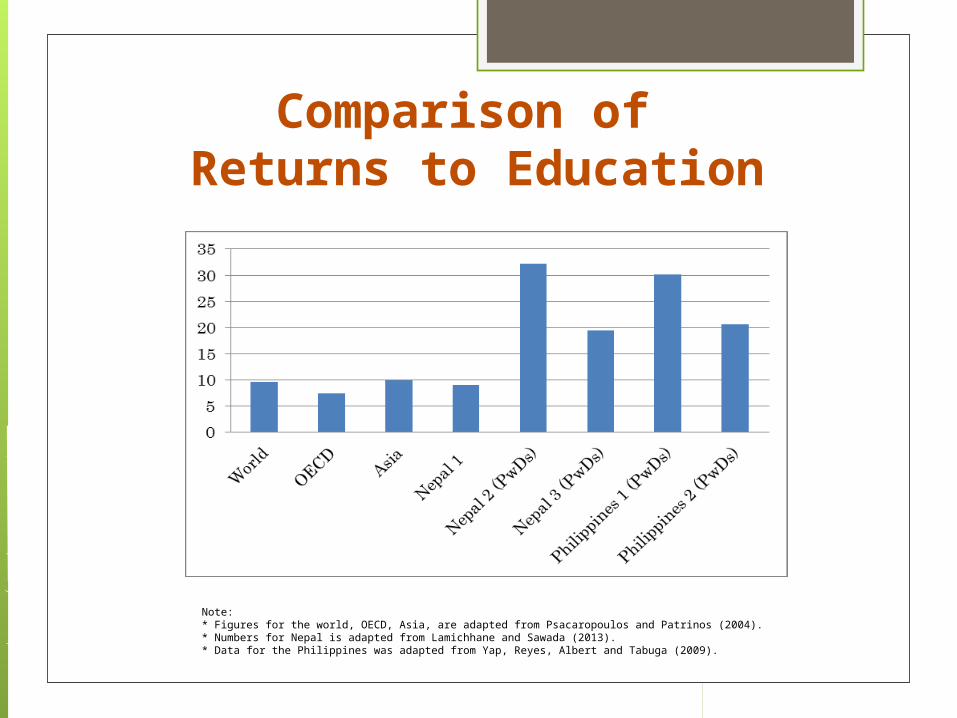
Comparison of Returns to Education
Note:* Figures for the world, OECD, Asia, are adapted from Psacaropoulos and Patrinos (2004).* Numbers for Nepal is adapted from Lamichhane and Sawada (2013).* Data for the Philippines was adapted from Yap, Reyes, Albert and Tabuga (2009).
Summary of Findings
I discussed the range of occupational opportunities for, and the current situation of, people with disabilities.
People with disabilities can benefit greatly from working, if the right person is put to the right job.
If individuals with disabilities are treated based on the principle of what they can do rather than what they can not – a strength-based approach – they can not only take care of their own livelihoods, but also contribute significantly to social progress.
This requires employment opportunities, and the elimination of prejudice and discrimination.
Concluding Remarks Develop policies toward increasing and promoting
employment opportunities for individuals with disabilities.
Provide educational opportunities beyond the primary level
Increase educational investment in people with disabilities
Incorporate strategies such as scholarship provisions, conditional cash transfers, and increasing of schools that can accommodate students with disabilities
Remove disabling barriers in workplace
Main References Organisation for Economic Co-operation and Development (OECD). (2010).
Sickness, disability and work: breaking the barriers. A synthesis of findings across OECD countries. Paris. Retrieved online from: http://www.oecd-ilibrary.org/social-issues-migration-health/sickness-disability-and-work-breaking-the-barriers_9789264088856-en (Last accessed: July 29, 2013)
O’Day, B., and M. Killeen. 2002. Does U.S. federal policy support employment and recovery for people with psychiatric disabilities? Behavioral Sciences and the Law, Vol.20, pp.559–583.
World Health Organization (WHO). (2011). World Report on Disability. Retrieved online from: http://www.who.int/disabilities/world_report/2011/en/index.html (Last accessed: 26 July 2013)
Elwan, Ann. 1999. ‘Poverty and Disability: A Survey of the Literature.’ Social Protection Discussion Paper, No. 9932. Washington, DC: World Bank.
![g]kfn ;/sf/ s]Gb|Lo cfof]hgf sfof{Gjog OsfO{1).pdf · 38 197264 GOKULNATH LAMICHHANE Gokul Nath Lamichhane Nuwakot Bageshwory 3 Suryagadhi 3 127676 G-28-1-3-0-021 81 लाभग्राह](https://img.pdfslide.us/doc/110x75/5fbcfe76172632149861c30b/gkfn-sf-sgblo-cfofhgf-sfofgjog-osfo-1pdf-38-197264-gokulnath-lamichhane.jpg)