Embed Size (px)
Citation preview
DISABILITY AND DEVELOPMENT BACKGROUND PAPER PREPARED FOR THE DISABILITY AND DEVELOPMENT
RESEARCH AGENDA MEETING, NOVEMBER 16, 2004, WORLD BANK HEADQUARTERS, WASHINGTON, D.C.
Robert Metts
A growing body of evidence suggests that social and economic benefits may be derived from addressing disability issues from a development perspective. So far, however, work in this area has tended to take place in the absence of a unifying theoretical framework for research. To begin to address this need, the World Bank has assembled a small group of distinguished Economic Development Scholars to meet with Senior Bank Staff to begin the process of drafting such a framework. This paper is intended to form the basis for this discussion, which will be centered on identifying the key components of a research agenda on Disability and Development.
THE ROOTS OF CONTEMPORARY DISABILITY POLICY AND PRACTICE
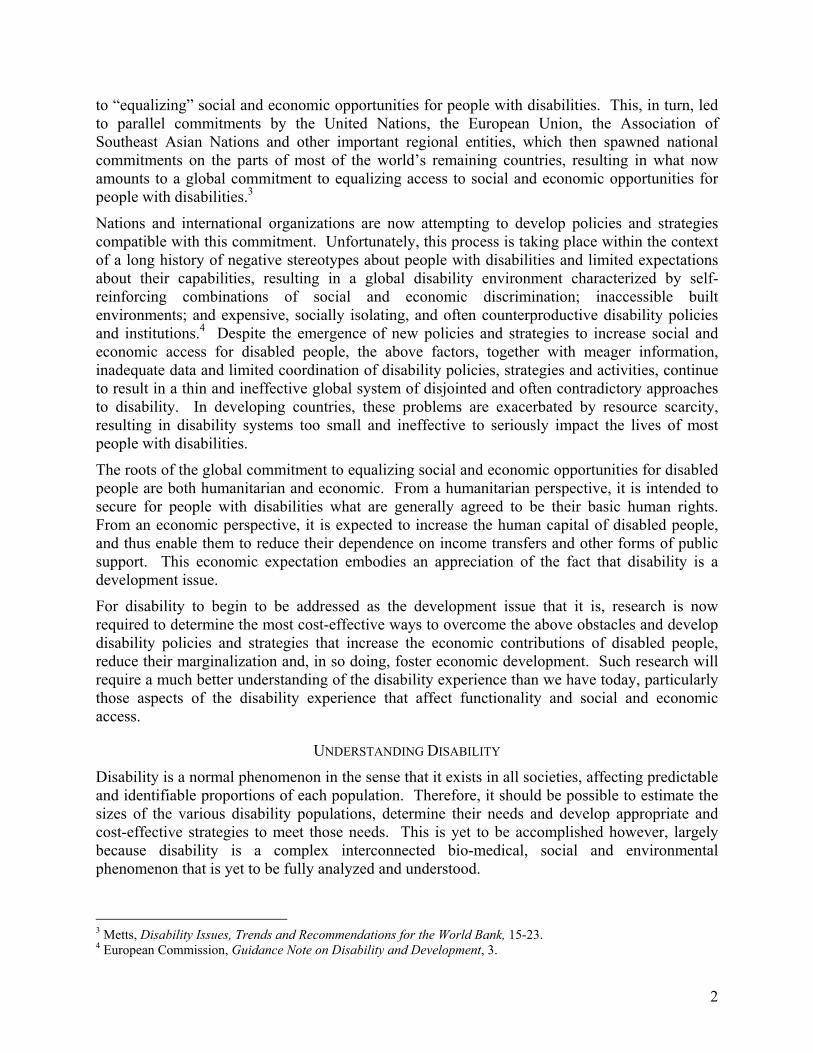
In the world’s affluent countries, segregated institutional systems have evolved over time, initially to care for people with disabilities, then to rehabilitate and educate them. In due course, these systems have raised the functional capabilities of people with disabilities to levels where significant numbers have become capable of mainstream social and economic participation. However, the compartmentalization of disabled people in segregated institutional systems, together with the limited expectations on which these systems are based, have worked against the social and economic inclusion of people with disabilities by perpetuating their isolation and reinforcing longstanding negative stereotypes that to this day significantly impair their ability to make social and economic contributions. 1
These types of expensive disability systems have tended to be beyond the reach of developing countries because of their limited resources for social programs. As a result, most people with disabilities in developing countries have tended to either die, care for themselves, or be cared for by their families and friends. A select few have become clients of charity-based versions of the expensive, segregated institutions developed in the economically advantaged countries but, due to the limited resources typically available through such charities, none have ever achieved the coverage required to have a significant impact.2
Despite these institutional disadvantages, technological change is continuously in the process of improving the socioeconomic circumstances and potentials of people with disabilities. Advances in medicine, rehabilitation and assistive technology work together to increase their functional capabilities, while mainstream technological advances steadily reduce the levels of functionality required for social and economic participation. All of these processes have contributed to the emergence of a large and increasingly empowered disability community, ever more capable of advocating for increased access to social and economic opportunities. Such advocacy first led to policies and commitments on the parts of a few of the most economically advantaged countries
1 Percy, Disability, Civil Rights, and Public Policy; Scotch, From Good Will to Civil Rights; Shapiro, No Pity: People with Disabilities Forging a New Civil Rights Movement; Thornton and Lunt, Employment Policies for Disabled People in Eighteen Countries, 298-301; and Metts, Disability Issues, Trends and Recommendations for the World Bank, 10-29. 2 Miles, Engaging with the Disability Rights Movement, 502.
to “equalizing” social and economic opportunities for people with disabilities. This, in turn, led to parallel commitments by the United Nations, the European Union, the Association of Southeast Asian Nations and other important regional entities, which then spawned national commitments on the parts of most of the world’s remaining countries, resulting in what now amounts to a global commitment to equalizing access to social and economic opportunities for people with disabilities.3
Nations and international organizations are now attempting to develop policies and strategies compatible with this commitment. Unfortunately, this process is taking place within the context of a long history of negative stereotypes about people with disabilities and limited expectations about their capabilities, resulting in a global disability environment characterized by self-reinforcing combinations of social and economic discrimination; inaccessible built environments; and expensive, socially isolating, and often counterproductive disability policies and institutions.4 Despite the emergence of new policies and strategies to increase social and economic access for disabled people, the above factors, together with meager information, inadequate data and limited coordination of disability policies, strategies and activities, continue to result in a thin and ineffective global system of disjointed and often contradictory approaches to disability. In developing countries, these problems are exacerbated by resource scarcity, resulting in disability systems too small and ineffective to seriously impact the lives of most people with disabilities.
The roots of the global commitment to equalizing social and economic opportunities for disabled people are both humanitarian and economic. From a humanitarian perspective, it is intended to secure for people with disabilities what are generally agreed to be their basic human rights. From an economic perspective, it is expected to increase the human capital of disabled people, and thus enable them to reduce their dependence on income transfers and other forms of public support. This economic expectation embodies an appreciation of the fact that disability is a development issue.
For disability to begin to be addressed as the development issue that it is, research is now required to determine the most cost-effective ways to overcome the above obstacles and develop disability policies and strategies that increase the economic contributions of disabled people, reduce their marginalization and, in so doing, foster economic development. Such research will require a much better understanding of the disability experience than we have today, particularly those aspects of the disability experience that affect functionality and social and economic access.
UNDERSTANDING DISABILITY
Disability is a normal phenomenon in the sense that it exists in all societies, affecting predictable and identifiable proportions of each population. Therefore, it should be possible to estimate the sizes of the various disability populations, determine their needs and develop appropriate and cost-effective strategies to meet those needs. This is yet to be accomplished however, largely because disability is a complex interconnected bio-medical, social and environmental phenomenon that is yet to be fully analyzed and understood.
3 Metts, Disability Issues, Trends and Recommendations for the World Bank, 15-23. 4 European Commission, Guidance Note on Disability and Development, 3.
2
Led by the World Health Organization (WHO), the most recent attempt to improve our understanding of disability has been underway for over twenty-five years. An important breakthrough came in 1980, when the WHO developed the International Classification of Impairments, Disabilities and Handicaps (ICIDH), which was the first conceptual framework of its kind to incorporate the influences of personal, social and environmental factors on people with disabilities. As such, the ICIDH was the first framework for analyzing disability issues to be compatible with the emerging understanding that medical restoration, rehabilitation, assistive devices and personal assistance can reduce the functional limitations of people with disabilities, and thus increase their capacity to take advantage of social and economic opportunities, and that social and environmental policies can alter the societal contexts of disability (e.g. social and economic institutions, built environments, cultures and beliefs) and thus increase the social and economic access of disabled people.
The ICIDH Framework
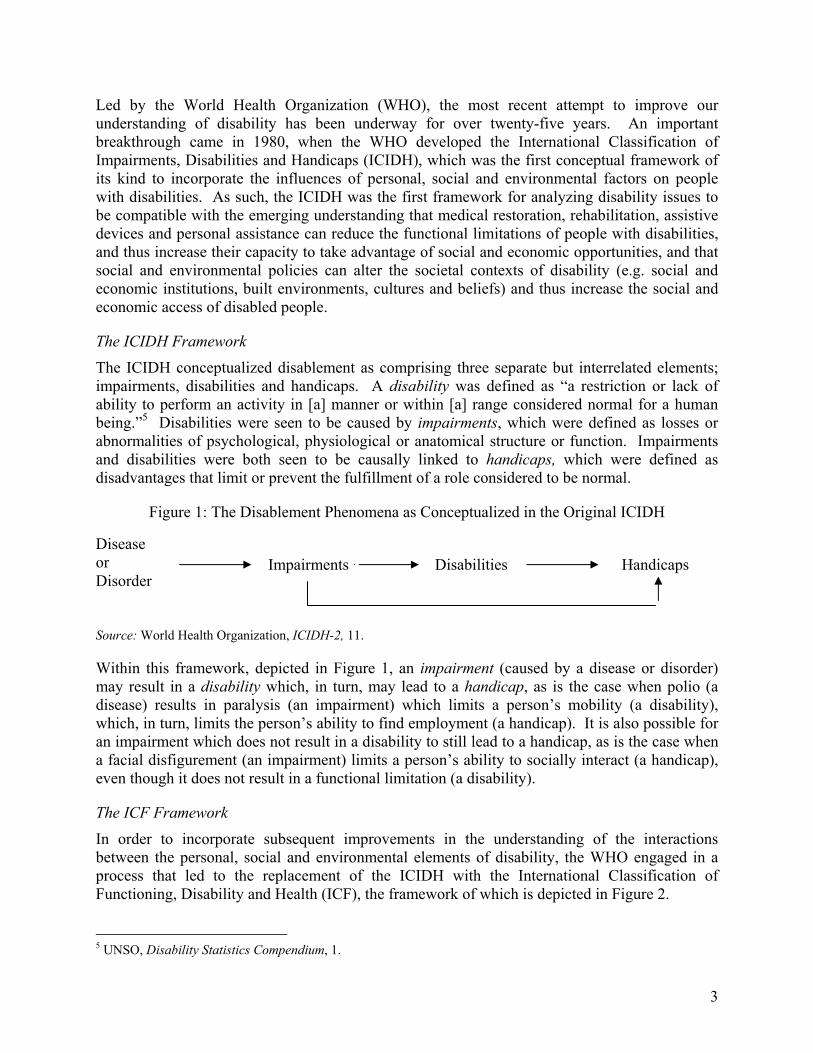
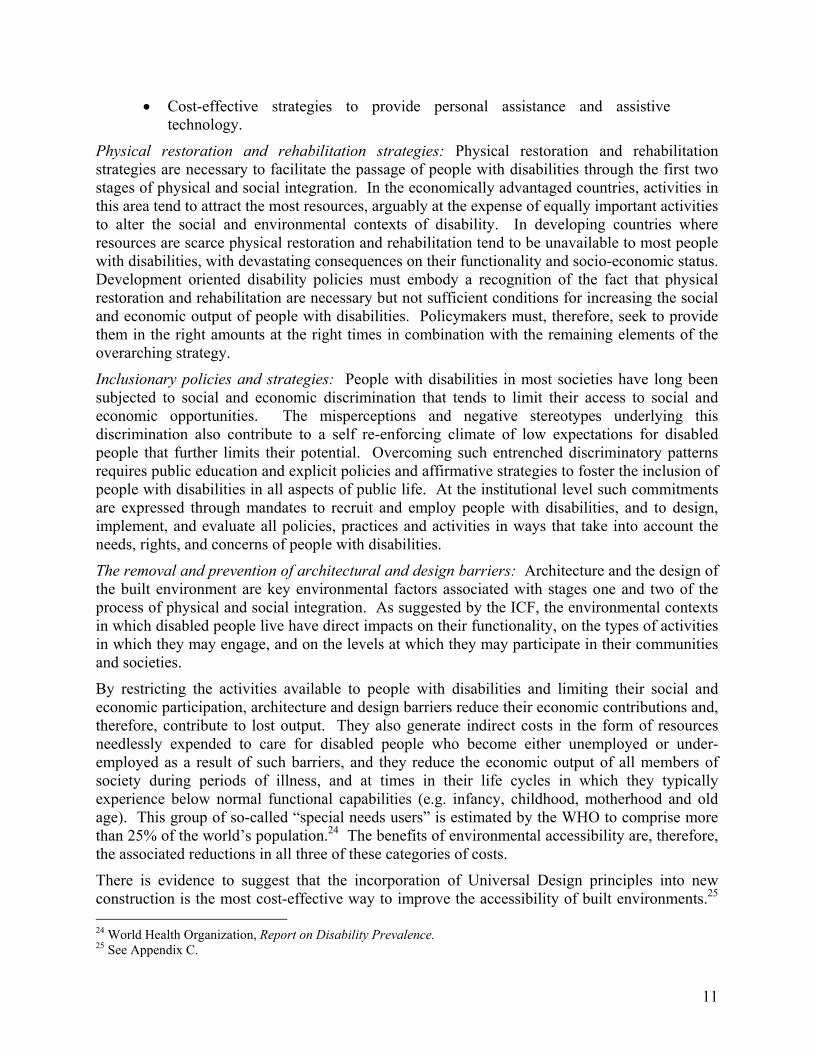
The ICIDH conceptualized disablement as comprising three separate but interrelated elements; impairments, disabilities and handicaps. A disability was defined as “a restriction or lack of ability to perform an activity in [a] manner or within [a] range considered normal for a human being.”5 Disabilities were seen to be caused by impairments, which were defined as losses or abnormalities of psychological, physiological or anatomical structure or function. Impairments and disabilities were both seen to be causally linked to handicaps, which were defined as disadvantages that limit or prevent the fulfillment of a role considered to be normal.
Figure 1: The Disablement Phenomena as Conceptualized in the Original ICIDH
Disease or Disorder
Impairments
Disabilities
Handicaps
Source: World Health Organization, ICIDH-2, 11.
Within this framework, depicted in Figure 1, an impairment (caused by a disease or disorder) may result in a disability which, in turn, may lead to a handicap, as is the case when polio (a disease) results in paralysis (an impairment) which limits a person’s mobility (a disability), which, in turn, limits the person’s ability to find employment (a handicap). It is also possible for an impairment which does not result in a disability to still lead to a handicap, as is the case when a facial disfigurement (an impairment) limits a person’s ability to socially interact (a handicap), even though it does not result in a functional limitation (a disability).
The ICF Framework
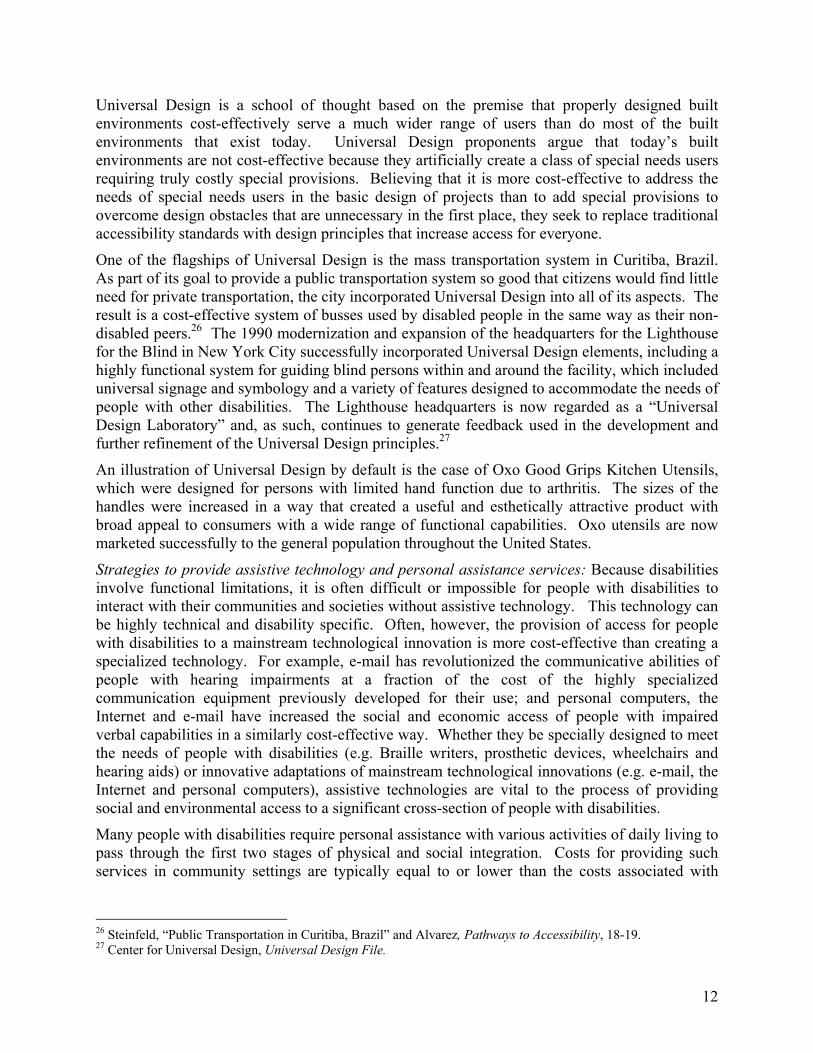
In order to incorporate subsequent improvements in the understanding of the interactions between the personal, social and environmental elements of disability, the WHO engaged in a process that led to the replacement of the ICIDH with the International Classification of Functioning, Disability and Health (ICF), the framework of which is depicted in Figure 2.
3
5 UNSO, Disability Statistics Compendium, 1.
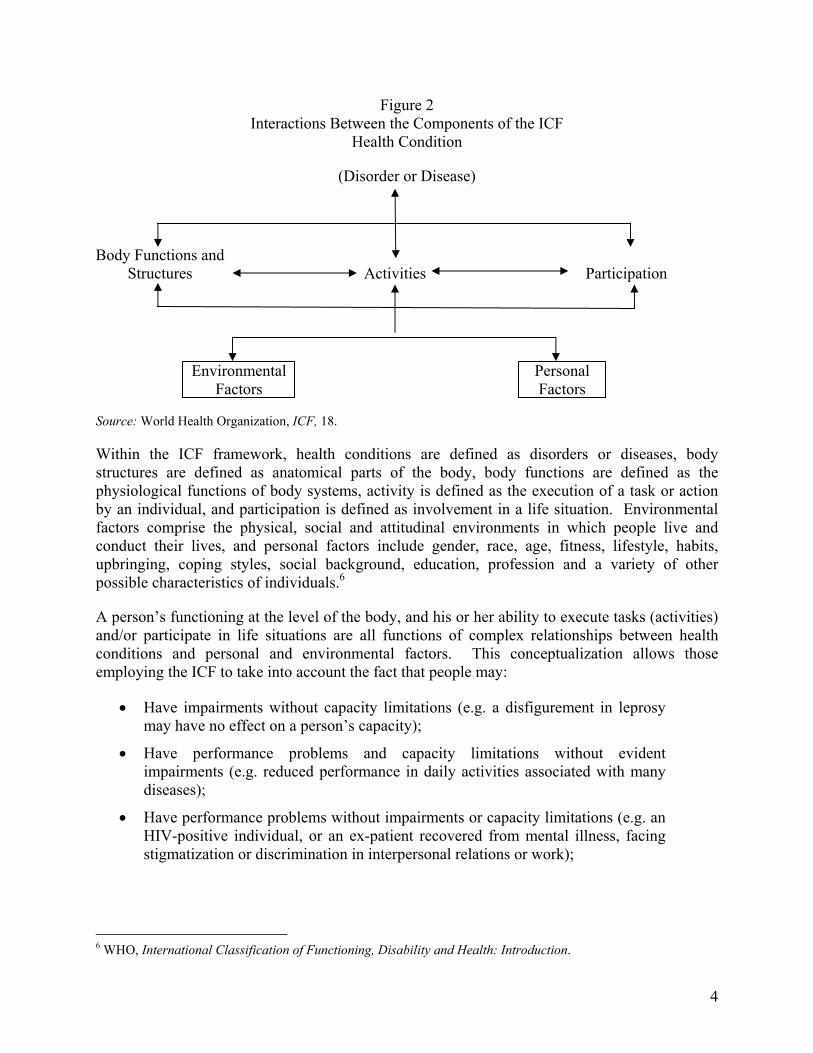
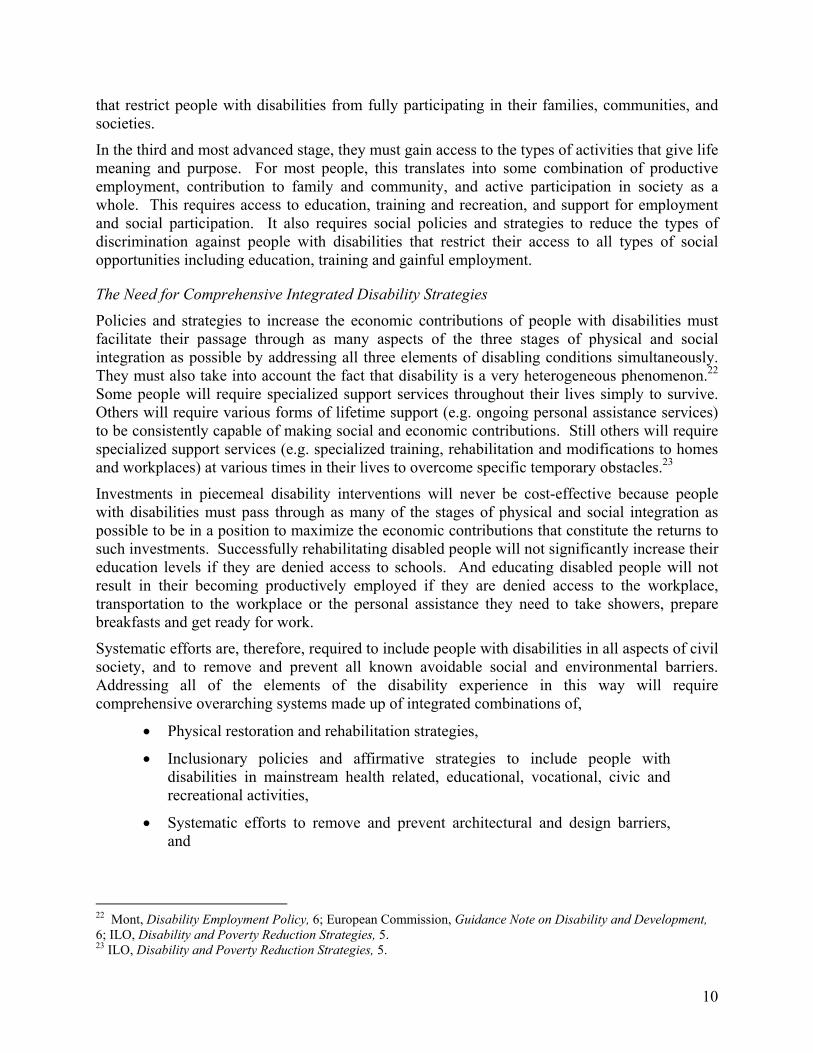
Figure 2 Interactions Between the Components of the ICF
Health Condition
(Disorder or Disease)
Body Functions and Structures Activities Participation
Environmental Personal Factors Factors Source: World Health Organization, ICF, 18.
Within the ICF framework, health conditions are defined as disorders or diseases, body structures are defined as anatomical parts of the body, body functions are defined as the physiological functions of body systems, activity is defined as the execution of a task or action by an individual, and participation is defined as involvement in a life situation. Environmental factors comprise the physical, social and attitudinal environments in which people live and conduct their lives, and personal factors include gender, race, age, fitness, lifestyle, habits, upbringing, coping styles, social background, education, profession and a variety of other possible characteristics of individuals.6
A person’s functioning at the level of the body, and his or her ability to execute tasks (activities) and/or participate in life situations are all functions of complex relationships between health conditions and personal and environmental factors. This conceptualization allows those employing the ICF to take into account the fact that people may:
• Have impairments without capacity limitations (e.g. a disfigurement in leprosy may have no effect on a person’s capacity);
• Have performance problems and capacity limitations without evident impairments (e.g. reduced performance in daily activities associated with many diseases);
• Have performance problems without impairments or capacity limitations (e.g. an HIV-positive individual, or an ex-patient recovered from mental illness, facing stigmatization or discrimination in interpersonal relations or work);
4
6 WHO, International Classification of Functioning, Disability and Health: Introduction.
• Have capacity limitations without assistance, and no performance problems in the current environment (e.g. an individual with mobility limitations may be provided by society with assistive technology to move around);
• Experience a degree of influence in a reverse direction (e.g. lack of use of limbs can cause muscle atrophy; institutionalization may result in loss of social skills).7
Though the ICF is rather cumbersome, and, therefore, remains somewhat of a work in progress, it is based on the most accurate conceptualization of disability currently available and, therefore, appears to embody the best conceptual framework available for data collection and policy research related to disability and development.
DISABILITY DATA
The ICIDH and ICF were designed to provide standardized disability definitions to be systematically employed in data collection strategies using the United Nations Framework for Integration of Social, Demographic and Related Statistics.8 Despite the advances in the conceptualization of disability embodied in the ICIDH and ICF, the formulation of disability policy is still significantly hampered by inadequate disability data and statistics.
Though disability researchers had been aware of the inadequacy of disability data for decades, formal evidence on a global scale was first provided by the creation of the United Nations Disability Statistics Data Base (DISTAT-1) in 1988. This database included national data from population censuses, household surveys and registration systems from 67 studies in 55 countries during the period 1975-87. The DISTAT-2, an extension of the DISTAT-1, now includes at least 179 national studies on disability from virtually all regions of the world. Unfortunately, these data have been found by researchers at the United Nations to be scarce, random and inadequate for analyses of national and regional disabled populations, or for comparisons of the circumstances of people with disabilities across social and geographic categories.9
Researchers at the United Nations Statistical Office (now the United Nations Statistical Division) have also found that differences in the types of disability screens employed in the survey instruments used by different countries have resulted in data unsuitable for cross-country comparisons. This problem has arisen because there have been two types of screens used by countries to identify people with disabilities, impairment screens and disability screens. Impairment screens, which ask respondents to identify losses or abnormalities of body structure or physiological or psychological function, are more prevalent in developing countries. Disability screens, which ask respondents to identify their activity limitations, are more prevalent in more economically advantaged countries. These differences in disability screens have caused a significant downward bias in the disability proportion estimates for the world’s less economically advantaged countries for the following reasons:
[Disability screens] for identifying disabled persons in surveys lead to higher rates of disability than do [impairment screens]. This is because a single question assessing functional limitations, or disability, typically embraces behaviours
7 Ibid., 19. 8United Nations, Toward a System of Social and Demographic Statistics. 9 UNSD, The collection and dissemination of statistics on disability at the UNSD, 4 and UNSO, Disability Statistics Compendium, 30.
5
associated with a broad range of impairment conditions. “Difficulty climbing stairs”, for example, may be due to musculo-skeletal, visceral, disfigurement or other impairments. Impairment screening questions, in contrast, are more directly related to specific conditions. For example, “profound visual impairment of both eyes”, or blindness, as well as “profound hearing loss in both ears”, or deafness, are all highly specified descriptions of relatively unique impairment conditions. It appears to be easier for individuals to initially discuss whether they have difficulty climbing stairs, or hearing conversations across a dining table, than it is to describe specific impairment conditions. In addition, disability questions seem to throw out a wider net which captures more reports of mild and moderate disablement. In order to cover the same ground that one or two disability questions can cover during a survey interview, a number of more detailed impairment questions must be utilized.10
In an effort to improve the collection of disability data in developing countries, the United Nations Statistical Division formed the Washington Group on Disability Statistics consisting of representatives from national statistical agencies. The World Bank has provided support for this group to help arrange regional meetings, subsidize the attendance of developing country representatives and to conduct field tests of the questions. The group is now working on two tasks aimed at developing disability measurements that will be comparable cross-nationally. First, in order to facilitate the gathering of basic disability information throughout the world, the group is guiding the process of developing a small set of general disability measures for use in censuses and sample based national surveys. Second, the group is preparing recommendations for extended sets of survey items related to general measures that can be used as components of population surveys or supplements to specialty surveys. The ICF framework will be used to develop the measures.
DISABILITY DEMOGRAPHICS
Measuring national, regional and global, disability populations is virtually impossible at this time due to the above-mentioned problems with disability data and definitions. More sophisticated statistical analyses of specific issues related to the demographics of disability are even more problematic. In the absence of adequate data, conflicting claims are made about total disability populations, the geographic distribution of people with disabilities, and about their age, gender, education and employment profiles.11 To avoid having this discussion of the relationships between disability and development become lost in a quagmire of conflicting statistical estimates, the author will confine his discussion of the demographics of disability to general population estimates.
10 UNSO, Disability Statistics Compendium, 28. 11 Elwan, Poverty and Disability, 7, 8, 10; Eide, et al, Living conditions among people with activity limitations in Zimbabwe, 12-13; Eide, van Rooy and Loeb, Living conditions among people with activity limitations in Namibia, 10; and Masset and White, “Are Chronically Poor People being Left Out of Progress Towards the Millennium Development Goals (MDG)?, 291-2.
6
Global, Regional and National Disability Populations
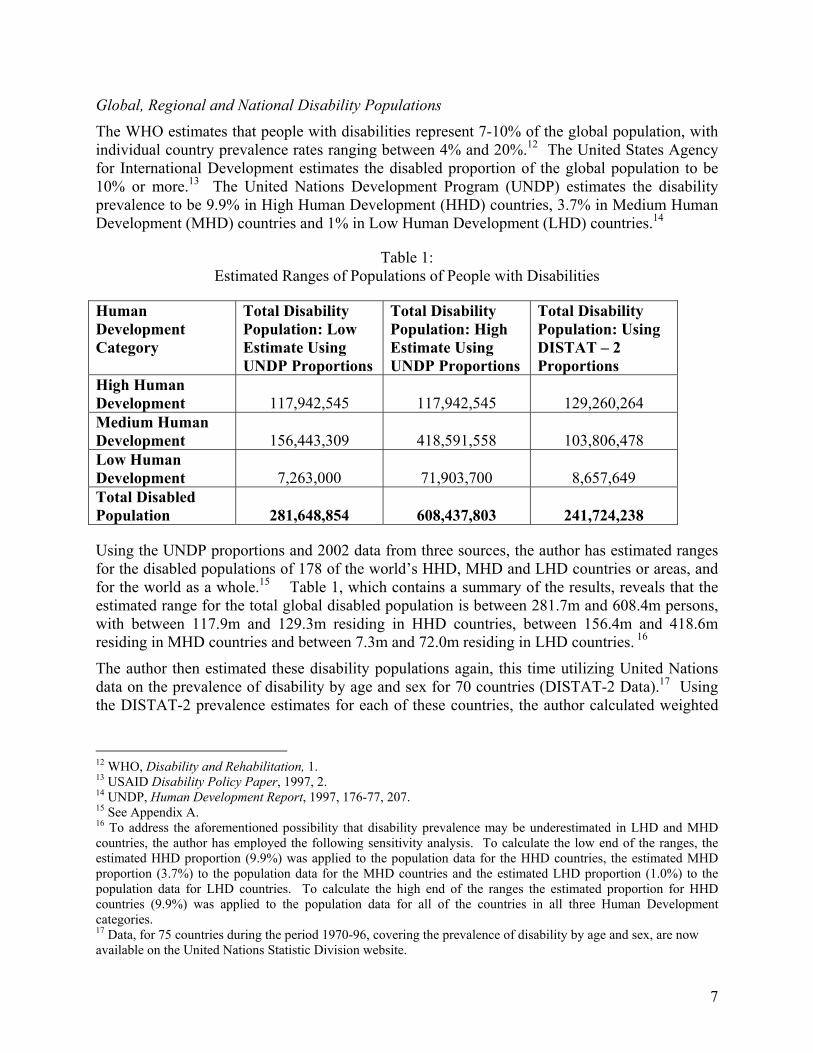
The WHO estimates that people with disabilities represent 7-10% of the global population, with individual country prevalence rates ranging between 4% and 20%.12 The United States Agency for International Development estimates the disabled proportion of the global population to be 10% or more.13 The United Nations Development Program (UNDP) estimates the disability prevalence to be 9.9% in High Human Development (HHD) countries, 3.7% in Medium Human Development (MHD) countries and 1% in Low Human Development (LHD) countries.14
Table 1: Estimated Ranges of Populations of People with Disabilities
Human Development Category
Total Disability Population: Low Estimate Using UNDP Proportions
Total Disability Population: High Estimate Using UNDP Proportions
Total Disability Population: Using DISTAT – 2 Proportions
High Human Development
117,942,545
117,942,545
129,260,264
Medium Human Development
156,443,309
418,591,558
103,806,478
Low Human Development
7,263,000
71,903,700
8,657,649
Total Disabled Population
281,648,854
608,437,803
241,724,238
Using the UNDP proportions and 2002 data from three sources, the author has estimated ranges for the disabled populations of 178 of the world’s HHD, MHD and LHD countries or areas, and for the world as a whole.15 Table 1, which contains a summary of the results, reveals that the estimated range for the total global disabled population is between 281.7m and 608.4m persons, with between 117.9m and 129.3m residing in HHD countries, between 156.4m and 418.6m residing in MHD countries and between 7.3m and 72.0m residing in LHD countries. 16
The author then estimated these disability populations again, this time utilizing United Nations data on the prevalence of disability by age and sex for 70 countries (DISTAT-2 Data).17 Using the DISTAT-2 prevalence estimates for each of these countries, the author calculated weighted
12 WHO, Disability and Rehabilitation, 1. 13 USAID Disability Policy Paper, 1997, 2. 14 UNDP, Human Development Report, 1997, 176-77, 207. 15 See Appendix A. 16 To address the aforementioned possibility that disability prevalence may be underestimated in LHD and MHD countries, the author has employed the following sensitivity analysis. To calculate the low end of the ranges, the estimated HHD proportion (9.9%) was applied to the population data for the HHD countries, the estimated MHD proportion (3.7%) to the population data for the MHD countries and the estimated LHD proportion (1.0%) to the population data for LHD countries. To calculate the high end of the ranges the estimated proportion for HHD countries (9.9%) was applied to the population data for all of the countries in all three Human Development categories. 17 Data, for 75 countries during the period 1970-96, covering the prevalence of disability by age and sex, are now available on the United Nations Statistic Division website.
7
averages of the prevalence estimates in each of the Human Development Categories.18 The resulting aggregate prevalence estimates were 10.85% for HHD countries, 2.46% for MHD countries and 1.19% for LHD countries. These proportions were then applied to the total population estimates for all 178 countries for which the UNDP prevalence estimates were used. This process resulted in an estimated global disabled population of 241.7m, of which 129m were estimated to reside in HHD countries, 104m in MHD countries, and 8.7m in LHD countries.
The combined results of the two analyses suggest that the total global disabled population is between 241.7m and 608.4m, with a combined total of between 112.5m and 490.5m disabled people residing in LHD and MHD (i.e. developing) countries. The World Health Organization estimates that there are 600m people with disabilities in the world, and that 480m of them live in low-income countries.19 This would put the WHO estimate at the very highest end of the range estimated by the author.
THE ECONOMIC COSTS OF DISABILITY
Disability tends to reduce economic output by reducing or eliminating the economic contributions of certain members of society, particularly people with disabilities and their family members and close friends. The amount by which economic output is reduced in this way constitutes the net economic cost of disability. It is inappropriate when estimating the economic costs of disability to add the costs of disability activities because disability activities are economic activities, which generate economic output and income just like other economic activities. Nevertheless, expenditures on disability are typically viewed as constituting an economic burden. This likely stems from the fact that most expenditures on disability have traditionally come either from government budgets, making them burdensome to taxpayers, or charitable remittances, making them charity, which necessarily implies a burden. Also, disability services have traditionally been viewed, not as investments in people with disabilities for which society should expect a return, but as unavoidable costs for their care. This reduces the economic potential of disability activities, turning what should be investments into burdensome expenditures.
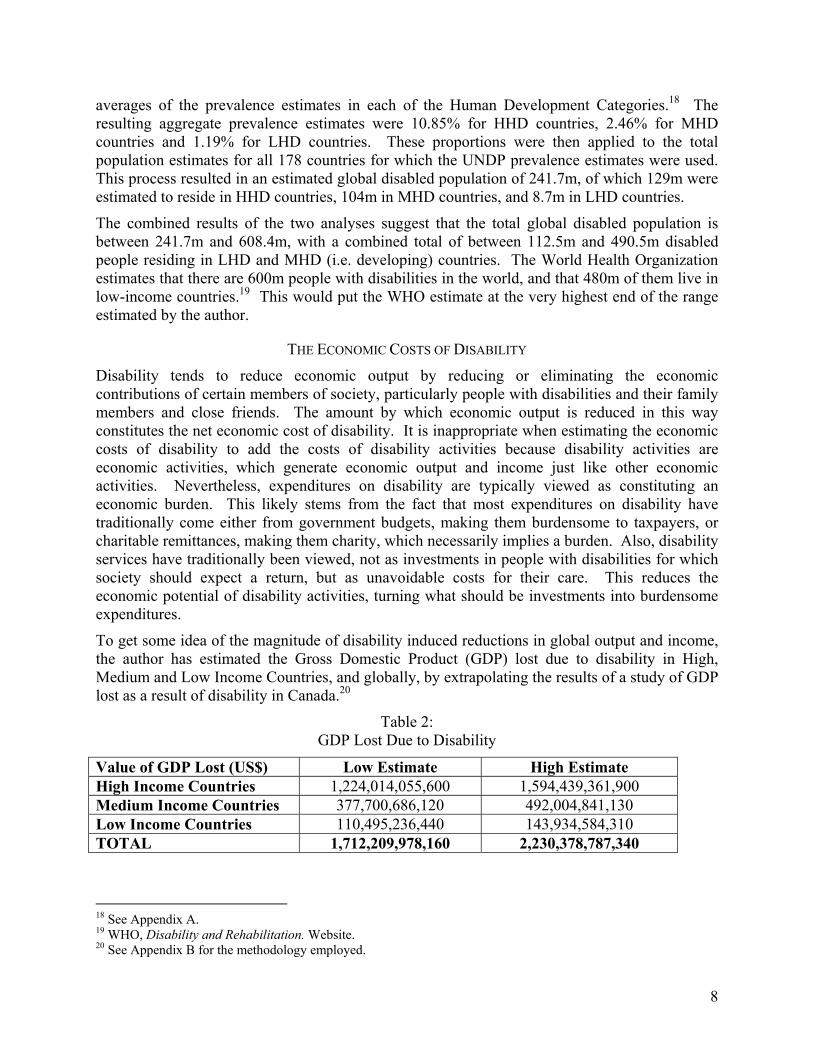
To get some idea of the magnitude of disability induced reductions in global output and income, the author has estimated the Gross Domestic Product (GDP) lost due to disability in High, Medium and Low Income Countries, and globally, by extrapolating the results of a study of GDP lost as a result of disability in Canada.20
Table 2: GDP Lost Due to Disability
Value of GDP Lost (US$) Low Estimate High Estimate High Income Countries 1,224,014,055,600 1,594,439,361,900 Medium Income Countries 377,700,686,120 492,004,841,130 Low Income Countries 110,495,236,440 143,934,584,310 TOTAL 1,712,209,978,160 2,230,378,787,340
18 See Appendix A. 19 WHO, Disability and Rehabilitation. Website. 20 See Appendix B for the methodology employed.
8
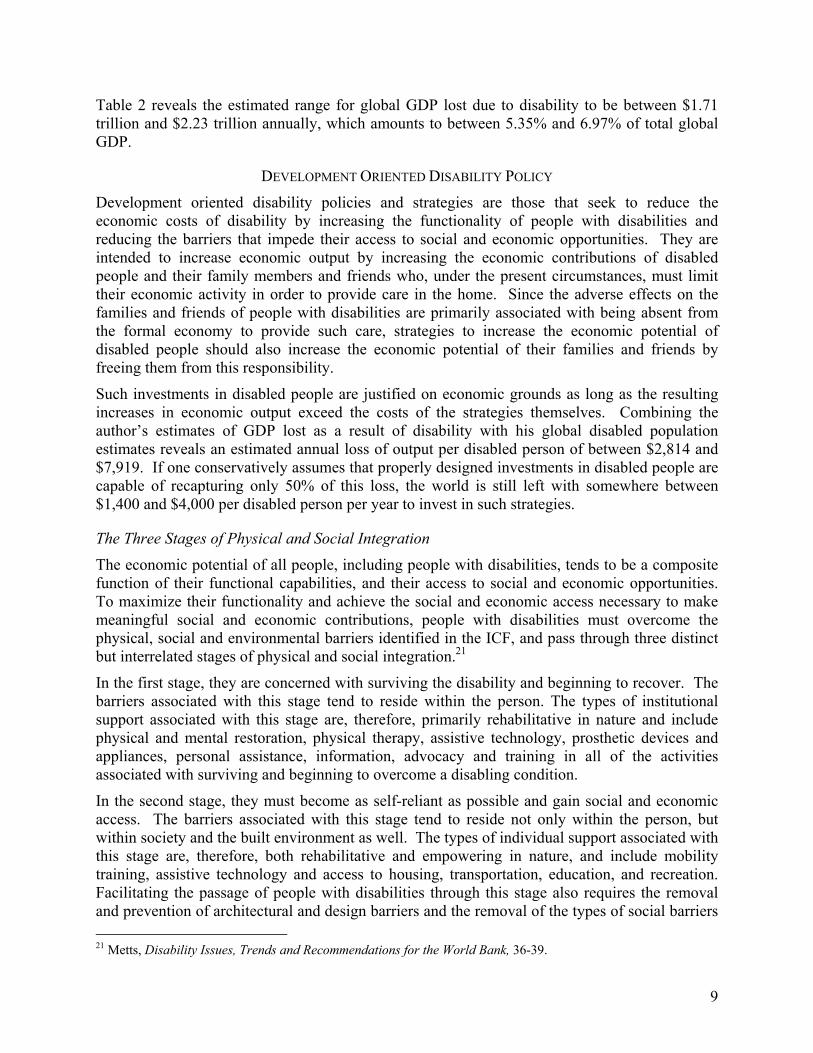
Table 2 reveals the estimated range for global GDP lost due to disability to be between $1.71 trillion and $2.23 trillion annually, which amounts to between 5.35% and 6.97% of total global GDP.
DEVELOPMENT ORIENTED DISABILITY POLICY
Development oriented disability policies and strategies are those that seek to reduce the economic costs of disability by increasing the functionality of people with disabilities and reducing the barriers that impede their access to social and economic opportunities. They are intended to increase economic output by increasing the economic contributions of disabled people and their family members and friends who, under the present circumstances, must limit their economic activity in order to provide care in the home. Since the adverse effects on the families and friends of people with disabilities are primarily associated with being absent from the formal economy to provide such care, strategies to increase the economic potential of disabled people should also increase the economic potential of their families and friends by freeing them from this responsibility.
Such investments in disabled people are justified on economic grounds as long as the resulting increases in economic output exceed the costs of the strategies themselves. Combining the author’s estimates of GDP lost as a result of disability with his global disabled population estimates reveals an estimated annual loss of output per disabled person of between $2,814 and $7,919. If one conservatively assumes that properly designed investments in disabled people are capable of recapturing only 50% of this loss, the world is still left with somewhere between $1,400 and $4,000 per disabled person per year to invest in such strategies.
The Three Stages of Physical and Social Integration
The economic potential of all people, including people with disabilities, tends to be a composite function of their functional capabilities, and their access to social and economic opportunities. To maximize their functionality and achieve the social and economic access necessary to make meaningful social and economic contributions, people with disabilities must overcome the physical, social and environmental barriers identified in the ICF, and pass through three distinct but interrelated stages of physical and social integration.21
In the first stage, they are concerned with surviving the disability and beginning to recover. The barriers associated with this stage tend to reside within the person. The types of institutional support associated with this stage are, therefore, primarily rehabilitative in nature and include physical and mental restoration, physical therapy, assistive technology, prosthetic devices and appliances, personal assistance, information, advocacy and training in all of the activities associated with surviving and beginning to overcome a disabling condition.
In the second stage, they must become as self-reliant as possible and gain social and economic access. The barriers associated with this stage tend to reside not only within the person, but within society and the built environment as well. The types of individual support associated with this stage are, therefore, both rehabilitative and empowering in nature, and include mobility training, assistive technology and access to housing, transportation, education, and recreation. Facilitating the passage of people with disabilities through this stage also requires the removal and prevention of architectural and design barriers and the removal of the types of social barriers 21 Metts, Disability Issues, Trends and Recommendations for the World Bank, 36-39.
9
that restrict people with disabilities from fully participating in their families, communities, and societies.
In the third and most advanced stage, they must gain access to the types of activities that give life meaning and purpose. For most people, this translates into some combination of productive employment, contribution to family and community, and active participation in society as a whole. This requires access to education, training and recreation, and support for employment and social participation. It also requires social policies and strategies to reduce the types of discrimination against people with disabilities that restrict their access to all types of social opportunities including education, training and gainful employment.
The Need for Comprehensive Integrated Disability Strategies
Policies and strategies to increase the economic contributions of people with disabilities must facilitate their passage through as many aspects of the three stages of physical and social integration as possible by addressing all three elements of disabling conditions simultaneously. They must also take into account the fact that disability is a very heterogeneous phenomenon.22 Some people will require specialized support services throughout their lives simply to survive. Others will require various forms of lifetime support (e.g. ongoing personal assistance services) to be consistently capable of making social and economic contributions. Still others will require specialized support services (e.g. specialized training, rehabilitation and modifications to homes and workplaces) at various times in their lives to overcome specific temporary obstacles.23
Investments in piecemeal disability interventions will never be cost-effective because people with disabilities must pass through as many of the stages of physical and social integration as possible to be in a position to maximize the economic contributions that constitute the returns to such investments. Successfully rehabilitating disabled people will not significantly increase their education levels if they are denied access to schools. And educating disabled people will not result in their becoming productively employed if they are denied access to the workplace, transportation to the workplace or the personal assistance they need to take showers, prepare breakfasts and get ready for work.
Systematic efforts are, therefore, required to include people with disabilities in all aspects of civil society, and to remove and prevent all known avoidable social and environmental barriers. Addressing all of the elements of the disability experience in this way will require comprehensive overarching systems made up of integrated combinations of,
• Physical restoration and rehabilitation strategies,
• Inclusionary policies and affirmative strategies to include people with disabilities in mainstream health related, educational, vocational, civic and recreational activities,
• Systematic efforts to remove and prevent architectural and design barriers, and
22 Mont, Disability Employment Policy, 6; European Commission, Guidance Note on Disability and Development, 6; ILO, Disability and Poverty Reduction Strategies, 5. 23 ILO, Disability and Poverty Reduction Strategies, 5.
10
• Cost-effective strategies to provide personal assistance and assistive technology.
Physical restoration and rehabilitation strategies: Physical restoration and rehabilitation strategies are necessary to facilitate the passage of people with disabilities through the first two stages of physical and social integration. In the economically advantaged countries, activities in this area tend to attract the most resources, arguably at the expense of equally important activities to alter the social and environmental contexts of disability. In developing countries where resources are scarce physical restoration and rehabilitation tend to be unavailable to most people with disabilities, with devastating consequences on their functionality and socio-economic status. Development oriented disability policies must embody a recognition of the fact that physical restoration and rehabilitation are necessary but not sufficient conditions for increasing the social and economic output of people with disabilities. Policymakers must, therefore, seek to provide them in the right amounts at the right times in combination with the remaining elements of the overarching strategy.
Inclusionary policies and strategies: People with disabilities in most societies have long been subjected to social and economic discrimination that tends to limit their access to social and economic opportunities. The misperceptions and negative stereotypes underlying this discrimination also contribute to a self re-enforcing climate of low expectations for disabled people that further limits their potential. Overcoming such entrenched discriminatory patterns requires public education and explicit policies and affirmative strategies to foster the inclusion of people with disabilities in all aspects of public life. At the institutional level such commitments are expressed through mandates to recruit and employ people with disabilities, and to design, implement, and evaluate all policies, practices and activities in ways that take into account the needs, rights, and concerns of people with disabilities.
The removal and prevention of architectural and design barriers: Architecture and the design of the built environment are key environmental factors associated with stages one and two of the process of physical and social integration. As suggested by the ICF, the environmental contexts in which disabled people live have direct impacts on their functionality, on the types of activities in which they may engage, and on the levels at which they may participate in their communities and societies.
By restricting the activities available to people with disabilities and limiting their social and economic participation, architecture and design barriers reduce their economic contributions and, therefore, contribute to lost output. They also generate indirect costs in the form of resources needlessly expended to care for disabled people who become either unemployed or under-employed as a result of such barriers, and they reduce the economic output of all members of society during periods of illness, and at times in their life cycles in which they typically experience below normal functional capabilities (e.g. infancy, childhood, motherhood and old age). This group of so-called “special needs users” is estimated by the WHO to comprise more than 25% of the world’s population.24 The benefits of environmental accessibility are, therefore, the associated reductions in all three of these categories of costs.
There is evidence to suggest that the incorporation of Universal Design principles into new construction is the most cost-effective way to improve the accessibility of built environments.25 24 World Health Organization, Report on Disability Prevalence. 25 See Appendix C.
11
Universal Design is a school of thought based on the premise that properly designed built environments cost-effectively serve a much wider range of users than do most of the built environments that exist today. Universal Design proponents argue that today’s built environments are not cost-effective because they artificially create a class of special needs users requiring truly costly special provisions. Believing that it is more cost-effective to address the needs of special needs users in the basic design of projects than to add special provisions to overcome design obstacles that are unnecessary in the first place, they seek to replace traditional accessibility standards with design principles that increase access for everyone.
One of the flagships of Universal Design is the mass transportation system in Curitiba, Brazil. As part of its goal to provide a public transportation system so good that citizens would find little need for private transportation, the city incorporated Universal Design into all of its aspects. The result is a cost-effective system of busses used by disabled people in the same way as their non-disabled peers.26 The 1990 modernization and expansion of the headquarters for the Lighthouse for the Blind in New York City successfully incorporated Universal Design elements, including a highly functional system for guiding blind persons within and around the facility, which included universal signage and symbology and a variety of features designed to accommodate the needs of people with other disabilities. The Lighthouse headquarters is now regarded as a “Universal Design Laboratory” and, as such, continues to generate feedback used in the development and further refinement of the Universal Design principles.27
An illustration of Universal Design by default is the case of Oxo Good Grips Kitchen Utensils, which were designed for persons with limited hand function due to arthritis. The sizes of the handles were increased in a way that created a useful and esthetically attractive product with broad appeal to consumers with a wide range of functional capabilities. Oxo utensils are now marketed successfully to the general population throughout the United States.
Strategies to provide assistive technology and personal assistance services: Because disabilities involve functional limitations, it is often difficult or impossible for people with disabilities to interact with their communities and societies without assistive technology. This technology can be highly technical and disability specific. Often, however, the provision of access for people with disabilities to a mainstream technological innovation is more cost-effective than creating a specialized technology. For example, e-mail has revolutionized the communicative abilities of people with hearing impairments at a fraction of the cost of the highly specialized communication equipment previously developed for their use; and personal computers, the Internet and e-mail have increased the social and economic access of people with impaired verbal capabilities in a similarly cost-effective way. Whether they be specially designed to meet the needs of people with disabilities (e.g. Braille writers, prosthetic devices, wheelchairs and hearing aids) or innovative adaptations of mainstream technological innovations (e.g. e-mail, the Internet and personal computers), assistive technologies are vital to the process of providing social and environmental access to a significant cross-section of people with disabilities.
Many people with disabilities require personal assistance with various activities of daily living to pass through the first two stages of physical and social integration. Costs for providing such services in community settings are typically equal to or lower than the costs associated with
26 Steinfeld, “Public Transportation in Curitiba, Brazil” and Alvarez, Pathways to Accessibility, 18-19. 27 Center for Universal Design, Universal Design File.
12
institutionalized custodial care.28 Moreover, personal assistance services, unlike custodial care, tend to empower disabled people to make social and economic contributions. Because the value of such contributions offsets the public costs of providing the service, investments in personal assistance services are typically more cost-effective than investments in institutionalized custodial care.
In developing countries, the consumers of assistive technology and personal assistance services tend to be poor. The markets for these things have, therefore, tended to be almost non-existent because of the poverty of the consumer base and the previously mentioned scarcity of resources for social programs. This began to change, however, with the 1976 introduction by the WHO of the concept of Community Based Rehabilitation (CBR). CBR strategies have spread throughout the developing world, and they are now as varied as the cultural settings in which they are being applied. Much has been written about CBR. For the purposes of this discussion, however, the following quotation from a researcher engaged in CBR activities worldwide sums up the current situation nicely:
There are arguably as many different types of CBR as there are programmes in existence. Most CBR programmes, however, include the following activities: the selection and training of village-based CBR workers; the identification, assessment and referral, where appropriate, of disabled children and adults; the design of aids and appliances by local craftsmen; and the teaching of simple rehabilitative techniques for use with their disabled child. Awareness raising, public education, counseling, multi-sectoral collaboration, community development and the promotion of integrated education are also key ingredients of CBR programmes. CBR may be integrated into existing health, education or social welfare structures or they may be vertical programmes run by NGOs. Increasingly CBR services are being developed at village level as part of community development programs, with relatively little input from rehabilitation professionals. Although a CBR programme may contain some or all of the ingredients discussed above, its flavour will depend upon the cultural context in which it is implemented. Each programme is therefore unique. Differences exist not only between CBR programmes in different cultures, but also between villages in one geographical area.29
Disability Policy and the Millennium Development Goals
Though the rights and needs of people with disabilities are not specifically addressed in the Millennium Development Goals, at least three of them are directly relevant,
• Eradicating extreme poverty and hunger,
• Achieving universal primary education and
• Developing a global partnership for development.
28 Tobis, Moving from Residential Institutions to Community-Based Social Services in Central and Eastern Europe and the Former Soviet Union, 29 and Fox and Götestam, Redirecting Resources to Community Based Services, i and 1. 29 Miles, “Engaging with the Disability Rights Movement,” 502-3.
13
Eradicating Extreme Poverty and Hunger: There is strong evidence to suggest that disabled people are typically among the poorest of the poor in developing countries. The World Bank, for example, estimates that disabled people make up from 15% to 20% of the poor in developing countries though they typically represent only 10% of the general population.30 The UN estimates that 82% of disabled people live below the poverty line in developing countries.31 The links between disability and poverty are strong, and there is evidence that these links run in both directions.32 Disability fosters poverty by decreasing the functional capabilities of people with disabilities and limiting their access to healthcare, nutrition and social and economic opportunities, particularly education and employment. Poverty fosters disability through inadequate sanitation, malnutrition, limited availability of vaccination programs, poor hygiene, limited availability of health and maternity care, elevated exposure to risks due to war and conflict, and dangerous working and living conditions.
It appears from the data that the two targets associated with this Millennium Development Goal (halving both poverty and hunger by 2015) could be met without including people with disabilities in the effort. The result would simply be that the proportion of the poor consisting of people with disabilities would rise to between 30% and 40%. However, a United Nations study on human rights and disability completed by the Special Rapporteur of the Sub-Commission on Prevention of Discrimination and Protection of Minorities has estimated that the adverse affects of disability impact 25% of the entire population.33 It appears, therefore, that if the proportion of this group that currently lives in poverty is added to the proportion of the total disabled population that currently lives in poverty, it would be difficult if not impossible to meet the poverty and hunger targets without raising the living standards of people with disabilities.
Achieving Universal Primary Education: At present, it is estimated that fewer than 2% of children with disabilities participate in the formal education system.34 To achieve universal primary education, therefore, disabled children must be included.
Developing a Global Partnership for Development: Target 12, which is related to this Millennium Development Goal, is to develop further an open, rule-based, predictable, non-discriminatory trading and financial system. This includes a commitment to good governance, development and poverty reduction-both nationally and internationally. As described in the body of this paper, people with disabilities experience discrimination and elevated rates of poverty. It appears that the poverty rates for people with disabilities are so high, in fact, that the Millennium poverty reduction targets cannot be met without their reduction. Efforts to hit target 12, therefore, necessarily require international and national efforts to reduce poverty amongst disabled people, which is most efficiently accomplished through development oriented disability strategies of the kind discussed in the body of this paper.
DISABILITY PREVENTION
Prevention of disabilities contributes to economic development by decreasing the proportion of the population with the most limited capacity to make economic contributions. However, because disability prevention primarily involves preventing the causes of disability, it tends not 30 Elwan, Poverty and Disability, 15 and World Bank, Challenges Facing the World Today, May 2004. 31 European Commission, Guidance Note on Disability and Development, 1. 32 DFID, Disability, poverty and development, 3. Elwan, Poverty and Disability, 21-24. 33 Despouy, Human Rights and Disabled Persons, as cited in DFID, Disability, poverty and development, 4. 34 UNESCO. Education for All: Is the World On Track?
14
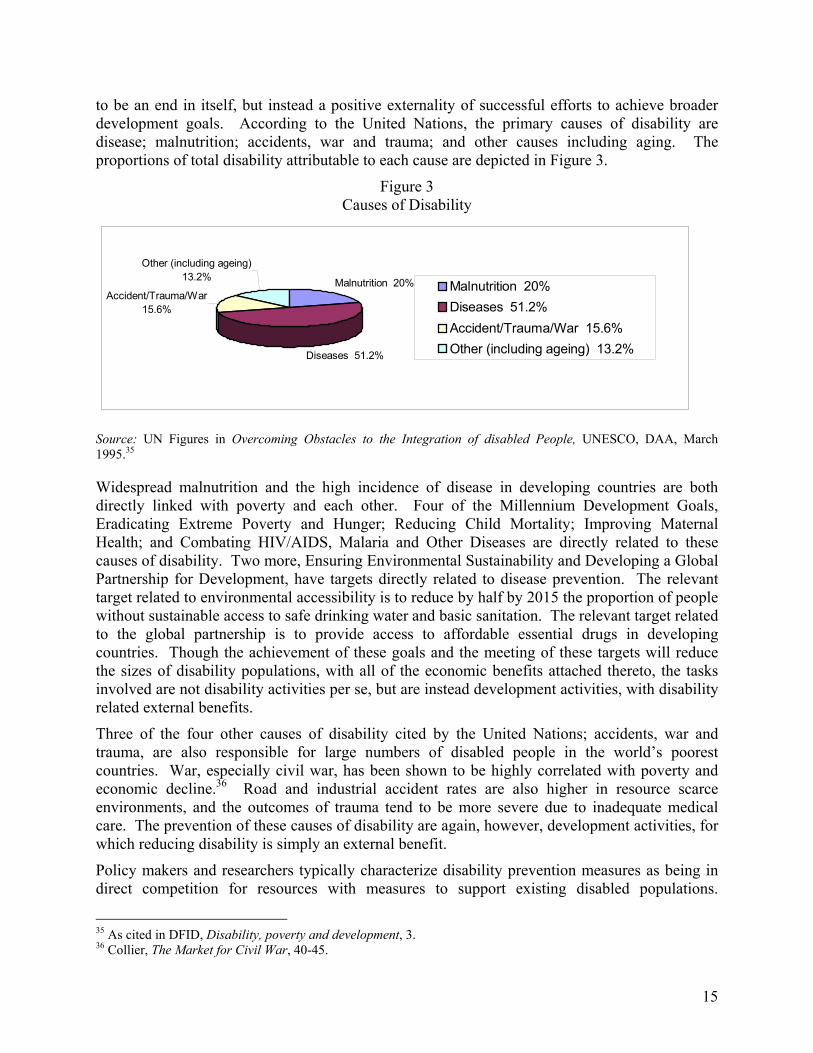
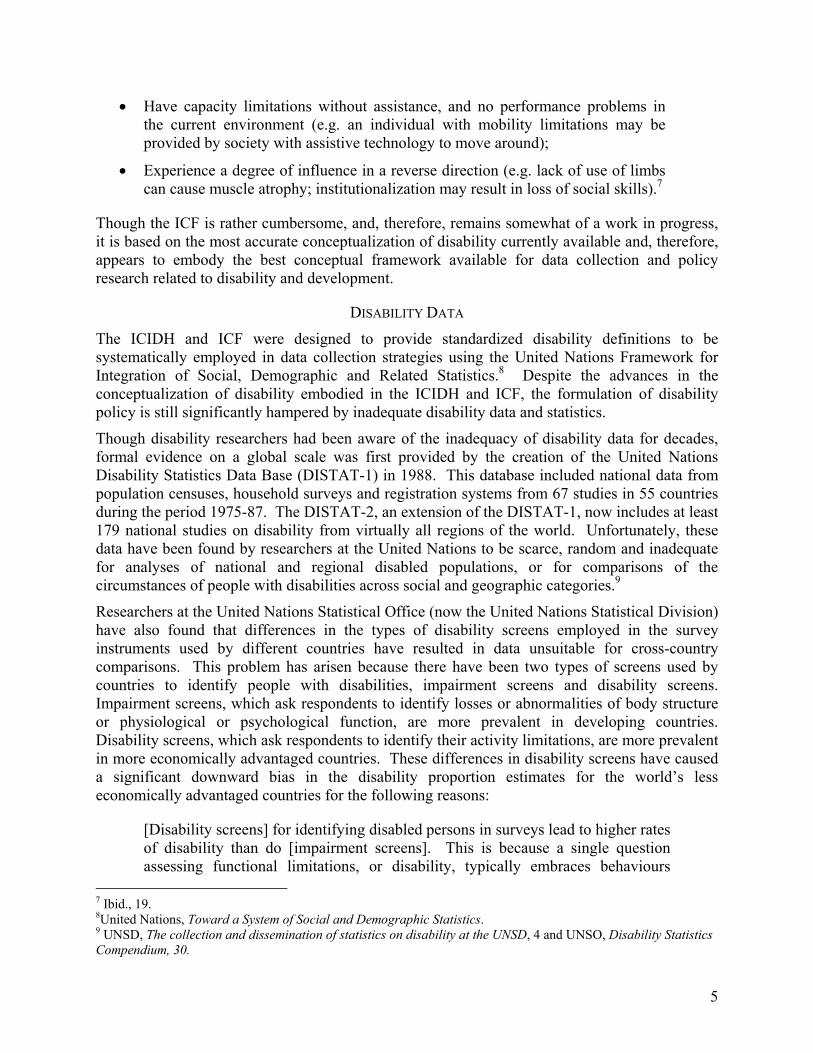
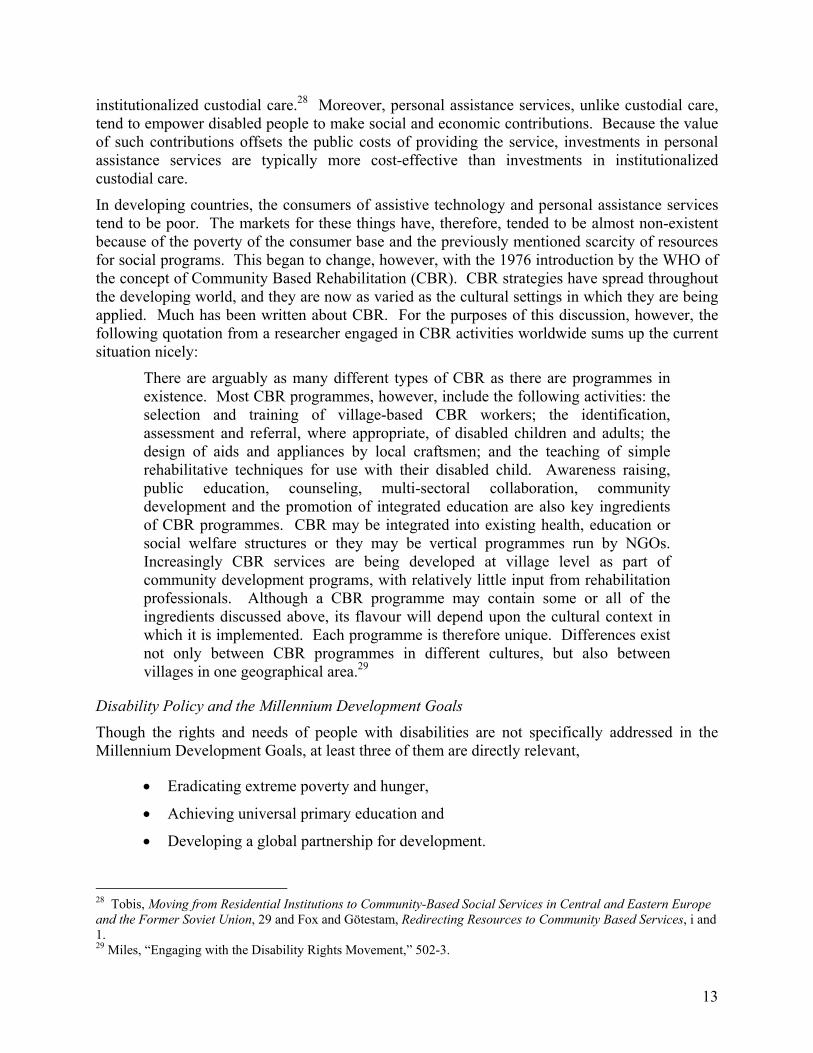
to be an end in itself, but instead a positive externality of successful efforts to achieve broader development goals. According to the United Nations, the primary causes of disability are disease; malnutrition; accidents, war and trauma; and other causes including aging. The proportions of total disability attributable to each cause are depicted in Figure 3.
Figure 3 Causes of Disability
Malnutrition 20%
Diseases 51.2%
Accident/Trauma/War 15.6%
Other (including ageing) 13.2%
Malnutrition 20%Diseases 51.2%Accident/Trauma/War 15.6%Other (including ageing) 13.2%
Source: UN Figures in Overcoming Obstacles to the Integration of disabled People, UNESCO, DAA, March 1995.35
Widespread malnutrition and the high incidence of disease in developing countries are both directly linked with poverty and each other. Four of the Millennium Development Goals, Eradicating Extreme Poverty and Hunger; Reducing Child Mortality; Improving Maternal Health; and Combating HIV/AIDS, Malaria and Other Diseases are directly related to these causes of disability. Two more, Ensuring Environmental Sustainability and Developing a Global Partnership for Development, have targets directly related to disease prevention. The relevant target related to environmental accessibility is to reduce by half by 2015 the proportion of people without sustainable access to safe drinking water and basic sanitation. The relevant target related to the global partnership is to provide access to affordable essential drugs in developing countries. Though the achievement of these goals and the meeting of these targets will reduce the sizes of disability populations, with all of the economic benefits attached thereto, the tasks involved are not disability activities per se, but are instead development activities, with disability related external benefits.
Three of the four other causes of disability cited by the United Nations; accidents, war and trauma, are also responsible for large numbers of disabled people in the world’s poorest countries. War, especially civil war, has been shown to be highly correlated with poverty and economic decline.36 Road and industrial accident rates are also higher in resource scarce environments, and the outcomes of trauma tend to be more severe due to inadequate medical care. The prevention of these causes of disability are again, however, development activities, for which reducing disability is simply an external benefit.
Policy makers and researchers typically characterize disability prevention measures as being in direct competition for resources with measures to support existing disabled populations.
35 As cited in DFID, Disability, poverty and development, 3. 36 Collier, The Market for Civil War, 40-45.
15
Resource allocations made on the basis of this misconception necessarily result in inappropriate allocations of the costs and benefits of disability prevention measures because the benefits accrue to members of society as a whole, who enjoy reductions in their probabilities of experiencing disabling conditions, while the costs accrue only to people who have already become disabled. This, of course, makes no sense, as it is illogical to saddle victims of war with the expenses associated with peace efforts, or accident victims with the costs of highway safety measures. It is equally inappropriate to burden malaria sufferers or those with HIV/AIDS with the costs of preventing malaria and HIV/AIDS. That said, it is still true that, in addition to their other economic and social benefits, efforts to prevent the causes of disability also generate the economic benefits associated with their ability to reduce disability rates.
DEVELOPMENT ORIENTED DISABILITY RESEARCH
Development oriented disability policy emphasizes increasing the economic contributions of disabled people. Therefore, the disability research agenda must be expanded beyond epidemiology, disability prevention and social protection to include the personal, social and environmental issues that affect the ability of people with disabilities to make such contributions. This involves simultaneously engaging in three general categories of research,
• Environmental Access,
• Social and Economic Access, and
• The Provision of Disability Related Goods and Services.
Each category requires its own specialized body of information in addition to accurate detailed demographic data. Census and household survey data must, at the very least, become internationally comparable and adequate for accurately estimating prevalence rates and geographic distributions. Additional data are then necessary to analyze disability as the heterogeneous phenomenon that it is. Disabilities vary across multiple dimensions. Therefore, disability data on at least gender, age, health, education, employment and income, are required across disability types, causes, ages at onset and impacts on functionality. Data collection and analysis in these areas should be designed to facilitate an understanding of the rehabilitation and inclusionary activities necessary to empower people in each type of disability circumstance to maximize their economic and social contributions, which can then be employed to analyze the economic impacts of competing disability policies and strategies.
Environmental Access
Evidence presented earlier suggests that there are significant economic returns to successful efforts to improve the accessibility of built environments, particularly when Universal Design principles are incorporated into new construction. Existing research on the relative costs and benefits of accessible design has demonstrated that research to evaluate the impacts of increasing the accessibility of the built environment is both valuable and easily undertaken.
Some problems do exist, however. For example, the costs of architectural and design barriers in terms of lost output are difficult to isolate from the total output lost due to disability, which is a composite function of all of the interrelated elements that limit the social and economic participation of people with disabilities. It is also difficult to measure the costs of caring for those people with disabilities who become either unemployed or under-employed as a result of
16
inaccessible architecture and design. This is because there are many possible strategies related to such care, including not caring for them at all, imposing responsibility for their care on their families and friends, or removing them from mainstream society to custodial care institutions. Since each strategy has its own structure of costs and benefits, the mix of approaches a society chooses affects the levels of care costs associated with the inaccessibility of its built environments.
The costs of increasing accessibility are easier to measure because improving environmental accessibility involves either retrofitting for accessibility or incorporating accessibility into the original design. The cost of retrofitting is a composite function of the configurations of the structures involved and the types of environments in which they exist. Generally speaking, the proportional cost of retrofitting a structure decreases as the size of the structure increases. The proportional cost of retrofitting a very large building or complex is usually quite small, while the proportional costs of retrofitting a small building can be much higher, occasionally approaching 20% of the building’s value, especially in domestic scale buildings.37 Integrating accessibility into projects at the earliest stages of the design process is almost always much less expensive than retrofitting. The cost of integrating accessibility into new buildings and infrastructure is typically very small, usually less than 1% of the capital development cost. 38
In light of the central importance of environmental access to the success of a development oriented approach to disability, and in light of the apparent cost-effectiveness of incorporating Universal Design principles into new construction, a significant portion of a development oriented research agenda and budget should be earmarked for research in this field. A useful initial activity for an institution like the World Bank would be to develop and employ a standardized and user-friendly research methodology for estimating and assessing the economic and social impacts of activities that affect environmental accessibility.
Social and Economic Access
The removal and prevention of social and economic access barriers for people with disabilities involves engaging in activities to increase access in all aspects of each of the following areas of civil society:
• Healthcare • Education and training • Employment • Housing • Political processes • Legal processes • Government services • Transportation • Recreation
The initial research agenda related to social and economic access should include, at the very least, strategies to measure the baseline circumstances of people with disabilities in each of these
37 South African Disability Institute, Special Housing for Disabled People, data provided by Philip Thompson, Africa Chair, International Comission on Technology and Accessibility. 38 Based on evaluations by the Department of Public Works in South Africa, presented in Appendix C.
17
areas of civil society, and to determine the nature of the social barriers they face in each, if any. Despite the existence of specific disability issues related to each area, there are four types of barriers that they all share:
• Barriers to physical access • Inhibitory policies and legislation • Discrimination • Limited expectations
Research into disability access will necessarily involve efforts to identify and understand the effects on people with disabilities of each type of barrier in each area of civil society. It will also involve additional research into their interconnectivities. This is because the different barriers tend to act together in mutually reinforcing ways. For example, blind people were legally prevented from signing binding documents when the author first visited Kenya in 1982 because they could not see what they were signing. In this case, limited expectations resulted in discriminatory legislation that limited the ability of blind people to have checking accounts, sign employment contracts, buy houses, etc. When the author first consulted with the International Labor Organization in 1993, the street entrance of its Geneva Headquarters was not made accessible because it was for people who arrived on the bus, which was not accessible. Here, one physical barrier spawned another. In the late 1960s in the United States, when quadriplegics first begin to survive their injuries, regulations prevented them from flying on commercial airliners because it was thought that they could not physically board the aircraft. Here, a physical barrier led to a discriminatory regulation. Many more cumulative effects exist.
Research in this area necessarily spans all fields relevant to public policy. Therefore, a development oriented approach to this research must begin with systematic efforts to educate policymakers and researchers in all fields on disability issues. The Poverty Reduction Strategy Paper (PRSP) process and the system of Country Assistance Strategies used to assess needs for concessionary assistance from the World Bank and the International Monetary Fund (IMF) provide appropriate vehicles for initiating such integrated and coordinated approaches to disability, while simultaneously opening channels for disabled people to begin to have a voice in the allocation of development resources.39
The Provision of Disability Related Goods and Services
The previous two categories of disability activities involved altering society as a whole to render it more accommodative to the needs of people with disabilities. This category involves providing disabled people with the goods and services required to maximize their functionality and make social and economic contributions.
For the purposes of this discussion, disability related goods and services may be viewed as falling into two broad categories. One is medical and rehabilitative in nature. Goods and services in this category include medical interventions related to physical restoration, prosthetics and orthodics. Their provision tends to be expensive because of the skills and technology involved in their production. The other category has to do with the provision of information, training, assistive technology, personal assistance and advocacy. The provision of these goods
39 For an in depth discussion of the advantages of including disability issues in the PRSP process, see ILO, Disability and Poverty Reduction Strategies.
18
and services tends to be less technical and skill intensive and, therefore, less costly than those of the first type.
Since both categories involve microeconomic activities associated with providing goods and services, research in this area should focus on the traditional microeconomic issues of productive and allocative efficiency, externalities of production and consumption, and forward and backward economic linkages. Productive efficiency research in this area should be concerned with improving the quality and driving down the costs of production of physical restoration, prosthetics and orthotics, information, training, personal assistance and advocacy. Research related to allocative efficiency should be concerned with increasing the total utility derived from the mix of goods produced.
CBR deserves close scrutiny for best practices in the provision of disability goods and services not only in terms of productive and allocative efficiency, but also in terms of its ability to generate positive externalities and forward and backward linkages. Unlike formal or institution based rehabilitation strategies CBR strategies often produce unanticipated positive social and economic outcomes. For example, in a refugee camp the author visited in northern Kenya, a CBR program put in a garden for rehabilitation purposes. The garden was so successful that the eventual sale of produce funded other program activities at the camp. A charity based prosthetics producer and distributor in Nairobi recognized that its factory and office had become a gathering place for people with disabilities, and took advantage of that fact by offering the facilities to the local disability community to house a full fledged CBR program. Some programs pay family members to get their disabled children to school, thus simultaneously educating the disabled children and generating income for their families. In the resource scarce environments in which CBR is typically applied, the consumers are normally cost conscious and, often, creative. With proper incentives, these traits can be translated into increased efficiency, and constructive employment of externalities and economic linkages.
The Work of the International Development Community The inclusion of people with disabilities in all aspects of mainstream society is a new concept that will ultimately require widespread acceptance of a new way of thinking about people with disabilities. In this way, it is much like the ongoing effort to increase social and economic access for women. The common thread that has stitched together all of the efforts around the world to provide equal social and economic access for women was the resolve of the international development community. This resolve manifested itself in policies at the international agencies themselves to include women in all aspects of everything they do, and in requirements that women be included in the work of all subcontractors and beneficiaries. The gender strategies and programs initiated by the international development institutions were designed to contain measurable objectives to be used in analyses aimed at improving future efforts.
Though the circumstances of people with disabilities are not identical to the circumstances of women, the need for explicit commitments to their inclusion in the mainstream activities of the international development organizations is at least as strong and probably stronger because of the wide range of technical issues that must be addressed to increase the functionality of people with disabilities, improve the accessibility of built environments and to increase their access to social and economic opportunities. For such a commitment to be serious and sustainable, it must be accompanied by affirmative inclusionary strategies with measurable outcomes that can be used to evaluate the strategies and improve them over time.
19
APPENDIX A NATIONAL AND GLOBAL DISABLED POPULATION ESTIMATES
Using disability data collected by the United Nations Statistics Division (UNSD) and general population data collected by the United Nations Development Program (UNDP), the author has estimated the total global disabled population and the disabled populations of the 178 countries or areas that have been classified in the UNDP Human Development Index. The author has then estimated the same populations using prevalence estimates from the DISTAT-2 database.
Methodology
The disabled populations of 178 countries have been estimated by multiplying United Nations population estimates for each country by estimated disability proportions derived by UNDP in the 1997 Human Development Report.
Countries are annually categorized by UNDP as either High Human Development (HHD), Medium Human Development (MHD) or Low Human Development (LHD) using a Human Development Index (HDI) which measures a country’s average achievements in three dimensions of human development: longevity, knowledge, and standard of living. UNDP has estimated the following proportional rates of disability for HHD, MHD and LHD countries:40
HHD: 9.9%. MHD: 3.7% LHD: 1.0%.
It is possible to estimate the disabled population of a country by multiplying its total population by the proportional disability rate assigned to its HDI category by UNDP. Research conducted by the UNSD, however, strongly suggests that the resulting estimates of the disabled populations of the MHD and LHD countries are likely to understate their actual disabled populations because of a systematic downward bias in the UNDP disability proportion estimates caused by differences in disability data collection procedures in HHD, MHD and LHD countries.
The DISTAT-1 was the first attempt of the United Nations Statistic Office (now known as UNSD) to bring together existing national disability data from around the world. There has been no international coordination of the techniques employed in the collection of the DISTAT-1 data. The database contains disability statistics from 55 countries, collected through national household surveys, population censuses, and population or civil registration systems. UNSD research indicates that differences in the types of survey screens employed to identify people with disabilities in the survey instruments used by the different countries have caused significant downward biases in the disability proportion estimates for MHD and LHD countries. To the extent that such biases exist, they will produce downward biases in disability population estimates for MHD and LHD countries based upon the UNDP proportions.
40 UNDP, Human Development Report 1997, 176-77, 207.
20
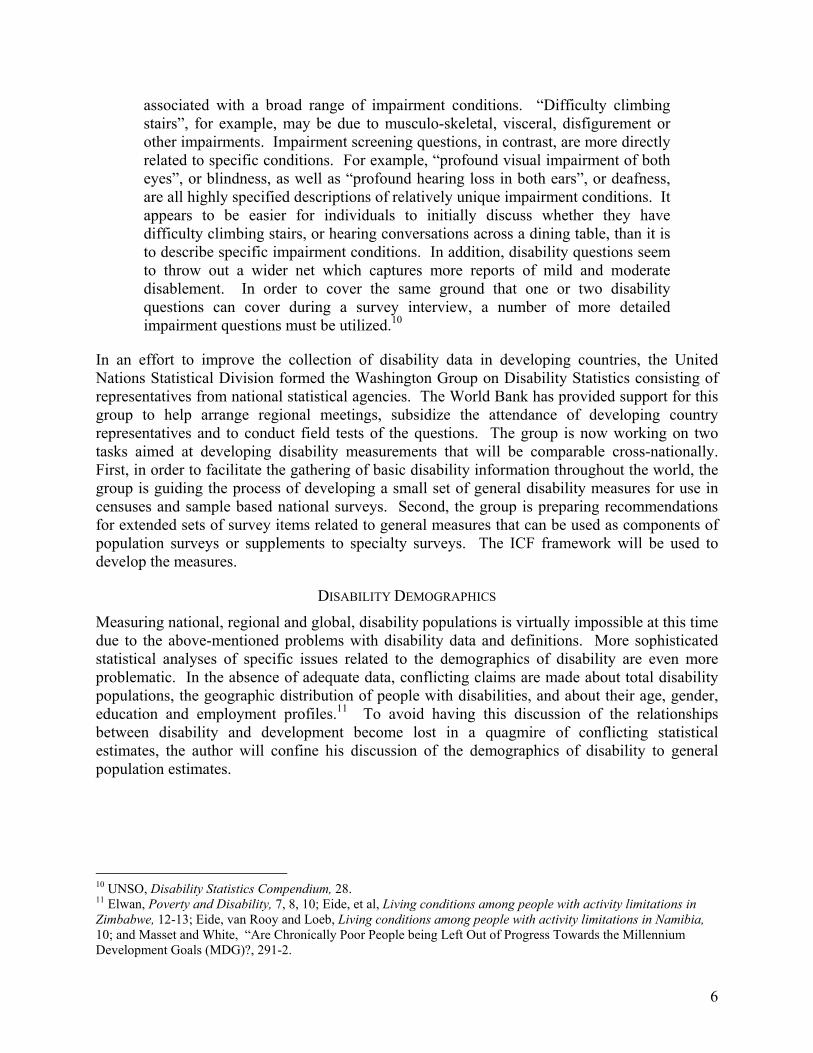
The problem arises because there have been two types of screens used by the participating countries to identify people with disabilities, impairment screens and disability screens. Impairment screens ask respondents to identify losses or abnormalities of body structure or of physiological or psychological function. Disability screens ask respondents to identify their activity limitations. The types of screens chosen have the following effect on the reported rates of disability:
[Disability screens] for identifying disabled persons in surveys lead to higher rates of disability than do [impairment screens]. This is because a single question assessing functional limitations, or disability, typically embraces behaviours associated with a broad range of impairment conditions. “Difficulty climbing stairs”, for example, may be due to musculo-skeletal, visceral, disfigurement or other impairments. Impairment screening questions, in contrast, are more directly related to specific conditions. For example, “profound visual impairment of both eyes”, or blindness, as well as “profound hearing loss in both ears”, or deafness, are all highly specified descriptions of relatively unique impairment conditions. It appears to be easier for individuals to initially discuss whether they have difficulty climbing stairs, or hearing conversations across a dining table, than it is to describe specific impairment conditions. In addition, disability questions seem to throw out a wider net which captures more reports of mild and moderate disablement. In order to cover the same ground that one or two disability questions can cover during a survey interview, a number of more detailed impairment questions must be utilized.41
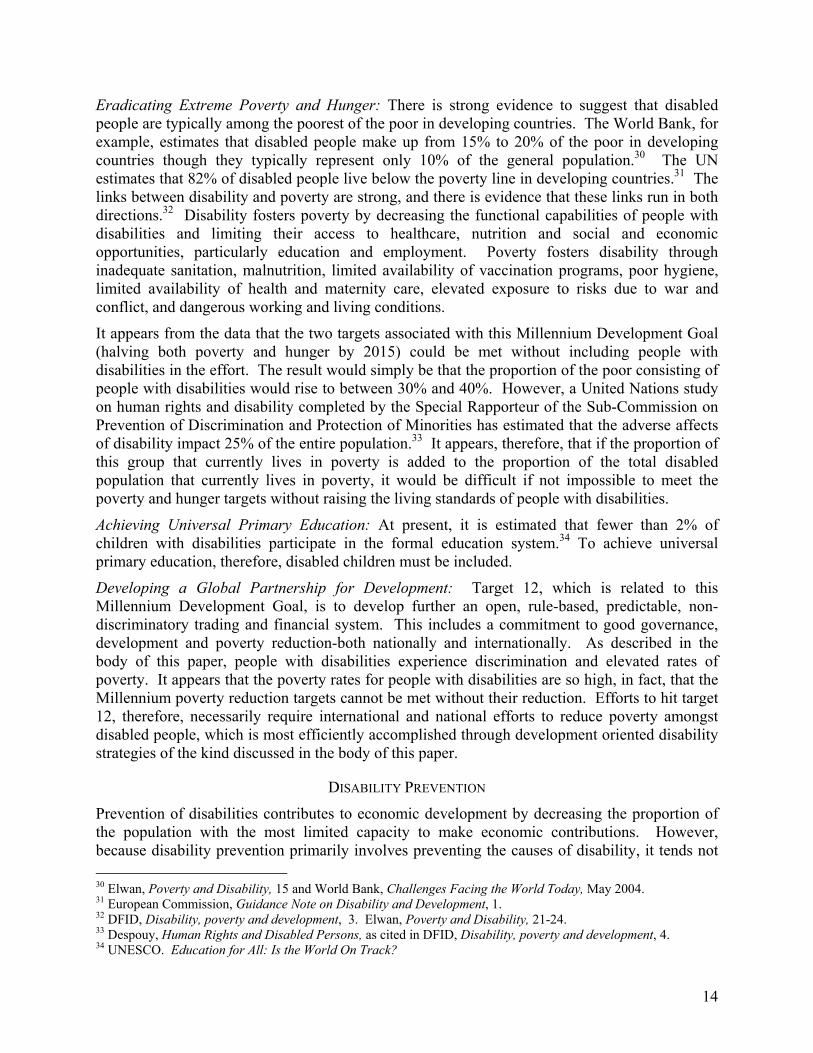
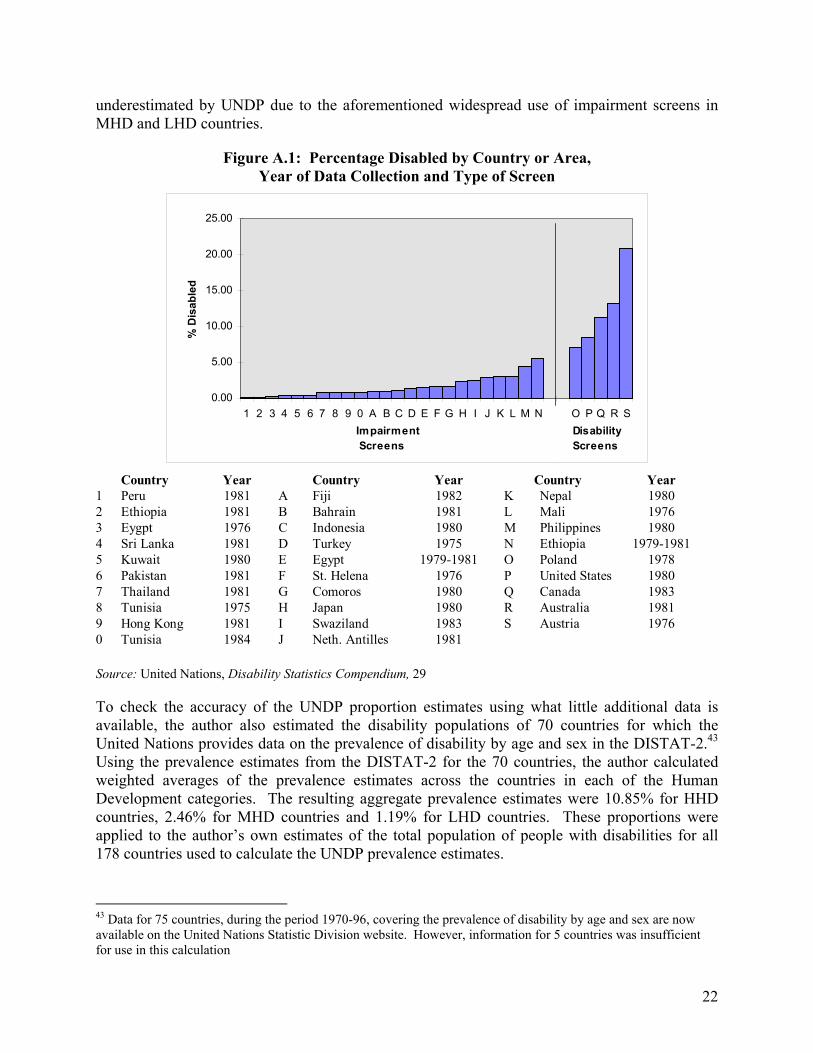
The effects of the screens employed can be seen in Figure A.1 which compares the disability rate estimates of countries that employed survey instruments using impairment screens with those that employed survey instruments using disability screens. The disability rate estimates for countries that employed impairment screens (which ranged from 0.16% to 5.49%) were unambiguously lower than those for countries that employed disability screens (which ranged from 7.10% to 20.88%). The High Human Development countries of Europe and North America tend to employ disability screens, while the Low and Medium Human Development Countries of Africa, Asia and South America tend to employ impairment screens.42 Therefore, at least some of the large and otherwise unexplained differences in the UNDP disability proportion estimates for the HHD, MHD and LHD countries may be attributed to systematic differences in the types of screens used to collect disability data.
To address this problem the author has conducted a sensitivity analysis in which the estimated ranges for the disabled populations of the MHD and LHD countries were calculated. To calculate the low end of the ranges, the estimated HHD proportion (9.9%) was applied to the population data for the HHD countries, the estimated MHD proportion (3.7%) to the population data for the MHD countries and the estimated LHD proportion (1.0%) to the population data for LHD countries. To calculate the high end of the ranges the UNDP estimated proportion for HHD countries (9.9%) was applied to the population data for countries in all three Human Development categories. This was done under the assumption that the relatively high HHD proportion may have actually prevailed in MHD and LHD countries as well, but were probably
41 UNSO, Disability Statistics Compendium, 28. 42 Ibid., 30.
21
underestimated by UNDP due to the aforementioned widespread use of impairment screens in MHD and LHD countries.
Figure A.1: Percentage Disabled by Country or Area, Year of Data Collection and Type of Screen
0.00
5.00
10.00
15.00
20.00
25.00
1 2 3 4 5 6 7 8 9 0 A B C D E F G H I J K L M N O P Q R S Impairment Disability Screens Screens
% D
isab
led
Country Year Country Year Country Year
1 Peru 1981 A Fiji 1982 K Nepal 19802 Ethiopia 1981 B Bahrain 1981 L Mali 19763 Eygpt 1976 C Indonesia 1980 M Philippines 19804 Sri Lanka 1981 D Turkey 1975 N Ethiopia 1979-19815 Kuwait 1980 E Egypt 1979-1981 O Poland 19786 Pakistan 1981 F St. Helena 1976 P United States 19807 Thailand 1981 G Comoros 1980 Q Canada 19838 Tunisia 1975 H Japan 1980 R Australia 19819 Hong Kong 1981 I Swaziland 1983 S Austria 19760 Tunisia 1984 J Neth. Antilles 1981
Source: United Nations, Disability Statistics Compendium, 29
To check the accuracy of the UNDP proportion estimates using what little additional data is available, the author also estimated the disability populations of 70 countries for which the United Nations provides data on the prevalence of disability by age and sex in the DISTAT-2.43 Using the prevalence estimates from the DISTAT-2 for the 70 countries, the author calculated weighted averages of the prevalence estimates across the countries in each of the Human Development categories. The resulting aggregate prevalence estimates were 10.85% for HHD countries, 2.46% for MHD countries and 1.19% for LHD countries. These proportions were applied to the author’s own estimates of the total population of people with disabilities for all 178 countries used to calculate the UNDP prevalence estimates.
43 Data for 75 countries, during the period 1970-96, covering the prevalence of disability by age and sex are now available on the United Nations Statistic Division website. However, information for 5 countries was insufficient for use in this calculation
22
Results
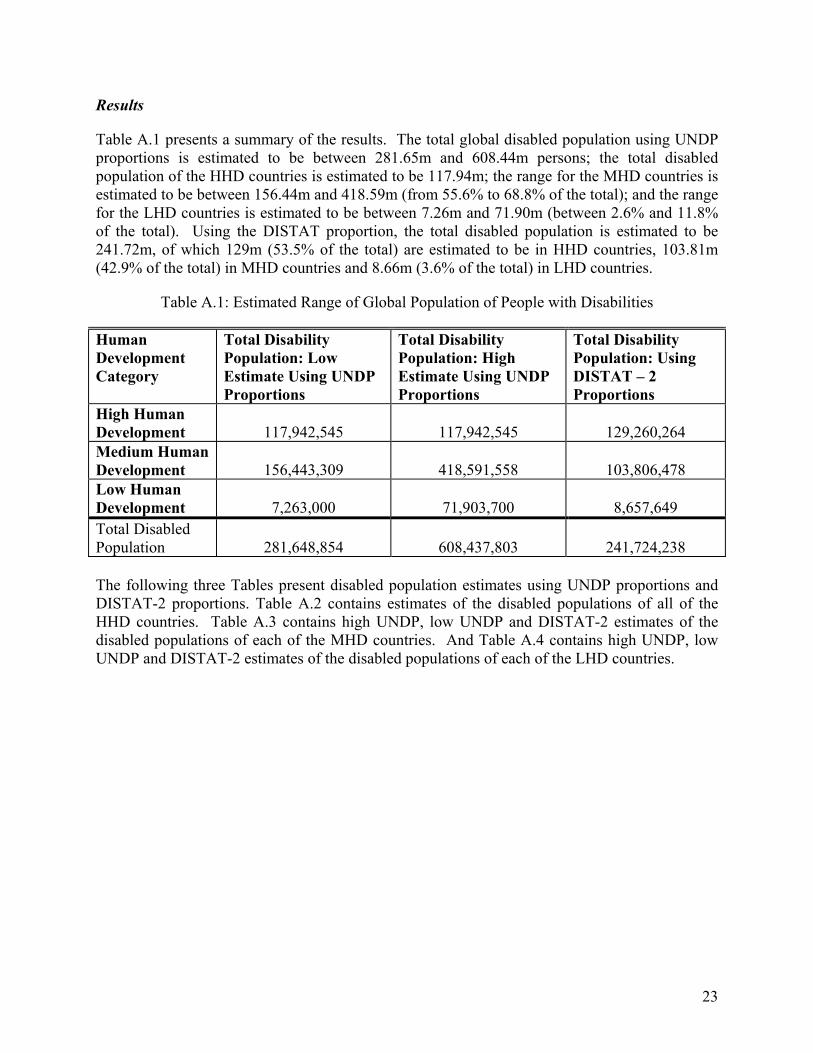
Table A.1 presents a summary of the results. The total global disabled population using UNDP proportions is estimated to be between 281.65m and 608.44m persons; the total disabled population of the HHD countries is estimated to be 117.94m; the range for the MHD countries is estimated to be between 156.44m and 418.59m (from 55.6% to 68.8% of the total); and the range for the LHD countries is estimated to be between 7.26m and 71.90m (between 2.6% and 11.8% of the total). Using the DISTAT proportion, the total disabled population is estimated to be 241.72m, of which 129m (53.5% of the total) are estimated to be in HHD countries, 103.81m (42.9% of the total) in MHD countries and 8.66m (3.6% of the total) in LHD countries.
Table A.1: Estimated Range of Global Population of People with Disabilities
Human Development Category
Total Disability Population: Low Estimate Using UNDP Proportions
Total Disability Population: High Estimate Using UNDP Proportions
Total Disability Population: Using DISTAT – 2 Proportions
High Human Development
117,942,545
117,942,545
129,260,264
Medium Human Development
156,443,309
418,591,558
103,806,478
Low Human Development
7,263,000
71,903,700
8,657,649
Total Disabled Population
281,648,854
608,437,803
241,724,238
The following three Tables present disabled population estimates using UNDP proportions and DISTAT-2 proportions. Table A.2 contains estimates of the disabled populations of all of the HHD countries. Table A.3 contains high UNDP, low UNDP and DISTAT-2 estimates of the disabled populations of each of the MHD countries. And Table A.4 contains high UNDP, low UNDP and DISTAT-2 estimates of the disabled populations of each of the LHD countries.
23
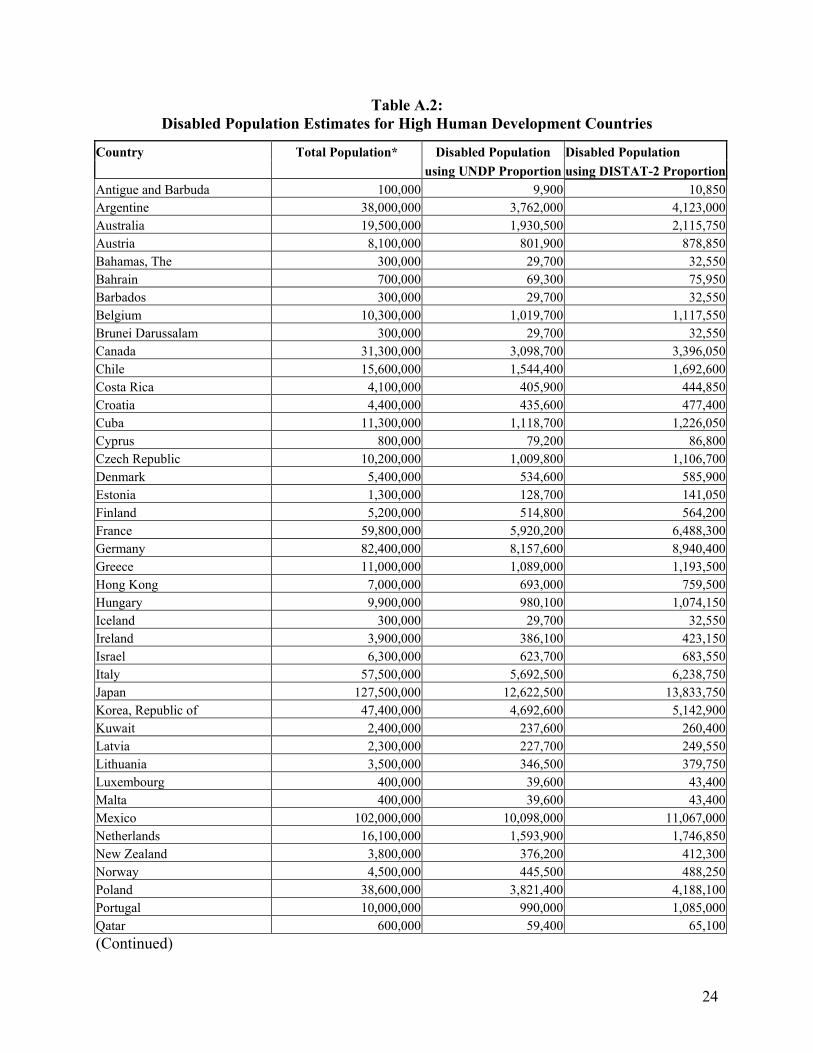
Table A.2: Disabled Population Estimates for High Human Development Countries
Country Total Population* Disabled Population Disabled Population using UNDP Proportion using DISTAT-2 ProportionAntigue and Barbuda 100,000 9,900 10,850Argentine 38,000,000 3,762,000 4,123,000Australia 19,500,000 1,930,500 2,115,750Austria 8,100,000 801,900 878,850Bahamas, The 300,000 29,700 32,550Bahrain 700,000 69,300 75,950Barbados 300,000 29,700 32,550Belgium 10,300,000 1,019,700 1,117,550Brunei Darussalam 300,000 29,700 32,550Canada 31,300,000 3,098,700 3,396,050Chile 15,600,000 1,544,400 1,692,600Costa Rica 4,100,000 405,900 444,850Croatia 4,400,000 435,600 477,400Cuba 11,300,000 1,118,700 1,226,050Cyprus 800,000 79,200 86,800Czech Republic 10,200,000 1,009,800 1,106,700Denmark 5,400,000 534,600 585,900Estonia 1,300,000 128,700 141,050Finland 5,200,000 514,800 564,200France 59,800,000 5,920,200 6,488,300Germany 82,400,000 8,157,600 8,940,400Greece 11,000,000 1,089,000 1,193,500Hong Kong 7,000,000 693,000 759,500Hungary 9,900,000 980,100 1,074,150Iceland 300,000 29,700 32,550Ireland 3,900,000 386,100 423,150Israel 6,300,000 623,700 683,550Italy 57,500,000 5,692,500 6,238,750Japan 127,500,000 12,622,500 13,833,750Korea, Republic of 47,400,000 4,692,600 5,142,900Kuwait 2,400,000 237,600 260,400Latvia 2,300,000 227,700 249,550Lithuania 3,500,000 346,500 379,750Luxembourg 400,000 39,600 43,400Malta 400,000 39,600 43,400Mexico 102,000,000 10,098,000 11,067,000Netherlands 16,100,000 1,593,900 1,746,850New Zealand 3,800,000 376,200 412,300Norway 4,500,000 445,500 488,250Poland 38,600,000 3,821,400 4,188,100Portugal 10,000,000 990,000 1,085,000Qatar 600,000 59,400 65,100(Continued)
24
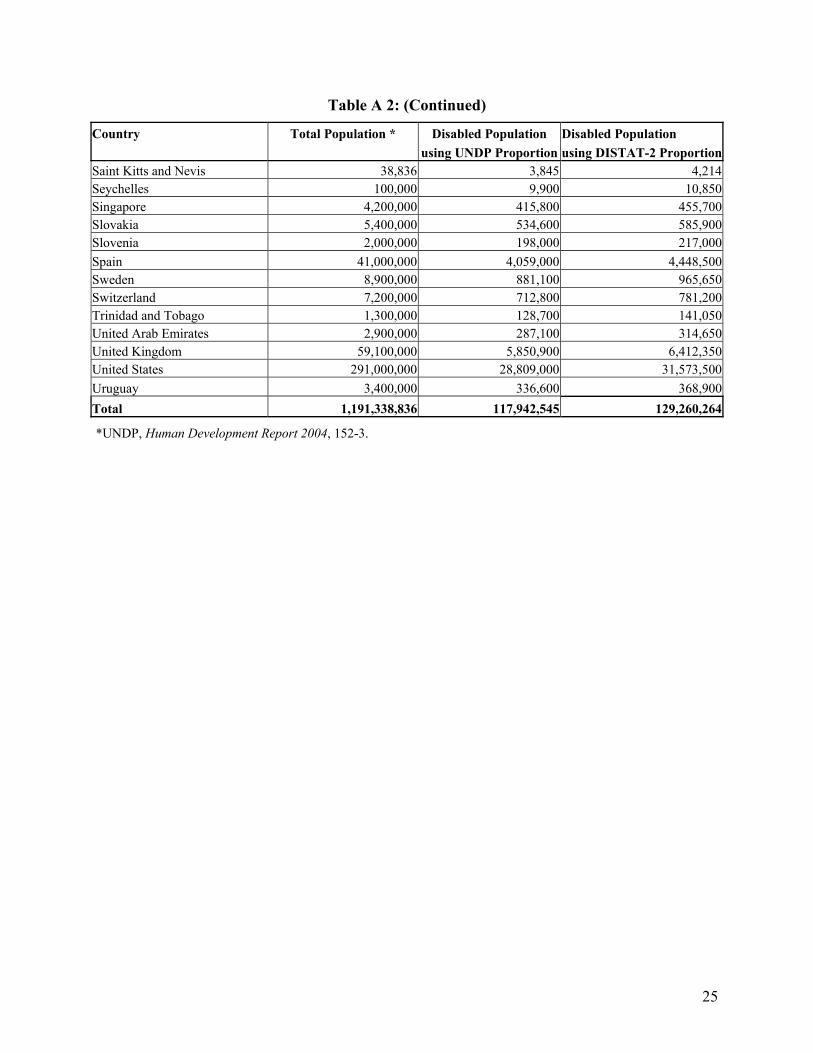
Table A 2: (Continued)
Country Total Population * Disabled Population Disabled Population using UNDP Proportion using DISTAT-2 ProportionSaint Kitts and Nevis 38,836 3,845 4,214Seychelles 100,000 9,900 10,850Singapore 4,200,000 415,800 455,700Slovakia 5,400,000 534,600 585,900Slovenia 2,000,000 198,000 217,000Spain 41,000,000 4,059,000 4,448,500Sweden 8,900,000 881,100 965,650Switzerland 7,200,000 712,800 781,200Trinidad and Tobago 1,300,000 128,700 141,050United Arab Emirates 2,900,000 287,100 314,650United Kingdom 59,100,000 5,850,900 6,412,350United States 291,000,000 28,809,000 31,573,500Uruguay 3,400,000 336,600 368,900Total 1,191,338,836 117,942,545 129,260,264
*UNDP, Human Development Report 2004, 152-3.
25
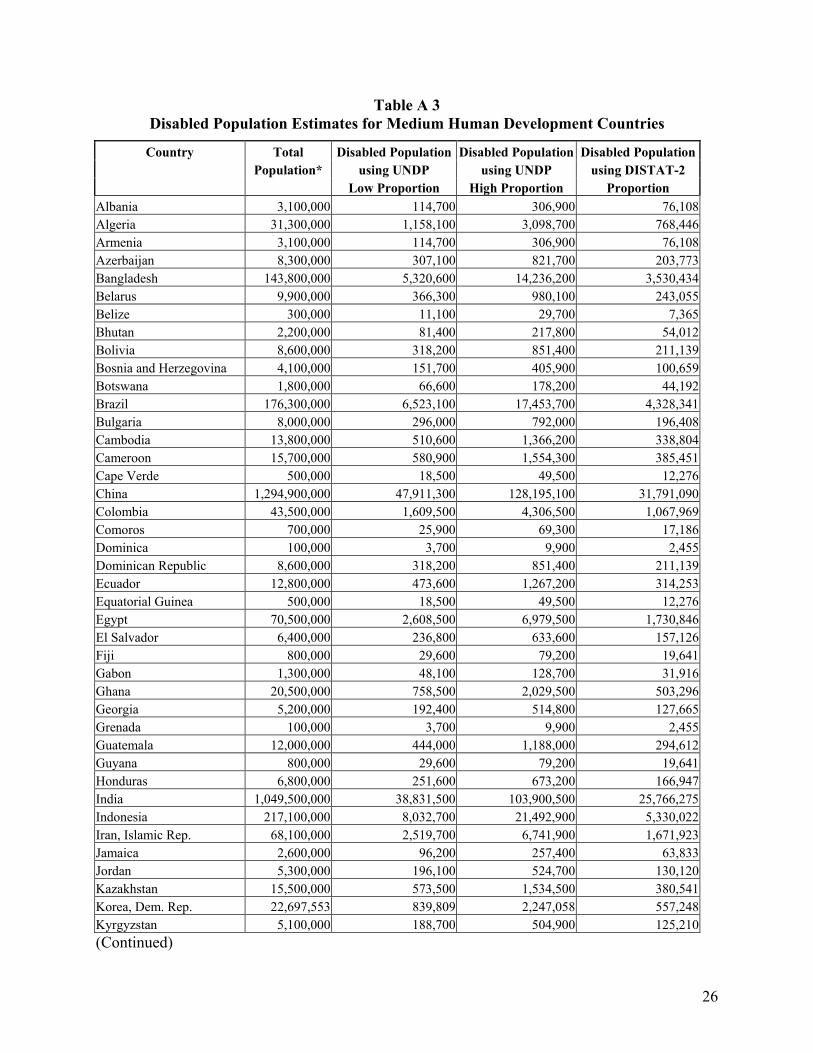
Table A 3 Disabled Population Estimates for Medium Human Development Countries
Country Total Disabled Population Disabled Population Disabled Population Population* using UNDP using UNDP using DISTAT-2 Low Proportion High Proportion Proportion
Albania 3,100,000 114,700 306,900 76,108Algeria 31,300,000 1,158,100 3,098,700 768,446Armenia 3,100,000 114,700 306,900 76,108Azerbaijan 8,300,000 307,100 821,700 203,773Bangladesh 143,800,000 5,320,600 14,236,200 3,530,434Belarus 9,900,000 366,300 980,100 243,055Belize 300,000 11,100 29,700 7,365Bhutan 2,200,000 81,400 217,800 54,012Bolivia 8,600,000 318,200 851,400 211,139Bosnia and Herzegovina 4,100,000 151,700 405,900 100,659Botswana 1,800,000 66,600 178,200 44,192Brazil 176,300,000 6,523,100 17,453,700 4,328,341Bulgaria 8,000,000 296,000 792,000 196,408Cambodia 13,800,000 510,600 1,366,200 338,804Cameroon 15,700,000 580,900 1,554,300 385,451Cape Verde 500,000 18,500 49,500 12,276China 1,294,900,000 47,911,300 128,195,100 31,791,090Colombia 43,500,000 1,609,500 4,306,500 1,067,969Comoros 700,000 25,900 69,300 17,186Dominica 100,000 3,700 9,900 2,455Dominican Republic 8,600,000 318,200 851,400 211,139Ecuador 12,800,000 473,600 1,267,200 314,253Equatorial Guinea 500,000 18,500 49,500 12,276Egypt 70,500,000 2,608,500 6,979,500 1,730,846El Salvador 6,400,000 236,800 633,600 157,126Fiji 800,000 29,600 79,200 19,641Gabon 1,300,000 48,100 128,700 31,916Ghana 20,500,000 758,500 2,029,500 503,296Georgia 5,200,000 192,400 514,800 127,665Grenada 100,000 3,700 9,900 2,455Guatemala 12,000,000 444,000 1,188,000 294,612Guyana 800,000 29,600 79,200 19,641Honduras 6,800,000 251,600 673,200 166,947India 1,049,500,000 38,831,500 103,900,500 25,766,275Indonesia 217,100,000 8,032,700 21,492,900 5,330,022Iran, Islamic Rep. 68,100,000 2,519,700 6,741,900 1,671,923Jamaica 2,600,000 96,200 257,400 63,833Jordan 5,300,000 196,100 524,700 130,120Kazakhstan 15,500,000 573,500 1,534,500 380,541Korea, Dem. Rep. 22,697,553 839,809 2,247,058 557,248Kyrgyzstan 5,100,000 188,700 504,900 125,210(Continued)
26
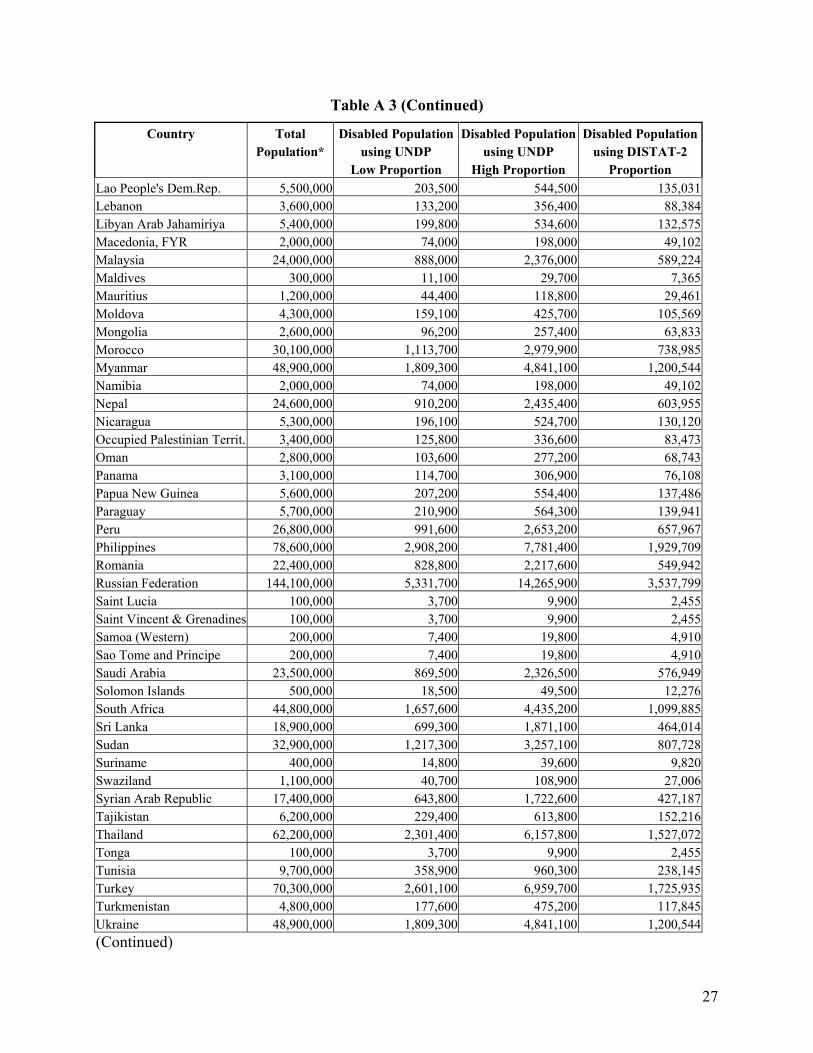
Table A 3 (Continued)
Country Total Disabled Population Disabled Population Disabled Population Population* using UNDP using UNDP using DISTAT-2 Low Proportion High Proportion Proportion
Lao People's Dem.Rep. 5,500,000 203,500 544,500 135,031Lebanon 3,600,000 133,200 356,400 88,384Libyan Arab Jahamiriya 5,400,000 199,800 534,600 132,575Macedonia, FYR 2,000,000 74,000 198,000 49,102Malaysia 24,000,000 888,000 2,376,000 589,224Maldives 300,000 11,100 29,700 7,365Mauritius 1,200,000 44,400 118,800 29,461Moldova 4,300,000 159,100 425,700 105,569Mongolia 2,600,000 96,200 257,400 63,833Morocco 30,100,000 1,113,700 2,979,900 738,985Myanmar 48,900,000 1,809,300 4,841,100 1,200,544Namibia 2,000,000 74,000 198,000 49,102Nepal 24,600,000 910,200 2,435,400 603,955Nicaragua 5,300,000 196,100 524,700 130,120Occupied Palestinian Territ. 3,400,000 125,800 336,600 83,473Oman 2,800,000 103,600 277,200 68,743Panama 3,100,000 114,700 306,900 76,108Papua New Guinea 5,600,000 207,200 554,400 137,486Paraguay 5,700,000 210,900 564,300 139,941Peru 26,800,000 991,600 2,653,200 657,967Philippines 78,600,000 2,908,200 7,781,400 1,929,709Romania 22,400,000 828,800 2,217,600 549,942Russian Federation 144,100,000 5,331,700 14,265,900 3,537,799Saint Lucia 100,000 3,700 9,900 2,455Saint Vincent & Grenadines 100,000 3,700 9,900 2,455Samoa (Western) 200,000 7,400 19,800 4,910Sao Tome and Principe 200,000 7,400 19,800 4,910Saudi Arabia 23,500,000 869,500 2,326,500 576,949Solomon Islands 500,000 18,500 49,500 12,276South Africa 44,800,000 1,657,600 4,435,200 1,099,885Sri Lanka 18,900,000 699,300 1,871,100 464,014Sudan 32,900,000 1,217,300 3,257,100 807,728Suriname 400,000 14,800 39,600 9,820Swaziland 1,100,000 40,700 108,900 27,006Syrian Arab Republic 17,400,000 643,800 1,722,600 427,187Tajikistan 6,200,000 229,400 613,800 152,216Thailand 62,200,000 2,301,400 6,157,800 1,527,072Tonga 100,000 3,700 9,900 2,455Tunisia 9,700,000 358,900 960,300 238,145Turkey 70,300,000 2,601,100 6,959,700 1,725,935Turkmenistan 4,800,000 177,600 475,200 117,845Ukraine 48,900,000 1,809,300 4,841,100 1,200,544(Continued)
27
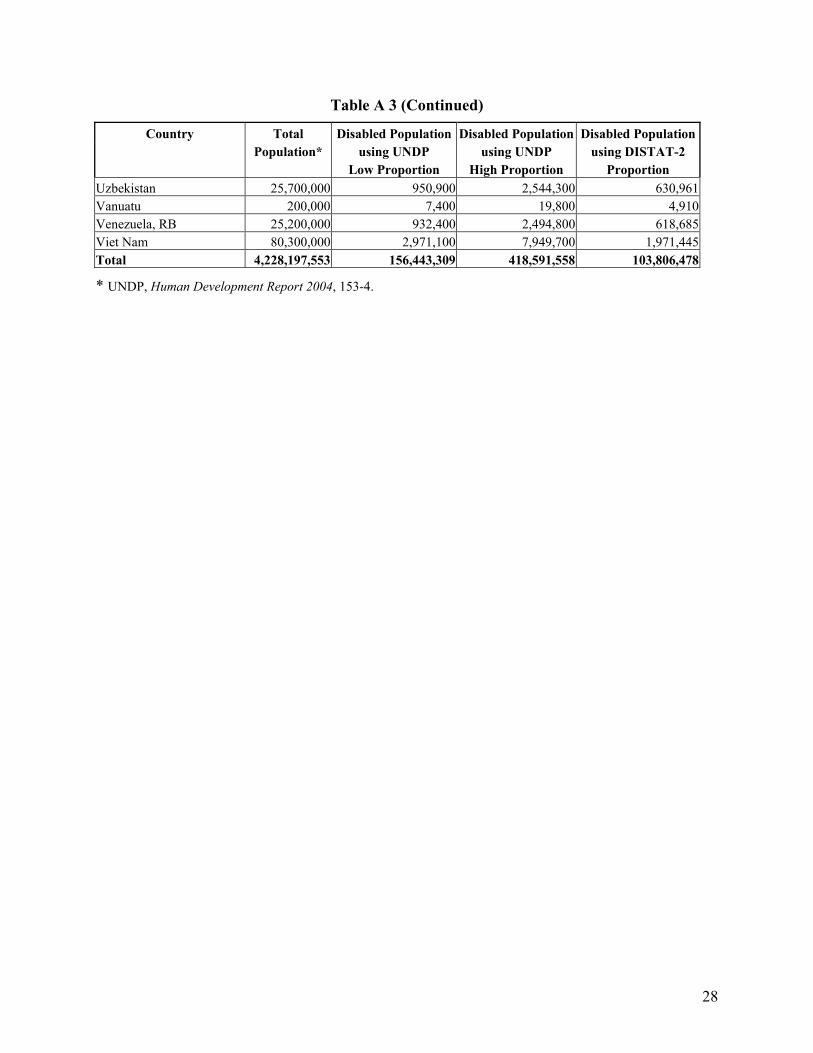
Table A 3 (Continued)
Country Total Disabled Population Disabled Population Disabled Population Population* using UNDP using UNDP using DISTAT-2 Low Proportion High Proportion Proportion
Uzbekistan 25,700,000 950,900 2,544,300 630,961Vanuatu 200,000 7,400 19,800 4,910Venezuela, RB 25,200,000 932,400 2,494,800 618,685Viet Nam 80,300,000 2,971,100 7,949,700 1,971,445Total 4,228,197,553 156,443,309 418,591,558 103,806,478
* UNDP, Human Development Report 2004, 153-4.
28
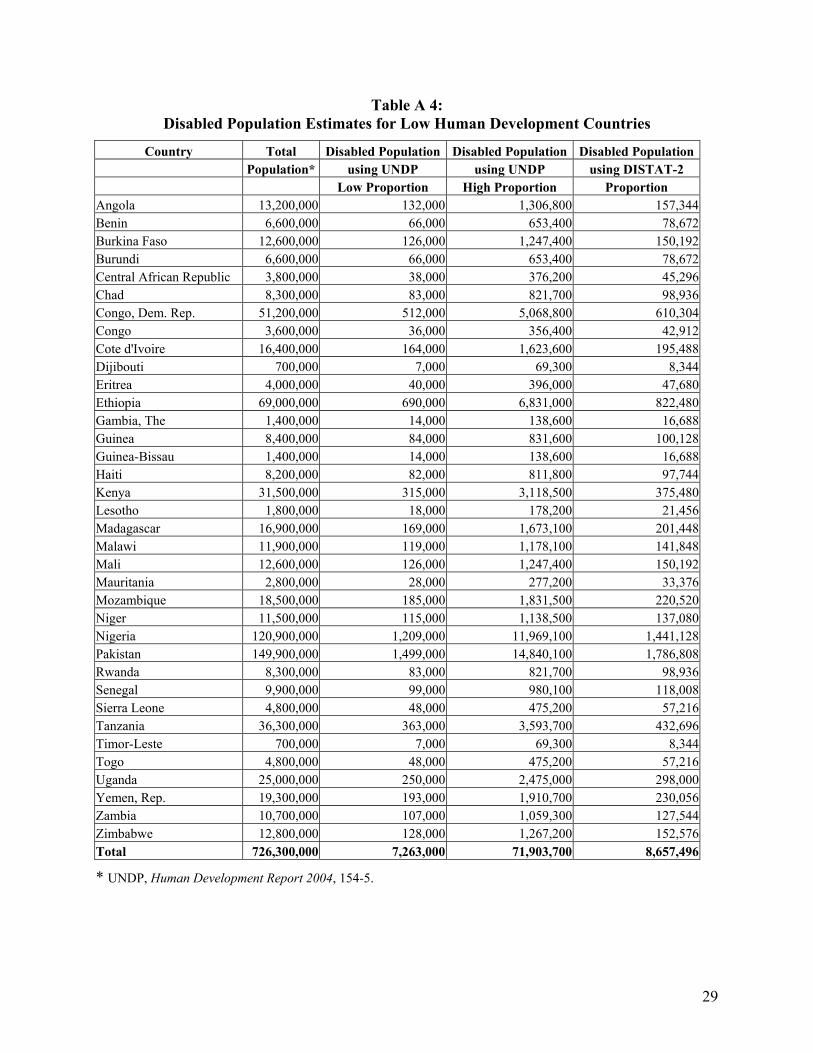
Table A 4: Disabled Population Estimates for Low Human Development Countries
Country Total Disabled Population Disabled Population Disabled Population Population* using UNDP using UNDP using DISTAT-2 Low Proportion High Proportion Proportion
Angola 13,200,000 132,000 1,306,800 157,344Benin 6,600,000 66,000 653,400 78,672Burkina Faso 12,600,000 126,000 1,247,400 150,192Burundi 6,600,000 66,000 653,400 78,672Central African Republic 3,800,000 38,000 376,200 45,296Chad 8,300,000 83,000 821,700 98,936Congo, Dem. Rep. 51,200,000 512,000 5,068,800 610,304Congo 3,600,000 36,000 356,400 42,912Cote d'Ivoire 16,400,000 164,000 1,623,600 195,488Dijibouti 700,000 7,000 69,300 8,344Eritrea 4,000,000 40,000 396,000 47,680Ethiopia 69,000,000 690,000 6,831,000 822,480Gambia, The 1,400,000 14,000 138,600 16,688Guinea 8,400,000 84,000 831,600 100,128Guinea-Bissau 1,400,000 14,000 138,600 16,688Haiti 8,200,000 82,000 811,800 97,744Kenya 31,500,000 315,000 3,118,500 375,480Lesotho 1,800,000 18,000 178,200 21,456Madagascar 16,900,000 169,000 1,673,100 201,448Malawi 11,900,000 119,000 1,178,100 141,848Mali 12,600,000 126,000 1,247,400 150,192Mauritania 2,800,000 28,000 277,200 33,376Mozambique 18,500,000 185,000 1,831,500 220,520Niger 11,500,000 115,000 1,138,500 137,080Nigeria 120,900,000 1,209,000 11,969,100 1,441,128Pakistan 149,900,000 1,499,000 14,840,100 1,786,808Rwanda 8,300,000 83,000 821,700 98,936Senegal 9,900,000 99,000 980,100 118,008Sierra Leone 4,800,000 48,000 475,200 57,216Tanzania 36,300,000 363,000 3,593,700 432,696Timor-Leste 700,000 7,000 69,300 8,344Togo 4,800,000 48,000 475,200 57,216Uganda 25,000,000 250,000 2,475,000 298,000Yemen, Rep. 19,300,000 193,000 1,910,700 230,056Zambia 10,700,000 107,000 1,059,300 127,544Zimbabwe 12,800,000 128,000 1,267,200 152,576Total 726,300,000 7,263,000 71,903,700 8,657,496
* UNDP, Human Development Report 2004, 154-5.
29
ANNEX B ESTIMATES OF GDP LOST DUE TO DISABILITY
The author has extrapolated the results of research conducted by the Roeher Institute in Toronto Canada in order to provide rough estimates of the annual value of Gross Domestic Product (GDP) lost as a result of disability globally and in each country.
Methodology The technique used to estimate the annual value of GDP lost due to disability is a variation of a technique developed by the Roeher Institute in Toronto Canada to extrapolate the results obtained in a study of the economic costs of disability in Canada (the Canadian Study) to the economic circumstances of the United States and Latin America.44
The Canadian Study estimated the GDP lost in Canada in 1998 as a result of long-term and short-term disability. The value of productivity lost due to long-term disability was estimated for two populations, “household disabled” and “institutionalized disabled,” using National Population Health Survey data and the methodology presented below. The results for both populations were then summed to arrive at an estimate of the total Canadian GDP lost due to long-term disability.
The National Population Health Survey (NPHS) household component provides the number of people who reported a long-term disability by diagnostic category, age group and sex. These figures are adjusted for severity and annual average length of long-term disability, applying distributions from the Quebec Health and Social Survey. Weights are assigned to account for lost productivity at different levels of long term disability.
The NPHS institutional component provides the number of people living in Canadian long-term health care facilities by age and sex. These figures, multiplied by the distribution of long-term disability in institutions according to diagnostic category, age group and sex and the annual average length of stay in institutions, provide estimates of the number of people in long-term health care facilities by diagnostic category, age group and sex. Weights are applied to account for productivity loss at different levels of long-term disability.
The adjusted figures for long-term disability by diagnostic category, age group and sex for the household and institutionalized populations are summed. These figures, multiplied by the 1998 annual average value of labour force work, adjusted for wage supplements and unpaid work, are used to estimate the total value of productivity lost to long-term disability by diagnostic category, age group and sex.45
Assigning a weight of 0.8 (very severe) to the institutionalized disabled population and a weight of 0.3 (minor limitations) to the household disabled population, the study estimated the GDP lost due to long term disability in 1998 to be $32.2 billion, of which $30.3 billion was attributable to
44 Health Canada, Economic Burden of Illness in Canada, 1993 and Rioux, Enabling the Well-Being of Persons with Disabilities, 9-11. 45 Health Canada, Economic Burden of Illness in Canada, 1998.
30
the household population and $1.9 billion was attributable to the institutionalized population. A sensitivity analysis assigning ranges of severity weights from 0.8 to 1.0 for the institutionalized population and from 0.0 to 0.2 for the household population resulted in an estimated range of lost GDP from $32.2 billion to $42.9 billion where the mid-point estimate is $37.6 billion.
The amount of productivity lost due to short-term disability was estimated using National Population Health Survey data and the following methodology:
The National Population Health Survey provides the average number of days of short-term disability by age and sex for two levels of severity: “days in bed” or “days of reduced major activity.” Weights are assigned to these levels to account for the loss of productivity at different severity levels of short-term disability: 0.8 for “days in bed” and 0.5 for “days of reduced major activity”. A sensitivity analysis of productivity losses using weights of 0.8 and 1.0 for “days in bed’ has also been conducted.
The adjusted values are applied to the general population to estimate total annual days of productivity lost due to short-term disability by age and sex. Annual days of productivity lost due to short-term disability by diagnostic category, age group and sex are generated by applying these values to the distribution of days lost due to short-term disability by diagnostic category, age group and sex obtained from the Quebec Health and Social Survey.
The number of annual days of productivity lost according to diagnostic category, age group and sex is then multiplied by an average value per day of labour force work, adjusted for wage supplements and unpaid work, to estimate the value of productivity lost to short-term disability by diagnostic category, age and sex. Labour force earnings and the value of unpaid work are available by age and sex.46
Using the above weightings for “days in bed” and “days of reduced major activity,” the study estimated the total 1998 Canadian GDP lost due to short-term disability to be $9.8 billion. A sensitivity analysis assigning a range of severity weights for “days in bed” from 0.9 to 1.0 resulted in estimated GDP losses due to short-term disability from $10.3 billion to $10.7 billion.
The sum of the Canadian Study’s estimates of GDP losses due to long-term and short-term disability in 1998 was $47.9 billion, or 6.7% of Canada’s 2002 GDP ($714.3 billion). The estimated range of Canadian GDP lost in 1998 as a result of disability that resulted from the Canadian Study’s sensitivity analysis was from $42 billion to $53.6 billion, or from 5.8% to 7.5% of GDP.
The author has extrapolated the results of this study to 191 countries using the following extrapolation technique developed by the Roeher Institute. Assuming that the GDP lost due to disability is a positive function of the incidence of exclusion of people with disabilities from the labor force because those who are excluded do not contribute, and a negative function of the general unemployment rate because a lower unemployment rate infers a higher probability of labor market activity, the Roeher Institute first calculated Canada’s proportion of annual GDP lost due to disability (%GDP lost can) as a proportion of its unemployment rate (UR). Canada's 2002 unemployment rate was 7.6% , resulting in a %GDP lost / UR ratio for 2002 of: 46 Ibid.
31
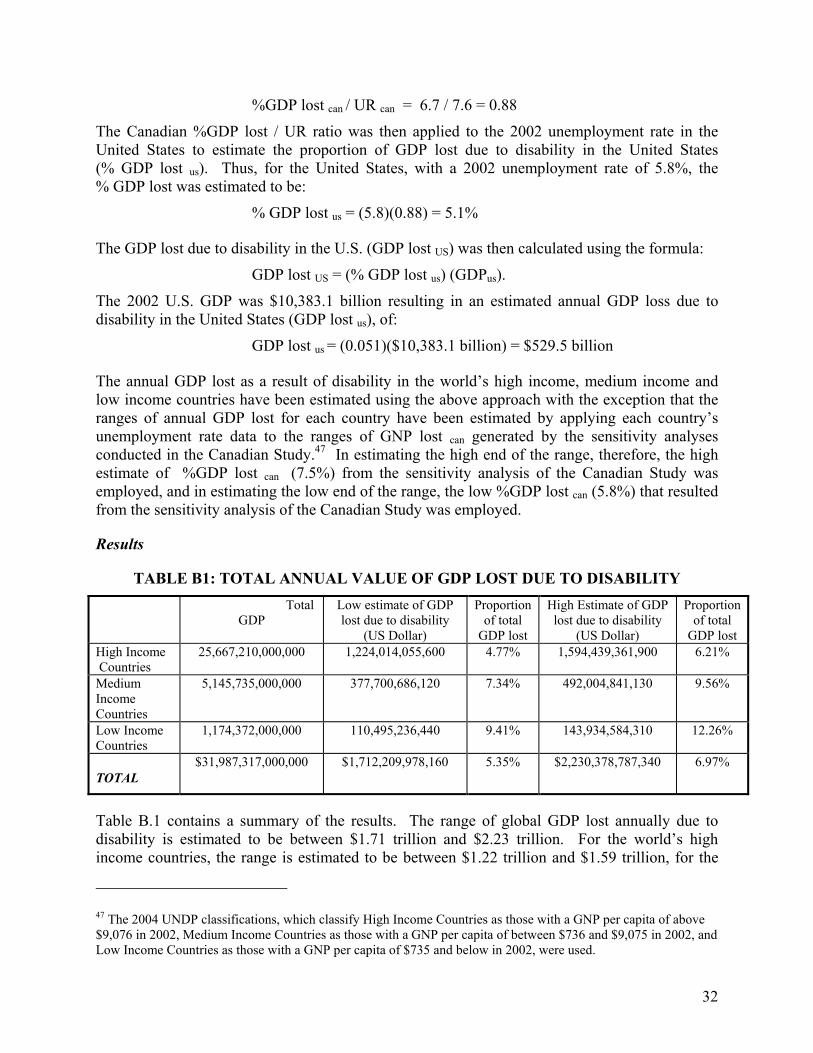
%GDP lost can / UR can = 6.7 / 7.6 = 0.88
The Canadian %GDP lost / UR ratio was then applied to the 2002 unemployment rate in the United States to estimate the proportion of GDP lost due to disability in the United States (% GDP lost us). Thus, for the United States, with a 2002 unemployment rate of 5.8%, the % GDP lost was estimated to be:
% GDP lost us = (5.8)(0.88) = 5.1%
The GDP lost due to disability in the U.S. (GDP lost US) was then calculated using the formula:
GDP lost US = (% GDP lost us) (GDPus).
The 2002 U.S. GDP was $10,383.1 billion resulting in an estimated annual GDP loss due to disability in the United States (GDP lost us), of:
GDP lost us = (0.051)($10,383.1 billion) = $529.5 billion
The annual GDP lost as a result of disability in the world’s high income, medium income and low income countries have been estimated using the above approach with the exception that the ranges of annual GDP lost for each country have been estimated by applying each country’s unemployment rate data to the ranges of GNP lost can generated by the sensitivity analyses conducted in the Canadian Study.47 In estimating the high end of the range, therefore, the high estimate of %GDP lost can (7.5%) from the sensitivity analysis of the Canadian Study was employed, and in estimating the low end of the range, the low %GDP lost can (5.8%) that resulted from the sensitivity analysis of the Canadian Study was employed.
Results
TABLE B1: TOTAL ANNUAL VALUE OF GDP LOST DUE TO DISABILITY Total
GDP Low estimate of GDP lost due to disability
(US Dollar)
Proportion of total
GDP lost
High Estimate of GDP lost due to disability
(US Dollar)
Proportion of total
GDP lost High Income Countries
25,667,210,000,000 1,224,014,055,600 4.77% 1,594,439,361,900 6.21%
Medium Income Countries
5,145,735,000,000 377,700,686,120 7.34% 492,004,841,130 9.56%
Low Income Countries
1,174,372,000,000 110,495,236,440 9.41% 143,934,584,310 12.26%
TOTAL $31,987,317,000,000 $1,712,209,978,160 5.35% $2,230,378,787,340 6.97%
Table B.1 contains a summary of the results. The range of global GDP lost annually due to disability is estimated to be between $1.71 trillion and $2.23 trillion. For the world’s high income countries, the range is estimated to be between $1.22 trillion and $1.59 trillion, for the
47 The 2004 UNDP classifications, which classify High Income Countries as those with a GNP per capita of above $9,076 in 2002, Medium Income Countries as those with a GNP per capita of between $736 and $9,075 in 2002, and Low Income Countries as those with a GNP per capita of $735 and below in 2002, were used.
32
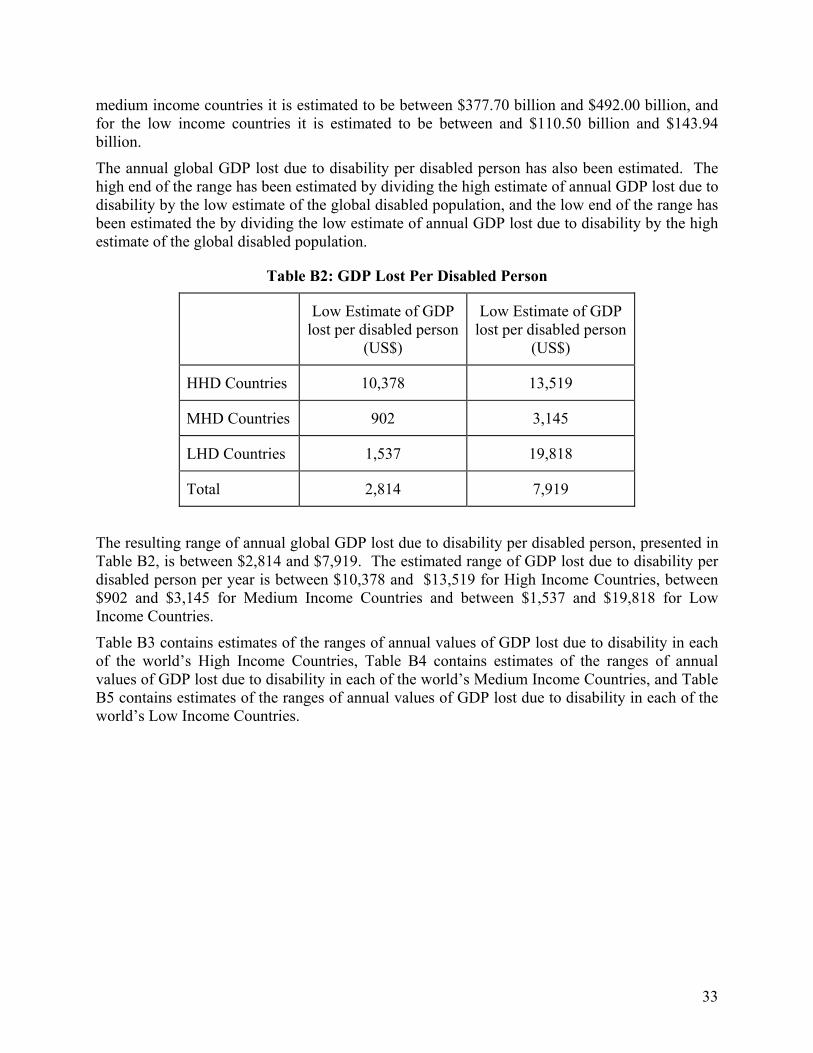
medium income countries it is estimated to be between $377.70 billion and $492.00 billion, and for the low income countries it is estimated to be between and $110.50 billion and $143.94 billion.
The annual global GDP lost due to disability per disabled person has also been estimated. The high end of the range has been estimated by dividing the high estimate of annual GDP lost due to disability by the low estimate of the global disabled population, and the low end of the range has been estimated the by dividing the low estimate of annual GDP lost due to disability by the high estimate of the global disabled population.
Table B2: GDP Lost Per Disabled Person
Low Estimate of GDP lost per disabled person
(US$)
Low Estimate of GDP lost per disabled person
(US$)
HHD Countries 10,378 13,519
MHD Countries 902 3,145
LHD Countries 1,537 19,818
Total 2,814 7,919
The resulting range of annual global GDP lost due to disability per disabled person, presented in Table B2, is between $2,814 and $7,919. The estimated range of GDP lost due to disability per disabled person per year is between $10,378 and $13,519 for High Income Countries, between $902 and $3,145 for Medium Income Countries and between $1,537 and $19,818 for Low Income Countries.
Table B3 contains estimates of the ranges of annual values of GDP lost due to disability in each of the world’s High Income Countries, Table B4 contains estimates of the ranges of annual values of GDP lost due to disability in each of the world’s Medium Income Countries, and Table B5 contains estimates of the ranges of annual values of GDP lost due to disability in each of the world’s Low Income Countries.
33
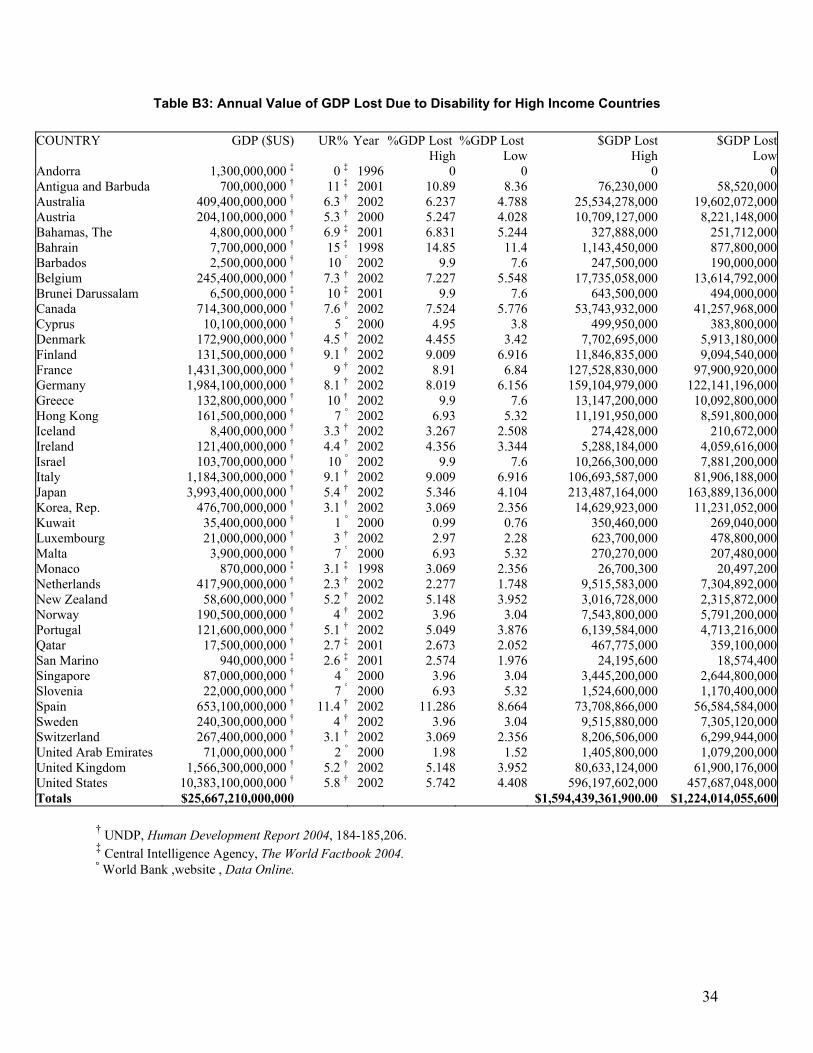
Table B3: Annual Value of GDP Lost Due to Disability for High Income Countries
COUNTRY GDP ($US) UR% Year %GDP Lost %GDP Lost $GDP Lost $GDP Lost High Low High Low
Andorra 1,300,000,000 ‡ 0 ‡ 1996 0 0 0 0Antigua and Barbuda 700,000,000 † 11 ‡ 2001 10.89 8.36 76,230,000 58,520,000Australia 409,400,000,000 † 6.3 † 2002 6.237 4.788 25,534,278,000 19,602,072,000Austria 204,100,000,000 † 5.3 † 2000 5.247 4.028 10,709,127,000 8,221,148,000Bahamas, The 4,800,000,000 † 6.9 ‡ 2001 6.831 5.244 327,888,000 251,712,000Bahrain 7,700,000,000 † 15 ‡ 1998 14.85 11.4 1,143,450,000 877,800,000Barbados 2,500,000,000 † 10 ° 2002 9.9 7.6 247,500,000 190,000,000Belgium 245,400,000,000 † 7.3 † 2002 7.227 5.548 17,735,058,000 13,614,792,000Brunei Darussalam 6,500,000,000 ‡ 10 ‡ 2001 9.9 7.6 643,500,000 494,000,000Canada 714,300,000,000 † 7.6 † 2002 7.524 5.776 53,743,932,000 41,257,968,000Cyprus 10,100,000,000 † 5 ° 2000 4.95 3.8 499,950,000 383,800,000Denmark 172,900,000,000 † 4.5 † 2002 4.455 3.42 7,702,695,000 5,913,180,000Finland 131,500,000,000 † 9.1 † 2002 9.009 6.916 11,846,835,000 9,094,540,000France 1,431,300,000,000 † 9 † 2002 8.91 6.84 127,528,830,000 97,900,920,000Germany 1,984,100,000,000 † 8.1 † 2002 8.019 6.156 159,104,979,000 122,141,196,000Greece 132,800,000,000 † 10 † 2002 9.9 7.6 13,147,200,000 10,092,800,000Hong Kong 161,500,000,000 † 7 ° 2002 6.93 5.32 11,191,950,000 8,591,800,000Iceland 8,400,000,000 † 3.3 † 2002 3.267 2.508 274,428,000 210,672,000Ireland 121,400,000,000 † 4.4 † 2002 4.356 3.344 5,288,184,000 4,059,616,000Israel 103,700,000,000 † 10 ° 2002 9.9 7.6 10,266,300,000 7,881,200,000Italy 1,184,300,000,000 † 9.1 † 2002 9.009 6.916 106,693,587,000 81,906,188,000Japan 3,993,400,000,000 † 5.4 † 2002 5.346 4.104 213,487,164,000 163,889,136,000Korea, Rep. 476,700,000,000 † 3.1 † 2002 3.069 2.356 14,629,923,000 11,231,052,000Kuwait 35,400,000,000 † 1 ° 2000 0.99 0.76 350,460,000 269,040,000Luxembourg 21,000,000,000 † 3 † 2002 2.97 2.28 623,700,000 478,800,000Malta 3,900,000,000 † 7 ° 2000 6.93 5.32 270,270,000 207,480,000Monaco 870,000,000 ‡ 3.1 ‡ 1998 3.069 2.356 26,700,300 20,497,200Netherlands 417,900,000,000 † 2.3 † 2002 2.277 1.748 9,515,583,000 7,304,892,000New Zealand 58,600,000,000 † 5.2 † 2002 5.148 3.952 3,016,728,000 2,315,872,000Norway 190,500,000,000 † 4 † 2002 3.96 3.04 7,543,800,000 5,791,200,000Portugal 121,600,000,000 † 5.1 † 2002 5.049 3.876 6,139,584,000 4,713,216,000Qatar 17,500,000,000 † 2.7 ‡ 2001 2.673 2.052 467,775,000 359,100,000San Marino 940,000,000 ‡ 2.6 ‡ 2001 2.574 1.976 24,195,600 18,574,400Singapore 87,000,000,000 † 4 ° 2000 3.96 3.04 3,445,200,000 2,644,800,000Slovenia 22,000,000,000 † 7 ° 2000 6.93 5.32 1,524,600,000 1,170,400,000Spain 653,100,000,000 † 11.4 † 2002 11.286 8.664 73,708,866,000 56,584,584,000Sweden 240,300,000,000 † 4 † 2002 3.96 3.04 9,515,880,000 7,305,120,000Switzerland 267,400,000,000 † 3.1 † 2002 3.069 2.356 8,206,506,000 6,299,944,000United Arab Emirates 71,000,000,000 † 2 ° 2000 1.98 1.52 1,405,800,000 1,079,200,000United Kingdom 1,566,300,000,000 † 5.2 † 2002 5.148 3.952 80,633,124,000 61,900,176,000United States 10,383,100,000,000 † 5.8 † 2002 5.742 4.408 596,197,602,000 457,687,048,000Totals $25,667,210,000,000 $1,594,439,361,900.00 $1,224,014,055,600
† UNDP, Human Development Report 2004, 184-185,206. ‡ Central Intelligence Agency, The World Factbook 2004. ° World Bank ,website , Data Online.
34
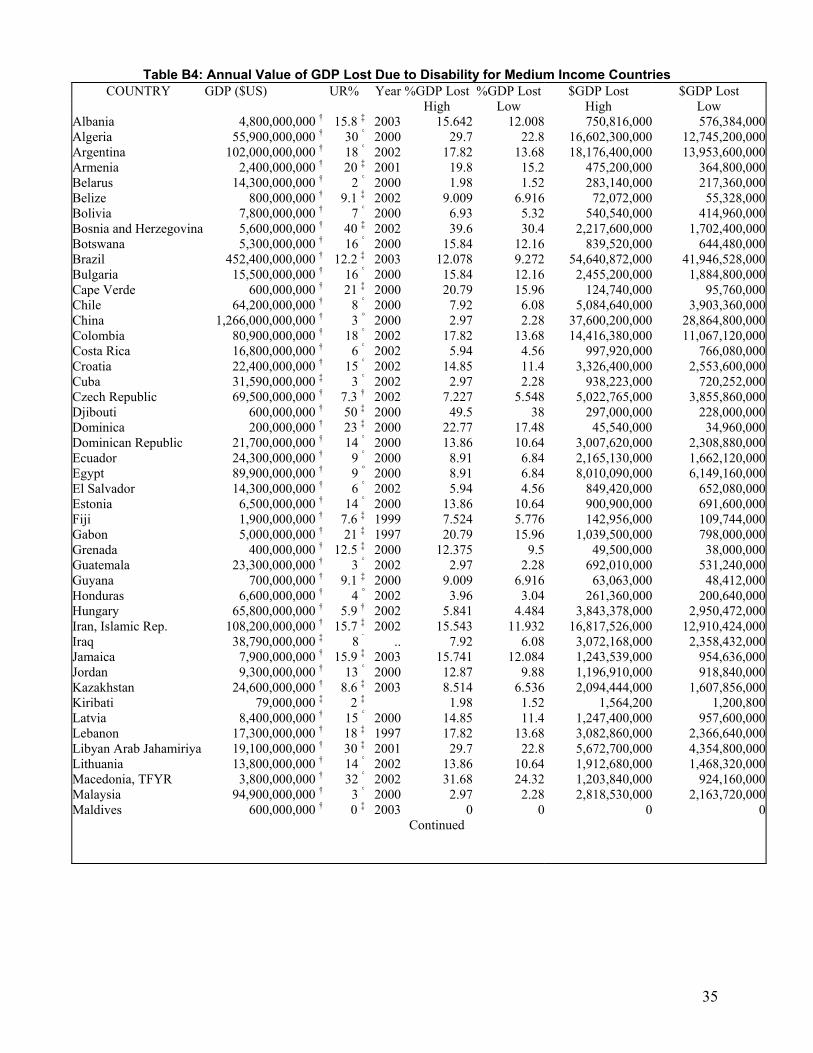
Table B4: Annual Value of GDP Lost Due to Disability for Medium Income Countries
COUNTRY GDP ($US) UR% Year %GDP Lost %GDP Lost $GDP Lost $GDP Lost High Low High Low
Albania 4,800,000,000 † 15.8 ‡ 2003 15.642 12.008 750,816,000 576,384,000Algeria 55,900,000,000 † 30 ° 2000 29.7 22.8 16,602,300,000 12,745,200,000Argentina 102,000,000,000 † 18 ° 2002 17.82 13.68 18,176,400,000 13,953,600,000Armenia 2,400,000,000 † 20 ‡ 2001 19.8 15.2 475,200,000 364,800,000Belarus 14,300,000,000 † 2 ° 2000 1.98 1.52 283,140,000 217,360,000Belize 800,000,000 † 9.1 ‡ 2002 9.009 6.916 72,072,000 55,328,000Bolivia 7,800,000,000 † 7 ° 2000 6.93 5.32 540,540,000 414,960,000Bosnia and Herzegovina 5,600,000,000 † 40 ‡ 2002 39.6 30.4 2,217,600,000 1,702,400,000Botswana 5,300,000,000 † 16 ° 2000 15.84 12.16 839,520,000 644,480,000Brazil 452,400,000,000 † 12.2 ‡ 2003 12.078 9.272 54,640,872,000 41,946,528,000Bulgaria 15,500,000,000 † 16 ° 2000 15.84 12.16 2,455,200,000 1,884,800,000Cape Verde 600,000,000 † 21 ‡ 2000 20.79 15.96 124,740,000 95,760,000Chile 64,200,000,000 † 8 ° 2000 7.92 6.08 5,084,640,000 3,903,360,000China 1,266,000,000,000 † 3 ° 2000 2.97 2.28 37,600,200,000 28,864,800,000Colombia 80,900,000,000 † 18 ° 2002 17.82 13.68 14,416,380,000 11,067,120,000Costa Rica 16,800,000,000 † 6 ° 2002 5.94 4.56 997,920,000 766,080,000Croatia 22,400,000,000 † 15 ° 2002 14.85 11.4 3,326,400,000 2,553,600,000Cuba 31,590,000,000 ‡ 3 ° 2002 2.97 2.28 938,223,000 720,252,000Czech Republic 69,500,000,000 † 7.3 † 2002 7.227 5.548 5,022,765,000 3,855,860,000Djibouti 600,000,000 † 50 ‡ 2000 49.5 38 297,000,000 228,000,000Dominica 200,000,000 † 23 ‡ 2000 22.77 17.48 45,540,000 34,960,000Dominican Republic 21,700,000,000 † 14 ° 2000 13.86 10.64 3,007,620,000 2,308,880,000Ecuador 24,300,000,000 † 9 ° 2000 8.91 6.84 2,165,130,000 1,662,120,000Egypt 89,900,000,000 † 9 ° 2000 8.91 6.84 8,010,090,000 6,149,160,000El Salvador 14,300,000,000 † 6 ° 2002 5.94 4.56 849,420,000 652,080,000Estonia 6,500,000,000 † 14 ° 2000 13.86 10.64 900,900,000 691,600,000Fiji 1,900,000,000 † 7.6 ‡ 1999 7.524 5.776 142,956,000 109,744,000Gabon 5,000,000,000 † 21 ‡ 1997 20.79 15.96 1,039,500,000 798,000,000Grenada 400,000,000 † 12.5 ‡ 2000 12.375 9.5 49,500,000 38,000,000Guatemala 23,300,000,000 † 3 ° 2002 2.97 2.28 692,010,000 531,240,000Guyana 700,000,000 † 9.1 ‡ 2000 9.009 6.916 63,063,000 48,412,000Honduras 6,600,000,000 † 4 ° 2002 3.96 3.04 261,360,000 200,640,000Hungary 65,800,000,000 † 5.9 † 2002 5.841 4.484 3,843,378,000 2,950,472,000Iran, Islamic Rep. 108,200,000,000 † 15.7 ‡ 2002 15.543 11.932 16,817,526,000 12,910,424,000Iraq 38,790,000,000 ‡ 8 ¨ .. 7.92 6.08 3,072,168,000 2,358,432,000Jamaica 7,900,000,000 † 15.9 ‡ 2003 15.741 12.084 1,243,539,000 954,636,000Jordan 9,300,000,000 † 13 ° 2000 12.87 9.88 1,196,910,000 918,840,000Kazakhstan 24,600,000,000 † 8.6 ‡ 2003 8.514 6.536 2,094,444,000 1,607,856,000Kiribati 79,000,000 ‡ 2 1992 1.98 1.52 1,564,200 1,200,800Latvia 8,400,000,000 † 15 ° 2000 14.85 11.4 1,247,400,000 957,600,000Lebanon 17,300,000,000 † 18 ‡ 1997 17.82 13.68 3,082,860,000 2,366,640,000Libyan Arab Jahamiriya 19,100,000,000 † 30 ‡ 2001 29.7 22.8 5,672,700,000 4,354,800,000Lithuania 13,800,000,000 † 14 ° 2002 13.86 10.64 1,912,680,000 1,468,320,000Macedonia, TFYR 3,800,000,000 † 32 ° 2002 31.68 24.32 1,203,840,000 924,160,000Malaysia 94,900,000,000 † 3 ° 2000 2.97 2.28 2,818,530,000 2,163,720,000Maldives 600,000,000 † 0 ‡ 2003 0 0 0 0
Continued
‡
35
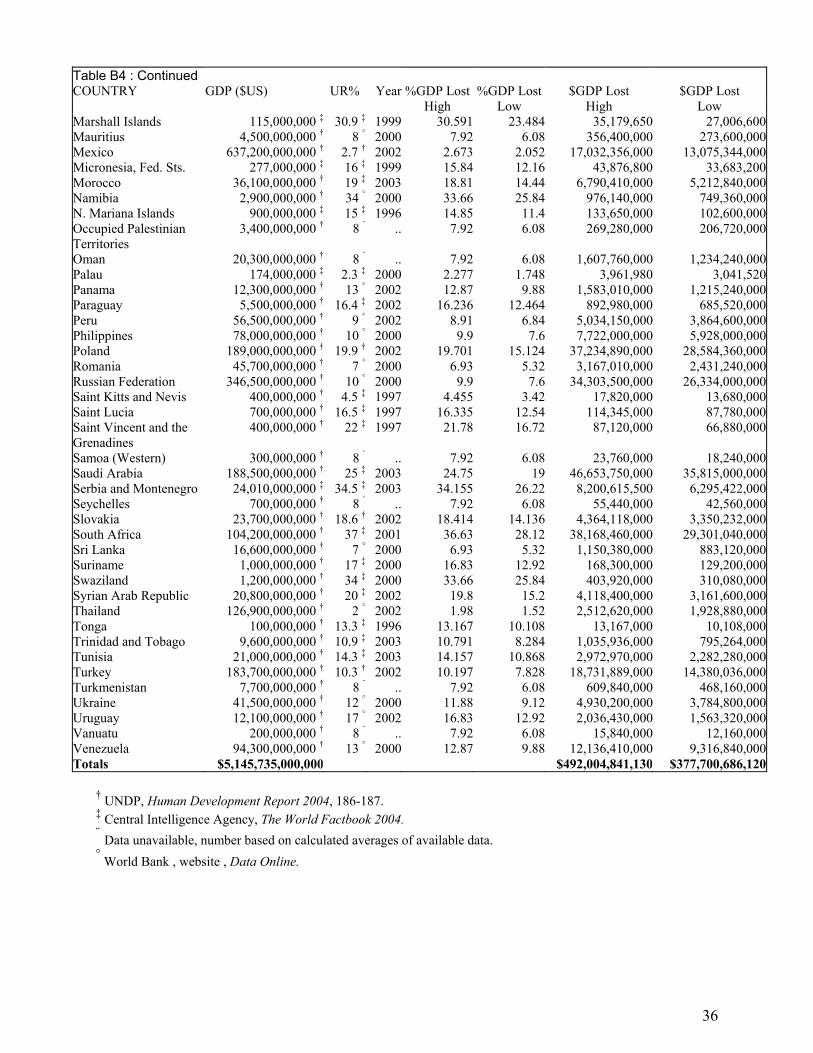
Table B4 : Continued COUNTRY GDP ($US) UR% Year %GDP Lost %GDP Lost $GDP Lost $GDP Lost
High Low High Low Marshall Islands 115,000,000 ‡ 30.9 ‡ 1999 30.591 23.484 35,179,650 27,006,600Mauritius 4,500,000,000 † 8 ° 2000 7.92 6.08 356,400,000 273,600,000Mexico 637,200,000,000 † 2.7 † 2002 2.673 2.052 17,032,356,000 13,075,344,000Micronesia, Fed. Sts. 277,000,000 ‡ 16 ‡ 1999 15.84 12.16 43,876,800 33,683,200Morocco 36,100,000,000 † 19 ‡ 2003 18.81 14.44 6,790,410,000 5,212,840,000Namibia 2,900,000,000 † 34 ° 2000 33.66 25.84 976,140,000 749,360,000N. Mariana Islands 900,000,000 ‡ 15 ‡ 1996 14.85 11.4 133,650,000 102,600,000Occupied Palestinian Territories
3,400,000,000 † 8 ¨ .. 7.92 6.08 269,280,000 206,720,000
Oman 20,300,000,000 † 8 ¨ .. 7.92 6.08 1,607,760,000 1,234,240,000Palau 174,000,000 ‡ 2.3 ‡ 2000 2.277 1.748 3,961,980 3,041,520Panama 12,300,000,000 † 13 ° 2002 12.87 9.88 1,583,010,000 1,215,240,000Paraguay 5,500,000,000 † 16.4 ‡ 2002 16.236 12.464 892,980,000 685,520,000Peru 56,500,000,000 † 9 ° 2002 8.91 6.84 5,034,150,000 3,864,600,000Philippines 78,000,000,000 † 10 ° 2000 9.9 7.6 7,722,000,000 5,928,000,000Poland 189,000,000,000 † 19.9 † 2002 19.701 15.124 37,234,890,000 28,584,360,000Romania 45,700,000,000 † 7 ° 2000 6.93 5.32 3,167,010,000 2,431,240,000Russian Federation 346,500,000,000 † 10 ° 2000 9.9 7.6 34,303,500,000 26,334,000,000Saint Kitts and Nevis 400,000,000 † 4.5 ‡ 1997 4.455 3.42 17,820,000 13,680,000Saint Lucia 700,000,000 † 16.5 ‡ 1997 16.335 12.54 114,345,000 87,780,000Saint Vincent and the Grenadines
400,000,000 † 22 ‡ 1997 21.78 16.72 87,120,000 66,880,000
Samoa (Western) 300,000,000 † 8 ¨ .. 7.92 6.08 23,760,000 18,240,000Saudi Arabia 188,500,000,000 † 25 ‡ 2003 24.75 19 46,653,750,000 35,815,000,000Serbia and Montenegro 24,010,000,000 ‡ 34.5 ‡ 2003 34.155 26.22 8,200,615,500 6,295,422,000Seychelles 700,000,000 † 8 ¨ .. 7.92 6.08 55,440,000 42,560,000Slovakia 23,700,000,000 † 18.6 † 2002 18.414 14.136 4,364,118,000 3,350,232,000South Africa 104,200,000,000 † 37 ‡ 2001 36.63 28.12 38,168,460,000 29,301,040,000Sri Lanka 16,600,000,000 † 7 ° 2000 6.93 5.32 1,150,380,000 883,120,000Suriname 1,000,000,000 † 17 ‡ 2000 16.83 12.92 168,300,000 129,200,000Swaziland 1,200,000,000 † 34 ‡ 2000 33.66 25.84 403,920,000 310,080,000Syrian Arab Republic 20,800,000,000 † 20 ‡ 2002 19.8 15.2 4,118,400,000 3,161,600,000Thailand 126,900,000,000 † 2 ° 2002 1.98 1.52 2,512,620,000 1,928,880,000Tonga 100,000,000 † 13.3 ‡ 1996 13.167 10.108 13,167,000 10,108,000Trinidad and Tobago 9,600,000,000 † 10.9 ‡ 2003 10.791 8.284 1,035,936,000 795,264,000Tunisia 21,000,000,000 † 14.3 ‡ 2003 14.157 10.868 2,972,970,000 2,282,280,000Turkey 183,700,000,000 † 10.3 † 2002 10.197 7.828 18,731,889,000 14,380,036,000Turkmenistan 7,700,000,000 † 8 ¨ .. 7.92 6.08 609,840,000 468,160,000Ukraine 41,500,000,000 † 12 ° 2000 11.88 9.12 4,930,200,000 3,784,800,000Uruguay 12,100,000,000 † 17 ° 2002 16.83 12.92 2,036,430,000 1,563,320,000Vanuatu 200,000,000 † 8 ¨ .. 7.92 6.08 15,840,000 12,160,000Venezuela 94,300,000,000 † 13 ° 2000 12.87 9.88 12,136,410,000 9,316,840,000Totals $5,145,735,000,000 $492,004,841,130 $377,700,686,120
† UNDP, Human Development Report 2004, 186-187. ‡ Central Intelligence Agency, The World Factbook 2004. ¨ Data unavailable, number based on calculated averages of available data. ° World Bank , website , Data Online.
36
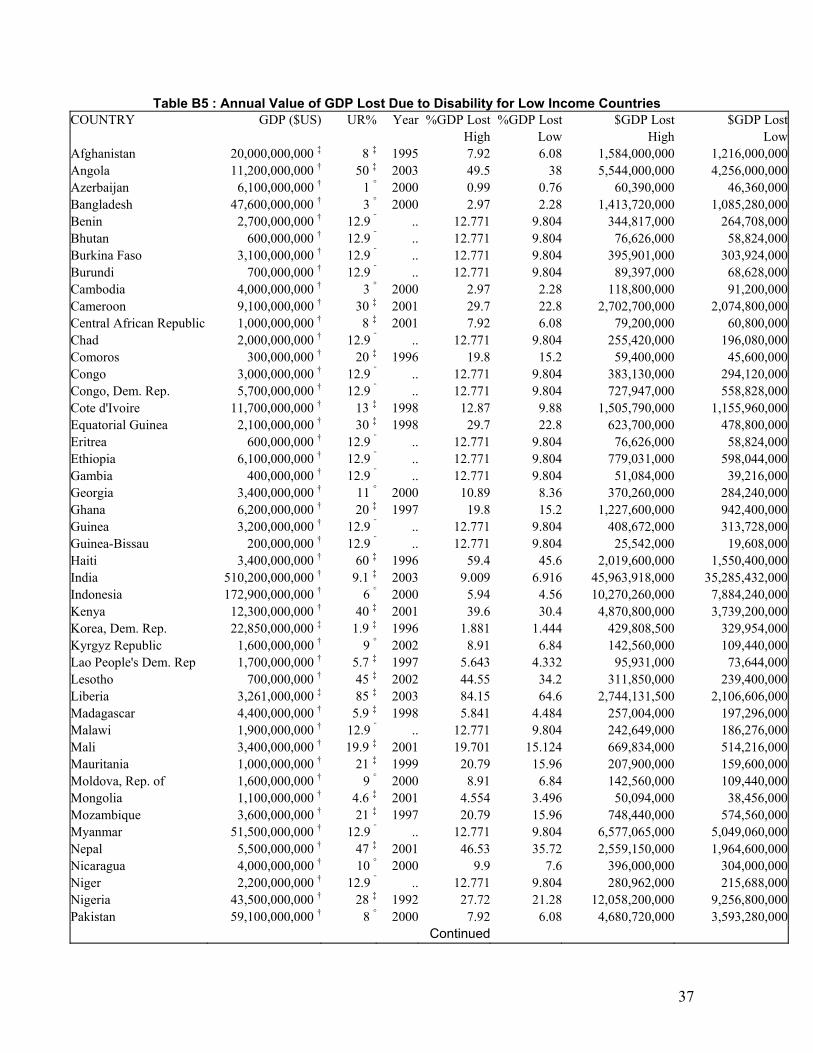
Table B5 : Annual Value of GDP Lost Due to Disability for Low Income Countries COUNTRY GDP ($US) UR% Year %GDP Lost %GDP Lost $GDP Lost $GDP Lost
High Low High LowAfghanistan 20,000,000,000 ‡ 8 ‡ 1995 7.92 6.08 1,584,000,000 1,216,000,000Angola 11,200,000,000 † 50 ‡ 2003 49.5 38 5,544,000,000 4,256,000,000Azerbaijan 6,100,000,000 † 1 ° 2000 0.99 0.76 60,390,000 46,360,000Bangladesh 47,600,000,000 † 3 ° 2000 2.97 2.28 1,413,720,000 1,085,280,000Benin 2,700,000,000 † 12.9 ¨ .. 12.771 9.804 344,817,000 264,708,000Bhutan 600,000,000 † 12.9 ¨ .. 12.771 9.804 76,626,000 58,824,000Burkina Faso 3,100,000,000 † 12.9 ¨ .. 12.771 9.804 395,901,000 303,924,000Burundi 700,000,000 † 12.9 ¨ .. 12.771 9.804 89,397,000 68,628,000Cambodia 4,000,000,000 † 3 ° 2000 2.97 2.28 118,800,000 91,200,000Cameroon 9,100,000,000 † 30 ‡ 2001 29.7 22.8 2,702,700,000 2,074,800,000Central African Republic 1,000,000,000 † 8 ‡ 2001 7.92 6.08 79,200,000 60,800,000Chad 2,000,000,000 † 12.9 ¨ .. 12.771 9.804 255,420,000 196,080,000Comoros 300,000,000 † 20 ‡ 1996 19.8 15.2 59,400,000 45,600,000Congo 3,000,000,000 † 12.9 ¨ .. 12.771 9.804 383,130,000 294,120,000Congo, Dem. Rep. 5,700,000,000 † 12.9 ¨ .. 12.771 9.804 727,947,000 558,828,000Cote d'Ivoire 11,700,000,000 † 13 ‡ 1998 12.87 9.88 1,505,790,000 1,155,960,000Equatorial Guinea 2,100,000,000 † 30 ‡ 1998 29.7 22.8 623,700,000 478,800,000Eritrea 600,000,000 † 12.9 ¨ .. 12.771 9.804 76,626,000 58,824,000Ethiopia 6,100,000,000 † 12.9 ¨ .. 12.771 9.804 779,031,000 598,044,000Gambia 400,000,000 † 12.9 ¨ .. 12.771 9.804 51,084,000 39,216,000Georgia 3,400,000,000 † 11 ° 2000 10.89 8.36 370,260,000 284,240,000Ghana 6,200,000,000 † 20 ‡ 1997 19.8 15.2 1,227,600,000 942,400,000Guinea 3,200,000,000 † 12.9 ¨ .. 12.771 9.804 408,672,000 313,728,000Guinea-Bissau 200,000,000 † 12.9 ¨ .. 12.771 9.804 25,542,000 19,608,000Haiti 3,400,000,000 † 60 ‡ 1996 59.4 45.6 2,019,600,000 1,550,400,000India 510,200,000,000 † 9.1 ‡ 2003 9.009 6.916 45,963,918,000 35,285,432,000Indonesia 172,900,000,000 † 6 ° 2000 5.94 4.56 10,270,260,000 7,884,240,000Kenya 12,300,000,000 † 40 ‡ 2001 39.6 30.4 4,870,800,000 3,739,200,000Korea, Dem. Rep. 22,850,000,000 ‡ 1.9 ‡ 1996 1.881 1.444 429,808,500 329,954,000Kyrgyz Republic 1,600,000,000 † 9 ° 2002 8.91 6.84 142,560,000 109,440,000Lao People's Dem. Rep 1,700,000,000 † 5.7 ‡ 1997 5.643 4.332 95,931,000 73,644,000Lesotho 700,000,000 † 45 ‡ 2002 44.55 34.2 311,850,000 239,400,000Liberia 3,261,000,000 ‡ 85 ‡ 2003 84.15 64.6 2,744,131,500 2,106,606,000Madagascar 4,400,000,000 † 5.9 ‡ 1998 5.841 4.484 257,004,000 197,296,000Malawi 1,900,000,000 † 12.9 ¨ .. 12.771 9.804 242,649,000 186,276,000Mali 3,400,000,000 † 19.9 ‡ 2001 19.701 15.124 669,834,000 514,216,000Mauritania 1,000,000,000 † 21 ‡ 1999 20.79 15.96 207,900,000 159,600,000Moldova, Rep. of 1,600,000,000 † 9 ° 2000 8.91 6.84 142,560,000 109,440,000Mongolia 1,100,000,000 † 4.6 ‡ 2001 4.554 3.496 50,094,000 38,456,000Mozambique 3,600,000,000 † 21 ‡ 1997 20.79 15.96 748,440,000 574,560,000Myanmar 51,500,000,000 † 12.9 ¨ .. 12.771 9.804 6,577,065,000 5,049,060,000Nepal 5,500,000,000 † 47 ‡ 2001 46.53 35.72 2,559,150,000 1,964,600,000Nicaragua 4,000,000,000 † 10 ° 2000 9.9 7.6 396,000,000 304,000,000Niger 2,200,000,000 † 12.9 ¨ .. 12.771 9.804 280,962,000 215,688,000Nigeria 43,500,000,000 † 28 ‡ 1992 27.72 21.28 12,058,200,000 9,256,800,000Pakistan 59,100,000,000 † 8 ° 2000 7.92 6.08 4,680,720,000 3,593,280,000 Continued
37
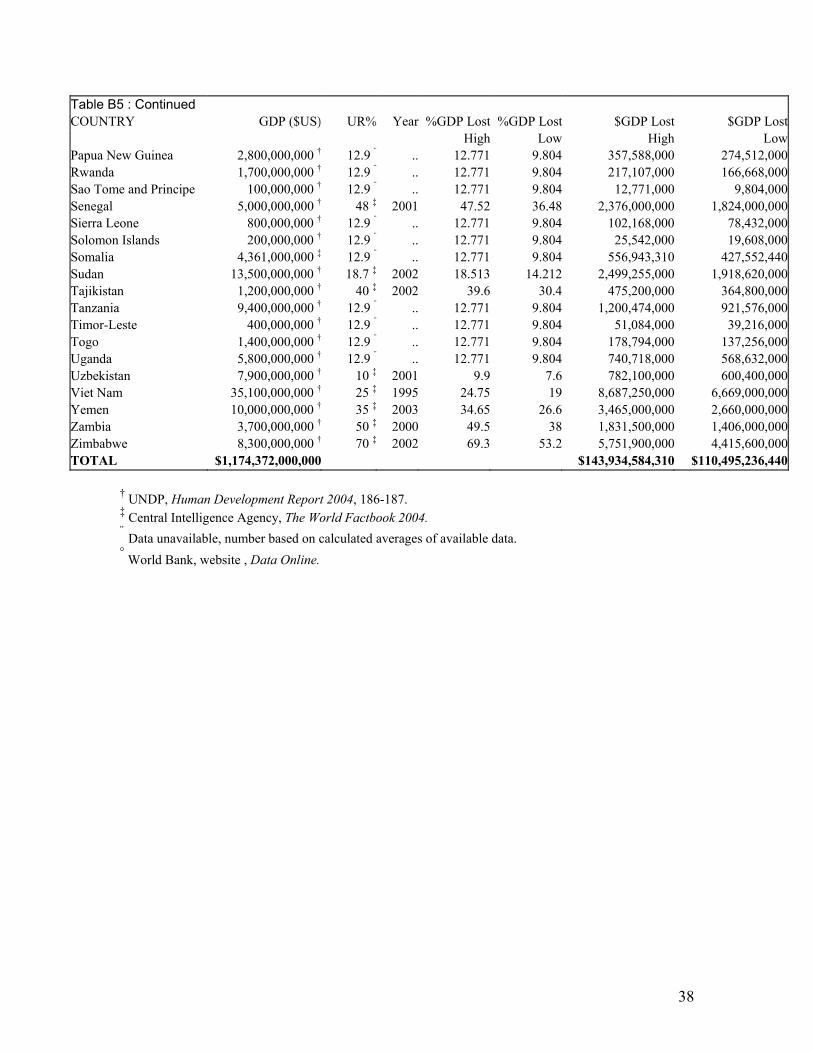
Table B5 : Continued COUNTRY GDP ($US) UR% Year %GDP Lost %GDP Lost $GDP Lost $GDP Lost
High Low High LowPapua New Guinea 2,800,000,000 † 12.9 ¨ .. 12.771 9.804 357,588,000 274,512,000Rwanda 1,700,000,000 † 12.9 ¨ .. 12.771 9.804 217,107,000 166,668,000Sao Tome and Principe 100,000,000 † 12.9 ¨ .. 12.771 9.804 12,771,000 9,804,000Senegal 5,000,000,000 † 48 ‡ 2001 47.52 36.48 2,376,000,000 1,824,000,000Sierra Leone 800,000,000 † 12.9 ¨ .. 12.771 9.804 102,168,000 78,432,000Solomon Islands 200,000,000 † 12.9 ¨ .. 12.771 9.804 25,542,000 19,608,000Somalia 4,361,000,000 ‡ 12.9 ¨ .. 12.771 9.804 556,943,310 427,552,440Sudan 13,500,000,000 † 18.7 ‡ 2002 18.513 14.212 2,499,255,000 1,918,620,000Tajikistan 1,200,000,000 † 40 ‡ 2002 39.6 30.4 475,200,000 364,800,000Tanzania 9,400,000,000 † 12.9 ¨ .. 12.771 9.804 1,200,474,000 921,576,000Timor-Leste 400,000,000 † 12.9 ¨ .. 12.771 9.804 51,084,000 39,216,000Togo 1,400,000,000 † 12.9 ¨ .. 12.771 9.804 178,794,000 137,256,000Uganda 5,800,000,000 † 12.9 ¨ .. 12.771 9.804 740,718,000 568,632,000Uzbekistan 7,900,000,000 † 10 ‡ 2001 9.9 7.6 782,100,000 600,400,000Viet Nam 35,100,000,000 † 25 ‡ 1995 24.75 19 8,687,250,000 6,669,000,000Yemen 10,000,000,000 † 35 ‡ 2003 34.65 26.6 3,465,000,000 2,660,000,000Zambia 3,700,000,000 † 50 ‡ 2000 49.5 38 1,831,500,000 1,406,000,000Zimbabwe 8,300,000,000 † 70 ‡ 2002 69.3 53.2 5,751,900,000 4,415,600,000TOTAL $1,174,372,000,000 $143,934,584,310 $110,495,236,440
† UNDP, Human Development Report 2004, 186-187. ‡ Central Intelligence Agency, The World Factbook 2004. ¨ Data unavailable, number based on calculated averages of available data. ° World Bank, website , Data Online.
38
APPENDIX C
ACCESSIBLE DESIGN CASE STUDIES
The following five South African case studies illustrate that accessibility provision can be cost-effectively accomplished in a variety of settings.48
Case 1: An Accessible Large International Conference Center
The International Conference Center (ICC) in Durban, South Africa illustrates the cost-effectiveness of incorporating accessibility into a world-class public facility. 49 At an early stage in its construction, it became apparent that the complex did not meet international accessibility standards. After intervention by accessibility advocates, the design consortium responsible for the project was given a directive to change the design to conform with the ADA Guidelines, ISO TR 9527 and the British Fire Evacuation Code BS 5588. This decision to utilize a combination of international codes was based on various perceived shortcomings in the ADA Guidelines. In addition, communication systems, orientation aids and signage were to be made accessible using Universal Design principles. Accessibility was to be incorporated into the design of the complex using Universal Design principles with minimal, if any, special features exclusively designed for people with disabilities. The total construction cost for the Center, completed in September 1997, was R280,000,000. The estimated total cost of accessibility provision, including the upgrading to international accessibility standards was R 1,670,000. Expressed as a percentage of the total capital cost, the provision of accessibility was 0.59%. Despite the fact that accessibility issues were not addressed until after initial construction had commenced, thus creating a partial retrofit situation, the proportional cost of accessibility provision was extremely low. Had accessibility been integrated into the original design, the cost may well have been lower.
Case 2: An Accessible Community Center East of Cape Town, informal settlements are in the process of being transformed from “townships” into formal urban neighborhoods. Community centers are being developed to provide multifunctional space for a range of activities from adult education to sports. One of these, the Ikwezi Community Center in Gugulethu was designed to provide nearly complete environmental accessibility (with the single exception of an inaccessible viewing gallery in the Main Hall). The complex consists of a large multipurpose hall with ancillary accommodation, a smaller sub-dividable hall with adjacent storage space for equipment and furniture, a gymnasium with sports offices, a small open amphitheater, a computer center and an administration center. The complex, completed in 1998, was built with direct community participation by an emerging contractor.
48 Information for the five Case Studies was provided by Philip Thompson, BArch (Natal), Arch (BA), Arch(SA), MIAArb, Dip IEM (UCT), Africa Chair, International Commission on Technology and Accessibility based on his experience with the projects in South Africa. 49 Information for this Case Study was drawn from the ICC Durban Accessibility Audit prepared by the Architects Consortium Stauch Vorster Architects in Association with Hallen Custers Smith and Johnson Murray Architects, Durban, 1997.
39
The site is flat, which eliminated the cost of ramping. Accessibility provision included dedicated parking bays, access to all components of the complex (with the one exception mentioned), strong color contrasts around doors and entrances and other way finding support, teletext facilities and the standard unisex accessible toilet. Limited signage was provided in the complex, as the strong color contrasts of the buildings were used to orient building users. By applying Universal Design principles in the design of the majority of the project’s spaces and facilities, accessibility related expenses were limited to the following costs for an accessible unisex toilet, teletext facilities and articulated paintwork:
Unisex accessible toilet facility R 5,500 Integral teletext equipment R 1,200 Articulated paintwork R 1,600 TOTAL COSTS R 8,300
Though paving slabs created a step into one building in the complex, and though the gallery in the Main Hall was not accessible, the Ikwezi Community center was largely accessible and had all the facilities necessary to make it an appropriate facility for the full social integration of people with disabilities into the Gugulethu Community. The final cost of construction was R1,768,700, and the cost of providing accessibility was R 8,300. Thus the proportional cost of incorporating accessibility into the project was only 0.47% of the cost of the project.
Case 3: Retrofitting Accessibility During the Final Stages of School Construction The Reservoir Hills Secondary School, located in Durban, was retrofitted for accessibility in the final stages of the project. Completed in 1991, the school was designed to accommodate 800 pupils. The format included twenty-seven classrooms, an administrative building, twenty specialist classrooms, a library resource center and toilet facilities. The costs of accessibility provision were as follows:
Two accessible parking bays with cover linked to the covered access-ways. R 7,600 Raised curb edgings along all accessible walkways which are adjacent to unhardened areas and changes in level. R 2,500 Kick plates to doors and lever action iron fixtures at required heights. R14,200 Three unisex accessible toilets with all requisite fittings. R11,800 Adjustments to fittings and furnishings for accessible work tops, counters and shelving. R12,600 New signage to facilitate way finding and orientation. R 5,700
Total Cost R 53,800
The cost of the retrofit of accessibility into this school during the final phases of the building process (R 53,800) represented only 1.08% of the schools total cost (R 4,955,300).
40
Case 4: Accessibility Incorporated into the Original Design of a School
The Gamalake Lower Primary School, located on the South Coast of the area now known as the province of KwaZulu Natal, is a standard design format school developed within the framework of the reduced norms and standards introduced by the KwaZulu Government. It consists of twenty-four classrooms, an administrative building, one multipurpose classroom and toilet facilities. Accessibility was incorporated into the original design of the school, which was completed in 1997.
The only additional expenditures identified were the costs of an entrance ramp between the parking level and the school, two unisex accessible toilets and larger signage. Under the South African Code 0400 it is possible to reduce the number of toilet fittings by the number of accessible unisex toilet facilities provided in the building. The net cost of an accessible toilet is thus the additional cost of providing the larger separate cubicle, grab rails and other requisite fittings. Since the school had been designed for accessibility from the outset, all access ways, entrances and circulation systems had been ramped and graded appropriately. The costs of the additional accessibility items were as follows:
Entrance ramp from the parking area R 23,000 Additional cost for unisex accessible toilets R 9,800 Enlarging signage to facilitate way finding R 3,200 TOTAL COST R 36,000
The cost of incorporating accessibility into this school’s original design (R 36,000) was only 0.78% of the school’s total cost (R 4,603,700).
Case 5: Provision of Necessary Separate Facilities at a School
The majority of the topography of the, then, Transkei region of South Africa is rugged with very poor road infrastructure. Schools are located on the most level sites in an attempt to reduce the costs of civil earthworks. It is common practice in this region not to provide schools with interlinking hardened or covered access ways. Due to the lack of reticulated water supplies, toilet facilities are provided in the form of “ventilated improved pit toilets” which are located a distance away from the school buildings. To achieve accessibility, an accessible unisex pit toilet is typically located separately in a locality closer to the school buildings than the other toilets, with uncovered hardened access at suitable gradients.
The Mzomhle Junior Secondary School is such a facility located outside of the town of Sterkspruit. Construction was completed in 1996. The school consists of twelve classrooms in bungalow style classroom blocks, with a very small administration block and the toilet facilities described. The provision of a separate accessible pit toilet for a relatively small number of people with disabilities represented a large proportional outlay for accessibility, as one pit toilet usually serves up to twenty classrooms. The costs of the pit toilet and the associated hardened access, are as follows:
41
Unisex accessible pit toilet R 4,700 Hardened access to accessible toilet R 1,900 TOTAL COST R 6,600
The total cost of the school complex was R 954,600. Therefore, the proportional cost of this separate provision was only 0.69% of the total cost of the project.
42
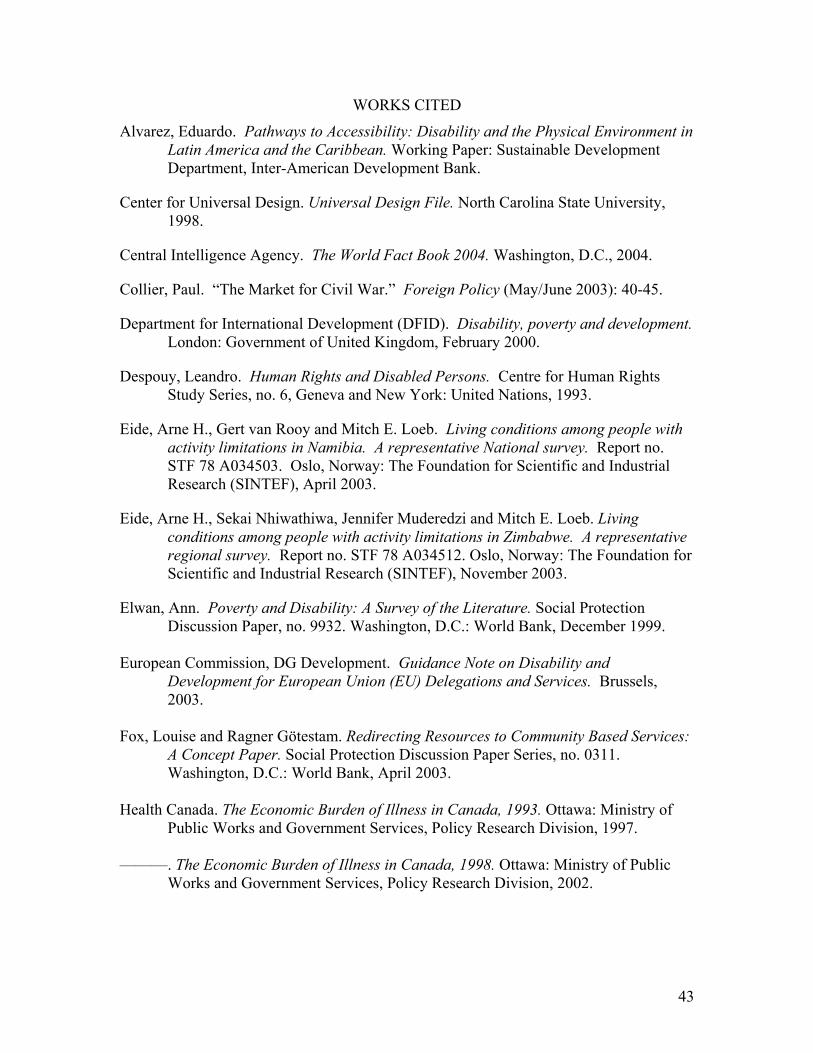
WORKS CITED
Alvarez, Eduardo. Pathways to Accessibility: Disability and the Physical Environment in Latin America and the Caribbean. Working Paper: Sustainable Development Department, Inter-American Development Bank.
Center for Universal Design. Universal Design File. North Carolina State University, 1998.
Central Intelligence Agency. The World Fact Book 2004. Washington, D.C., 2004.
Collier, Paul. “The Market for Civil War.” Foreign Policy (May/June 2003): 40-45.
Department for International Development (DFID). Disability, poverty and development. London: Government of United Kingdom, February 2000.
Despouy, Leandro. Human Rights and Disabled Persons. Centre for Human Rights Study Series, no. 6, Geneva and New York: United Nations, 1993.
Eide, Arne H., Gert van Rooy and Mitch E. Loeb. Living conditions among people with activity limitations in Namibia. A representative National survey. Report no. STF 78 A034503. Oslo, Norway: The Foundation for Scientific and Industrial Research (SINTEF), April 2003.
Eide, Arne H., Sekai Nhiwathiwa, Jennifer Muderedzi and Mitch E. Loeb. Living conditions among people with activity limitations in Zimbabwe. A representative regional survey. Report no. STF 78 A034512. Oslo, Norway: The Foundation for Scientific and Industrial Research (SINTEF), November 2003.
Elwan, Ann. Poverty and Disability: A Survey of the Literature. Social Protection Discussion Paper, no. 9932. Washington, D.C.: World Bank, December 1999.
European Commission, DG Development. Guidance Note on Disability and
Development for European Union (EU) Delegations and Services. Brussels, 2003.
Fox, Louise and Ragner Götestam. Redirecting Resources to Community Based Services:
A Concept Paper. Social Protection Discussion Paper Series, no. 0311. Washington, D.C.: World Bank, April 2003.
Health Canada. The Economic Burden of Illness in Canada, 1993. Ottawa: Ministry of
Public Works and Government Services, Policy Research Division, 1997. ———. The Economic Burden of Illness in Canada, 1998. Ottawa: Ministry of Public
Works and Government Services, Policy Research Division, 2002.
43
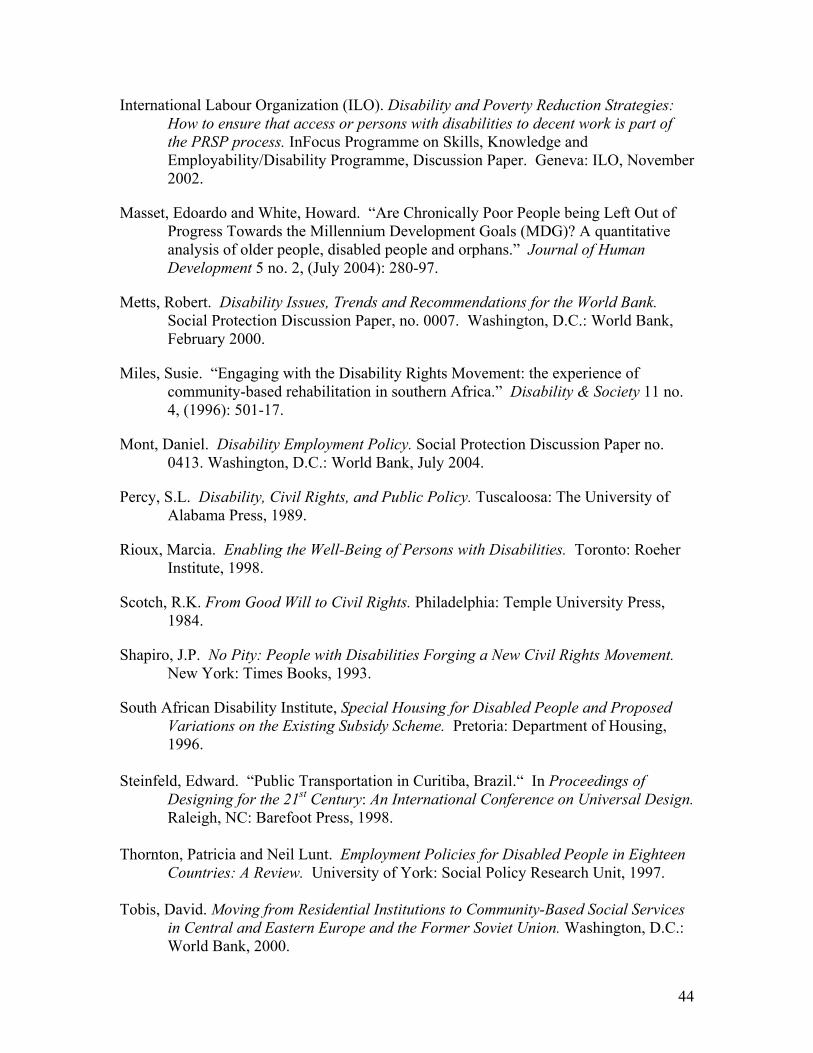
International Labour Organization (ILO). Disability and Poverty Reduction Strategies: How to ensure that access or persons with disabilities to decent work is part of the PRSP process. InFocus Programme on Skills, Knowledge and Employability/Disability Programme, Discussion Paper. Geneva: ILO, November 2002.
Masset, Edoardo and White, Howard. “Are Chronically Poor People being Left Out of Progress Towards the Millennium Development Goals (MDG)? A quantitative analysis of older people, disabled people and orphans.” Journal of Human Development 5 no. 2, (July 2004): 280-97.
Metts, Robert. Disability Issues, Trends and Recommendations for the World Bank. Social Protection Discussion Paper, no. 0007. Washington, D.C.: World Bank, February 2000.
Miles, Susie. “Engaging with the Disability Rights Movement: the experience of community-based rehabilitation in southern Africa.” Disability & Society 11 no. 4, (1996): 501-17.
Mont, Daniel. Disability Employment Policy. Social Protection Discussion Paper no. 0413. Washington, D.C.: World Bank, July 2004.
Percy, S.L. Disability, Civil Rights, and Public Policy. Tuscaloosa: The University of Alabama Press, 1989.
Rioux, Marcia. Enabling the Well-Being of Persons with Disabilities. Toronto: Roeher Institute, 1998.
Scotch, R.K. From Good Will to Civil Rights. Philadelphia: Temple University Press, 1984.
Shapiro, J.P. No Pity: People with Disabilities Forging a New Civil Rights Movement. New York: Times Books, 1993.
South African Disability Institute, Special Housing for Disabled People and Proposed Variations on the Existing Subsidy Scheme. Pretoria: Department of Housing, 1996.
Steinfeld, Edward. “Public Transportation in Curitiba, Brazil.“ In Proceedings of
Designing for the 21st Century: An International Conference on Universal Design. Raleigh, NC: Barefoot Press, 1998.
Thornton, Patricia and Neil Lunt. Employment Policies for Disabled People in Eighteen
Countries: A Review. University of York: Social Policy Research Unit, 1997. Tobis, David. Moving from Residential Institutions to Community-Based Social Services
in Central and Eastern Europe and the Former Soviet Union. Washington, D.C.: World Bank, 2000.
44
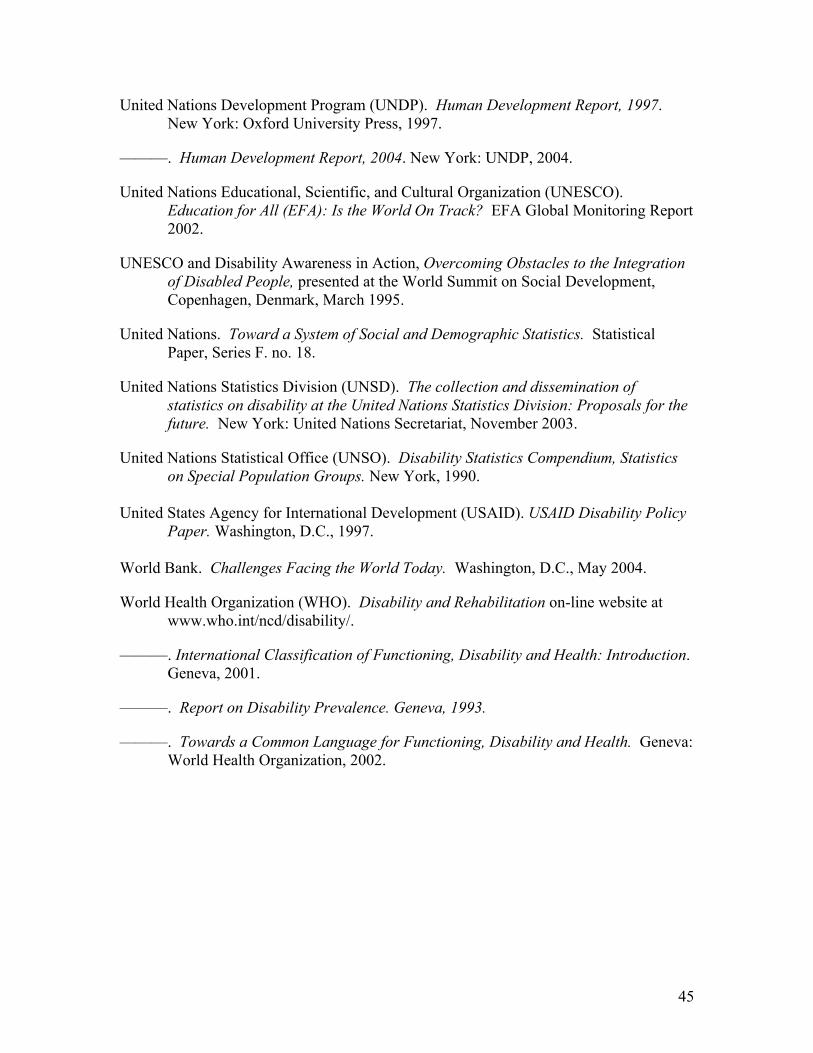
45
United Nations Development Program (UNDP). Human Development Report, 1997. New York: Oxford University Press, 1997.
———. Human Development Report, 2004. New York: UNDP, 2004.
United Nations Educational, Scientific, and Cultural Organization (UNESCO). Education for All (EFA): Is the World On Track? EFA Global Monitoring Report 2002.
UNESCO and Disability Awareness in Action, Overcoming Obstacles to the Integration of Disabled People, presented at the World Summit on Social Development, Copenhagen, Denmark, March 1995.
United Nations. Toward a System of Social and Demographic Statistics. Statistical Paper, Series F. no. 18.
United Nations Statistics Division (UNSD). The collection and dissemination of statistics on disability at the United Nations Statistics Division: Proposals for the future. New York: United Nations Secretariat, November 2003.
United Nations Statistical Office (UNSO). Disability Statistics Compendium, Statistics on Special Population Groups. New York, 1990.
United States Agency for International Development (USAID). USAID Disability Policy
Paper. Washington, D.C., 1997. World Bank. Challenges Facing the World Today. Washington, D.C., May 2004.
World Health Organization (WHO). Disability and Rehabilitation on-line website at www.who.int/ncd/disability/.
———. International Classification of Functioning, Disability and Health: Introduction. Geneva, 2001.
———. Report on Disability Prevalence. Geneva, 1993.
———. Towards a Common Language for Functioning, Disability and Health. Geneva: World Health Organization, 2002.