Embed Size (px)
Citation preview
A Public Eye Investigation – September 2016
Dirty Diesel How Swiss Traders Flood Africa with Toxic Fuels
Executive summary 3
Chapter 1 INTRODUCTION 9
Chapter 2 TOXIC GASOLINE: EVERY DAY SIDE OF THE PROBO KOALA SCANDAL 15
Chapter 3 A SILENT KILLER: AIR POLLUTION AND HIGH SULPHUR FUELS 19
Chapter 4 SWISS TRADERS: EMPIRE-BUILDING IN AFRICA’S DOWNSTREAM SECTOR 29
Chapter 5 DANCING WITH DEVILS: SWISS TRADING COMPANIES AND THEIR POLICIES OF MARKET ACCESS 39
Chapter 6 ACROSS AFRICA TO SAMPLE SWISS FUELS 49
Chapter 7 A BLEND OF DIRTY FUELS AND DIRTY POLITICS IN GHANA 65
Chapter 8 DIRTY TRADE FLOWS FROM EUROPE TO WEST AFRICA 81
Chapter 9 BLENDING: THE BASICS 89
Chapter 10 MAKING “AFRICAN QUALITY” FUELS 99
Chapter 11 IN EUROPE AND OFFSHORE: WHERE AFRICAN QUALITY FUELS ARE PRODUCED 113
Chapter 12 CONCLUSIONS: PUTTING PEOPLE BEFORE PROFIT 125
Glossary 134
Annexes 135
Endnotes 148
IMPRINT Dirty Diesel. How Swiss Traders Flood Africa with Toxic Fuels. A Public Eye Investigation, September 2016. | Authors Marc Guéniat, Marietta Harjono, Andreas Missbach, Gian-Valentino Viredaz | Contributors Olivier Longchamp, Urs Rybi, Géraldine Viret | Acknowledgment Oliver Classen, Silvie Lang, Lyssandra Sears | Editor Edward Harris | Publisher Raphaël de Riedmatten | Layout Karin Hutter, karinhutter.com | Print Vogt-Schild Druck AG, Cyclus Print, FSC (recycling) CONTACT Public Eye, Avenue Charles-Dickens 4, CH-1006 Lausanne, phone +41 (0)21 620 03 03, fax +41 (0)21 620 03 00, [email protected], www.publiceye.ch | Donations IBAN CH64 0900 0000 1001 0813 5 | © Public Eye, 2016. Reproduction permitted with editors’ prior consent. COVER PHOTO Ghana, June 2016 © Carl De Keyzer – Magnum
A Public Eye Investigation | September 2016 3
Executive summary 3
Chapter 1 INTRODUCTION 9
Chapter 2 TOXIC GASOLINE: EVERY DAY SIDE OF THE PROBO KOALA SCANDAL 15
Chapter 3 A SILENT KILLER: AIR POLLUTION AND HIGH SULPHUR FUELS 19
Chapter 4 SWISS TRADERS: EMPIRE-BUILDING IN AFRICA’S DOWNSTREAM SECTOR 29
Chapter 5 DANCING WITH DEVILS: SWISS TRADING COMPANIES AND THEIR POLICIES OF MARKET ACCESS 39
Chapter 6 ACROSS AFRICA TO SAMPLE SWISS FUELS 49
Chapter 7 A BLEND OF DIRTY FUELS AND DIRTY POLITICS IN GHANA 65
Chapter 8 DIRTY TRADE FLOWS FROM EUROPE TO WEST AFRICA 81
Chapter 9 BLENDING: THE BASICS 89
Chapter 10 MAKING “AFRICAN QUALITY” FUELS 99
Chapter 11 IN EUROPE AND OFFSHORE: WHERE AFRICAN QUALITY FUELS ARE PRODUCED 113
Chapter 12 CONCLUSIONS: PUTTING PEOPLE BEFORE PROFIT 125
Glossary 134
Annexes 135
Endnotes 148
Executive summary
Swiss commodity trading companies take advantage of weak fuel standards in Africa to produce, deliver and sell diesel and gasoline, which is damaging to people’s health. Their business model relies on an illegi timate strategy of deliberately lowering the quality of fuels in order to increase their profits. Using a common industry practice called blending, trading companies mix cheap but toxic intermediate petroleum products to make what the industry calls “African Quality” fuels. These intermediate products contain high levels of sulphur as well as other toxic substances such as benzene and aromatics. By selling such fuels at the pump in Africa, the traders increase outdoor air pollution, causing respiratory disease and premature death. This affects West Africa, in particular, because this is the region where the authorised levels of sulphur in fuels remain very high. West Africa does not have the refining capacity to produce enough gasoline and diesel for its own consumption, and so it must import the majority of its fuels from Europe and the US, where fuel standards are strict.
Fuels have been on the agenda for some time already. Beginning in 2002, the UN Environmental Programme (UNEP) conducted a ten-year campaign that led in most countries to a ban on lead in gasoline. However, fuels still account for other severe health issues. The issue of sulphur content must be urgently addressed.
This report is the result of three years of research by Public Eye (formerly the Berne Declaration). It highlights the contribution by the commodity trading industry to outdoor air pollution in Africa and the related health effects.
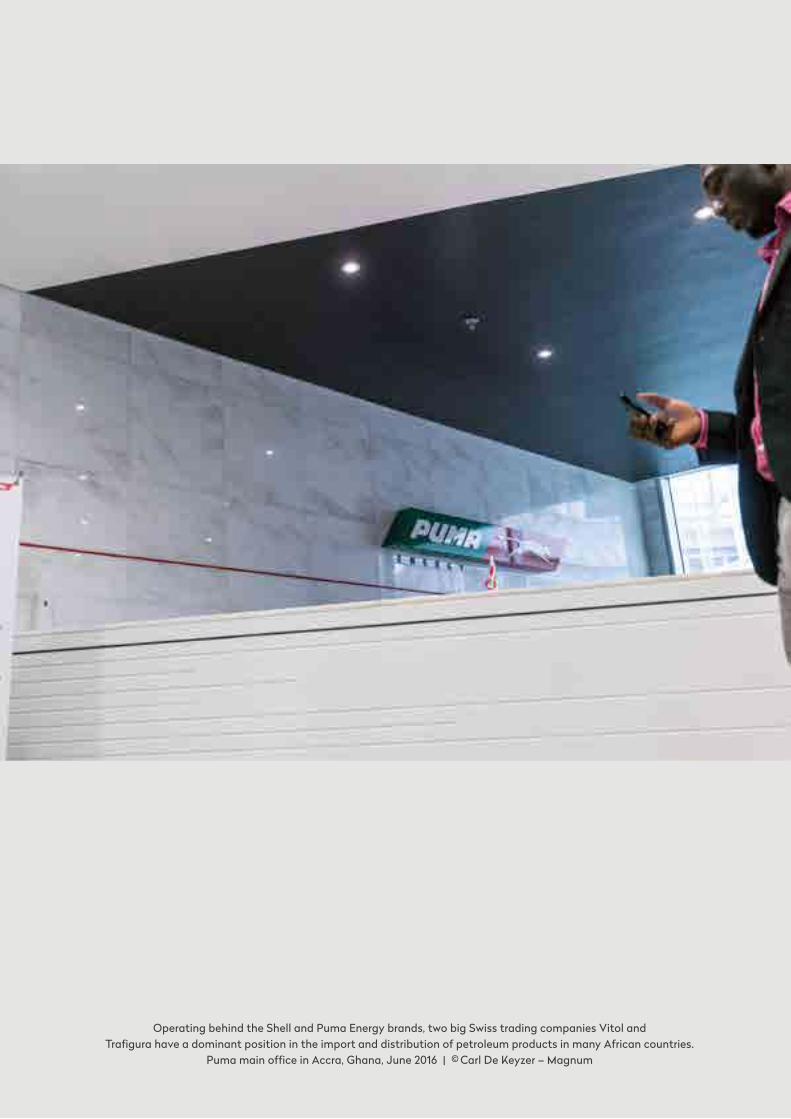
Operating behind the Shell and Puma Energy brands, two big Swiss trading companies Vitol and Trafigura have a dominant position in the import and distribution of petroleum products in many African countries.
Puma main office in Accra, Ghana, June 2016 | © Carl De Keyzer – Magnum
A Public Eye Investigation | September 2016 5
THE ISSUE: SULPHUR, A TICKING BOMB THAT NEEDS DEFUSING
African mega-cities such as Lagos or Dakar already have worse air quality than Beijing. Rapid urbanisation, the growing num-bers of cars, and the poor quality of these cars, which are mostly second hand, partly explains the worsening air pollution in African cities.
The crucial factor though is that most African countries still permit the use of high-sulphur diesel and gasoline. On average, African sulphur limits in diesel are 200 times above the Euro-pean limit, in some countries this figure is as high as 1,000.
Sulphur in fuels is crucial to air pollution because of its di-rect health-damaging effects but also because it destroys emis-sions control technologies in vehicles. As long as fuel sulphur content remains so high, any efforts to reduce air pollution (for example, by modernising Africa’s car fleet) will be in vain.
Without rapid and meaningful improvements in fuel quality, traffic-related air pollution will soon be a major health issue (see chapter 3). Respiratory diseases such as asthma, chronic ob-structive lung diseases, lung cancer and cardiovascular diseases will rise.
On the other hand the use of ultra-low sulphur fuels (10 parts per million [ppm] sulphur) would immediately halve the emissions of pollutants. If done together with the introduction of cars that use existing emissions control technologies, the emission of pollutants could be reduced by 99 percent.
THE PLAYERS: THE SWISS TRADING COMPANIES
The fuel business in Africa is very opaque. Over the past de-cade, important shifts have happened, almost unnoticed. As oil majors pulled out from Africa’s retail business, Swiss trading companies moved in, expanding downstream to control key as-sets such as storage facilities and hundreds of petrol stations across Africa (see chapter 4). Hidden from view by operating behind the Shell and Puma Energy brands, two big Swiss trad-ing companies Vitol and Trafigura, together with smaller Swiss companies, have a dominant position in the import and distri-bution of petroleum products in many African countries, espe-cially in West Africa. Other heavyweights, namely Glencore, Mercuria and Gunvor, that don’t own petrol station networks, are equally important in supplying African markets. To access markets and increase their market share, they often rely on dodgy local door-openers or other politically exposed persons (see chapter 5).
THE TEST: SAMPLING AT THE PUMP
Public Eye tested fuels sold at the pump by Swiss trading compa-nies (see chapter 6). Countries were selected based on their weak fuel standards and on the presence of petrol stations owned by Swiss trading companies. We analysed samples from eight coun-tries: Angola, Benin, the Republic of the Congo, Ghana, Côte d'Ivoire, Mali, Senegal and Zambia. The trading companies sam-
pled were Trafigura (operating through Puma, Pumangol, Gazelle trading, UBI), Vitol (Vivo Energy with Shell brand), Addax & Oryx Group (Oryx) and Lynx Energy (X-Oil).
More than two thirds of the diesel samples (17 out of 25) had a sulphur level higher than 1,500 ppm, which is 150 times the European limit of 10 ppm. The highest level of sulphur was in a diesel sample from one of Oryx’s petrol stations in Mali, where the sulphur content was 3,780 ppm. Almost half of the gasoline samples (10 out of 22) have a sulphur level between 15 and 72 times the European limit of 10 ppm. Worryingly, we also detected other health damaging substances in concentrations that would never be allowed in a European or US fuel. These substances include polyaromatics (diesel), aromatics and benzene (gasoline). In a number of samples, we found traces of metals that would also contribute to higher emissions of pollutants and damage car engines too.
THE CONTEXT: TOXIC FUELS BROUGHT TO AFRICA
West Africa is a significant producer of crude oil. But due to its lack of refining capacity, the region must import roughly half of its diesel and gasoline, which is high in sulphur, mostly from Europe and the US.
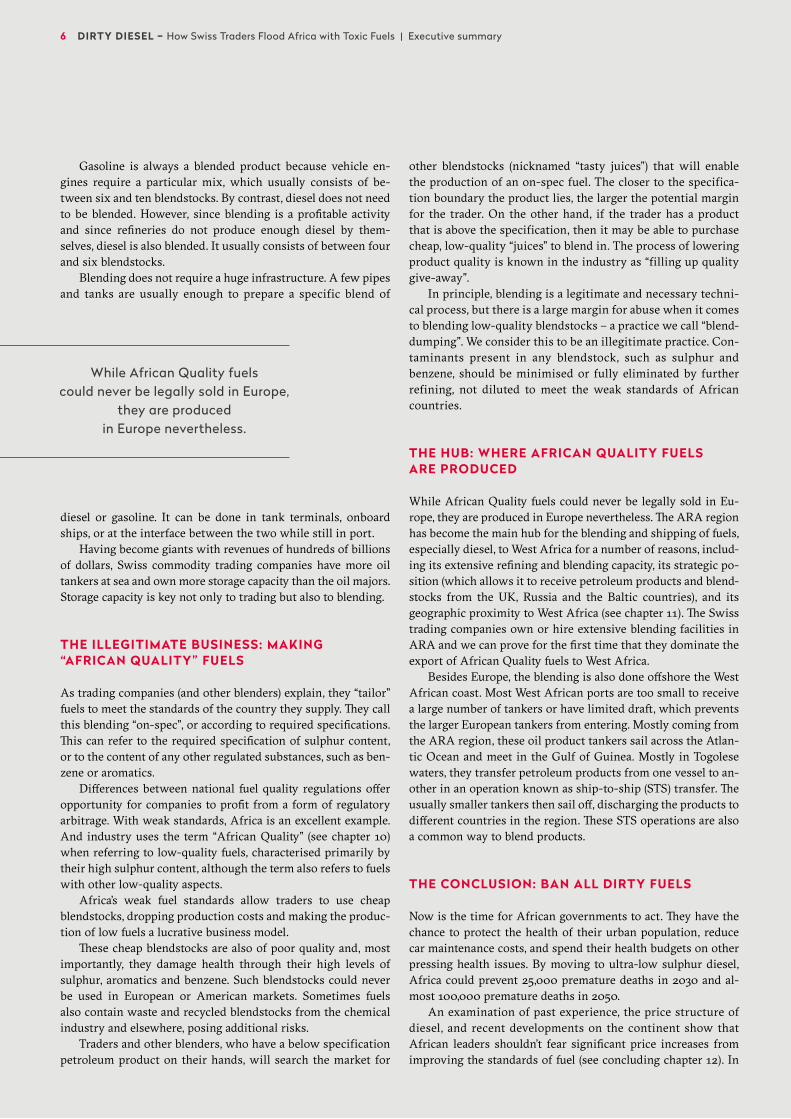
Around 50 percent of the fuels imported to West Africa come from Amsterdam, Rotterdam and Antwerp, collectively known as the “ARA” region (see chapter 8). Trade statistics show 80 percent of the diesel exported from ARA to Africa has sulphur content at least 100 times above the European standard. This figure soared to an average 90 percent for West Africa, with Ghana (93 percent), Guinea (100 percent), Senegal (82 percent), Nigeria (84 percent) and Togo (96 percent) receiving the biggest volumes.
Based on specific cargoes, official documents from Ghana show that, in both 2013 and 2014, diesel imports contained sul-phur levels extremely close to the legal limit. This all happened even as specifications were changed between 2013 and 2014. This shows how trading companies are able quickly to adapt to new standards, sticking as close as possible to the limit (see chapter 7).
Swiss trading companies play a major role in transporting fuel from the ARA region, and from the US, to West Africa. In the case of Ghana, these companies delivered most of the known high sulphur cargoes in 2013 and 2014.
THE BUSINESS: BLENDING FUELS
Contrary to what most people might think, fuels such as diesel or gasoline tend not to come straight from refineries. Instead, the refineries produce intermediate products, which are then mixed together, occasionally with intermediate products from other sources (such as the chemical industry). This process is called “blending” (see chapter 9). To make matters more com-plex, different types of refineries produce different intermediate products or “blendstocks”.
Gasoline is always a blended product because vehicle en-gines require a particular mix, which usually consists of be-tween six and ten blendstocks. By contrast, diesel does not need to be blended. However, since blending is a profitable activity and since refineries do not produce enough diesel by them-selves, diesel is also blended. It usually consists of between four and six blendstocks.
Blending does not require a huge infrastructure. A few pipes and tanks are usually enough to prepare a specific blend of
diesel or gasoline. It can be done in tank terminals, onboard ships, or at the interface between the two while still in port.
Having become giants with revenues of hundreds of billions of dollars, Swiss commodity trading companies have more oil tankers at sea and own more storage capacity than the oil majors. Storage capacity is key not only to trading but also to blending.
THE ILLEGITIMATE BUSINESS: MAKING “AFRICAN QUALITY” FUELS
As trading companies (and other blenders) explain, they “tailor” fuels to meet the standards of the country they supply. They call this blending “on-spec”, or according to required specifications. This can refer to the required specification of sulphur content, or to the content of any other regulated substances, such as ben-zene or aromatics.
Differences between national fuel quality regulations offer opportunity for companies to profit from a form of regulatory arbitrage. With weak standards, Africa is an excellent example. And industry uses the term “African Quality” (see chapter 10) when referring to low-quality fuels, characterised primarily by their high sulphur content, although the term also refers to fuels with other low-quality aspects.
Africa’s weak fuel standards allow traders to use cheap blendstocks, dropping production costs and making the produc-tion of low fuels a lucrative business model.
These cheap blendstocks are also of poor quality and, most importantly, they damage health through their high levels of sulphur, aromatics and benzene. Such blendstocks could never be used in European or American markets. Sometimes fuels also contain waste and recycled blendstocks from the chemical industry and elsewhere, posing additional risks.
Traders and other blenders, who have a below specification petroleum product on their hands, will search the market for
other blendstocks (nicknamed “tasty juices”) that will enable the production of an on-spec fuel. The closer to the specifica-tion boundary the product lies, the larger the potential margin for the trader. On the other hand, if the trader has a product that is above the specification, then it may be able to purchase cheap, low-quality “juices” to blend in. The process of lowering product quality is known in the industry as “filling up quality give-away”.
In principle, blending is a legitimate and necessary techni-cal process, but there is a large margin for abuse when it comes to blending low-quality blendstocks – a practice we call “blend- dumping”. We consider this to be an illegitimate practice. Con-taminants present in any blendstock, such as sulphur and benzene, should be minimised or fully eliminated by further refining, not diluted to meet the weak standards of African countries.
THE HUB: WHERE AFRICAN QUALITY FUELS ARE PRODUCED
While African Quality fuels could never be legally sold in Eu-rope, they are produced in Europe nevertheless. The ARA region has become the main hub for the blending and shipping of fuels, especially diesel, to West Africa for a number of reasons, includ-ing its extensive refining and blending capacity, its strategic po-sition (which allows it to receive petroleum products and blend-stocks from the UK, Russia and the Baltic countries), and its geographic proximity to West Africa (see chapter 11). The Swiss trading companies own or hire extensive blending facilities in ARA and we can prove for the first time that they dominate the export of African Quality fuels to West Africa.
Besides Europe, the blending is also done offshore the West African coast. Most West African ports are too small to receive a large number of tankers or have limited draft, which prevents the larger European tankers from entering. Mostly coming from the ARA region, these oil product tankers sail across the Atlan-tic Ocean and meet in the Gulf of Guinea. Mostly in Togolese waters, they transfer petroleum products from one vessel to an-other in an operation known as ship-to-ship (STS) transfer. The usually smaller tankers then sail off, discharging the products to different countries in the region. These STS operations are also a common way to blend products.
THE CONCLUSION: BAN ALL DIRTY FUELS
Now is the time for African governments to act. They have the chance to protect the health of their urban population, reduce car maintenance costs, and spend their health budgets on other pressing health issues. By moving to ultra-low sulphur diesel, Africa could prevent 25,000 premature deaths in 2030 and al-most 100,000 premature deaths in 2050.
An examination of past experience, the price structure of diesel, and recent developments on the continent show that African leaders shouldn’t fear significant price increases from improving the standards of fuel (see concluding chapter 12). In
While African Quality fuels could never be legally sold in Europe,
they are produced in Europe nevertheless.
6 DIRTY DIESEL – How Swiss Traders Flood Africa with Toxic Fuels | Executive summary
A Public Eye Investigation | September 2016 7
January 2015, for example, five East African countries adopted low sulphur fuels with no impact on prices at the pump, or on government spending through subsidies.
A limited increase of prices at the pump should in any case be balanced with the health and associated savings of reducing air pollution from high sulphur fuels. The savings from better health are by far higher than the effects of the potential costs of cleaner fuels.
Four different sets of actors should take decisive steps im-mediately:
African governments (and others with weak fuel standards) should set stringent fuel quality standards of 10 ppm sulphur for diesel and gasoline, and introduce European limits on other health damaging substances. Whether or not they have suffi-cient refining capacity in the country or can only import, gov-ernments should be strict with implementing fuel standards. If not, their fuels will quickly contain bad blendstocks. The blend-
ers know exactly which standards apply where, and how best they can dump their African Quality blends.
Swiss trading companies should stop abusing Africa’s low fuel quality standards, recognize that if left unchanged their prac-tices will kill more and more people across the continent, and immediately produce and sell to African countries only fuels that would meet Europe’s high fuel quality standards.
Governments of export hubs for African fuels (such as Amster-dam, Antwerp or the US Gulf) should prohibit the export of any health damaging fuels or blendstocks, which would never be used in their own country.
The Swiss government should implement mandatory human rights and environmental due diligence requirements for Swiss companies, covering the entire supply chain and including po-tentially toxic products.
Around 50 percent of the fuels imported to West Africa come from Amsterdam, Rotterdam and Antwerp, collectively known as the “ARA” region. Port of Amsterdam, Netherlands, June 2016 | © Carl De Keyzer – Magnum
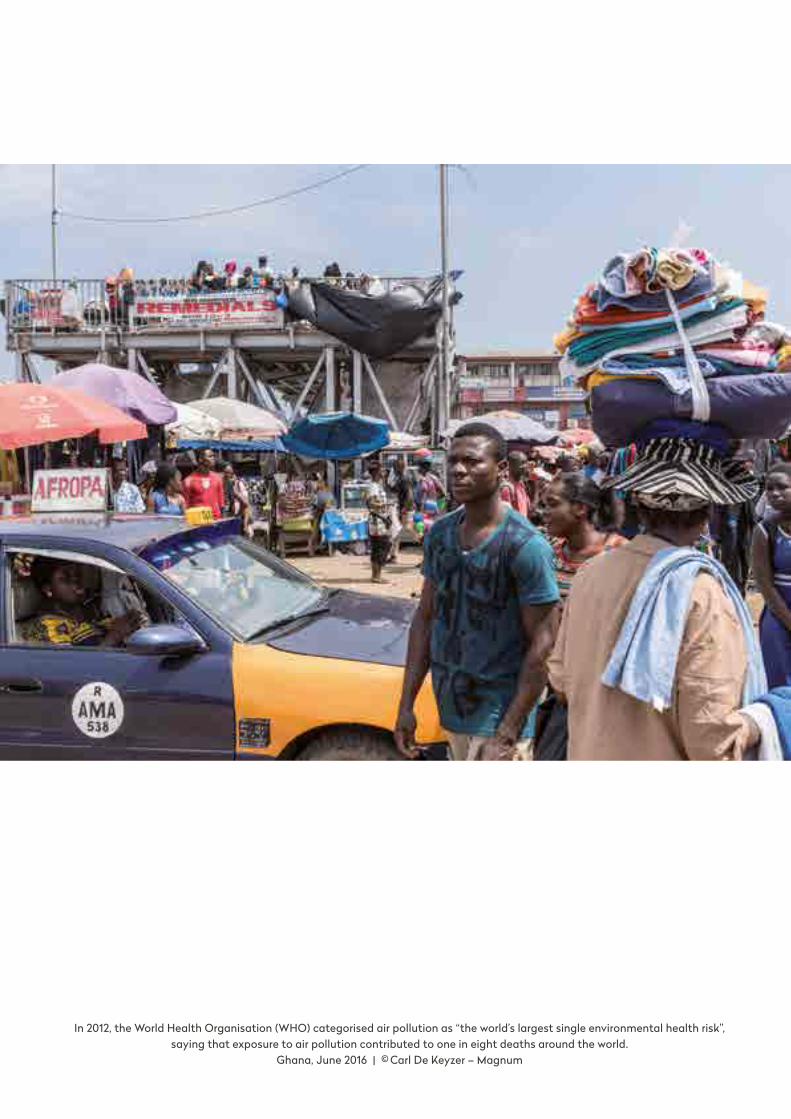
In 2012, the World Health Organisation (WHO) categorised air pollution as “the world’s largest single environmental health risk”, saying that exposure to air pollution contributed to one in eight deaths around the world.
Ghana, June 2016 | © Carl De Keyzer – Magnum

A Public Eye Investigation | September 2016 9
1
Introduction
“Double, double toil and trouble; Fire burn, and caldron bubble.”
William Shakespeare, Macbeth
10 DIRTY DIESEL – How Swiss Traders Flood Africa with Toxic Fuels | Chapter 1
1.1 – SULPHUR IN FUELS: A TICKING BOMB
With their populations increasing at breakneck speed, African cities are becoming megacities. By 2050, the continent’s urban population is expected to triple, while cities such as Lagos will have reached 20 million inhabitants long before that. Africa’s urbanization comes with a fast growing car fleet too. In Accra, the number of cars doubled between 2005 and 2012. The conti-nent’s economic development and lack of public transport can only accentuate the problem.
No wonder that traffic-related air pollution is becoming a major health issue in many African cities. Images of Beijing’s frightening smog may have struck many around the world, but Dakar and Lagos have air quality that is worse. And while more cars are driven every day in Paris or Rome than in most African cities, outdoor air pollution is undoubtedly much worse in parts of Africa. That is because the average level of particulate matter (PM), one of the most damaging atmospheric pollutants emitted by vehicles, is five times higher in Accra than in London.1 Com-pared with London, the population of Lagos breathes thirteen times more particulate matter.
This particulate matter comes from several sources, but some of the main culprits are fuels, or to be more accurate, dirty fuels. Improving fuel quality has already been on the agenda for some time now. Beginning after the World Summit on Sustain-able Development in Johannesburg in 2002, the UN Environ-mental Programme (UNEP) ran a ten-year clean air campaign based on the fact that “leaded petrol poisoning is one of the world’s most serious environmental health problems.”2 The suc-cess of this campaign led most countries to introduce a ban on lead in petrol – only three countries still allow it – but other severe fuel-related health issues still remain.
Sulphur is a ticking bomb. Let’s call it the “lead of the 21st century”, following the framing of the International Council on Clean Transportation, the NGO that revealed the recent VW scandal in which the car manufacturer manipulated software to cheat US emission tests on its diesel vehicles.3
By increasing air pollution, high sulphur fuels have direct con-sequences for public health. In 2012, the World Health Organisa-
tion categorized diesel exhaust as carcinogenic, a move that added to the long list of known negative health effects from traffic-related emissions. High sulphur gasoline and diesel also destroy emis-sions control technologies in vehicles. As long as these fuels are sold at the pump, modernising Africa’s car fleet, many of which are old second-hand cars, would not therefore improve air quality.
One key difference between lead and sulphur is that the for-mer is an additive that can be banned (and replaced), while the latter is naturally present in crude oil. The only solution is to refine and de-sulphurise the crude oil in order to lower the sul-phur content of gasoline and diesel as much as possible. The good news is that it is possible. It’s already being done.
Confronted with evidence showing a causal relationship be-tween sulphur in fuels, exposure to traffic-related particulate matter, and respiratory diseases in adults as well as children, particularly in the asthmatic subpopulation, Europe and North America were the first to address this issue. They dramatically lowered the authorised limits on sulphur in fuels to 10 parts per million (ppm) or 0.001 percent of the volume in European fuels, and 15 ppm in the US. In Switzerland, traffic-related particulate matter emissions fell by nearly half between 1990 and 2010 even as the number of cars increased by 33 percent.4 During that period, Switzerland moved from an authorised level of sulphur in fuels of 2,000 ppm to 10 ppm, reducing traffic-related SO₂ emissions by 98 percent. In Europe, sulphur in fuels is no longer considered a problem.
Engaged in its own mortal battle against severe air pollu-tion, China has also decided to adopt ultra-low sulphur stan-dards for diesel and gasoline, acknowledging that high sulphur fuels, especially diesel for trucks, is a main contributor to the shocking smog that plagues its cities. By January 2017, 10 ppm will be the rule for both gasoline and diesel nationwide, as is already the case in the Eastern provinces.
Beyond these significant achievements, however, many re-gions lag behind. Some countries in Latin America, Asia and the Middle East have only just begun the path to ban high sulphur levels, though the situation has improved somewhat at a conti-nent level. Despite encouraging progress in Africa, the conti-nent’s average sulphur limit remains 200 times higher than in Europe. In some countries, this figure is as high as 1,000 times the European limit.
In other words, the differences between African, European, and North American fuels show how some are tolerating an ob-vious double standard. Nothing justifies this situation. There is no technological challenge, no restrictions on the availability of low sulphur fuels, no significant economical impact related to their adoption. Jane Akumu, who leads the African campaign at UNEP’s Transport Unit, explains: “On the contrary, the adoption of ultra-low sulphur fuels will save costs for governments. For example in Kenya, vehicle emissions have been estimated to cost the country about US$ 1 billion annually. This is the economic loss due to vehicle emission pollutants related illnesses and deaths in monetary terms for patients treated. In countries where low sulphur fuels have been introduced, there was no price dif-ferential. Moving to ultra-low sulphur fuels may come at a small premium, but the benefits outweigh the costs.”5 Without rapid and thorough improvement in fuel quality, Africa is facing a dra-matic increase of illnesses and death from urban air pollution.
While UNEP and African governments continue to discuss the improvement of fuel standards, with notable successes such as in East Africa, these discussions still emphasise the improve-ment of local refineries and do not pay enough attention to im-ports of high sulphur fuels to the continent. For the first time,
As long as high-sulphur fuels are sold at the pump, modernising Africa’s car fleet,
many of which are old second-hand cars, would not improve air quality.
A Public Eye Investigation | September 2016 11
this report looks at the intercontinental trade in fuels. It shows how industry profits from these double standards. It also shows how industry operates under the radar screen of public attention, profiting from the deliberate and illegitimate producing and sup-ply of dirty fuels at the expense of people’s health. This report highlights the responsibility of an industry, whose managers live in places such as Geneva or Amsterdam. Sulphur isn’t a problem in these cities any more. But it is still a lucrative business.
1.2 – AN ILLEGITIMATE BUSINESS MODEL THAT MUST BE CALLED TO ACCOUNT
Two entirely different developments triggered Public Eye to look closer at the business of African fuels.
First, in 2006, Trafigura dumped toxic waste in Côte d’Ivoire. The waste had been created in an improvised refining operation aboard a tanker chartered by the Swiss-based trading company. Just like everybody else who examined this enormous scandal, we focused initially on the waste, which caused a catastrophe of environmental health. But then we asked ourselves: Why was Trafigura improvising a refining operation aboard a tanker? We now know that the company was processing a very highly sul-phurous intermediate product to be blended into the gasoline it was producing. This high sulphur gasoline could never have been sold at a pump in Europe, but it was good enough for the African market.
Then, in about 2010, Swiss oil trading companies began to buy networks of petrol stations across Africa. Switzerland is home to the biggest commodity trading hub with a global mar-ket share of 25 percent for all commodities and of 35 percent for crude oil and petroleum products.6 Traditionally acting as an intermediary between buyer and seller, trading companies are expanding along the supply chain right down to the end-con-sumers. Giants such as Vitol and Trafigura have become the big-gest shareholders in companies owning more than 2,200 retail points across the continent. And the African fuel business is incredibly dynamic. “In Africa we have 660 retail stations, and I can tell you that those statistics are typically valid only for a week”, says Christopher Zyde, Chief Operations Officer of Puma Energy, Trafigura’s downstream arm.7 Again, we had questions. Why would trading companies decide to invest in such a high-risk, low-margin activity? Why were they so keen to buy petrol stations, especially in Africa?
These two elements prompted a further line of questioning, core to this report: what if there was a profitable business model that exploited weak fuel standards in Africa by dumping cheap intermediate products from refineries, the chemical industry, and elsewhere, into gasoline and diesel for sale in Africa?
1.2.1 – DIVING DEEP INTO THE MECHANICS OF AN OPAQUE INDUSTRY
We began our research more than 3 years ago to see whether our suspicions were valid. We had to start from zero. Even the most basic data was not available. One researcher with long experi-ence in the global oil and gas markets told us: “This is one of the
most opaque sectors I’ve ever had to deal with.” This statement may be indisputable, but it should also be surprising, because the downstream sector is a key economic and commercial sector. Ensuring a constant supply of petroleum products, such as gaso-line and diesel, via infrastructure such as storage tanks or pipe-lines, is of vital significance to all economies and a matter of na-tional security for governments around the world. In Ghana, for example, the downstream sector accounts for more than 10 per-cent of GDP. Often subsidised, fuel prices are a constant and con-troversial subject of public debate in many African countries.
Despite this opacity, we gathered a minimal amount of in-formation from official statistics, trade authorities, and the com-panies themselves in their annual reports and bond prospec-tuses for potential investors. We talked to dozens of industry insiders, supervisors, port personnel and even the crews of ocean-going tankers. When we were able to talk with industry sources, they generally agreed to share their insights on condi-tion of anonymity. Where statistics were lacking or incomplete, we found that tracking individual tankers was a useful way to understand the flows and patterns of trade. We also visited sev-eral African countries to speak with authorities, regulators, and civil society organisations.
But our first challenge was to test the assumption that the levels of sulphur in fuels on sale in Africa were as dirty as the standards allowed them to be (and hence the double standard). That is, we had to test the quality of these fuels. And here, we had to make some choices. We couldn’t sample the gasoline and diesel sold in every country nor could we analyse the fuels sold by all the retail companies in a country that we visited. These tests are expensive and they require the services of specialized logistics support to transport the samples and an accredited lab-oratory to test them.
As a Swiss corporate watchdog, we focus on Swiss-based trading companies. This is not an arbitrary choice, however. These actors dominate the fuel business in many African coun-tries. We do think, though, that other companies outside the focus of our study, such as the oil majors and state-owned com-panies, would also be worth a closer look.
We used two criteria in deciding where and what to sample. We singled out the countries that have both weak sulphur stan-dards and petrol stations owned, partly-owned or supplied by Swiss trading companies. Samples from eight countries were analysed: Angola, Benin, the Republic of the Congo, Ghana, Côte d’Ivoire, Mali, Senegal and Zambia. For other parts of the report we also looked at Nigeria, Sierra Leone, Tanzania, Togo, and Zimbabwe. With the assistance of a renowned independent laboratory, we analysed the sulphur content as well as other health-damaging substances that can be regularly found in gas-oline and diesel sold at African pumps. None of the fuels sam-pled were even close to the qualities of fuel being sold in Eu-rope. A large majority of the diesel samples contained sulphur levels several hundred times higher than any authorized limit found anywhere between Lisbon and Warsaw.
The results from our fuel tests are even more shocking when one considers that Africa, especially West Africa, supplies the world with some of the best quality, low sulphur, “sweet”, crude oil. Nigerian Bonny Light, for example, has one of the lowest
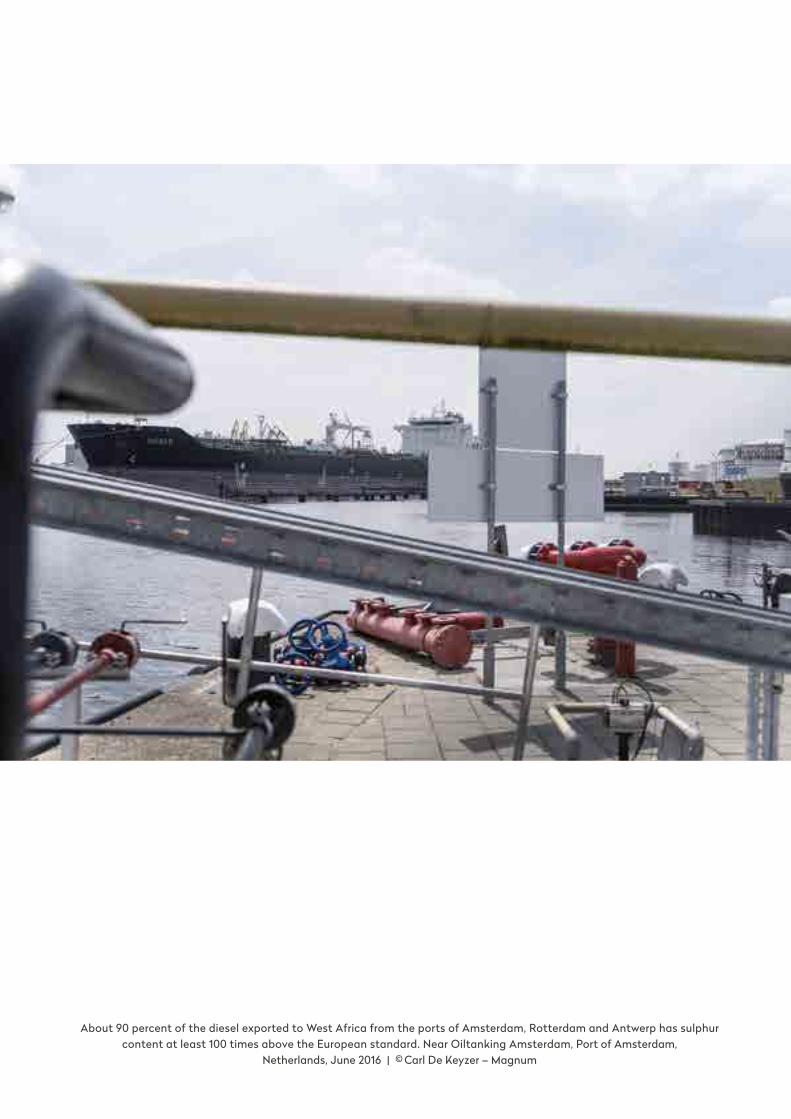
About 90 percent of the diesel exported to West Africa from the ports of Amsterdam, Rotterdam and Antwerp has sulphur content at least 100 times above the European standard. Near Oiltanking Amsterdam, Port of Amsterdam,
Netherlands, June 2016 | © Carl De Keyzer – Magnum
A Public Eye Investigation | September 2016 13
sulphur contents of all crudes. The region produces more than enough of this high-quality crude to satisfy domestic demand. But most of it is exported. And in exchange for their high-qual-ity crude, countries in the region receive high sulphur, low-qual-ity fuels in return. Insufficient refining capacity in Africa means that roughly half of the diesel and gasoline consumed on the continent is not produced locally but imported. Increased pop-ulation and car fleets means that in the next few years, that share of imports will increase.
Following the supply chain backwards from the pump, we saw where many of these fuels originated. Publically available trade statistics show that most fuels sold on the west coast of Africa, from Dakar to Luanda, arrive from Europe and to a less-er extent from the US. The ports of Belgium and the Netherlands emerge as major exporters of petroleum products to West Afri-ca. Indeed, the Amsterdam, Rotterdam and Antwerp region col-lectively form a hub that is known as “ARA”. While the ARA region supplies Europe and other regions with low sulphur fuels, it also exports high sulphur fuels elsewhere. More than 80 percent of diesel exports from the ARA region to Africa are high sulphur diesel, meaning more than 1,000 ppm. That is, on a daily basis, the region ships fuels to Africa that would be forbid-den for sale in Europe.
We dedicate a whole case study to Ghana, because it’s the one country where we could access confidential documents that showed the sulphur content of fuels at the moment where they entered the country. These documents opened up an important part of our research, revealing the name of the ships, which dis-charged products into Ghana. Shipping databases allowed us to discover the routes used by the vessels to deliver fuels as well as the identity of their suppliers. This information matched other sources which showed the actual cargoes of high sulphur fuels that were imported into Ghana almost exclusively from Europe and the United States. The majority of these known deliveries were brought to Ghana by Swiss trading companies, although oil majors are also part of the game.
It is surprising enough that Swiss commodity trading com-panies are dominant players in the sale and supply of fuels to Africa, but we were even more surprised to learn that the Swiss traders are also producing those fuels.
Swiss trading companies like to describe themselves as lo-gisticians pure and simple, carrying the raw materials from where they are produced to where they are needed in order that the world economy can function. Glencore’s CEO, Ivan Glasen-berg has stated, for example: “We are a DHL for commodities. We buy them in one country, ship them to another and, by doing so, we facilitate the trade in goods and create surplus. We close the gap between producers and consumers.”8 Mercuria’s co-founder, Daniel Jaeggi, takes a similar stance: “My job is to bring physical goods from a place where the people don’t need them to a place where they are needed.”9
This model sounds harmless and rather straightforward. But it’s not true.
For the first time, we show that Swiss trading companies are indeed producers of the fuels they sell. This disturbing surprise leads us deep into mechanics of the fuel industry. Some of the Swiss trading companies involved – namely Vitol and Oryx –
denied that they “produce" fuels, when approached by us, while Gunvor confirmed our view exactly, that traders produce fuels by blending different intermediate products: “Once a sale is made, the fuel is then produced from scratch by blending com-ponents [. . .]."
We have documented all the answers we received from the companies to our detailed questions on the Public Eye website.10
1.2.2 – THE WITCHY BUSINESS OF AFRICAN QUALITY FUELS
Intuitively, one might think that fuels are produced in refineries and then sold at petrol stations owned by the brand names with which we are all familiar. But that does not come even close to the truth. We discovered an entirely different industry with a particular business model and many more players involved. In doing so, we uncovered the very disturbing essence of this report: that Swiss-based trading companies as well as others increase their profit by blending low-quality intermediate prod-ucts, producing fuels that the traders know will damage human health unnecessarily. The industry has a word for these bad fuels: “African Quality”.
African Quality fuels are characterised primarily by their high sulphur content, though the term also refers to fuels with other hazardous components. Blending is in principle a legiti-mate and necessary technical process. Gasoline is always a blended product because vehicle engines require a mixture of refining streams. Diesel does not need to be blended, but be-cause blending is a profitable activity and there is limited global availability of directly usable streams from refineries, diesel is also blended. But “blend-dumping” is clearly illegitimate, given that it takes advantage of weak standards and involves deliber-ately lowering a fuel's quality to just within the legal limits through the addition of cheap and toxic products. With respect to sulphur specifically, we have called this practice “sulphur dumping”. And our tests revealed that sulphur is not the only hazardous substance present in “African Quality” fuels. These fuels also contain worrying levels of polyaromatics in the case of diesel and benzene in the case of gasoline.
Blending African quality fuels is a form of regulatory arbi-trage (taking advantage of weak standards) and it’s done at the expense of people’s health. A whole range of different players are complicit: refiners, storage owners, blenders, chemists, “ad-ditive doctors”, testers, ship owners, oil majors, and, of course, the traders themselves. In other words, there is a business mod-el behind the making of African Quality fuels. It is an industry by itself.
Indeed, it is an industry in which Swiss trading companies play a decisive role. Having developed into giants, companies such as Vitol, Trafigura, Mercuria, Gunvor and Glencore now own more oil tankers and storage facilities than the oil majors. They not only sell and supply dirty fuels to the African market, but, as this report will show, also produce them in search of bigger profit.
Unwilling to tolerate profit over human life, we invite read-ers to come with us on our journey through the silent, and deadly, world of dirty fuels.
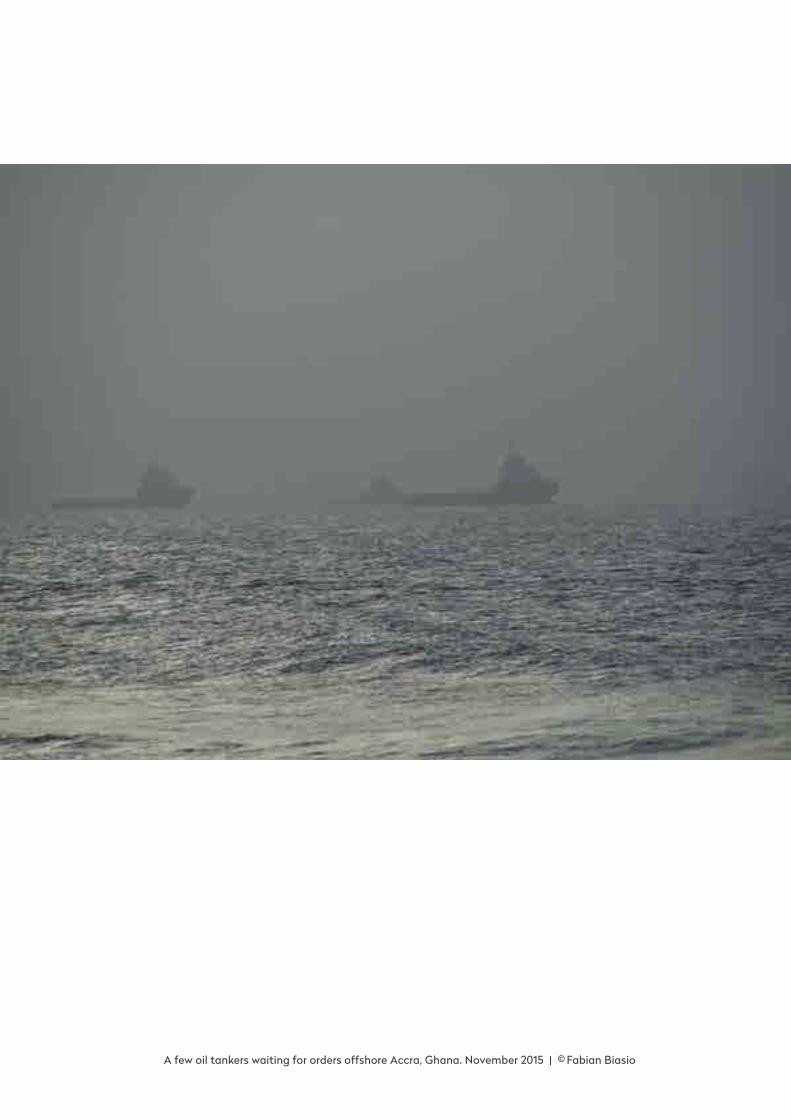
A few oil tankers waiting for orders offshore Accra, Ghana. November 2015 | © Fabian Biasio
A Public Eye Investigation | September 2016 15
2
Toxic gasoline: every day side of the
Probo Koala scandal
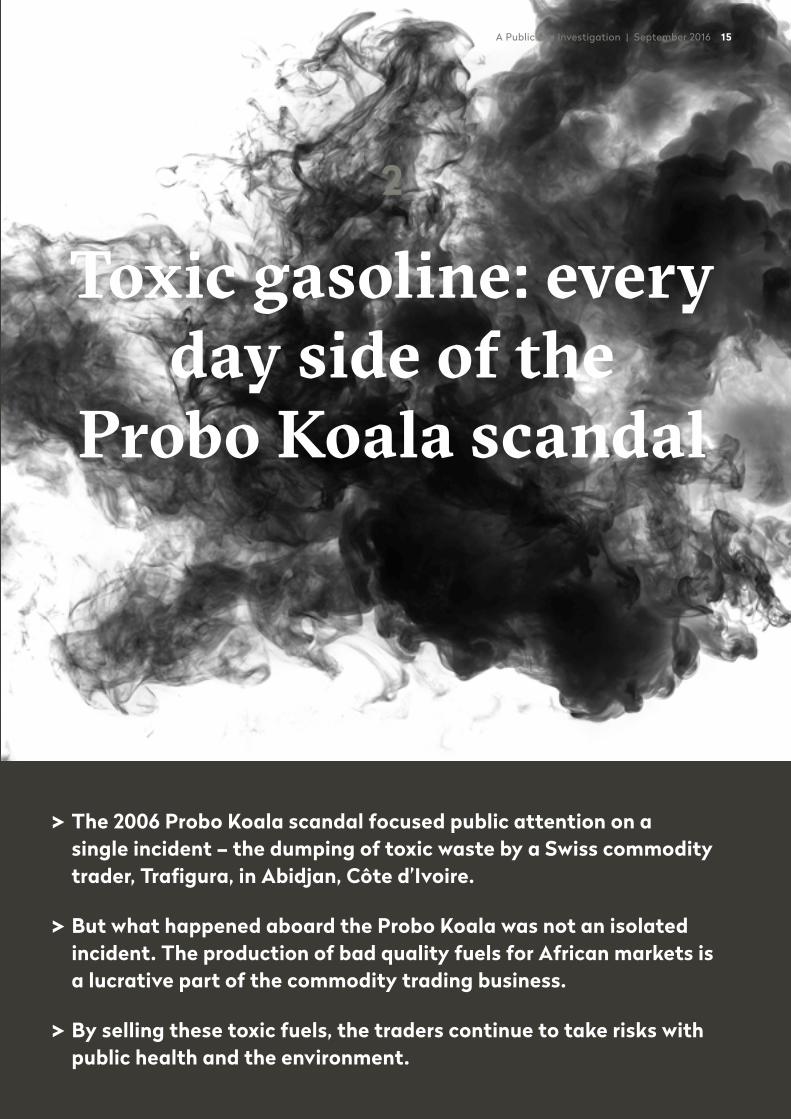
The 2006 Probo Koala scandal focused public attention on a single incident – the dumping of toxic waste by a Swiss commodity trader, Trafigura, in Abidjan, Côte d’Ivoire.
But what happened aboard the Probo Koala was not an isolated incident. The production of bad quality fuels for African markets is a lucrative part of the commodity trading business.
By selling these toxic fuels, the traders continue to take risks with public health and the environment.
16 DIRTY DIESEL – How Swiss Traders Flood Africa with Toxic Fuels | Chapter 2
At Public Eye (formerly the Berne Declaration), we first came across the sale of toxic fuels to African markets while working on our 2011 book, “Commodities: Switzerland’s Most Danger-ous Business”.1 Like everyone else, we focused on the waste, which was dumped in Côte d’Ivoire in August 2006 and caused a sanitary catastrophe. But the dangerous process aboard the Probo Koala, which created the toxic waste in the first place, had been done to produce blendstocks, semi-finished products used for making gasoline. And a niggling question remained: What happened to that gasoline?
Consensus at the time seemed to be that activities aboard the Probo Koala and the Probo Emu, another vessel chartered by Tra-figura, were unique, the “first known incidence of gasoline being washed with caustic soda aboard a ship”.2 But we learnt that this process has occurred at least one other time, in 2013 in European waters. And while these incidents are not so numerous that we can call them a business model, they nevertheless illustrate the risks some Swiss commodity traders are willing to take to pro-duce fuels of “African Quality”.
The commercial aim of Trafigura’s caustic washings was clear: to make cheap blendstocks for African Quality gasoline.3
So while the Probo Koala ended up dumping its waste in Côte d’Ivoire, it had already offloaded its product, a blendstock called naphtha, onto six other tankers4 while still in the Mediterra-nean. Our research used shiptracking software to show that all six tankers sailed straight to West Africa, transporting the toxic naphtha, with its sulphur levels up to 700 times the European limit, for further blending, then sale on the African continent.
So, while attention rightly focused on the human tragedy caused by Trafigura’s dumping of waste in Abidjan, and on the negligence of governments,5 the incident also casts some light on other scandalous issues: how a leading Swiss oil trader transformed dirty fuel blendstocks to eventually sell toxic gaso-line in West Africa; how it conducted a dangerous refining pro-cedure (caustic washing) at sea, effectively “offshoring” national safety regulations by shifting hazardous processes onto ships.
To this day, Africa continues to be a dumping ground for European companies, who knowingly produce and sell fuels that endanger people’s health.
This report puts Trafigura’s Probo Koala operations into a new and controversial context. It tells the forgotten side of the story,
which was not, as most people thought at the time, a one-off in-cident. In fact, the Probo Koala incident just highlighted one ex-perimental method of producing “African Quality” gasoline, de-spite the availability of better, safer production processes. There is also a regular way of producing those fuels through blending
cheap but dirty blendstocks. Most fuel deliveries escape the Pro-bo Koala levels of scrutiny, but they illustrate an industry-wide business model that merits further inspection. Swiss traders and others maximise profits by taking advantage of weak regulations to produce and sell harmful fuels. This form of regulatory arbi-trage ignores the serious risks to public health. In this report, we show that selling high sulphur fuels in Africa is done on a daily basis by every industry player. This can happen because although the risks relating to toxic emissions from dirty fuels are well known, this business model is hidden from the public.
But let’s go back to the Probo Koala, to try to understand what led Trafigura to transport hazardous sulphur molecules half way around the globe from a Mexican refinery to West Af-rica, and the consequences of this decision.
2.1 – THE COLLATERAL OF TRAFIGURA’S “SERIOUS DOLLARS” ENDS UP IN ABIDJAN
On Saturday, 19th August 2006, soon after residents began to notice the invasive smell of rotten egg, a medical and political crisis began to unfold in Abidjan, the economic capital of Côte d’Ivoire. Some 500 tonnes of toxic waste had just been dumped in various places around the city – waste created by Trafigura aboard the Probo Koala. The government blamed the chemical contamination for the deaths of at least 15 people.6 Another 100,000 Ivorians sought medical attention for problems such as nausea, headaches, vomiting, abdominal pains, irritation to the eyes and skin, and difficulties with respiration.7
Even before it began the caustic washings which generated the toxic waste, Trafigura was well aware that waste disposal would be difficult and expensive. After all, few facilities would be willing or able to accept the waste. For months, the company hesitated about how and where to get rid of the waste. It rejected a safe disposal option in the Netherlands on the grounds of cost. It finally decided upon Abidjan – by far the cheapest option.8
How was this waste produced? Every month for 16 months, between January 2006 and April 2007, Trafigura bought batches of coker naphtha created at a Mexican refinery, with the inten-tion of turning them into blendstocks for gasoline. This coker naphtha is one of the lowest qualities of gasoline blendstocks and it is created during oil refining from the “bottom of the bar-rel”. It has two specificities: first, it contains very high levels of toxic substances, namely sulphur and mercaptan sulphur, and second, as a direct consequence, it is very cheap.9 In other words, it is an opportunity for (almost) any creative trader.
“As cheap as anyone can imagine,” James McNicol, a trader from Trafigura, wrote in an email to his colleagues in December 2005, “[this] should make serious dollars.”10
Trafigura’s sole motivation for experimenting with the pro-duction process was profit. Company executives had estimated that buying and selling the coker naphtha would generate profit to the tune of US$7 million per cargo.11 But before “making se-rious dollars”, Trafigura had to convert the product into a suit-able ingredient for African gasoline: it had to find a way to low-er drastically the mercaptan sulphur content, otherwise its odour would be unbearably strong.
The commercial aim of Trafigura’s caustic washings was clear:
to make cheap blendstocks for African Quality gasoline.

A Public Eye Investigation | September 2016 17
It was the prospect of profits that led Trafigura to show such chemical creativity, onshore at first in the United Arab Emirates and Tunisia (at Tankmed), then aboard the tankers Probo Koala and Probo Emu, and finally at Vest Tank in Norway, although the latter went out (literally) with a big bang on 24th May 2007.12
2.2 – A SHIP TURNED INTO A FLOATING FACTORY
In 2010, four years after the dumping, the Court of Amsterdam, prosecuting Trafigura and others, emphasised that conducting caustic washing aboard was an unusual operation: the process “essentially boils down to the moving of an industrial process from land to sea […]. The ship was not used for its designated purpose as a ship, but instead as a floating factory carrying out a process for which it was in no way necessary for the ship to be at sea.”13
Driven solely by profits, Trafigura decided not to send the dirty batches of coker naphtha to a refinery for further treatment, which would have cost a significant fee. Instead, the company chose to solve the problem by “caustic washing” at sea, a process banned in many countries because of the dangers involved. This showed the risks that Trafigura was willing to take.
Trafigura opted for a ship considered to be near the end of her operational life. In this way, the damage to the vessel caused by the caustic soda would not be too costly. In any case, the ship needed to be very cheap: “We need dogs [trader jargon for tank-ers] and cheap ones too,”14 Leon Christophilopoulos, Trafigura’s head of gasoline trading, wrote to colleagues in March 2006.
Further internal email correspondence indicated that cer-tain individuals within the company were indifferent to what would become of the ship. Christophilopoulos went on to de-scribe the state of the vessel:
The “vessel […] is about to be scrapped […] and parked some-where” in West Africa. This “ship […] doesn’t care about its coat-ings […] would work very well.”
Toula Gerakis from Falcon Navigation, operating Trafigura’s fleet, replied, warning that the hiring costs would be more than twice as expected: “[This] implies you do not want insurance […] and you do not care if she sinks.”15
Other internal email correspondence between London- based gasoline blender Naeem Ahmed, his colleagues, Trafigu-ra’s founder and chairman, Claude Dauphin, and Jose Larocca, who still holds a senior position at Trafigura16, shows how the company’s leadership knew caustic washing is controversial: “This operation is no longer allowed in EU/US and Singapore. Caustic washes are banned by most countries due to the haz-ardous nature of the waste […] and suppliers of caustic are un-willing to dispose of the waste since there are not many facili-ties remaining in the market. And I have approached all our storage terminals with the possibility of caustic washing and only two […] [are] willing to entertain the idea”.17
Trafigura decided to move the caustic washings to tankers that would operate in the Mediterranean. Internal emails raise questions about whether Trafigura was trying to avoid regulato-
ry scrutiny of its tankers. An email dated 21st June 2006 sug-gests that the company considered bringing the coker naphtha [referred to as PMI crap] into the UK port of Milford Haven, but eventually decided against it:
“We should store the PMI crap on a ship in Gibraltar rather than taking it to Milford Haven. Reasons are as follows […]. Milford will require at least one approval. The bucket [tanker] in Gib [Gibraltar] will require no such thing.”18
Trafigura settled upon a strategic position in the Mediter-ranean Sea, not far from Gibraltar. In its decision on the case, the Court of Amsterdam detailed why: “On the one hand, this was closer to Europe and the Baltic States where many of the shipments destined for mixing originated, and on the other hand, it was close to West Africa, the market for which the shipments to be mixed with the blendstock were ultimately destined.” 19
2.3 – A FIRST LOOK AT THE MAKINGOF AFRICAN QUALITY FUELS
In spring 2006, a few months before the toxic waste was dumped in Abidjan, Trafigura washed three batches, a total 85,000 tonnes, of coker naphtha aboard the Probo Koala. The dangerous exercise was an attempt to reduce the high level of mercaptan sulphur by trying to replicate at sea the “Merox treat-ment”, a process usually done in a refinery.20 Since Trafigura considered it too expensive to entrust this job to a safe refinery, the company did its own experiments with the Merox treat-ment at sea.21
The batches of coker naphtha contained mercaptan sulphur levels as high as 2,014 ppm, twice the unofficial limit for the so-called African Quality. The caustic washing allowed Trafigura to reduce the mercaptan sulphur levels to around 950 ppm. At this level, the intense stench of mercaptan sulphur was considered just about acceptable and the coker naphtha was commercially suitable as a blendstock for gasoline. McNicol neatly sum-marised the general idea when he wrote to Claude Dauphin in December 2005: “[We] just have to make them [“super cheap PMI barrels”] more compatible for gasoline blending.”22
But reducing the mercaptan sulphur content did not signifi-cantly reduce the overall content of sulphur, the substance that makes car emissions so damaging to human health. We estimate that the washed naphtha still had a sulphur level of around 7,226 ppm, more than 700 times the European limit. We don’t know the sulphur level of the African Quality gasoline, which Trafigura finally produced through further blending, but it cer-tainly had to be very high above the European standard.23
In 2011, the Dutch Court of Appeal characterised the pro-cess as “highly unusual.”24 We cannot blame the Dutch court, asked to work on this specific case, for not looking further into the business model behind this “highly unusual” process. Tra-figura may have gone further than its competitors by dumping waste in Abidjan, but it is far from being the only company to deliberately produce, supply and sell dirty products across Afri-ca. In fact, every day, the oil trading industry makes sure that African Quality fuels reach their target markets.
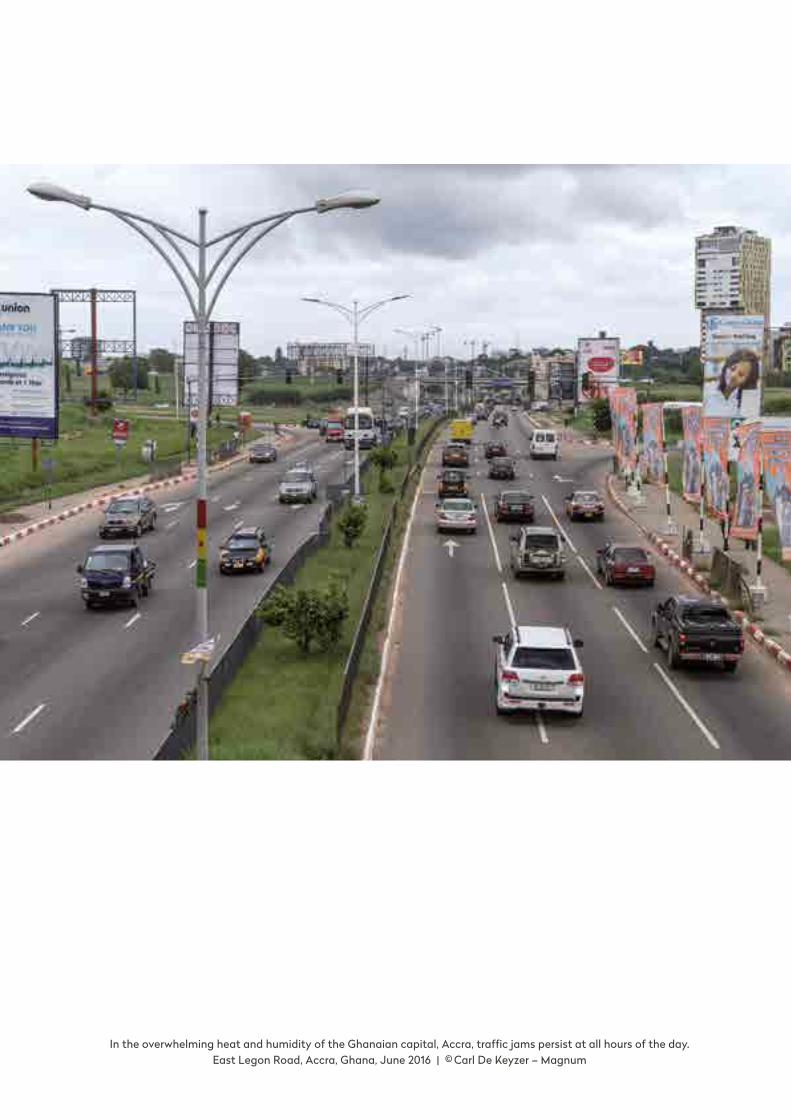
In the overwhelming heat and humidity of the Ghanaian capital, Accra, traffic jams persist at all hours of the day. East Legon Road, Accra, Ghana, June 2016 | © Carl De Keyzer – Magnum
A Public Eye Investigation | September 2016 19
3
A silent killer: air pollution and high
sulphur fuels
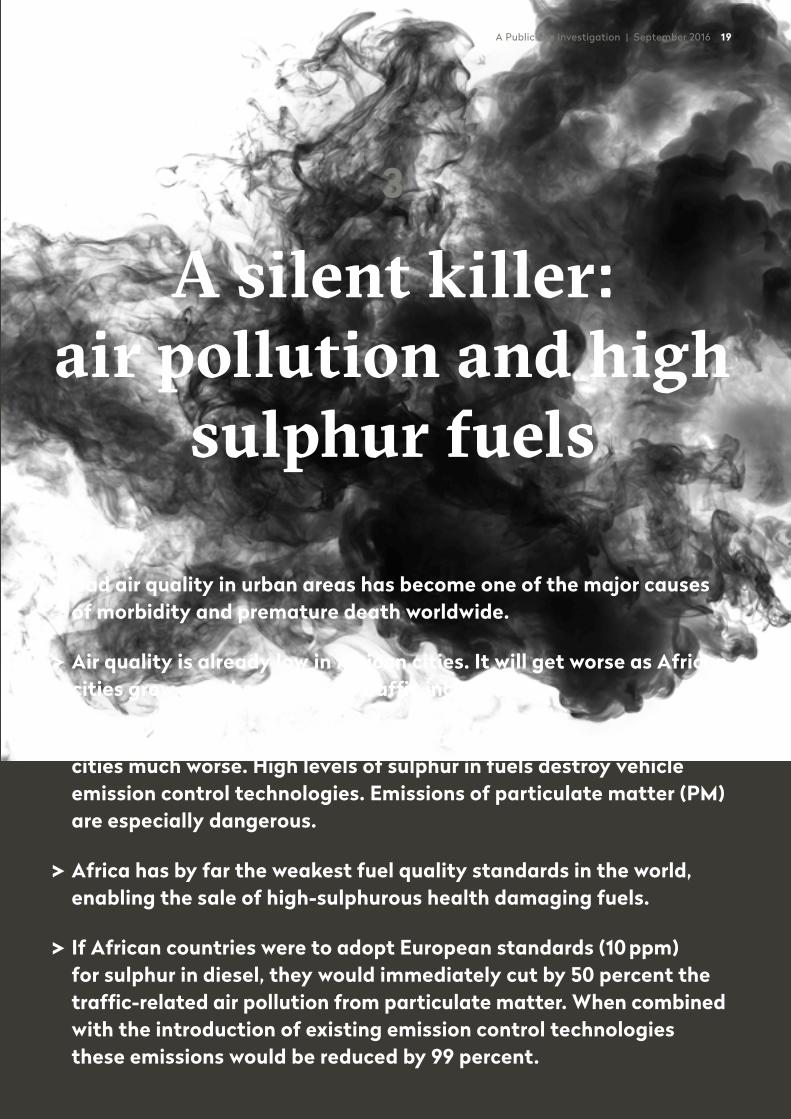
Bad air quality in urban areas has become one of the major causes of morbidity and premature death worldwide.
Air quality is already low in African cities. It will get worse as African cities grow and the volume of traffic increases.
The low-quality fuels make the urban air pollution in many African cities much worse. High levels of sulphur in fuels destroy vehicle emission control technologies. Emissions of particulate matter (PM) are especially dangerous.
Africa has by far the weakest fuel quality standards in the world, enabling the sale of high-sulphurous health damaging fuels.
If African countries were to adopt European standards (10 ppm) for sulphur in diesel, they would immediately cut by 50 percent the traffic-related air pollution from particulate matter. When combined with the introduction of existing emission control techno logies these emissions would be reduced by 99 percent.

20 DIRTY DIESEL – How Swiss Traders Flood Africa with Toxic Fuels | Chapter 3
Sulphur levels in diesel and gasoline used to be high all around the world, at least until the end of the last century. But the sul-phur contributed significantly to urban air pollution and dam-aged people’s health, so industrialized countries took action, gradually reducing the amount of sulphur in fuels. Europe, for example, still allowed diesel with a sulphur content of 2,000 ppm (parts per million) in 1994, but two years later, it dropped the limit to 500 ppm. This limit was gradually lowered further until in 2009, Europe fixed the current limit at 10 ppm, introducing an era of “ultra-low sulphur”.1
Africa, however, still lags behind. African countries have an average sulphur limit of 2,000 ppm, and many countries allow much higher levels than that. Until a few decades ago, this might not have been a major health concern, because the volume of traffic stayed low. But this is changing dramatically. As Africa urbanises and car ownership grows across the continent, traffic- related emissions are growing rapidly.
Meanwhile, fuel standards in many countries, especially in West Africa, have remained the same or improved only very slightly. Without improvements in fuel standards, traffic-related air pollution will cause dramatically more illness and premature deaths. By moving to ultra-low sulphur diesel, however, Africa could prevent 25,000 premature deaths in 2030 and almost 100,000 premature deaths in 2050.2
3.1 – TRAFFIC-RELATED AIR POLLUTION IS GROWING RAPIDLY IN AFRICAN CITIES
In the last two decades, Africa’s urban populations have been growing at an average 3.5 percent per year, faster than any oth-er region in the world.3 Indeed, half of the world’s fastest-grow-ing cities are in sub-Saharan Africa. Between 2012 and 2030, some 13 African cities are expected to double their population, including Lagos, which will be home to 25 million people by 2030.4 By 2050 the continent’s urban population is expected to triple.5
Africa’s urbanisation comes with the rapid growth of car ownership too. The number of cars per inhabitant in Africa re-mains low by comparison to Europe or the United States. But these figures are grow-ing fast. In Ghana, for example, the num-ber of vehicles more than tripled between 2005 and 2015, reaching more than 2 mil-lion vehicles.6 In Accra alone, individual car ownership is projected to increase from 181,000 in 2004 to over 1 million in 2023. And some analysts forecast that Af-rica will see a four to fivefold increase in the number of cars by 2050.7 With urbani-sation and the rapid expansion of the ur-ban car population, more and more people will be exposed to increasing levels of traffic-related air pollution.
Africa’s air pollution shows some of the most alarming trends. Between 2009 and
2012, for example, air quality in African cities exhibited the big-gest increase (26 percent) in the level of annual mean particulate matter (PM10),8 one of the most damaging atmospheric pollut-ants emitted by vehicles. In the same period, some 70 percent of Africa’s urban population experienced worsening air pollution, a higher share than any other region in the world.9 As figure 3.1 shows10, African cities are among the most polluted in the world.
The UN Environment Programme (UNEP) generally qualifies vehicle emissions as a major source of outdoor urban air pollu-tion in developing countries.11 Other sources include open waste burning, industry, power generation, traffic-related dust, and contributions from the burning of wood and charcoal for house-hold cooking.12 Few studies exist that measure and identify the sources of outdoor air pollution in African cities.13
In 2005, however, smog in Lagos caused panic among some of the metropolis’ 18 million residents. The smog event also trig-gered an important study by the Lagos Metropolitan Area Transport Authority (LAMATA), which concluded that vehicles contribute approximately 43 percent of the city’s ambient air pollution.14 LAMATA’s Managing Director, Dr Mobereola Dayo blamed the city’s population of second-hand cars, whose emis-sions are three to four times higher than in Europe.
Three years later, in 2008, a study by Raphael Arku, a scien-tist from the Harvard School of Public Health, noted that the “growth in the urban population using biomass, coupled with increasing traffic and industrial emissions that accompany eco-nomic development, is likely to lead to even higher air pollution in African cities than observed in large cities in Asia” 15. This is already the case today.
The widespread use of second-hand cars in Africa may com-pound the problem. Indeed, the majority of vehicles in Africa are second-hand cars from Europe and Asia, which are more polluting and less fuel-efficient. In May 2015, UNEP and the Ghanaian Ministry of Transport estimated that, in 2009, 83 per-cent of cars imported into the country were second-hand16 (the regional average for West Africa is 85 percent).17
0–50
0
501–
1000
1001
–150
0
1501
–200
0
2001
–250
0
2501
–300
0
3001
–350
0
3501
–40
00
4001
–450
0
4501
–500
0
5001
–550
0
Num
ber o
f car
goes
repo
rted
ppm
8
7
6
5
4
3
2
1
0
Diesel imports in Ghana by sulphur content (2013)
0–50
0
501–
1000
1001
–150
0
1501
–200
0
2001
–250
0
2501
–300
0
3001
–350
0
Num
ber o
f car
goes
repo
rted
13
12
11
10
9
8
7
6
5
4
3
2
1
0
Diesel imports in Ghana by sulphur content (2014)
ppm
Sier
ra L
eone
Gui
nea
Ben
in
Côt
e d’
Ivoi
re
Togo
Gha
na
Nig
eria
Shar
e (%
of v
olum
e)
Sene
gal
Con
go
100
90
80
70
60
50
40
30
20
10
0 Volu
me
expo
rted
(in
'000
MT
)
900
800
700
600
500
400
300
200
100
0
Share of high sulphur (> 1000 ppm) diesel in total diesel exports from ARA to West Africa (2014)
100 100 100 10096 93
8482
45
Sier
ra L
eone
Gui
nea
Côt
e d’
Ivoi
re
Ben
in
Gha
na
Nig
eria
Togo
Shar
e of
ARA
(% o
f vol
ume
impo
rted
)
Sene
gal
Mau
ritan
ia
100
90
80
70
60
50
40
30
20
10
0 Volu
me
(in
'000
MT
)
4,500
4,000
3,500
3,000
2,500
2,000
1,500
1,000
500
0
ARA floods West Africa with fuels (2014)
Share volume of “known” voyages from ARA to West Africa by trading companies (2014)
91 88
6964
5144
3021 19
CNR 14%
Irving 1%Valeska 1%
Talaveras 3%
Noble 4%
Total 7%
BP Amoco 9%
Swiss traders61%
Litasco 20 %
Glencore (ST Shipping) 11%
Addax and Oryx (Nyala) 9 %
Sahara Energy 7 %
Trafigura (Delaney) 5 %Mercuria 4 %Trafigura 2 %Gunvor (Clearlake) 2 %Orion 1 %
Share volume of “known” voyages from ARA to West Africa by trading companies (2014)
Charterer not reported 14 %
Irving 1 %Valeska 1 %
Talaveras 3 %
Noble 4 %
Total 7 %
BP Amoco 9 %
Swiss traders61 %
Litasco 20 %
Glencore (ST Shipping) 11 %
Addax and Oryx (Nyala) 9 %
Sahara Energy 7 %
Trafigura (Delaney) 5 %Mercuria 4 %Trafigura 2 %Gunvor (Clearlake) 2 %Orion 1 %
<10 ppm 10–20 ppm 20– 1,000 ppm >1,000 ppm
Shar
e vo
lum
e (%
)
sulphur content (ppm)
80
70
60
50
40
30
20
10
0
Lago
s (2
011)
Dak
ar (2
013)
Acc
ra (2
008)
Joha
nnes
burg
(201
1)
New
Del
hi (2
012)
Bei
jing
(201
3)
Car
acas
(201
2)
Ban
gkok
(201
4)
Rott
erda
m (2
013)
Paris
(201
4)
Lond
on (2
013)
Zuric
h (2
013)
Was
hing
ton
(201
4)
µg/m
3
350
300
250
200
150
100
50
0
PM10 level of African cities compared to cities in other world regions
Africa Asia Americas Europe
4 3
22
46
59
16
42
2230
80
3632
720 µg/m3 WHO Annual
Air Quality Guideline
8
1 1 1
4
2
5
2
4
1 1
1
2 2
4
9
13
3
Cai
ro (2
013)
Mex
ico
Cit
y (2
014)
Gen
eva
(201
3)
Figure 3.1 – Levels of PM10 in selected African cities compared with other major cities
A Public Eye Investigation | September 2016 21
But second-hand cars are not the principal cause of traffic- related air pollution in African cities. In fact, even if Africa’s car population consisted solely of brand new cars running on the most modern emission control technologies, air quality would not improve significantly. That is because poor quality fuels inhibit the functioning of these technologies. As we explain below, it will be impossible to tackle the problem of air pollu-tion in African cities without minimising the sulphur content of fuels.
3.2 – HIGH SULPHUR FUELS ARE THE MAIN CULPRITS BEHIND AFRICAN AIR POLLUTION
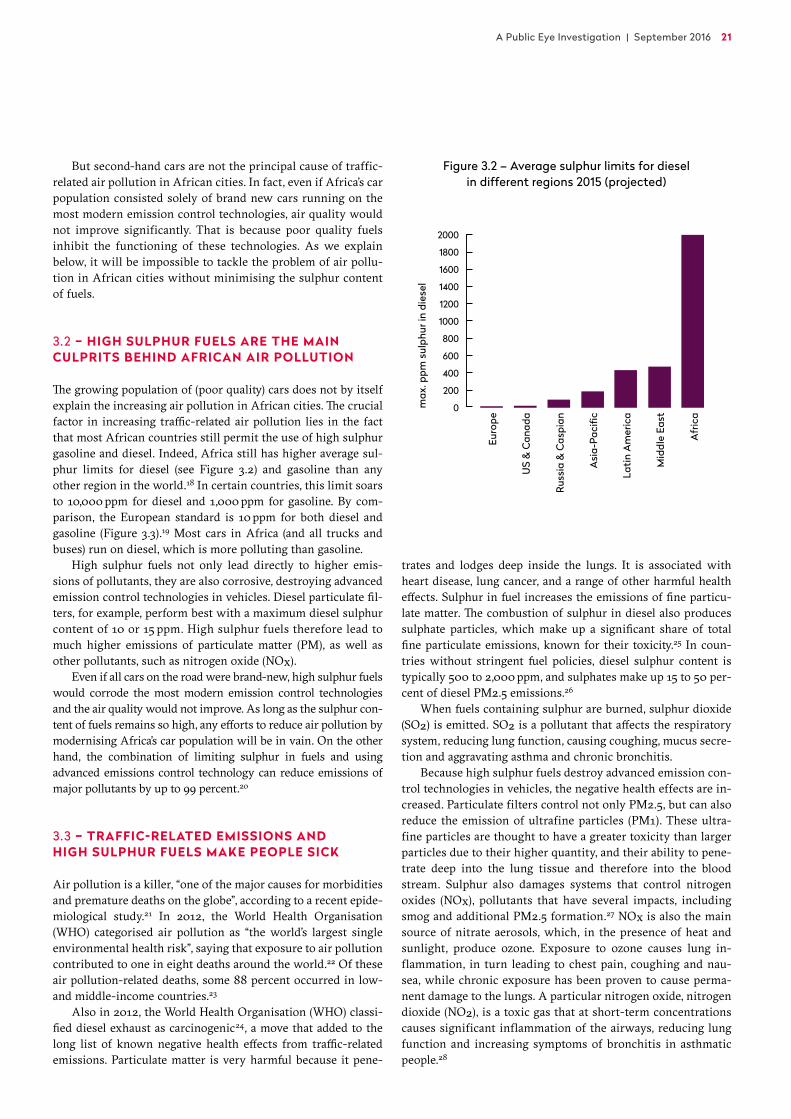
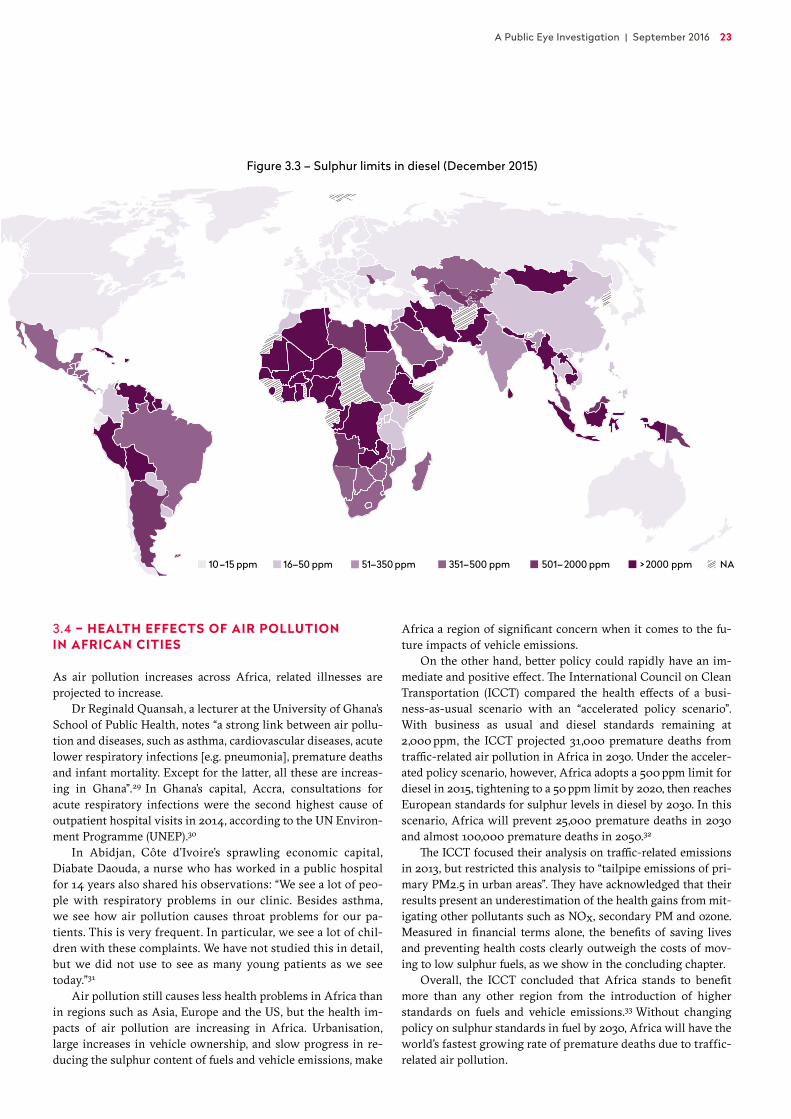
The growing population of (poor quality) cars does not by itself explain the increasing air pollution in African cities. The crucial factor in increasing traffic-related air pollution lies in the fact that most African countries still permit the use of high sulphur gasoline and diesel. Indeed, Africa still has higher average sul-phur limits for diesel (see Figure 3.2) and gasoline than any other region in the world.18 In certain countries, this limit soars to 10,000 ppm for diesel and 1,000 ppm for gasoline. By com-parison, the European standard is 10 ppm for both diesel and gasoline (Figure 3.3).19 Most cars in Africa (and all trucks and buses) run on diesel, which is more polluting than gasoline.
High sulphur fuels not only lead directly to higher emis-sions of pollutants, they are also corrosive, destroying advanced emission control technologies in vehicles. Diesel particulate fil-ters, for example, perform best with a maximum diesel sulphur content of 10 or 15 ppm. High sulphur fuels therefore lead to much higher emissions of particulate matter (PM), as well as other pollutants, such as nitrogen oxide (NOx).
Even if all cars on the road were brand-new, high sulphur fuels would corrode the most modern emission control technologies and the air quality would not improve. As long as the sulphur con-tent of fuels remains so high, any efforts to reduce air pollution by modernising Africa’s car population will be in vain. On the other hand, the combination of limiting sulphur in fuels and using advanced emissions control technology can reduce emissions of major pollutants by up to 99 percent.20
3.3 – TRAFFIC-RELATED EMISSIONS AND HIGH SULPHUR FUELS MAKE PEOPLE SICK
Air pollution is a killer, “one of the major causes for morbidities and premature deaths on the globe”, according to a recent epide-miological study.21 In 2012, the World Health Organisation (WHO) categorised air pollution as “the world’s largest single environmental health risk”, saying that exposure to air pollution contributed to one in eight deaths around the world.22 Of these air pollution-related deaths, some 88 percent occurred in low- and middle-income countries.23
Also in 2012, the World Health Organisation (WHO) classi-fied diesel exhaust as carcinogenic24, a move that added to the long list of known negative health effects from traffic-related emissions. Particulate matter is very harmful because it pene-
trates and lodges deep inside the lungs. It is associated with heart disease, lung cancer, and a range of other harmful health effects. Sulphur in fuel increases the emissions of fine particu-late matter. The combustion of sulphur in diesel also produces sulphate particles, which make up a significant share of total fine particulate emissions, known for their toxicity.25 In coun-tries without stringent fuel policies, diesel sulphur content is typically 500 to 2,000 ppm, and sulphates make up 15 to 50 per-cent of diesel PM2.5 emissions.26
When fuels containing sulphur are burned, sulphur dioxide (SO2) is emitted. SO2 is a pollutant that affects the respiratory system, reducing lung function, causing coughing, mucus secre-tion and aggravating asthma and chronic bronchitis.
Because high sulphur fuels destroy advanced emission con-trol technologies in vehicles, the negative health effects are in-creased. Particulate filters control not only PM2.5, but can also reduce the emission of ultrafine particles (PM1). These ultra-fine particles are thought to have a greater toxicity than larger particles due to their higher quantity, and their ability to pene-trate deep into the lung tissue and therefore into the blood stream. Sulphur also damages systems that control nitrogen oxides (NOx), pollutants that have several impacts, including smog and additional PM2.5 formation.27 NOx is also the main source of nitrate aerosols, which, in the presence of heat and sunlight, produce ozone. Exposure to ozone causes lung in-flammation, in turn leading to chest pain, coughing and nau-sea, while chronic exposure has been proven to cause perma-nent damage to the lungs. A particular nitrogen oxide, nitrogen dioxide (NO2), is a toxic gas that at short-term concentrations causes significant inflammation of the airways, reducing lung function and increasing symptoms of bronchitis in asthmatic people.28
Figure 3.2 – Average sulphur limits for diesel in different regions 2015 (projected)
Euro
pe
US
& C
anad
a
Russ
ia &
Cas
pian
Asi
a-Pa
cific
Lati
n A
mer
ica
Mid
dle
East
Afr
ica
max
. ppm
sul
phur
in d
iese
l
2000
1800
1600
1400
1200
1000
800
600
400
200
0
Inde
pend
ent
Trad
ers
Oth
er C
ompa
nies
Regi
onal
Oil
Com
pani
es
Tota
l
Ang
lo-S
axon
Maj
ors
10 %
5 %
0 %
–5 %
–10 %
–15 %
–20 %
–25 %
51–500 ppm20 %
501–1500 ppm12%
1501–2500 ppm24 %
2501–3500 ppm40 %
> 3500 ppm4%
Africa 61 %
Gibraltar 12 %
Europe 20 %
America 6 %Asia 1%
11–50 ppm27%
51–150 ppm27%
151–250 ppm14 %
251–350 ppm27%
> 350 ppm5%
EU average (≤ 29 %v) 27 %
EU limit (>29 and ≤ 35%v)32 %
over EU limit (> 35 %v)41 %
0–5
00 p
pm
1 1 1 1 1
4 43
9
13
2 2
1
2 2
5
8
4
501–
1,000
ppm
1,001
–1,5
00 p
pm
1,501
–2,0
00 p
pm
2,00
1–2,
500
ppm
2,50
1–3,
000
ppm
3,00
1–3,
500
ppm
3,50
1–4,
000
ppm
4,00
1–4,
500
ppm
4,50
1–5,
000
ppm
5,00
1–5,
500
ppm
Num
ber o
f car
goes
repo
rted
Nat
iona
l spe
cific
atio
n 5,
000
ppm
0–5
00 p
pm
Num
ber o
f car
goes
repo
rted
Nat
iona
l spe
cific
atio
n 3,
000
ppm
501–
1,000
ppm
1,001
–1,5
00 p
pm
1,501
–2,0
00 p
pm
2,00
1–2,
500
ppm
2,50
1–3,
000
ppm
3,00
1–3,
500
ppm
SLOVAKIA
Sulphur limit in diesel (December 2015)
10–15 ppm 16–50 ppm 51–350 ppm 351–500 ppm 501–2000 ppm >2000 ppm NA
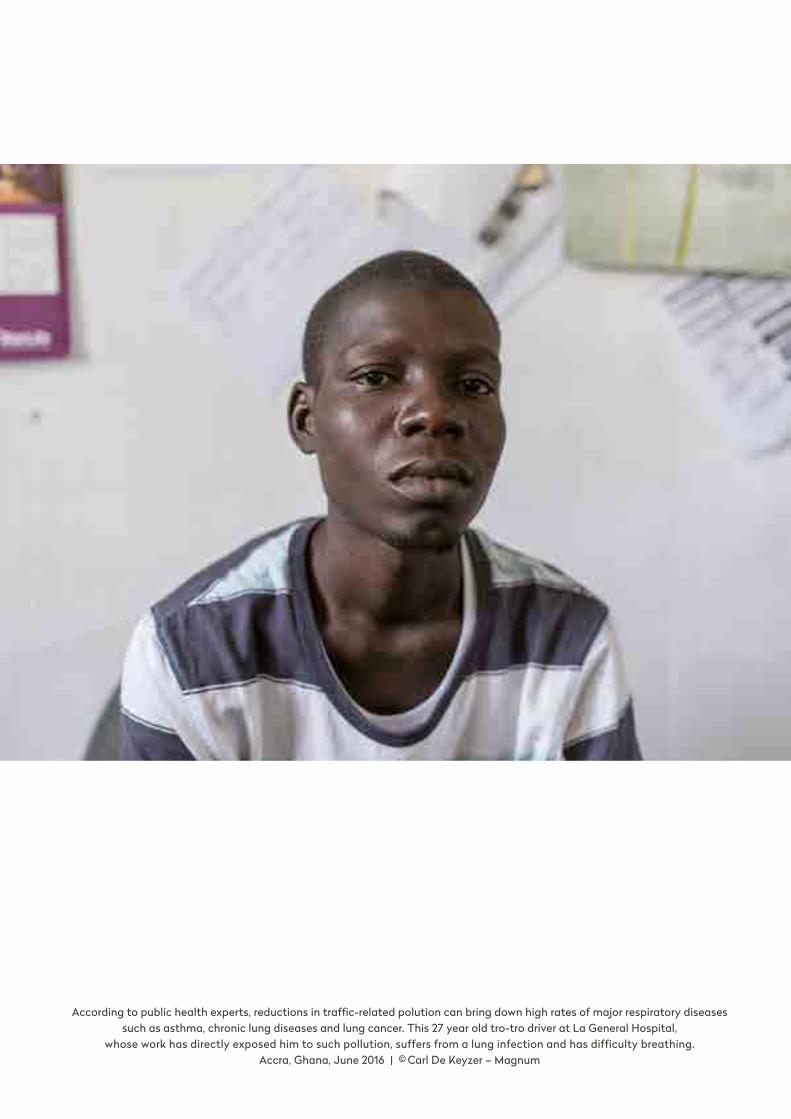
According to public health experts, reductions in traffic-related polution can bring down high rates of major respiratory diseases such as asthma, chronic lung diseases and lung cancer. This 27 year old tro-tro driver at La General Hospital,
whose work has directly exposed him to such pollution, suffers from a lung infection and has difficulty breathing. Accra, Ghana, June 2016 | © Carl De Keyzer – Magnum
A Public Eye Investigation | September 2016 23
3.4 – HEALTH EFFECTS OF AIR POLLUTION IN AFRICAN CITIES
As air pollution increases across Africa, related illnesses are projected to increase.
Dr Reginald Quansah, a lecturer at the University of Ghana’s School of Public Health, notes “a strong link between air pollu-tion and diseases, such as asthma, cardiovascular diseases, acute lower respiratory infections [e.g. pneumonia], premature deaths and infant mortality. Except for the latter, all these are increas-ing in Ghana”.29 In Ghana’s capital, Accra, consultations for acute respiratory infections were the second highest cause of outpatient hospital visits in 2014, according to the UN Environ-ment Programme (UNEP).30
In Abidjan, Côte d’Ivoire’s sprawling economic capital, Diabate Daouda, a nurse who has worked in a public hospital for 14 years also shared his observations: “We see a lot of peo-ple with respiratory problems in our clinic. Besides asthma, we see how air pollution causes throat problems for our pa-tients. This is very frequent. In particular, we see a lot of chil-dren with these complaints. We have not studied this in detail, but we did not use to see as many young patients as we see today.”31
Air pollution still causes less health problems in Africa than in regions such as Asia, Europe and the US, but the health im-pacts of air pollution are increasing in Africa. Urbanisation, large increases in vehicle ownership, and slow progress in re-ducing the sulphur content of fuels and vehicle emissions, make
Africa a region of significant concern when it comes to the fu-ture impacts of vehicle emissions.
On the other hand, better policy could rapidly have an im-mediate and positive effect. The International Council on Clean Transportation (ICCT) compared the health effects of a busi-ness-as-usual scenario with an “accelerated policy scenario”. With business as usual and diesel standards remaining at 2,000 ppm, the ICCT projected 31,000 premature deaths from traffic-related air pollution in Africa in 2030. Under the acceler-ated policy scenario, however, Africa adopts a 500 ppm limit for diesel in 2015, tightening to a 50 ppm limit by 2020, then reaches European standards for sulphur levels in diesel by 2030. In this scenario, Africa will prevent 25,000 premature deaths in 2030 and almost 100,000 premature deaths in 2050.32
The ICCT focused their analysis on traffic-related emissions in 2013, but restricted this analysis to “tailpipe emissions of pri-mary PM2.5 in urban areas”. They have acknowledged that their results present an underestimation of the health gains from mit-igating other pollutants such as NOx, secondary PM and ozone. Measured in financial terms alone, the benefits of saving lives and preventing health costs clearly outweigh the costs of mov-ing to low sulphur fuels, as we show in the concluding chapter.
Overall, the ICCT concluded that Africa stands to benefit more than any other region from the introduction of higher standards on fuels and vehicle emissions.33 Without changing policy on sulphur standards in fuel by 2030, Africa will have the world’s fastest growing rate of premature deaths due to traffic- related air pollution.
SLOVAKIA
Sulphur limit in diesel (December 2015)
10–15 ppm 16–50 ppm 51–350 ppm 351–500 ppm 501–2000 ppm >2000 ppm NA
Figure 3.3 – Sulphur limits in diesel (December 2015)
24 DIRTY DIESEL – How Swiss Traders Flood Africa with Toxic Fuels | Chapter 3
3.4.1 – THE FIRST STEP TO CLEAN THE AIR? REMOVE SULPHUR FROM FUELS
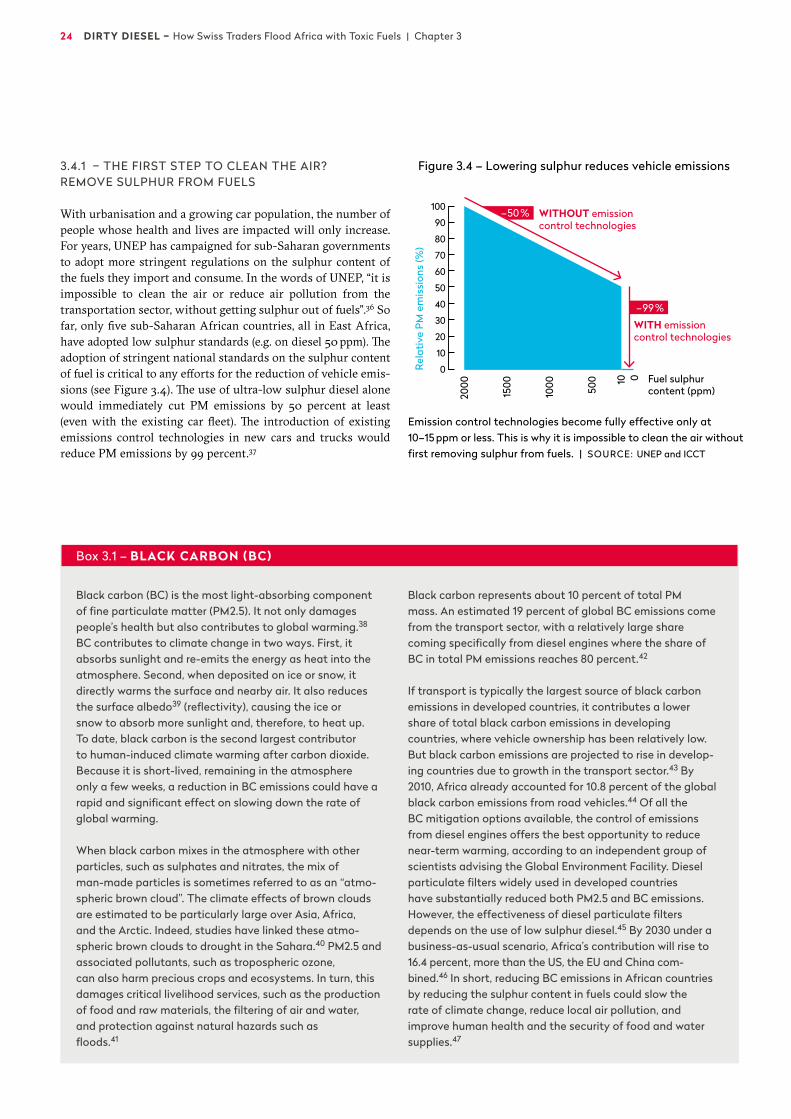
With urbanisation and a growing car population, the number of people whose health and lives are impacted will only increase. For years, UNEP has campaigned for sub-Saharan governments to adopt more stringent regulations on the sulphur content of the fuels they import and consume. In the words of UNEP, “it is impossible to clean the air or reduce air pollution from the transportation sector, without getting sulphur out of fuels”.36 So far, only five sub-Saharan African countries, all in East Africa, have adopted low sulphur standards (e.g. on diesel 50 ppm). The adoption of stringent national standards on the sulphur content of fuel is critical to any efforts for the reduction of vehicle emis-sions (see Figure 3.4). The use of ultra-low sulphur diesel alone would immediately cut PM emissions by 50 percent at least (even with the existing car fleet). The introduction of existing emissions control technologies in new cars and trucks would reduce PM emissions by 99 percent.37
Figure 3.4 – Lowering sulphur reduces vehicle emissions
Black carbon (BC) is the most light-absorbing component of fine particulate matter (PM2.5). It not only damages people’s health but also contributes to global warming.38 BC contributes to climate change in two ways. First, it absorbs sunlight and re-emits the energy as heat into the atmosphere. Second, when deposited on ice or snow, it directly warms the surface and nearby air. It also reduces the surface albedo39 (reflectivity), causing the ice or snow to absorb more sunlight and, therefore, to heat up. To date, black carbon is the second largest contributor to human-induced climate warming after carbon dioxide. Because it is short-lived, remaining in the atmosphere only a few weeks, a reduction in BC emissions could have a rapid and significant effect on slowing down the rate of global warming.
When black carbon mixes in the atmosphere with other particles, such as sulphates and nitrates, the mix of man-made particles is sometimes referred to as an “atmo-spheric brown cloud”. The climate effects of brown clouds are estimated to be particularly large over Asia, Africa, and the Arctic. Indeed, studies have linked these atmo-spheric brown clouds to drought in the Sahara.40 PM2.5 and associated pollutants, such as tropospheric ozone, can also harm precious crops and ecosystems. In turn, this damages critical livelihood services, such as the production of food and raw materials, the filtering of air and water, and protection against natural hazards such as floods.41
Black carbon represents about 10 percent of total PM mass. An estimated 19 percent of global BC emissions come from the transport sector, with a relatively large share coming specifically from diesel engines where the share of BC in total PM emissions reaches 80 percent.42
If transport is typically the largest source of black carbon emissions in developed countries, it contributes a lower share of total black carbon emissions in developing countries, where vehicle ownership has been relatively low. But black carbon emissions are projected to rise in develop-ing countries due to growth in the transport sector.43 By 2010, Africa already accounted for 10.8 percent of the global black carbon emissions from road vehicles.44 Of all the BC mitiga tion options available, the control of emissions from diesel engines offers the best opportunity to reduce near-term warming, according to an independent group of scientists advising the Global Environment Facility. Diesel particulate filters widely used in developed countries have substantially reduced both PM2.5 and BC emissions. However, the effectiveness of diesel particulate filters depends on the use of low sulphur diesel.45 By 2030 under a business-as-usual scenario, Africa’s contribution will rise to 16.4 percent, more than the US, the EU and China com-bined.46 In short, reducing BC emissions in African countries by reducing the sulphur content in fuels could slow the rate of climate change, reduce local air pollution, and improve human health and the security of food and water supplies.47
2000
1500
1000 50
0
Rela
tive
PM
em
issi
ons
(%)
10 0
100
90
80
70
60
50
40
30
20
10
0
WITH emission control technologies
–99 %
–50 % WITHOUT emission control technologies
Fuel sulphur content (ppm)
Emission control technologies become fully effective only at 10–15 ppm or less. This is why it is impossible to clean the air without first removing sulphur from fuels. | SOURCE: UNEP and ICCT
Box 3.1 – BLACK CARBON (BC)
A Public Eye Investigation | September 2016 25
Prof. Nino Künzli, MD PhD is Deputy Direc-tor of the Swiss Tropical and Public Health Institute in Basel and Dean of the Swiss School of Public Health. Since more than 25 years, his primary focus is research on air pollution and its health effects. He developed methods for assessments of the public health impact of air pollution which have become standard tools to inform about the relevance of air pollution and the benefits of clean air
policies. He is an internationally known expert and advisor of re-search teams in both science and policy-oriented commissions.
What are currently the most pressing health concerns with regards to the emission of pollutants by road traffic?Road traffic-related pollutants remain an important concern and challenge, particularly due to the fact that these emissions usually occur very close to people, be it pedestrians, cyclists or all those who live on busy roads. Exhaust-related pollutants such as carbon monoxide, ultrafine particles, nitrogen oxides, diesel soot particles and many others are highly concentrated along busy roads and enclosed streets. As a consequence, exposure can be several times higher than in alleys or parks that are only 50–100 meters away. As research progressed in the past decades, the list of health prob-lems known to be related to these pollutants has become longer and longer. Major respiratory diseases such as asthma, chronic ob-structive lung diseases and lung cancer would be less common if there was less traffic-related air pollution. The same is true for cardiovascular diseases, including the major underlying cause of these diseases – atherosclerosis, or the calcification and stiffening of the arteries. Air pollution accelerates these processes, thus, health problems may occur earlier in life and be more severe.
Novel research findings indicate that air pollutants may ad-versely affect brain development as well as metabolic disorders such as diabetes or obesity. These chronic diseases are also strong determinants of life expectancy. People living close to traffic-related air pollution have, on average, a shorter life expec-tancy and higher risk of disease than those living in less pollut-ed locations highlighting the urgent need to control emissions to reduce the health effects of traffic-related air pollutants.
There is some good news: policymakers can have a strong in-fluence on air quality. As seen in most Western countries over the past three decades, emissions controls and other clean technolo-gies have led to substantial improvements in air quality. These improvements are resulting in better health. The famous Swiss SAPALDIA study showed that the “normal” process of aging (in-cluding continued loss of lung function) was slowed down among those study participants who experienced an improvement in local outdoor air quality during the years of the study.
How does sulphur content in fuels influence the emission of pollutants and their health effects?One should be cautious in assigning the health effects men-tioned above to single pollutants, as they are the consequence of complex pollutant mixes carried most effectively and deeply
into the lungs by fine and ultrafine particles. These “carriers” are directly emitted by dirty engines, but also formed in the atmo-sphere from traffic-related precursor gases (including sulphur). Sulphur is therefore just one of many problematic pollutants in fuel. However, what makes it a particularly serious problem re-lates to the fact that the most advanced exhaust technologies are not functional in the presence of high sulphur fuels. Thus, the problem extends far beyond the issue of having higher sulphur concentrations in the air to include the disabling of a wide range of cleaner technologies available on the market and indeed the legal default in all vehicles sold in Europe.
How relevant are traffic-related emissions for urban areas in Africa today and how relevant will they become in the future?Africa is as much in transition as the “global South” in general. This also means that urbanisation and car ownership are dra-matically increasing. It should be a policy priority to ensure that the growing vehicle fleet is at least as clean as the newest gener-ation of cars sold in Europe, Japan or the US. It is unacceptable that the dirty cars forbidden on our streets are ending up on the streets of African megacities instead. These trends will continue to increase for many years to come. The disease burden related to air pollution, already particularly high in these countries, will also continue to increase. If countries in the South do not make substantial changes to their air quality management, air pollu-tion may soon rank as the primary cause of morbidity and mor-tality. According to the Global Burden of Disease, air pollution from indoor and outdoor sources currently ranks as the second most important cause of mortality and morbidity, after poor nu-trition and diet, and above smoking and malaria. This highlights the enormous opportunity for governments to implement clean air policies as a primary strategy to protect public health.
What should be done?Governments around the globe have a major responsibility to enforce stringent fuel standards in their countries. Some hesi-tate because refineries are owned by the state, so investments must be made by the state as well. This is very short-sighted because the health consequences of pollution are an order of magnitude costlier than the investment required to modernise fuel production. It is unfortunate that many governments con-tinue to believe that pollution is the price to pay for economic prosperity. The opposite is true and indeed the most developed economies in the world understood this long ago. These coun-tries have seen the success of pro-active clean air policy making. Switzerland is one of many countries where air quality is far better today than 30 years ago. It is extremely unfortunate that the most polluted countries still see trends in the opposite di-rection. Solutions to the problem are well known and could be adopted on a global scale. Governments of the most polluted countries should implement 10 ppm sulphur standards for fuels, as well as emission and air quality standards. They should do this to protect their population from companies who continue to produce and sell high sulphur fuels or heavily polluting vehi-cles in their countries simply because the rules are so weak.
Box 3.2 – INTERVIEW WITH PROFESSOR NINO KÜNZLI

Kate Okine, an asthmatic pregnant woman, complains about Ghana's air pollution that is directly impacting her chronic disease. Accra, Ghana. November 2015 | © Fabian Biasio
A Public Eye Investigation | September 2016 27
3.5 – BEYOND SULPHUR: AROMATICS AND BENZENE
Sulphur is not the only health damaging substance we detected while analysing our samples of African fuels. We also found (poly) aromatics in diesel. In gasoline, we found aromatics and benzene.
Aromatics are a naturally occurring constituent of crude oil48 and also produced in the refinery during cracking.49 They are high-octane components used for blending gasoline. The most commonly traded aromatics are benzene, toluene and xylenes.50
When combusted in fuels, aromatics generate particulate and polycyclic aromatic hydrocarbon (PAH) emissions.51 PAHs are an alarming group of substances for living organisms. Many are car-cinogenic, mutagenic and toxic for reproduction.52 The US Envi-ronmental Protection Agency (EPA) has identified sixteen PAHs as “priority pollutants”, including chrysene and benzo(a)pyrene. Benzo(a)pyrene, in particular, is known to harm the unborn child. The International Agency for Research on Cancer lists fifteen PAH compounds as probable, possible or known human carcinogens.53
Some PAHs are persistent, bioaccumulative and toxic for living organisms. Substances that combine these three characteristics, known as PBTs, represent a particular level of concern, as, once released, they can no longer be removed from the environment.
PAHs come from several sources, including an oil product that is incompletely burned. They are found in the exhaust from diesel engines.54 Studies in the United States and Europe found that motor vehicle emissions account for between 46 percent and 90 percent of the mass of individual PAHs in ambient air particles in urban areas.55 The well-documented harm from PAHs has led Europe to introduce new standards that restrict PAH content in diesel.56 In 2003, this was set at 11 percent (by weight in diesel)57, later dropped to 8 percent in 2009.58 With the rare exceptions of countries such as Angola, African coun-tries place hardly any limits at all on aromatics in diesel.59
The combustion of gasoline containing aromatics in a car engine leads to the formation of carcinogenic benzene in ex-haust gas. According to European and US studies, lowering the level of aromatics in gasoline significantly reduces the emis-sions of toxic benzene in vehicle exhausts.60 In Europe, aromat-ics in gasoline are restricted to 35 percent.61
In sub-Saharan Africa, however, there are almost no limits on how much aromatics are allowed in gasoline, although once again Angola is one of the few exceptions.62
Benzene is not only produced when aromatics in gasoline are burned, it is also a naturally occurring constituent of crude oil and is produced during catalytic reforming in refineries. It is toxic to humans. According to the European Agency for Safety and Health at Work, benzene is classified as a known carcinogen with presumed mutagenic properties.63 It is highly volatile and human exposure occurs mainly through inhalation or absorp-tion through the skin, for example “during contact with a source such as gasoline”.64 Acute direct exposure to benzene may cause, among other things, headaches, dizziness, drowsiness and loss of consciousness, while chronic exposure may result in leukae-mia, cardiac abnormalities, cancer, and more. Benzene can also cause excessive bleeding and can affect the immune system, increasing the risk of infection. Long-term exposure has been associated with reproductive disorders in women.65
Regulators from many countries recognise that an effective way to reduce human exposure to benzene is to control the legal limits on benzene levels in gasoline.66 In Europe, benzene in gas-oline is restricted to 1 percent. In many African countries, limits do not exist. Where such limits do exist, they can be as high as 5 percent.67
3.5.1 – A MAJOR HEALTH CONCERN FOR AFRICA
Africa is of special concern regarding pollution from aromatics exhaust. This is because catalytic converters, which minimise PAH emissions, are rarely installed in vehicles and, when they are installed, they don’t work due to the corrosive impact of high sulphur fuels. Diesel and gasoline engines without catalyt-ic converters are reported to have the highest PAH emissions.68
In 2014, WHO identified benzene and PAHs as major health concerns in the African region. “Exposure to harmful hydrocar-bons, including benzene and polycyclic aromatic hydrocarbons (PAHs), has been reported in a number of countries in the Afri-can Region,” the WHO wrote. A biomonitoring study conducted in Kinshasa in the Democratic Republic of the Congo, for exam-ple, found higher levels of benzene in urban blood samples than in samples from a sub-rural population. The urban area had high levels of population density, motorisation, old vehicles and car traffic, whereas the sub-rural area had a higher percentage of green areas. Another study conducted in Cotonou, Benin, assessed non-smoking taxi-motorbike drivers for exposure to benzene and PAHs in ambient air. The study found that city-dwelling drivers were exposed to levels of benzene 15 times that of the maximum limit set by the WHO (5 µg/m3), while the exposure of villagers remained within the limits. PAHs an-alysed from urinary excretion was also higher from the city dwellers compared to the people living in the villages.69
The WHO survey also noted that occupational exposure to benzene is “very common” in Africa. Automobile mechanics and petrol station attendants are at special risk mainly because they lack proper guidance and are therefore less likely to observe proper safety procedures. A study in Calabar, Nigeria, investi-gated the potential risk of benzene exposure from gasoline among car mechanics and station attendants. It found that me-chanics often exposed themselves to benzene when they si-phoned gasoline from vehicle tanks by using their mouths to suck gasoline through a tube. In addition, they did not use gloves when cleaning vehicle parts with petrol. Petrol station attendants dispensed fuel into vehicles without protective gear. Such practices are common in many parts of Africa and raise serious public health concerns.70
“Exposure to harmful hydrocarbons, including benzene and polycyclic aromatic
hydrocarbons (PAHs), has been reported in a number of countries in the
African Region,” the WHO wrote.
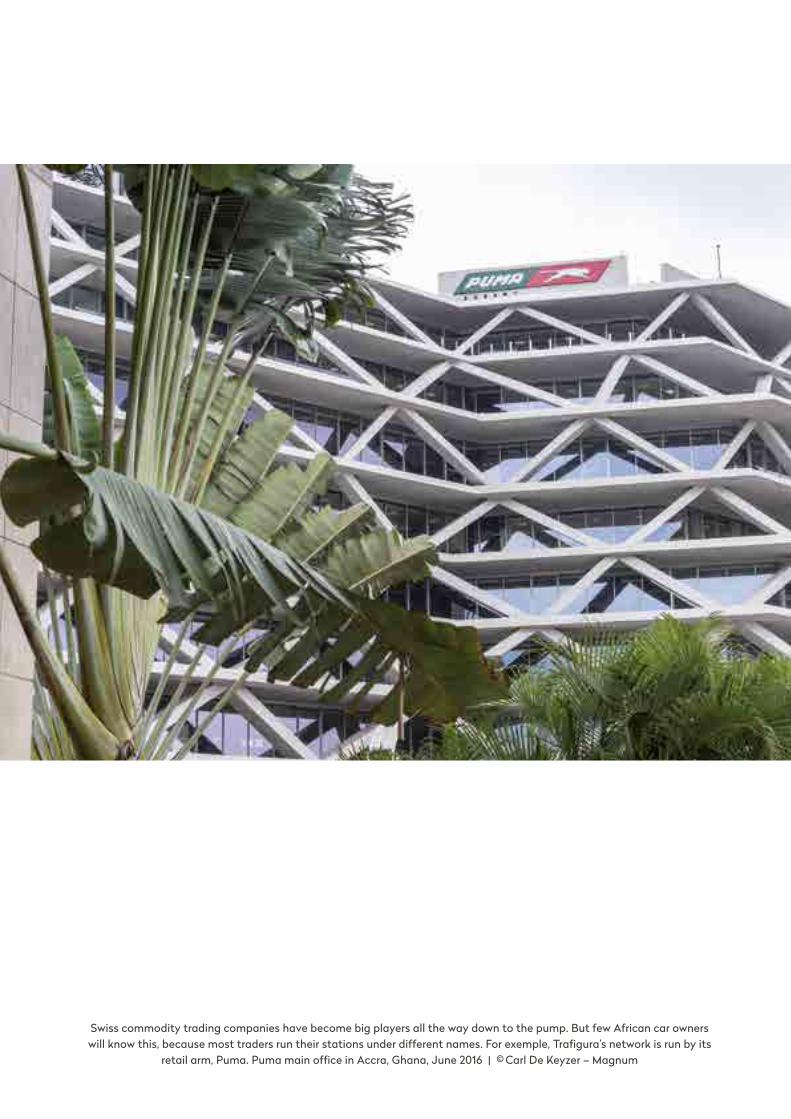
Swiss commodity trading companies have become big players all the way down to the pump. But few African car owners will know this, because most traders run their stations under different names. For exemple, Trafigura’s network is run by its
retail arm, Puma. Puma main office in Accra, Ghana, June 2016 | © Carl De Keyzer – Magnum
A Public Eye Investigation | September 2016 29
4
Swiss traders: empire-building
in Africa’s downstream sector
As oil majors began to pull out from Africa’s downstream business in the past decade, Swiss trading companies have moved in, expanding downstream to control key assets and numerous petrol stations in Africa.
Swiss traders have a dominant position in the import and/or distribution of petroleum products in West Africa.
Despite its strategic importance, petroleum products trading and distribution is a very opaque sector.
30 DIRTY DIESEL – How Swiss Traders Flood Africa with Toxic Fuels | Chapter 4
Public Eye has shone new light in recent years on the impor-tance and role of Switzerland as the world’s biggest commodity trading hub. Active in all commodities with important market shares, Swiss trading companies account for one third of the global trade in crude oil and petroleum products. The larger companies such as Vitol, Trafigura, Glencore, Mercuria and Gunvor operate globally, but have a strong focus on Africa. Nicknamed “the known unknowns” by a UK regulatory agency,1
these trading companies are famous for their opacity, a business model that has repeatedly confirmed our fears about the risks associated with the lack of transparency when they buy from African countries.
But these trading companies are not only buying crude oil on the continent. They also supply the major share of its petro-leum products, including the diesel and gasoline that is fuelling African cars. Over the past decade, bigger players such as Vitol and Trafigura have expanded downstream, buying assets in-cluding storage and petrol stations. In 2015, Trafigura had reve-nues of US$ 14.4 billion from Africa, making the continent its second largest market after Europe. Its competitor, Vitol, also operates widely on the continent. Thought to be the world’s largest commodity trader, Vitol might be expected to give some information about its activities if only in the public interest, but the company does not disclose its annual results. Many other Swiss companies also supply fuels to Africa.
And although Swiss commodity trading companies are rare-ly associated with African petrol stations, some of them have become big players all the way down to the pump. But few car owners will know this, because most traders run their stations under different names. Trafigura’s network is run by its retail arm, Puma, while Vitol’s stations still carry the iconic “Shell” logo (though Shell is only a minority shareholder). Focused ex-clusively on Africa, the Geneva-based Addax and Oryx Group (AOG) is the only exception, running petrol stations branded “Oryx Energies”.
How did this happen? Seismic changes in Africa’s down-stream markets have certainly played a role and two factors have prompted these changes. First, demand for petroleum products has been growing rapidly across the continent. At the same time, the world’s oil majors, traditional sources of African fuel, have been selling their assets too. Taken together, these fac-tors have opened new opportunities, which the Swiss commod-ity traders have gladly seized.
4.1 – AFRICA’S DOWNSTREAM MARKET: A PRO-MISING FUTURE FOR TRADING COMPANIES
Sub-Saharan Africa’s oil sector appears full of contradictions. On the one hand, Africa is an important exporter of crude oil. On the other hand, it remains a net importer of petroleum prod-ucts, such as gasoline, diesel and kerosene. The reason for this is that – with a few exceptions, such as Côte d’Ivoire and Senegal – the continent lacks capacity to refine.
This situation creates favourable prospects for Africa’s downstream players, especially those that own significant stor-age facilities. These facilities will become even more important
with rapid economic growth, which is expected to double the demand for fuels in Africa between 2000 and 2020. More im-portantly for investors, the gap between this demand and the output of African refineries is growing exponentially. Despite the desperate need to upgrade the continent’s refining facilities, financial institutions such as the IMF or the African Develop-ment Bank do not back such investments. Crucially for trading companies, therefore, African nations must rely more and more on imports to satisfy their domestic demand. Soon the conti-nent will import more products than its refineries produce.2 In West Africa, the ratio is already negative.
Africa’s downstream sector has a bright future, but the oil majors had made up their minds: they wanted to get rid of these activities. So, despite the opportunity, international oil compa-nies (the “majors”) have been pulling out of the continent for the past ten years, selling assets such as petrol stations and storage facilities.
4.2 – MAJORS OUT, TRADERS IN
ExxonMobil was the first major to pull out, closely followed by the other American giant Chevron in 2008. Chevron, which re-mained present in South Africa and Egypt, sold around one thou-sand petrol stations to an African consortium composed of Côte d’Ivoire’s state-owned Petroci and a Nigerian group called MRS. In 2010, BP and Shell sold most of their sub-Saharan networks too.
Total remains the single exception, increasing its retail mar-ket share across the continent. In 2005, the French company bought ExxonMobil’s network of petrol stations in 14 African countries.
The majors said they wanted to focus on their core business – exploration and production – and to get rid of the activities with lower margins. As Chevron’s executive vice president, Mike Wirth, neatly put it: “We are increasing efficiency and im-proving returns by shrinking our market footprint to better align with our refining operations.”3 For BP, the sale of its net-work across five countries in southern Africa was a conse-quence of the Gulf of Mexico oil spill.4 And Shell, which sold 80 percent of its assets in 14 countries, wanted to “significantly reduce our capital exposure in line with our strategy to concen-trate our global downstream footprint”, explained Mark Wil-liams, Shell’s downstream director.5
PFC Energy, a leading provider of oil and gas information, provided an additional reason: “The majors increasingly viewed their positions as ever more threatened by factors over which they have no control and by competitors who sometimes enjoy political support and lax law enforcement.”6 These new compet-itors arrived on the market as a result of the liberalization poli-cies that took place in the noughties in many African countries.
PFC Energy further reported that the “withdrawal [of the majors] permitted smaller, opportunistic and aggressive opera-tors to penetrate the downstream sector or consolidate their existing operations.”
Enter the Swiss commodity traders. As figure 4.1 shows, in-dependent trading companies, mainly based in Switzerland, didn’t miss the opportunity. By acquiring networks of petrol
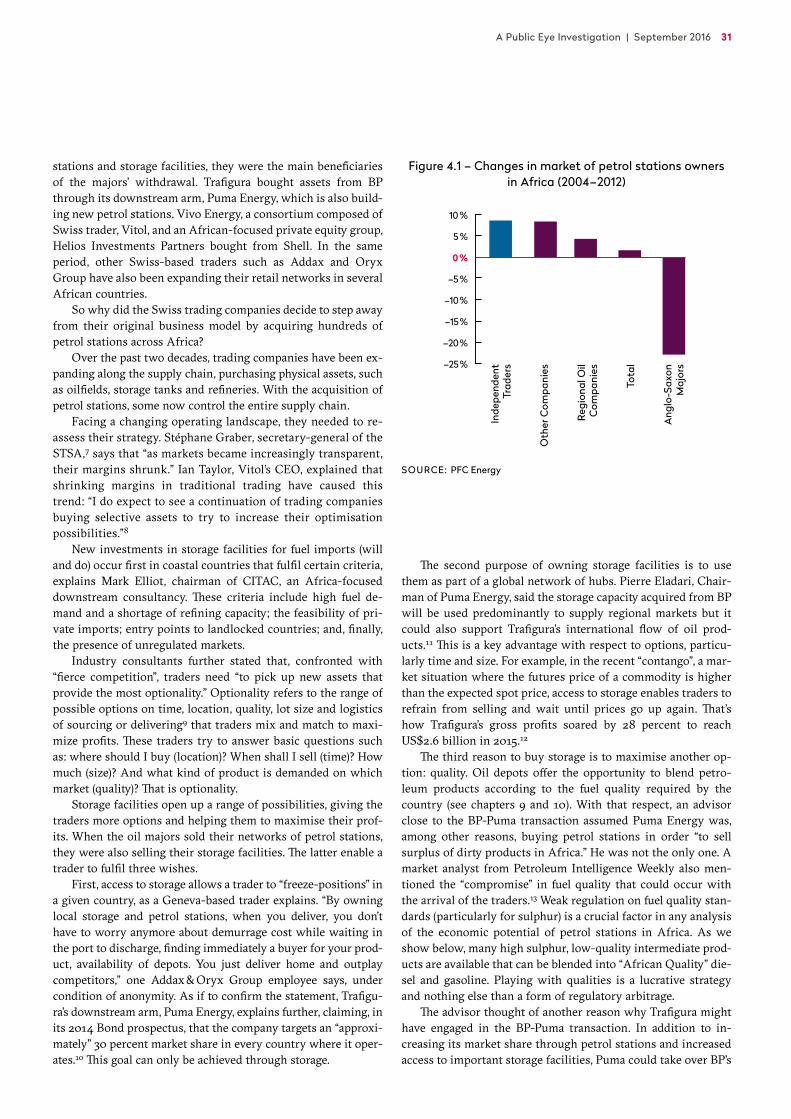
A Public Eye Investigation | September 2016 31
stations and storage facilities, they were the main beneficiaries of the majors’ withdrawal. Trafigura bought assets from BP through its downstream arm, Puma Energy, which is also build-ing new petrol stations. Vivo Energy, a consortium composed of Swiss trader, Vitol, and an African-focused private equity group, Helios Investments Partners bought from Shell. In the same period, other Swiss-based traders such as Addax and Oryx Group have also been expanding their retail networks in several African countries.
So why did the Swiss trading companies decide to step away from their original business model by acquiring hundreds of petrol stations across Africa?
Over the past two decades, trading companies have been ex-panding along the supply chain, purchasing physical assets, such as oilfields, storage tanks and refineries. With the acquisition of petrol stations, some now control the entire supply chain.
Facing a changing operating landscape, they needed to re-assess their strategy. Stéphane Graber, secretary-general of the STSA,7 says that “as markets became increasingly transparent, their margins shrunk.” Ian Taylor, Vitol’s CEO, explained that shrinking margins in traditional trading have caused this trend: “I do expect to see a continuation of trading companies buying selective assets to try to increase their optimisation possibilities.”8
New investments in storage facilities for fuel imports (will and do) occur first in coastal countries that fulfil certain criteria, explains Mark Elliot, chairman of CITAC, an Africa-focused downstream consultancy. These criteria include high fuel de-mand and a shortage of refining capacity; the feasibility of pri-vate imports; entry points to landlocked countries; and, finally, the presence of unregulated markets.
Industry consultants further stated that, confronted with “fierce competition”, traders need “to pick up new assets that provide the most optionality.” Optionality refers to the range of possible options on time, location, quality, lot size and logistics of sourcing or delivering9 that traders mix and match to maxi-mize profits. These traders try to answer basic questions such as: where should I buy (location)? When shall I sell (time)? How much (size)? And what kind of product is demanded on which market (quality)? That is optionality.
Storage facilities open up a range of possibilities, giving the traders more options and helping them to maximise their prof-its. When the oil majors sold their networks of petrol stations, they were also selling their storage facilities. The latter enable a trader to fulfil three wishes.
First, access to storage allows a trader to “freeze-positions” in a given country, as a Geneva-based trader explains. “By owning local storage and petrol stations, when you deliver, you don’t have to worry anymore about demurrage cost while waiting in the port to discharge, finding immediately a buyer for your prod-uct, availability of depots. You just deliver home and outplay competitors,” one Addax & Oryx Group employee says, under condition of anonymity. As if to confirm the statement, Trafigu-ra’s downstream arm, Puma Energy, explains further, claiming, in its 2014 Bond prospectus, that the company targets an “approxi-mately” 30 percent market share in every country where it oper-ates.10 This goal can only be achieved through storage.
The second purpose of owning storage facilities is to use them as part of a global network of hubs. Pierre Eladari, Chair-man of Puma Energy, said the storage capacity acquired from BP will be used predominantly to supply regional markets but it could also support Trafigura’s international flow of oil prod-ucts.11 This is a key advantage with respect to options, particu-larly time and size. For example, in the recent “contango”, a mar-ket situation where the futures price of a commodity is higher than the expected spot price, access to storage enables traders to refrain from selling and wait until prices go up again. That’s how Trafigura’s gross profits soared by 28 percent to reach US$2.6 billion in 2015.12
The third reason to buy storage is to maximise another op-tion: quality. Oil depots offer the opportunity to blend petro-leum products according to the fuel quality required by the country (see chapters 9 and 10). With that respect, an advisor close to the BP-Puma transaction assumed Puma Energy was, among other reasons, buying petrol stations in order “to sell surplus of dirty products in Africa.” He was not the only one. A market analyst from Petroleum Intelligence Weekly also men-tioned the “compromise” in fuel quality that could occur with the arrival of the traders.13 Weak regulation on fuel quality stan-dards (particularly for sulphur) is a crucial factor in any analysis of the economic potential of petrol stations in Africa. As we show below, many high sulphur, low-quality intermediate prod-ucts are available that can be blended into “African Quality” die-sel and gasoline. Playing with qualities is a lucrative strategy and nothing else than a form of regulatory arbitrage.
The advisor thought of another reason why Trafigura might have engaged in the BP-Puma transaction. In addition to in-creasing its market share through petrol stations and increased access to important storage facilities, Puma could take over BP’s
Euro
pe
US
& C
anad
a
Russ
ia &
Cas
pian
Asi
a-Pa
cific
Lati
n A
mer
ica
Mid
dle
East
Afr
ica
max
. ppm
sul
phur
in d
iese
l
2000
1800
1600
1400
1200
1000
800
600
400
200
0
Inde
pend
ent
Trad
ers
Oth
er C
ompa
nies
Regi
onal
Oil
Com
pani
es
Tota
l
Ang
lo-S
axon
Maj
ors
10 %
5 %
0 %
–5 %
–10 %
–15 %
–20 %
–25 %
51–500 ppm20 %
501–1500 ppm12%
1501–2500 ppm24 %
2501–3500 ppm40 %
> 3500 ppm4%
Africa 61 %
Gibraltar 12 %
Europe 20 %
America 6 %Asia 1%
11–50 ppm27%
51–150 ppm27%
151–250 ppm14 %
251–350 ppm27%
> 350 ppm5%
EU average (≤ 29 %v) 27 %
EU limit (>29 and ≤ 35%v)32 %
over EU limit (> 35 %v)41 %
0–5
00 p
pm
1 1 1 1 1
4 43
9
13
2 2
1
2 2
5
8
4
501–
1,000
ppm
1,001
–1,5
00 p
pm
1,501
–2,0
00 p
pm
2,00
1–2,
500
ppm
2,50
1–3,
000
ppm
3,00
1–3,
500
ppm
3,50
1–4,
000
ppm
4,00
1–4,
500
ppm
4,50
1–5,
000
ppm
5,00
1–5,
500
ppm
Num
ber o
f car
goes
repo
rted
Nat
iona
l spe
cific
atio
n 5,
000
ppm
0–5
00 p
pm
Num
ber o
f car
goes
repo
rted
Nat
iona
l spe
cific
atio
n 3,
000
ppm
501–
1,000
ppm
1,001
–1,5
00 p
pm
1,501
–2,0
00 p
pm
2,00
1–2,
500
ppm
2,50
1–3,
000
ppm
3,00
1–3,
500
ppm
Figure 4.1 – Changes in market of petrol stations owners in Africa (2004–2012)
SOURCE: PFC Energy

32 DIRTY DIESEL – How Swiss Traders Flood Africa with Toxic Fuels | Chapter 4
contracts to supply diesel to copper mines and jet fuel to air-ports, he said. These storage assets also opened the possibility of “sweetheart deals,” such as the one Trafigura enjoys in Angola with a politically exposed person (see chapter 5). Just like his assumption on fuel quality, this one is backed by PFC Energy when it referred to the majors’ new competitors “who some-times enjoy political support.” We demonstrate in the next chapter that trading companies indeed have no problems build-ing alliances with politically connected players or even directly with politicians. Commodity traders also like opacity. And in this respect, the African downstream industry, despite its cru-cial importance for African economies, gives them exactly what they need (see box 4.1).
Overall, it all went well for the Swiss commodity trading companies in the context of their dire need to adapt their business model: the conjunction of Africa’s downstream changing market
and the desire of the majors to pull out occurred at the same time. Figure 4.2 (pages 34–35) shows the market shares they managed to create for themselves by following their new strategy. It clearly demonstrates the importance of major commodity trading com-panies such as Vitol, Trafigura, and the Addax and Oryx Group. Having introduced these companies, we turn to the lesser-known Swiss traders, such as SARPD-Oil,14 Augusta Energy and Lynx Energy, which have established themselves in niche markets.
4.3 – VITOL BECOMES AN AFRICAN GIANT OVERNIGHT Vitol, the world’s largest trader, expanded into African distribu-tion networks by buying up large amounts of Shell’s infrastruc-ture in 16 countries in 2010. Since then, it has consolidated its
Public Eye and its partners have long advocated for more transparency in the oil trade, arguing that transparency is critical to protect the best interests of citizens of resource- rich countries.
But finding consistent and comprehensive data on Africa’s fuel sector has proved extremely difficult, even for the basics, such as production, consumption and imports. Finding information on trade flows – for example to answer questions about the origin of imported products, a company’s market share in the distribution of petroleum products, its assets and/or business relationships, etc. – is sometimes nearly impossible using traditional research methods.
We researched online, going through most of the publicly accessible statistics and leading market analyses. We also looked at ship-tracking databases and dug into companies’ annual reports, their bond prospectuses (where they exist). We visited most of the countries under review to obtain data directly from the relevant ministries. And we systematically cross-checked all the information to obtain the best possible data on the downstream sectors of our focus countries.
We also commissioned London-based CITAC, a respected industry consultancy, to tell us about Angola. The former Portuguese colony is of particular interest due to the magnitude of Trafigura’s activities there (see chapter 5). But citing the sector’s opacity, CITAC was unable to answer some basic questions. It could tell us, for example, that Trafigura imports “the majority” of Angola’s petroleum products, but when we requested a more specific answer, it replied: “We do not believe anyone else supplies the country.” The answer to our next question on the origin of the products delivered was
that they could come from any refining hub in the world, including north-west Europe, the US Gulf, the Arab Gulf, India’s west coast or Singapore.
We next commissioned a distinguished freelance researcher to find data on national production, consumption, import volumes, and market shares for Swiss trading companies for both gasoline and diesel in our focus countries. Despite gathering important information, large gaps remained and the quality of the data collected varied from country to country. The researcher explained:
“This is one of the most opaque sectors I’ve ever had to deal with. There’s a lethal combination of limited government capacity for collecting or publishing data from a sector that is operated by a vast number of mainly private, sometimes small and often non-resident companies. There is also a larger than usual degree of secrecy surrounding shipping operations that I think is down to the fact that more trades are with private sector companies that are not obliged to release detailed reports than is the case with crude and to the lack of trade reporters covering product shipping (so there are limited ways for the information to leak out). The result of this combination is an almost total absence of coherent data on even the most basic fundamentals in most countries. This big black data hole obviously facilitates vested interests and questionable commercial behaviour, and in turn hurts consumers, but it’s not clear that information flow is being blocked to any greater extent by vested interests than by capacity failings. I got the impression that a lot of national organisations are collecting elements of product consumption and trade data, but that it is not in most cases being put together to create a unified picture.”
Box 4.1 – OPACITY IS A PROPERTY OF OIL
A Public Eye Investigation | September 2016 33
physical African presence in Ghana and Nigeria. Despite a 38 per-cent drop in annual turnover in 2015, Vitol still pulled in US$168 billion making it Switzerland’s second largest company by reve-nue after Glencore (with four other commodity traders close be-hind).15 In 2014, it was the ninth largest company in the world.16
Owned by its senior employees, the group has offices in 40 countries and publishes neither its annual report nor its profits. Every day, it has 200 ships at sea, carrying the equivalent of half the daily output from Russia, the world’s second biggest pro-ducer country.17 By comparison, oil giants Exxon Mobil and BP own 54 and 44 tankers respectively.18
Originally a pure trader, Vitol has acquired stakes in pro-duction assets since then, including a 100 percent ownership of oil fields in Ghana and minority stakes in Côte d’Ivoire. Through a minority share in another company, the London-based Arawak Energy, Vitol also has permits to exploit oil and natural gas fields in Russia, Ukraine and Azerbaijan. Its biggest revenue stream is crude oil, but Vitol is also a key player in a wide-range of petroleum products such as gasoline and diesel. Through its logistics branch, VTTI, and its mid-stream arm, Varo Energy, Vitol owns major storage facilities, including refineries in Swit-zerland, Belgium and the United Arab Emirates (UAE). It is able to refine more oil in one year than the entire production of a country like the Republic of the Congo.
In 2010, Vitol and its associate Helios Investment Partners, an Africa-focused private equity group, each bought a 40 per-cent share in Shell’s distribution networks in 16 countries across sub-Saharan Africa, while Shell held on to the remaining 20 percent. Over one thousand of these petrol stations continue to display the Shell brand, which explains why few African con-sumers have heard of the operating company, Vivo Energy. Shell only kept its assets in four African countries – Botswana, Na-mibia, Tanzania and Togo – which are “under review for poten-tial inclusion in the deal at a later date.”19
In July 2016, Vitol and Helios expanded their foothold on the continent by acquiring 49 percent of Oando’s assets in Nigeria.20 For US$ 210 million, the consortium added 350 petrol stations and large storage facilities to its portfolio, operating under OVH Energy. Vitol and its partners thus became the second biggest downstream entity in Africa’s largest economy after Total, with a market share of 12 percent.
While, today, Vivo Energy is the market leader in the distri-bution of petroleum products in many African countries, Vitol also enjoys a privileged position in the market for imported pe-troleum products. In Mozambique, for example, it became the sole importer of fuel in 2014.21 Vivo’s Côte d’Ivoire manager told Jeune Afrique that all the products he sells at the pump are bought from Vitol, highlighting the synergies between the group’s trading and retail activities.22
In its corporate brochure, Vivo Energy states it is “fortunate that, through Vitol and the fast-growing storage and terminal business, VTTI, we benefit from unique access to a truly global integrated supply chain with the world's largest physical energy trader".23 Hardly can one be clearer about the synergies between Vitol and Vivo. Responding to our detailed questions, Vitol however said it only supplies “a small proportion of the petro-leum products sold by Vivo Energy".
4.4 – TRAFIGURA BRINGS AN AGGRESSIVE PUMA IN THE CONTINENT
For most (West) Africans, the very mention of Trafigura brings back memories of “Probo Koala”, the ship caught dumping toxic waste in Abidjan in 2006, a scandal for which the former CEO Claude Dauphin spent five months in an Ivorian jail.24 Locals must have been quite surprised, therefore, to discover in Jeune Afrique that Trafigura had become the biggest foreign company operating on the continent.25 The group makes over a quarter of its revenues (US$24.3 billion in 201426) by buying crude oil and selling petroleum products between Casablanca and Johannes-burg. The commodity price slump reduced this figure to US$14.4 billion in 2015, though Africa remained the company’s second biggest market after Europe. And Trafigura enjoyed its “best trading year,” thanks to extremely volatile prices.
Trafigura was founded by Claude Dauphin and five partners in 1993 as a spin-off from Marc Rich International when the latter became Glencore. Dauphin was a textbook student of his mentor, Marc Rich, the iconic commodity trader who moved to Switzerland in 1983 when charged in the United States for tax fraud and 65 other criminal charges. Dauphin brought the same taste for risky environments to his new company, of which he owned “a little less than 20 percent” until he passed away in September 2015.27 The remaining 80 percent belongs to Trafigu-ra’s managers. Despite its global operations, Trafigura remains highly secretive. Jeremy Weir made Bloomberg’s headlines in April 2015 as the company’s first ever CEO to speak in public.28
Like other trading companies, the group, whose ultimate parent company is based in Curaçao in the Caribbean, began its life as a pure trader. Like Vitol, most of Trafigura’s income (67 percent of its net turnover in 2015) comes from crude oil and petroleum products, though it also claims to be “one of the world’s largest metals and mineral traders.”30 Today, Trafigura is more than a simple intermediary. It owns physical assets worth US$39 billion, including mines, ships, storage tanks, petrol sta-tions and pipelines.
Downstream and retail activities are operated through Puma Energy, who developed along the same aggressive path paved by its parent company, Trafigura (48.4 % share of Puma). Puma's shareholders include the Angolan state-owned Sonangol and
the privately-held Cochan, holding respectively 30 % and 15 % each (see next chapter). The remaining shares belong to offshore companies owned by Trafigura's main managers, which puts them de facto in possession of the majority of Puma, as Trafigura is also privately held by the same group of individuals, although according to Puma the two companies “operate independently".
Vitol is able to refine more oil in one year than the entire production
of a country like the Republic of Congo.

34 DIRTY DIESEL – How Swiss Traders Flood Africa with Toxic Fuels | Chapter 4
Figure 4.2 – Swiss trading companies presence in Africa’s downstream sector
CORPORATE OWNERSHIP
Countries in which Swiss traders own major downstream assets (petrol stations, storages,
terminals, airports)
OPERATIONS
PE Group of companies
48.4 % 30 % 15 % 6.6 %
40 % 40 % 20 %
100 %

A Public Eye Investigation | September 2016 35
SOURCES: market, independent consultant, respective government ministries, statistics institutes and company sources. See endnotes for respective status of data.29
Market shares and infrastructures
MARKET SHARES OF IMPORTS
OWNED STORAGE CAPACITY (M3)
MARKET SHARES OF SALES TO END CONSUMERS
OWNED PETROL STATIONS
ANGOLA Trafigura/ DT Group 100 %
Pumangol 236,300 Unknown Pumangol 78
BENIN Unknown Oryx Energies 55,000Puma Energy 74,300
Oryx Energies 20 % Puma Energy/Gazelle Trading ? %
Oryx Energies 59Puma Energy/Gazelle Trading 16
REPUBLIC OF THE CONGO
SARPD-OIL 60 % Unknown Puma Energy 43 % Lynx/X-Oil 29 %
Puma Energy 38Lynx/X-Oil 19
CÔTE D'IVOIRE
Unknown Vivo Energy 95,831Puma Energy 176,600
Vivo Energy 34 % Puma Energy Unknown
Vivo Energy 183Puma Energy 1
GHANA Glencore/Fueltrade 12 % Trafigura/ Chase Petroleum 9 % Vitol/Cirrus Oil 6 % Trafigura/Blue Ocean 5 %
Vivo Energy 11,000Puma Energy 62,700
Vivo Energy 13 % Puma Energy/ UBI 2 %
Puma Energy/UBI 40Vivo Energy 202
MALI Oryx Energies 40 % Vivo Energy 3,200 Unknown Oryx Energies 23Vivo Energy 16
MOZAMBIQUE Vitol 100 % Puma Energy 276,700 Unknown Puma Energy 14
NIGERIA Trafigura/Delaney 10 % Glencore 4 % Vitol 1 % Mercuria 1 % Only cover gasoline imported by PPMC (2013)
Vitol/Oando 84,000 Oryx Energies 30,000Puma Energy 17,400
Vitol/Oando 12 % Vitol/Oando 420Oryx Oil Marketing Company Nigeria Ltd. 2
TANZANIA Addax Energy 42 % Augusta Energy 25 %
Puma Energy 94,800Oryx Energies 150,000 (+100,000)
Puma Energy 12 % Oryx Energies 12 %
Puma Energy 44Oryx Energies 20
ZAMBIA Trafigura 15 % Only cover gasoline and gasoil (2013)
Puma Energy 12,000Oryx Energies unknown
Puma Energy 24 % Oryx Energies 2 %
Puma Energy 58Oryx Energies 4
ZIMBABWE Trafigura/Sakunda Energy 50 %
Unknown Unknown Puma Energy/Redan Petroleum 87
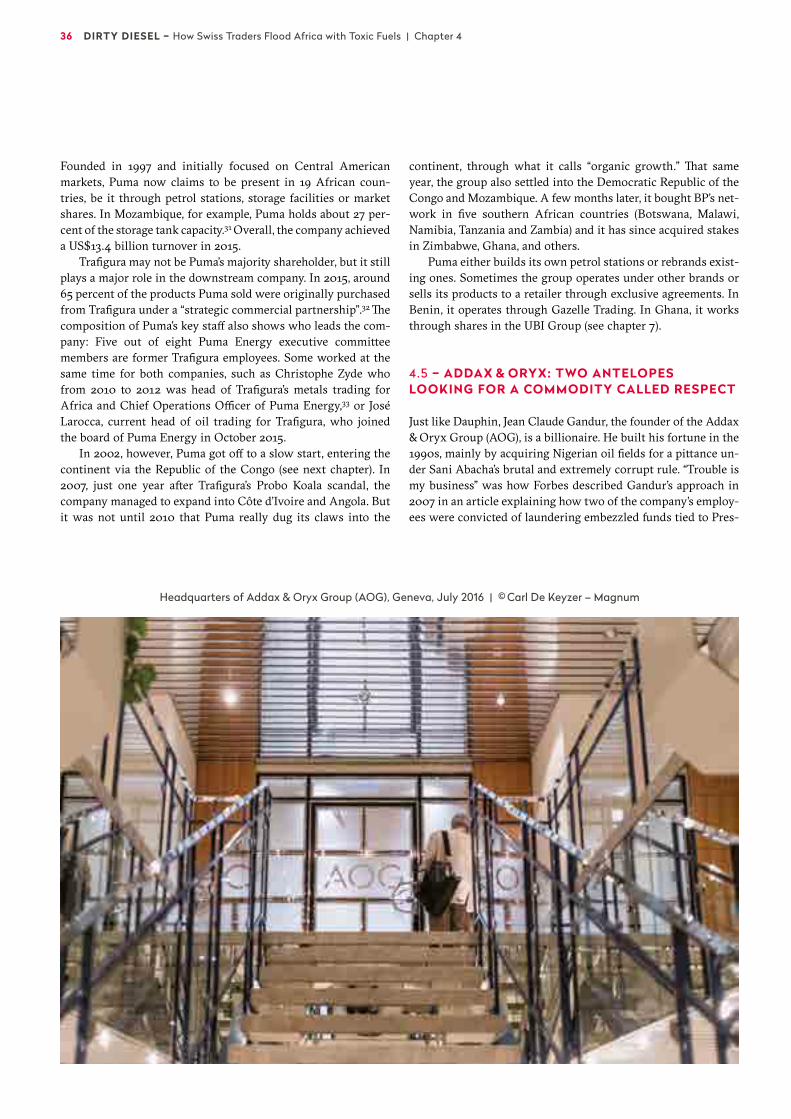
36 DIRTY DIESEL – How Swiss Traders Flood Africa with Toxic Fuels | Chapter 4
Founded in 1997 and initially focused on Central American markets, Puma now claims to be present in 19 African coun-tries, be it through petrol stations, storage facilities or market shares. In Mozambique, for example, Puma holds about 27 per-cent of the storage tank capacity.31 Overall, the company achieved a US$13.4 billion turnover in 2015.
Trafigura may not be Puma’s majority shareholder, but it still plays a major role in the downstream company. In 2015, around 65 percent of the products Puma sold were originally purchased from Trafigura under a “strategic commercial partnership”.32 The composition of Puma’s key staff also shows who leads the com-pany: Five out of eight Puma Energy executive committee members are former Trafigura employees. Some worked at the same time for both companies, such as Christophe Zyde who from 2010 to 2012 was head of Trafigura’s metals trading for Africa and Chief Operations Officer of Puma Energy,33 or José Larocca, current head of oil trading for Trafigura, who joined the board of Puma Energy in October 2015.
In 2002, however, Puma got off to a slow start, entering the continent via the Republic of the Congo (see next chapter). In 2007, just one year after Trafigura’s Probo Koala scandal, the company managed to expand into Côte d’Ivoire and Angola. But it was not until 2010 that Puma really dug its claws into the
continent, through what it calls “organic growth.” That same year, the group also settled into the Democratic Republic of the Congo and Mozambique. A few months later, it bought BP’s net-work in five southern African countries (Botswana, Malawi, Namibia, Tanzania and Zambia) and it has since acquired stakes in Zimbabwe, Ghana, and others.
Puma either builds its own petrol stations or rebrands exist-ing ones. Sometimes the group operates under other brands or sells its products to a retailer through exclusive agreements. In Benin, it operates through Gazelle Trading. In Ghana, it works through shares in the UBI Group (see chapter 7).
4.5 – ADDAX & ORYX: TWO ANTELOPES LOOKING FOR A COMMODITY CALLED RESPECT
Just like Dauphin, Jean Claude Gandur, the founder of the Addax & Oryx Group (AOG), is a billionaire. He built his fortune in the 1990s, mainly by acquiring Nigerian oil fields for a pittance un-der Sani Abacha’s brutal and extremely corrupt rule. “Trouble is my business” was how Forbes described Gandur’s approach in 2007 in an article explaining how two of the company’s employ-ees were convicted of laundering embezzled funds tied to Pres-
Headquarters of Addax & Oryx Group (AOG), Geneva, July 2016 | © Carl De Keyzer – Magnum
A Public Eye Investigation | September 2016 37
ident Abacha.34 In the same article, written several years after Addax became one of the first companies to invest in Iraqi oil fields after the 2003 invasion; Gandur described his working context: “Peace has no value to our assets.”
All these assets turned to cash when, in 2009, Gandur sold his upstream empire, Addax Petroleum, to China’s state-owned Sinopec for more than US$7 billion.35 But the group kept its trading operations and downstream assets. AOG does not dis-close its financial statements. Its corporate records in Malta where the group has incorporated its holding show a turnover of US$4.7 billion in 2014.
When, in 2011, Gandur failed to sell the rest of AOG (by this time a fully-integrated company, playing up-, mid- and down-stream, with assets in real estate too) the Geneva-based firm announced its intentions instead to invest US$400 million in Africa from 2013 onwards. Gandur’s masterplan was to build or buy assets, such as gas terminals, lubricant factories and petrol stations, across 22 countries on the continent. At this point, Oryx Energies, AOG’s retail subsidiary, already had a respect-able presence in 16 sub-Saharan African countries, plus a “com-mercial presence” in 6 others. The Group’s activities range from trading most types of petroleum products, including diesel, to distribution, whether through imports or its petrol stations. Al-though the company claims only “just over" 100 petrol stations across the continent, the size of its retail network and market share varies widely from one country to the next.
AOG has an import market share of 40 percent in Mali.36 It is also a major player in Benin, where it is one of only three private companies to own storage facilities plus more than a dozen petrol stations with plans to build more. AOG is among the major distributors in Tanzania too. In Nigeria, it owns petrol stations through its majority stake in Phoenix Oil Company Ni-geria Ltd. And in other countries, such as Sierra Leone, it doesn’t have a retail network, but enjoys a quasi-monopoly over im-ports of petroleum products (see next chapter).
Like the other traders, Oryx delivers most of its oil products to Africa using chartered tankers from Europe and the United States through its subsidiary Nyala Shipping. As its website states, the group relies strategically on storage based in regional hubs, such as Benin, Togo, Senegal or Tanzania, to supply land-locked countries such as Mali, Burkina Faso or Zambia. AOG has also a huge new storage facility in the Canary Islands, in order to supply its markets. Since June 2016, Oryx is also actively looking forward to entering Côte d'Ivoire fuel distribution market.
The company aims “to be the most respected independent oil and gas company” in the region; a “vision” that is a “natural ex-tension of our achievements over the past 25 years,” according to its website.
4.6 – OTHER SWISS TRADING COMPANIES
Other Swiss traders, including the commodity giant Glencore and the pure oil traders Mercuria and Gunvor, have also been building their operations on mainland Africa, supplying petro-leum products across the continent. Except for Glencore in Zim-babwe, they do not own petrol stations, so they were not the
focus of our study. But monthly reports by industry analysts at CITAC often list them as tender winners across the continent. In its 2013 bond prospectus, Gunvor claimed to own a 65,000 MT floating storage facility offshore Cotonou (Benin), using it to store and blend diesel for the regional market.37 In 2014, Mercu-ria lifted petroleum products from Côte d’Ivoire’s refinery, SIR, to
other West African countries, such as Benin or Equatorial Guin-ea, according to CITAC’s monthly reports. Glencore, which has partnerships with downstream operators in Zimbabwe and Gha-na, also delivers products regularly to Nigeria. Analysis of phys-ical trade flows between Europe’s main exporting hub (Amster-dam-Rotterdam-Antwerp) and West Africa, especially in Ghana and Nigeria (see chapters 7 and 8), shows clearly that Russian oil giant, Lukoil, is a leading supplier of petroleum products to Afri-can countries through its Geneva-based trading arm, Litasco.
Besides these giants, other smaller Swiss players also oper-ate in Africa’s downstream business.
Among them is Lynx Energy Partners, founded by former traders from Mercuria Energy. The Geneva-based company trades globally, but its downstream activities are focused exclu-sively on the Republic of the Congo.38 In 2011, it acquired local X-Oil’s network of 19 petrol stations, “accounting for nearly 29 percent of retail segment sales in the country,” according to its website.39 Lynx claims third place in Congo, just behind Puma, in this reputedly corrupt market (see chapter 5). Big Swiss trad-ing companies have fairly sound economic explanations for purchasing retail assets, but it remains a mystery why a small trader such as Lynx Energy Partners would invest in a retail network in one country alone.
Another is SARPD-Oil, which also operates mainly in Con-go. Incorporated in the secretive British Virgin Islands,40 with offices in Geneva and Morocco, the company is owned by Wil-fried Etoka, an individual who acknowledged his close relation-ship with the Sassou’s ruling clan.41
Also in Geneva is Augusta Energy, created in 2010 and run by former AOG employees. Capitalising on AOG’s success in Tanzania, Augusta is now AOG’s main competitor in the coun-try. Following its rapid expansion, Augusta is now looking closely at West Africa. CITAC’s monthly reports show that they frequently participate in calls for tender, sometimes successful-ly. In 2014, Augusta Energy exported from Côte d’Ivoire to Cameroon. They also won a tender to supply Gabon.42
In the next chapter, we provide examples to show how Swiss trading companies have managed to access certain mar-kets, either to invest in storage or retail networks, or to supply countries with products.
“Peace has no value to our assets.” Addax and Oryx Group's CEO
Jean Claude Gandur.
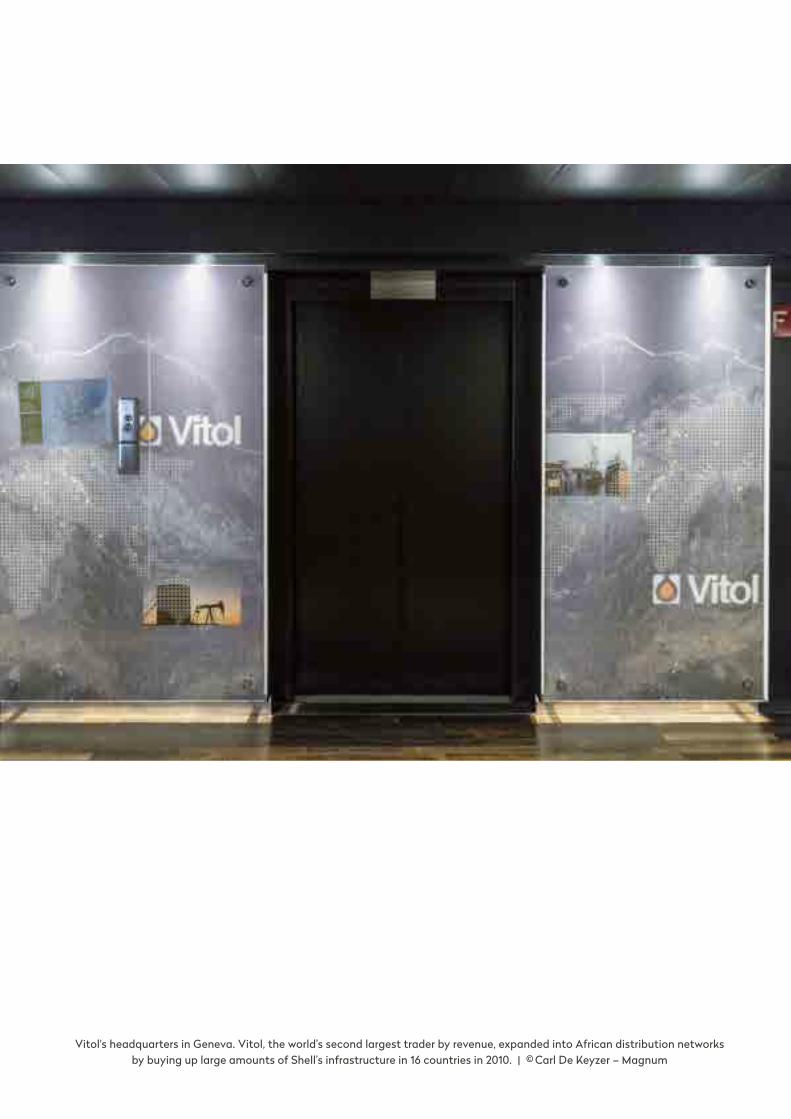
Vitol's headquarters in Geneva. Vitol, the world’s second largest trader by revenue, expanded into African distribution networks by buying up large amounts of Shell’s infrastructure in 16 countries in 2010. | © Carl De Keyzer – Magnum
A Public Eye Investigation | September 2016 39
5
Dancing with devils: Swiss trading
companies and their policies of
market access
Swiss traders use aggressive strategies to access markets and to become dominant in those markets.
They work with politically connected individuals and do business with politically exposed persons.
This happens in notoriously corrupt countries such as Angola, the Republic of the Congo or Zimbabwe.
The provision of credit to local companies allows the traders to gain indirect control in situations where it would not otherwise be possible.
40 DIRTY DIESEL – How Swiss Traders Flood Africa with Toxic Fuels | Chapter 5
Market access means everything to commodity traders; and some will do almost anything to get it. Previous studies have high-lighted the opacity and governance risks relating to the export of crude oil, when national oil companies’ (NOCs) sell to Swiss-based traders.1 For imports too, traders follow similar, albeit less well-known, rules to supply petroleum products to sub-Saharan African countries. In fuel markets across the continent, traders commonly use strategies such as a reliance on local tycoons, dodgy door openers with access to rulers, unholy alliances with public officials. Some traders have been accused of bribing poli-ticians in order to win tenders. As with crude oil, public money is at stake here. Many governments subsidise imports of cheap fuels for the population. In short, the import of these products is strategically important to governments and their economies.
Below we highlight a few cases that are emblematic of the “aggressive” business model set by Swiss trading companies. These cases focus on Angola, Sierra Leone, the Republic of the Congo, Zambia, and Zimbabwe. Readers should know that this selection is by no means a complete picture. For example, we left aside Puma's acquisition of the retail network of state-owned Petroci in Côte d'Ivoire, where Puma chose President Alassane Ouattara's nephew, Ahmadou Touré, to act as local chairman.
5.1 – ANGOLA: A WELL-CONNECTED POLITICIAN HELPS TO BUILD THE MONOPOLY
When we visited Angola in December 2013, giant colour posters of a serenely smiling President José Eduardo Dos Santos sur-rounded by happy crowds, lined roads across the country. Stamped across the posters in capital letters was “Obrigado Povo Angolano” – “Thank you, people of Angola”.
“... For allowing me to rob the country since 1979,” our driver added dryly.
According to a Western diplomat based in Angola’s capital, Luanda, Dos Santos is still seen as the country’s liberator, a man who, in 2002, put an end to almost three decades of civil war. Despite this, the diplomat says, anger is growing among the population. Angola’s oil has generated billions of dollars in the past decade, but Angola’s citizens barely see any of it (except in the immense palaces that literally overhang the slums in which they live). Meanwhile, Dos Santos’ daughter, Isabel, is Africa’s richest woman.2 In terms of GDP, Angola ranks 65th worldwide. In terms of life expectancy, however, it remains at the back of the pack, ranked 207 out of 224 countries.3 Blatant corruption by Angola’s elite who monopolise their country’s main source of revenue, oil, is one of the prime reasons for this stagnation. An-gola’s downstream sector is no exception.
When it comes to petrol stations, just three brands exist. One of them is Puma Energy, which runs 77 retail sites across the country.4 Puma Energy is often represented as the down-stream and retail arm of Trafigura, but this is only partly true. It is true that Trafigura founded Puma, but the Swiss trader only holds a 48.4 percent share. Since 2013, Angola's state-owned oil company, Sonangol, acquired a 30 percent stake, covering not just Angolan operations but global operations too, while other shareholders – Cochan Holdings LLC (15 percent), PE Invest-
ment Limited (5.6 percent) and other offshore companies – hold minority stakes.
5.1.1 – GOOD “KNOWLEDGE”… OF THE PRESIDENT
Cochan is worth a closer look. Puma’s 2014 bond prospectus, issued in Luxembourg, explains to potential investors that “Co-chan is an investment company organised under the laws of the Marshall Islands in 2010”. The prospectus further states that Puma benefits “from the local market knowledge of Cochan”.5 If by “knowledge” Puma means direct access to the Angolan Pres-ident through Cochan’s Chairman, General Leopoldino Fragoso do Nascimento (alias “Dino”), then we’d certainly agree.
Indeed, in September 2010, the very same year that Cochan received its 15 percent stake in Puma, Dino was quietly appoint-ed “Consultant to the Minister of State and Chief of the Military House,” a very senior position within the government. A month later, President Dos Santos authorised a US$931 million con-tract with Puma, enabling the company to pour huge sums of investment into the country. We’ll probably never know the connection between these events, despite Angola’s law on “ad-ministrative probity,” which defines an act of corruption as the receiving of economic advantage from a party that seeks to ben-efit from an action arising from the duties of a public servant.6
Dino is the perfect example of how conflicts of interests can arise when a public official also acts as a private investor and benefits from contracts with the State.
For Puma, the problem is history. The Puma 2014 bond pro-spectus argues that Dino “no longer serves” in his public capac-ity. But we are not so sure about that. As an Angolan investiga-tive journalist, who must remain anonymous, explained to us: “Dino’s appointment was published in the ‘Diario da Republica’, the official journal, as it should have been, but his resignation still hasn’t been (published).”
5.1.2 – A MAN WORTH US$750 MILLION
Cochan’s business with Trafigura is not limited to Puma. Through Cochan (Singapore), Dino also benefits from a 50-50 joint-venture with the Swiss trader, which has a monopoly, through the Singapore-based DT Group on imports of petro-leum products into Angola, the second largest petroleum prod-ucts market in sub-Saharan Africa.7 Is it “D” for Dino and “T” for Trafigura? Either way, the deal was clearly important enough that Trafigura’s late founder and (former) main shareholder, Claude Dauphin,8 sat on the board of the DT Group together with the General. Energy Compass, which describes itself as an independent data provider, estimated that in 2011 this monopo-ly was worth US$3.3 billion linked to the imports of 3.25 mil-lion tonnes of products, such as diesel and gasoline.9 The owner of Cochan’s (Singapore) shares in the DT Group is a Bahamas- based shell company, called Cochan (Bahamas). From there, it is impossible to trace the true beneficial owner of this company, though it is established that Dino is the founder of the group. But Puma's bond prospectus specifies that Cochan is “ultimately owned" by Dino.10 Asked to comment on its business with Gen-eral Dino, Trafigura declined to do so.
A Public Eye Investigation | September 2016 41
Based on a 2013 investigation by Public Eye, Foreign Policy assumes that Dino is the owner of Cochan and that he has be-come a very rich man. Having calculated the value of Cochan’s stake in Puma, the magazine even nicknamed him “the 750 mil-lion dollar man”.11 And that fortune does not include his other business in banking, telecoms and oil exploration. He could be a billionaire.
But Trafigura never seems bothered by the obvious conflicts of interest surrounding Dino’s public and private activities. On the contrary, the Swiss trader seems right at home. One day, the CEO of Trafigura might also have his smile on a poster thanking the people of Angola.
5.2 – SIERRA LEONE: ADDAX & ORYX GROUP CONTROL THE COUNTRY
Early in 2015, a Geneva-based commodity trading company sent a business developer on a trip to Sierra Leone to open a new market there. But he returned disappointed. “It’s dead,” he told us. “The entire country is controlled by Addax & Oryx Group (AOG),” he added, estimating that Jean Claude Gandur’s company imports around 80 % of the country’s petroleum needs.12 Asked about its market share, AOG states it supplies “around 60 %" of the products consumed in the country. Let’s have a look at how the two antelopes, after which the group is named, managed to create the lion’s share for themselves in the country.
In 2003, the year after the civil war ended, Oryx Energies, AOG’s downstream arm, entered Sierra Leone. It did so through Petrol Leone, a joint-venture with the local Leonoil, in which Oryx Energies has a majority shareholding. Oryx however claims it has had commercial relations in the country since 1991. Petrol Leone operates five strategic oil storage facilities in the port of Freetown with a total capacity of more than 65,000 m3.13 Accord-ing to Tank Storage Magazine, a specialist publication, this puts Oryx “in an excellent position in the country – there are limited other storage possibilities, the economy in Sierra Leone is ex-panding rapidly, and the location serves as a great route to land-locked countries such as Mali.”14 Oryx also owns assets in Mali, where it supplies 40 percent of the domestic demand for fuels.
Another of Oryx’s local subsidiaries, Petrojetty Co., is also building new storage capacity in Sierra Leone as well as a jetty to discharge petroleum products. The project is worth US$40 mil-lion and had been due for completion by the end of 2015.15 When finished, the jetty should enable the country to receive larger oil tankers, thus facilitating the import of petroleum products. The jetty might also have been a means to export bioethanol pro-duced by the trader’s sister company, Addax Bioenergy,16 though the Swiss company has recently abandoned this project.17
5.2.1 – A CLOSE FRIEND OF THE PRESIDENT
And AOG looks set to hold onto this quasi-monopoly. Key to AOG’s dominance in Sierra Leone, at least until he passed away in February 2016, was local tycoon Vincent Kanu who chaired Oryx’s partner Leonoil.18 Also a board member of Addax Bio-energy SA in Geneva,19 Kanu was, according to The Africa Report,
“close friends” with the President of Sierra Leone, Ernest Bai Koroma. They both came from the north of the country.20
But Vincent Kanu didn’t wait on President Koroma for his in-fluence.21 Having worked for foreign companies in the down-stream sector, Kanu then became managing director of the partly state-owned Sierra Leone National Petroleum Company (also known as “NP”).22 And when, in 1997, the government sold its 60 percent stake in NP, as part of a Bretton Woods-imposed structur-al adjustment plan, Mr Kanu was the biggest winner. Supervising the privatisation, Kanu was caught up in an obvious conflict of interest. While a 5 percent portion went to former employees, some 55 percent was granted to Mr Kanu’s Leoneoil … by him-self.23 The remaining 40 percent equity stayed with the private-ly-owned Precious Minerals and Mining Company (PMMC).
Besides Vincent Kanu, AOG hired another equally useful lo-cal agent for its Sierra Leone-focused bioenergy business: Mar-tin Bangura. The two of them, Kanu and Bangura, formed a joint company, Vinmart Security (formed by combining their two first names), which was commissioned by AOG.24
When Addax launched its project in 2008, the “Honourable” Martin Bangura was a member of parliament. And so, besides sitting on committees related to AOG activities, such as Energy and Power or Local Government and Rural Development, Ban-gura was also “representing” Bombali,25 the district where Addax Bioenergy intended to grow crops. In the local media, Mr Bangu-ra described himself as a “champion” for Addax’s plan, spending up to two or three days a week26 in his district convincing people there of the project’s benefits. In a blatant conflict of interest, he did this while his security company was on AOG’s payroll.
Asked about Vinmart, AOG said it hired the security com-pany after M. Bangura left parliament, to protect AOG's assets which were facing “extensive theft and vandalism". AOG first hired another security firm, which failed to reduce the damages. The handover to Vinmart then became effective in 2015. Finally, AOG states “it did not particularly concern" the company that “Mr. Bangura promoted a project that would bring jobs and local development to his constituency".
Looking at this situation, there is little doubt that AOG will be the main supplier of fuels consumed in Sierra Leone. Its oil tankers will continue to be navigating from the Canaries or from Lomé, where the Swiss group owns blending facilities, to reach the port of Freetown. Potential competitors are warned.
5.3 – REPUBLIC OF THE CONGO: TWO WILD-CATS, PUMA AND LYNX, ENTERTAIN THE ELITE
Entering the Republic of the Congo – a country with a solid track record of corruption – is a risky move for any company, particularly in the lucrative oil sector. But two Swiss compa-nies, Trafigura’s Puma Energy and Geneva-based Lynx Energy, seem to have handled the task with ease. They both enjoy a sig-nificant share of the domestic market from Brazzaville to Pointe-Noire. For that, following the rules of business in Congo, they had to rely on well-connected persons to serve as inter-faces between the companies and the ruling family. Many inves-tigations surrounding oil deals in the Congo have shown that
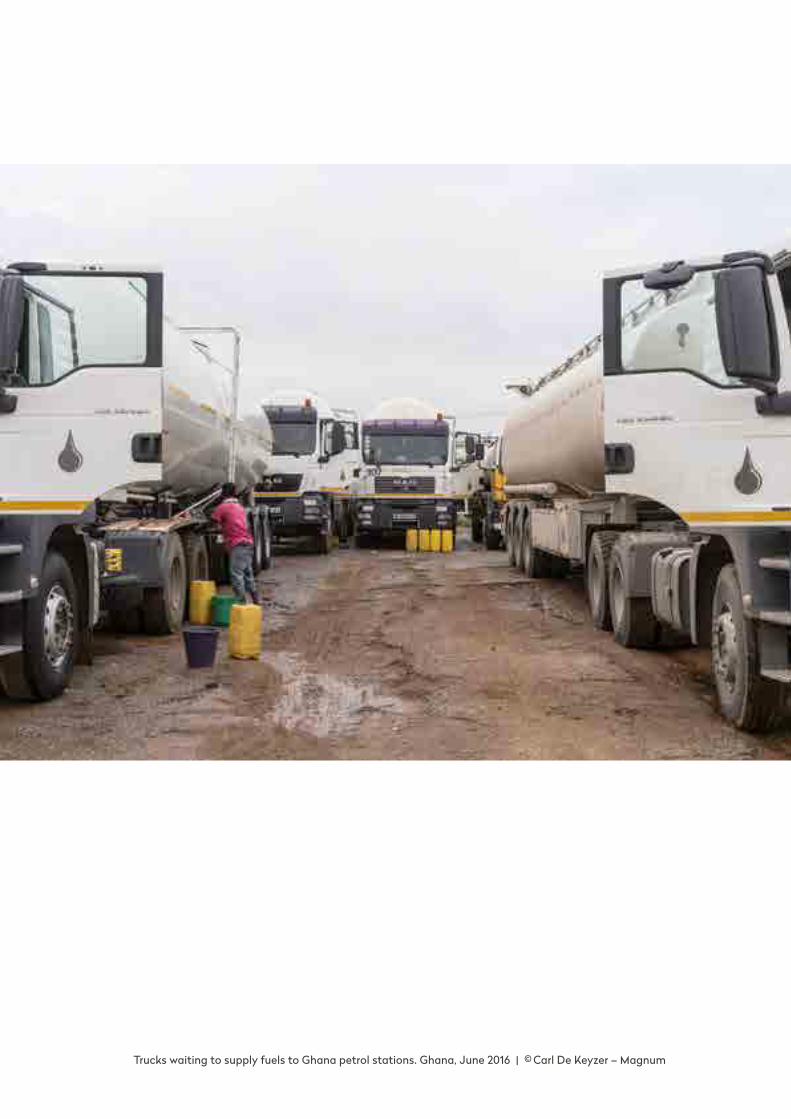
Trucks waiting to supply fuels to Ghana petrol stations. Ghana, June 2016 | © Carl De Keyzer – Magnum
A Public Eye Investigation | September 2016 43
their purpose is to enrich President Sassou Nguesso’s relatives, rather than bringing desperately needed cash to the treasury. Despite Congo’s membership of the Extractive Industries Trans-parency Initiative (EITI), which has slightly improved the trans-parency of crude sales, the country’s downstream sector re-mains highly opaque and, therefore, fertile with opportunities for fund mismanagement.
5.3.1 – A MARKET DESIGNED BY KIKI’S REFINERY AND IMPORTER FRIENDS
Congo’s demand for petroleum products is satisfied by two sources. The first source is the state-owned refinery, Coraf, which is run by the President’s son Denis Christel Sassou Nguesso, nicknamed “Kiki". This refinery gets its oil from the State and provides diesel and gasoline to the local market. Coraf’s dodgy deals with a Swiss front company, Philia, have been the subject of a previous report by Public Eye.27 Congo’s most recent EITI report, covering 2013, shows that the refin-ery processed 600,000 barrels of the state’s crude oil to gener-ate product sales worth US$600 million, but this money never reached the national treasury. PWYP-Congo and others raised serious concerns about the destination of the money.28 Under Denis Christel’s management, the refinery appears to be noth-ing less than a financial black hole. And, on the production side, its annual output is “largely insufficient for the national market”.29
That’s why remaining gaps in the national market are filled by imports. The importers sell the products to the state-owned Société Nationale des Pétroles Congolais (SNPC), which then transfers these fuels to a logistics consortium, Société commune de logistique (Sclog). The latter in turn sells them to retailers, such as Total, Puma and Lynx. Sclog has an interesting history (see box 5.1).
Among importers, SARPD-Oil dominates some 60 percent of the fuel supply, according to its owner Claude Wilfried Etoka,
a man who acknowledges his proximity to the Sassou family.34
Incorporated in the British Virgin Islands35 though its opera-tions are conducted from Morocco and Switzerland, SARPD-Oil came under the spotlight recently together with another Swiss trader, Glencore. Together, they contracted a questionable oil-backed loan with the state-owned SNPC. This was despite Congo having committed to the IMF in 2010 to cease such pre-payment deals, after investigations uncovered their use as a vehicle for the embezzlement of public funds.36
To find out about other importers of fuels, one has to rely on trading sources and ship tracking databases. They all reveal that the Orion Group also delivers products to Congo. Orion is owned by a close contact of President Sassou Nguesso, Lucien Ebata. The two are so close, in fact, that the Swiss Federal Pros-ecutor indicted Philippe Chironi, director of an Orion Group office near the Swiss town of Geneva, for aggravated money laundering after he created a complex web of offshore compa-nies to hide the Sassou family’s allegedly ill-gotten wealth. French investigators said the funds in question “may have […] resulted from corrupt practices in Africa (notably in the Repub-lic of the Congo […])”.37
Another known importer is the Africa Oil and Gas Corpora-tion (AOGC). Although there are no publicly available corporate records to establish its true human ownership, AOGC’s oil fields, trading activities and petrol stations all seem to belong to Denis Gokana. In its impressive database of corruption cases, the Stolen Asset Recovery Initiative quotes a British Commer-cial Court judgment, in which the judge claims he was “entirely satisfied that the oil business carried on in the name of AOGC, was in fact carried on by Mr Gokana”.38 That would make him the head of the Congo’s oldest and biggest indigenous private company in the oil sector, created back in 2003 when the state liberalized part of the oil sector.39 Then and now, Mr Gokana is also the chairman of SNPC, the state-owned oil company. In other words, he led the part-privatisation of his country’s oil sector and benefited directly from it too.
Handling the bulk distribution of petroleum products in Congo, Sclog30 shows how public and private interests overlap and even collide.
All retailers present in the country have a share in the consor-tium. Today, the consortium is composed of Total (25 percent), Africa Oil and Gas Corporation (25 percent) and state-owned SNPC (25 percent), while Puma Energy and X-Oil, which belongs to Lynx Energy, share their 25 percent ownership.
But the shareholding of the Sclog has changed over the years. As a retailer, Chevron once had a stake, but then sold it to Africa Oil and Gas Corporation (AOGC), a private company founded by Denis Gokana. In a blatant conflict of interest,
Gokana is also the chairman of SNPC. In its early days in the country, Puma was once in a partnership with X-Oil, which belonged at the time to another Swiss trading company called Tacoma.31
Tacoma and its Congolese subsidiary X-Oil have both been paying “consulting fees” to an offshore shell company belonging to Denis Christel Sassou Nguesso, the Congolese President’s son and head of trading operations at SNPC, according to a 2006 Hong Kong court judgment.32 The shell company, Long Beach Limited (Anguilla), was part of a broader scheme set up by Denis Christel Sassou Nguesso to syphon off part of Congo’s oil wealth to private coffers, in collusion with Denis Gokana’s AOGC.33
Box 5.1 – A LIVELY CONSORTIUM TO ENSURE DISTRIBUTION
44 DIRTY DIESEL – How Swiss Traders Flood Africa with Toxic Fuels | Chapter 5
5.3.2 – LYNX ENTERS THE BEAUTIFUL GAME
The Congolese context has not discouraged the newly formed Lynx Energy from entering this country too. In fact, Lynx start-ed in Congo, in 2011, by buying X-Oil and its network of petrol stations, as well as its share in Sclog.40 Today, Lynx, which was founded by former employees of the Swiss trading company Mercuria, claims a 24 percent share in Congo’s retail market.
Lynx hired a well-connected local agent called Donatien Mpika.41 Despite having no prior experience in the oil sector, he is currently head of Lynx Energy Trading Congo. Lynx makes no attempts to hide Mr Mpika’s previous positions: technical consultant to the Congolese Presidency’s Minister of Defence and consultant to the minister responsible for cooperation, hu-manitarian aid, and solidarity.
Mr Mpika is considered by Congolese media to be close to Denis Christel Sassou Nguesso. He even participated in the or-ganisation of a big event for the glory of the President’s son in 2009, the “Forum pour la consolidation de la paix au Congo”. He is, therefore, a useful business partner to have in Congo’s down-stream sector. For this particular event, he was part of the work-ing group that alone managed to spend well over three quarters of the event’s total budget of 3.6 million euros (of public funds, no less).42
Besides hiring Mr Mpika, Lynx wisely sponsors a football club dear to Brazzaville’s elite – “Les Diables Noirs”. Until 2013, the club was chaired by Hugues Ngouélondélé, who is currently in his third term as Mayor of Brazzaville, as well as being the President’s nephew and the brother-in-law, through his sister, of Edgard Nguesso, currently under investigation in France in a case known as the Biens mal acquis affair, meaning “Affair of the ill-gotten gains”.43
This football club has other murky histories, unrelated to the beautiful game. Until recently, it was managed by General Jean-François Ndenguet, head of the Congolese police force, the same man who, in 2004, was arrested in France for alleged participa-tion in the “disappearance” of at least 353 Congolese (DRC) refu-gees during the civil war in 1999. Thanks to his diplomatic im-munity, he was quickly released.
Asked about its activities in Congo, Lynx didn't answer to our questions.
5.3.3 – TRAFIGURA’S SEAT AT THE HEART OF THE REGIME
When Puma Energy, Trafigura’s retail arm, entered Congo in 2002, it was taking its first steps onto the continent.44 Today, it claims a 43 percent market share in the country with 37 petrol stations. More than a decade after putting down roots in the country, Puma still benefits from a “tax exemption”, its 2014 Bond Prospectus says.
Trafigura also knows how to position itself favourably with the ruling family – this time, through hiring a lady called Aurelia Mendes. Mendes described herself to Radio France International as the “Project Manager” in Congo for both Trafigura and Puma.45 Press reports have also said she works for the Swiss trading com-pany, though we could not find her in either of the companies’
organograms. Asked to comment about Aurelia Mendes' role within Trafigura and Puma, Trafigura declined to do so.
Aurelia Mendes also happens to be a close friend of Congo’s first lady, Antoinette Sassou Nguesso. This places Trafigura at the very epicentre of the family in power, as well as smack bang in the middle of the first family’s gross misappropriation of public funds: the President’s wife is cited in France’s Biens mal acquis affair as a beneficiary of the offshore companies discov-ered during investigation.
France is also where Antoinette Sassou Nguesso chose to celebrate her 68th birthday, inviting no less than 150 guests, mostly from the Republic of the Congo, for five days to Saint- Tropez in May 2013. For an estimated cost of one million euros,46
reportedly paid by the Congolese treasury, they ate in the best restaurants in town, slept in five stars hotels and some or all of them were granted pocket money between 10,000 and 30,000 euros to shop in the luxury boutiques of Saint-Tropez.47
For some, this birthday was a double provocation. Many people, especially that half of Congo’s population which lives below the poverty line viewed the ostensible demonstration of (illegitimate) wealth as an insult. Adding to the insult was the irony that the party took place in the very country where the Congolese ruling family was (and still is) under investigation.
Meanwhile, just as the party was underway, Congolese state TV chose to broadcast a report that showed the first lady proud-ly assisting the country’s poorest through her foundation, Con-go Assistance.
Congo Assistance may fund social support and healthcare, including partnerships to fight against drepanocytes, a disease that is widespread in Central Africa. But behind its noble aims, the foundation appears to be part of a propaganda machine to support President Sassou Nguesso. Why else would its website state that Congo is a nation where “free elections are held” when Antoinette’s husband (described by the website as a “genius”) has been ruling the country since 1979?48
Congo Assistance certainly has several controversial indi-viduals on its board. Maxime Gandzion, a former advisor to the President, received millions of dollars in commissions for act-ing as an intermediary between Gunvor and the SNPC in a crude oil contract that led the Swiss Federal Prosecutor’s office to open another money laundering investigation.49 Georgette Okemba is another controversial board member: her husband Jean-Dominique Okemba is head of Congo’s secret service and Chairman of the BGFI Bank Congo, in which the Gabonese Presidential family, the Bongos, have shares.50
Finally, one of Congo Assistance’s board members is… Aure-lia Mendes,51 Trafigura’s key figure in Congo. Just like Antoi-nette, Mendes wasn’t busy with Congo Assistance when the party took place in Saint-Tropez: she was among the happy few to benefit from the autocratic clan’s “generosity”. But was she there as a friend of the first lady or on duty for Trafigura?
5.4 – ZAMBIA: FIDDLING WITH THE TENDERS
“Commodity trading [sic] wins contracts mainly through com-mercial public tenders,” wrote Stéphane Graber, Secretary-
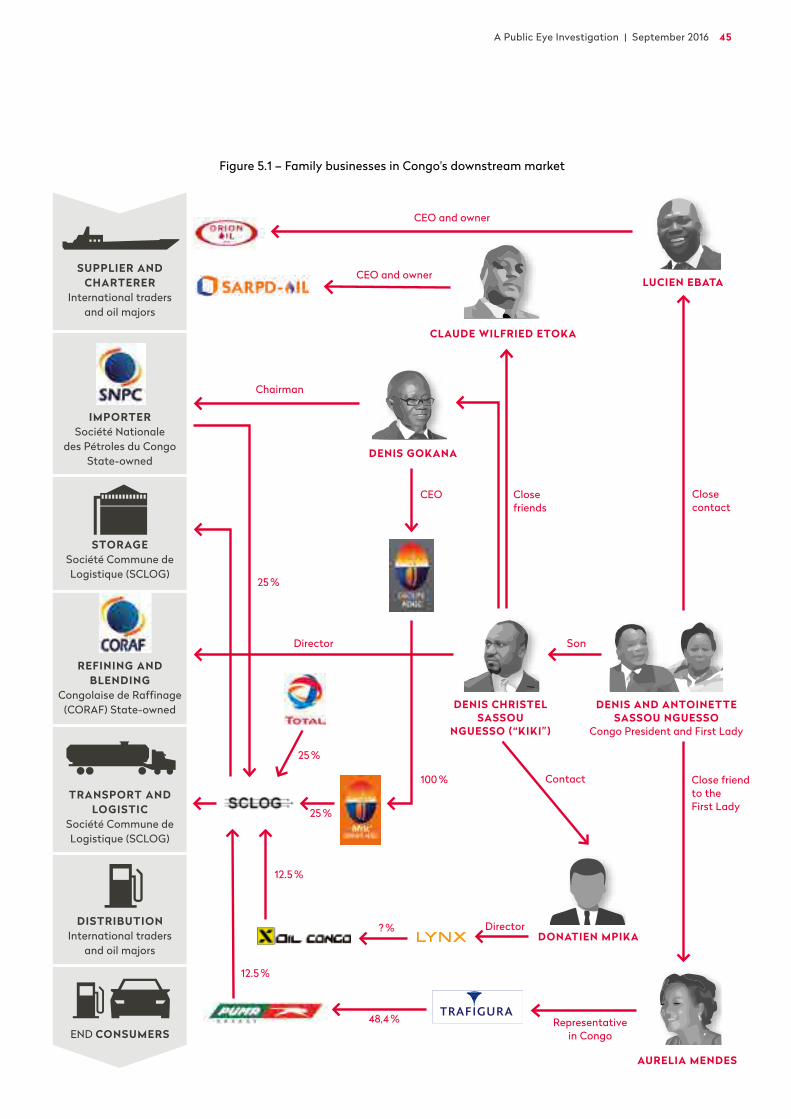
A Public Eye Investigation | September 2016 45
Figure 5.1 – Family businesses in Congo's downstream market
SUPPLIER AND CHARTERER
International traders and oil majors
IMPORTER Société Nationale
des Pétroles du Congo State-owned
STORAGE Société Commune de Logistique (SCLOG)
REFINING AND BLENDING
Congolaise de Raffinage (CORAF) State-owned
TRANSPORT AND LOGISTIC
Société Commune de Logistique (SCLOG)
DISTRIBUTIONInternational traders
and oil majors
END CONSUMERS
CEO and owner
Chairman
25 %
100 %
12.5 %
12.5 %
? % Director
25 %
25 %
48,4 %
CEO and owner
Director
CEO Closefriends
Close contact
Close friend to the First Lady
Son
Representative in Congo
CLAUDE WILFRIED ETOKA
DENIS GOKANA
LUCIEN EBATA
DENIS AND ANTOINETTE SASSOU NGUESSO
Congo President and First Lady
AURELIA MENDES
DENIS CHRISTEL SASSOU
NGUESSO (“KIKI”)
DONATIEN MPIKA
Contact
46 DIRTY DIESEL – How Swiss Traders Flood Africa with Toxic Fuels | Chapter 5
General of the Swiss Trading and Shipping Association (STSA).52
But we are not convinced by this statement. The examples of Angola and Sierra Leone show Mr Graber’s claim to be mislead-ing at best. And even when such tenders do exist, there is no guarantee of their integrity.
Allegations of irregularities in the procurement tenders have surfaced, for example, in Zambia, where Puma and Oryx operate a network of petrol stations. In June 2012, members of the opposition party, the Movement for Multi-party Democracy (MMD), wrote an open letter to “the donor community of the Republic of Zambia” in which they highlighted situations where the mismanagement of public funds could have occurred. Among the questions they raised were: “In the recent oil pro-curement contract awarded to Trafigura (…), why were the more competitively priced bids overlooked? Who acted as agent for these suppliers, and does this person have a relationship to any political figures?”53
A non-oil producing country, Zambia imports its oil, some of which it refines itself at its ageing refinery, Indeni. However, with a maximum output of 24,000 barrels per day and usually operating at 50 percent of that capacity, this refinery does not meet all of Zambian demand. So the government also uses in-ternational tenders, awarding two-year contracts for the supply of diesel and gasoline. Glencore won the bid for 2010–2012, then Trafigura secured the deal in August 2012. Under the terms of this deal, Trafigura would deliver 216 million litres of diesel and 21 million litres of gasoline, worth US$500 million, until 2014.54
5.4.1 – HOT TIMES FOR WYNTER
Allegations of corruption in the Trafigura contract emerged quickly. As if power was synonymous with money, Zambia’s then Justice Minister, Wynter Kabimba, set up Midland Energy, of which he was a board member and shareholder, in January 2012, just four months after the head of his party, Michael Sata, was elected president of Zambia, The Guardian reported. Then, in December 2012, media reported that Zambia’s Anti-Corrup-tion Commission had called Kabimba “to respond to allegations that Trafigura paid his company, Midland Energy Zambia,” in order to win the tender.55 At the time, Wynter Kabimba also served as Chairman of the Commission of Inquiry of the Ener-gy Regulation Board (ERB) and as Secretary-General of the Patriotic Front, the governing party.
Wynter Kabimba was cleared of the charges in 2013 after a preliminary investigation, while still heading the ruling party. But President Michael Sata dismissed him nevertheless in Au-gust 2014.56 This case echoes Jamaica in 2006 when Trafigura was accused of funding the People’s National Party (PNP) in or-der to win contracts for the supply of crude oil through the PNP’s Secretary-General and national Information Minister, Colin Campbell.57 Campbell admitted the accusations and was forced to resign. In both the Zambian and Jamaican cases, how-ever, Trafigura denied all wrong-doing.
Zambian press reports allege that Trafigura’s “agent” in the country was businessman Rajan Mahtani, a close friend of Wynter Kabimba and known funder of the Patriotic Front (PF).58
He was also Chairman of Finance Bank until his arrest in June 2015 for forgery and the illegal acquisition of a cement compa-ny’s shares. By then, he had already been implicated in a sepa-rate case related to PF funds.59 A spokesperson for Trafigura said Rajan Mahtani is “neither an agent nor an employee or a consultant” of the company, but would not say – despite being asked specifically – whether that had also been the case at the time of the deal.60 The spokesperson did say, however, that Tra-figura “welcomed the investigation by Zambia’s Anti-Corrup-tion Commission (ACC) in 2012 where they found no evidence of corruption”.
5.4.2 – ANOTHER QUESTIONABLE CONTRACT IN ZAMBIA
In November 2014, Trafigura won another controversial US$28 million contract to supply petroleum products into Zambia.61 It attracted suspicion, because it was “hastily executed (…) on 12th November 2014, apparently “at a very high price” before the normal consultative procedures had been completed.” President Michael Sata had previously rejected the contract before he passed away.62
National media claimed the price was high because, al-though oil prices had crashed in the second half of 2014, Tra-figura requested and “apparently obtained” a price based on more favourable months.63 According to the same report, the Anti-Corruption Commission is investigating the deal and the police have questioned a South-African based employee of Tra-figura. Responding through its local law firm, Trafigura con-firmed the contract and said that it had been approved by the relevant authorities. It failed to mention the pricing issue.64
The contract had indeed been approved by the relevant au-thorities. But how? Two senior government officials of the Min-istry of Mines, Energy and Water development are due in court for having “illegally awarded” the contract to Trafigura.65 A company spokesperson said he could not “comment on legal proceedings to which Trafigura is not a party”.66
5.5 – ZIMBABWE: TRADERS ADAPT TO THE LOCAL CONTENT LAWS
In Zimbabwe, the fuel industry is dominated by three players, Sakunda Holdings,67 Redan Petroleum and Zuva Petroleum. Local content laws require petroleum companies to be at least 50 percent owned by nationals. But Swiss trading companies Glencore and Trafigura partly own all three, thanks to loans they granted to local purchasers of retail networks.
Glencore, for example, is using “fronts” to conceal its inter-ests in the distribution sector, a 2013 report by the National In-digenisation and Economic Empowerment Board (NIEEB) con-cluded. The report said that Glencore used a company called Alveir Management, which it owned 100 percent and registered in the British Virgin Islands, to provide a US$22.2 million loan to Woble Investments Ltd, a local company which bought Zuva Petroleum. Zuva, in turn, claims to be the country’s “biggest oil company” after acquiring BP and Shell assets in 2010.68
A Public Eye Investigation | September 2016 47
In June 2012, the loan was converted into equity in Woble, putting the Swiss commodity trader in indirect control of 72 petrol stations across Zimbabwe. The NIEEB stated that such a move reduced the “effective indigenous interest” in Zuva to less than 26 percent, well under the threshold required by law. De-spite NIEEB objections, Zimbabwe’s government approved the transaction.69 One explanation is that the owner of Woble, John Mushayavanhu, is not only a successful banker but also an “in-fluential” member of the ruling party ZANU-PF.70
Asked to comment, Glencore denied owning a stake in Woble Investments and said it owns “a minority equity interest in Zuva Petroleum, in line with the requirements of the Indigenisation and Economic Empowerment Act”. With respect to politically exposed persons, the company said it “conducts appropriate due diligence as required to ensure that it acts in line with the Glen-core Corporate Practice (GCP) and its Code of Conduct”.
Trafigura begin its acquisitions in Zimbabwe with a loan. At the end of 2013, it guaranteed a US$120 million loan by French bank Société Générale to Sakunda Holdings.71 In December of the same year, the company bought a 60 percent stake in Redan Petroleum, also in excess of local content requirements.72 A few months later, Trafigura concluded a US$262 million deal to buy 49 percent of Sakunda Holdings too.73
With both Redan and Sakunda in its pocket, Trafigura con-trols more than 125 retail outlets74 and imports about 50 per-cent of the country’s petroleum product needs. Through exclu-sive agreements, it controls the Feruka-Msasa pipeline, con- necting Trafigura’s important storage facilities in Beira, Mozam-bique, to the Zimbabwean capital, Harare. That same deal also allowed Trafigura to become an important supplier for Malawi and Zambia, and won the company a leading position despite fierce competition in the scramble for Southern Africa.
5.5.1 – POLITICALLY CONNECTED PARTNERS
Just like Zuva Petroleum, Sakunda Holdings is a very politically connected company. The chairman of the board, Willard Manun-go, is also head of the state-owned Infrastructure Development Bank of Zimbabwe and was for several years a financial advisor to President Robert Mugabe.75 The list also includes a sharehold-er who is formally head of Zimbabwe’s central bank, and current ministers too, says Africa Confidential which talks of Trafigura’s “excellent links with government officials and ZANU-PF”. Asked to comment on how the company handled the risk of working with political figures, Trafigura declined to do so.
Such links may also explain why, in January 2016, the gov-ernment awarded a tender to Sakunda for the supply of 200 megawatts of electricity in order to mitigate power shortages. The company would cumulatively inject US$2 billion to build an Emergency Diesel Power Station. Besides its shares in Sakunda, Trafigura is explicitly described as a partner to the project, though its role is not specified.76 It could be by providing fund-ing and/or supplying the heavy fuel oil to run the station.
Zimbabwe shows how the provision of much-needed credit in African economies, especially risky ones, is an effective way for commodity traders such as Glencore and Trafigura to enter these markets.
The last two chapters have shown how Swiss trading com-panies have bought assets such as storage facilities and petrol stations to become big in Africa’s downstream market. When the oil majors pulled out, trading companies saw an opportuni-ty to enter new markets in dozens of countries. For that, they sometimes built risky alliances with politically well-connected door openers and business partners. That is how the fuel busi-ness is conducted. And it suits Swiss traders quite well. They pay to increase their optionality possibilities, buying storage assets on the trading side and an outlet on the retail side to sell their dirty products. The next chapter will examine in more de-tail what exactly they are selling at pumps throughout the con-tinent.
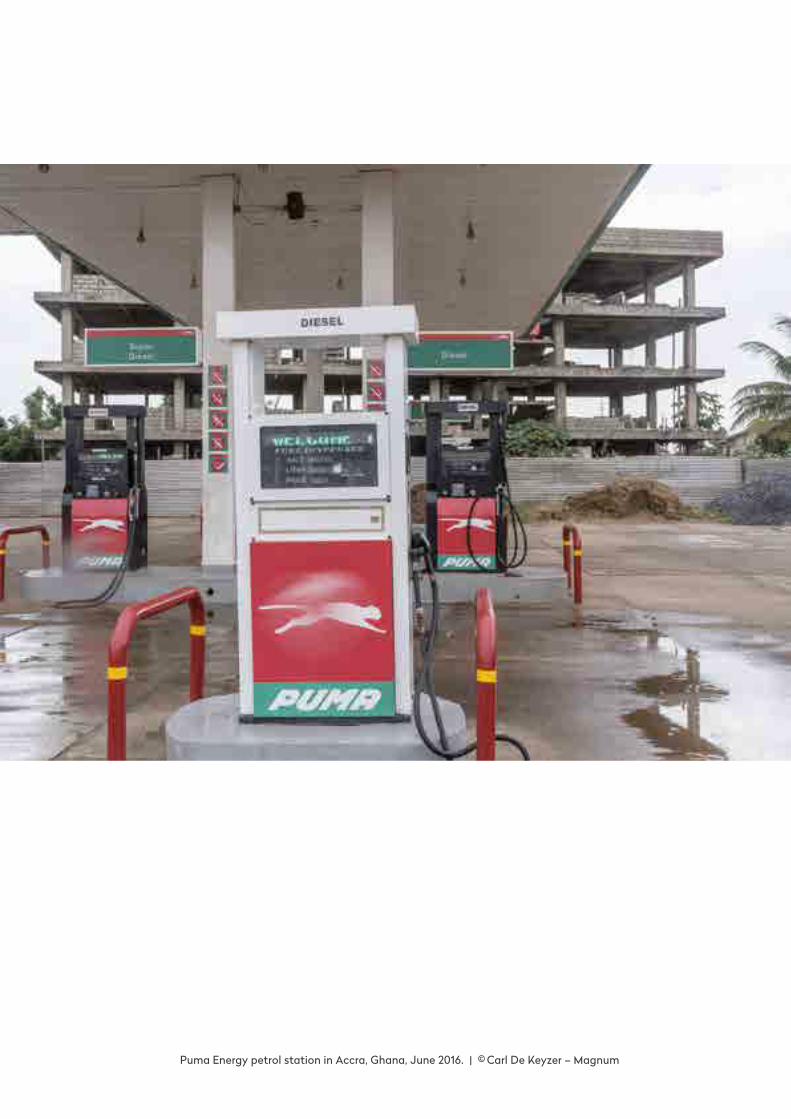
Puma Energy petrol station in Accra, Ghana, June 2016. | © Carl De Keyzer – Magnum
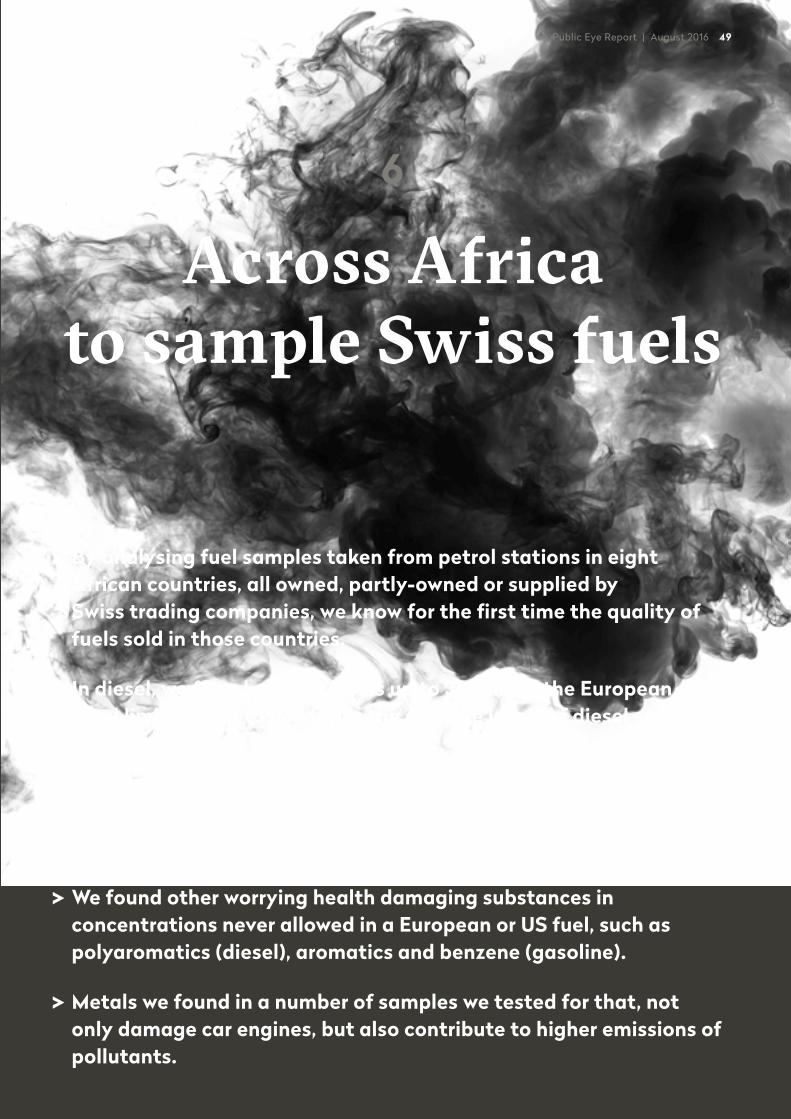
A Public Eye Investigation | September 2016 49
6
Across Africa to sample Swiss fuels
Public Eye Report | August 2016 49
By analysing fuel samples taken from petrol stations in eight African countries, all owned, partly-owned or supplied by Swiss trading companies, we know for the first time the quality of fuels sold in those countries.
In diesel, we found sulphur levels up to 380 times the European legal limit and up to 630 times the average levels of diesel sold in Western Europe.
In gasoline, we found sulphur levels up to 70 times the European legal limit and over 100 times the average levels of gasoline sold in Europe.
We found other worrying health damaging substances in concen trations never allowed in a European or US fuel, such as polyaromatics (diesel), aromatics and benzene (gasoline).
Metals we found in a number of samples we tested for that, not only damage car engines, but also contribute to higher emissions of pollutants.
50 DIRTY DIESEL – How Swiss Traders Flood Africa with Toxic Fuels | Chapter 6
The European winter seemed far away on 9th December 2013, as we enjoyed dinner on a mild evening in Luanda, Angola’s capital, with a local contact and a magnificent sunset view over the Ilha do Cabo, the city’s peninsula that juts into the Atlantic Ocean. It’s an exceptional experience and not just for the view. The average US$40 per person puts this restaurant way out of reach for most Angolans. Prices in this city are often higher than in Tokyo, New York, or Geneva. And Angola has become one of the most unequal countries in the world.1
We had views in two directions. We could look out towards the distant Atlantic horizon. Or we could turn towards the city, where our eyes immediately fell upon several fancy buildings, dominating the skyline. Flanked by yellow flags stamped with a capital “S” in red and black, these buildings belonged to Sonan-gol, Angola’s almighty national oil company.
Back at ground level, just next to the restaurant, a brand new Puma petrol station stood proud. Surrounded by palm trees, the pavements of the red and green branded wildcat company spar-kled – almost as much as the shop windows next door, but not quite. This place was also out of reach for most Angolans, since the prohibitive prices mean they would not have dreamed of owning a car. And yet the government continues to heavily subsidise fuel. Gasoline and diesel are perhaps the only cheap products2 in this country, even though, like most consumer goods, they are large-ly imported. Like many other oil-producing countries with in-adequate refining capacity, Angola’s government thinks fuel should cost less here than on world markets.3
When we arrived, we already knew how billions of dollars of Angolan public funds are wasted to subsidise products that most people cannot afford. We also knew that endemic corrup-tion still haunts the country’s oil sector. But we had come to Angola to find out whether, on top of all this, these fuels are also risking people’s health.
To do so, we just rented a car, hired a driver and travelled across the country collecting samples from petrol stations along the way. We chose Angola as one of our first countries, since it
was easier to check there, whether fuel at the pump was sup-plied and sold by a Swiss trading company. Although the issue is shrouded in total secrecy, industry experts believe that Trafig-ura is Angola’s sole supplier of petroleum products. In other words, it has a monopoly over imports (see chapter 5). As if to prove the point, the trader also runs a large network of petrol stations across Angola through its downstream arm, Puma En-
ergy (which operates under the Pumangol brand). Most of the petrol stations we visited were new, and Puma Energy’s website confirms the speedy expansion of its network: growing from 15 petrol stations in 2011, to 52 in 2013 when we were on the ground, and then to 77 in 2016.4
We took samples from petrol stations along a 2,000 km jour-ney, from the southern port of Lobito to Huambo, hidden deep in the hinterland, and Soyo, a tropical town lying at the mouth of the gigantic Congo River. We then delivered the samples to a logistics company in Luanda for export to the Netherlands, where an independent accredited laboratory did the petrochemi-cal analysis on six samples.
Very little information is publicly available on fuel quality in Angola and elsewhere in the region. But we can get an idea just by checking the national fuel quality regulations and require-ments as set out in various fuel tenders, information that is al-ready difficult to access. By comparing these “African standards” with the European ones, we can see very clearly that a clear dou-ble standard exists between these two parts of the world. We still did not know for sure, however, until we did the analysis, what actually was contained in the fuels sold at West African pumps.
We know of at least one inspection company, which frequent-ly samples fuels around the world, including in West and Central Africa. But their results and analysis never see the light of day. Instead they are bought by car manufacturing and oil companies under confidentiality agreements only for internal use.
So while a handful of people have the answers to these ques-tions – including the suppliers, usually the same people as the fuel producers, the buyers, the surveyors and the regulatory authorities – the region’s publics do not know the quality of their fuels. Fuel sampling is the only way to find out what they really contain and to answer the basic question: are these fuels dangerous for people’s health?
Besides Angola, we collected gasoline and diesel samples from petrol stations owned, controlled or linked to Swiss trad-ing companies in seven other sub-Saharan Africa countries. We carefully followed the methodology described below to make sure our results could not be disputed.
To this day, our sampling research and analysis is the most extensive publicly available data on the fuels sold in West and Central Africa, even if the number investigated is inevitably small compared to the volumes sold. And given that all our sam-ples were taken on a single trip, the results might have been dif-ferent a month before or after. So these results represent a snap-shot rather than a comprehensive picture.
But the results do show us that high sulphur and aromatic fuels are being sold in countries with weak, or non-existent, regulation on sulphur and aromatics. And these findings are supported by the other evidence that we have, notably from our investigation in Ghana (see chapter 7) and statistical analysis of the fuels being transported from Europe to West Africa (see chapter 8).
We are therefore confident that, despite the limitations of our analyses, the results represent an accurate picture of prod-ucts sold in the countries which we visited. The gasoline and diesel that we tested in these sub-Saharan African countries could never be sold at the pump in Switzerland, in any EU coun-
Many of our samples show much higher sulphur contents
than what refineries in West Africa often produce.
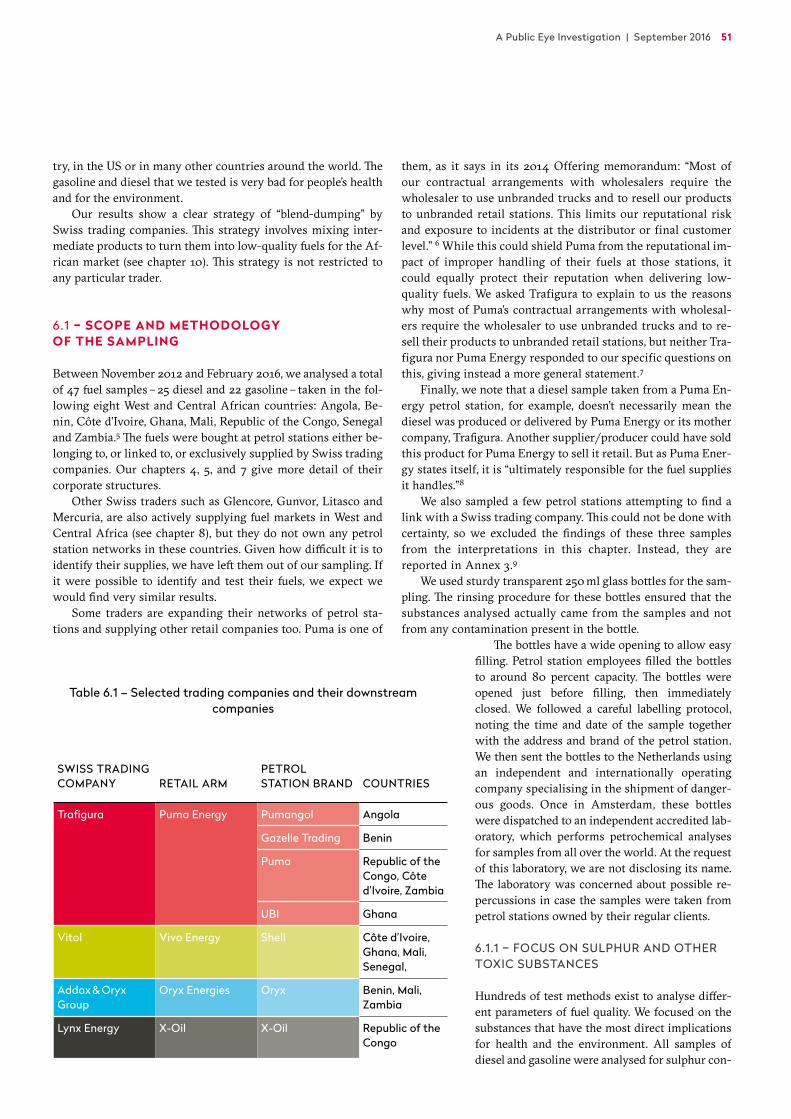
A Public Eye Investigation | September 2016 51
try, in the US or in many other countries around the world. The gasoline and diesel that we tested is very bad for people’s health and for the environment.
Our results show a clear strategy of “blend-dumping” by Swiss trading companies. This strategy involves mixing inter-mediate products to turn them into low-quality fuels for the Af-rican market (see chapter 10). This strategy is not restricted to any particular trader.
6.1 – SCOPE AND METHODOLOGY OF THE SAMPLING
Between November 2012 and February 2016, we analysed a total of 47 fuel samples – 25 diesel and 22 gasoline – taken in the fol-lowing eight West and Central African countries: Angola, Be-nin, Côte d’Ivoire, Ghana, Mali, Republic of the Congo, Senegal and Zambia.5 The fuels were bought at petrol stations either be-longing to, or linked to, or exclusively supplied by Swiss trading companies. Our chapters 4, 5, and 7 give more detail of their corporate structures.
Other Swiss traders such as Glencore, Gunvor, Litasco and Mercuria, are also actively supplying fuel markets in West and Central Africa (see chapter 8), but they do not own any petrol station networks in these countries. Given how difficult it is to identify their supplies, we have left them out of our sampling. If it were possible to identify and test their fuels, we expect we would find very similar results.
Some traders are expanding their networks of petrol sta-tions and supplying other retail companies too. Puma is one of
them, as it says in its 2014 Offering memorandum: “Most of our contractual arrangements with wholesalers require the wholesaler to use unbranded trucks and to resell our products to unbranded retail stations. This limits our reputational risk and exposure to incidents at the distributor or final customer level.” 6 While this could shield Puma from the reputational im-pact of improper handling of their fuels at those stations, it could equally protect their reputation when delivering low- quality fuels. We asked Trafigura to explain to us the reasons why most of Puma's contractual arrangements with wholesal-ers require the wholesaler to use unbranded trucks and to re-sell their products to unbranded retail stations, but neither Tra-figura nor Puma Energy responded to our specific questions on this, giving instead a more general statement.7
Finally, we note that a diesel sample taken from a Puma En-ergy petrol station, for example, doesn’t necessarily mean the diesel was produced or delivered by Puma Energy or its mother company, Trafigura. Another supplier/producer could have sold this product for Puma Energy to sell it retail. But as Puma Ener-gy states itself, it is “ultimately responsible for the fuel supplies it handles."8
We also sampled a few petrol stations attempting to find a link with a Swiss trading company. This could not be done with certainty, so we excluded the findings of these three samples from the interpretations in this chapter. Instead, they are reported in Annex 3.9
We used sturdy transparent 250 ml glass bottles for the sam-pling. The rinsing procedure for these bottles ensured that the substances analysed actually came from the samples and not from any contamination present in the bottle.
The bottles have a wide opening to allow easy filling. Petrol station employees filled the bottles to around 80 percent capacity. The bottles were opened just before filling, then immediately closed. We followed a careful labelling protocol, noting the time and date of the sample together with the address and brand of the petrol station. We then sent the bottles to the Netherlands using an independent and internationally operating company specialising in the shipment of danger-ous goods. Once in Amsterdam, these bottles were dispatched to an independent accredited lab-oratory, which performs petrochemical analyses for samples from all over the world. At the request of this laboratory, we are not disclosing its name. The laboratory was concerned about possible re-percussions in case the samples were taken from petrol stations owned by their regular clients.
6.1.1 – FOCUS ON SULPHUR AND OTHER TOXIC SUBSTANCES
Hundreds of test methods exist to analyse differ-ent parameters of fuel quality. We focused on the substances that have the most direct implications for health and the environment. All samples of diesel and gasoline were analysed for sulphur con-
SWISS TRADING COMPANY RETAIL ARM
PETROL STATION BRAND COUNTRIES
Trafigura Puma Energy Pumangol Angola
Gazelle Trading Benin
Puma Republic of the Congo, Côte d’Ivoire, Zambia
UBI Ghana
Vitol Vivo Energy Shell Côte d’Ivoire, Ghana, Mali, Senegal,
Addax & Oryx Group
Oryx Energies Oryx Benin, Mali, Zambia
Lynx Energy X-Oil X-Oil Republic of the Congo
Table 6.1 – Selected trading companies and their downstream companies
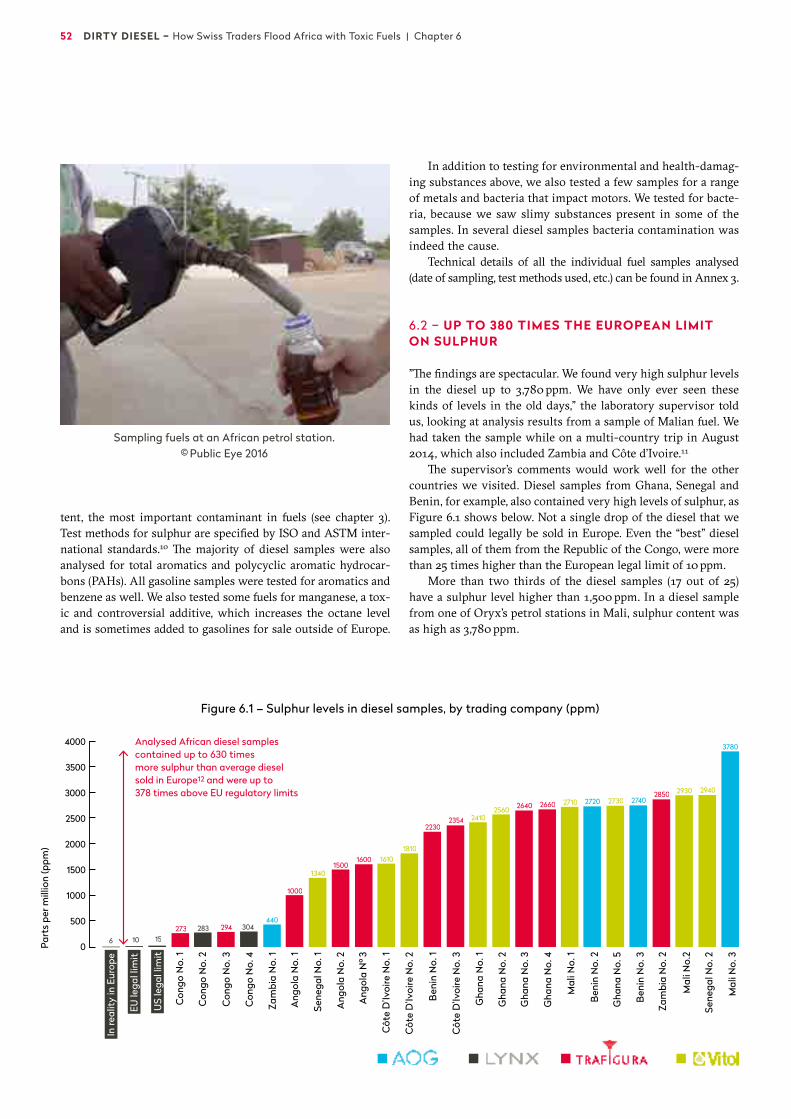
52 DIRTY DIESEL – How Swiss Traders Flood Africa with Toxic Fuels | Chapter 6
In re
ality
in E
urop
e
Part
s pe
r mill
ion
(ppm
)
EU le
gal l
imit
US
lega
l lim
it
Con
go N
o. 1
Con
go N
o. 2
Con
go N
o. 3
Con
go N
o. 4
Zam
bia
No.
1
Ang
ola
No.
1
Sene
gal N
o. 1
Ang
ola
No.
2
Ang
ola
Nº 3
Côt
e D
’Ivoi
re N
o. 1
Côt
e D
’Ivoi
re N
o. 2
Ben
in N
o. 1
Côt
e D
’Ivoi
re N
o. 3
Gha
na N
o. 1
Gha
na N
o. 2
Gha
na N
o. 3
Gha
na N
o. 4
Mal
i No.
1
Ben
in N
o. 2
Gha
na N
o. 5
Ben
in N
o. 3
Zam
bia
No.
2
4000
3500
3000
2500
2000
1500
1000
500
0
Analysed African diesel samples contained up to 630 times more sulphur than average diesel sold in Europe12 and were up to 378 times above EU regulatory limits
6 10 15273 283 294 304
440
1000
13401500
1600 16101810
22302354 2410
2560 2640 2660 2710 2720 2730 2740
Mal
i No.
2
Sene
gal N
o. 2
Mal
i No.
3
2930 2940
3780
2850
tent, the most important contaminant in fuels (see chapter 3). Test methods for sulphur are specified by ISO and ASTM inter-national standards.10 The majority of diesel samples were also analysed for total aromatics and polycyclic aromatic hydrocar-bons (PAHs). All gasoline samples were tested for aromatics and benzene as well. We also tested some fuels for manganese, a tox-ic and controversial additive, which increases the octane level and is sometimes added to gasolines for sale outside of Europe.
In addition to testing for environmental and health-damag-ing substances above, we also tested a few samples for a range of metals and bacteria that impact motors. We tested for bacte-ria, because we saw slimy substances present in some of the samples. In several diesel samples bacteria contamination was indeed the cause.
Technical details of all the individual fuel samples analysed (date of sampling, test methods used, etc.) can be found in Annex 3.
6.2 – UP TO 380 TIMES THE EUROPEAN LIMIT ON SULPHUR
”The findings are spectacular. We found very high sulphur levels in the diesel up to 3,780 ppm. We have only ever seen these kinds of levels in the old days,” the laboratory supervisor told us, looking at analysis results from a sample of Malian fuel. We had taken the sample while on a multi-country trip in August 2014, which also included Zambia and Côte d’Ivoire.11
The supervisor’s comments would work well for the other countries we visited. Diesel samples from Ghana, Senegal and Benin, for example, also contained very high levels of sulphur, as Figure 6.1 shows below. Not a single drop of the diesel that we sampled could legally be sold in Europe. Even the “best” diesel samples, all of them from the Republic of the Congo, were more than 25 times higher than the European legal limit of 10 ppm.
More than two thirds of the diesel samples (17 out of 25) have a sulphur level higher than 1,500 ppm. In a diesel sample from one of Oryx’s petrol stations in Mali, sulphur content was as high as 3,780 ppm.
Figure 6.1 – Sulphur levels in diesel samples, by trading company (ppm)
Sampling fuels at an African petrol station.© Public Eye 2016
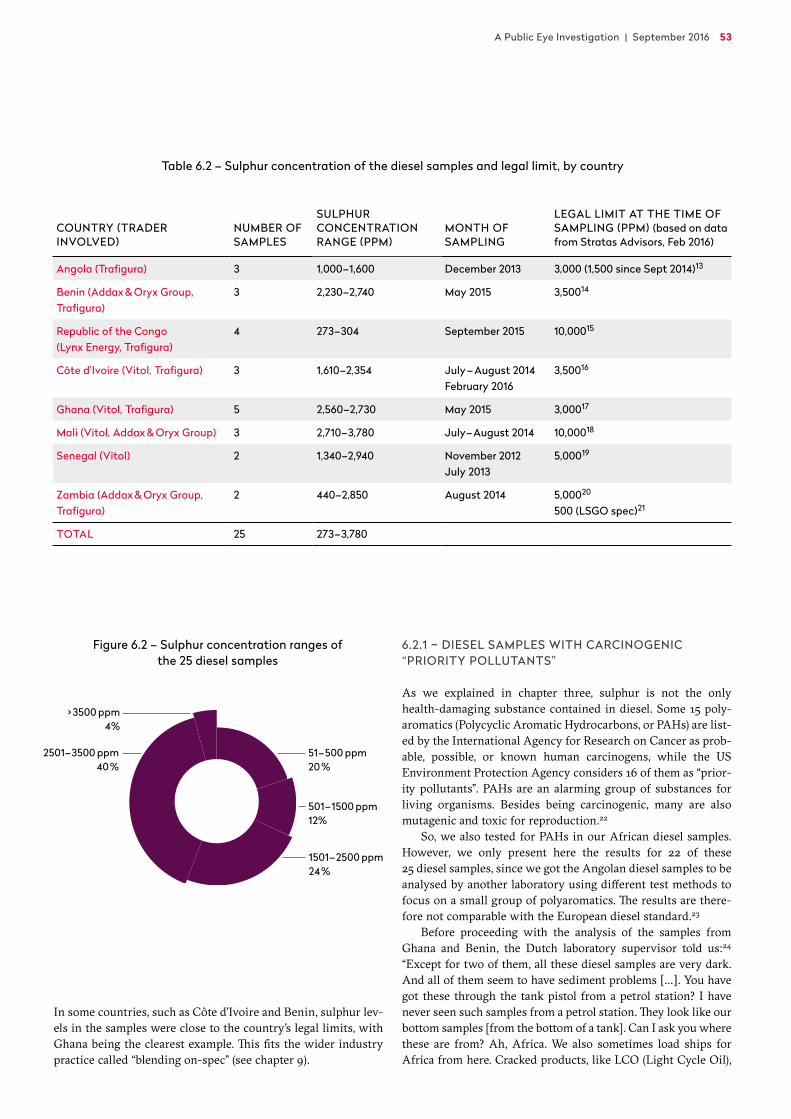
A Public Eye Investigation | September 2016 53
Table 6.2 – Sulphur concentration of the diesel samples and legal limit, by country
In some countries, such as Côte d’Ivoire and Benin, sulphur lev-els in the samples were close to the country’s legal limits, with Ghana being the clearest example. This fits the wider industry practice called “blending on-spec” (see chapter 9).
6.2.1 – DIESEL SAMPLES WITH CARCINOGENIC “PRIORITY POLLUTANTS”
As we explained in chapter three, sulphur is not the only health-damaging substance contained in diesel. Some 15 poly-aromatics (Polycyclic Aromatic Hydrocarbons, or PAHs) are list-ed by the International Agency for Research on Cancer as prob-able, possible, or known human carcinogens, while the US Environment Protection Agency considers 16 of them as “prior-ity pollutants”. PAHs are an alarming group of substances for living organisms. Besides being carcinogenic, many are also mutagenic and toxic for reproduction.22
So, we also tested for PAHs in our African diesel samples. However, we only present here the results for 22 of these 25 diesel samples, since we got the Angolan diesel samples to be analysed by another laboratory using different test methods to focus on a small group of polyaromatics. The results are there-fore not comparable with the European diesel standard.23
Before proceeding with the analysis of the samples from Ghana and Benin, the Dutch laboratory supervisor told us:24 “Except for two of them, all these diesel samples are very dark. And all of them seem to have sediment problems […]. You have got these through the tank pistol from a petrol station? I have never seen such samples from a petrol station. They look like our bottom samples [from the bottom of a tank]. Can I ask you where these are from? Ah, Africa. We also sometimes load ships for Africa from here. Cracked products, like LCO (Light Cycle Oil),
COUNTRY (TRADER INVOLVED)
NUMBER OF SAMPLES
SULPHUR CONCENTRATION RANGE (PPM)
MONTH OF SAMPLING
LEGAL LIMIT AT THE TIME OF SAMPLING (PPM) (based on data from Stratas Advisors, Feb 2016)
Angola (Trafigura) 3 1,000–1,600 December 2013 3,000 (1,500 since Sept 2014)13
Benin (Addax & Oryx Group,Trafigura)
3 2,230–2,740 May 2015 3,50014
Republic of the Congo (Lynx Energy, Trafigura)
4 273–304 September 2015 10,00015
Côte d’Ivoire (Vitol, Trafigura) 3 1,610–2,354 July – August 2014February 2016
3,50016
Ghana (Vitol, Trafigura) 5 2,560–2,730 May 2015 3,00017
Mali (Vitol, Addax & Oryx Group) 3 2,710–3,780 July–August 2014 10,00018
Senegal (Vitol) 2 1,340–2,940 November 2012 July 2013
5,00019
Zambia (Addax & Oryx Group, Trafigura)
2 440–2,850 August 2014 5,00020
500 (LSGO spec)21
TOTAL 25 273–3,780
Euro
pe
US
& C
anad
a
Russ
ia &
Cas
pian
Asi
a-Pa
cific
Lati
n A
mer
ica
Mid
dle
East
Afr
ica
max
. ppm
sul
phur
in d
iese
l
2000
1800
1600
1400
1200
1000
800
600
400
200
0
Inde
pend
ent
Trad
ers
Oth
er C
ompa
nies
Regi
onal
Oil
Com
pani
es
Tota
l
Ang
lo-S
axon
Maj
ors
10 %
5 %
0 %
–5 %
–10 %
–15 %
–20 %
–25 %
51–500 ppm20 %
501–1500 ppm12%
1501–2500 ppm24 %
2501–3500 ppm40 %
> 3500 ppm4%
Africa 61 %
Gibraltar 12 %
Europe 20 %
America 6 %Asia 1%
11–50 ppm27%
51–150 ppm27%
151–250 ppm14 %
251–350 ppm27%
> 350 ppm5%
EU average (≤ 29 %v) 27 %
EU limit (>29 and ≤ 35%v)32 %
over EU limit (> 35 %v)41 %
0–5
00 p
pm
1 1 1 1 1
4 43
9
13
2 2
1
2 2
5
8
4
501–
1,000
ppm
1,001
–1,5
00 p
pm
1,501
–2,0
00 p
pm
2,00
1–2,
500
ppm
2,50
1–3,
000
ppm
3,00
1–3,
500
ppm
3,50
1–4,
000
ppm
4,00
1–4,
500
ppm
4,50
1–5,
000
ppm
5,00
1–5,
500
ppm
Num
ber o
f car
goes
repo
rted
Nat
iona
l spe
cific
atio
n 5,
000
ppm
0–5
00 p
pm
Num
ber o
f car
goes
repo
rted
Nat
iona
l spe
cific
atio
n 3,
000
ppm
501–
1,000
ppm
1,001
–1,5
00 p
pm
1,501
–2,0
00 p
pm
2,00
1–2,
500
ppm
2,50
1–3,
000
ppm
3,00
1–3,
500
ppm
Figure 6.2 – Sulphur concentration ranges of the 25 diesel samples

Diesel samples from Ghana contained sulphur levels up to 273 times the European limit. A Shell (Vivo Energy) petrol station in Accra, Ghana. June 2016 | © Carl De Keyzer – Magnum
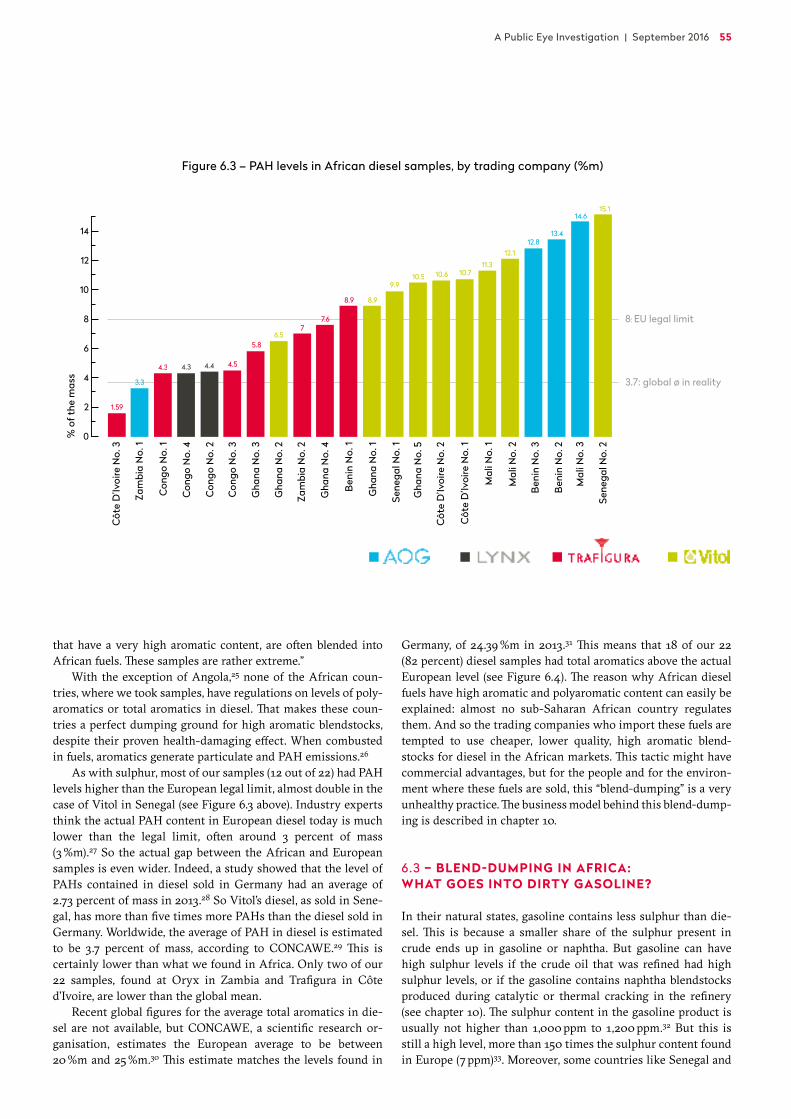
A Public Eye Investigation | September 2016 55
that have a very high aromatic content, are often blended into African fuels. These samples are rather extreme.”
With the exception of Angola,25 none of the African coun-tries, where we took samples, have regulations on levels of poly-aromatics or total aromatics in diesel. That makes these coun-tries a perfect dumping ground for high aromatic blendstocks, despite their proven health-damaging effect. When combusted in fuels, aromatics generate particulate and PAH emissions.26
As with sulphur, most of our samples (12 out of 22) had PAH levels higher than the European legal limit, almost double in the case of Vitol in Senegal (see Figure 6.3 above). Industry experts think the actual PAH content in European diesel today is much lower than the legal limit, often around 3 percent of mass (3 %m).27 So the actual gap between the African and European samples is even wider. Indeed, a study showed that the level of PAHs contained in diesel sold in Germany had an average of 2.73 percent of mass in 2013.28 So Vitol’s diesel, as sold in Sene-gal, has more than five times more PAHs than the diesel sold in Germany. Worldwide, the average of PAH in diesel is estimated to be 3.7 percent of mass, according to CONCAWE.29 This is certainly lower than what we found in Africa. Only two of our 22 samples, found at Oryx in Zambia and Trafigura in Côte d’Ivoire, are lower than the global mean.
Recent global figures for the average total aromatics in die-sel are not available, but CONCAWE, a scientific research or-ganisation, estimates the European average to be between 20 %m and 25 %m.30 This estimate matches the levels found in
Germany, of 24.39 %m in 2013.31 This means that 18 of our 22 (82 percent) diesel samples had total aromatics above the actual European level (see Figure 6.4). The reason why African diesel fuels have high aromatic and polyaromatic content can easily be explained: almost no sub-Saharan African country regulates them. And so the trading companies who import these fuels are tempted to use cheaper, lower quality, high aromatic blend-stocks for diesel in the African markets. This tactic might have commercial advantages, but for the people and for the environ-ment where these fuels are sold, this “blend-dumping” is a very unhealthy practice. The business model behind this blend-dump-ing is described in chapter 10.
6.3 – BLEND-DUMPING IN AFRICA: WHAT GOES INTO DIRTY GASOLINE?
In their natural states, gasoline contains less sulphur than die-sel. This is because a smaller share of the sulphur present in crude ends up in gasoline or naphtha. But gasoline can have high sulphur levels if the crude oil that was refined had high sulphur levels, or if the gasoline contains naphtha blendstocks produced during catalytic or thermal cracking in the refinery (see chapter 10). The sulphur content in the gasoline product is usually not higher than 1,000 ppm to 1,200 ppm.32 But this is still a high level, more than 150 times the sulphur content found in Europe (7 ppm)33. Moreover, some countries like Senegal and
Côt
e D
’Ivoi
re N
o. 3
Zam
bia
No.
1
Con
go N
o. 1
Con
go N
o. 4
Con
go N
o. 2
Con
go N
o. 3
Gha
na N
o. 3
Gha
na N
o. 2
Zam
bia
No.
2
Gha
na N
o. 4
Gha
na N
o. 5
Côt
e D
’Ivoi
re N
o. 2
Côt
e D
’Ivoi
re N
o. 1
Ben
in N
o. 1
Gha
na N
o. 1
Sene
gal N
o. 1
Sene
gal N
o. 2
Mal
i No.
1
Mal
i No.
2
Mal
i No.
3
Ben
in N
o. 3
Ben
in N
o. 2
14
12
10
8
6
4
2
0
1.59
3.3
4.3 4.3 4.4 4.5
5.86.5
77.6
8.9 8.9
9.910.5 10.6 10.7
11.312.1
12.813.4
15.114.6
Con
go N
o. 1
Con
go N
o. 2
Con
go N
o. 4
Con
go N
o. 3
Zam
bia
No.
2
Zam
bia
No.
1
Gha
na N
o. 3
Gha
na N
o. 2
Côt
e D
’Ivoi
re N
o. 1
Côt
e D
’Ivoi
re N
o. 2
Gha
na N
o. 4
Sene
gal N
o. 1
Ben
in N
o. 1
Côt
e D
’Ivoi
re N
o. 3
Ben
in N
o. 3
Mal
i No.
1
Mal
i No.
2
Gha
na N
o. 1
Ben
in N
o. 2
Gha
na N
o. 5
Mal
i No.
3
Sene
gal N
o. 2
40
35
30
25
20
15
10
5
0
13.813.8 13.8 14
2828.9 29.3 30 30.3 30.5 30.8 31.2 31.6 31.8
33.7 34 34.1 34.2 34.435.5 36
43.7
% o
f the
mas
s%
of t
he m
ass
8: EU legal limit
3.7: global ø in reality
24.4: ø in reality in Germany (2013)
Figure 6.3 – PAH levels in African diesel samples, by trading company (%m)
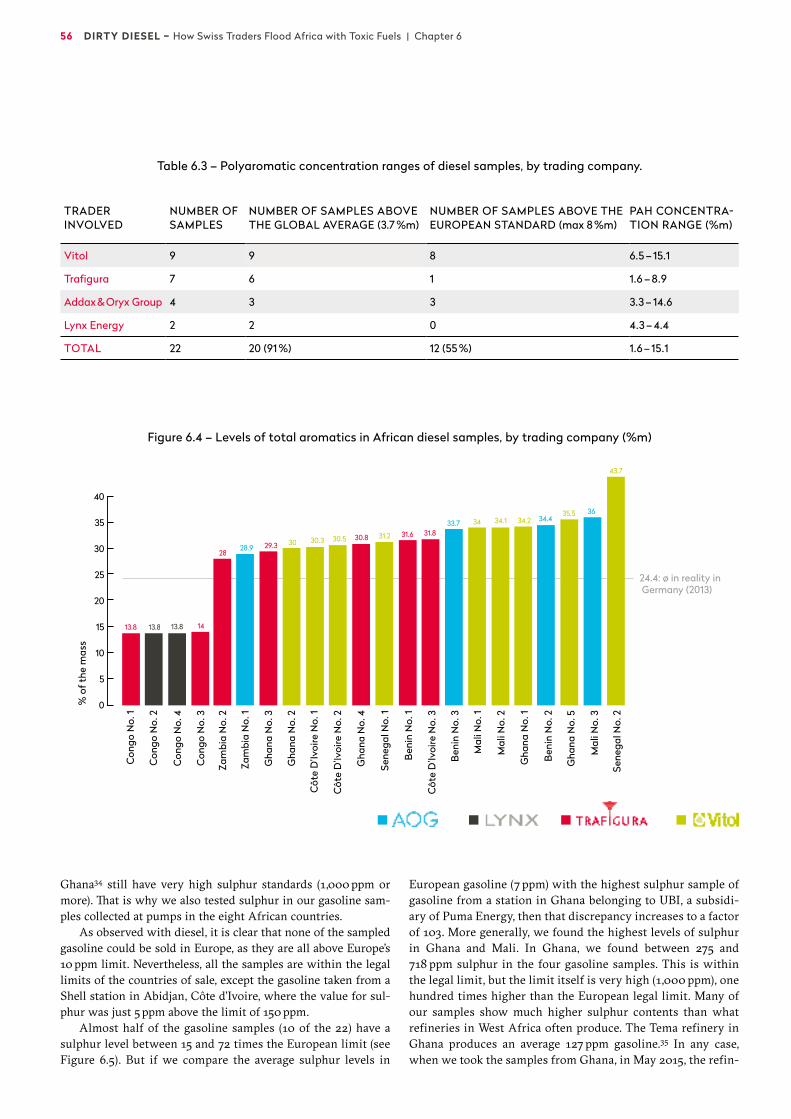
56 DIRTY DIESEL – How Swiss Traders Flood Africa with Toxic Fuels | Chapter 6
Ghana34 still have very high sulphur standards (1,000 ppm or more). That is why we also tested sulphur in our gasoline sam-ples collected at pumps in the eight African countries.
As observed with diesel, it is clear that none of the sampled gasoline could be sold in Europe, as they are all above Europe’s 10 ppm limit. Nevertheless, all the samples are within the legal limits of the countries of sale, except the gasoline taken from a Shell station in Abidjan, Côte d’Ivoire, where the value for sul-phur was just 5 ppm above the limit of 150 ppm.
Almost half of the gasoline samples (10 of the 22) have a sulphur level between 15 and 72 times the European limit (see Figure 6.5). But if we compare the average sulphur levels in
European gasoline (7 ppm) with the highest sulphur sample of gasoline from a station in Ghana belonging to UBI, a subsidi-ary of Puma Energy, then that discrepancy increases to a factor of 103. More generally, we found the highest levels of sulphur in Ghana and Mali. In Ghana, we found between 275 and 718 ppm sulphur in the four gasoline samples. This is within the legal limit, but the limit itself is very high (1,000 ppm), one hundred times higher than the European legal limit. Many of our samples show much higher sulphur contents than what refineries in West Africa often produce. The Tema refinery in Ghana produces an average 127 ppm gasoline.35 In any case, when we took the samples from Ghana, in May 2015, the refin-
Côt
e D
’Ivoi
re N
o. 3
Zam
bia
No.
1
Con
go N
o. 1
Con
go N
o. 4
Con
go N
o. 2
Con
go N
o. 3
Gha
na N
o. 3
Gha
na N
o. 2
Zam
bia
No.
2
Gha
na N
o. 4
Gha
na N
o. 5
Côt
e D
’Ivoi
re N
o. 2
Côt
e D
’Ivoi
re N
o. 1
Ben
in N
o. 1
Gha
na N
o. 1
Sene
gal N
o. 1
Sene
gal N
o. 2
Mal
i No.
1
Mal
i No.
2
Mal
i No.
3
Ben
in N
o. 3
Ben
in N
o. 2
14
12
10
8
6
4
2
0
1.59
3.3
4.3 4.3 4.4 4.5
5.86.5
77.6
8.9 8.9
9.910.5 10.6 10.7
11.312.1
12.813.4
15.114.6
Con
go N
o. 1
Con
go N
o. 2
Con
go N
o. 4
Con
go N
o. 3
Zam
bia
No.
2
Zam
bia
No.
1
Gha
na N
o. 3
Gha
na N
o. 2
Côt
e D
’Ivoi
re N
o. 1
Côt
e D
’Ivoi
re N
o. 2
Gha
na N
o. 4
Sene
gal N
o. 1
Ben
in N
o. 1
Côt
e D
’Ivoi
re N
o. 3
Ben
in N
o. 3
Mal
i No.
1
Mal
i No.
2
Gha
na N
o. 1
Ben
in N
o. 2
Gha
na N
o. 5
Mal
i No.
3
Sene
gal N
o. 2
40
35
30
25
20
15
10
5
0
13.813.8 13.8 14
2828.9 29.3 30 30.3 30.5 30.8 31.2 31.6 31.8
33.7 34 34.1 34.2 34.435.5 36
43.7
% o
f the
mas
s%
of t
he m
ass
8: EU legal limit
3.7: global ø in reality
24.4: ø in reality in Germany (2013)
Figure 6.4 – Levels of total aromatics in African diesel samples, by trading company (%m)
TRADER INVOLVED
NUMBER OF SAMPLES
NUMBER OF SAMPLES ABOVE THE GLOBAL AVERAGE (3.7 %m)
NUMBER OF SAMPLES ABOVE THE EUROPEAN STANDARD (max 8 %m)
PAH CONCENTRA-TION RANGE (%m)
Vitol 9 9 8 6.5 – 15.1
Trafigura 7 6 1 1.6 – 8.9
Addax & Oryx Group 4 3 3 3.3 – 14.6
Lynx Energy 2 2 0 4.3 – 4.4
TOTAL 22 20 (91 %) 12 (55 %) 1.6 – 15.1
Table 6.3 – Polyaromatic concentration ranges of diesel samples, by trading company.
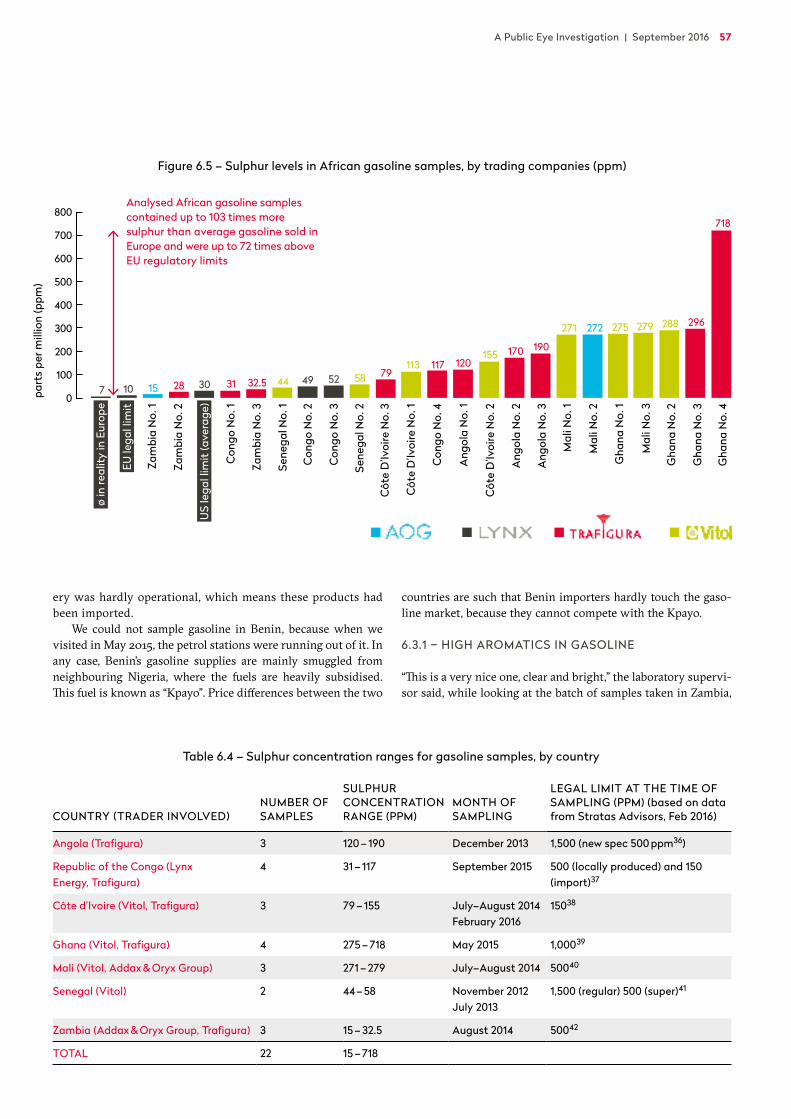
A Public Eye Investigation | September 2016 57
ery was hardly operational, which means these products had been imported.
We could not sample gasoline in Benin, because when we visited in May 2015, the petrol stations were running out of it. In any case, Benin’s gasoline supplies are mainly smuggled from neighbouring Nigeria, where the fuels are heavily subsidised. This fuel is known as “Kpayo”. Price differences between the two
countries are such that Benin importers hardly touch the gaso-line market, because they cannot compete with the Kpayo.
6.3.1 – HIGH AROMATICS IN GASOLINE
“This is a very nice one, clear and bright,” the laboratory supervi-sor said, while looking at the batch of samples taken in Zambia,
ø in
real
ity in
Eur
ope
EU le
gal l
imit
Zam
bia
No.
1
Zam
bia
No.
2
US
lega
l lim
it (a
vera
ge)
Con
go N
o. 1
Zam
bia
No.
3
Sene
gal N
o. 1
Con
go N
o. 2
Con
go N
o. 3
Sene
gal N
o. 2
Côt
e D
’Ivoi
re N
o. 3
Côt
e D
’Ivoi
re N
o. 1
Con
go N
o. 4
Ang
ola
No.
1
Côt
e D
’Ivoi
re N
o. 2
Ang
ola
No.
2
Ang
ola
No.
3
Mal
i No.
1
Mal
i No.
2
Gha
na N
o. 1
Mal
i No.
3
Gha
na N
o. 2
Gha
na N
o. 3
Gha
na N
o. 4
800
700
600
500
400
300
200
100
0
Analysed African gasoline samples contained up to 103 times moresulphur than average gasoline sold in Europe and were up to 72 times above EU regulatory limits
7 10 15 28 30 31 32.5 44 49 52 58 79113 117 120
155 170 190
271 272 275 279 288 296
718
part
s pe
r mill
ion
(ppm
)
Figure 6.5 – Sulphur levels in African gasoline samples, by trading companies (ppm)
Table 6.4 – Sulphur concentration ranges for gasoline samples, by country
COUNTRY (TRADER INVOLVED)NUMBER OF SAMPLES
SULPHUR CONCENTRATION RANGE (PPM)
MONTH OF SAMPLING
LEGAL LIMIT AT THE TIME OF SAMPLING (PPM) (based on data from Stratas Advisors, Feb 2016)
Angola (Trafigura) 3 120 – 190 December 2013 1,500 (new spec 500 ppm36)
Republic of the Congo (Lynx Energy, Trafigura)
4 31 – 117 September 2015 500 (locally produced) and 150 (import)37
Côte d’Ivoire (Vitol, Trafigura) 3 79 – 155 July–August 2014 February 2016
15038
Ghana (Vitol, Trafigura) 4 275 – 718 May 2015 1,00039
Mali (Vitol, Addax & Oryx Group) 3 271 – 279 July–August 2014 50040
Senegal (Vitol) 2 44 – 58 November 2012 July 2013
1,500 (regular) 500 (super)41
Zambia (Addax & Oryx Group, Trafigura) 3 15 – 32.5 August 2014 50042
TOTAL 22 15 – 718
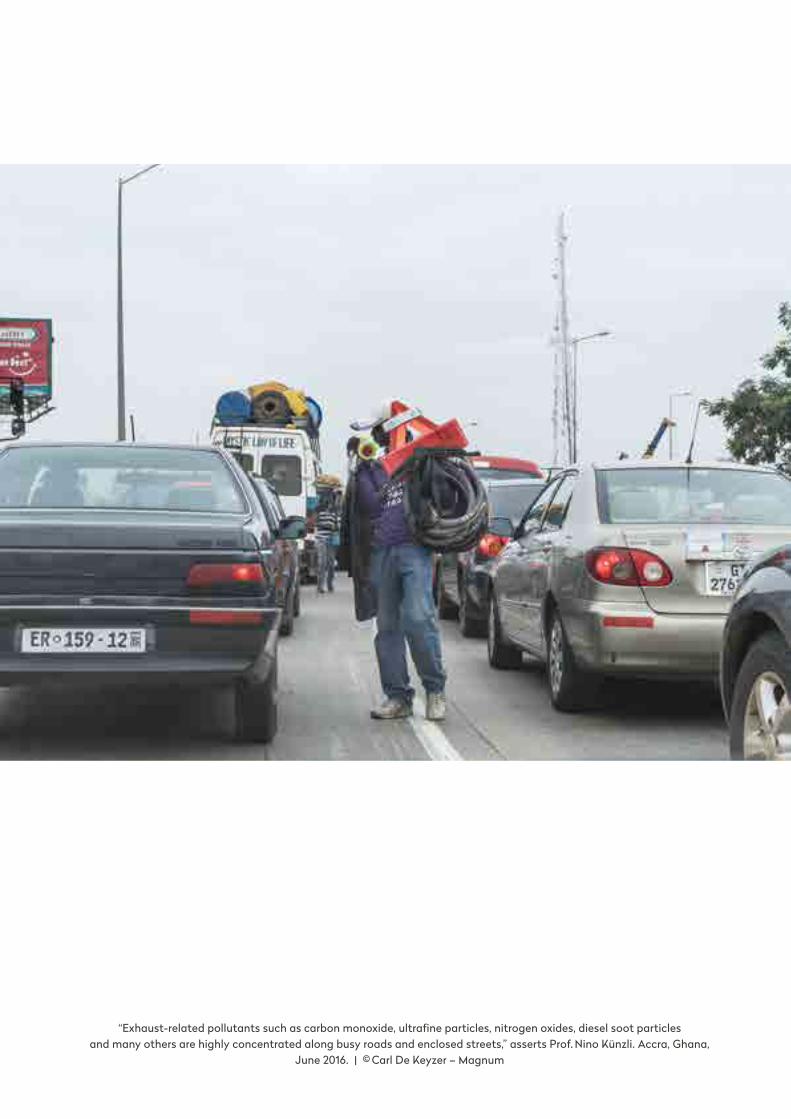
“Exhaust-related pollutants such as carbon monoxide, ultrafine particles, nitrogen oxides, diesel soot particles and many others are highly concentrated along busy roads and enclosed streets,” asserts Prof. Nino Künzli. Accra, Ghana,
June 2016. | © Carl De Keyzer – Magnum
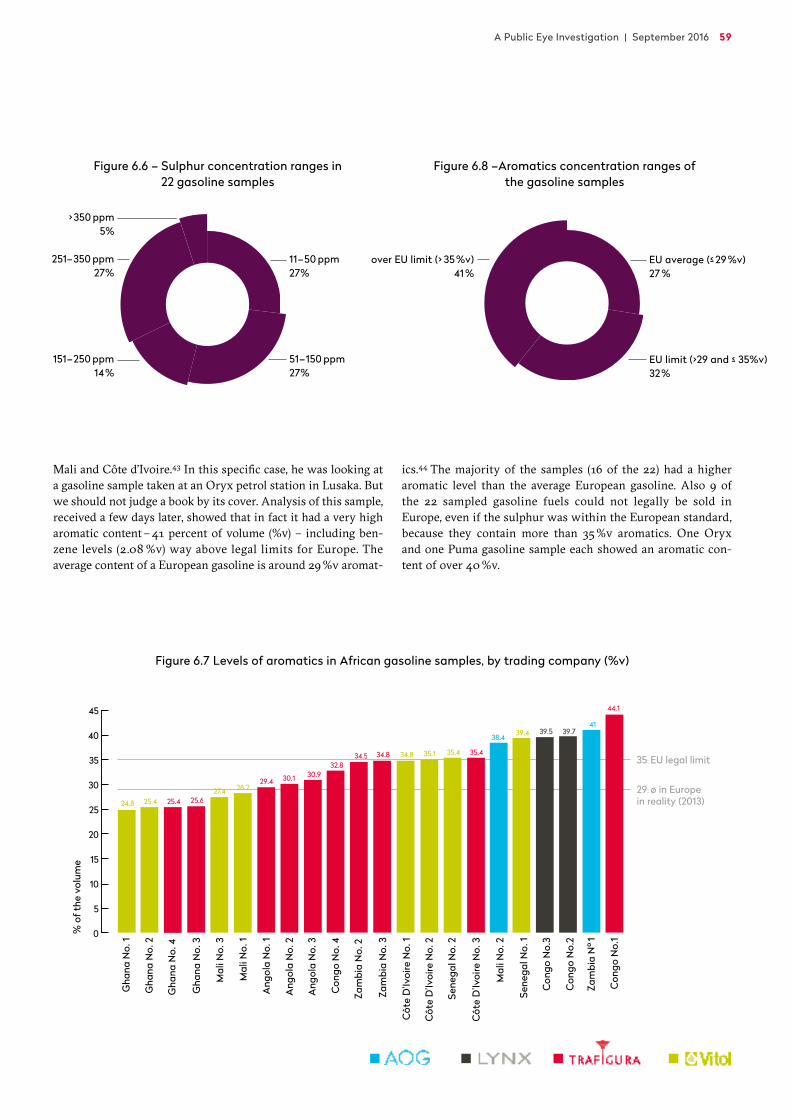
A Public Eye Investigation | September 2016 59
Mali and Côte d’Ivoire.43 In this specific case, he was looking at a gasoline sample taken at an Oryx petrol station in Lusaka. But we should not judge a book by its cover. Analysis of this sample, received a few days later, showed that in fact it had a very high aromatic content – 41 percent of volume (%v) – including ben-zene levels (2.08 %v) way above legal limits for Europe. The average content of a European gasoline is around 29 %v aromat-
ics.44 The majority of the samples (16 of the 22) had a higher aromatic level than the average European gasoline. Also 9 of the 22 sampled gasoline fuels could not legally be sold in Europe, even if the sulphur was within the European standard, because they contain more than 35 %v aromatics. One Oryx and one Puma gasoline sample each showed an aromatic con-tent of over 40 %v.
Figure 6.7 Levels of aromatics in African gasoline samples, by trading company (%v)
Gha
na N
o. 4
Zam
bia
No.
2
Gha
na N
o. 1
Gha
na N
o. 2
Gha
na N
o. 3
Mal
i No.
3
Mal
i No.
1
Ang
ola
No.
1
Ang
ola
No.
2
Ang
ola
No.
3
Con
go N
o. 4
Côt
e D
’Ivoi
re N
o. 2
Sene
gal N
o. 2
Côt
e D
’Ivoi
re N
o. 3
Zam
bia
No.
3
Côt
e D
’Ivoi
re N
o. 1
35: EU legal limit
29: ø in Europein reality (2013)
1: EU legal limit
0.6: ø in Europein reality (2013)
Con
go N
o.1
Mal
i No.
2
Sene
gal N
o. 1
Zam
bia
Nº 1
Con
go N
o.3
Con
go N
o.2
45
40
35
30
25
20
15
10
5
0
25.4
34.5
24.8 25.4 25.627.4 28.2
29.4 30.1 30.932.8
34.8 34.8 35.1 35.4 35.4
38.4 39.4 39.5 39.7
44.1
41
Mal
i No.
3
Sene
gal N
o. 2
Ang
ola
No.
3
Mal
i No.
1
Ang
ola
No.
2
Ang
ola
No.
1
Gha
na N
o. 1
Gha
na N
o. 2
Gha
na N
o. 4
Gha
na N
o. 3
Sene
gal N
o. 1
Con
go N
o. 1
Zam
bia
No.
1
Côt
e D
’Ivoi
re N
o. 1
Zam
bia
No.
3
Zam
bia
No.
2
Mal
i No.
2
Con
go N
o. 2
Con
go N
o. 3
Côt
e D
’Ivoi
re N
o. 2
Côt
e D
’Ivoi
re N
o. 3
4
3
2
1
0
0.62
0.92 0.92 0.93 0.95 0.96
1.25 1.29 1.3 1.31
1.66
1.99
Con
go N
o. 4
3.84
2.082.21 2.22 2.24
2.472.66 2.72 2.76
3.82
% o
f the
vol
ume
% o
f the
vol
ume
Figure 6.6 – Sulphur concentration ranges in 22 gasoline samples
Euro
pe
US
& C
anad
a
Russ
ia &
Cas
pian
Asi
a-Pa
cific
Lati
n A
mer
ica
Mid
dle
East
Afr
ica
max
. ppm
sul
phur
in d
iese
l
2000
1800
1600
1400
1200
1000
800
600
400
200
0
Inde
pend
ent
Trad
ers
Oth
er C
ompa
nies
Regi
onal
Oil
Com
pani
es
Tota
l
Ang
lo-S
axon
Maj
ors
10 %
5 %
0 %
–5 %
–10 %
–15 %
–20 %
–25 %
51–500 ppm20 %
501–1500 ppm12%
1501–2500 ppm24 %
2501–3500 ppm40 %
> 3500 ppm4%
Africa 61 %
Gibraltar 12 %
Europe 20 %
America 6 %Asia 1%
11–50 ppm27%
51–150 ppm27%
151–250 ppm14 %
251–350 ppm27%
> 350 ppm5%
EU average (≤ 29 %v) 27 %
EU limit (>29 and ≤ 35%v)32 %
over EU limit (> 35 %v)41 %
0–5
00 p
pm
1 1 1 1 1
4 43
9
13
2 2
1
2 2
5
8
4
501–
1,000
ppm
1,001
–1,5
00 p
pm
1,501
–2,0
00 p
pm
2,00
1–2,
500
ppm
2,50
1–3,
000
ppm
3,00
1–3,
500
ppm
3,50
1–4,
000
ppm
4,00
1–4,
500
ppm
4,50
1–5,
000
ppm
5,00
1–5,
500
ppm
Num
ber o
f car
goes
repo
rted
Nat
iona
l spe
cific
atio
n 5,
000
ppm
0–5
00 p
pm
Num
ber o
f car
goes
repo
rted
Nat
iona
l spe
cific
atio
n 3,
000
ppm
501–
1,000
ppm
1,001
–1,5
00 p
pm
1,501
–2,0
00 p
pm
2,00
1–2,
500
ppm
2,50
1–3,
000
ppm
3,00
1–3,
500
ppm
Figure 6.8 –Aromatics concentration ranges of the gasoline samples
Euro
pe
US
& C
anad
a
Russ
ia &
Cas
pian
Asi
a-Pa
cific
Lati
n A
mer
ica
Mid
dle
East
Afr
ica
max
. ppm
sul
phur
in d
iese
l
2000
1800
1600
1400
1200
1000
800
600
400
200
0
Inde
pend
ent
Trad
ers
Oth
er C
ompa
nies
Regi
onal
Oil
Com
pani
es
Tota
l
Ang
lo-S
axon
Maj
ors
10 %
5 %
0 %
–5 %
–10 %
–15 %
–20 %
–25 %
51–500 ppm20 %
501–1500 ppm12%
1501–2500 ppm24 %
2501–3500 ppm40 %
> 3500 ppm4%
Africa 61 %
Gibraltar 12 %
Europe 20 %
America 6 %Asia 1%
11–50 ppm27%
51–150 ppm27%
151–250 ppm14 %
251–350 ppm27%
> 350 ppm5%
EU average (≤ 29 %v) 27 %
EU limit (>29 and ≤ 35%v)32 %
over EU limit (> 35 %v)41 %
0–5
00 p
pm
1 1 1 1 1
4 43
9
13
2 2
1
2 2
5
8
4
501–
1,000
ppm
1,001
–1,5
00 p
pm
1,501
–2,0
00 p
pm
2,00
1–2,
500
ppm
2,50
1–3,
000
ppm
3,00
1–3,
500
ppm
3,50
1–4,
000
ppm
4,00
1–4,
500
ppm
4,50
1–5,
000
ppm
5,00
1–5,
500
ppm
Num
ber o
f car
goes
repo
rted
Nat
iona
l spe
cific
atio
n 5,
000
ppm
0–5
00 p
pm
Num
ber o
f car
goes
repo
rted
Nat
iona
l spe
cific
atio
n 3,
000
ppm
501–
1,000
ppm
1,001
–1,5
00 p
pm
1,501
–2,0
00 p
pm
2,00
1–2,
500
ppm
2,50
1–3,
000
ppm
3,00
1–3,
500
ppm
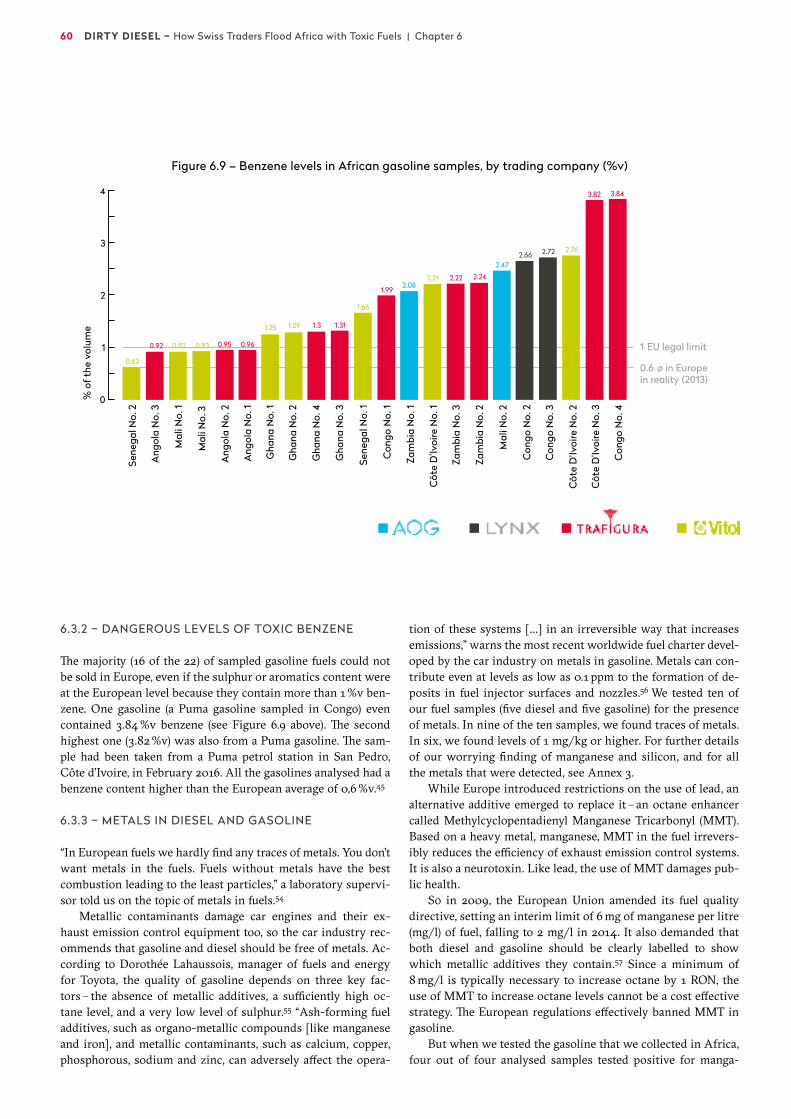
60 DIRTY DIESEL – How Swiss Traders Flood Africa with Toxic Fuels | Chapter 6
6.3.2 – DANGEROUS LEVELS OF TOXIC BENZENE
The majority (16 of the 22) of sampled gasoline fuels could not be sold in Europe, even if the sulphur or aromatics content were at the European level because they contain more than 1 %v ben-zene. One gasoline (a Puma gasoline sampled in Congo) even contained 3.84 %v benzene (see Figure 6.9 above). The second highest one (3.82 %v) was also from a Puma gasoline. The sam-ple had been taken from a Puma petrol station in San Pedro, Côte d’Ivoire, in February 2016. All the gasolines analysed had a benzene content higher than the European average of 0,6 %v.45
6.3.3 – METALS IN DIESEL AND GASOLINE
“In European fuels we hardly find any traces of metals. You don’t want metals in the fuels. Fuels without metals have the best combustion leading to the least particles,” a laboratory supervi-sor told us on the topic of metals in fuels.54
Metallic contaminants damage car engines and their ex-haust emission control equipment too, so the car industry rec-ommends that gasoline and diesel should be free of metals. Ac-cording to Dorothée Lahaussois, manager of fuels and energy for Toyota, the quality of gasoline depends on three key fac-tors – the absence of metallic additives, a sufficiently high oc-tane level, and a very low level of sulphur.55 “Ash-forming fuel additives, such as organo-metallic compounds [like manganese and iron], and metallic contaminants, such as calcium, copper, phosphorous, sodium and zinc, can adversely affect the opera-
tion of these systems […] in an irreversible way that increases emissions,” warns the most recent worldwide fuel charter devel-oped by the car industry on metals in gasoline. Metals can con-tribute even at levels as low as 0.1 ppm to the formation of de-posits in fuel injector surfaces and nozzles.56 We tested ten of our fuel samples (five diesel and five gasoline) for the presence of metals. In nine of the ten samples, we found traces of metals. In six, we found levels of 1 mg/kg or higher. For further details of our worrying finding of manganese and silicon, and for all the metals that were detected, see Annex 3.
While Europe introduced restrictions on the use of lead, an alternative additive emerged to replace it – an octane enhancer called Methylcyclopentadienyl Manganese Tricarbonyl (MMT). Based on a heavy metal, manganese, MMT in the fuel irrevers-ibly reduces the efficiency of exhaust emission control systems. It is also a neurotoxin. Like lead, the use of MMT damages pub-lic health.
So in 2009, the European Union amended its fuel quality directive, setting an interim limit of 6 mg of manganese per litre (mg/l) of fuel, falling to 2 mg/l in 2014. It also demanded that both diesel and gasoline should be clearly labelled to show which metallic additives they contain.57 Since a minimum of 8 mg/l is typically necessary to increase octane by 1 RON, the use of MMT to increase octane levels cannot be a cost effective strategy. The European regulations effectively banned MMT in gasoline.
But when we tested the gasoline that we collected in Africa, four out of four analysed samples tested positive for manga-
Figure 6.9 – Benzene levels in African gasoline samples, by trading company (%v)G
hana
No.
4
Zam
bia
No.
2
Gha
na N
o. 1
Gha
na N
o. 2
Gha
na N
o. 3
Mal
i No.
3
Mal
i No.
1
Ang
ola
No.
1
Ang
ola
No.
2
Ang
ola
No.
3
Con
go N
o. 4
Côt
e D
’Ivoi
re N
o. 2
Sene
gal N
o. 2
Côt
e D
’Ivoi
re N
o. 3
Zam
bia
No.
3
Côt
e D
’Ivoi
re N
o. 1
35: EU legal limit
29: ø in Europein reality (2013)
1: EU legal limit
0.6: ø in Europein reality (2013)
Con
go N
o.1
Mal
i No.
2
Sene
gal N
o. 1
Zam
bia
Nº 1
Con
go N
o.3
Con
go N
o.2
45
40
35
30
25
20
15
10
5
0
25.4
34.5
24.8 25.4 25.627.4 28.2
29.4 30.1 30.932.8
34.8 34.8 35.1 35.4 35.4
38.4 39.4 39.5 39.7
44.1
41
Mal
i No.
3
Sene
gal N
o. 2
Ang
ola
No.
3
Mal
i No.
1
Ang
ola
No.
2
Ang
ola
No.
1
Gha
na N
o. 1
Gha
na N
o. 2
Gha
na N
o. 4
Gha
na N
o. 3
Sene
gal N
o. 1
Con
go N
o. 1
Zam
bia
No.
1
Côt
e D
’Ivoi
re N
o. 1
Zam
bia
No.
3
Zam
bia
No.
2
Mal
i No.
2
Con
go N
o. 2
Con
go N
o. 3
Côt
e D
’Ivoi
re N
o. 2
Côt
e D
’Ivoi
re N
o. 3
4
3
2
1
0
0.62
0.92 0.92 0.93 0.95 0.96
1.25 1.29 1.3 1.31
1.66
1.99
Con
go N
o. 4
3.84
2.082.21 2.22 2.24
2.472.66 2.72 2.76
3.82
% o
f the
vol
ume
% o
f the
vol
ume
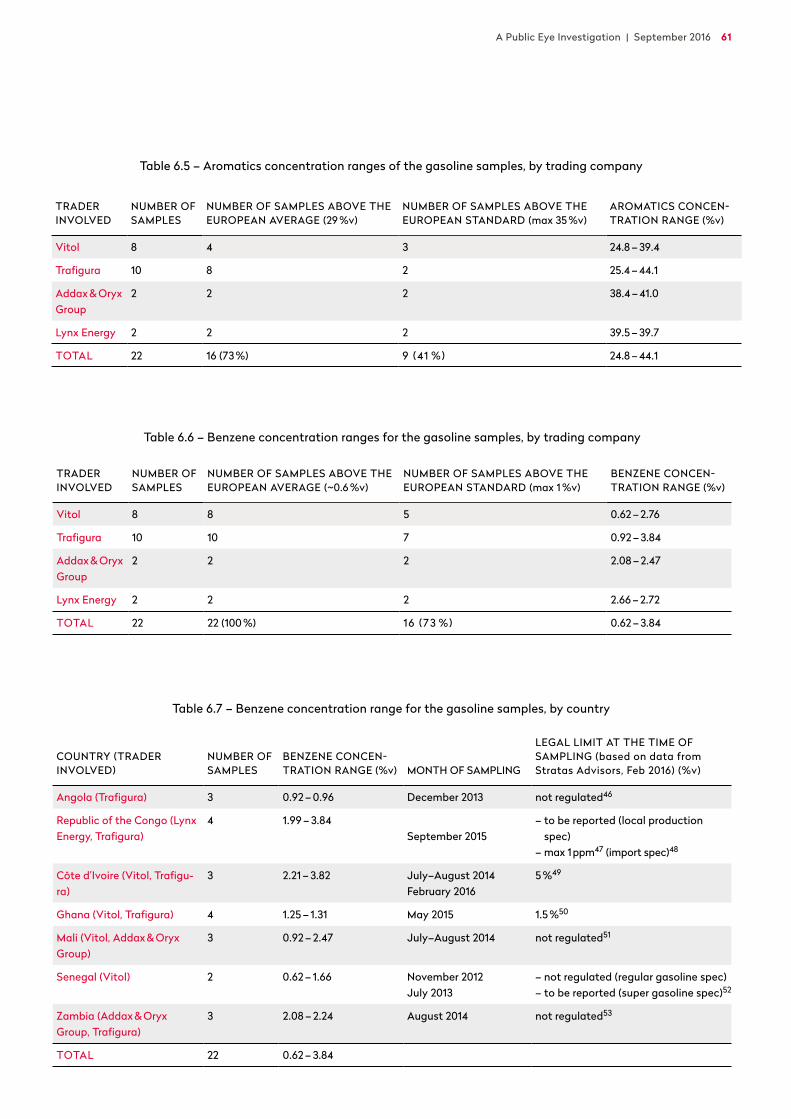
A Public Eye Investigation | September 2016 61
Table 6.5 – Aromatics concentration ranges of the gasoline samples, by trading company
Table 6.6 – Benzene concentration ranges for the gasoline samples, by trading company
Table 6.7 – Benzene concentration range for the gasoline samples, by country
TRADER INVOLVED
NUMBER OF SAMPLES
NUMBER OF SAMPLES ABOVE THE EUROPEAN AVERAGE (29 %v)
NUMBER OF SAMPLES ABOVE THE EUROPEAN STANDARD (max 35 %v)
AROMATICS CONCEN-TRATION RANGE (%v)
Vitol 8 4 3 24.8 – 39.4
Trafigura 10 8 2 25.4 – 44.1
Addax & Oryx Group
2 2 2 38.4 – 41.0
Lynx Energy 2 2 2 39.5 – 39.7
TOTAL 22 16 (73 %) 9 (41 %) 24.8 – 44.1
COUNTRY (TRADER INVOLVED)
NUMBER OF SAMPLES
BENZENE CONCEN-TRATION RANGE (%v) MONTH OF SAMPLING
LEGAL LIMIT AT THE TIME OF SAMPLING (based on data from Stratas Advisors, Feb 2016) (%v)
Angola (Trafigura) 3 0.92 – 0.96 December 2013 not regulated46
Republic of the Congo (Lynx Energy, Trafigura)
4 1.99 – 3.84September 2015
– to be reported (local production spec)
– max 1 ppm47 (import spec)48
Côte d’Ivoire (Vitol, Trafigu-ra)
3 2.21 – 3.82 July–August 2014 February 2016
5 %49
Ghana (Vitol, Trafigura) 4 1.25 – 1.31 May 2015 1.5 %50
Mali (Vitol, Addax & Oryx Group)
3 0.92 – 2.47 July–August 2014 not regulated51
Senegal (Vitol) 2 0.62 – 1.66 November 2012 July 2013
– not regulated (regular gasoline spec)– to be reported (super gasoline spec)52
Zambia (Addax & Oryx Group, Trafigura)
3 2.08 – 2.24 August 2014 not regulated53
TOTAL 22 0.62 – 3.84
TRADERINVOLVED
NUMBER OF SAMPLES
NUMBER OF SAMPLES ABOVE THE EUROPEAN AVERAGE (~0.6 %v)
NUMBER OF SAMPLES ABOVE THE EUROPEAN STANDARD (max 1 %v)
BENZENE CONCEN-TRATION RANGE (%v)
Vitol 8 8 5 0.62 – 2.76
Trafigura 10 10 7 0.92 – 3.84
Addax & Oryx Group
2 2 2 2.08 – 2.47
Lynx Energy 2 2 2 2.66 – 2.72
TOTAL 22 22 (100 %) 16 (73 %) 0.62 – 3.84
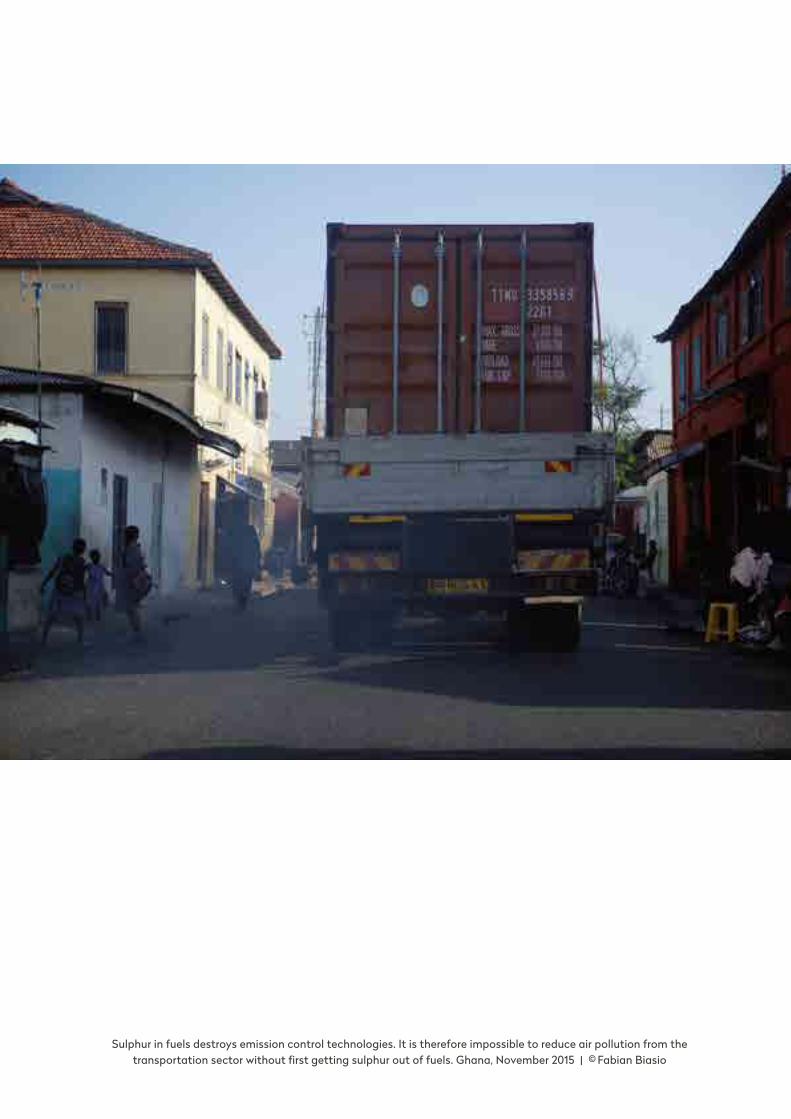
Sulphur in fuels destroys emission control technologies. It is therefore impossible to reduce air pollution from thetransportation sector without first getting sulphur out of fuels. Ghana, November 2015 | © Fabian Biasio
A Public Eye Investigation | September 2016 63
nese. In two cases the levels were low (2.1 and 2.5 mg/kg equiv-alent to 1.6 and 1.9 mg/l), suggesting that the manganese addi-tive had not been intentionally added to these fuels, but showing that MMT is present in the fuel chain. For the other two sam-ples, we can assume that the controversial octane enhancer MMT was intentionally added. Given that octane requirements are low for the two countries where these samples were taken (RON 87 in Senegal and RON 91 in Côte d’Ivoire), we know that a quite considerable amount of MMT has been added to the gas-oline, equal to 61 mg/kg (equivalent to 47 mg/l) for Vitol gaso-line in Senegal and 26 mg/kg (equivalent to 20.4 mg/l) for Tra-figura’s gasoline in San Pedro, Côte d’Ivoire.
The levels of 47 and 20.4 mg/l are also high considering that typical treat rates range from 8 mg/litre to 18 mg/litre. In those countries where manganese is (or was) allowed, the max-imum application is (or was) 18 mg/l.58 Our findings suggest that the two gasoline fuels might have been blended with very low-quality and low-octane blendstocks such as coker naphtha. Indeed, as we know from the case of Trafigura’s Probo Koala caustic washing, coker naphtha is more often used as a cheap blendstock for African gasoline. In five of the ten samples, we also found traces of silicon. While our diesel samples showed low levels (less than 1 mg/kg of silicon), we found a level of 15 mg/kg in a gasoline sample taken from Puma’s petrol station in February 2016 in San Pedro, Côte d’Ivoire, raising serious questions about where this contamination came from. The source of this silicon contamination could have come from the blending of coker naphtha or from waste in a different industry (see chapter 10).59
6.4 – “HIGH-QUALITY FUELS” – REALLY ?
So how do the Swiss trading companies perceive their role as suppliers and sellers of fuels in Africa? We’ll let the traders have the first word.
Vivo Energy says it aims to create “a new benchmark for quality, excellence, safety and responsibility in Africa’s down-stream energy marketplace.”60 The company is proud to make “truly world-class products available to all our African cus-tomers.” In Côte d'Ivoire, Vivo declares that it “uses all the means and tools necessary to ensure the latest international standards of quality [...] so that Ivoirian consumers benefit from what is best in terms of fuel when going to a Shell petrol station."61
Trafigura also expresses pride, stating on its website that: “Across Africa and other developing regions, our supply of af-fordable high-quality fuel products empowers local businesses.”
Clearly, such statements don’t come even close to the reali-ty that we found at their pumps in African countries. Analysis of our samples showed a very high sulphur content for both diesel and gasoline, providing accurate insight into the prod-ucts they offer to African consumers. By selling diesel with a sulphur content close to the legal limit, the Swiss trading com-panies show a willingness to maximise profits at the cost of people’s health. With the exception of Congo, all our diesel samples show sulphur levels at least 100 times the European
10 ppm limit. More than half of our diesel samples were 200 times the European limit. This is no coincidence: it demon-strates a deliberate strategy to convert weak regulation into healthy profit.
Our results correspond with a 2012 study from Nigeria which analysed five samples of gasoline for sulphur. Interest-ingly, the study focused on the origin of the product, highlight-ing, as we do in chapter 8 and beyond, the role of the Amster-dam-Rotterdam-Antwerp region as a key source of bad fuels to Africa. “The result of the sulphur content analyses […] shows that Hollandian gasoline has the highest sulphur concentration […]”62 The “Hollandian” gasoline contained 810 ppm followed by Brazilian gasoline (400 ppm) and Nigerian gasoline with the lowest sulphur content (250 ppm). The “Hollandian gasoline” was therefore very close to the allowed limit of 1,000. The study notes that “in Nigeria, where most of the gasoline being con-sumed is imported through independent marketers, there is the temptation of profit maximisation through either adulteration or importation of substandard products.”63 This is exactly the same as one of this report’s conclusions, though we add that these “independent marketers” are mostly supplied by trading companies based in Switzer land.
We asked the trading companies to share with us the levels of sulphur in the gasoline and diesel fuels that they produced, supplied and sold to African countries in 2015 and 2016, but none of them were willing to give that information.
Through our samples, we also demonstrate the presence of high levels of other components, potentially dangerous to health, including PAHs and aromatics in diesel, and benzene and aromatics in gasoline. All of these components have been detected in different countries and at petrol stations run by dif-ferent trading companies, indicating that the results of our find-ings are closer to being the rule than the exception.
The fact that we did not find any substances above the legal limits, except one (Shell in Côte d’Ivoire)64, shows how traders stay strictly within the legal limits. This makes sense given the potential commercial risks involved with the supply and sale of products off-specification (“off-spec”). But it also means that countries really get what they allow. Mali is a good example. Côte d’Ivoire has slightly better legal standards on sulphur than Mali. So Mali might expect that its fuel, which is often imported from Côte d’Ivoire, would be the same quality as in Côte d’Ivoire. But actually it gets worse. The traders know they can sell lower quality fuel in Mali, so they do.
The best summary on this issue comes from Jane Akumu, who leads the Africa sulphur campaign for the Transport Unit at the United Nations Environment Programme (UNEP): “Regu-lators, you need to be on top of your standards. Otherwise, any product that doesn’t meet the specifications in other countries will end up in yours.”
In the next chapter, we show how importers easily adapted to new standards in Ghana by blending to the specification. Fur-ther chapters also lend strength to the conclusions that we draw from the analysis of our samples. These chapters include the dominant role of Swiss trading companies in the supply of high sulphur fuels from Europe to West Africa, and the blending strategies they use to produce “African Quality” fuels.
Petrol and politics, two sides of a same coin. Ghana, June 2016 | © Carl De Keyzer – Magnum
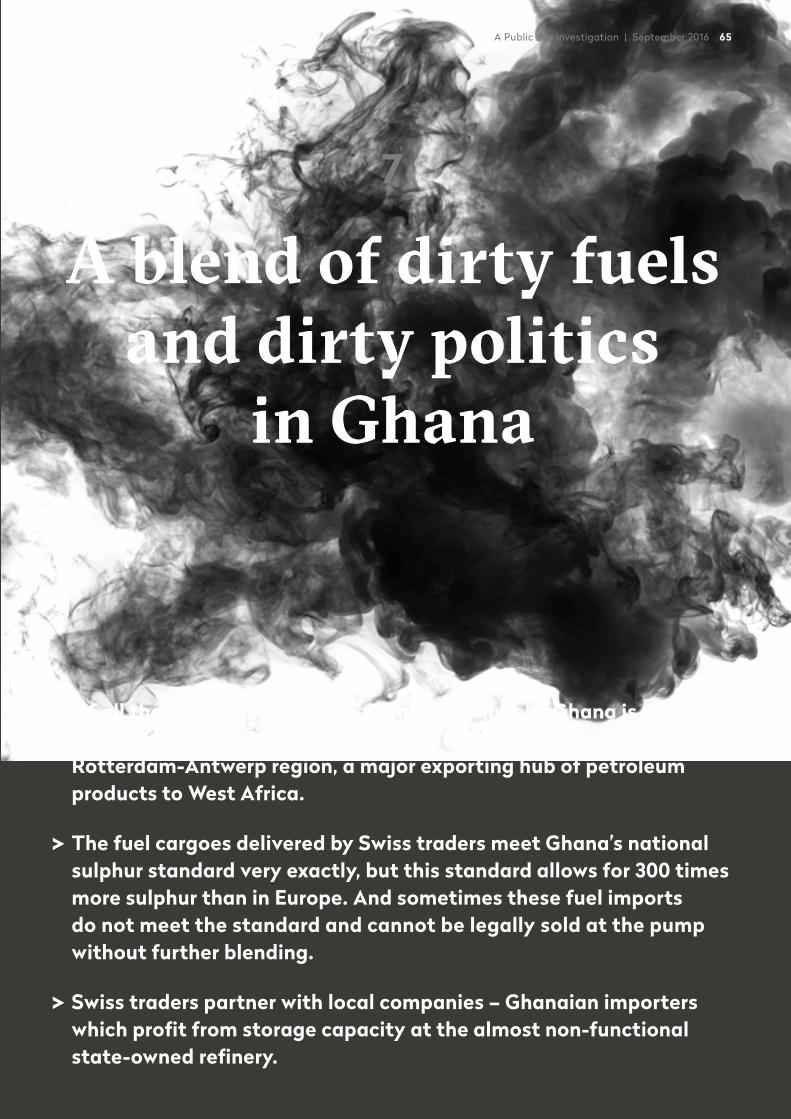
A Public Eye Investigation | September 2016 65
7
A blend of dirty fuels and dirty politics
in Ghana
Of all the countries between Senegal and Angola, Ghana is the largest recipient of high sulphur diesel from the Amsterdam- Rotterdam-Antwerp region, a major exporting hub of petroleum products to West Africa.
The fuel cargoes delivered by Swiss traders meet Ghana’s national sulphur standard very exactly, but this standard allows for 300 times more sulphur than in Europe. And sometimes these fuel imports do not meet the standard and cannot be legally sold at the pump without further blending.
Swiss traders partner with local companies – Ghanaian importers which profit from storage capacity at the almost non-functional state-owned refinery.
66 DIRTY DIESEL – How Swiss Traders Flood Africa with Toxic Fuels | Chapter 7
In the overwhelming heat and humidity of the Ghanaian capital, Accra, traffic jams persist at all hours of the day. Testimony to urban population growth and the rising number of motor vehi-cles since the turn of the century, these interminable queues comprise a motley mix of trendy saloons, battered cars, old goods lorries, and buses overflowing with passengers.
The cars that groove the streets spit thick black fumes sub-sequently inhaled by hordes of hawkers, drenched in sweat, scraping a living selling trinkets, cold drinks and SIM cards to the prisoners of the infernal traffic. The city’s highways are interspersed with middle and lower class residential areas. Over four million people are exposed to these harmful emis-sions, 24/7.
In the previous chapter on the samples, we showed the high levels of sulphur in diesel sold at the pump by Swiss trading companies in eight African countries. In Ghana, we found die-sel at Vitol and Trafigura operated petrol stations with average sulphur levels between 240 and 260 times higher than the European standard. But were these fuels exceptional or do they represent what is sold every day in the country? Who brought these fuels to Ghana? Where do they come from? And why do African drivers continue to buy dirty fuels, with a sulphur con-tent several hundred times higher than the authorised Europe-an limit?
After spending time in Ghana and gaining access to exclu-sive documents, we have been able, for the first time, to fully trace the sulphur route from European ports to African pumps. We have also been able to establish the identities of internation-al players supplying Ghana. We show that Swiss trading compa-nies are dominant in this dirty business and that most of the petroleum products they deliver come from Europe and the United States. These industrialised nations would not have al-lowed these same products to be sold at the pump due to their damaging effects on health and the environment.
Ghana relies almost exclusively on imports to satisfy its domestic fuel demand and these imports are secured by a small club of importers known as bulk distributing compa-nies (BDCs). Local content laws require BDCs to be indige-nous, though many of the bigger players team up with Swiss trading companies, which supply them with products and cheap credit.
Together with their Swiss partners, these importers pur-posefully deliver diesel with sulphur content as close to the legal limit as possible. At times, the sulphur content goes above the legal limit. Organised as a powerful and politically-con-nected lobby, the BDCs do not supply higher quality fuel if this cuts into their profit margins. Indeed, despite robust evidence that shows the public health impact of high sulphur diesel, the importers’ association, the Ghanaian Chamber of Bulk Oil Dis-tributors (CBOD), argued against the adoption of higher stan-dards in 2012, when the country discussed lowering the legal sulphur limit from 5,000 ppm to 3,000 ppm. Today, the latter figure is still the standard, which is 300 times higher than in the European Union. Supported by the industry’s opacity, im-porters have argued in bad faith against better standards, as we will show. But let’s start with an overview of Ghana’s market players.
7.1 – IMPORTS SUPPLIED BY A CARTEL OF SWISS UNCLES AND GHANAIAN NEPHEWS
Ghana is sub-Saharan Africa’s fifth largest market for petroleum products, and today it depends almost exclusively on imports to satisfy its domestic needs. By 2014, more than three quarters of the national demand for petroleum products was for gasoline and diesel – due largely to the fact that road traffic accounted for 97 percent of transport in the country.1 Ghana’s diesel consump-tion has also been growing in the past decade, jumping 64 per-cent between 2010 and 2012.2
“We import 98 percent of the country’s needs,” declares Senyo K. Hosi, CEO of the Ghanaian Chamber of Bulk Oil Dis-tributors (CBOD). Highly strategic, the import sector alone ac-counts for over 10 percent of Ghana’s GDP, according to Imani, a policy and education centre.3 “It is the most lucrative business you can do in Ghana,” states Mohammed Amin Adam, Execu-tive Director of the African Centre for Energy Policy (ACEP).
Ghana’s dependence on imports may appear somewhat para-doxical in an oil producer country equipped with its own refin-ery, Tema Oil Refinery (TOR). However, for the past two years, the state-owned company has hardly been functioning. This situation – an oil-rich country relying on imports – is common-place in the region. Nigeria and Angola, sub-Saharan Africa’s two main oil producers, also import almost all of their fuel. Like Ghana, Nigeria’s four refineries constantly operate way below their capacity.
Ghana’s downstream oil sector is supervised by the National Petroleum Authority (NPA), which grants import licenses to bulk distributing companies (BDCs). In turn, these BDCs sell their fuels to oil marketing companies (OMCs) who own the petrol stations. Both BDCs and OMCs are local companies, by virtue of Ghana’s local content policies. In order to obtain an import license, a BDC must fulfill certain conditions, including 50 percent Ghanaian ownership and access to at least 40,000 m3
of storage facilities.4 That said, only four of the licensed BDCs own tank terminals: Chase Petroleum Ghana Ltd, Cirrus Oil Services Ltd, Fueltrade Ltd and Petroleum Warehouse and Sup-plies Ltd.5 Other operators rent facilities from these four or from the state-owned Tema Oil Refinery (TOR), which is why the latter hardly operates, although it resumed activities in Feb-ruary 2016 after two years of almost complete shutdown.
When Senyo K. Hosi said the members he represents as CEO of the Chamber of Bulk Oil Distributors “import 98 per-cent of the country’s needs,” he quickly added, “but a group of eight [members] runs the show.” In 2014, the country met these needs by importing more than 3.2 million tonnes of petroleum products, worth billions of dollars. According to NPA statistics, 9 of the 29 certified importers accounted for 88 percent of the market that year. And of the four market leaders supplying over half of Ghana’s needs in 2014, three were operating in partner-ship with Swiss companies: Fueltrade with Glencore, Cirrus Oil with Vitol and Chase Petroleum with Trafigura. The down-stream industry is therefore highly concentrated or, in the words of the NPA’s former CEO, John Attafuah, it’s “a cartel”.6
Unlike in their neighbouring countries, Ghanaians must re-tain at least a 50 percent share in every company active in the

A Public Eye Investigation | September 2016 67
oil sector, so no Swiss trading companies appear on official NPA lists of fuel importers as bulk distributing companies. Instead, Swiss trading companies partner with local ones. It is a mutual-ly beneficial arrangement. Indeed, most local companies don’t have international networks from which they can source either fuels or credit. In order to make profits, “BDCs differentiate themselves through their cost management and credit rate. Or, if they work with an international trader on a regular basis, they may save on the cost of a letter of credit,”7 explained Abass Ibra-him Tasunti, Pricing Officer at the NPA. Swiss commodity trad-ers add value to a local company by supplying products and credit. This credit can be used both to buy products and to in-vest in facilities such as storage.
The NPA lists Ghanaian importers and their partners, in-cluding Swiss trading companies too. The list includes a wide range of Swiss trading companies, showing how diverse the sector is in Switzerland. It also includes companies that are smaller and less known than the ones in this report. With the notable exception of AOT Trading, based in Zug, all these com-panies are registered in Geneva (Arcadia, Geogas and Ovlas).
Some of these partnerships may have expired, however, since they are no longer referenced in the latest list, published by the NPA in March 2015. Only Trafigura’s relationship with the Ghanaian company, Chase, persists. Asked about this part-nership, Trafigura declined to say whether it was still in exis-tence. But other Swiss trading companies may continue to oper-ate in Ghana. According to CITAC, Glencore has replaced Mercuria as partner for Ghana’s biggest importer, Fueltrade.9 Glencore confirmed it “owns a minority holding in a fuel storage terminal in Tema, which is majority owned by Fueltrade."
There are indications that Vitol is still working with Cirrus Oil Services, whose parent company is now called Woodfields
Energy Resources.10 In a 2014 British litigation procedure be-tween Glencore and Cirrus Oil Services, Mr Anthony Stimler, a trader from Glencore, testified that “he regarded Glencore’s competitor as Vitol rather than any local company,”11 suggesting that, for him, Cirrus and Vitol form one company. One of our sources adds another reason to believe the partnership goes on: “Vitol’s representative John Taylor is Woodfields’ Executive Chairman.”12 In 2011, Vitol and Woodfields also teamed up with Ghana National Petroleum Corporation to market crude that the state had received from producing companies.13 Finally, both companies used to share the same address in Accra.14 Asked about it, Vitol states it has “never been in partnership with Cir-rus", but has a “commercial relationship" and, “on occasion, sup-plies them with product."
Vitol will also add a stake in another Ghanian BDC, Oando, to its portfolio, as part of a deal to buy Oando’s retail network in Nigeria.15 Oando is not on the list of official BDCs because the company operates through a local partner, Ebony. Ebony was Ghana’s second largest BDC during the first nine months of 2015, and Vitol has confirmed that it acquired a minority share in Ebony. With new shares in Ebony, Vitol is well-placed to be-come indirectly Ghana’s biggest importer.
None of Vitol, Trafigura or Glencore’s Ghanaian partners publish annual reports or provide the identity of their share-holders, though Chase Petroleum claims an annual turnover of US$500 million.16 Glencore-backed Fueltrade doesn’t have a website anymore, despite being the country’s biggest importer in 2014.
Such alliances between international traders and national importers take diverse forms. They generally comprise of exclu-sive supply contracts with the local company, which calls upon its foreign partner once it has obtained an import allocation or when it needs to invest in storage. The foreign partner can also buy a stake (up to 50 percent) in the local company, as did Tra-figura, a company that is building a little empire for itself in Ghana.
7.2 – TRAFIGURA: ALL ALONE ALONG THE WHOLE SUPPLY CHAIN
“Trafigura … these guys are brutal.” Why? “Well, you know what they are doing in Angola, no?”
said Senyo K. Hosi, CEO of Ghana’s importers’ association, re-ferring to Trafigura’s monopoly over the supply of petroleum products in Angola (see chapter 5). Trafigura “is the only player in Ghana that is present at every stage of the supply chain,” he continued. We don’t disagree.
First, via Tema Offshore Mooring Limited (TOM), Trafigura receives a levy of US$4.9 per tonne17 on all cargoes of crude oil and refined products that enter Tema port via the pipeline sys-tem. Set up to compensate for the lack of capacity in Ghanaian ports, this system connects ships to depots onshore. Such car-goes account for 80 percent of the country’s imports, according to Puma’s website.18 But in its 2014 Bond Prospectus, Trafigura’s downstream arm Puma Energy proudly boasted that “all […] re-fined oil products must be imported into Ghana through” its
Table 7.1 – Oil Trading Companies in 2011 – partnership
SWISS TRADING COMPANY GHANAIAN COMPANY
AOT Trading AG Forester Associates Ltd
Arcadia Petroleum Sankofa Energy
Geogas SA Bulk Ship & Trade Ltd
Glencore Energy Uk Ltd8 Avalon Petroleum Ltd
Glencore Energy Uk Ltd Yimpex Ghana Ltd
Gunvor International Ltd Fraga Oil Ghana Ltd
Litasco Chells Consult
Mercuria Energy Trading Fueltrade Ltd
Ovlas Trading SA DAD Energy Resources Ltd
Trafigura Beheer Ltd Chase Petroleum Ltd
Vitol SA Cirrus Oil Services Ltd
SOURCE: NPA, 2011
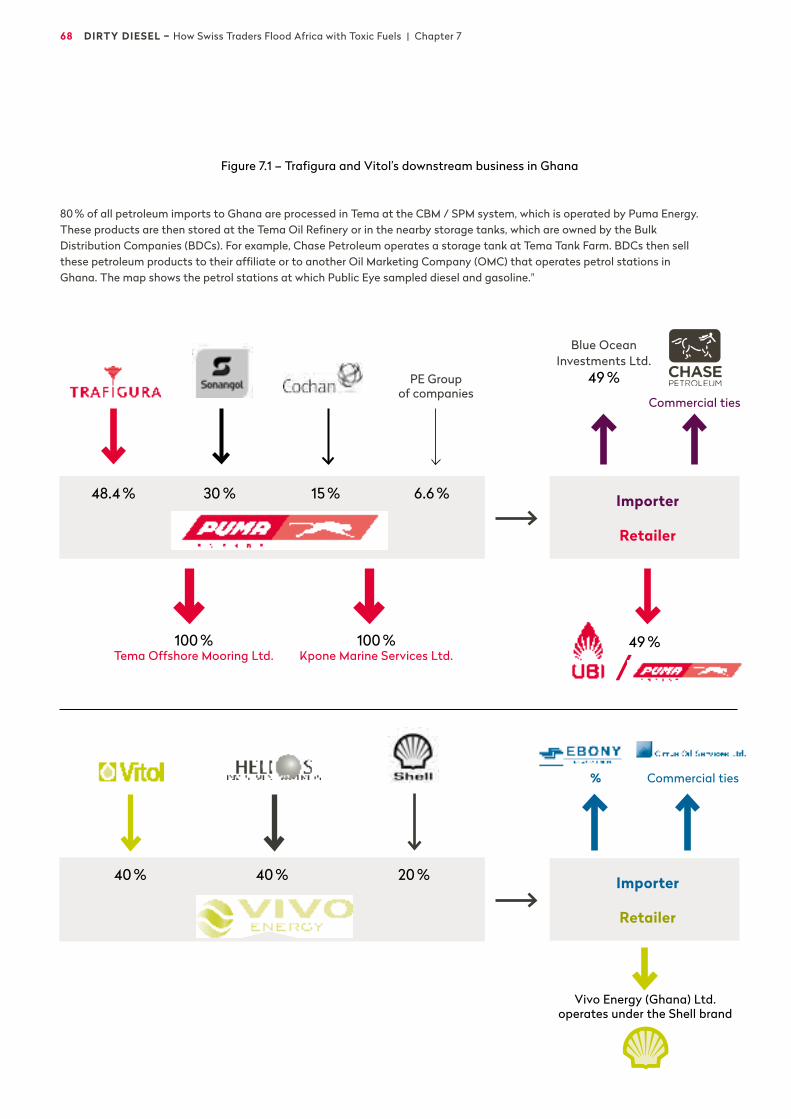
68 DIRTY DIESEL – How Swiss Traders Flood Africa with Toxic Fuels | Chapter 7
Figure 7.1 – Trafigura and Vitol’s downstream business in Ghana
100 % Tema Offshore Mooring Ltd.
Importer
Retailer
Importer
Retailer
/
Vivo Energy (Ghana) Ltd. operates under the Shell brand
PE Group of companies
Blue Ocean Investments Ltd.
49 %
Commercial ties
Commercial ties%
48.4 % 30 % 15 % 6.6 %
40 % 40 % 20 %
49 %100 % Kpone Marine Services Ltd.
80 % of all petroleum imports to Ghana are processed in Tema at the CBM / SPM system, which is operated by Puma Energy. These products are then stored at the Tema Oil Refinery or in the nearby storage tanks, which are owned by the Bulk Distribution Companies (BDCs). For example, Chase Petroleum operates a storage tank at Tema Tank Farm. BDCs then sell these petroleum products to their affiliate or to another Oil Marketing Company (OMC) that operates petrol stations in Ghana. The map shows the petrol stations at which Public Eye sampled diesel and gasoline."
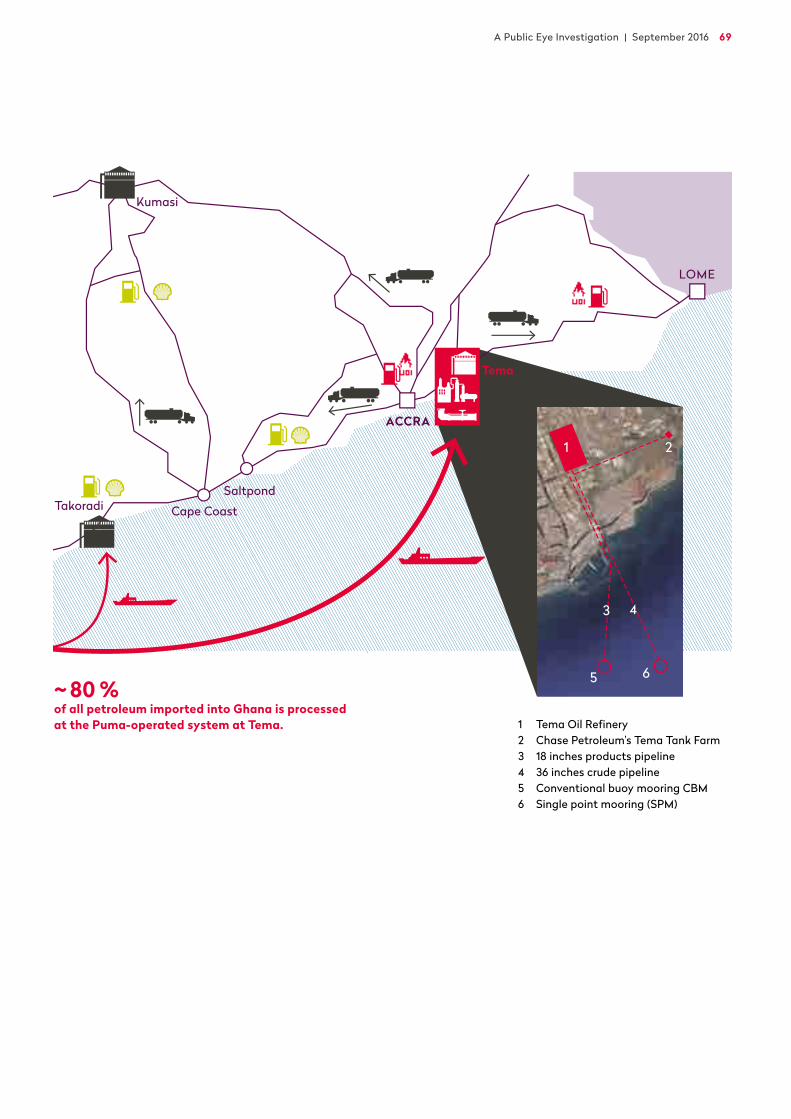
A Public Eye Investigation | September 2016 69
1 Tema Oil Refinery2 Chase Petroleum’s Tema Tank Farm3 18 inches products pipeline4 36 inches crude pipeline5 Conventional buoy mooring CBM6 Single point mooring (SPM)
~ 80 % of all petroleum imported into Ghana is processed at the Puma-operated system at Tema.
1 2
3
5 6
4
LOME
ACCRA
Cape Coast
Saltpond
Tema
Kumasi
Takoradi
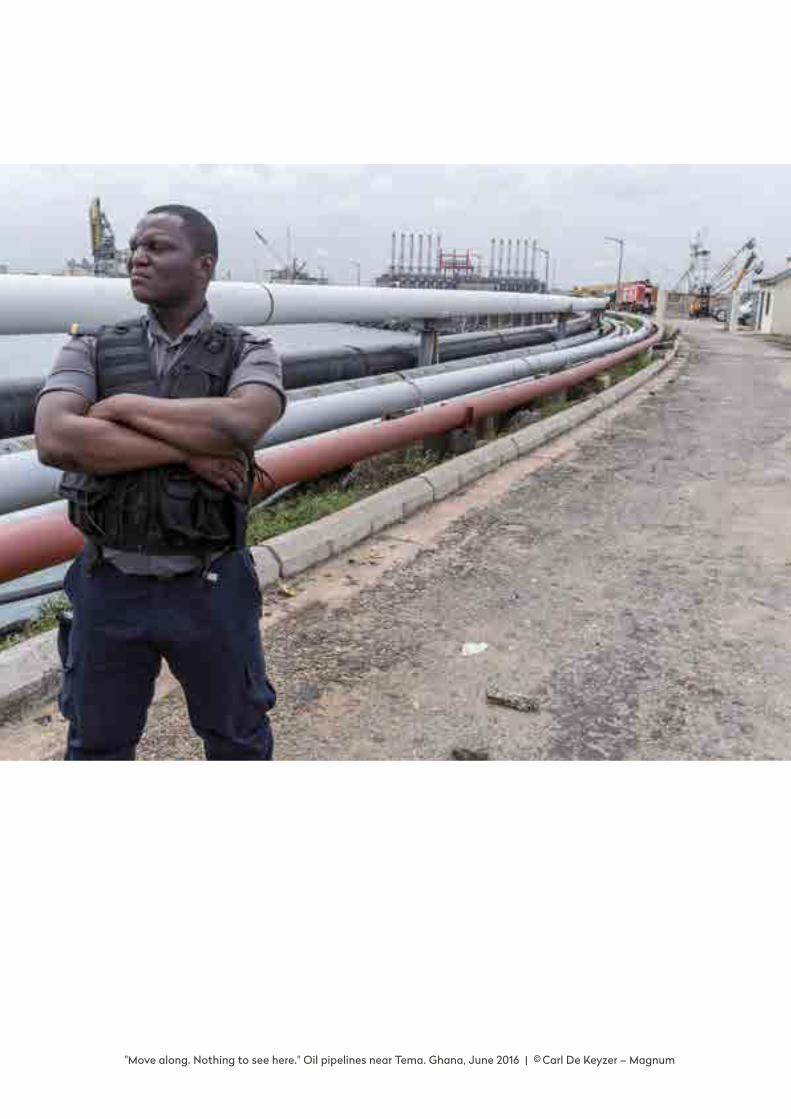
"Move along. Nothing to see here." Oil pipelines near Tema. Ghana, June 2016 | © Carl De Keyzer – Magnum
A Public Eye Investigation | September 2016 71
single point mooring system (SPM) and conventional buoy mooring system (CBM), located 7.3 km offshore. Between its in-stallation in 2006 and the end of 2015, the pipeline earned roughly US$120 million for the Swiss company, according to our conservative calculations,19 making it a lucrative business given that Trafigura invested US$68 million. An additional US$12 million was financed by the Emerging Africa Infrastruc-ture Fund, a structure that receives state funds, notably from the Swiss State Secretariat for Economic Affairs (SECO).20 Beyond the monetary aspect, the pipeline offers Trafigura a preferential insight into the Ghanaian market (see Figure 7.1). This project was originally conceived under a BOT contract (Build-Oper-ate-Transfer). Under such an agreement, the ownership of the infrastructure should return to the Ghanaian government after ten years, i.e. in August 2016.
Trafigura also imports petroleum products, initially in part-nership with Chase, one of Ghana’s bigger importers. But Tra-figura now seems to work mainly with the UBI Group, in which Puma Energy bought 49 percent in early 2014.
A few months later, the Ghanaian President himself, John Mahama, welcomed the move in a speech where he described UBI as the “only fully integrated downstream company in the oil and gas industry.” He thus confirmed Senyo K. Hosi’s analy-sis that Trafigura is the only player to have interests at every level of the supply chain.21 Founded by Salma Okonkwo, the group has a retail branch, UBI Petroleum, and an importing arm, Blue Ocean Investments. Africa Energy Intelligence described Salma Okonkwo as a “Mahama favorite” and an “excellent ally [for Trafigura] in its bid to establish a local footprint.”22 Trafigu-ra declined to comment on that specific point.
When we visited Ghana in May 2015, UBI was still operat-ing under the UBI brand. But in April 2016, Puma Energy offi-cially put its logo on a petrol station in Accra. This followed the announcement made in February 2016 by Puma’s Chief Operat-ing Officer, Christophe Zyde, confirming that he had “received approval from the NPA to change the name UBI to Puma Ener-gy. […]. You will now see the Puma Energy brand coming up in Ghana.”23 Puma Energy now claims a “retail network of over 40 stations” in the country, which should include UBI’s former portfolio, Zyde said.
Recently established, Blue Ocean only imported a small amount of kerosene in 2014.24 Over the first two quarters of 2015, however, its business increased, covering diesel, gasoline and kerosene.25 This growth could be explained by its partner-ship with Trafigura.
Finally, Puma Energy also owns Kpone Marine Service Limi ted (KMSL), which runs its own depots.26 It is unclear on Puma’s website whether Kpone or another entity owns the 62,700 metric tonnes storage it refers to.27
7.3 – THE HAZARDOUS MIX OF PETROL AND POLITICS
In Ghana, as in many other countries, the business of importing petroleum products is lucrative, strategic and politically sensi-tive. “BDCs are critical and will always be, given their role in the
economy,” states Senyo K. Hosi. They are also opaque and highly concentrated.
NPA’s former CEO, John Attafuah, recently warned about the risks of concentration: “It is very risky to allow individuals or certain groups of people to dominate the petroleum sector, which restricts competition and eventually makes Ghanaians ‘just pawns in the game’.”28 “[The NPA must] ensure that no player in the field is given an unfair advantage to the extent that it becomes a monopoly or cartels form, especially when politi-cians become the unseen hands of these industry players.” Mr Attafuah thinks his country is not far from a situation whereby “decisions are not made in the boardrooms but behind the scenes. Therefore nobody gets to know what is going on. It’s just politicians deciding what to do with the industry so that they can make money.”
Senyo K. Hosi also suspects the NPA of protecting interests and questions the need to control this market. When asked about the import process and how the NPA chooses a BDC on the basis of its quarterly lists, he says he doesn’t really under-stand: for him it is a “‘discretionary process’ […] Everybody should be able to import whatever he wants, as long as there is a demand. But it seems the NPA tries to control market shares of private players.”
According to the African Centre for Energy Policy (ACEP), conflicts of interest between politicians and companies are com-monplace in Ghana: state officials, ministers and their entourage use their influence to obtain the right to import. “We call this petro-politics,” says ACEP’s CEO, Mohamed Amin Adam.
7.4 – TEMA OIL REFINERY: AN ALL TOO COMMON FAILURE
Located in the coastal city of Tema, the Tema Oil Refinery (TOR) is Ghana’s only refinery. It has been operating since 1963 – almost fifty years before crude oil was first drilled in the country. At full capacity, TOR could provide roughly 40 per-cent of Ghana’s domestic fuel demand. But, in 2014, the state-owned company was operating at 5 percent of its capacity, pro-ducing only 3.5 percent of the country’s fuel needs.32 According to the NPA, the refinery supplied only 1.15 percent of the fuels sold in Ghana.33 After many months of almost complete shut-down, the refinery resumed its operations in early 2016.
The question of the refinery raises a mixture of embarrass-ment and mockery. During our research in Ghana, the manag-ers informed us that they were “snowed under and unavailable.” Some well-informed sources nonetheless shed light on the sit-uation: “TOR faces two main challenges,” explained a source from the NPA. “Banks don’t want to lend it money to buy crude, as it is severely indebted. And it makes losses in terms of pro-duction.” These production-related losses occur because the state-owned refinery doesn’t earn enough. Until June 2015, the country’s subsidy regime on fuels obliged it to sell products at a price set by the NPA, which led to losses. This induced a vi-cious circle: the refinery’s debt denied it from accessing suffi-cient credit to purchase crude oil, yet without crude oil it can-not produce.
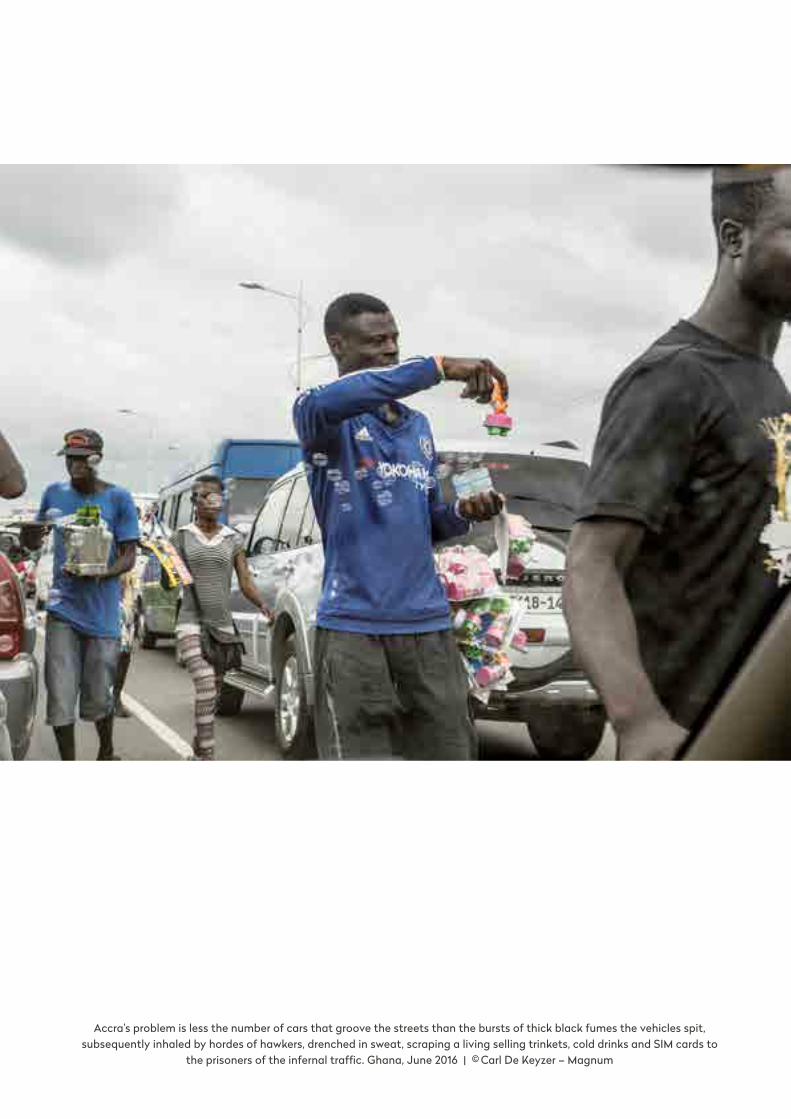
Accra’s problem is less the number of cars that groove the streets than the bursts of thick black fumes the vehicles spit, subsequently inhaled by hordes of hawkers, drenched in sweat, scraping a living selling trinkets, cold drinks and SIM cards to
the prisoners of the infernal traffic. Ghana, June 2016 | © Carl De Keyzer – Magnum
A Public Eye Investigation | September 2016 73
Unfair competition arose between the refinery and the im-porters under the subsidy regime. TOR was trapped in the vi-cious circle, while the BDCs could make substantial profits with little risk, as public funds were there to limit their foreign exchange exposure (BDCs buy products in dollars and sell them in Ghanaian cedis on the domestic market). With or with-out the subsidy, the refinery’s problems remain. As Emmanuel Quartey, former refinery worker and consultant for the African Refiners Association, puts it, “TOR is in dire need of restruc-turing and recapitalisation.” The government contemplated this option several times but never acted accordingly, although the cost would not have been more than one year of subsidies paid to importers.
Unfortunately, “there is lack of political will to resuscitate the TOR and make it functional once again,” concludes Emman-uel Appoh from Ghana’s Environment Protection Agency.
7.4.1 – TOR’S OPPONENTS
In addition to financial constraints and the lack of political will, TOR faces a major logistical issue that hinders it from re-suming operations. With the restructuring that resulted from the slow down, or total stop, in production, TOR had to lease its depots to importers. For instance, Vitol-backed Cirrus rents a diesel depot with a 42,000 MT capacity from the refinery, ac-cording to NPA data.34 BDCs are required to ensure they have permanent access to storage facilities, and so if the refinery was to reclaim its tanks for its own production, then the BDCs would risk losing their import licenses. They would also face increased competition for imports, cutting their shares of the market.
In this situation, the importers have zero interest in TOR resuming its activities. As we will see below, many are political-ly connected and therefore influential. As many in Ghana warned, there is little doubt that they would do their best to prevent the refinery from functioning.
The local press even refers to a “political sabotage” of the re-finery. The New Statesman, an opposition newspaper, highlight-ed how, since 2009 when the National Democratic Congress (NDC) took office, production at TOR has dramatically de-creased. The paper goes on to explain how the government “pro-moted” twelve new fuel importers, while TOR was forced to become simply “a fuel storage depot where private importers store their fuel in return for a modest fee.”35
7.4.2 – LESS GAS AND ELECTRICITY EQUALS MORE DIESEL
One European diplomat based in Accra has his own explana-tion: “Conflicts of interest are the rule in this country. This is particularly the case in the oil sector, whether upstream or downstream. There is no accountability.” The Ambassador said the refinery faces a similar curse to the power plants: “The elec-tric facilities are being damaged by the BDCs’ mafia so that they can import more for diesel powered generators.”
According to CITAC, the sub-Saharan Africa downstream consultant, 25 percent of national fuel oil and diesel consump-
tion is used to generate electricity.36 This means there are big interests at stake, perhaps even enough for some to sabotage infrastructure, as in Nigeria. In fact, two of Ghana’s three natu-ral gas power plants were sabotaged immediately prior to open-ing, the ambassador said. (The third is operated by a Chinese company and is operational.) The West African Gas Pipeline, through which Nigeria supplies Ghana with natural gas for power, is often sabotaged too.37 Raj Kulasingam, a power spe-cialist at Dentons in London, added that there is “pilferage and vandalism” on the transmission networks in Ghana.38 Constant power cuts have led the Ghanaians to nickname their electricity supply “dumsor”, meaning “on and off.”
As a result, those who can afford it rely on diesel-run gen-erators for their electricity. “First of all this is expensive,” ex-plained Raj Kulasingam, “diesel is 20 percent or 30 percent more expensive than most other fuels. […] Also, generators are noisy and produce a lot of smoke, entailing noise and air pol-lution.”
The ambassador refers to this situation as the “Nigerianisa-tion” of Ghana, referring to the mass fraud that plagued the for-mer’s import sector, refineries and power supply. The conse-quences of the failures of both TOR and the power sector are costly for Ghanaians, in every sense of the word.
7.5 – HIGH SULPHUR DIESEL FLOODS GHANA
Now that the Ghanaian scene is set, we examine the products, focusing on the sulphur content of diesel supplied to the coun-try by this cartel of national importers and Swiss trading com-panies.
In September 2012, UNEP and Ghanaian authorities organ-ised a workshop with the title: “Cleaner fuel for public trans-port”.39 The debate focused on the sulphur content of fuels (par-ticularly diesel) consumed in the country and their impact on public health. At the time, the sulphur limit for diesel was set at 5,000 ppm. However, resulting from a decision taken at the workshop, the standard was improved to 3,000 ppm in 2014.
The industry was represented at the workshop by the im-porters’s lobby group, the Ghanaian Chamber of Bulk Oil Dis-tributors, which claimed they import diesel with an average 1,000 – 1,500 ppm sulphur content. On the contrary, the Ghana Standard Authority (GSA), tasked with quality controls at the pump, stated that the average for all cargoes was two to three times higher, at around 3,000 ppm.
Public Eye has uncovered evidence showing that what BDCs import into Ghana and what marketers, such as Vivo En-ergy (under the Shell brand), sell at the pump is of far lower quality than what they claim. We also have evidence that they try to stay as close as possible to the limit in order to maximize profits.
During our visit to Ghana in May 2015, a source from the Ghana Standards Authority confirmed that “it’s not unusual to find up to 3,000 ppm.” A laboratory worker, wishing to remain anonymous, showed Public Eye samples taken in the second half of April 2015 at Shell’s service stations operated by Vivo Energy. The tests revealed sulphur levels of between 2,260 ppm
74 DIRTY DIESEL – How Swiss Traders Flood Africa with Toxic Fuels | Chapter 7
and 2,280 ppm, already much higher than the figures given by the BDCs.
In May 2015, we took samples in “Swiss” petrol stations, from Shell and UBI Petroleum, the Ghanaian company in which Puma Energy owns a 49 percent share. Our analyses confirm the trend. The five diesel samples show that Swiss trading companies are selling products of 2,410 ppm– 2,730 ppm to Ghanaian drivers (see chapter 6). This is just un-der the legal limit. Although we can’t draw general conclu-sions from just a few samples, our findings confirm the assessment, which Ghanaian authorities shared at a confer-ence in May 2015, that the sulphur content of imported diesel
in the first months of the year had reached an average 2,480 ppm.40 Further, Public Eye has obtained official lists of samples of sulphur levels in diesel at the moment of import, that is, when oil tankers discharge into depots. The 2013 list has 30 samples and the 2014 list has 34. These sample lists, belonging to Ghanaian authorities, show that sulphur levels are systematically high. They are certainly much higher than what the industry states.
In 2013, when the limit was set at 5,000 ppm, just two of the 30 samples collected were under 1,000 ppm. The average sul-phur content of fuels delivered reached 3,341 ppm (Figure 7.2). And one third of deliveries were over 4,000 ppm (11 cargoes).
The following year, 2014, when the maximum legal sulphur content was lowered to 3,000 ppm, the average was 2,270 ppm, while only three of the 34 samples were under 1,000 ppm (Fig-ure 7.3). Nearly half of all deliveries this year were between 2,500 ppm and 3,000 ppm.
These two years also offer an interesting view of the dynam-ics of the deliveries. They clearly demonstrate the strategy used by importers and traders. Both adapt comfortably to the stan-dards by ensuring their products have sulphur levels just within the legal limits. More positively, it also shows how rapidly change can be implemented.
It is also worth highlighting the fact that one delivery in 2013 and three in 2014 were even above the limit, meaning they could not legally be sold at the pump without further blending onshore.
Besides the details of sulphur content, the two sample lists also give the names of tankers that discharged the diesel in Ghana. With access to this information, we were able to use pri-vate industry databases, including Lloyd's List Intelligence, to find out where the cargo came from and which company char-tered the vessel.
7.6 – EUROPE SENDS WHAT IT WOULDN’T ACCEPT TO GHANA Armed with this information, we found that, during 2013 and 2014, most of Ghana’s diesel imports came from Europe. None of these cargoes could have been sold at the pump between Lis-bon and Warsaw, however, due to their high sulphur content.
We faced two main hurdles in pinning down the provenance of each vessel. First, the vessels tended to stop at some point en route for a long period (often off the coast of Lagos). This intro-duced uncertainty over the source of the cargo arriving in Gha-na. We could not always prove that the cargo came from Europe, therefore.
Second, we only had access to the year of shipment, not the date of discharge. This meant that for ships that travelled to Ghana on multiple occasions during one year, we were unable to identify the precise date of shipment.
For 2013, we therefore had to strike 9 of 30 tankers off our list, leaving us with 22 different cargo samples (multiple cargoes may come from the same ship). For 2014, we had to strike off 9 out of 34 tankers. Figure 7.4 and 7.5 (on page 76) summarise the provenance of the vessels known to have delivered diesel to Ghana in 2013 and 2014, and detail the average sulphur content for each different source.
In 2013, the 11 cargoes above 4,000 ppm came from Europe, mostly from the Amsterdam-Rotterdam-Antwerp region (ARA). In 2014, vessels came from more diverse locations, including Russia and the US Gulf. The ships often stopped en route off the coast of Lomé, Togo, where we believe the products are blended through ship-to-ship operations before reaching Ghana (see chapter 11).
These findings are backed by Dutch and Belgian export statis-tics. This data shows that, from Senegal to Angola, Ghana is the single biggest importer of high sulphur diesel (over 1,000 ppm) from the ARA region, one of the main hubs for exports of petro-leum products to West Africa (see next chapter). More than 90 percent of Ghana’s diesel imports belong to that category.
7.7 – SWISS TRADING COMPANIES SUPPLY DIRTY DIESEL
We also used the two lists of official 2013 and 2014 samples to identify the companies delivering Ghana’s dirty diesel. Again, we were faced with a number of limitations. First, the lists only refer to samples taken from depots rented by BDCs at Tema Oil Refin-ery. They therefore exclude private importers that own storage, such as Chase, Cirrus and Fueltrade, three of the largest distribu-tor companies all in partnership with Swiss trading companies. This means that private storage owners have their products tested by independent laboratories. This situation can be problematic, according to a source from the Ghana Standards Authority:
“No one knows what is going on in their storage. As private players, they conduct their own testing and no neutral person is involved. Certificates have been forged before. The importer can easily conspire with a private lab. For example, the lab can pro-vide a certificate before the product is blended with lower qual-
“It's not unusual to find up to 3,000 ppm”, confirmed a
source from the Ghana Standards Authority.
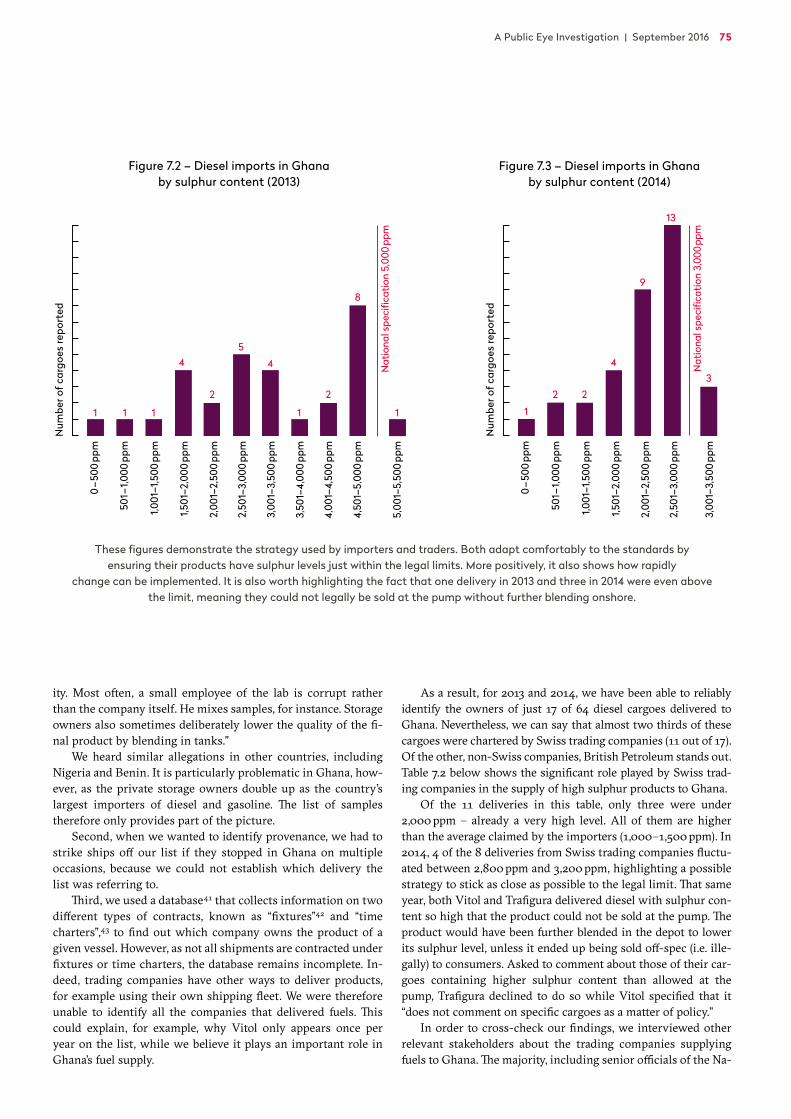
A Public Eye Investigation | September 2016 75
ity. Most often, a small employee of the lab is corrupt rather than the company itself. He mixes samples, for instance. Storage owners also sometimes deliberately lower the quality of the fi-nal product by blending in tanks.”
We heard similar allegations in other countries, including Nigeria and Benin. It is particularly problematic in Ghana, how-ever, as the private storage owners double up as the country’s largest importers of diesel and gasoline. The list of samples therefore only provides part of the picture.
Second, when we wanted to identify provenance, we had to strike ships off our list if they stopped in Ghana on multiple occasions, because we could not establish which delivery the list was referring to.
Third, we used a database41 that collects information on two different types of contracts, known as “fixtures”42 and “time charters”,43 to find out which company owns the product of a given vessel. However, as not all shipments are contracted under fixtures or time charters, the database remains incomplete. In-deed, trading companies have other ways to deliver products, for example using their own shipping fleet. We were therefore unable to identify all the companies that delivered fuels. This could explain, for example, why Vitol only appears once per year on the list, while we believe it plays an important role in Ghana’s fuel supply.
As a result, for 2013 and 2014, we have been able to reliably identify the owners of just 17 of 64 diesel cargoes delivered to Ghana. Nevertheless, we can say that almost two thirds of these cargoes were chartered by Swiss trading companies (11 out of 17). Of the other, non-Swiss companies, British Petroleum stands out. Table 7.2 below shows the significant role played by Swiss trad-ing companies in the supply of high sulphur products to Ghana.
Of the 11 deliveries in this table, only three were under 2,000 ppm – already a very high level. All of them are higher than the average claimed by the importers (1,000–1,500 ppm). In 2014, 4 of the 8 deliveries from Swiss trading companies fluctu-ated between 2,800 ppm and 3,200 ppm, highlighting a possible strategy to stick as close as possible to the legal limit. That same year, both Vitol and Trafigura delivered diesel with sulphur con-tent so high that the product could not be sold at the pump. The product would have been further blended in the depot to lower its sulphur level, unless it ended up being sold off-spec (i.e. ille-gally) to consumers. Asked to comment about those of their car-goes containing higher sulphur content than allowed at the pump, Trafigura declined to do so while Vitol specified that it “does not comment on specific cargoes as a matter of policy."
In order to cross-check our findings, we interviewed other relevant stakeholders about the trading companies supplying fuels to Ghana. The majority, including senior officials of the Na-
Figure 7.2 – Diesel imports in Ghana by sulphur content (2013)
These figures demonstrate the strategy used by importers and traders. Both adapt comfortably to the standards by ensuring their products have sulphur levels just within the legal limits. More positively, it also shows how rapidly
change can be implemented. It is also worth highlighting the fact that one delivery in 2013 and three in 2014 were even above the limit, meaning they could not legally be sold at the pump without further blending onshore.
Figure 7.3 – Diesel imports in Ghana by sulphur content (2014)
Euro
pe
US
& C
anad
a
Russ
ia &
Cas
pian
Asi
a-Pa
cific
Lati
n A
mer
ica
Mid
dle
East
Afr
ica
max
. ppm
sul
phur
in d
iese
l
2000
1800
1600
1400
1200
1000
800
600
400
200
0
Inde
pend
ent
Trad
ers
Oth
er C
ompa
nies
Regi
onal
Oil
Com
pani
es
Tota
l
Ang
lo-S
axon
Maj
ors
10 %
5 %
0 %
–5 %
–10 %
–15 %
–20 %
–25 %
51–500 ppm20 %
501–1500 ppm12%
1501–2500 ppm24 %
2501–3500 ppm40 %
> 3500 ppm4%
Africa 61 %
Gibraltar 12 %
Europe 20 %
America 6 %Asia 1%
11–50 ppm27%
51–150 ppm27%
151–250 ppm14 %
251–350 ppm27%
> 350 ppm5%
EU average (≤ 29 %v) 27 %
EU limit (>29 and ≤ 35%v)32 %
over EU limit (> 35 %v)41 %
0–5
00 p
pm
1 1 1 1 1
4 43
9
13
2 2
1
2 2
5
8
4
501–
1,000
ppm
1,001
–1,5
00 p
pm
1,501
–2,0
00 p
pm
2,00
1–2,
500
ppm
2,50
1–3,
000
ppm
3,00
1–3,
500
ppm
3,50
1–4,
000
ppm
4,00
1–4,
500
ppm
4,50
1–5,
000
ppm
5,00
1–5,
500
ppm
Num
ber o
f car
goes
repo
rted
Nat
iona
l spe
cific
atio
n 5,
000
ppm
0–5
00 p
pm
Num
ber o
f car
goes
repo
rted
Nat
iona
l spe
cific
atio
n 3,
000 p
pm
501–
1,000
ppm
1,001
–1,5
00 p
pm
1,501
–2,0
00 p
pm
2,00
1–2,
500
ppm
2,50
1–3,
000
ppm
3,00
1–3,
500
ppm

76 DIRTY DIESEL – How Swiss Traders Flood Africa with Toxic Fuels | Chapter 7
SLOVAKIA
ARA
Augusta
Tema
Diesel provenance to Ghana 2013
13 tankersav. 3,578 ppm
1 tanker3,010 ppm 7 tankers
av. 3,401 ppmLagos
SLOVAKIA
ARA
Tema
Port de Bouc
Diesel provenance to Ghana 2014
2,492 ppm
8 tankersav. 2,386 ppmLagos
Immingham
Lake Charles
4 tankersav. 2,304 ppm
1 tanker822 ppm
Port de Bouc
1 tanker1,760 ppm
10 tankersav. 2,593 ppm
1 tanker2,130 ppm
SLOVAKIA
ARA
Augusta
Tema
Diesel provenance to Ghana 2013
13 tankersav. 3,578 ppm
1 tanker3,010 ppm 7 tankers
av. 3,401 ppmLagos
SLOVAKIA
ARA
Tema
Port de Bouc
Diesel provenance to Ghana 2014
2,492 ppm
8 tankersav. 2,386 ppmLagos
Immingham
Lake Charles
4 tankersav. 2,304 ppm
1 tanker822 ppm
Port de Bouc
1 tanker1,760 ppm
10 tankersav. 2,593 ppm
1 tanker2,130 ppm
Figure 7.4 – Provenance of diesel entering Ghana (2013)
Figure 7.5 – Provenance of diesel entering Ghana (2014)
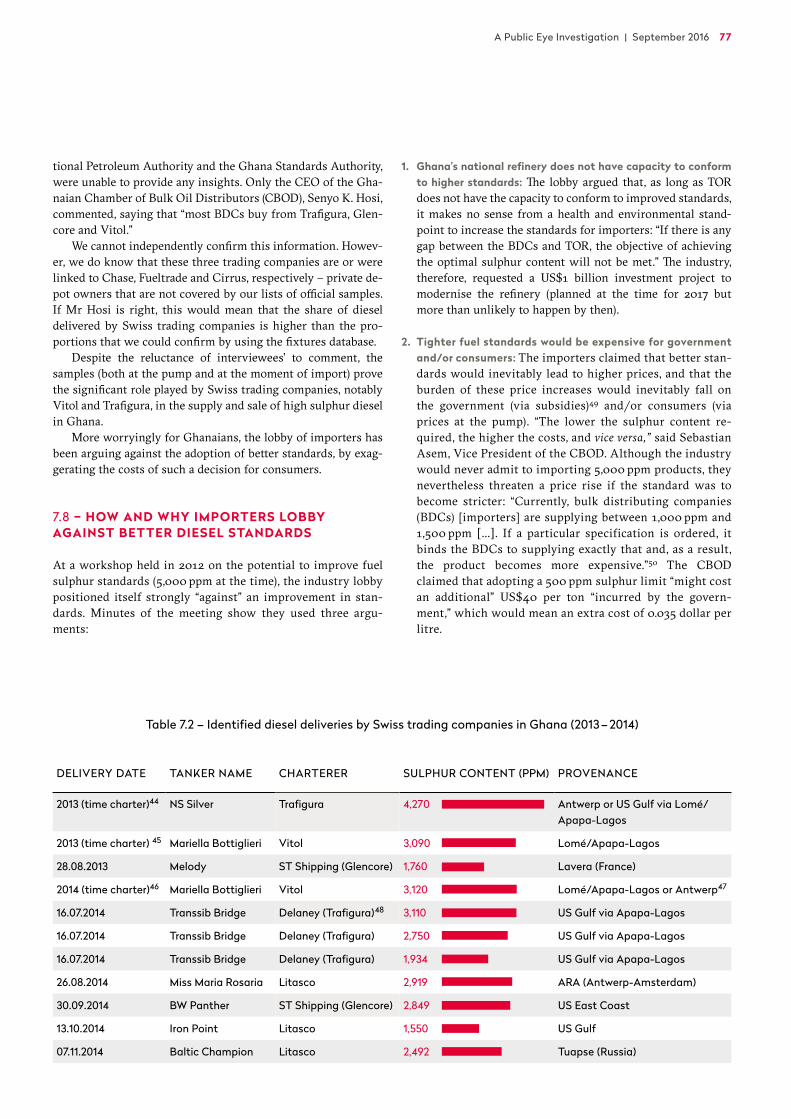
A Public Eye Investigation | September 2016 77
tional Petroleum Authority and the Ghana Standards Authority, were unable to provide any insights. Only the CEO of the Gha-naian Chamber of Bulk Oil Distributors (CBOD), Senyo K. Hosi, commented, saying that “most BDCs buy from Trafigura, Glen-core and Vitol.”
We cannot independently confirm this information. Howev-er, we do know that these three trading companies are or were linked to Chase, Fueltrade and Cirrus, respectively – private de-pot owners that are not covered by our lists of official samples. If Mr Hosi is right, this would mean that the share of diesel delivered by Swiss trading companies is higher than the pro-portions that we could confirm by using the fixtures database.
Despite the reluctance of interviewees’ to comment, the samples (both at the pump and at the moment of import) prove the significant role played by Swiss trading companies, notably Vitol and Trafigura, in the supply and sale of high sulphur diesel in Ghana.
More worryingly for Ghanaians, the lobby of importers has been arguing against the adoption of better standards, by exag-gerating the costs of such a decision for consumers.
7.8 – HOW AND WHY IMPORTERS LOBBY AGAINST BETTER DIESEL STANDARDS
At a workshop held in 2012 on the potential to improve fuel sulphur standards (5,000 ppm at the time), the industry lobby positioned itself strongly “against” an improvement in stan-dards. Minutes of the meeting show they used three argu-ments:
1. Ghana’s national refinery does not have capacity to conform to higher standards: The lobby argued that, as long as TOR does not have the capacity to conform to improved standards, it makes no sense from a health and environmental stand-point to increase the standards for importers: “If there is any gap between the BDCs and TOR, the objective of achieving the optimal sulphur content will not be met.” The industry, therefore, requested a US$1 billion investment project to modernise the refinery (planned at the time for 2017 but more than unlikely to happen by then).
2. Tighter fuel standards would be expensive for government and/or consumers: The importers claimed that better stan-dards would inevitably lead to higher prices, and that the burden of these price increases would inevitably fall on the government (via subsidies)49 and/or consumers (via prices at the pump). “The lower the sulphur content re-quired, the higher the costs, and vice versa,” said Sebastian Asem, Vice President of the CBOD. Although the industry would never admit to importing 5,000 ppm products, they nevertheless threaten a price rise if the standard was to become stricter: “Currently, bulk distributing companies (BDCs) [importers] are supplying between 1,000 ppm and 1,500 ppm […]. If a particular specification is ordered, it binds the BDCs to supplying exactly that and, as a result, the product becomes more expensive.”50 The CBOD claimed that adopting a 500 ppm sulphur limit “might cost an additional” US$40 per ton “incurred by the govern-ment,” which would mean an extra cost of 0.035 dollar per litre.
Table 7.2 – Identified diesel deliveries by Swiss trading companies in Ghana (2013 – 2014)
DELIVERY DATE TANKER NAME CHARTERER SULPHUR CONTENT (PPM) PROVENANCE
2013 (time charter)44 NS Silver Trafigura 4,270 Antwerp or US Gulf via Lomé/Apapa-Lagos
2013 (time charter) 45 Mariella Bottiglieri Vitol 3,090 Lomé/Apapa-Lagos
28.08.2013 Melody ST Shipping (Glencore) 1,760 Lavera (France)
2014 (time charter)46 Mariella Bottiglieri Vitol 3,120 Lomé/Apapa-Lagos or Antwerp47
16.07.2014 Transsib Bridge Delaney (Trafigura)48 3,110 US Gulf via Apapa-Lagos
16.07.2014 Transsib Bridge Delaney (Trafigura) 2,750 US Gulf via Apapa-Lagos
16.07.2014 Transsib Bridge Delaney (Trafigura) 1,934 US Gulf via Apapa-Lagos
26.08.2014 Miss Maria Rosaria Litasco 2,919 ARA (Antwerp-Amsterdam)
30.09.2014 BW Panther ST Shipping (Glencore) 2,849 US East Coast
13.10.2014 Iron Point Litasco 1,550 US Gulf
07.11.2014 Baltic Champion Litasco 2,492 Tuapse (Russia)
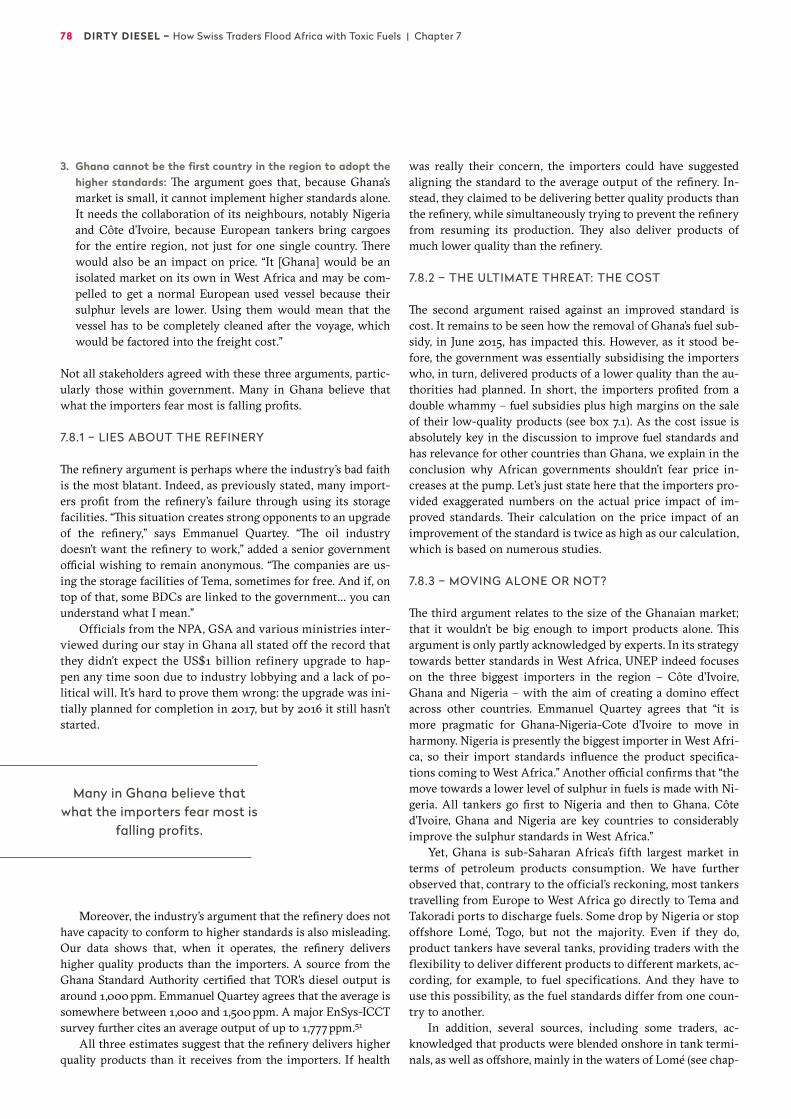
78 DIRTY DIESEL – How Swiss Traders Flood Africa with Toxic Fuels | Chapter 7
3. Ghana cannot be the first country in the region to adopt the higher standards: The argument goes that, because Ghana’s market is small, it cannot implement higher standards alone. It needs the collaboration of its neighbours, notably Nigeria and Côte d’Ivoire, because European tankers bring cargoes for the entire region, not just for one single country. There would also be an impact on price. “It [Ghana] would be an isolated market on its own in West Africa and may be com-pelled to get a normal European used vessel because their sulphur levels are lower. Using them would mean that the vessel has to be completely cleaned after the voyage, which would be factored into the freight cost.”
Not all stakeholders agreed with these three arguments, partic-ularly those within government. Many in Ghana believe that what the importers fear most is falling profits.
7.8.1 – LIES ABOUT THE REFINERY
The refinery argument is perhaps where the industry’s bad faith is the most blatant. Indeed, as previously stated, many import-ers profit from the refinery’s failure through using its storage facilities. “This situation creates strong opponents to an upgrade of the refinery,” says Emmanuel Quartey. “The oil industry doesn’t want the refinery to work,” added a senior government official wishing to remain anonymous. “The companies are us-ing the storage facilities of Tema, sometimes for free. And if, on top of that, some BDCs are linked to the government… you can understand what I mean.”
Officials from the NPA, GSA and various ministries inter-viewed during our stay in Ghana all stated off the record that they didn’t expect the US$1 billion refinery upgrade to hap-pen any time soon due to industry lobbying and a lack of po-litical will. It’s hard to prove them wrong: the upgrade was ini-tially planned for completion in 2017, but by 2016 it still hasn’t started.
Moreover, the industry’s argument that the refinery does not have capacity to conform to higher standards is also misleading. Our data shows that, when it operates, the refinery delivers higher quality products than the importers. A source from the Ghana Standard Authority certified that TOR’s diesel output is around 1,000 ppm. Emmanuel Quartey agrees that the average is somewhere between 1,000 and 1,500 ppm. A major EnSys-ICCT survey further cites an average output of up to 1,777 ppm.51
All three estimates suggest that the refinery delivers higher quality products than it receives from the importers. If health
was really their concern, the importers could have suggested aligning the standard to the average output of the refinery. In-stead, they claimed to be delivering better quality products than the refinery, while simultaneously trying to prevent the refinery from resuming its production. They also deliver products of much lower quality than the refinery.
7.8.2 – THE ULTIMATE THREAT: THE COST
The second argument raised against an improved standard is cost. It remains to be seen how the removal of Ghana’s fuel sub-sidy, in June 2015, has impacted this. However, as it stood be-fore, the government was essentially subsidising the importers who, in turn, delivered products of a lower quality than the au-thorities had planned. In short, the importers profited from a double whammy – fuel subsidies plus high margins on the sale of their low-quality products (see box 7.1). As the cost issue is absolutely key in the discussion to improve fuel standards and has relevance for other countries than Ghana, we explain in the conclusion why African governments shouldn’t fear price in-creases at the pump. Let’s just state here that the importers pro-vided exaggerated numbers on the actual price impact of im-proved standards. Their calculation on the price impact of an improvement of the standard is twice as high as our calculation, which is based on numerous studies.
7.8.3 – MOVING ALONE OR NOT?
The third argument relates to the size of the Ghanaian market; that it wouldn’t be big enough to import products alone. This argument is only partly acknowledged by experts. In its strategy towards better standards in West Africa, UNEP indeed focuses on the three biggest importers in the region – Côte d’Ivoire, Ghana and Nigeria – with the aim of creating a domino effect across other countries. Emmanuel Quartey agrees that “it is more pragmatic for Ghana-Nigeria-Cote d’Ivoire to move in harmony. Nigeria is presently the biggest importer in West Afri-ca, so their import standards influence the product specifica-tions coming to West Africa.” Another official confirms that “the move towards a lower level of sulphur in fuels is made with Ni-geria. All tankers go first to Nigeria and then to Ghana. Côte d’Ivoire, Ghana and Nigeria are key countries to considerably improve the sulphur standards in West Africa.”
Yet, Ghana is sub-Saharan Africa’s fifth largest market in terms of petroleum products consumption. We have further observed that, contrary to the official’s reckoning, most tankers travelling from Europe to West Africa go directly to Tema and Takoradi ports to discharge fuels. Some drop by Nigeria or stop offshore Lomé, Togo, but not the majority. Even if they do, product tankers have several tanks, providing traders with the flexibility to deliver different products to different markets, ac-cording, for example, to fuel specifications. And they have to use this possibility, as the fuel standards differ from one coun-try to another.
In addition, several sources, including some traders, ac-knowledged that products were blended onshore in tank termi-nals, as well as offshore, mainly in the waters of Lomé (see chap-
Many in Ghana believe that what the importers fear most is
falling profits.
A Public Eye Investigation | September 2016 79
ter 11). As we have seen, trading companies already supply products according to different existing standards across West Africa, so they could easily blend to meet a stricter standard in Ghana, as they do elsewhere. But they don’t do this, because they make more profit by purchasing and blending the cheaper blendstocks (see chapter 10).
These profits are earned “by compromising the health of the population of Ghana,” according to Dr Reginald Quansah of the University of Ghana’s School of Public Health. “The BDCs are
putting the lives of many at risk, but I am not surprised – they do what they need to do to make profits. It’s the same with the tobacco industry – they lobbied hard against a ban in public places,” says Dr Kwaku Poku Asante, Head of Research at Kintampo Health Research Centre.
Emmanuel Quartey summarizes it nicely: “If we don’t move on standards, we will remain the dumping place for bad Euro-pean products.” This situation suits the import lobby, which does everything it can to maintain the status quo.
Box 7.1 – HOW THE IMPORTERS UNDULY BENEFITED FROM SUBSIDIES
In June 2015, Ghana’s government put an end to a controver-sial subsidy regime for diesel and gasoline importers. Consequently, world prices now drive prices at the local pump.
Prior to the market deregulation, importers had received subsidies to supply fuels at a price set every two weeks by the National Petroleum Authority. The NPA calculated a profit margin for the distributors, that is, the service stations (OMCs). The OMCs are supplied by importers (BDCs), also at a fixed price calculated according to import costs (freight, credit, insurance, etc.) plus a profit margin. This margin, however, was highly theoretical, as “nobody knows at what price the BDC buys from international trading companies,” explained Abass Ibrahim Tasunti, Pricing Officer at the NPA.
The pricing mechanism for petroleum on which the subsidy was based “has always been shrouded in secrecy and technical jargon,” confirms Imani, a policy and education centre.52 The formula was supposed to take into account various parameters, including the crude oil price, exchange rate and weather conditions (freight cost). However, without the information essential for calculating an ade-quate profit margin, the NPA relied on a benchmark price. The benchmark price for diesel, for example, was calculated based on a cargo with a sulphur level of 1,000 ppm.53 For gasoline, the benchmark was calculated for 10 ppm products.
“Such a system is great when prices fall. You can earn a lot of money as an importer,” explained a government source. This perhaps explains why, when prices started to collapse in summer 2014, the importers suddenly shifted their position towards maintaining the subsidy regime.
Just like the TOR issue, raising the topic of the subsidies in Ghana generates silence and embarrassment. In the words of an NPA official, “the [amount of the] subsidy is not a secret, but it’s not public either.” For a simple reason: over the past years, the subsidy has been systematically higher than the government budgeted. The Minister of Finance himself noted that, in 2012, the subsidy reached 389 million Ghanaian cedis (GH¢) instead of 50 million – 7.5 times more than planned.54 In 2014, it overran by GH¢277 million. In March 2015, the press quoted Senyo K. Hosi stating that Ghana has spent US$1.8 billion in subsidies over the last four years.55
While the subsidies drained the public treasury, the BDCs benefited from them systemically delivering lower quality products than planned (<1,000 ppm). Indeed, our findings revealed sulphur levels in diesel that were on average much higher than 1,000 ppm both at the moment of import and at the pump. The price calculated by the government to subsi-dise the importers therefore didn’t correspond with the quality of products imported. In a totally legal manner, as they were respecting Ghana’s national standards, the importers profited from a system to the detriment of the government (public finances) and the consumers, not to mention Ghanaian health.
Moreover, all major importers benefited (and still benefit) from partnerships with the international traders, which we assume granted them discounts over the products they buy in the form of term contracts. The subsidies were therefore granted according to higher costs than truly incurred by the importers.
Given their market share, Switzerland-linked importers, such as Chase (Trafigura), Cirrus (Vitol) and Fueltrade (Glencore), can be considered as the main beneficiaries of this scheme.
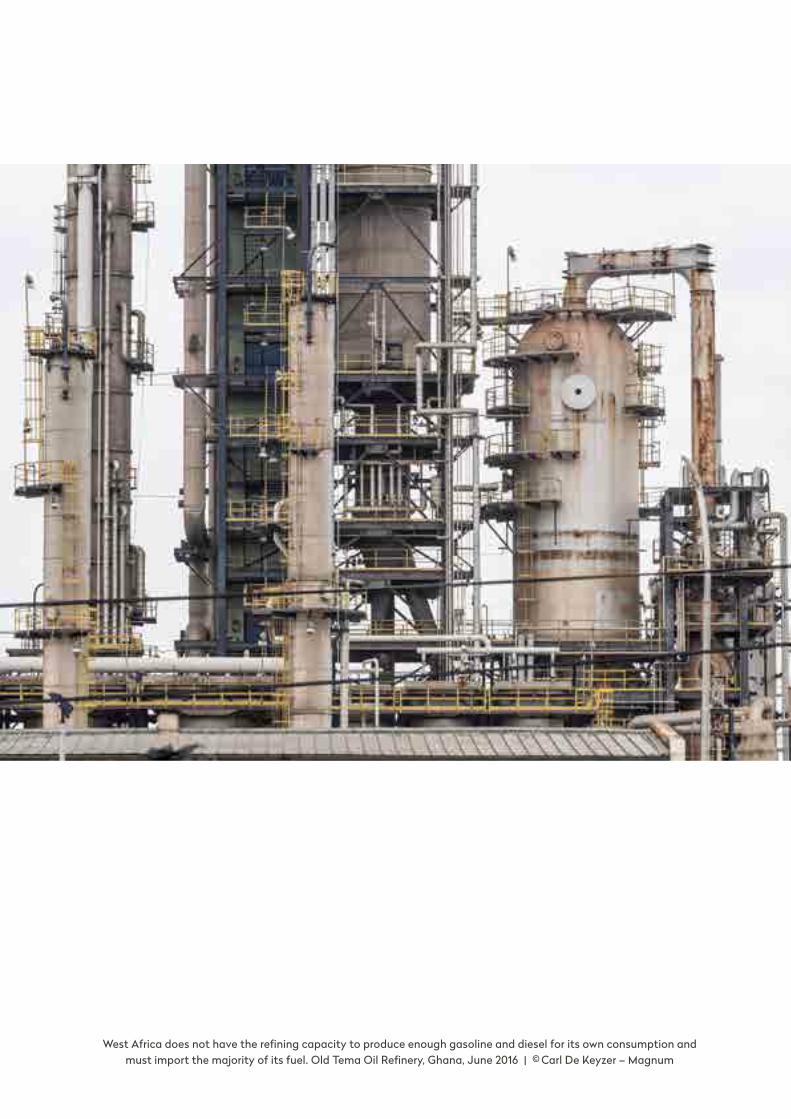
West Africa does not have the refining capacity to produce enough gasoline and diesel for its own consumption and must import the majority of its fuel. Old Tema Oil Refinery, Ghana, June 2016 | © Carl De Keyzer – Magnum
A Public Eye Investigation | September 2016 81
8
Dirty trade flows from Europe
to West Africa
West Africa exports mostly high-quality (low sulphur) “sweet” crude. In return, it imports low-quality (high sulphur) diesel and gasoline.
Swiss trading companies play a major role in transporting fuel from the Amsterdam- Rotterdam-Antwerp (ARA) and US Gulf regions, West Africa’s two main supply hubs.
Around 50 percent of fuel imported to West Africa comes from the ARA region. Some 90 percent of the diesel has sulphur content at least 100 times above the European standard.
82 DIRTY DIESEL – How Swiss Traders Flood Africa with Toxic Fuels | Chapter 8
West Africa produces a significant amount of crude oil, but most of this crude is exported. In 2014, the continent’s biggest producer, Nigeria, only refined 3 percent of its production.1 The rest was sent abroad, mostly (87.5 percent) outside of Africa. Ni-geria’s four refineries have hardly ever been able to satisfy do-mestic demand. And this is true for all other significant oil-pro-ducing countries in the region except Côte d’Ivoire (see box 8.1). So while West Africa is a net exporter of crude oil, it must im-port petroleum products such as gasoline and diesel.
In fact, no other region of the world has such a crooked ratio between exports of crude oil and imports of petroleum prod-ucts. In 2014, the region exported 213.9 million tonnes of crude oil (while importing 0.2 million tonnes of crude oil) and import-ed 18.6 million tonnes of products (while exporting 6.5 million tonnes).2 In other words, West Africa produces more than enough crude oil to satisfy domestic demand for fuel.
The paradox worsens further when one considers the quality of the crude exported and fuels received. With some exceptions, West African countries provide some of the best grades of crude, known as “sweet” due to their low sulphur content. Nige-rian Bonny Light has one of the lowest sulphur content of all crudes (0.15 percent). Even with a simple refinery one can get a higher amount of ultra-low sulphur diesel (10 ppm) than from other grades of crude.3 In 2014, Europe received 45.82 percent of Nigeria’s exports. The Netherlands alone bought 13 percent of Nigeria’s total exports. The country’s Bonny Light in partic-
ular went mainly to Europe, according to an analyst from Platts.
So what does West Africa get in return? Analysis of the samples we took from fuel pumps in eight African countries showed high levels of sulphur and other toxic substances. Our Ghana case study showed that these fuels were supplied by for-eign companies, mainly Swiss trading companies, who trans-ported them from places around the world such as Europe and the United States. These fuels may have been produced in such countries, but their very high sulphur content meant they could not be sold at the pump in these same countries. But to what extent is Ghana an exception?
As it turns out, Ghana is typical. It is just one example of the rule that Africa gets the dirtiest fuels. And these dirty fu-els are imported from the very same region that receives Afri-ca’s high-quality crude in return. Trade statistics leave no room for doubt. Two main regions supply West Africa with fuels: the so-called ARA zone (Amsterdam, Rotterdam, Ant-werp), and the US Gulf, the region around Houston. Other countries such as France, Italy, the United Kingdom, Russia, and even South Korea also export petroleum products regular-ly to West Africa, but we focus on these two major logistical hubs because of their dominant position as exporters of high sulphur fuels to West Africa. As we will see, these fuels could not be sold at the pump in the United States, Belgium or the Netherlands.
Box 8.1 – AFRICAN REFINERIES CAN’T KEEP UP WITH THE GROWING DEMAND
Africa’s rapid economic growth is increasing fuel demand, which is expected to double between 2000 and 2020. More specifically, and perhaps more worrying, the gap between this demand and the output from African refineries is growing exponentially. This means the region, and especially West Africa, will rely more and more on imports to satisfy its domestic demand. In West Africa, the volume of imported petroleum products has already overtaken the output of refineries.
Almost all of West Africa’s 11 existing refineries – many with outdated and inefficient technology – operate far below capacity.4 Several have been looking for investors to upgrade their plants and desulphurisation capacity, but these efforts remain in vain. While the global average for refinery utilisation was 79.6 percent in 2014, in Africa it remained at 63 percent.5 As domestic fuel demand grows rapidly in Africa – primary energy consumption grew by 2.8 percent in 2014, above the ten-year average of 2.6 percent per annum6 – the continent’s refineries cannot keep up. This is not going to change in the near future. As Reuters wrote
in 2013, “Africa’s efforts to supply more of its booming demand for fuel are being dashed by fierce competition from foreign oil refiners and traders flooding the US$80 billion market with imports.” Robert Turner, a director at Pricewater-house Coopers, adds that “the constant challenge [for African refineries] is competing with imports, with many global players being long in products and seeking outlets in Africa.” 7
“Competition to supply Africa is only going to increase,” commented Rolake Akinkugbe, Ecobank’s Head of Oil and Gas Research. “Even if three projects get built, there is no way they can keep up with the demand growth.” Akinkugbe further notes that, over the last decade, only 7 out of 90 refinery projects in Africa were completed. Similarly, the UK-based consultancy CITAC estimates that of a planned 1.1 million barrels per day of new African refining capacity, only about one third (400,000 bpd) will be built. David Bleasdale, Executive Director for CITAC Africa, said their “view is that growing African demand will by and large be met by imports.”8
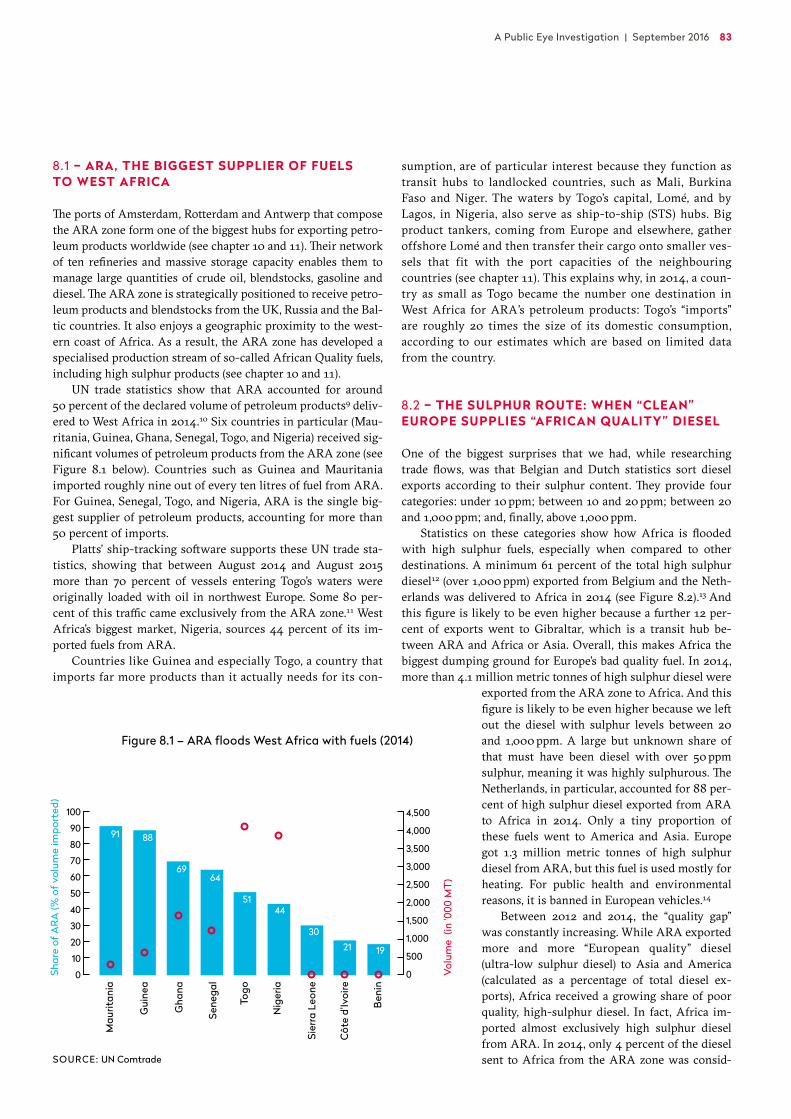
A Public Eye Investigation | September 2016 83
8.1 – ARA, THE BIGGEST SUPPLIER OF FUELS TO WEST AFRICA
The ports of Amsterdam, Rotterdam and Antwerp that compose the ARA zone form one of the biggest hubs for exporting petro-leum products worldwide (see chapter 10 and 11). Their network of ten refineries and massive storage capacity enables them to manage large quantities of crude oil, blendstocks, gasoline and diesel. The ARA zone is strategically positioned to receive petro-leum products and blendstocks from the UK, Russia and the Bal-tic countries. It also enjoys a geographic proximity to the west-ern coast of Africa. As a result, the ARA zone has developed a specialised production stream of so-called African Quality fuels, including high sulphur products (see chapter 10 and 11).
UN trade statistics show that ARA accounted for around 50 percent of the declared volume of petroleum products9 deliv-ered to West Africa in 2014.10 Six countries in particular (Mau-ritania, Guinea, Ghana, Senegal, Togo, and Nigeria) received sig-nificant volumes of petroleum products from the ARA zone (see Figure 8.1 below). Countries such as Guinea and Mauritania imported roughly nine out of every ten litres of fuel from ARA. For Guinea, Senegal, Togo, and Nigeria, ARA is the single big-gest supplier of petroleum products, accounting for more than 50 percent of imports.
Platts’ ship-tracking software supports these UN trade sta-tistics, showing that between August 2014 and August 2015 more than 70 percent of vessels entering Togo’s waters were originally loaded with oil in northwest Europe. Some 80 per-cent of this traffic came exclusively from the ARA zone.11 West Africa’s biggest market, Nigeria, sources 44 percent of its im-ported fuels from ARA.
Countries like Guinea and especially Togo, a country that imports far more products than it actually needs for its con-
sumption, are of particular interest because they function as transit hubs to landlocked countries, such as Mali, Burkina Faso and Niger. The waters by Togo’s capital, Lomé, and by Lagos, in Nigeria, also serve as ship-to-ship (STS) hubs. Big product tankers, coming from Europe and elsewhere, gather offshore Lomé and then transfer their cargo onto smaller ves-sels that fit with the port capacities of the neighbouring countries (see chapter 11). This explains why, in 2014, a coun-try as small as Togo became the number one destination in West Africa for ARA’s petroleum products: Togo’s “imports” are roughly 20 times the size of its domestic consumption, according to our estimates which are based on limited data from the country.
8.2 – THE SULPHUR ROUTE: WHEN “CLEAN” EUROPE SUPPLIES “AFRICAN QUALITY” DIESEL
One of the biggest surprises that we had, while researching trade flows, was that Belgian and Dutch statistics sort diesel exports according to their sulphur content. They provide four categories: under 10 ppm; between 10 and 20 ppm; between 20 and 1,000 ppm; and, finally, above 1,000 ppm.
Statistics on these categories show how Africa is flooded with high sulphur fuels, especially when compared to other destinations. A minimum 61 percent of the total high sulphur diesel12 (over 1,000 ppm) exported from Belgium and the Neth-erlands was delivered to Africa in 2014 (see Figure 8.2).13 And this figure is likely to be even higher because a further 12 per-cent of exports went to Gibraltar, which is a transit hub be-tween ARA and Africa or Asia. Overall, this makes Africa the biggest dumping ground for Europe’s bad quality fuel. In 2014, more than 4.1 million metric tonnes of high sulphur diesel were
exported from the ARA zone to Africa. And this figure is likely to be even higher because we left out the diesel with sulphur levels between 20 and 1,000 ppm. A large but unknown share of that must have been diesel with over 50 ppm sulphur, meaning it was highly sulphurous. The Netherlands, in particular, accounted for 88 per-cent of high sulphur diesel exported from ARA to Africa in 2014. Only a tiny proportion of these fuels went to America and Asia. Europe got 1.3 million metric tonnes of high sulphur diesel from ARA, but this fuel is used mostly for heating. For public health and environmental reasons, it is banned in European vehicles.14
Between 2012 and 2014, the “quality gap” was constantly increasing. While ARA exported more and more “European quality” diesel (ultra-low sulphur diesel) to Asia and America (calculated as a percentage of total diesel ex-ports), Africa received a growing share of poor quality, high-sulphur diesel. In fact, Africa im-ported almost exclusively high sulphur diesel from ARA. In 2014, only 4 percent of the diesel sent to Africa from the ARA zone was consid-
0–50
0
501–
1000
1001
–150
0
1501
–200
0
2001
–250
0
2501
–300
0
3001
–350
0
3501
–400
0
4001
–450
0
4501
–500
0
5001
–550
0
Num
ber o
f car
goes
repo
rted
ppm
8
7
6
5
4
3
2
1
0
Diesel imports in Ghana by sulphur content (2013)
0–50
0
501–
1000
1001
–150
0
1501
–200
0
2001
–250
0
2501
–300
0
3001
–350
0
Num
ber o
f car
goes
repo
rted
13
12
11
10
9
8
7
6
5
4
3
2
1
0
Diesel imports in Ghana by sulphur content (2014)
ppm
Sier
ra L
eone
Gui
nea
Ben
in
Côt
e d’
Ivoi
re
Togo
Gha
na
Nig
eria
Shar
e (%
of v
olum
e)
Sene
gal
Con
go
100
90
80
70
60
50
40
30
20
10
0 Volu
me
expo
rted
(in
'000
MT
)
900
800
700
600
500
400
300
200
100
0
Share of high sulphur (> 1000 ppm) diesel in total diesel exports from ARA to West Africa (2014)
100 100 100 10096 93
8482
45
Sier
ra L
eone
Gui
nea
Côt
e d’
Ivoi
re
Ben
in
Gha
na
Nig
eria
Togo
Shar
e of
ARA
(% o
f vol
ume
impo
rted
)
Sene
gal
Mau
ritan
ia
100
90
80
70
60
50
40
30
20
10
0 Volu
me
(in
'000
MT
)
4,500
4,000
3,500
3,000
2,500
2,000
1,500
1,000
500
0
ARA floods West Africa with fuels (2014)
Share volume of “known” voyages from ARA to West Africa by trading companies (2014)
91 88
6964
5144
3021 19
CNR 14%
Irving 1%Valeska 1%
Talaveras 3%
Noble 4%
Total 7%
BP Amoco 9%
Swiss traders61%
Litasco 20 %
Glencore (ST Shipping) 11%
Addax and Oryx (Nyala) 9 %
Sahara Energy 7 %
Trafigura (Delaney) 5 %Mercuria 4 %Trafigura 2 %Gunvor (Clearlake) 2 %Orion 1 %
Share volume of “known” voyages from ARA to West Africa by trading companies (2014)
Charterer not reported 14 %
Irving 1 %Valeska 1 %
Talaveras 3 %
Noble 4 %
Total 7 %
BP Amoco 9 %
Swiss traders61 %
Litasco 20 %
Glencore (ST Shipping) 11 %
Addax and Oryx (Nyala) 9 %
Sahara Energy 7 %
Trafigura (Delaney) 5 %Mercuria 4 %Trafigura 2 %Gunvor (Clearlake) 2 %Orion 1 %
<10 ppm 10–20 ppm 20– 1,000 ppm >1,000 ppm
Shar
e vo
lum
e (%
)
sulphur content (ppm)
80
70
60
50
40
30
20
10
0
Lago
s (2
011)
Dak
ar (2
013)
Acc
ra (2
008)
Joha
nnes
burg
(201
1)
New
Del
hi (2
012)
Bei
jing
(201
3)
Car
acas
(201
2)
Ban
gkok
(201
4)
Rott
erda
m (2
013)
Paris
(201
4)
Lond
on (2
013)
Zuric
h (2
013)
Was
hing
ton
(201
4)
µg/m
3
350
300
250
200
150
100
50
0
PM10 level of African cities compared to cities in other world regions
Africa Asia Americas Europe
4 3
22
46
59
16
42
2230
80
3632
720 µg/m3 WHO Annual
Air Quality Guideline
8
1 1 1
4
2
5
2
4
1 1
1
2 2
4
9
13
3
Cai
ro (2
013)
Mex
ico
Cit
y (2
014)
Gen
eva
(201
3)
Figure 8.1 – ARA floods West Africa with fuels (2014)
SOURCE: UN Comtrade

84 DIRTY DIESEL – How Swiss Traders Flood Africa with Toxic Fuels | Chapter 8
ered to be of European quality, while 80 percent was high sul-phur (see Figure 8.3).15
This figure soared to an average 90 percent for West Africa, with Ghana (93 percent), Senegal (82 percent), Togo (96 percent), Nigeria (84 percent) and Guinea (100 percent) receiving the big-gest volumes in absolute terms (see Figure 8.4). Eight of the nine West African coastal countries we examined received at least 80 percent of their high sulphur diesel from ARA.
8.3 – SWISS TRADING COMPANIES DOMINATE THE HIGH SULPHUR ROUTE
Contrary to Africa’s crude oil exports, very little attention is giv-en to the flows of dirty fuels delivered to the continent: almost
no information is publicly available. But, of course, behind the frightening Belgian and Dutch statistics, there are companies who charter vessels and make profits out of these deliveries of high sulphur diesel to West Africa.
We wanted to find out about that. To our knowledge, the only way to go beyond anecdotal evidence and to find out for sure who the main players are on the ARA to West Africa route (and any other route, in fact) is to consult a shipping intelligence database that provides the identity of the charterers.16
The database we used has limitations. We were only able to get information on the charterers of oil product tankers travelling from ARA to West Africa when a trading company had chartered a vessel from a shipping company for a single and specific voyage (“spot cargo” or “spot fixture” since a chartering contract is called a fixture). While the database does shed some light on what is otherwise an extremely opaque industry, some fixtures are not declared. Nor does it provide information on tankers owned by a trading company or on any other kind of contractual arrangements between shipbrokers and trading companies, such as long-term con-tracts (time charters). Another limitation relates to compa-nies’ freight strategy: if a company owns the vessel (rather than chartering one), the voyage will not appear in the data-base. Vitol provides a good example. It is the largest indepen-dent oil trading company, but, because it mostly operates with its own vessels, the company doesn’t appear in the database (for that route). In short, the database provides the best possi-ble picture of the dominant players on a given maritime route, but excludes many cargoes. That’s why we speak about “known” cargoes or tankers. Our results should be understood that way.
Nevertheless, the database shows that Swiss trading compa-nies are major players on the high sulphur fuels route from ARA to West Africa. From 2012 to 2015, Swiss trading compa-nies (or their shipping subsidiaries) chartered more than half of the known tankers that left ARA for West Africa. In 2014, Swiss
Figure 8.2 – Share of ARA high-sulphur diesel exports (>1,000 ppm) by destination (2014)
SOURCE: Belgium National Bank and Netherland’s Central Office for Statistics
SOURCE: Belgium National Bank and Netherland’s Central Office for Statistics
Euro
pe
US
& C
anad
a
Russ
ia &
Cas
pian
Asi
a-Pa
cific
Lati
n A
mer
ica
Mid
dle
East
Afr
ica
max
. ppm
sul
phur
in d
iese
l
2000
1800
1600
1400
1200
1000
800
600
400
200
0
Inde
pend
ent
Trad
ers
Oth
er C
ompa
nies
Regi
onal
Oil
Com
pani
es
Tota
l
Ang
lo-S
axon
Maj
ors
10 %
5 %
0 %
–5 %
–10 %
–15 %
–20 %
–25 %
51–500 ppm20 %
501–1500 ppm12%
1501–2500 ppm24 %
2501–3500 ppm40 %
> 3500 ppm4%
Africa 61 %
Gibraltar 12 %
Europe 20 %
America 6 %Asia 1%
11–50 ppm27%
51–150 ppm27%
151–250 ppm14 %
251–350 ppm27%
> 350 ppm5%
EU average (≤ 29 %v) 27 %
EU limit (>29 and ≤ 35%v)32 %
over EU limit (> 35 %v)41 %
0–5
00 p
pm
1 1 1 1 1
4 43
9
13
2 2
1
2 2
5
8
4
501–
1,000
ppm
1,001
–1,5
00 p
pm
1,501
–2,0
00 p
pm
2,00
1–2,
500
ppm
2,50
1–3,
000
ppm
3,00
1–3,
500
ppm
3,50
1–4,
000
ppm
4,00
1–4,
500
ppm
4,50
1–5,
000
ppm
5,00
1–5,
500
ppm
Num
ber o
f car
goes
repo
rted
Nat
iona
l spe
cific
atio
n 5,
000
ppm
0–5
00 p
pm
Num
ber o
f car
goes
repo
rted
Nat
iona
l spe
cific
atio
n 3,
000
ppm
501–
1,000
ppm
1,001
–1,5
00 p
pm
1,501
–2,0
00 p
pm
2,00
1–2,
500
ppm
2,50
1–3,
000
ppm
3,00
1–3,
500
ppm
0–50
0
501–
1000
1001
–150
0
1501
–200
0
2001
–250
0
2501
–300
0
3001
–350
0
3501
–40
00
4001
–450
0
4501
–500
0
5001
–550
0
Num
ber o
f car
goes
repo
rted
ppm
8
7
6
5
4
3
2
1
0
Diesel imports in Ghana by sulphur content (2013)
0–50
0
501–
1000
1001
–150
0
1501
–200
0
2001
–250
0
2501
–300
0
3001
–350
0
Num
ber o
f car
goes
repo
rted
13
12
11
10
9
8
7
6
5
4
3
2
1
0
Diesel imports in Ghana by sulphur content (2014)
ppm
Sier
ra L
eone
Gui
nea
Ben
in
Côt
e d’
Ivoi
re
Togo
Gha
na
Nig
eria
Shar
e (%
of v
olum
e)
Sene
gal
Con
go100
90
80
70
60
50
40
30
20
10
0 Volu
me
expo
rted
(in
'000
MT
)
900
800
700
600
500
400
300
200
100
0
Share of high sulphur (> 1000 ppm) diesel in total diesel exports from ARA to West Africa (2014)
100 100 100 10096 93
8482
45
Sier
ra L
eone
Gui
nea
Côt
e d’
Ivoi
re
Ben
in
Gha
na
Nig
eria
Togo
Shar
e of
ARA
(% o
f vol
ume
impo
rted
)
Sene
gal
Mau
ritan
ia
100
90
80
70
60
50
40
30
20
10
0 Volu
me
(in
'000
MT
)
4,500
4,000
3,500
3,000
2,500
2,000
1,500
1,000
500
0
ARA floods West Africa with fuels (2014)
Share volume of “known” voyages from ARA to West Africa by trading companies (2014)
91 88
6964
5144
3021 19
CNR 14%
Irving 1%Valeska 1%
Talaveras 3%
Noble 4%
Total 7%
BP Amoco 9%
Swiss traders61%
Litasco 20 %
Glencore (ST Shipping) 11%
Addax and Oryx (Nyala) 9 %
Sahara Energy 7 %
Trafigura (Delaney) 5 %Mercuria 4 %Trafigura 2 %Gunvor (Clearlake) 2 %Orion 1 %
Share volume of “known” voyages from ARA to West Africa by trading companies (2014)
Charterer not reported 14 %
Irving 1 %Valeska 1 %
Talaveras 3 %
Noble 4 %
Total 7 %
BP Amoco 9 %
Swiss traders61 %
Litasco 20 %
Glencore (ST Shipping) 11 %
Addax and Oryx (Nyala) 9 %
Sahara Energy 7 %
Trafigura (Delaney) 5 %Mercuria 4 %Trafigura 2 %Gunvor (Clearlake) 2 %Orion 1 %
<10 ppm 10–20 ppm 20– 1,000 ppm >1,000 ppm
Shar
e vo
lum
e (%
)
sulphur content (ppm)
80
70
60
50
40
30
20
10
0
Lago
s (2
011)
Dak
ar (2
013)
Acc
ra (2
008)
Joha
nnes
burg
(201
1)
New
Del
hi (2
012)
Bei
jing
(201
3)
Car
acas
(201
2)
Ban
gkok
(201
4)
Rott
erda
m (2
013)
Paris
(201
4)
Lond
on (2
013)
Zuric
h (2
013)
Was
hing
ton
(201
4)
µg/m
3
350
300
250
200
150
100
50
0
PM10 level of African cities compared to cities in other world regions
Africa Asia Americas Europe
4 3
22
46
59
16
42
2230
80
3632
720 µg/m3 WHO Annual
Air Quality Guideline
8
1 1 1
4
2
5
2
4
1 1
1
2 2
4
9
13
3
Cai
ro (2
013)
Mex
ico
Cit
y (2
014)
Gen
eva
(201
3)
Figure 8.3 – Share of ARA diesel exports, by main region of destination and sulphur content (2014)
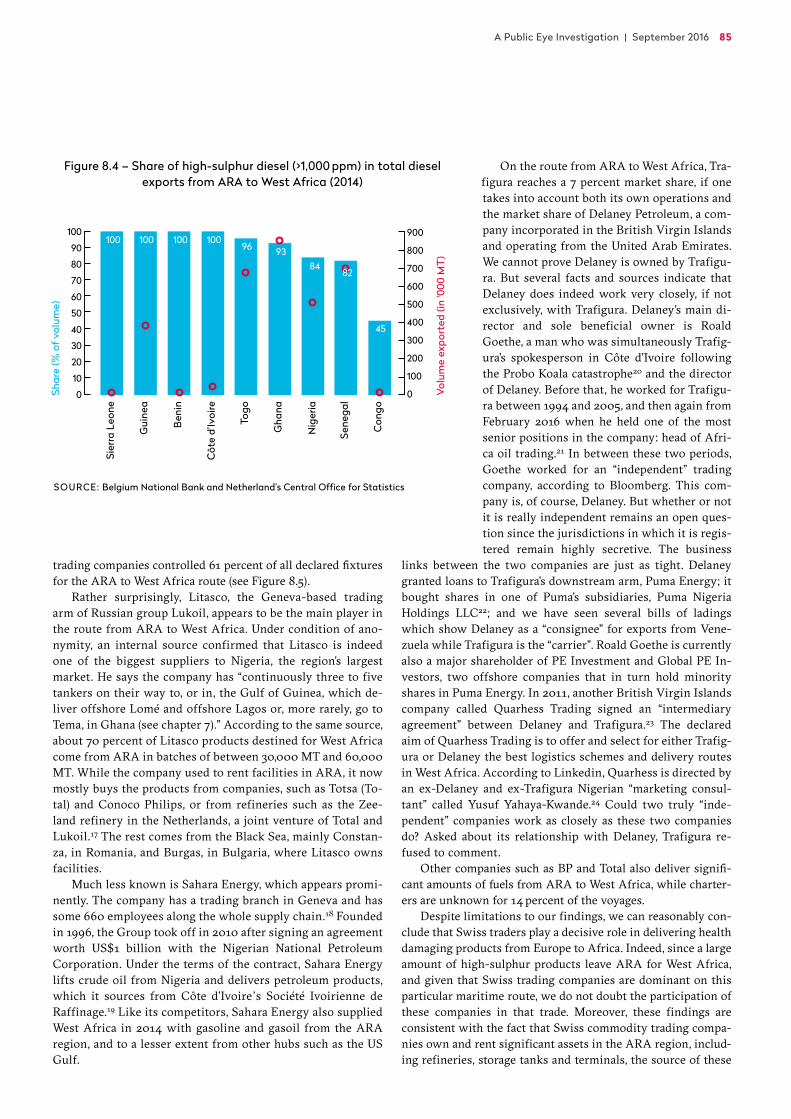
A Public Eye Investigation | September 2016 85
trading companies controlled 61 percent of all declared fixtures for the ARA to West Africa route (see Figure 8.5).
Rather surprisingly, Litasco, the Geneva-based trading arm of Russian group Lukoil, appears to be the main player in the route from ARA to West Africa. Under condition of ano-nymity, an internal source confirmed that Litasco is indeed one of the biggest suppliers to Nigeria, the region’s largest market. He says the company has “continuously three to five tankers on their way to, or in, the Gulf of Guinea, which de-liver offshore Lomé and offshore Lagos or, more rarely, go to Tema, in Ghana (see chapter 7).” According to the same source, about 70 percent of Litasco products destined for West Africa come from ARA in batches of between 30,000 MT and 60,000 MT. While the company used to rent facilities in ARA, it now mostly buys the products from companies, such as Totsa (To-tal) and Conoco Philips, or from refineries such as the Zee-land refinery in the Netherlands, a joint venture of Total and Lukoil.17 The rest comes from the Black Sea, mainly Constan-za, in Romania, and Burgas, in Bulgaria, where Litasco owns facilities.
Much less known is Sahara Energy, which appears promi-nently. The company has a trading branch in Geneva and has some 660 employees along the whole supply chain.18 Founded in 1996, the Group took off in 2010 after signing an agreement worth US$1 billion with the Nigerian National Petroleum Corporation. Under the terms of the contract, Sahara Energy lifts crude oil from Nigeria and delivers petroleum products, which it sources from Côte d’Ivoire’s Société Ivoirienne de Raffinage.19 Like its competitors, Sahara Energy also supplied West Africa in 2014 with gasoline and gasoil from the ARA region, and to a lesser extent from other hubs such as the US Gulf.
On the route from ARA to West Africa, Tra-figura reaches a 7 percent market share, if one takes into account both its own operations and the market share of Delaney Petroleum, a com-pany incorporated in the British Virgin Islands and operating from the United Arab Emirates. We cannot prove Delaney is owned by Trafigu-ra. But several facts and sources indicate that Delaney does indeed work very closely, if not exclusively, with Trafigura. Delaney’s main di-rector and sole beneficial owner is Roald Goethe, a man who was simultaneously Trafig-ura’s spokesperson in Côte d’Ivoire following the Probo Koala catastrophe20 and the director of Delaney. Before that, he worked for Trafigu-ra between 1994 and 2005, and then again from February 2016 when he held one of the most senior positions in the company: head of Afri-ca oil trading.21 In between these two periods, Goethe worked for an “independent” trading company, according to Bloomberg. This com-pany is, of course, Delaney. But whether or not it is really independent remains an open ques-tion since the jurisdictions in which it is regis-tered remain highly secretive. The business
links between the two companies are just as tight. Delaney granted loans to Trafigura’s downstream arm, Puma Energy; it bought shares in one of Puma’s subsidiaries, Puma Nigeria Holdings LLC22; and we have seen several bills of ladings which show Delaney as a “consignee” for exports from Vene-zuela while Trafigura is the “carrier”. Roald Goethe is currently also a major shareholder of PE Investment and Global PE In-vestors, two offshore companies that in turn hold minority shares in Puma Energy. In 2011, another British Virgin Islands company called Quarhess Trading signed an “intermediary agreement” between Delaney and Trafigura.23 The declared aim of Quarhess Trading is to offer and select for either Trafig-ura or Delaney the best logistics schemes and delivery routes in West Africa. According to Linkedin, Quarhess is directed by an ex-Delaney and ex-Trafigura Nigerian “marketing consul-tant” called Yusuf Yahaya-Kwande.24 Could two truly “inde-pendent” companies work as closely as these two companies do? Asked about its relationship with Delaney, Trafigura re-fused to comment.
Other companies such as BP and Total also deliver signifi-cant amounts of fuels from ARA to West Africa, while charter-ers are unknown for 14 percent of the voyages.
Despite limitations to our findings, we can reasonably con-clude that Swiss traders play a decisive role in delivering health damaging products from Europe to Africa. Indeed, since a large amount of high-sulphur products leave ARA for West Africa, and given that Swiss trading companies are dominant on this particular maritime route, we do not doubt the participation of these companies in that trade. Moreover, these findings are consistent with the fact that Swiss commodity trading compa-nies own and rent significant assets in the ARA region, includ-ing refineries, storage tanks and terminals, the source of these
0–50
0
501–
1000
1001
–150
0
1501
–200
0
2001
–250
0
2501
–300
0
3001
–350
0
3501
–40
00
4001
–450
0
4501
–500
0
5001
–550
0
Num
ber o
f car
goes
repo
rted
ppm
8
7
6
5
4
3
2
1
0
Diesel imports in Ghana by sulphur content (2013)
0–50
0
501–
1000
1001
–150
0
1501
–200
0
2001
–250
0
2501
–300
0
3001
–350
0
Num
ber o
f car
goes
repo
rted
13
12
11
10
9
8
7
6
5
4
3
2
1
0
Diesel imports in Ghana by sulphur content (2014)
ppm
Sier
ra L
eone
Gui
nea
Ben
in
Côt
e d’
Ivoi
re
Togo
Gha
na
Nig
eria
Shar
e (%
of v
olum
e)
Sene
gal
Con
go
100
90
80
70
60
50
40
30
20
10
0 Volu
me
expo
rted
(in
'000
MT
)
900
800
700
600
500
400
300
200
100
0
Share of high sulphur (> 1000 ppm) diesel in total diesel exports from ARA to West Africa (2014)
100 100 100 10096 93
8482
45
Sier
ra L
eone
Gui
nea
Côt
e d’
Ivoi
re
Ben
in
Gha
na
Nig
eria
Togo
Shar
e of
ARA
(% o
f vol
ume
impo
rted
)
Sene
gal
Mau
ritan
ia
100
90
80
70
60
50
40
30
20
10
0 Volu
me
(in
'000
MT
)
4,500
4,000
3,500
3,000
2,500
2,000
1,500
1,000
500
0
ARA floods West Africa with fuels (2014)
Share volume of “known” voyages from ARA to West Africa by trading companies (2014)
91 88
6964
5144
3021 19
CNR 14%
Irving 1%Valeska 1%
Talaveras 3%
Noble 4%
Total 7%
BP Amoco 9%
Swiss traders61%
Litasco 20 %
Glencore (ST Shipping) 11%
Addax and Oryx (Nyala) 9 %
Sahara Energy 7 %
Trafigura (Delaney) 5 %Mercuria 4 %Trafigura 2 %Gunvor (Clearlake) 2 %Orion 1 %
Share volume of “known” voyages from ARA to West Africa by trading companies (2014)
Charterer not reported 14 %
Irving 1 %Valeska 1 %
Talaveras 3 %
Noble 4 %
Total 7 %
BP Amoco 9 %
Swiss traders61 %
Litasco 20 %
Glencore (ST Shipping) 11 %
Addax and Oryx (Nyala) 9 %
Sahara Energy 7 %
Trafigura (Delaney) 5 %Mercuria 4 %Trafigura 2 %Gunvor (Clearlake) 2 %Orion 1 %
<10 ppm 10–20 ppm 20– 1,000 ppm >1,000 ppm
Shar
e vo
lum
e (%
)
sulphur content (ppm)
80
70
60
50
40
30
20
10
0
Lago
s (2
011)
Dak
ar (2
013)
Acc
ra (2
008)
Joha
nnes
burg
(201
1)
New
Del
hi (2
012)
Bei
jing
(201
3)
Car
acas
(201
2)
Ban
gkok
(201
4)
Rott
erda
m (2
013)
Paris
(201
4)
Lond
on (2
013)
Zuric
h (2
013)
Was
hing
ton
(201
4)
µg/m
3
350
300
250
200
150
100
50
0
PM10 level of African cities compared to cities in other world regions
Africa Asia Americas Europe
4 3
22
46
59
16
42
2230
80
3632
720 µg/m3 WHO Annual
Air Quality Guideline
8
1 1 1
4
2
5
2
4
1 1
1
2 2
4
9
13
3
Cai
ro (2
013)
Mex
ico
Cit
y (2
014)
Gen
eva
(201
3)
Figure 8.4 – Share of high-sulphur diesel (>1,000 ppm) in total diesel exports from ARA to West Africa (2014)
SOURCE: Belgium National Bank and Netherland’s Central Office for Statistics
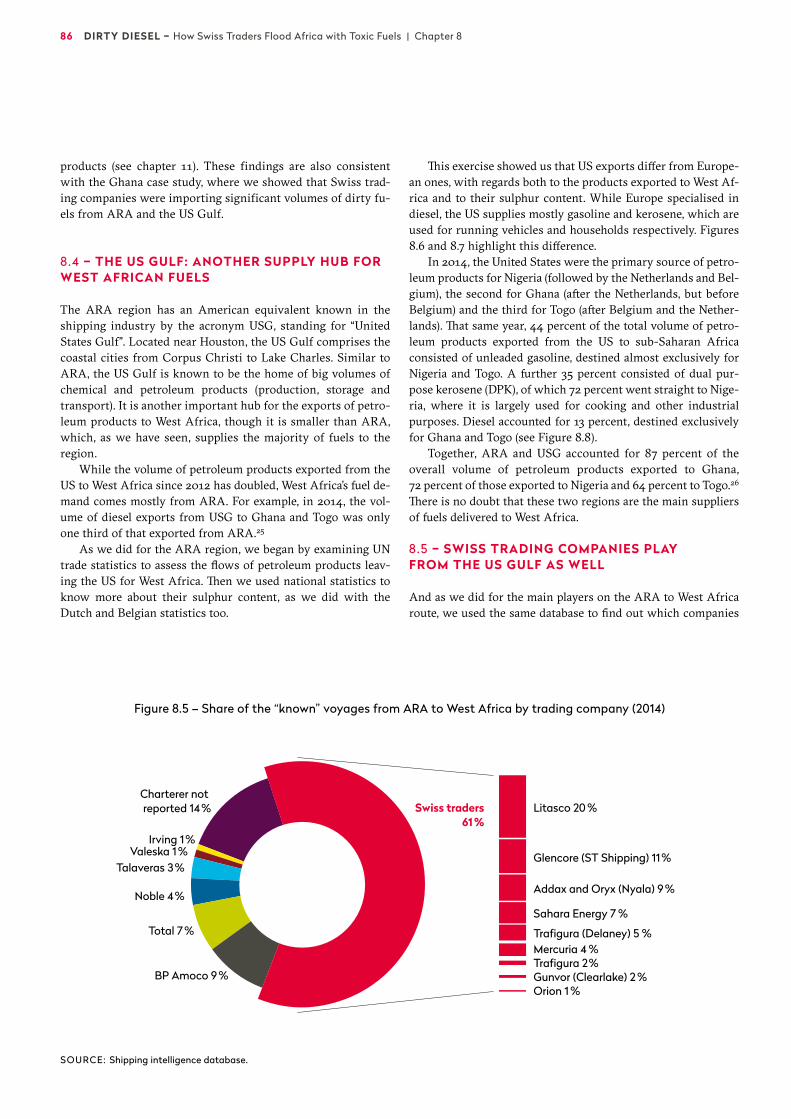
86 DIRTY DIESEL – How Swiss Traders Flood Africa with Toxic Fuels | Chapter 8
products (see chapter 11). These findings are also consistent with the Ghana case study, where we showed that Swiss trad-ing companies were importing significant volumes of dirty fu-els from ARA and the US Gulf.
8.4 – THE US GULF: ANOTHER SUPPLY HUB FOR WEST AFRICAN FUELS
The ARA region has an American equivalent known in the shipping industry by the acronym USG, standing for “United States Gulf”. Located near Houston, the US Gulf comprises the coastal cities from Corpus Christi to Lake Charles. Similar to ARA, the US Gulf is known to be the home of big volumes of chemical and petroleum products (production, storage and transport). It is another important hub for the exports of petro-leum products to West Africa, though it is smaller than ARA, which, as we have seen, supplies the majority of fuels to the region.
While the volume of petroleum products exported from the US to West Africa since 2012 has doubled, West Africa’s fuel de-mand comes mostly from ARA. For example, in 2014, the vol-ume of diesel exports from USG to Ghana and Togo was only one third of that exported from ARA.25
As we did for the ARA region, we began by examining UN trade statistics to assess the flows of petroleum products leav-ing the US for West Africa. Then we used national statistics to know more about their sulphur content, as we did with the Dutch and Belgian statistics too.
This exercise showed us that US exports differ from Europe-an ones, with regards both to the products exported to West Af-rica and to their sulphur content. While Europe specialised in diesel, the US supplies mostly gasoline and kerosene, which are used for running vehicles and households respectively. Figures 8.6 and 8.7 highlight this difference.
In 2014, the United States were the primary source of petro-leum products for Nigeria (followed by the Netherlands and Bel-gium), the second for Ghana (after the Netherlands, but before Belgium) and the third for Togo (after Belgium and the Nether-lands). That same year, 44 percent of the total volume of petro-leum products exported from the US to sub-Saharan Africa consisted of unleaded gasoline, destined almost exclusively for Nigeria and Togo. A further 35 percent consisted of dual pur-pose kerosene (DPK), of which 72 percent went straight to Nige-ria, where it is largely used for cooking and other industrial purposes. Diesel accounted for 13 percent, destined exclusively for Ghana and Togo (see Figure 8.8).
Together, ARA and USG accounted for 87 percent of the overall volume of petroleum products exported to Ghana, 72 percent of those exported to Nigeria and 64 percent to Togo.26
There is no doubt that these two regions are the main suppliers of fuels delivered to West Africa.
8.5 – SWISS TRADING COMPANIES PLAY FROM THE US GULF AS WELL
And as we did for the main players on the ARA to West Africa route, we used the same database to find out which companies
Figure 8.5 – Share of the “known” voyages from ARA to West Africa by trading company (2014)
SOURCE: Shipping intelligence database.
0–50
0
501–
1000
1001
–150
0
1501
–200
0
2001
–250
0
2501
–300
0
3001
–350
0
3501
–400
0
4001
–450
0
4501
–500
0
5001
–550
0
Num
ber o
f car
goes
repo
rted
ppm
8
7
6
5
4
3
2
1
0
Diesel imports in Ghana by sulphur content (2013)
0–50
0
501–
1000
1001
–150
0
1501
–200
0
2001
–250
0
2501
–300
0
3001
–350
0
Num
ber o
f car
goes
repo
rted
13
12
11
10
9
8
7
6
5
4
3
2
1
0
Diesel imports in Ghana by sulphur content (2014)
ppm
Sier
ra L
eone
Gui
nea
Ben
in
Côt
e d’
Ivoi
re
Togo
Gha
na
Nig
eria
Shar
e (%
of v
olum
e)
Sene
gal
Con
go
100
90
80
70
60
50
40
30
20
10
0 Volu
me
expo
rted
(in
'000
MT
)
900
800
700
600
500
400
300
200
100
0
Share of high sulphur (> 1000 ppm) diesel in total diesel exports from ARA to West Africa (2014)
100 100 100 10096 93
8482
45
Sier
ra L
eone
Gui
nea
Côt
e d’
Ivoi
re
Ben
in
Gha
na
Nig
eria
Togo
Shar
e of
ARA
(% o
f vol
ume
impo
rted
)
Sene
gal
Mau
ritan
ia
100
90
80
70
60
50
40
30
20
10
0 Volu
me
(in
'000
MT
)
4,500
4,000
3,500
3,000
2,500
2,000
1,500
1,000
500
0
ARA floods West Africa with fuels (2014)
Share volume of “known” voyages from ARA to West Africa by trading companies (2014)
91 88
6964
5144
3021 19
CNR 14%
Irving 1%Valeska 1%
Talaveras 3%
Noble 4%
Total 7%
BP Amoco 9%
Swiss traders61%
Litasco 20 %
Glencore (ST Shipping) 11%
Addax and Oryx (Nyala) 9 %
Sahara Energy 7 %
Trafigura (Delaney) 5 %Mercuria 4 %Trafigura 2 %Gunvor (Clearlake) 2 %Orion 1 %
Share volume of “known” voyages from ARA to West Africa by trading companies (2014)
Charterer not reported 14 %
Irving 1 %Valeska 1 %
Talaveras 3 %
Noble 4 %
Total 7 %
BP Amoco 9 %
Swiss traders61 %
Litasco 20 %
Glencore (ST Shipping) 11 %
Addax and Oryx (Nyala) 9 %
Sahara Energy 7 %
Trafigura (Delaney) 5 %Mercuria 4 %Trafigura 2 %Gunvor (Clearlake) 2 %Orion 1 %
<10 ppm 10–20 ppm 20– 1,000 ppm >1,000 ppm
Shar
e vo
lum
e (%
)
sulphur content (ppm)
80
70
60
50
40
30
20
10
0
Lago
s (2
011)
Dak
ar (2
013)
Acc
ra (2
008)
Joha
nnes
burg
(201
1)
New
Del
hi (2
012)
Bei
jing
(201
3)
Car
acas
(201
2)
Ban
gkok
(201
4)
Rott
erda
m (2
013)
Paris
(201
4)
Lond
on (2
013)
Zuric
h (2
013)
Was
hing
ton
(201
4)
µg/m
3
350
300
250
200
150
100
50
0
PM10 level of African cities compared to cities in other world regions
Africa Asia Americas Europe
4 3
22
46
59
16
42
2230
80
3632
720 µg/m3 WHO Annual
Air Quality Guideline
8
1 1 1
4
2
5
2
4
1 1
1
2 2
4
9
13
3
Cai
ro (2
013)
Mex
ico
Cit
y (2
014)
Gen
eva
(201
3)
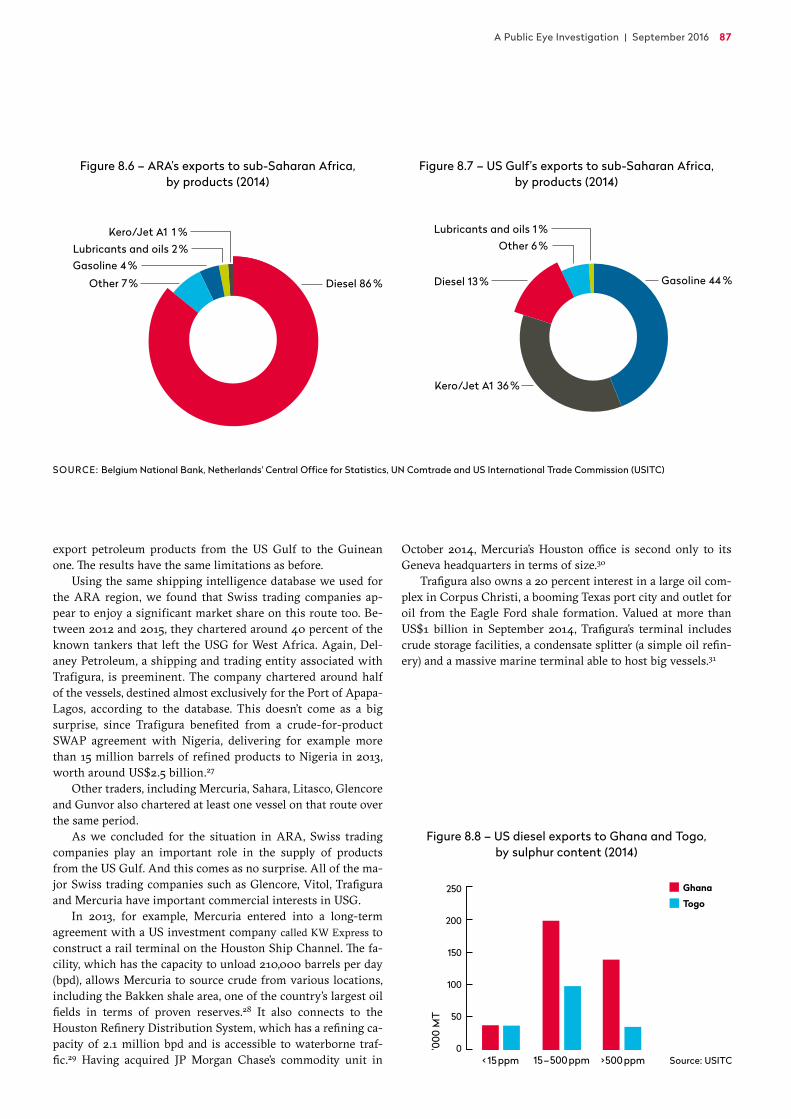
A Public Eye Investigation | September 2016 87
export petroleum products from the US Gulf to the Guinean one. The results have the same limitations as before.
Using the same shipping intelligence database we used for the ARA region, we found that Swiss trading companies ap-pear to enjoy a significant market share on this route too. Be-tween 2012 and 2015, they chartered around 40 percent of the known tankers that left the USG for West Africa. Again, Del-aney Petroleum, a shipping and trading entity associated with Trafigura, is preeminent. The company chartered around half of the vessels, destined almost exclusively for the Port of Apapa- Lagos, according to the database. This doesn’t come as a big surprise, since Trafigura benefited from a crude-for-product SWAP agreement with Nigeria, delivering for example more than 15 million barrels of refined products to Nigeria in 2013, worth around US$2.5 billion.27
Other traders, including Mercuria, Sahara, Litasco, Glencore and Gunvor also chartered at least one vessel on that route over the same period.
As we concluded for the situation in ARA, Swiss trading companies play an important role in the supply of products from the US Gulf. And this comes as no surprise. All of the ma-jor Swiss trading companies such as Glencore, Vitol, Trafigura and Mercuria have important commercial interests in USG.
In 2013, for example, Mercuria entered into a long-term agreement with a US investment company called KW Express to construct a rail terminal on the Houston Ship Channel. The fa-cility, which has the capacity to unload 210,000 barrels per day (bpd), allows Mercuria to source crude from various locations, including the Bakken shale area, one of the country’s largest oil fields in terms of proven reserves.28 It also connects to the Houston Refinery Distribution System, which has a refining ca-pacity of 2.1 million bpd and is accessible to waterborne traf-fic.29 Having acquired JP Morgan Chase’s commodity unit in
October 2014, Mercuria’s Houston office is second only to its Geneva headquarters in terms of size.30
Trafigura also owns a 20 percent interest in a large oil com-plex in Corpus Christi, a booming Texas port city and outlet for oil from the Eagle Ford shale formation. Valued at more than US$1 billion in September 2014, Trafigura’s terminal includes crude storage facilities, a condensate splitter (a simple oil refin-ery) and a massive marine terminal able to host big vessels.31
Figure 8.7 – US Gulf’s exports to sub-Saharan Africa, by products (2014)
Figure 8.6 – ARA’s exports to sub-Saharan Africa, by products (2014)
Figure 8.8 – US diesel exports to Ghana and Togo, by sulphur content (2014)
Diesel 86 % Diesel 13 % Gasoline 44 %
Gasoline 4 %
Other 7 %
Lubricants and oils 2 %Kero/Jet A1 1 %
0–5
00 p
pm
1 1 1 1 1
4
2 2
5
8
4
501–
1000
ppm
1001
–150
0 pp
m
1051
–200
0 pp
m
2001
–250
0 pp
m
2501
–300
0 pp
m
3001
–350
0 pp
m
3501
–400
0 pp
m
4001
–450
0 pp
m
4501
–500
0 pp
m
5001
–550
0 pp
m
Num
ber o
f car
goes
repo
rted Nat
iona
l spe
cific
atio
n
< 15 ppm >500 ppm
’000
MT
Con
oco
Phili
ps
Tota
l
Gun
vor
Vit
ol
Mer
curia
Trafi
gura
Che
vron
Gle
ncor
e
Mio
bar
rels
60
50
40
30
20
10
0
250
200
150
100
50
0
Daily oil consumption
International oil companies
Swiss traders
Other 6 %Lubricants and oils 1 %
Kero/Jet A1 36 %
15–500 ppm
Ghana
Togo
US
ChinaAfrica
Russ
ia
Uni
ted
Stat
es
Uni
ted
Kin
gdom
Latv
ia
Lith
uani
a
Sing
apor
e
Uni
ted
Stat
es
Uni
ted
Kin
gdom
Gib
ralt
ar
Fran
ce
Volu
me
(mill
ion
tons
)
14
12
10
8
6
4
2
0
13 12.9
3.4 3.2
Countries of origin
Countries of destination
2.8 2.63.4 3.1
2.4 1.5
Source: USITC
SOURCE: Belgium National Bank, Netherlands' Central Office for Statistics, UN Comtrade and US International Trade Commission (USITC)
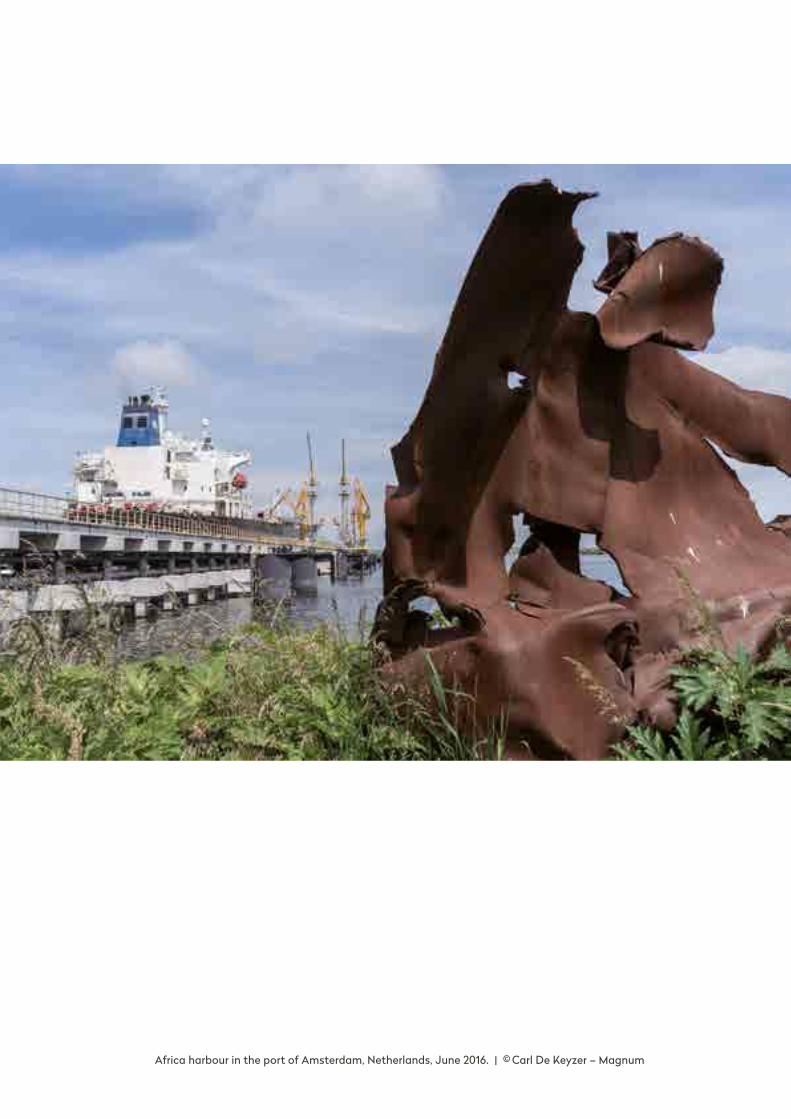
Africa harbour in the port of Amsterdam, Netherlands, June 2016. | © Carl De Keyzer – Magnum
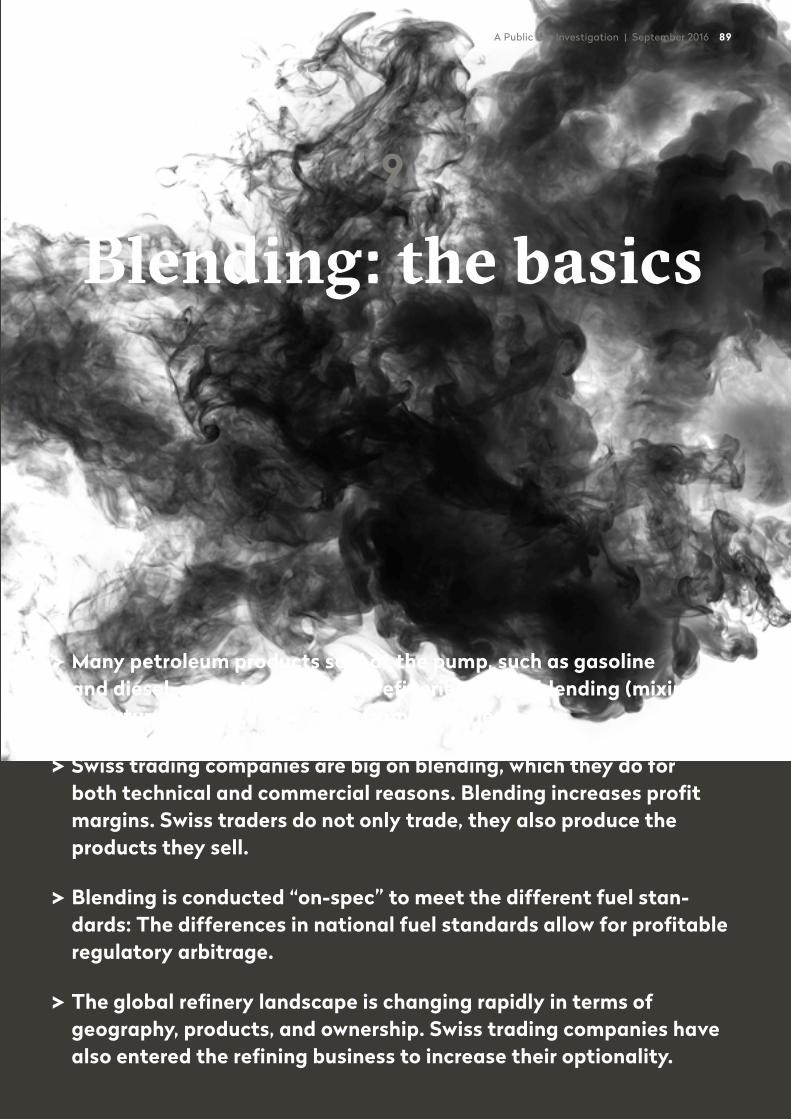
A Public Eye Investigation | September 2016 89
9
Blending: the basics
Many petroleum products sold at the pump, such as gasoline and diesel, are not produced at refineries but by blending (mixing) a mixture of substances away from refineries.
Swiss trading companies are big on blending, which they do for both technical and commercial reasons. Blending increases profit margins. Swiss traders do not only trade, they also produce the products they sell.
Blending is conducted “on-spec” to meet the different fuel stan-dards: The differences in national fuel standards allow for profitable regulatory arbitrage.
The global refinery landscape is changing rapidly in terms of geography, products, and ownership. Swiss trading companies have also entered the refining business to increase their optionality.
90 DIRTY DIESEL – How Swiss Traders Flood Africa with Toxic Fuels | Chapter 9
Contrary to what most people might think, fuels such as diesel or gasoline do not always come straight from refineries. Instead, the refineries tend to produce besides finished petroleum prod-ucts a lot of intermediate products, which are then mixed to-gether, occasionally with other intermediate products from oth-er sources (such as the chemical industry). This process is called “blending”. To make matters more complex, different types of refineries produce different intermediate products or “blend-stocks” (see Annex 4).
Some refineries do produce “straight-run” diesel, which does not need to be blended. However, the amount of directly usable diesel produced by these refineries is limited, and so die-sel is usually blended too. Gasoline is always a blended product. The blending ensures that the final product complies with tech-nical specifications, such as minimum levels of cetane (diesel) or octane (gasoline).
Beyond the technical considerations, however, there is also a commercial motivation for blending. Blenders look for the cheapest possible blendstocks to produce a fuel that will be ac-ceptable for any given market. This is why differing national standards for fuels – or “specifications” as they are called – are so crucial for the blending business.
“The objective of product blending is to allocate the available blending components in such a way as to meet product de-mands and specifications at the least cost, and to produce incre-mental products that maximize overall profit,” write James Gary and Glenn Handwerk in their book, “Petroleum Refining – Tech-nology and Economics”. A “Dictionary of Oil Trading Jargon” describes the “blending margin” as the profitability of blending: “Profit which is made by buying unfinished products or prod-ucts with quality give-away. By upgrading or downgrading, profit can be made if the required components are bought at the right value. The blender buys components at a price, which would match economically in his blend. A gasoline with an oc-tane specification which is much higher than the market re-quirements can be blended with lower octane components that are cheaper than the basis price of gasoline.”1
In this chapter, we explain the technical and commercial ba-sics of the blending business. We will show how traders have stepped out of their traditional roles and entered the refining business, constantly increasing their capacity to get the right blendstocks. In the following chapter we focus on the use of low-quality blendstocks to produce so-called “African Quality” fuels – a practice we call “blend-dumping”. We consider this practice to be illegitimate.
9.1 – BLENDING “ON-SPEC”
“Blending is an art, not a science,” Ton Visser, a Dutch blending expert, explains. “A trader doesn’t earn too much just by selling finished products direct from the refineries. They gain when they can blend their own fuel products (see box 9.1). Pure blending is simple. The science is easy if you stick to the rules. What to blend in what ratio, however, can make a big difference for profits.”2
“Blending on-spec” – the mixing of products to obtain a cer-tain specification for a certain market – is an omnipresent term
in the fuel blending industry and trading companies make no secret of it:
Gunvor: “Gunvor is active in the gasoline market, with a strong focus on blending. As the finished grade specifications differ be-tween countries, the blending of gasoline has to be tailored for each country, which is achieved by mixing many different refin-ery streams as well as petrochemical components.”3
Vitol: “Our detailed knowledge of specifications […] gives us a real advantage in achieving better trading performance.”4
Trafigura/Puma: “We offer a full range of refined oil products and operate blending facilities in order to tailor our products to regional demands and specifications.”5
As variations in fuel quality regulations are at the heart of the arbitrage business model, regulatory changes create opportuni-ties. “Any changes in regulations, new rules, will effectively disrupt flows and create opportunities,” commented Trafigura’s CFO Pierre Lorinet. “It’s more about the arbitrage it gener-ates.”6
9.2 – THE TECHNICAL NECESSITY TO BLEND
While different crude oils are blended before they reach a refin-ery, petroleum products are blended in the refinery or outside of the refinery. Our focus is on the latter. The technical necessity to blend relates to physical and chemical properties, and perfor-mance characteristics.7
Gasoline is always a blended product, because vehicle en-gines require a mix of components from “light” when they start to “heavy” once they are warmed-up and operating. Gasoline fuels usually consist of between six and ten blendstocks, and more than 400 different blending components are currently available on the market.
In contrast, diesel does not need to be blended. Light gas oil, for example, would be suitable to run a diesel engine in its “nat-ural” state. However, blending is a profitable activity and directly usable gasoil components, such as Light Gas Oil, have limited availability, so diesel is also blended. It usually consists of between 4 and 6 blendstocks.8 Many of these blendstocks (around 40) are on the market far less than gasoline.
When searching for blendstocks, a blender will look at the price and then the boiling point. One basic rule of blending is that if a blendstock is within the boiling range of the fuel prod-uct, then it can be blended in. The boiling range of gasoline is between 35 and 210 °C. For diesel it is between 160 and 360 °C. While there are many technical requirements for fuels that need to be met by blending, we focus on the most important ones for gasoline and diesel.
9.2.1 – THE OCTANE NUMBER FOR GASOLINE
The octane number is a measure of the product’s ability to resist auto-ignition, spontaneous ignition, which causes damaging
A Public Eye Investigation | September 2016 91
engine knock.9 Vehicles running on high octane gasoline are more fuel efficient than others and hence have lower CO2 emis-sions. Gasoline is usually blended to reach the required octane number, sometimes by adding octane enhancers.
European standards require gasoline to have an octane level of at least 95 (RON), while other countries like Japan and many in Africa require a minimum of 91. Europe’s ruling of 95 was a consensus outcome. In general, the car industry would like to see high octane numbers in gasoline, as this gives vehicles more engine power, while the oil industry prefers low octane num-bers to reduce costs and increase blending options.
9.2.2 – THE CETANE NUMBER FOR DIESEL
Like the octane number for gasoline, diesel is blended to a spe-cific cetane number. The combustion quality of diesel is mea-sured by its ignition delay, the time between injection and com-bustion in a diesel engine. This is expressed as cetane number (a high number signifying a short ignition delay and vice versa).
A long ignition delay means combustion starts late, power is lost and more smoke is formed in the exhaust gases. The cetane number also influences engine deposits and fuel consumption. Overall, the higher the cetane number the better, as this results in a more complete fuel combustion, lower soot particle emis-sions, and less smoke. European standards require diesel to have a cetane number of at least 51, while many in Africa require a minimum of about 45.
9.3 – WHERE BLENDING TAKES PLACE
Blending usually takes place at a tank terminal in a process known as “in-tank” or “batch” blending. However, it may also occur in a pipeline system (“in-line” blending) or on a ship (“on-board” blending).
Robert Kruijff, with many years of experience in the lubri-cant market (blending and delivering), bunkering and waste management, explained that “if you want to blend oil products onshore, you need facilities that allow quick pumping from one tank to the other, a number of small units, tanks that allow in-jecting air and tanks that allow samples to be easily taken.”12
Indeed, access to storage capacity provides the means to blend products. As figure 9.1 (page 93) shows, Swiss trading companies have access to a significant amount of storage facili-ties. In this respect, they are the new “majors”, with more capac-ity than the integrated oil companies.
In addition to capacity and infrastructure, cost plays a key role in deciding where to blend. The average operational price of blending using an onshore tank is US$1 per tonne, although this may vary according to the trader, terminal and products used. A trader has several options to economise on the cost of blending:
– In-tank blending: The supply of blend components – a combi-nation of those already stored at the terminal and those being shipped in – must be planned very precisely. This enables the different blendstocks to be pumped in the right order into a
Box 9.1 – THE SPIDER IN THE NET
According to an expert who trains traders in blending products, Ton Visser, “the job of a trader is to be the spider in the net. The trader has a huge network of contacts with refineries and other industries that can supply blendstock. And he needs to maintain his contacts. Contacts are everything. In fact, one could say that a trader is paid for the value of his contacts.
Traders rarely buy finished products from oil refineries because they want to blend themselves. Traders buy volumes here and there. The trader knows exactly what is being produced and where, whether a refinery is on the edge of bankruptcy, or whether a refinery is full and needing to get rid of fuel components. And, of course, he is always on top of prices. In addition, each unit of a refinery needs maintenance or has malfunctions. So it is always possible that cheap, low-quality streams are brought into the global blending pool.
Traders need so much to have a constant flow of information and good relations that if a trader finds out that a refiner
has too much VGO [vacuum gas oil] and needs to get rid of it, then the trader might offer to buy it and quickly find a way to sell or to use it. Traders active in the ARA region [Amsterdam, Rotterdam, Antwerp] buy a lot from refineries in Russia and the Middle East. They also buy from other industries, such as the chemical industry.”
A Geneva-based trader adds: “A good blender is usually the best paid person in the trading room. It’s a very opportunistic activity, which depends on the availability of blendstocks. A trader must know the markets well enough to be able to know where he can source what kind of blendstocks and then to gather them all at the same place.”10
It is a demanding job, observed a petro lab supervisor who works closely with oil majors and trading companies: “Traders work 24/7 to be on top of market development and blendstocks they want to acquire. They earn a lot of money, but when they are fifty years old they are worn out.”11
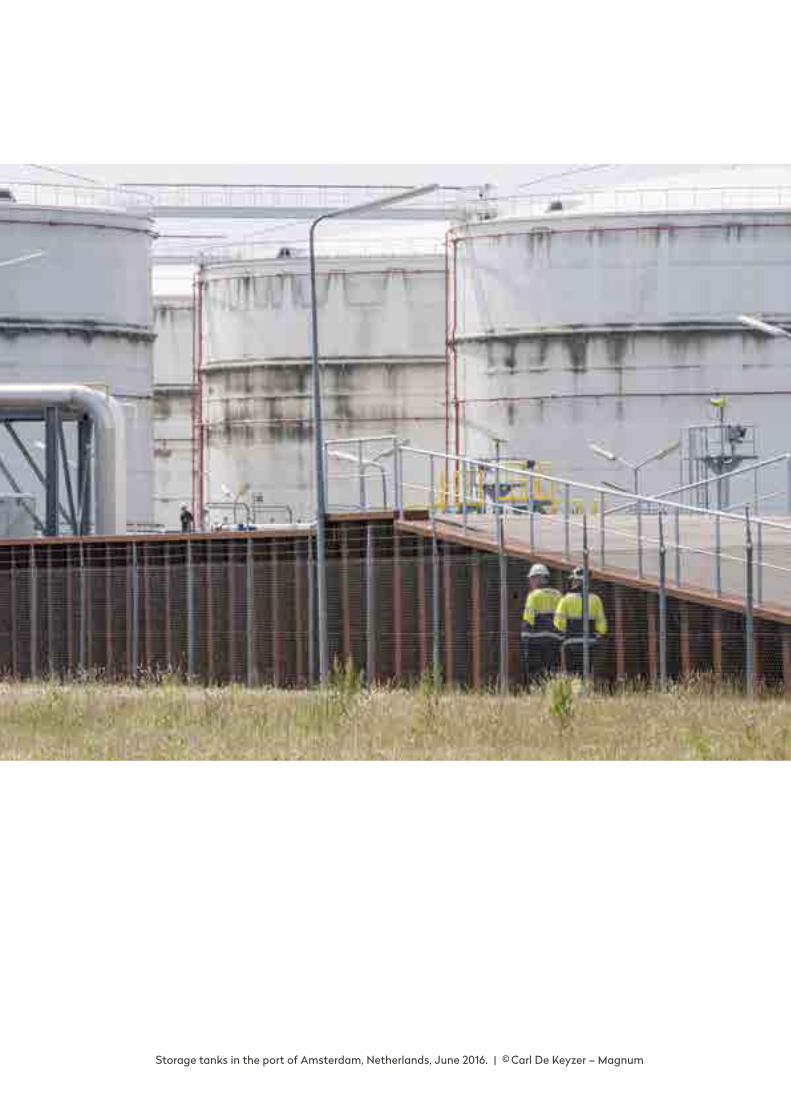
Storage tanks in the port of Amsterdam, Netherlands, June 2016. | © Carl De Keyzer – Magnum
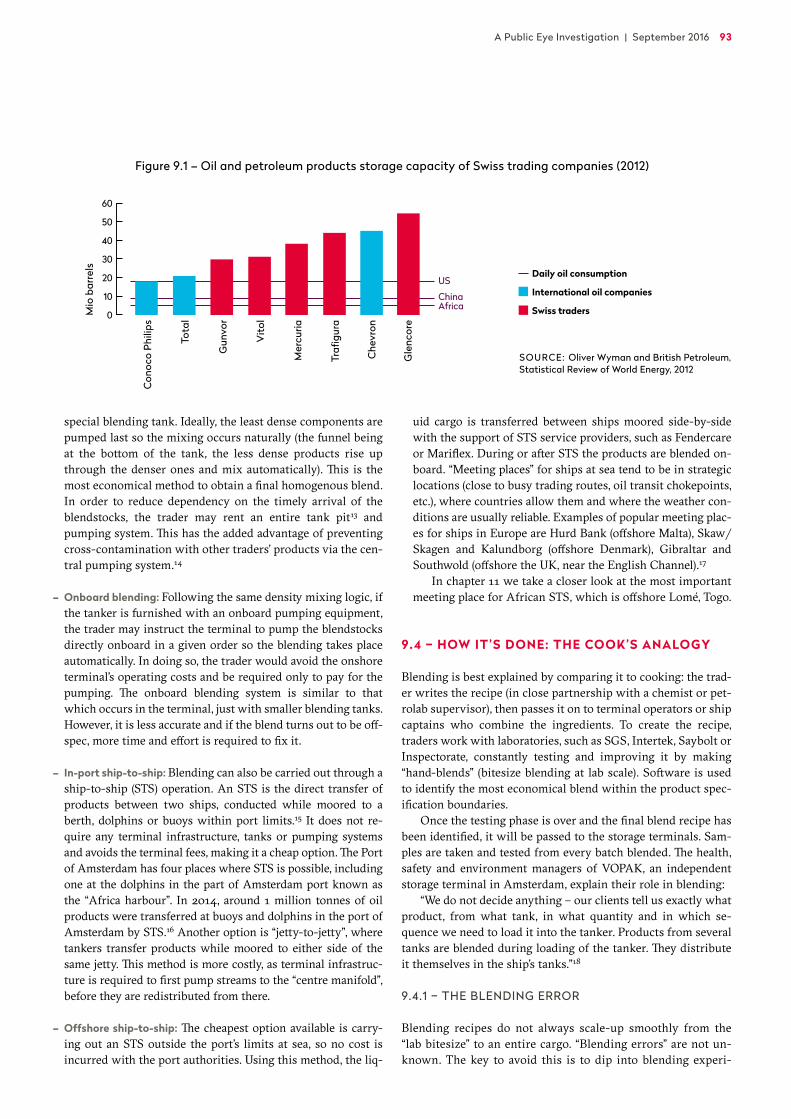
A Public Eye Investigation | September 2016 93
special blending tank. Ideally, the least dense components are pumped last so the mixing occurs naturally (the funnel being at the bottom of the tank, the less dense products rise up through the denser ones and mix automatically). This is the most economical method to obtain a final homogenous blend. In order to reduce dependency on the timely arrival of the blendstocks, the trader may rent an entire tank pit13 and pumping system. This has the added advantage of preventing cross-contamination with other traders’ products via the cen-tral pumping system.14
– Onboard blending: Following the same density mixing logic, if the tanker is furnished with an onboard pumping equipment, the trader may instruct the terminal to pump the blendstocks directly onboard in a given order so the blending takes place automatically. In doing so, the trader would avoid the onshore terminal’s operating costs and be required only to pay for the pumping. The onboard blending system is similar to that which occurs in the terminal, just with smaller blending tanks. However, it is less accurate and if the blend turns out to be off-spec, more time and effort is required to fix it.
– In-port ship-to-ship: Blending can also be carried out through a ship-to-ship (STS) operation. An STS is the direct transfer of products between two ships, conducted while moored to a berth, dolphins or buoys within port limits.15 It does not re-quire any terminal infrastructure, tanks or pumping systems and avoids the terminal fees, making it a cheap option. The Port of Amsterdam has four places where STS is possible, including one at the dolphins in the part of Amsterdam port known as the “Africa harbour”. In 2014, around 1 million tonnes of oil products were transferred at buoys and dolphins in the port of Amsterdam by STS.16 Another option is “jetty-to-jetty”, where tankers transfer products while moored to either side of the same jetty. This method is more costly, as terminal infrastruc-ture is required to first pump streams to the “centre manifold”, before they are redistributed from there.
– Offshore ship-to-ship: The cheapest option available is carry-ing out an STS outside the port’s limits at sea, so no cost is incurred with the port authorities. Using this method, the liq-
uid cargo is transferred between ships moored side-by-side with the support of STS service providers, such as Fendercare or Mariflex. During or after STS the products are blended on-board. “Meeting places” for ships at sea tend to be in strategic locations (close to busy trading routes, oil transit chokepoints, etc.), where countries allow them and where the weather con-ditions are usually reliable. Examples of popular meeting plac-es for ships in Europe are Hurd Bank (offshore Malta), Skaw/Skagen and Kalundborg (offshore Denmark), Gibraltar and Southwold (offshore the UK, near the English Channel).17
In chapter 11 we take a closer look at the most important meeting place for African STS, which is offshore Lomé, Togo.
9.4 – HOW IT’S DONE: THE COOK’S ANALOGY Blending is best explained by comparing it to cooking: the trad-er writes the recipe (in close partnership with a chemist or pet-rolab supervisor), then passes it on to terminal operators or ship captains who combine the ingredients. To create the recipe, traders work with laboratories, such as SGS, Intertek, Saybolt or Inspectorate, constantly testing and improving it by making “hand-blends” (bitesize blending at lab scale). Software is used to identify the most economical blend within the product spec-ification boundaries.
Once the testing phase is over and the final blend recipe has been identified, it will be passed to the storage terminals. Sam-ples are taken and tested from every batch blended. The health, safety and environment managers of VOPAK, an independent storage terminal in Amsterdam, explain their role in blending:
“We do not decide anything – our clients tell us exactly what product, from what tank, in what quantity and in which se-quence we need to load it into the tanker. Products from several tanks are blended during loading of the tanker. They distribute it themselves in the ship’s tanks.”18
9.4.1 – THE BLENDING ERROR
Blending recipes do not always scale-up smoothly from the “lab bitesize” to an entire cargo. “Blending errors” are not un-known. The key to avoid this is to dip into blending experi-
Figure 9.1 – Oil and petroleum products storage capacity of Swiss trading companies (2012)
Diesel 86 % Diesel 13 % Gasoline 44 %
Gasoline 4 %
Other 7 %
Lubricants and oils 2 %Kero/Jet A1 1 %
0–5
00 p
pm
1 1 1 1 1
4
2 2
5
8
4
501–
1000
ppm
1001
–150
0 pp
m
1051
–200
0 pp
m
2001
–250
0 pp
m
2501
–300
0 pp
m
3001
–350
0 pp
m
3501
–400
0 pp
m
4001
–450
0 pp
m
4501
–500
0 pp
m
5001
–550
0 pp
m
Num
ber o
f car
goes
repo
rted Nat
iona
l spe
cific
atio
n
< 15 ppm >500 ppm
’000
MT
Con
oco
Phili
ps
Tota
l
Gun
vor
Vit
ol
Mer
curia
Trafi
gura
Che
vron
Gle
ncor
e
Mio
bar
rels
60
50
40
30
20
10
0
250
200
150
100
50
0
Daily oil consumption
International oil companies
Swiss traders
Other 6 %Lubricants and oils 1 %
Kero/Jet A1 36 %
15–500 ppm
Ghana
Togo
US
ChinaAfrica
Russ
ia
Uni
ted
Stat
es
Uni
ted
Kin
gdom
Latv
ia
Lith
uani
a
Sing
apor
e
Uni
ted
Stat
es
Uni
ted
Kin
gdom
Gib
ralt
ar
Fran
ce
Volu
me
(mill
ion
tons
)
14
12
10
8
6
4
2
0
13 12.9
3.4 3.2
Countries of origin
Countries of destination
2.8 2.63.4 3.1
2.4 1.5
SOURCE: Oliver Wyman and British Petroleum, Statistical Review of World Energy, 2012
94 DIRTY DIESEL – How Swiss Traders Flood Africa with Toxic Fuels | Chapter 9
ence, uploaded into software and models. A Geneva-based trader refers to the risks of blending. “Blending is very lucra-tive but also very risky. If you mess up, you can lose all your cargo.”19 Traders confronted with failed blends have few and expensive options.
Traders we spoke to explained what they do in a case of blending error. One said that he would use additives to bring the product on-spec (see box 9.2). This appeared to be a common choice, though another trader stressed it costs time and money, as the tanker must be stopped for the additives to be injected. Another possibility is downgrading the blend and selling it for a lower price. Most agreed this is best avoided. The blend could also be sent to a refinery for re-distillation, but again this would incur transportation and processing costs. Similarly, traders ex-plained it could be blended with another cargo to dilute the contamination, though this too is problematic because it would result in a larger volume than planned, which may be challeng-ing to sell or simply too big to load onto the tanker. Finally, trad-ers have the option of seeking help from a “troubleshooter”, an expert specialising in the on-site treatment of off-spec cargoes. According to interviewees, troubleshooters are creative, have extensive knowledge on the chemistry of additives, “the right contacts”, and a trial-and-error mentality.
9.5 – REFINERIES PRODUCE MANY DIFFERENT BLEND COMPONENTS OF VARYING QUALITY
Over 600 refineries operate worldwide. Each is unique in the crude oil refined, the cracking and desulphurisation methods used, the specific end market configurations adapted to chang-ing demand, and the products and blend components created.
At one end of the spectrum are the “tea pot” refineries, built on, or close to, oilfields. These are largely found in the US, Rus-sia and China, and produce small volumes (2,000 – 20,000 bpd).
Naphtha and gasoil blendstocks are usually retained for making gasoline and diesel for the domestic market, while the heavier components are sold abroad.
At the other end of the spectrum are the mega-refineries that produce between 300,000 and 1 million bpd. Examples are the Shell Pernis, Total, Exxon and BP refineries in the ARA re-gion, and Reliance in Jamnagar (India). The majority of refineries operate somewhere in the middle, with outputs between 60,000 and 200,000 bpd.
9.5.1 – WHAT GOES IN
The composition of crude oil varies according to its origin (see Table 9.1). Crude oils are classified by their density (light, me-dium or heavy), sulphur content (high sulphur is “sour”, low sulphur is “sweet”), and chemical composition (parafinnic, napthenic or aromatic). Most light crudes, containing compo-nents such as naphtha, kerosene and gasoil, are sweet and more expensive than heavy crudes.
9.5.2 – BLENDSTOCKS FROM THE REFINERY
Most blendstocks used to blend diesel and gasoline are created at a refinery. Blendstocks vary in quality (cetane and octane numbers) and in their eventual impacts on the environment and public health. In the following chapter, we take a closer look at some of the blendstocks used to produce African Quality fuels as well as on blendstocks from other industries.
Intermediate products, produced by refineries, can either be further refined, blended to produce gasoline, diesel or other oil products, or sold as blendstocks. Nothing goes to waste; even the lowest quality products are used somewhere. Cost, market opportunity, and final product specs determine a “usable” blendstock. Originating from the dregs of an oil barrel, residual fuel oil (used for ships and power plants) is one example. “The
Box 9.2 – FROM A TRADER’S TOOLKIT: THE BUSINESS OF ADDING MILLIGRAMS
Does your fuel have a tendency to darken or form residue over time during distribution? The solution is to use “stability additives”, which lead to “improved fuel quality during distribution” and “possible utilisation of an increased range of blend stocks”.
Does the fuel have an obtrusive odour? Hydrogen sulphide scavengers, mercaptan scavengers or odour abatement chemicals will result in “an acceptable fuel odour and reduced complaints,” according to an additive supplier active in the industry.20 Other additives used for refined products include octane and cetane boosters, antioxidants, lubricity improvers, dyes, biocides and dehazers.
A blending expert further explains the additive business: “Blending is a way to bring products together to meet the specs. There are also other ways. Some specs cannot perhaps be fully met. The alternative is the use of additives. This is a very lucrative market: US$10 billion annually. It is on the increase due to more stringent specs. Additives are used for fine-tuning. You would never bring a 5,000 ppm sulphur coker naphtha [a low-octane gasoline blendstock] down to 1,000 ppm sulphur with it: besides technical limitations, it would also be far too expensive, as additives can cost between a few dollars and US$50 per litre. We always talk about milligrams, ppm ranges, when we talk about additives, while for blending components we talk in percentages.”21
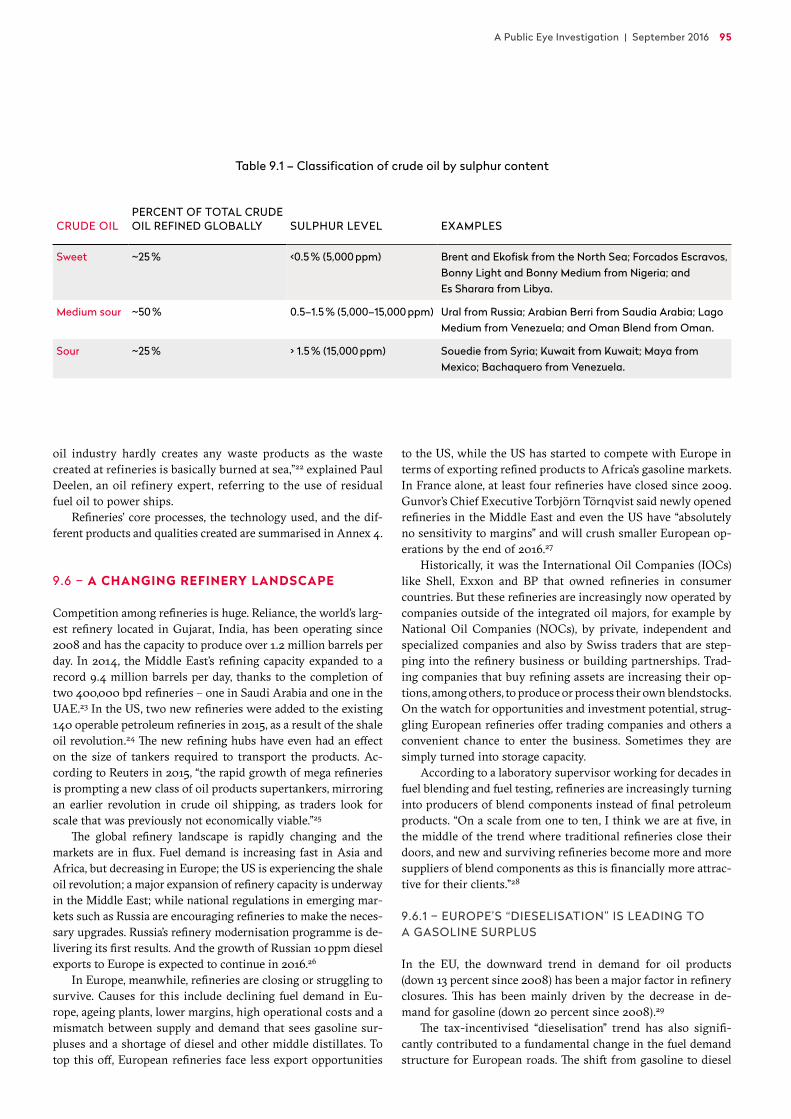
A Public Eye Investigation | September 2016 95
oil industry hardly creates any waste products as the waste created at refineries is basically burned at sea,”22 explained Paul Deelen, an oil refinery expert, referring to the use of residual fuel oil to power ships.
Refineries’ core processes, the technology used, and the dif-ferent products and qualities created are summarised in Annex 4.
9.6 – A CHANGING REFINERY LANDSCAPE
Competition among refineries is huge. Reliance, the world’s larg-est refinery located in Gujarat, India, has been operating since 2008 and has the capacity to produce over 1.2 million barrels per day. In 2014, the Middle East’s refining capacity expanded to a record 9.4 million barrels per day, thanks to the completion of two 400,000 bpd refineries – one in Saudi Arabia and one in the UAE.23 In the US, two new refineries were added to the existing 140 operable petroleum refineries in 2015, as a result of the shale oil revolution.24 The new refining hubs have even had an effect on the size of tankers required to transport the products. Ac-cording to Reuters in 2015, “the rapid growth of mega refineries is prompting a new class of oil products supertankers, mirroring an earlier revolution in crude oil shipping, as traders look for scale that was previously not economically viable.”25
The global refinery landscape is rapidly changing and the markets are in flux. Fuel demand is increasing fast in Asia and Africa, but decreasing in Europe; the US is experiencing the shale oil revolution; a major expansion of refinery capacity is underway in the Middle East; while national regulations in emerging mar-kets such as Russia are encouraging refineries to make the neces-sary upgrades. Russia’s refinery modernisation programme is de-livering its first results. And the growth of Russian 10 ppm diesel exports to Europe is expected to continue in 2016.26
In Europe, meanwhile, refineries are closing or struggling to survive. Causes for this include declining fuel demand in Eu-rope, ageing plants, lower margins, high operational costs and a mismatch between supply and demand that sees gasoline sur-pluses and a shortage of diesel and other middle distillates. To top this off, European refineries face less export opportunities
to the US, while the US has started to compete with Europe in terms of exporting refined products to Africa’s gasoline markets. In France alone, at least four refineries have closed since 2009. Gunvor’s Chief Executive Torbjörn Törnqvist said newly opened refineries in the Middle East and even the US have “absolutely no sensitivity to margins” and will crush smaller European op-erations by the end of 2016.27
Historically, it was the International Oil Companies (IOCs) like Shell, Exxon and BP that owned refineries in consumer countries. But these refineries are increasingly now operated by companies outside of the integrated oil majors, for example by National Oil Companies (NOCs), by private, independent and specialized companies and also by Swiss traders that are step-ping into the refinery business or building partnerships. Trad-ing companies that buy refining assets are increasing their op-tions, among others, to produce or process their own blendstocks. On the watch for opportunities and investment potential, strug-gling European refineries offer trading companies and others a convenient chance to enter the business. Sometimes they are simply turned into storage capacity.
According to a laboratory supervisor working for decades in fuel blending and fuel testing, refineries are increasingly turning into producers of blend components instead of final petroleum products. “On a scale from one to ten, I think we are at five, in the middle of the trend where traditional refineries close their doors, and new and surviving refineries become more and more suppliers of blend components as this is financially more attrac-tive for their clients.”28
9.6.1 – EUROPE’S “DIESELISATION” IS LEADING TO A GASOLINE SURPLUS
In the EU, the downward trend in demand for oil products (down 13 percent since 2008) has been a major factor in refinery closures. This has been mainly driven by the decrease in de-mand for gasoline (down 20 percent since 2008).29
The tax-incentivised “dieselisation” trend has also signifi-cantly contributed to a fundamental change in the fuel demand structure for European roads. The shift from gasoline to diesel
Table 9.1 – Classification of crude oil by sulphur content
CRUDE OILPERCENT OF TOTAL CRUDE OIL REFINED GLOBALLY SULPHUR LEVEL EXAMPLES
Sweet ~25 % <0.5 % (5,000 ppm) Brent and Ekofisk from the North Sea; Forcados Escravos, Bonny Light and Bonny Medium from Nigeria; and Es Sharara from Libya.
Medium sour ~50 % 0.5–1.5 % (5,000–15,000 ppm) Ural from Russia; Arabian Berri from Saudia Arabia; Lago Medium from Venezuela; and Oman Blend from Oman.
Sour ~25 % > 1.5 % (15,000 ppm) Souedie from Syria; Kuwait from Kuwait; Maya from Mexico; Bachaquero from Venezuela.
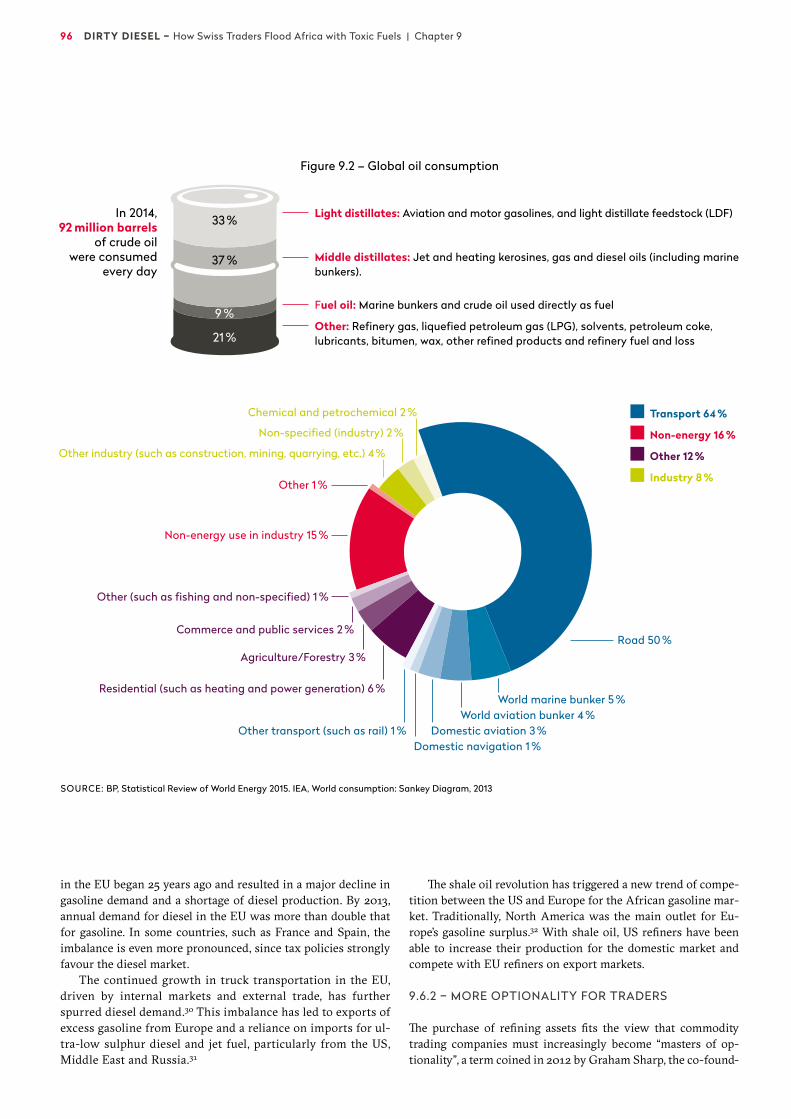
96 DIRTY DIESEL – How Swiss Traders Flood Africa with Toxic Fuels | Chapter 9
in the EU began 25 years ago and resulted in a major decline in gasoline demand and a shortage of diesel production. By 2013, annual demand for diesel in the EU was more than double that for gasoline. In some countries, such as France and Spain, the imbalance is even more pronounced, since tax policies strongly favour the diesel market.
The continued growth in truck transportation in the EU, driven by internal markets and external trade, has further spurred diesel demand.30 This imbalance has led to exports of excess gasoline from Europe and a reliance on imports for ul-tra-low sulphur diesel and jet fuel, particularly from the US, Middle East and Russia.31
The shale oil revolution has triggered a new trend of compe-tition between the US and Europe for the African gasoline mar-ket. Traditionally, North America was the main outlet for Eu-rope’s gasoline surplus.32 With shale oil, US refiners have been able to increase their production for the domestic market and compete with EU refiners on export markets.
9.6.2 – MORE OPTIONALITY FOR TRADERS
The purchase of refining assets fits the view that commodity trading companies must increasingly become “masters of op-tionality”, a term coined in 2012 by Graham Sharp, the co-found-
Light distillates: Aviation and motor gasolines, and light distillate feedstock (LDF)
Middle distillates: Jet and heating kerosines, gas and diesel oils (including marine bunkers).
Fuel oil: Marine bunkers and crude oil used directly as fuel
Other: Refinery gas, liquefied petroleum gas (LPG), solvents, petroleum coke, lubricants, bitumen, wax, other refined products and refinery fuel and loss
Transport 64 %
Non-energy 16 %
Other 12 %
Industry 8 %
Road 50 %
World marine bunker 5 %World aviation bunker 4 %
Domestic aviation 3 %Domestic navigation 1 %
Other transport (such as rail) 1 %
Residential (such as heating and power generation) 6 %
Agriculture/Forestry 3 %
Commerce and public services 2 %
Other (such as fishing and non-specified) 1 %
Non-energy use in industry 15 %
Other 1 %
Other industry (such as construction, mining, quarrying, etc.) 4 %
Non-specified (industry) 2 %
Chemical and petrochemical 2 %
Figure 9.2 – Global oil consumption
In 2014, 92 million barrels
of crude oil were consumed
every day
SOURCE: BP, Statistical Review of World Energy 2015. IEA, World consumption: Sankey Diagram, 2013
33 %
37 %
9 %
21 %
A Public Eye Investigation | September 2016 97
er of Trafigura. He argued “businesses that have not yet become masters of optionality will need to reconsider whether they can continue to afford not to.” Building global logistical networks at the lowest cost and attracting the talent to optimize them is part of mastering optionality. Further, “refineries offer even more op-tionality by allowing traders to change the production mix of different products. For example, they may switch the crude oil consumed between sources from different geographies. Traders used to obtain access to these assets mainly through long-term agreements for a portion of the assets’ available capacity. Now that many commodity traders have grown, they have ramped up their direct investments in larger existing projects or new ones such as terminals and refineries.”33
A Geneva-based trader confirms this trend: “Traders buy re-fineries only with a trading perspective, not an industrial one. For them, it’s okay to lose on refinery production, as long as they make more profit on trading. They earn blending opportunities and maintain access to cheap blendstocks, including the possi-bility to process crappy crude. In one word: buying refineries provides more optionality to traders. They can make arbitrage on products that the market doesn’t want otherwise.”
Vitol (through Varo Energy – a joint venture of Vitol, Carlyle group and Dutch-based Reggeborgh) runs two European refin-eries, one of them in Cressier, in the Swiss canton of Neuchâtel.
Trafigura (also via its retail arm Puma) has invested in what they call “pocket refineries”: “Refining is not part of the
Puma Energy core business model. We own and operate refin-ing assets where it makes sense to do so. In the overwhelming majority of instances we act as buyers from refineries; how-ever, we do operate two pocket refineries, which are the only exceptions.”34 Since 2012, Trafigura has owned the Nagarjuna Oil Refinery in India and is responsible for supplying the crude oil feedstock and off-taking some of the refinery prod-ucts.35
Gunvor also owns a refinery in Ingolstadt, Germany36 and Gunvor Petroleum Antwerp (GPA) in Belgium.37 At the begin-ning of 2016 it was completing a deal to buy its third European refinery, the Kuwait refinery in Europoort, Rotterdam, now called Gunvor Petroleum Rotterdam (GPR).38 Gunvor’s Chief Executive Torbjörn Törnqvist was quoted as saying that com-patibility with its Antwerp refinery was a key factor in the Rotterdam purchase.39 This is in line with the trend that refin-eries are increasingly looking for flexibility (considered neces-sary to survive) by working in close collaboration with other refineries that have a different configuration. Total’s refinery in Vlissingen (a joint venture with Lukoil), for example, works with Total’s refinery in Antwerp. The ExxonMobil refineries in Rotterdam and Antwerp also work closely together. There-fore tankers constantly move back and forth between the ports of Rotterdam and Antwerp.40 Gunvor’s Antwerp refinery is a “swing refinery” that can easily switch from one feedstock to another (see box 9.3).
Box 9.3 – GUNVOR’S SWING REFINERY IN ANTWERP
Gunvor Petroleum Antwerp (GPA) in Belgium is an example of a “swing refinery”. The refinery can use a very flexible range of feeds. Its main feed is Russian Urals crude purchased on a spot basis, and this is often supplemented with a mixture of niche grades that allows the refinery to improve its margins considerably.41 Where traders would acquire or have access to off-spec, contaminated or low-quality batches that are too poor to use as blendstocks, having a refinery comes in very handy.
In 2012, Gunvor took over the former bankrupt Petroplus refinery, first called Independent Belgium Refinery (IBR), now GPA. GPA writes on its website that it is “ideally located in the ARA hub to optimize our logistics and trading. [...] The refinery’s large storage capacity and the flexibility of its installations give us capabilities to handle a wide range of both intermediate and finished products.”42
We discussed Gunvor’s move with the Port of Rotterdam’s Russian expert, Louis Monninkhof, and Mrs Pype, from the Port of Antwerp. They share the view that it is an asset for Gunvor to provide more options to increase its margins:43
“Gunvor really operates GPA as a refinery and they have just
invested large amounts of money in it. It surprised me though to learn that the GPA refinery is falling within the logistics department of Gunvor, counted as tank storage. The refining they do is effectively to blend products: to upgrade low- quality grades, for example. And they also refine the crude oil that enters the port of Antwerp.”44
Asked if the refineries in Antwerp and Rotterdam only produce Gunvor's own products, Gunvor answered that it purchases all of the crude oil and feedstocks that are processed in their refineries, and sells the products to a multitude of buyers. The company also added that “any finished products purchased from GPR or GPA are meeting European specifi cations."
In Gunvor’s bond prospectus we read that the refinery is an important asset for their gasoil trading: “Gunvor is active in the Amsterdam-Rotterdam-Antwerp region gasoil barges market relying on its access to storage facilities in Amster-dam. Gunvor’s trading activity in this area has increased substantially since the acquisition of the Antwerp Refinery in 2012.” The refinery has a tank farm of 90 tanks, providing the trader with a high storage capacity of 1.2 million cubic metres and supporting Gunvor’s trading.45
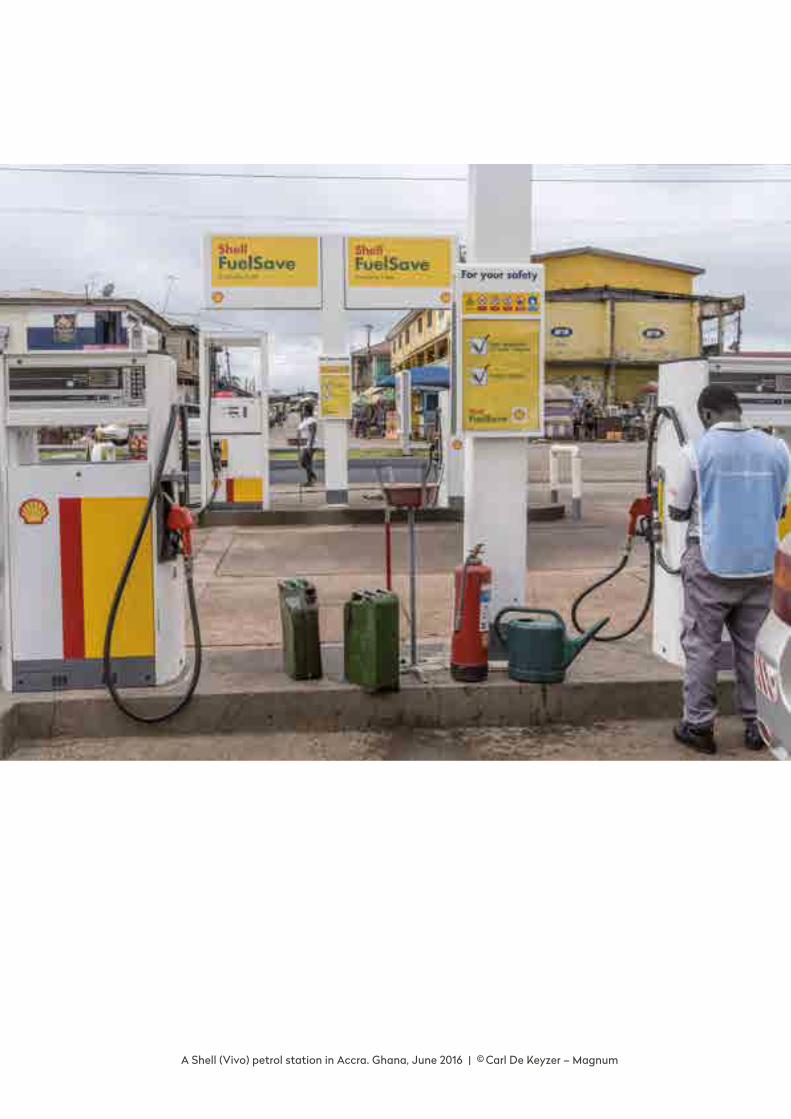
A Shell (Vivo) petrol station in Accra. Ghana, June 2016 | © Carl De Keyzer – Magnum
A Public Eye Investigation | September 2016 99
10
Making “African Quality”
fuels
Weak fuel standards in Africa allow the use of cheap and low-quality blendstocks in the manufacture of so-called “African Quality” fuels. These blendstocks are often harmful to both health and the environment.
European and American markets do not accept the use of such low- quality blendstocks as fuel ingredients. These blendstocks need further treatment to minimise or eliminate the hazardous substances.
Some blendstocks, including those that are waste or recycled from the chemical industry, pose additional risks when blended into fuels.
For traders, however, these blendstocks are cheap, and they can be profitably used to produce African Quality fuels.
100 DIRTY DIESEL – How Swiss Traders Flood Africa with Toxic Fuels | Chapter 10
In the previous chapter, we saw how gasoline and diesel are produced through a process known as blending. This chapter turns more specifically to the blending of African Quality fuels, the different blendstocks used, and the role of Swiss trading companies. In the following chapter we examine the two im-portant blending hubs, which make African Quality fuels for delivery to West Africa: the Amsterdam-Rotterdam-Antwerp (ARA) region and the waters offshore Lomé, Togo.
“African Quality” is the industry term for fuels that are des-tined for African markets. They are characterised primarily by their high sulphur content, though the term also refers to fuels with other low-quality aspects such as a high olefinic or aro-matic content. In short, this definition of African Quality matches the type of fuels that we found at petrol stations owned by Swiss trading companies in Africa.
African countries tend to have less strict specifications for diesel and gasoline than their counterparts in Europe, particu-larly in relation to limits on sulphur, polyaromatics and ben-zene. For trading companies and others, access to this market provides a profitable opportunity to make fuels for Africa using blendstocks that are cheap, dirty, and therefore damaging to people’s health.
To be sure, blending is a legitimate and necessary technical process. But there is a large margin for abuse when it comes to blending low-quality blendstocks. We call this practice “blend- dumping” and we consider it to be illegitimate. Contaminants such as sulphur and benzene should be eliminated as much as possible from all blendstocks, not diluted to meet the weaker standards of African countries.
10.1 – THE COMMERCIAL MOTIVATIONS FOR BLENDING AFRICAN QUALITY
Besides the technical reasons for blending fuels, there are also commercial motivations for finding the cheapest combination of blendstocks for any given specification of fuel product.
Traders and other blenders, who have a below specification product on their hands, will search the market for blendstocks (also referred to as “tasty juices”) that will enable them to pro-duce a final product that meets the appropriate specifications. Examples of such blendstocks might include TX mixtures1 or alkylates used for boosting the octane levels in low octane gas-olines. The closer to the specification boundary that the product lies, the larger the potential margin for the trader.
On the other hand, if the trader has a product that is within the specification, then he may be able to purchase cheap, low- quality “juices” to blend in. The process of lowering product quality is known in the industry as “filling up quality give-away,” says refinery expert Paul Deelen.2 “Filling up quality give-away” is most common with regards to the octane number, sulphur, and aromatics content for gasoline, and with regards to the cetane number and sulphur content for diesel.
We asked companies how they decrease the quality of the products to meet African specifications. Most companies did not specifically answer this question, while Oryx Energies stat-ed that it "does not lower the quality of the products."
10.1.1 – WEAK FUEL STANDARDS FACILITATE “SULPHUR DUMPING”
Fuel standards in many African countries are very weak (see also box 10.1). And so the production of African Quality fuels can be done with cheap, high sulphur or other low-quality blendstocks. And that’s why blenders buy such low-quality blendstocks.
For example, when a new Colombian refinery was fine-tun-ing its production recently, it accidentally produced a batch of gasoline with sulphur levels as high as 3,000 ppm. According to Platts, the refinery has been quietly looking since then to un-load its toxic batch. “‘Maybe some blender buys it real cheap and dilutes it little by little,’ a Latin America trading source said.”3
Sometimes, a trader ends up with low-quality blendstocks as part of a “package deal” with a refinery. One expert told us: “State of the art refineries produce low sulphur fuels because these have the highest market value. In several countries though, such as Russia and Mexico, investments in desulphuris-ing technologies are lagging behind. Out-dated refineries drop large quantities of sulphur in small batches – visbreaking naph-tha4 is an example. These are marketed in so-called ‘package deals’ to the major fuel traders. The refineries say: ‘You buy from me this batch of fuel for this price, but then you need to take this batch of crap for half the price.’ Often these batches are blended away in African Quality fuels.”5
So, sulphur from crude oil could end up in any region where national regulations fail to restrict sulphur levels in diesel and gasoline in any meaningful way. This is true for many countries, not just in Africa, but also in Asia and Latin America. Sulphur also finds its way into jet fuels, residual fuel oil for ships and power plants, marine diesel fuels, home and industrial heating gasoil, lubricants, asphalt/bitumen and cokes.
One oil product created from the “bottom of the barrel” is commonly used as a basis for residual fuel oil used by ships and power plants. It is called “visbreaker residue” and is highly sul-phurous, often containing between 30,000 and 50,000 ppm sul-phur. As residual fuel oils are very viscous (syrupy), they can be conveniently used to “blend away” other dirty blendstocks. Some blendstocks, such as Light Cycle Oil, are of such poor quality that they are only suitable for blending into residual fuel oil. But since they are cheap, blenders sometimes use them to produce African Quality fuels (see Tables 10.1 and 10.2 on pages 106–107). The prices of these blendstocks correlate strongly with the market price of cheap marine fuel oil. Their low prices are precisely what make them attractive.
Even in the immediate aftermath of the Probo Koala disas-ter, Trafigura continued to get rid of highly toxic sulphur waste by mixing it into African fuels. In January 2007, Tra-figura chartered the tanker Ottavia, loading it with about 30,000 tons of gasoline from the UK’s Immingham refinery. This tanker then sailed to Slovag in Norway, where, accord-ing to a Norwegian documentary, “Dirty Cargo”, she picked up 5,855 tons of residue from caustic washing. The residue was similar to the waste that Trafigura had dumped in Abidjan just half a year before. And from Norway, the Ottavia sailed direct to West Africa, where she unloaded her cargo, staying offshore Lomé for two days before heading to Apapa (Lagos)
A Public Eye Investigation | September 2016 101
in Nigeria.6 Asked to answer specific questions on this old case, Trafigura decided not to respond.
Leaked internal documents from Trafigura show that Trafig-ura had already considered blending this waste aboard the Pro-bo Koala “in small percentages to different grades of petroleum blendstocks”.7 The commercial benefits of this unhealthy prac-tice are double: it adds volume to the product and it avoids the high costs of safely disposing dangerous waste.
10.1.2 – LOW-QUALITY BLENDSTOCKS BLEND EASILY INTO HEAVY AFRICAN DIESEL
We have seen how the cetane number and sulphur content are key factors when “filling up quality give-away” diesel. One petrolab su-pervisor who works closely with oil majors and trading companies told us that blending “on density” is also popular when making diesel for the African market. While the European standard allows a maximum density of 845 kg/m3, this figure can go as high as
880–890 kg/m3 in countries such as Zambia, Guinea and Angola. “You can see that these African diesels are almost DMA
quality [note: DMA is a grade of marine diesel fuel with a max-imum density of 890 kg/m3].8 A trader who sees these specs will be delighted because it allows him to blend away the heavy, the more syrupy, blendstocks like heavy gas oil and the cracked stuff,” the petrolab supervisor told us.9
Other examples of heavy blendstocks include vacuum gas oil, light cycle oil, pyrolysis gas oil and thermally cracked gas-oil such as visbreaker and coker gasoil. Table 10.1 (on page 106) shows how most of these heavy streams are not only cheap, but low quality too. That is, they are aromatic, olefinic and sul-phurous.
The high density specification of several African countries and the fact that aromatics are unrestricted in most African countries allows the dumping in African diesels of sulphur and aromatic hydrocarbons too. In chapter 6, we showed how many of the diesels we tested had high aromatic content.
Box 10.1 – “MANIPULATION AT THE PLACE OF DESTINATION”
The fact that African countries allow high sulphur content in fuels is the continent’s biggest regulatory failure on fuel specifications. However, it is not the only failure. A country also takes major risks when its fuel specifications are weak or unclear.
A laboratory supervisor explains a common trick in the business: “Take the example of a gasoline spec that requires the gasoline to be “clear and bright”. If the standard does not include a temperature at which the gasoline should appear clean and bright, then a trader can get an off-spec cargo to be accepted by heating the sample and instructing the surveyor to look again at the gasoline. When heated, the water present in the gasoline, which made the gasoline hazy at room temperature, will dissolve [temporarily] and the gasoline will pass its exam.”15 The trick is even more applicable to diesel.
Lax controls and weak capacity are contributing factors that allow bad quality fuels to enter the market. We talked to Arend van Campen who has been working as a superinten-dent for trading companies for decades, checking several petroleum discharges in African harbours. A superintendent is usually hired by traders to travel to loading and discharging terminals, or to tankers to supervise tanker loadings, discharges, and ship-to-ship oil transfers. “Manipulations at the place of destination” is a term that Van Campen used when explaining his former job.
In his book ‘Toxic Tanker’ he tells the story of the Probo Koala naphtha washing procedure. He explains the role of the
superintendent, also known as a “marine expeditor”,16 who is usually appointed by the cargo’s owner to control the discharge at destination and, if a problem arises, to make sure the cargo is accepted. “It can happen that a cargo is tested to be ‘on-spec’ at the port of loading, but arrives ‘off- spec’ at the port of discharge. Several things can be done to avoid problems, from hiding documents to convincing the surveyor (who is normally paid half by the buyer and half by the seller) to check the loading or unloading, or informing him where to take the samples in the tanker, thus defining which tanks will escape checks. Added to this is the fact that a surveyor usually has less knowledge on the product than the superintendent and is less well-paid. He is therefore more open to ‘facilitation gifts’ and more easily manipulated into accepting the cargo.”
When asked how a product can leave the port of origin “on- spec” but arrive “off-spec” in the port of destination, Van Campen explains that due to intense blending, and the tanker’s constant movement, the different blendstocks don’t always remain a homogeneous mix. That is, they can separate. So some additives, that have been injected into the cargo at the port of origin, no longer function. For example, in the case of a failing mercaptan scavenger that was added to reduce the fuel’s stinking mercaptans, the mercaptan level in the product at arrival will be too high. The fuel will have an intense stench making it more difficult to be accepted by the buyer.17 For more infor mation on the use of mercaptan scavengers, see Annex 2.
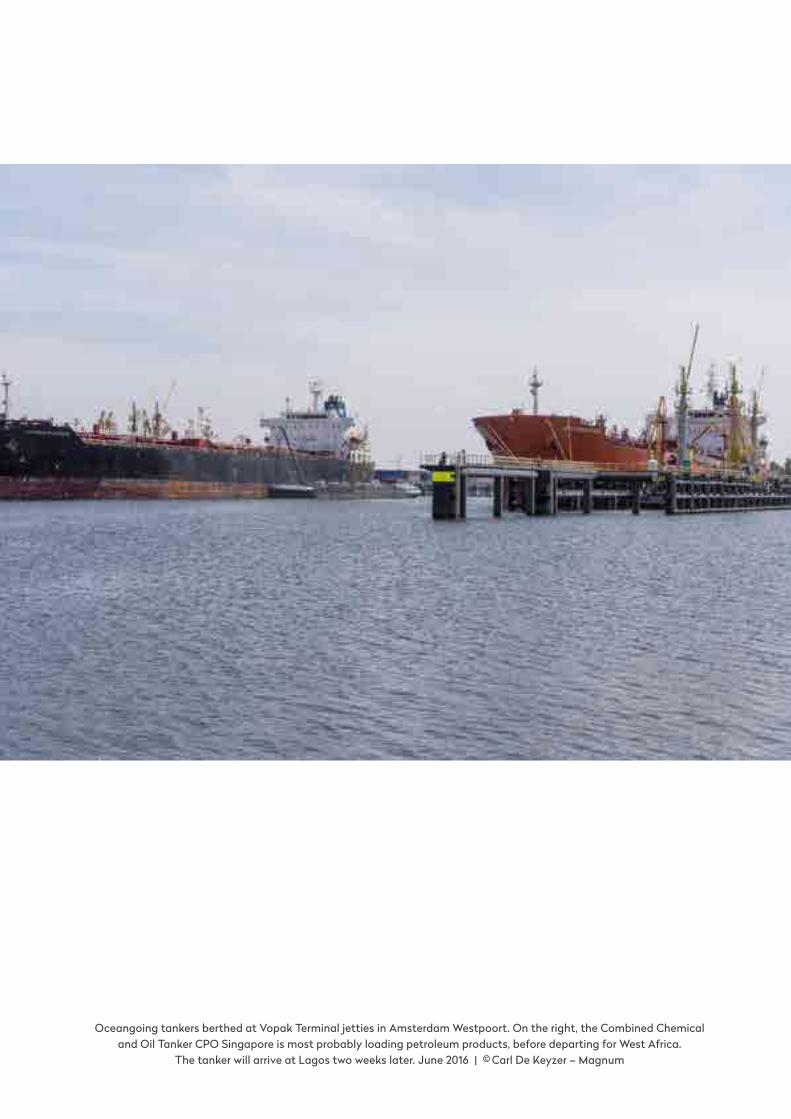
Oceangoing tankers berthed at Vopak Terminal jetties in Amsterdam Westpoort. On the right, the Combined Chemical and Oil Tanker CPO Singapore is most probably loading petroleum products, before departing for West Africa.
The tanker will arrive at Lagos two weeks later. June 2016 | © Carl De Keyzer – Magnum

A Public Eye Investigation | September 2016 103
10.1.3 – LOW-QUALITY BLENDSTOCKS BLEND EASILY INTO AFRICAN PRODUCTS
Besides selling African Quality fuels at the pump, traders also import dirty blendstocks into African countries for blending with products produced from high-quality African crude. Sev-eral African crude oils have the benefits of being both sweet (low in sulphur) and waxy.10 Examples are the AKPO blend from Nigeria, Cabinda from Angola, and Rabi Light from Ga-bon.11 Deelen, the refinery expert above, explains that “many African crude oils are waxy and therefore produce a very high cetane Light Gas Oil [...] making it a very popular blendstock for diesel.”12 Light Gas Oil can be used directly as diesel fuel; it does not need to be blended. Since many African countries have a lower minimum cetane number, often as low as 45, traders can work to the “fill up quality give away” blending rationale by “fill-ing up” African refined diesel before placing it onto the market.
There is a risk, however, that they are “filled up” with imports of low cetane blendstocks. As shown in table 10.1, low cetane blendstocks, for example Light Cycle Oil, often contain sub-stances such as sulphur and aromatics, which damage human health.
If a blender has no access to high cetane gasoil blendstocks and still wants to profit from using cheap and low cetane blend-stocks, there is always the option of additivation. Cetane im-provers such as HFA 3033, supplied by major additive supplier WRT, are widely used additives for diesel. And cetane boosters don’t cost a fortune.13 According to the petrolab supervisor, a trader could easily spend US$100,000 or more on cetane im-provers for a 30,000 tonne cargo leaving ARA for West Africa: “That looks like a lot of money, but if that allows them to blend in cheap and low cetane blendstocks, it is worth it.”14
10.1.4 – “BENZENE DUMPING” IN GASOLINE FOR WEST AFRICA
It is difficult to find out what trading companies have really blend-ed into fuels because the information is, of course, not publicly available. But we have been able to identify two cases of potential-ly high benzene blendstocks that were mixed into gasoline des-tined for the West African market. In both cases, the health-dam-aging blendstocks were loaded into tankers chartered by Swiss trading companies and berthed in Amsterdam’s Africa harbour. We don't know though who decided on the blending recipes, whether the trading companies or the seller, as both trading com-panies we asked said they had acquired the product as a finished grade of gasoline.
The first case concerns the tanker Conger chartered by Swiss trader Mocoh (see chapter 11). The second case concerns a tanker called High Beam, which was chartered by Mercuria18 and which visited the port of Amsterdam in March 2016 to load the follow-ing gasoline blendstocks – taken together, these blendstocks are an example of an African Quality recipe:
– Gasoline additive– Pygas – FCC gasoline
– Naphtha top– Eurobob <95 RON (a type of European quality gasoline, which will be on-spec after addition of ethanol)– LCCG heartcut
In this list, both pygas and LCCG heartcut stand out, because they are very high benzene blendstocks.
According to Paul Deelen, a refinery expert, who assessed the different blendstocks for us, this seems to be a typical case of downgrading, showing that dirty fuels are deliberately produced for the African market. Assuming that the Eurobob gasoline was on-specification, the rest was added to increase the volume in the cheapest possible way. The blending recipe includes sev-eral problematic blendstocks, such as FCC gasoline, which is cracked gasoline from the cat cracker. If not treated, it will be high in olefins, aromatics and sulphur. In addition, pygas can be up to 70 percent benzene if not debenzenised – 70 times the European limit for gasoline. Add to that LCCG heartcut. LCGG (Light Cat Cracked Gasoline) is the light fraction of a gasoline created by the cat cracker, it can have very high benzene levels. To use LCCG as a blendstock for a European gasoline, benzene must be a maximum 1 percent, so the refinery removes the “ben-zene heart”. That is why this separated stream is called LCCG heartcut.19 LCCG heartcut is a really cheap blendstock, with benzene levels also as high as 70 percent, probably used in this blend to increase the octane number. It is not clear what the additive was. It may have been an anti-oxidant, but it might also have been MMT, an octane booster (for more information on MMT, a controversial additive, see subchapter 10.3.4).
Asked about the High Beam, Mercuria did not answer de-tailed questions on the exact composition and origin of the dif-ferent blendstocks used and the share of them in the final gaso-line blend, but stated the following:
“Mercuria confirms that it has bought gasoline in Amster-dam directly from a local refiner at its Vopak terminal which de-livered the finished product into the vessel from its onshore tanks. The product was required to meet the Nigerian specifica-tions. No additives or semi-finished blendstocks have been fur-ther incorporated by Mercuria which sold the product “as is” to a couple of customers through Ship-to-Ship transfer offshore Lome. The commercial details related to the transaction(s), in-cluding the price or the quantities are confidential. We can also confirm that the technical specifications of the products, as test-ed and verified by a professional inspection company, have met all the specifications required by our local customers. Needless to say, Mercuria is always delivering products which are in ac-cordance with the requirements of its customers. Additionally, as part of its standard procedures, Mercuria is also making sure that the quality of the products it delivers is always fully compli-ant with the prevailing local legislations as it is defined by the local authorities.”
When asked further to identify the local refiner they refer to, and to provide details about the composition of the product (for example the benzene level), Mercuria was unwilling to share the information with us.
After loading in Amsterdam, the tanker High Beam left late in the evening flying the Panamanian flag and sailed straight to
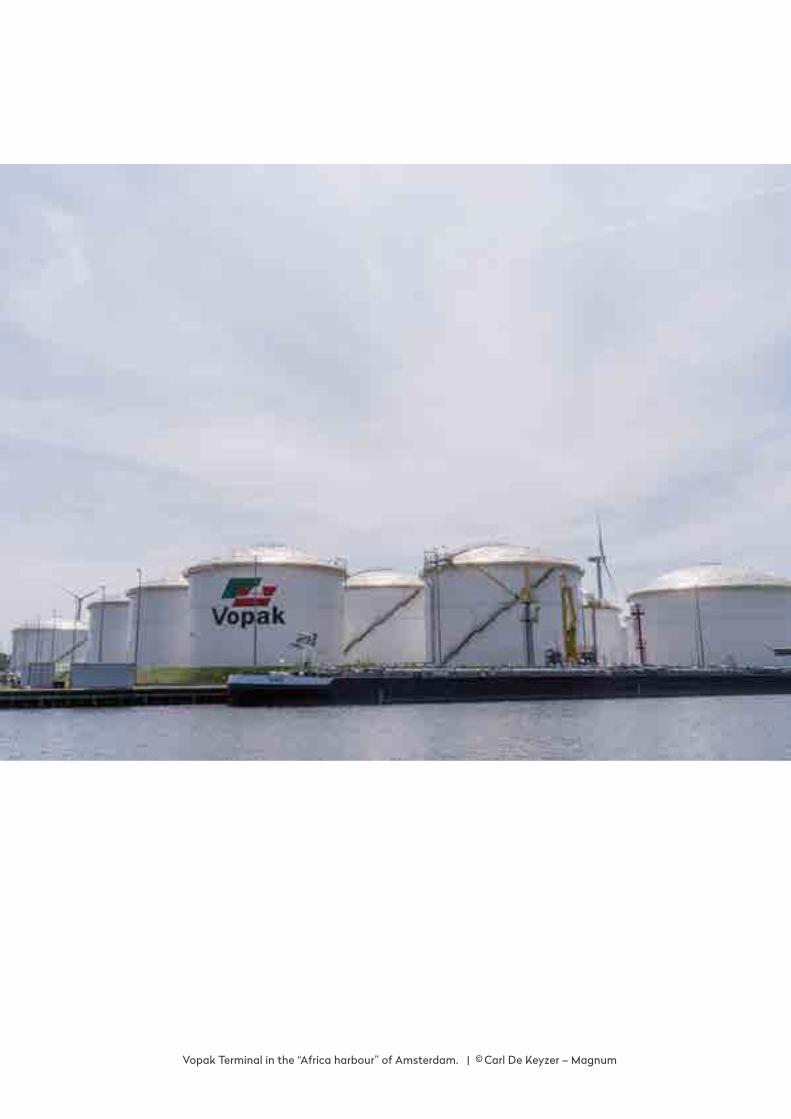
Vopak Terminal in the “Africa harbour” of Amsterdam. | © Carl De Keyzer – Magnum
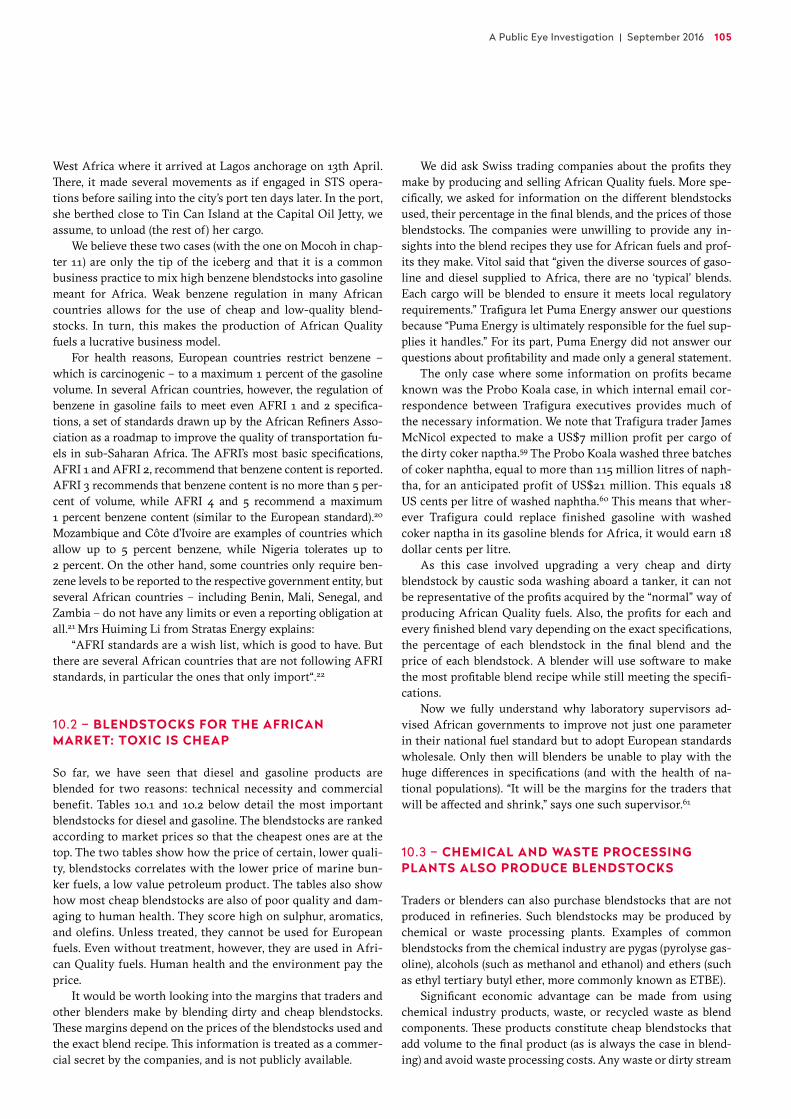
A Public Eye Investigation | September 2016 105
West Africa where it arrived at Lagos anchorage on 13th April. There, it made several movements as if engaged in STS opera-tions before sailing into the city’s port ten days later. In the port, she berthed close to Tin Can Island at the Capital Oil Jetty, we assume, to unload (the rest of) her cargo.
We believe these two cases (with the one on Mocoh in chap-ter 11) are only the tip of the iceberg and that it is a common business practice to mix high benzene blendstocks into gasoline meant for Africa. Weak benzene regulation in many African countries allows for the use of cheap and low-quality blend-stocks. In turn, this makes the production of African Quality fuels a lucrative business model.
For health reasons, European countries restrict benzene – which is carcinogenic – to a maximum 1 percent of the gasoline volume. In several African countries, however, the regulation of benzene in gasoline fails to meet even AFRI 1 and 2 specifica-tions, a set of standards drawn up by the African Refiners Asso-ciation as a roadmap to improve the quality of transportation fu-els in sub-Saharan Africa. The AFRI’s most basic specifications, AFRI 1 and AFRI 2, recommend that benzene content is reported. AFRI 3 recommends that benzene content is no more than 5 per-cent of volume, while AFRI 4 and 5 recommend a maximum 1 percent benzene content (similar to the European standard).20
Mozambique and Côte d’Ivoire are examples of countries which allow up to 5 percent benzene, while Nigeria tolerates up to 2 percent. On the other hand, some countries only require ben-zene levels to be reported to the respective government entity, but several African countries – including Benin, Mali, Senegal, and Zambia – do not have any limits or even a reporting obligation at all.21 Mrs Huiming Li from Stratas Energy explains:
“AFRI standards are a wish list, which is good to have. But there are several African countries that are not following AFRI standards, in particular the ones that only import“.22
10.2 – BLENDSTOCKS FOR THE AFRICAN MARKET: TOXIC IS CHEAP
So far, we have seen that diesel and gasoline products are blended for two reasons: technical necessity and commercial benefit. Tables 10.1 and 10.2 below detail the most important blendstocks for diesel and gasoline. The blendstocks are ranked according to market prices so that the cheapest ones are at the top. The two tables show how the price of certain, lower quali-ty, blendstocks correlates with the lower price of marine bun-ker fuels, a low value petroleum product. The tables also show how most cheap blendstocks are also of poor quality and dam-aging to human health. They score high on sulphur, aromatics, and olefins. Unless treated, they cannot be used for European fuels. Even without treatment, however, they are used in Afri-can Quality fuels. Human health and the environment pay the price.
It would be worth looking into the margins that traders and other blenders make by blending dirty and cheap blendstocks. These margins depend on the prices of the blendstocks used and the exact blend recipe. This information is treated as a commer-cial secret by the companies, and is not publicly available.
We did ask Swiss trading companies about the profits they make by producing and selling African Quality fuels. More spe-cifically, we asked for information on the different blendstocks used, their percentage in the final blends, and the prices of those blendstocks. The companies were unwilling to provide any in-sights into the blend recipes they use for African fuels and prof-its they make. Vitol said that “given the diverse sources of gaso-line and diesel supplied to Africa, there are no ‘typical’ blends. Each cargo will be blended to ensure it meets local regulatory requirements.” Trafigura let Puma Energy answer our questions because “Puma Energy is ultimately responsible for the fuel sup-plies it handles.” For its part, Puma Energy did not answer our questions about profitability and made only a general statement.
The only case where some information on profits became known was the Probo Koala case, in which internal email cor-respondence between Trafigura executives provides much of the necessary information. We note that Trafigura trader James McNicol expected to make a US$7 million profit per cargo of the dirty coker naptha.59 The Probo Koala washed three batches of coker naphtha, equal to more than 115 million litres of naph-tha, for an anticipated profit of US$21 million. This equals 18 US cents per litre of washed naphtha.60 This means that wher-ever Trafigura could replace finished gasoline with washed coker naptha in its gasoline blends for Africa, it would earn 18 dollar cents per litre.
As this case involved upgrading a very cheap and dirty blendstock by caustic soda washing aboard a tanker, it can not be representative of the profits acquired by the “normal" way of producing African Quality fuels. Also, the profits for each and every finished blend vary depending on the exact specifications, the percentage of each blendstock in the final blend and the price of each blendstock. A blender will use software to make the most profitable blend recipe while still meeting the specifi-cations.
Now we fully understand why laboratory supervisors ad-vised African governments to improve not just one parameter in their national fuel standard but to adopt European standards wholesale. Only then will blenders be unable to play with the huge differences in specifications (and with the health of na-tional populations). “It will be the margins for the traders that will be affected and shrink,” says one such supervisor.61
10.3 – CHEMICAL AND WASTE PROCESSING PLANTS ALSO PRODUCE BLENDSTOCKS
Traders or blenders can also purchase blendstocks that are not produced in refineries. Such blendstocks may be produced by chemical or waste processing plants. Examples of common blendstocks from the chemical industry are pygas (pyrolyse gas-oline), alcohols (such as methanol and ethanol) and ethers (such as ethyl tertiary butyl ether, more commonly known as ETBE).
Significant economic advantage can be made from using chemical industry products, waste, or recycled waste as blend components. These products constitute cheap blendstocks that add volume to the final product (as is always the case in blend-ing) and avoid waste processing costs. Any waste or dirty stream
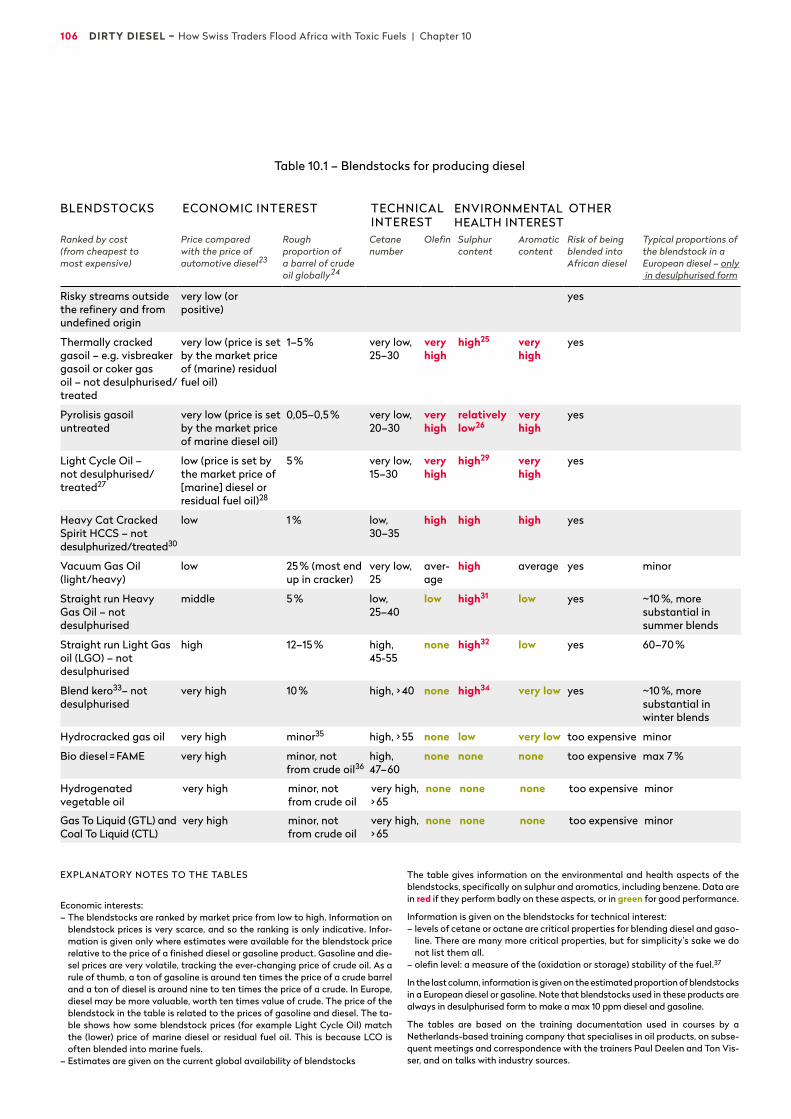
106 DIRTY DIESEL – How Swiss Traders Flood Africa with Toxic Fuels | Chapter 10
Table 10.1 – Blendstocks for producing diesel
EXPLANATORY NOTES TO THE TABLES
Economic interests:– The blendstocks are ranked by market price from low to high. Information on
blendstock prices is very scarce, and so the ranking is only indicative. Infor-mation is given only where estimates were available for the blendstock price relative to the price of a finished diesel or gasoline product. Gasoline and die-sel prices are very volatile, tracking the ever-changing price of crude oil. As a rule of thumb, a ton of gasoline is around ten times the price of a crude barrel and a ton of diesel is around nine to ten times the price of a crude. In Europe, diesel may be more valuable, worth ten times value of crude. The price of the blendstock in the table is related to the prices of gasoline and diesel. The ta-ble shows how some blendstock prices (for example Light Cycle Oil) match the (lower) price of marine diesel or residual fuel oil. This is because LCO is often blended into marine fuels.
– Estimates are given on the current global availability of blendstocks
The table gives information on the environmental and health aspects of the blendstocks, specifically on sulphur and aromatics, including benzene. Data are in red if they perform badly on these aspects, or in green for good performance.
Information is given on the blendstocks for technical interest: – levels of cetane or octane are critical properties for blending diesel and gaso-
line. There are many more critical properties, but for simplicity’s sake we do not list them all.
– olefin level: a measure of the (oxidation or storage) stability of the fuel.37
In the last column, information is given on the estimated proportion of blendstocks in a European diesel or gasoline. Note that blendstocks used in these products are always in desulphurised form to make a max 10 ppm diesel and gasoline.
The tables are based on the training documentation used in courses by a Netherlands-based training company that specialises in oil products, on subse-quent meetings and correspondence with the trainers Paul Deelen and Ton Vis-ser, and on talks with industry sources.
BLENDSTOCKS ECONOMIC INTEREST TECHNICAL INTEREST
ENVIRONMENTAL HEALTH INTEREST
OTHER
Ranked by cost (from cheapest to most expensive)
Price compared with the price of automotive diesel23
Rough proportion of a barrel of crude oil globally24
Cetanenumber
Olefin Sulphur content
Aromatic content
Risk of being blended into African diesel
Typical proportions of the blendstock in a European diesel – only in desulphurised form
Risky streams outside the refinery and from undefined origin
very low (or positive)
yes
Thermally cracked gasoil – e.g. visbreaker gasoil or coker gas oil – not desulphurised/treated
very low (price is set by the market price of (marine) residual fuel oil)
1–5 % very low, 25–30
very high
high25 very high
yes
Pyrolisis gasoil untreated
very low (price is set by the market price of marine diesel oil)
0,05–0,5 % very low, 20–30
very high
relatively low26
very high
yes
Light Cycle Oil – not desulphurised/treated27
low (price is set by the market price of [marine] diesel or residual fuel oil)28
5 % very low, 15–30
very high
high29 very high
yes
Heavy Cat Cracked Spirit HCCS – not desulphurized/treated30
low 1 % low, 30–35
high high high yes
Vacuum Gas Oil (light/heavy)
low 25 % (most end up in cracker)
very low, 25
aver-age
high average yes minor
Straight run Heavy Gas Oil – not desulphurised
middle 5 % low, 25–40
low high31 low yes ~10 %, more substantial in summer blends
Straight run Light Gas oil (LGO) – not desulphurised
high 12–15 % high, 45-55
none high32 low yes 60–70 %
Blend kero33– not desulphurised
very high 10 % high, > 40 none high34 very low yes ~10 %, more substantial in winter blends
Hydrocracked gas oil very high minor35 high, > 55 none low very low too expensive minor
Bio diesel = FAME very high minor, not from crude oil36
high, 47–60
none none none too expensive max 7 %
Hydrogenated vegetable oil
very high minor, not from crude oil
very high, > 65
none none none too expensive minor
Gas To Liquid (GTL) and Coal To Liquid (CTL)
very high minor, not from crude oil
very high, > 65
none none none too expensive minor
A Public Eye Investigation | September 2016 107
Table 10.2 – Blendstocks for producing gasoline
BLENDSTOCKS ECONOMIC INTEREST TECHNICAL INTEREST
ENVIRONMENTAL HEALTH INTEREST
OTHER
Ranked by cost (from cheapest to most expensive)
Price compared with the price of gasoline38
Rough proportion of a barrel of crude oil globally39
Octane level
Olefin Sulphur content
Aromatic content (incl. benzene)
Risk of being blended into African gasoline
Typical proportions of the blendstock in a European gasoline – only in desulphurised form
Risky streams outside the refinery and from undefined origin
very low (or positive)
yes
Butane very low40 ~5 % 94 average (can be high)
none none 10 %41
Thermally cracked naphtha (e.g. coker or visbreaking naphtha)
very low minor42 ~ 80 high very high43 high yes 0 %
Cat cracker naphtha/FCC gasoline (heavy CC spirit) – not desulphurised/treated
very low 1–2 % 90–98 high high high yes 0 %
Cat cracker naphtha/FCC gasoline (light CC spirit) – not desulphurised/treated
very low 10–12 % 90–98 high high high yes 20–30 % (for some up to 50 %)
Light straight run naphtha – not desulphurised/treated
low44 minor45 60–75 low high46 low yes 5–10 %
Pygas untreated low47 minor 88–95 high (25–55 %)
high48 high (can have benzene up to 50–70 %)
yes 0 %
Reformate < 50 % aromatics
low–middle49 8–10 % (this figure is for the four different reformates together)
~90–98 low none very high (benzene 40–55 %)
yes Often deben-zenised for European market
Reformate > 50 % aromatics
middle50 — ~ 98–104 low none very high (benzene 40–55 %)
yes 0 %-minor
Pygas treated middle minor 88–95 low low sulphur low minor
Isomerates high 3–4 % 78–92 none none none minor
Modern reformate – octane minus51
high — ~95 low none low max 5 %
Cracked naphtha from hydrocracker (also used a feedstock for naphtha stream cracker
high Minor52 40–85 low low sulphur low 0 %
Modern reformate – octane plus
very high — ~98–104 low none low around 50 %
Alkylates very high 2 %53 93–96 none low sulphur, free of olefins & aromatics
none minor
Ethers (like MTBE)54 not related to gasoline price
1–3 % 116 none none none max 15 %
(B)TX mixtures55 not related to gasoline price56
Minor 124 none none n/a
Alcohols (like ethanol and methanol)57
not related to gasoline price58
5–10 % 111–114 none none max 10 % in Europe
108 DIRTY DIESEL – How Swiss Traders Flood Africa with Toxic Fuels | Chapter 10
within the boiling range of the fuel (see chapter 9) can get blend-ed in. But the risks are also high: the composition of waste and other streams of unidentified origin is unknown. They may con-tain chlorine or high levels of heavy metals.
A trader may transport off-spec or contaminated blend-stocks, or waste streams, to its own refinery or any other plant capable of a small processing job, such as Odjfell in the Nether-lands or Petrochem-Carless in the UK. Once upgraded, the product would likely be used as a blendstock to produce fuels for markets outside of Europe or North America. It could also be used for African Quality fuels.
10.3.1 – CHLORINE DESTROYS CARS, AS WELL AS HEALTH
Waste streams often contain chlorine that, when burned in oil, produces highly toxic and carcinogenic dioxins.62 In addition to its serious health and environmental impacts, chlorine also damages car engines. No wonder the automobile industry warns against chlorine in fuels:
“Organic chlorine may enter the fuel through contamination with chemical or waste solvents. Chlorine forms highly corro-sive acids during combustion, which can significantly reduce the durability of the engine, fuel system, and emissions control system. In the worst case, chlorine may lead to catastrophic en-gine failure, as injectors fail to operate or operate improperly af-ter various periods and levels of exposure.”63
From a regulator’s perspective, contaminants like chlorine pose a challenge. The usual tests conducted would not normally indicate their presence. Paul Deelen, a refinery expert, outlines the further risks associated with high chlorine waste streams being blended into fuels:
“What is most common, in my view, is that a large amount of organic chlorine from particular waste or high benzene streams is blended into gasoline. A risky blendstock could come from new processes to recycle plastics – oil derived from plas-tics, for example. Other risky streams from undefined origins are waste streams, like solvents collected from chemical compa-nies or streams from the industry that recycles waste oils from ships, processing it into marine fuels. It is possible that some would blend the lighter fractions into African diesel.”64
Regulation on chlorine in fuels and blendstocks varies sig-nificantly within the ARA region. In the Netherlands, regula-
tion strictly limits chlorine levels in fuels. For example, organic halogen (containing fluorine, chlorine, bromine and iodine) is restricted to a maximum 50 ppm in both fuels and blendstocks
used for fuel production.65 In neighbouring Belgium, however, the organic halogen is not restricted in fuels or any of their blendstocks.66 Deelen told us: “High chlorine naphthas tend to be first diluted to 49 ppm chlorine in Belgium, before they are transported to the Netherlands. The rest – undiluted, high chlo-rine fuel – may instead be shipped from Antwerp to African markets.”67
An expert in treating off-spec gasoline and diesel cargoes made further reference to traders blending high-quality prod-ucts with those of lower quality: “If a copper corrosion test on the fuel doesn’t show 1B but 1A [which is better], while only 1B is required, the blender has margin to manoeuvre. If a cargo is on 110 percent [i.e. 10 percent above spec], the blender has space to blend stuff away.” The expert went on to warn that, from an environmental perspective, one should not pay attention to the name of the blendstock – which could mean anything – but to how the blendstock was used before. For example, “transformer oil” is easily contaminated with PCBs and is therefore a risky blendstock68 (see box 10.2).
10.3.2 – A MARRIAGE OF INDUSTRIES
The chemical and blending industries are heavily interlinked. Some 25 percent of the naphtha produced in refineries world-wide is then sold to the chemical industry, which converts it into chemicals such as polypropylene and polyethene for use in the production of various plastics. The dirty by-products of this process – pygas and pyrolysis gasoil – are returned to the oil trading industry, which – among other things – blends them into African fuels. As we have seen, recycled chemicals or waste from the chemical industry can also be blended into these fuels.
This linkage took on a new commercial reality, when the China National Chemical Corporation (“ChemChina”), one of China’s largest chemical companies, bought a 12 percent stake in Switzerland’s Mercuria Energy Trading74, an otherwise pri-vate company. ChemChina runs nine refineries, and partnering with it clearly increases Mercuria’s optionalities. The Swiss company already does a lot of business in, and with, China.
10.3.3 – CONTAMINATION AND ENGINE FAILURE
Blending waste products or chemicals can also occur by mistake. In the UK in 2007, and then in the US in 2009, the contami-
nation of gasoline with silicone caused engine failure in thou-sands of cars, bringing them to a halt. In the UK case, octane levels in gasoline had been increased by adding toluene, but the toluene had previously been used to wash silicon chips thus contaminating it. In the US case, the contamination likely oc-curred because the gasoline had been manufactured with anti- foam agents containing silicon.75 “Such contaminated streams would not commonly be used for European or American gaso-line, though it may be tempting for some to use them in gaso-lines destined for the African market,” says refinery expert Paul Deelen. In one of our gasoline samples taken from the Puma station in San Pedro, Côte d’Ivoire, we found a high content of silicon (see chapter 6).
Significant economic advantage can be made from using chemical
industry products, waste, or recycled waste as blend components.
A Public Eye Investigation | September 2016 109
Polychlorinated biphenyls (PCBs) are man-made chemicals known as persistent organic pollutants (POPs). They are extremely harmful to the environment and human health. If a fuel is contaminated with chlorinated wastes like PCBs, then burning it at less than 1,000°C will cause the formation of highly toxic products, such as dioxins and dibenzofurans.69
Manufactured since the 1930s, PCBs are noted for their chemical stability. They have been used for a variety of industrial and commercial purposes such as hydraulic, transformer and heating fluids. PCBs do not mix well with water, but they dissolve in most organic solvents, such as oil and grease. These solvents are therefore easily contaminat-ed. In the 1970s, when researchers discovered how serious a threat they represented to human health and the environ-ment, their production was gradually phased-out. For decades, national and international decision-makers have been concerned about their elimination and safe disposal.
Today, PCBs fall under the scope of three legally binding international treaties on chemicals and waste: the Basel Convention, the Rotterdam Convention and the Stockholm Convention. Due to the widespread reliance on PCB-contain-
ing equipment such as electrical transformers and capacitors, countries are allowed to continue using PCBs in equipment until 2025, as long as leaks can be prevented, while the international community works towards the safe manage-ment and destruction of PCB oils and contaminated equip-ment. PCBs, therefore, continue to be widely used. The Secretariat of the Stockholm Convention estimates that in 2015, some 2.2 million tonnes of PCB-containing waste still required safe disposal.70 71
The regulations requiring the safe disposal of PCBs may unintentionally encourage the uncontrolled dumping of PCBs in fuels, since this is financially far more attractive than safe disposal. Industry insiders say the PCBs from dismantled transformers in Eastern Europe and Russia represent a significant proportion of the major volumes of hazardous waste produced in these countries. These countries have less developed infrastructure for waste disposal. They also have less legislation, and less enforcement, on responsible waste management. So, there is a risk that oils and other liquids containing PCBs will end up in fuels.72 It is also possible that transformers are cleaned with PCB-containing solvents after which these solvents are blended into diesel.73
Box 10.2 – EVEN HARMFUL POLYCHLORINATED BIPHENYLS (PCBS) CAN END UP IN FUELS
Silicon has been found in gasoline samples elsewhere too. In its most recent Worldwide Fuel Charter, the automobile in-dustry says: “The source is usually silicon-containing waste solvents added to the gasoline after the fuel has left the refin-ery. Such contamination has significant adverse effects on the engine and emissions control systems. Even in low concentra-tions, silicon can cause failure of the oxygen sensors and high levels of deposits in engines and catalytic converters. This can lead to catastrophic engine failures in less than one tankful of contaminated fuel.” The charter recommends that silicon is never used to improve gasoline and engine performance. Rath-er, it should be strictly controlled, including checks at the pump if necessary.76
In 2006, Swiss trading company Glencore transported more than 10,000 tonnes of gasoline mixed with acetone from Singa-pore to the Vietnamese market. Reports emerged that this gaso-line was “causing car and motorbike engines to stall, due to the expansion of rubber parts inside.”77 The troublesome gasoline was first detected in Ho Chi Minh City, then in other provinces, including Tien Giang in the South and Da Nang, Thua Thien-Hue, Binh Dinh, Kontum and Quang Tri in the central region.78
Thousands of vehicle engines, mostly motorcycles and scooters, were adversely affected. Tests conducted later on the gasoline found high levels (10–17 percent) of acetone. Unfortunately, this acetone had already damaged engine fuel systems by the time
that the contaminated fuel could be removed from service sta-tions around the country.79
Acetone is a common industrial and household substance (used in nail polish remover, for example), neither present in crude oil nor created during the refining process. With a boiling point of 56°C acetone is within the boiling range of gasoline, hence it can be mixed into gasoline. One news article reported that adding acetone to gasoline could increase fuel companies’ profits fourfold. The two Vietnamese importers laid the blame for the contaminated gasoline with their supplier, Glencore Sin-gapore Ltd., which took back all the adulterated fuel it had sup-plied to Vietnam.80
According to Paul Deelen, “a professional trader would never mix acetone into gasoline. It is well known that acetone is an aggressive solvent that damages rubber, so it is illogical to deliberately mix such high percentages into gasoline. If it was intentionally added, the blender would have limited it to 1 per-cent or so.”81
Asked about this case, Glencore confirms that it added ace-tone intentionally, but that the amount was by mistake. “Acetone is a solvent that is an industry recognised and approved additive used to increase the oxygenation properties of gasoline. In 2006, too much acetone was mistakenly added to a shipment of gaso-line that was destined for the Vietnamese market. The blending took place in Singapore. As soon as this error was identified, the
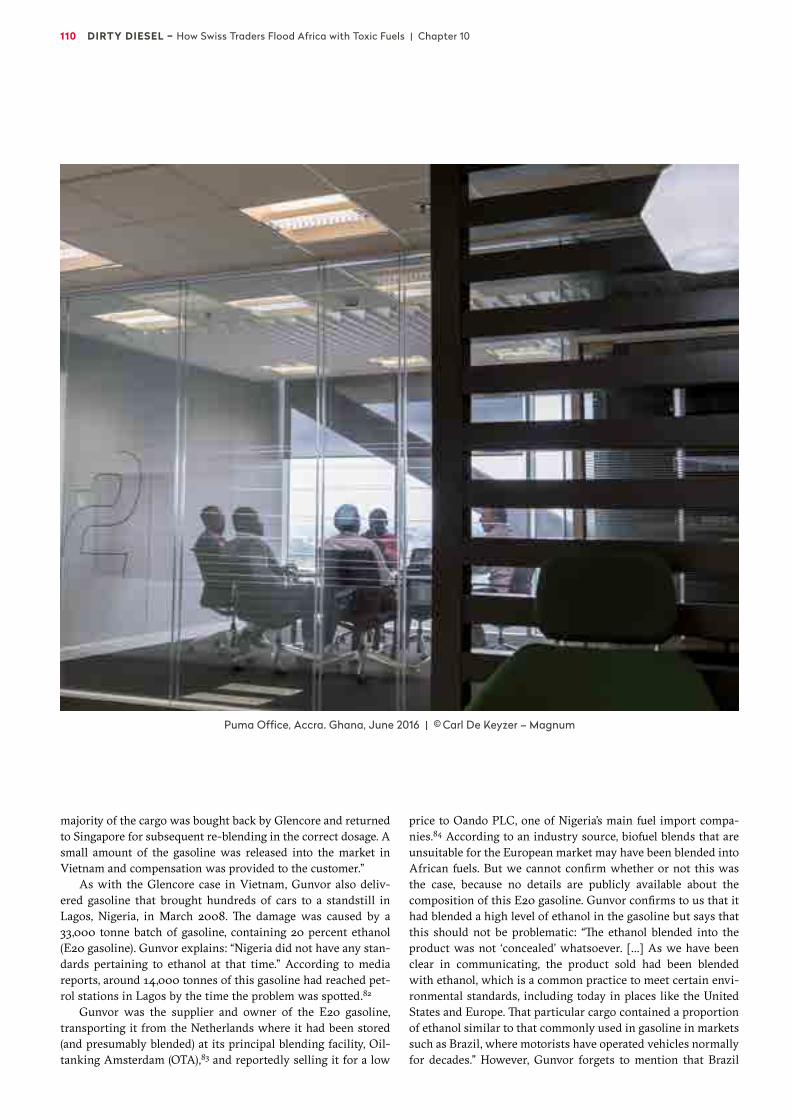
110 DIRTY DIESEL – How Swiss Traders Flood Africa with Toxic Fuels | Chapter 10
majority of the cargo was bought back by Glencore and returned to Singapore for subsequent re-blending in the correct dosage. A small amount of the gasoline was released into the market in Vietnam and compensation was provided to the customer.”
As with the Glencore case in Vietnam, Gunvor also deliv-ered gasoline that brought hundreds of cars to a standstill in Lagos, Nigeria, in March 2008. The damage was caused by a 33,000 tonne batch of gasoline, containing 20 percent ethanol (E20 gasoline). Gunvor explains: “Nigeria did not have any stan-dards pertaining to ethanol at that time.” According to media reports, around 14,000 tonnes of this gasoline had reached pet-rol stations in Lagos by the time the problem was spotted.82
Gunvor was the supplier and owner of the E20 gasoline, transporting it from the Netherlands where it had been stored (and presumably blended) at its principal blending facility, Oil-tanking Amsterdam (OTA),83 and reportedly selling it for a low
price to Oando PLC, one of Nigeria’s main fuel import compa-nies.84 According to an industry source, biofuel blends that are unsuitable for the European market may have been blended into African fuels. But we cannot confirm whether or not this was the case, because no details are publicly available about the composition of this E20 gasoline. Gunvor confirms to us that it had blended a high level of ethanol in the gasoline but says that this should not be problematic: “The ethanol blended into the product was not ‘concealed’ whatsoever. […] As we have been clear in communicating, the product sold had been blended with ethanol, which is a common practice to meet certain envi-ronmental standards, including today in places like the United States and Europe. That particular cargo contained a proportion of ethanol similar to that commonly used in gasoline in markets such as Brazil, where motorists have operated vehicles normally for decades.” However, Gunvor forgets to mention that Brazil
Puma Office, Accra. Ghana, June 2016 | © Carl De Keyzer – Magnum
A Public Eye Investigation | September 2016 111
has been blending ethanol into gasoline since 1975, and Brazil-ian carmakers have adapted their gasoline engines to run smoothly with this range of mixtures, while in Nigeria they have not.
We do know that this scandal made a lot of people in Nigeria very angry. The Department of Petroleum Resources (DPR) was forced to act, demanding that the poor quality gasoline be sent back to Amsterdam. Oando in turn stated that it would sue Gunvor, accusing the trader of concealing the ethanol content in the fuel.85
Gunvor responded in the media and to us, stating that the facts reported were incorrect, that the gasoline had been con-trolled during loading in Amsterdam and delivery in Lagos, and that it had complied with quality specifications set out in the contract between Gunvor and the Nigerian buyer.86 Asked to respond to specific questions on this old case, Gunvor stated to us that the ethanol was not the problem but blamed the import-er in Nigeria for improper storage that “caused the product to be mixed with water and mud, among other contaminants, which resulted in the issue with the cars.”
The E20 gasoline was shipped back to OTA in Amsterdam. According to our source, who was close to the case, Dutch pro-secutors charged OTA for violation of the EU’s Waste Shipment Regulation by illegally importing waste but neglecting to notify the competent authorities. It is not clear to us why the terminal, and not Gunvor as owner of the waste fuel, was charged. How-ever, the case on OTA was reportedly settled and no more de-tails are available. We do not know what happened to the batch of E20 gasoline. Gunvor confirmed to us that it had provided information to the Dutch authorities but that it had “effectively demonstrated our compliance with all regulations. Neither Gunvor nor its traders have been found guilty of any violation and no fines were imposed on Gunvor.”
10.3.4 – CHEMICAL CONTAMINATION BY MANGANESE: A CONTROVERSIAL ALTERNATIVE FOR LEAD
Sometimes chemicals are intentionally mixed into fuels in the form of additives – not as a cheap blendstock but to improve the performance or quality of the product. For decades, lead was added to gasoline to increase the octane level, for example. But scientists identified leaded gasoline as a major health and envi-ronmental hazard, and a campaign by UNEP and The Partnership for Clean Fuels and Vehicles (PCFV), which began in 2002, even-tually led to a near global ban that has been in effect ever since.87
Achim Steiner, UNEP executive director, commented in 2011 on the near global phase out of leaded gasoline: “This will go down in history as one of the major environmental achievements of the past few decades.” But, he added, the cleaner fuel effort still has a long way to go. He was referring to other hazardous vehi-cle emissions, including the unacceptably sulphurous fuels still being sold in African countries.88
The phasing out of lead additives did not happen smoothly, however. Some still put commercial interests before human health. Between 2000 and 2008, executives from Octel – which subsequently changed its name to Innospec – bribed officials in Iraq and Indonesia millions of dollars to allow the continued
sale of leaded gasoline, even after it was banned from western countries on health grounds.89 The executives were subsequent-ly convicted by US and British courts between 2010 and 2014. But Iraq still allows leaded gasoline.
As the regulations restricting the use of lead came into force, a controversial alternative additive, an octane enhancer called Methylcyclopentadienyl Manganese Tricarbonyl (MMT), emerged, that we also found in several of our samples (see chapter 6). MMT is produced by Afton Chemical Corporation (formerly Ethyl Corporation) – the company that, for decades, produced a controversial lead additive (tetraethyl).90 According to the pro-ducer, MMT can be used in very small amounts, increases oc-tane in an environmentally friendly and cost effective manner, and poses no risks to human health.91
But MMT is based on the heavy metal manganese, a neuro-toxin. When burned in gasoline, MMT releases particles such as manganese phosphates, manganese sulphates and manganese oxides into the air. When inhaled, these compounds enter the bloodstream through the lungs and deliver dangerous doses of manganese to the brain. Accumulation of this element can lead to Parkinson’s disease-like symptoms, including loss of motor control, memory loss, and erratic behaviour.92
As with lead, this additive raises serious concerns for public health. In 2009, the European Union effectively banned MMT in European gasoline. As shown in chapter 6, the current maxi-mum level of MMT in Europe makes its use uneconomical and it is not used anymore in European fuels. In the US, manganese is prohibited in reformulated gasoline (which comprises 60 per-cent of US fuel supply), while the state of California bans it out-right.93
According to Paul Deelen, it’s possible that manganese addi-tives are used to increase the octane level of gasolines destined for the African market.94 Indeed, none of the ten African coun-tries, where we took samples, bans manganese in gasoline. Only Ghana restricts manganese to a maximum 18 mg per litre. This is the level recommended by Afton Chemical.95 And two gaso-line samples from Senegal and Côte d’Ivoire showed high levels of manganese (see chapter 6).
While ARA countries have de facto banned the use of MMT in their own gasoline, MMT is surely added to gasoline intended for other destinations. We found for example Afton Chemical’s HiTEC 3062 on Hazardous Components Lists col-lected from tank terminals in Amsterdam (see chapter 11). Ac-cording to Afton Chemical’s website, its HiTEC ® 3000 Series of products all contain MMT, which enables the delivery of economic and on-specification gasoline – whatever the octane target. “That’s why 150 refineries and blenders in 53 countries are happy to use our solutions.”96 According to the ICCT, MMT is not widely used in western countries, but it is being market-ed heavily in developing nations as a convenient and low-cost lead replacement. Afton does not publish the list of countries where its product is sold, and there is no data publicly avail-able to show what volume of MMT is being channelled to Africa.97
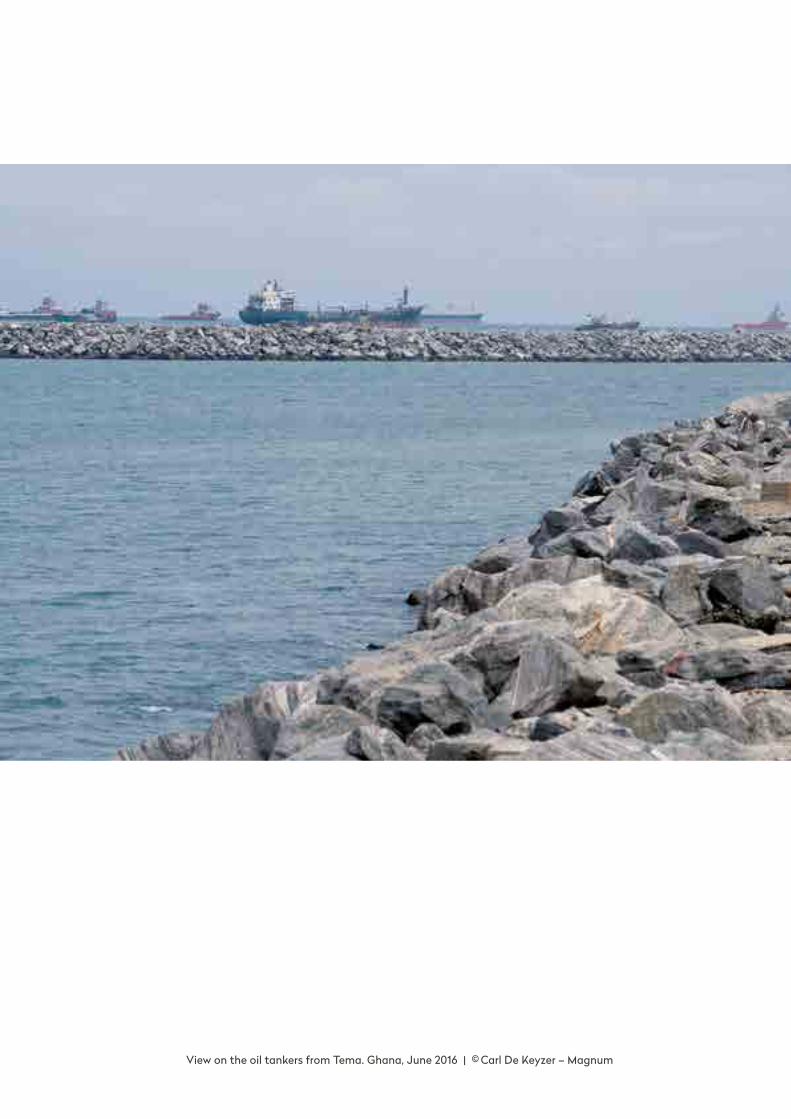
View on the oil tankers from Tema. Ghana, June 2016 | © Carl De Keyzer – Magnum
A Public Eye Investigation | September 2016 113
11
In Europe and offshore: where
African Quality fuels are produced
Many African Quality fuels are produced in the Amsterdam- Rotterdam-Antwerp (ARA) region.
Swiss trading companies either own or rent extended facilities in the ARA region.
The waters offshore Lomé, Togo’s capital city, are also a hotspot for blending, which is done aboard tankers and during ship-to-ship (STS) operations.
We uncovered the way in which a tanker, the Conger, travelled from Amsterdam to West Africa, containing dirty blendstocks for use in gasoline delivered to Lagos and Cotonou.
Because of the risk of spills, a global ban exists on blending while at sea. This ban is difficult to interpret and we believe that blending at anchor outside ports, and possibly during voyages too, is still a widespread practice.

114 DIRTY DIESEL – How Swiss Traders Flood Africa with Toxic Fuels | Chapter 11
Every day, thousands of tourists stroll, or cycle, along the roads of Amsterdam. Indeed, the Dutch capital has become increas-ingly popular with foreign tourists since the turn of the century, welcoming over 7 million people in 2015.1 Just a stone’s throw away, however, a different kind of visitor, a tanker, moors at one of the many oil terminals in Amsterdam’s port. The vessel’s name is Conger and on a July day in 2015, she is about to load and blend a batch of blendstocks destined to become gasoline for sale in West Africa.
In Amsterdam, the blending business operates 24/7. Every day, barges and tankers from all around the world arrive at the port to load or unload products stored in the terminals’ tanks. This loading, unloading and blending is highly efficient, since the terminals are modern and well-equipped. The Port of Am-sterdam describes itself as “the world’s largest gasoline port”.2
But the competition is tough, and Amsterdam must com-pete with the neighbouring ports of Rotterdam and Antwerp for its share of the lucrative petroleum product markets. To-gether, these three ports form the ARA region, an important hub for the export of fuels to West Africa (see chapter 8) and elsewhere. Its extensive refining and blending capacity contrasts sharply with the lack of refining capacity in West Africa. Close geographically to the Gulf of Guinea, the ARA region also en-joys a strategic positioning which makes it an efficient location to receive petroleum products and blendstocks from the UK, Russia and the Baltic countries. Altogether, this makes the ARA region not only a major transit hub for petroleum products, but also an important location to produce fuels, thanks to modern blending infrastructures and the presence of specialised compa-nies. In short, the ARA region is the perfect place to produce and supply African Quality fuels.
Given their market share in the supply of fuels to West Afri-ca, Swiss trading companies might be expected to use a signifi-cant portion of ARA’s infrastructure, such as storage facilities and refineries. They actively participate in the making of African Quality fuels, which are also produced closer to their final mar-kets. To find out more about that, we move to the high seas and to the waters offshore Lomé, where blending is performed aboard ships through ship-to-ship transfers. This provides us with an opportunity to examine the unclear legal status of blending at sea. Finally, we follow two concrete deliveries of Af-rican Quality fuels to West Africa, by following the journey of the Conger, a tanker, which left a terminal in the Africa harbour of Amsterdam with a cargo of dirty gasoline aboard, and the Marianne Kirk, loaded with diesel.
11.1 – GIBRALTAR MAY BE THE DESTINATION REPORTED, BUT THE REAL DESTINATION IS UNKNOWN
The fuel business is known for being opaque (see chapter 4), al-though port authorities do, in fact, provide some limited data, trade statistics, and information on the sulphur content of prod-ucts traded. Statistics from the Port of Amsterdam confirm that West Africa is a major destination for petroleum products, and in 2013, four West African countries were among the ten coun-
tries receiving the most commodities from Amsterdam, of which a large share are composed of petroleum products.3 Ac-cording to Rutger Van der Hoeven, a manager in the commercial division of the Port of Amsterdam, petroleum products are made to specification, mainly for the UK, North America, South America, and West Africa. The products also go to Europe, since Amsterdam has a strategic position to supply the hinterland.4
Overall, the Amsterdam terminals handled around 42 million tonnes of oil products coming in and out the port, including approximately 20 million tonnes of diesel, in 2014.
The authorities also compile information on all ships, which leave the ports of Amsterdam, Rotterdam and Antwerp. These vessels are required to report their destination and connect to a system that provides information on the last ten port calls of any given ship.
However, the reported destination does not always match the real or final destination, as Rose-Marie Pype, Commercial Manager for the Port of Antwerp, explained: “Gibraltar sudden-ly became a very big destination. But what happens in Gibral-tar? It’s just a little rock with some storage tanks. What hap-pens in reality is that departing tankers, which report Gibraltar as their destination, actually put the cargo on the market [to see] if a profitable deal can be made with the products aboard the ship. The products are either going to Africa or Asia. And in Gibraltar, they can choose. So that is why many automatical-ly report ‘Gibraltar’, but where the tankers are actually going, we do not know.”5
According to Henri Van der Weide, Policy Advisor for the Port of Amsterdam, re-directing ships on short notice in order to obtain a higher price is not uncommon: “On some occasions, we don’t know where the ships leaving the port are going. De-parting ships indeed have an obligation to report their destina-tion, but in the ships’ tramp trade,6 this is not always known. The destination reported will therefore be ‘North Sea for orders’ and they go to the anchorage place.”
Gibraltar is also listed as a destination in Rotterdam’s port statistics, which give a clear idea of trade flows. In 2015, Rotter-dam imported over 49 million tonnes of mineral oil products (including blendstocks but not crude oil), while more than 39 million tonnes were outgoing.7 This makes the port a major hub for petroleum products, receiving them from – and then delivering them to – all around the world.
The data is not disaggregated by product, but Figure 11.1 shows how Russia and Singapore stand out for the size of their imports and exports of oil products. The trade between Rotter-dam and Singapore is related to marine bunker fuels for ships, as the two ports rank in the world’s top three for these fuels. Meanwhile, besides bunker fuel, Russia is also an important source of diesel and gasoline blendstocks and final products im-ported into Rotterdam.
Indeed, Rotterdam’s sources of products and blendstocks partly correspond with those of the two other ports of the ARA region. Van der Hoeven, of the port of Amsterdam, said that many of their fuel blendstocks come from the Baltics (including Russia), as well as from the UK, Rotterdam and the US.8 US trade statistics show that the US exported 4,6 million tonnes of ultra-low sulphur diesel products (less than 15 ppm) to the

A Public Eye Investigation | September 2016 115
Netherlands. It exported around 1 million tonnes of high sul-phur diesel products into the Netherlands too.9
An interviewee at the Port of Antwerp also mentioned Eu-rope, including Russia, as an important source of fuel blend-stocks coming in. The port does not make public any disaggre-gated figures on the country of destination, but the authorities said blended petroleum products are mainly exported to Amer-ica and Africa.10
11.1.1 – DO-IT-YOURSELF: ARA’S READY TO USE INFRASTRUCTURE
Core to the ARA blending hub is the network of ten refineries in the region. Shell, BP, ExxonMobil, Koch and Gunvor operate five refineries in the port of Rotterdam alone. Combined, these refineries have a distillation capacity of 58 million tonnes. A further five refineries are located in the hinterland, comprising Total/Lukoil in Flushing, Shell in Godorf and Wesseling (Co-logne), BP/Rosneft near Gelsenkirchen and Total/ExxonMobil in Antwerp. They receive crude oil through pipelines from Rot-terdam and add another 70 million tonnes of distillation capac-ity to the region’s potential output. Inland barges transport blendstocks and fuels from refineries to the storage terminals in Amsterdam, Rotterdam, and Antwerp.
On top of the refineries, the three ports offer massive stor-age facilities to their clients, an absolute necessity both to trade products and to blend them. Although they form a hub, these ports also compete to increase their respective market share, by attracting more trading companies, expanding storage facilities, and improving infrastructure.
Rotterdam alone has a storage capacity of 27.4 million m3, which allow the blending of crude and mineral oil products. It also has 24 berths for ship-to-ship transfers.11 The largest liq-uid bulk port in Europe, Rotterdam has historically been big in crude and fuel oil. According to Louis Monninkhof and Ron-
ald Backers from the Port of Rotterdam, the port authorities hope to expand its gasoline and diesel capacities: “At the moment we do around 3 to 3.5 million tonnes of gasoline – sea transport, loading and unloading. And we have the ambition to grow in this market. Gasoline is an interesting market, a lot is exported. Big volumes are pro-duced here in the Rotterdam region and then transported with inland barges to Amsterdam, where they get blended and exported.”12 They both aim to attract more ship-to-ship operations, currently happening offshore Denmark, into Rot-terdam’s port. Besides bringing more business to the port, this would also be a safer option and would make charterers less dependent on the weather, they said.
The port of Amsterdam has eight oil terminals with around 400 storage tanks (large and small), generating a total storage capacity of over 5 mil-lion m3. Rutger van der Hoeven, Commercial Man-ager for the Port of Amsterdam, explained how the port developed competitive advantage based on its
storage facilities specially built for the efficient blending of gas-oline. “Our clients’ demands are complex.” he said, but the lay-out and logistics of the terminals can accommodate this com-plexity. Small tanks are best for gasoline, which is an intensively blended product, he said. “We have these. It would not be logical for Amsterdam to position itself as a hub for crude or fuel oil, products that are transported by bigger tankers.” Amsterdam is best suited for receiving the smaller tankers that carry gasoline or diesel.
Antwerp has experienced constant growth over the past years. In 2013, it even overtook Amsterdam in terms of vol-ume, with a throughput of 43 million tonnes of petroleum products, against 39 million tonnes for the Dutch city.13 Ac-cording to Rose-Marie Pype from the Port of Antwerp, this growth stems both from the land available for expansion and existing storage capacity. “We have risen to a 6.9 million [m3] capacity. This is still increasing. And it does not include the storage capacity of the oil majors’ refineries, like Total and ExxonMobil.”14
Also very relevant when it comes to blending, and valuable for trading companies, Antwerp has an historical connection with the chemical industries. It claims to be Europe’s largest “maritime (petro) chemical cluster”, with major active refineries and where seven of the global top ten chemical producers have production plants.15 Several of the port’s storage tank terminals specialise in chemical storage, while others are equipped to store and to blend mineral oils and petroleum products. These provide the traders with more options to purchase inexpensive, often poor quality, blendstocks. One example is naphtha pro-cessed by the chemical industry in a process called steamcrack-ing. This process produces for the plastics industry. Its by-prod-ucts, including pyrolysis gasoil and pyrolysis gasoline – known as pygas – can be sold to fuel blenders.
One other factor explains Antwerp’s growth: the arrival of Swiss trading companies.
Figure 11.1 – Rotterdam: imports and exports of oil products (2013)
Diesel 86 % Diesel 13 % Gasoline 44 %
Gasoline 4 %
Other 7 %
Lubricants and oils 2 %Kero/Jet A1 1 %
0–5
00 p
pm
1 1 1 1 1
4
2 2
5
8
4
501–
1000
ppm
1001
–150
0 pp
m
1051
–200
0 pp
m
2001
–250
0 pp
m
2501
–300
0 pp
m
3001
–350
0 pp
m
3501
–400
0 pp
m
4001
–450
0 pp
m
4501
–500
0 pp
m
5001
–550
0 pp
m
Num
ber o
f car
goes
repo
rted Nat
iona
l spe
cific
atio
n
< 15 ppm >500 ppm
’000
MT
Con
oco
Phili
ps
Tota
l
Gun
vor
Vit
ol
Mer
curia
Trafi
gura
Che
vron
Gle
ncor
e
Mio
bar
rels
60
50
40
30
20
10
0
250
200
150
100
50
0
Daily oil consumption
International oil companies
Swiss traders
Other 6 %Lubricants and oils 1 %
Kero/Jet A1 36 %
15–500 ppm
Ghana
Togo
US
ChinaAfrica
Russ
ia
Uni
ted
Stat
es
Uni
ted
Kin
gdom
Latv
ia
Lith
uani
a
Sing
apor
e
Uni
ted
Stat
es
Uni
ted
Kin
gdom
Gib
ralt
ar
Fran
ce
Volu
me
(mill
ion
tons
)
14
12
10
8
6
4
2
0
13 12.9
3.4 3.2
Countries of origin
Countries of destination
2.8 2.63.4 3.1
2.4 1.5
116 DIRTY DIESEL – How Swiss Traders Flood Africa with Toxic Fuels | Chapter 11
11.1.2 – NO PATIENCE FOR WAITING: SWISS TRADING COMPANIES’ BLEND IN THE ARA REGION
The ARA region’s blending facilities, mainly the oil storage ter-minals, are heavily used by Swiss trading companies. One of Amsterdam’s terminals belongs to a Swiss trading company: VTTI’s Eurotank Amsterdam (ETA), a fully owned subsidiary of Vitol.16 Most terminals such as VOPAK, Oiltanking Amsterdam (OTA) and Nustar, are independent of traders or majors. Instead, commodity traders and other players, including the Swiss, rent their storage and blending tanks.
Oiltanking Amsterdam (OTA), which leases part of its fa-cility to Gunvor, promotes itself as “a first class service pro-vider for storage and blending of gasoline. Being located so close to the refineries in the Amsterdam-Rotterdam-Antwerp (ARA) region, [our] clients are well positioned to collect the various components needed to blend gasoline and other oil products.”17 OTA is Amsterdam’s busiest oil terminal, with an average four or five tankers at its jetties at any given time.18 Since 2006, it has been the principal gasoline blending facili-ty of Gunvor, which claims to operate 292,000 m3 of storage capacity under a long-term contract. Gasoline blended here can be shipped to anywhere in the world, though it is mostly sent to North America and West Africa. When asked whether OTA is still one of Gunvor’s main blending and storage facili-ties for gasoline and gasoil and if there are any other termi-nals in the ARA region where it rents tanks for storage and blending, Gunvor stated that it could not comment as “it re-lates to commercially sensitive information.” Gunvor’s bond prospectus stated that, in 2012, “Gunvor had approximately 20 percent of its blended volumes under term contracts, most-ly from Russian sources. Russian-sourced gasoline is current-ly transported by rail to the port of Riga (Lithuania) on the Baltic Sea. It is either shipped to Amsterdam for further blending or directly to US blenders, depending principally on pricing considerations.”19
Similarly, Vitol’s VTTI Eurotank boasts that its “key strengths are jetty flexibility coupled with a capacity for com-plex blending.”20 A representative of Eurotank Amsterdam (ETA) went on to explain the terminal’s two competitive advan-tages over their biggest competitors, VOPAK and OTA: “We are located on three territories with water in between, which means that we have a lot of jetties, making the terminal very flexible for receiving several seaships and inland vessels at the same time. The other advantage we have is that the new tanks each have four pipelines connected to the pumping room, mak-ing ETA very flexible and quick. This is also beneficial for blending.”21
Louis Monninkhof and Ronald Backers from the Port of Rot-terdam stress the importance to the port of trading companies, which arrived around 15 years ago. The port’s clients are the ship-owners whose ships pay harbour fees when visiting the port, and the terminals that rent the terrain. But the port tries to influence the clients of their clients, the ones who own the car-go. And these are often the trading companies. According to Backers, the cargo owners want “optionality”. In other words they want more choice on how to get value from the Port of
Rotterdam, through product transfers, ship-to-ship operations, and choice of terminals.
However, the port authorities of Rotterdam would prefera-bly not let trading companies own their own terminals, as this is not an efficient use of land or existing terminal capacity. How-ever, this contradicts the traders’ ambitions, who aim to control access to assets considered as key to their operations. Moreover, trading companies are reluctant to use the facilities belonging to direct competitors. For instance, “Glencore moved to Antwerp some years ago, as they insisted on having their own terminal capacity which could at that time not be offered by the existing ones," explains Louis Monninkhof. 22
This is why, despite Rotterdam’s best efforts and its status as the biggest port in Europe, it has not been able to match the at-traction to traders of Antwerp. Rose-Marie Pype from the Port of Antwerp explained why traders accelerated the enormous growth of Antwerp as a hub for petroleum products: “In 2000 – just before the economic boom – the traders discovered Ant-werp because Rotterdam was always full of large tankers with crude oil. They had to wait, but there is one thing that those people do not have and that is patience. They prefer a jetty where they are the boss. These same players have, in a relatively short time [the last 10–15 years], added enormously to the stor-age of petroleum products here in Antwerp.”23
Figure 11.2 provides an overview of the assets and blending facilities of Swiss traders in the ARA region.
11.2 – BLENDSTOCKS UNCOVERED IN AMSTERDAM There are hundreds of gasoline and diesel blendstocks on the market (see chapter 10). Terminal tanks must therefore store many different blend components and products. We visited the Port of Amsterdam to take a closer look at the blendstocks stored and some of the recipes for African Quality fuels.
Under Dutch law, which implements European regulation for the prevention of major accidents such as those in Seveso (Italy) or Bhopal (India), all companies dealing with dangerous components are obliged to keep an up-to-date list of the haz-ardous components present on their premises and to ensure that this list can be seen by anyone.24 When we visited the oil terminals in Amsterdam and asked to see their “Hazardous Compounds Lists”, the terminals agreed to show us the lists but remained tight-lipped about their specific clients. They said this was highly confidential information, making it virtu-ally impossible for us to know which company was handling a given product, and, more importantly, were the latter was going to be sold. A Eurotank Amsterdam representative said the cli-ents would be identifiable from the names of the blendstocks, and so by disclosing the list of hazardous components, he would be disclosing the names of the terminal’s clients. Several weeks later, he handed over a short list of hazardous compo-nents.25
In fact, we collected several lists of hazardous compounds, which had been stored in Amsterdam’s tank terminals on differ-ent dates in 2014, 2015 and 2016.26
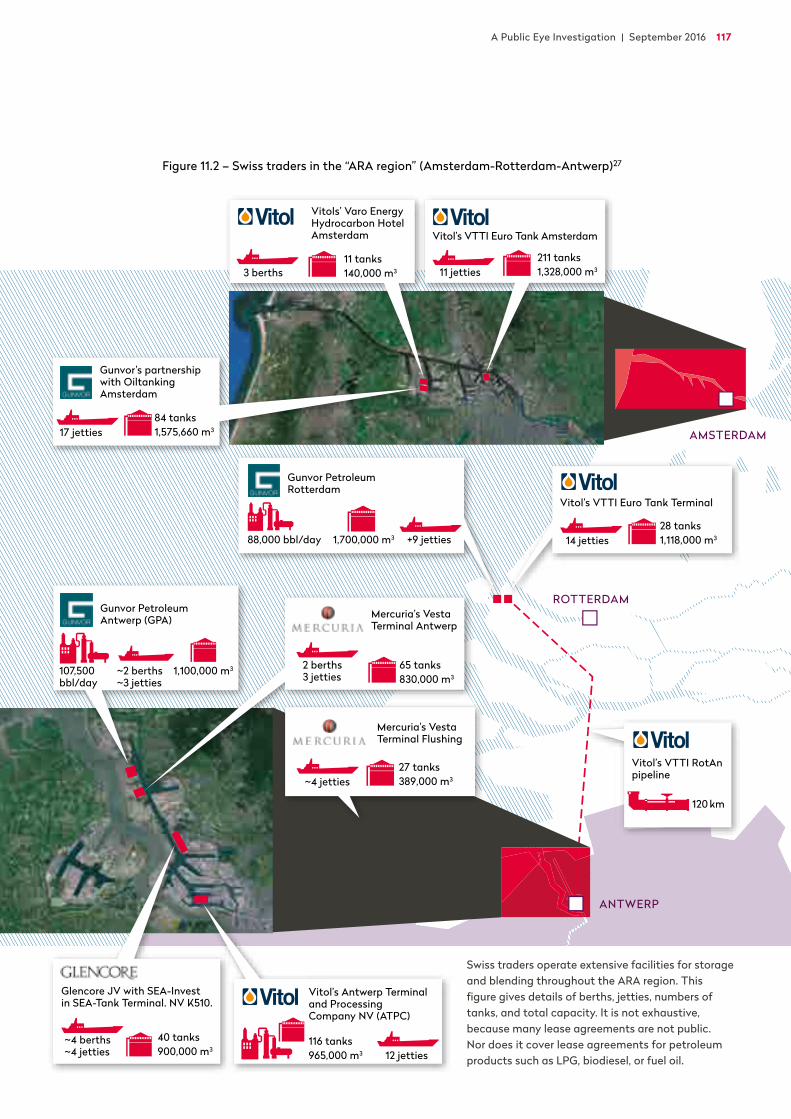
A Public Eye Investigation | September 2016 117
ANTWERP
ROTTERDAM
AMSTERDAM
Figure 11.2 – Swiss traders in the “ARA region” (Amsterdam-Rotterdam-Antwerp)27
Swiss traders operate extensive facilities for storage and blending throughout the ARA region. This figure gives details of berths, jetties, numbers of tanks, and total capacity. It is not exhaustive, because many lease agreements are not public. Nor does it cover lease agreements for petroleum products such as LPG, biodiesel, or fuel oil.
Vitol’s VTTI Euro Tank Terminal
14 jetties28 tanks1,118,000 m3
Vitol’s VTTI RotAn pipeline
120 km
Gunvor Petroleum Rotterdam
+9 jetties1,700,000 m388,000 bbl/day
Gunvor’s partnership with OiltankingAmsterdam
11 jetties211 tanks1,328,000 m33 berths
11 tanks140,000 m3
Vitols’ Varo Energy Hydrocarbon Hotel Amsterdam Vitol’s VTTI Euro Tank Amsterdam
17 jetties84 tanks1,575,660 m3
Mercuria’s Vesta Terminal Flushing
~4 jetties27 tanks389,000 m3
Gunvor Petroleum Antwerp (GPA)
107,500 bbl/day
~2 berths~3 jetties
1,100,000 m3
Mercuria’s Vesta Terminal Antwerp
2 berths3 jetties
65 tanks830,000 m3
Glencore JV with SEA-Invest in SEA-Tank Terminal. NV K510.
~4 berths~4 jetties
40 tanks900,000 m3
Vitol’s Antwerp Terminal and Processing Company NV (ATPC)
12 jetties116 tanks965,000 m3
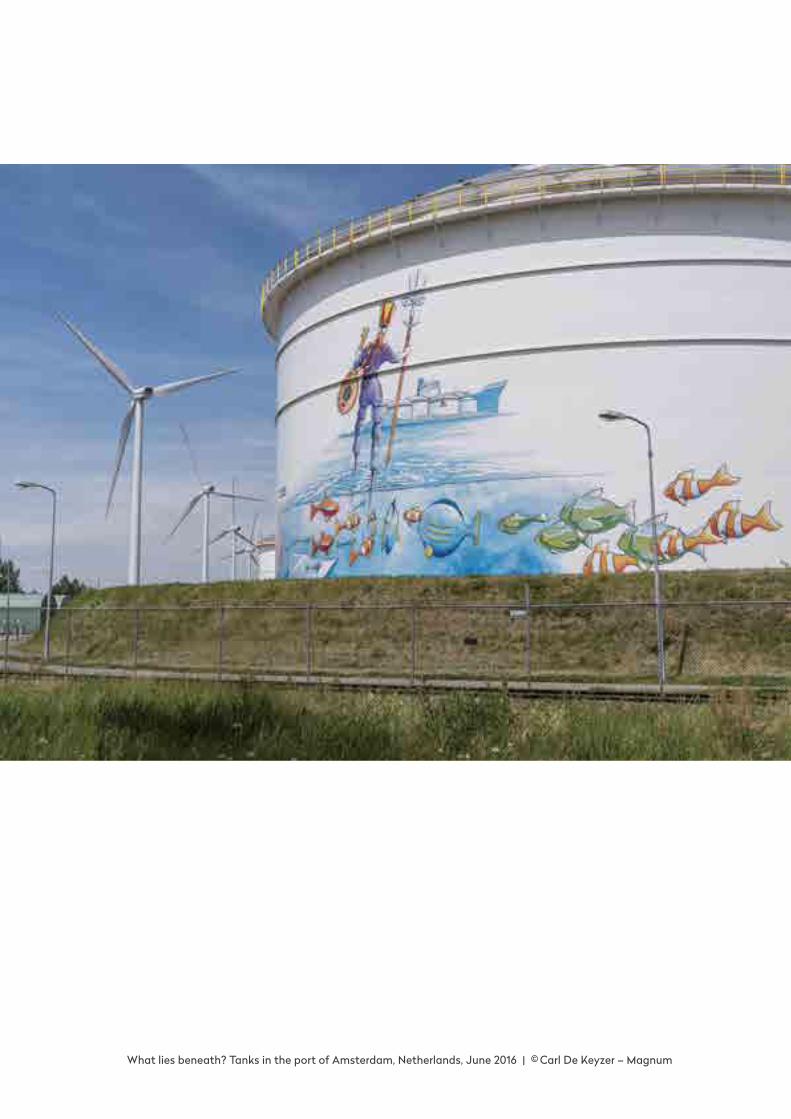
What lies beneath? Tanks in the port of Amsterdam, Netherlands, June 2016 | © Carl De Keyzer – Magnum
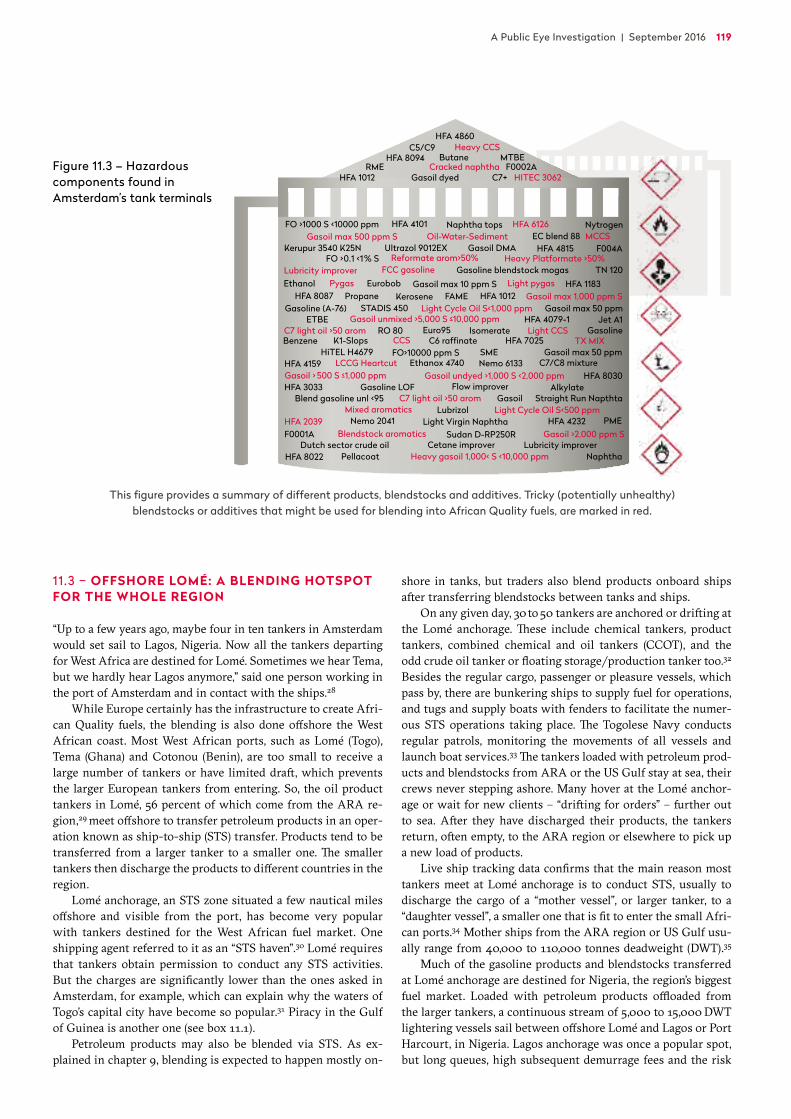
A Public Eye Investigation | September 2016 119
11.3 – OFFSHORE LOMÉ: A BLENDING HOTSPOT FOR THE WHOLE REGION
“Up to a few years ago, maybe four in ten tankers in Amsterdam would set sail to Lagos, Nigeria. Now all the tankers departing for West Africa are destined for Lomé. Sometimes we hear Tema, but we hardly hear Lagos anymore,” said one person working in the port of Amsterdam and in contact with the ships.28
While Europe certainly has the infrastructure to create Afri-can Quality fuels, the blending is also done offshore the West African coast. Most West African ports, such as Lomé (Togo), Tema (Ghana) and Cotonou (Benin), are too small to receive a large number of tankers or have limited draft, which prevents the larger European tankers from entering. So, the oil product tankers in Lomé, 56 percent of which come from the ARA re-gion,29 meet offshore to transfer petroleum products in an oper-ation known as ship-to-ship (STS) transfer. Products tend to be transferred from a larger tanker to a smaller one. The smaller tankers then discharge the products to different countries in the region.
Lomé anchorage, an STS zone situated a few nautical miles offshore and visible from the port, has become very popular with tankers destined for the West African fuel market. One shipping agent referred to it as an “STS haven”.30 Lomé requires that tankers obtain permission to conduct any STS activities. But the charges are significantly lower than the ones asked in Amsterdam, for example, which can explain why the waters of Togo’s capital city have become so popular.31 Piracy in the Gulf of Guinea is another one (see box 11.1).
Petroleum products may also be blended via STS. As ex-plained in chapter 9, blending is expected to happen mostly on-
shore in tanks, but traders also blend products onboard ships after transferring blendstocks between tanks and ships.
On any given day, 30 to 50 tankers are anchored or drifting at the Lomé anchorage. These include chemical tankers, product tankers, combined chemical and oil tankers (CCOT), and the odd crude oil tanker or floating storage/production tanker too.32 Besides the regular cargo, passenger or pleasure vessels, which pass by, there are bunkering ships to supply fuel for operations, and tugs and supply boats with fenders to facilitate the numer-ous STS operations taking place. The Togolese Navy conducts regular patrols, monitoring the movements of all vessels and launch boat services.33 The tankers loaded with petroleum prod-ucts and blendstocks from ARA or the US Gulf stay at sea, their crews never stepping ashore. Many hover at the Lomé anchor-age or wait for new clients – “drifting for orders” – further out to sea. After they have discharged their products, the tankers return, often empty, to the ARA region or elsewhere to pick up a new load of products.
Live ship tracking data confirms that the main reason most tankers meet at Lomé anchorage is to conduct STS, usually to discharge the cargo of a “mother vessel”, or larger tanker, to a “daughter vessel”, a smaller one that is fit to enter the small Afri-can ports.34 Mother ships from the ARA region or US Gulf usu-ally range from 40,000 to 110,000 tonnes deadweight (DWT).35
Much of the gasoline products and blendstocks transferred at Lomé anchorage are destined for Nigeria, the region’s biggest fuel market. Loaded with petroleum products offloaded from the larger tankers, a continuous stream of 5,000 to 15,000 DWT lightering vessels sail between offshore Lomé and Lagos or Port Harcourt, in Nigeria. Lagos anchorage was once a popular spot, but long queues, high subsequent demurrage fees and the risk
Figure 11.3 – Hazardous components found in Amsterdam’s tank terminals
Heavy Platformate >50%
HFA 1012
Euro95
HFA 1012
CCS
Light Cycle Oil S<1,000 ppm
Heavy gasoil 1,000< S <10,000 ppm
Gasoil unmixed >5,000 S ≤10,000 ppm
Kerupur 3540 K25N
C7 light oil >50 arom
Gasoil >2,000 ppm S
C7 light oil >50 arom
Lubricity improver
Oil-Water-Sediment
HITEC 3062
Blendstock aromatics
Light CCS
Mixed aromatics
Light pygas
Gasoil undyed >1,000 S <2,000 ppmGasoil > 500 S ≤1,000 ppmLCCG Heartcut
Gasoil max 1,000 ppm SPygas
HFA 2039
Reformate arom>50%FCC gasoline
HFA 6126
Cracked naphtha
MCCSGasoil max 500 ppm S
Heavy CCS
TX MIX
Naphtha tops
Gasoline (A-76)ETBE
RO 80
Gasoline LOF
FO>10000 ppm S
Gasoil max 50 ppm
Straight Run Napthta
HFA 1183FAME
MTBE
PME
HFA 4815
HFA 4079-1
Naphtha
Nytrogen
HFA 8022
HFA 4232
Alkylate
Kerosene
SMEHFA 4159
HFA 7025
Gasoil max 10 ppm SGasoline blendstock mogas
HFA 4101
Gasoline
Lubrizol
HiTEL H4679
Butane
Eurobob
Benzene
Ethanox 4740
Sudan D-RP250R
Flow improverBlend gasoline unl <95
HFA 8094
HFA 4860
K1-Slops
Jet A1
Light Virgin Naphtha
RME
Ultrazol 9012EX
F0001A
FO >0.1 <1% S
Propane
C5/C9
Nemo 2041
HFA 8087
Light Cycle Oil S<500 ppm
Gasoil DMA
C7+
Isomerate
F0002A
HFA 3033Gasoil
HFA 8030
Dutch sector crude oil
Gasoil max 50 ppm
TN 120
Lubricity improver
EC blend 88
Ethanol
Cetane improver
C6 raffinate
Pellacoat
F004A
Gasoil dyed
FO >1000 S <10000 ppm
STADIS 450
C7/C8 mixtureNemo 6133
This figure provides a summary of different products, blendstocks and additives. Tricky (potentially unhealthy) blendstocks or additives that might be used for blending into African Quality fuels, are marked in red.
120 DIRTY DIESEL – How Swiss Traders Flood Africa with Toxic Fuels | Chapter 11
of piracy, leading to rising insurance premiums, have pushed tankers to go the extra miles to Lomé.36
In addition to the daughter vessels, regionally-operating barges receive gasoline, diesel, blendstocks or other products from mother ships at Lomé, then deliver them to the regional ports, from Dakar, in Senegal, to Luanda, in Angola. These ports supply fuels to coastal and landlocked West African countries by truck, train, and, occasionally, pipeline too.
To supply the region, various patterns coexist among the dif-ferent companies. “For example, Total uses smaller vessels coming from Europe that stop in every port to supply the countries where they own petrol stations. I also call it taxi-stop. But the likes of Trafigura and Vitol, they don’t bother: they just go with big tankers from Europe to Lomé and then blend and proceed STS to smaller vessels. All to Lomé, where they own offshore barges. But you have to be big to do so,” a Geneva-based trader said.37
In the waters offshore Lomé, fuel products are blended ac-cording to country specifications either during or after the STS operations. “The international traders, which deliver products to importers, either buy high sulphur products from the port of origin or low sulphur products and blend them offshore Lomé before reaching Ghana,”43 explained Emmanuel Quartey, a for-mer refinery worker and consultant for the African Refiners As-sociation. Trafigura, Gunvor and Litasco keep barges perma-nently offshore Lomé. “They can handle big volumes,” one trader from Cotonou commented. “Blending there is where real money is made.”44 This is in line with Gunvor’s own publicity on their
gasoil trading in West Africa: “Gunvor has access to a floating storage of 65,000 metric tonnes off Cotonou in Benin. Access to this floating storage facility allowed Gunvor to become one of the most active gasoil [diesel] trading companies in West Africa, with 1.4 million metric tonnes sold in the region in 2012, most-ly to Gabon, Nigeria and Ghana.”45 When asked to provide us with more details, Gunvor responded that “market conditions have changed, and we no longer have this storage.”
Platts further reported that Geneva-based Trafigura rented “at least” two very large crude carriers under time charter agree-ments to transport diesel from South Korea to West Africa46 – a “rare” move, as these large tankers are usually meant for crude. One of these vessels was “taken with a six month storage option in West Africa,” meaning it may serve as floating storage to sup-ply the regional market, most likely offshore Lomé. The Swiss Addax and Oryx Group is also very active offshore Lomé. “It’s an interesting hub from a tax perspective,” an employee of Oryx Energies in Benin explained.47
We describe the cases of two tankers below to give a sense of the practices at Lomé anchorage. We draw upon confidential information derived from several ship tracking and chartering databases, as well as interviews with experts working in the port of Amsterdam in contact with the ships. Despite the occa-sional contradiction in the source information, we have man-aged to piece together the cases as accurately as possible.48 The journeys of the Conger and the Marianne Kirk are two concrete examples of African Quality gasoline and diesel sailing from
Piracy in the Gulf of Guinea occurs almost on a weekly basis.38 The thriving black market for refined petroleum products means stealing is fast and easy money. “Very smart people are doing this,” Cyrus Mody, of the International Maritime Bureau, said. “The product is sold just under market value so that it doesn’t affect the market and therefore remains under the radar. That means these people have real knowledge of how pricing works. If it impacted prices, there would be much more action taken against the piracy.”39
In an average attack, pirates usually steal 2,000 to 10,000 tonnes of products, which they can cash in for up to “5 million dollars straight,” Mody said. In a typical scenario, the tanker is hijacked, the AIS (Automatic Identification System) disabled by the pirates and the crew locked up – including those with the technical knowledge to conduct an STS transfer. The IMB has observed that piracy groups increasing-ly have the skills to conduct the transfer themselves, highlighting how well prepared and organised they are.
Hijacked tankers then rendezvous with a daughter vessel to offload the stolen cargo, which is then shipped into West
Africa (Nigeria, Togo, Benin). There, it is stored in shore-tanks and sold on the black and possibly legal market.40
In the Strait of Malacca, hijackings last 48 hours or less, but in West Africa hijackers hold the tankers for an average 10 to 12 days. Mody recounted a hijack in West Africa, which took place in January 2014, when a fully loaded diesel tanker was “picked up” at the Luanda anchorage. Ten days later, the crew was released outside of Nigeria. Over the course of these two weeks, the tanker undertook several STS operations and almost 13,000 metric tonnes of diesel had been stolen.41 Piracy in West Africa often goes unreport-ed. “It is sometimes kept silent because the tanker per- haps should not have been there in the first place,” Mody said.
Piracy has pushed tankers to anchor further and further west of Lagos and then to the south as far as Gabon. Togo’s Lomé and Ghana’s Tema have also been hit. Lloyds of London’s Joint War Risk Committee has since expanded the West African “high risk” area from Nigerian waters to the waters of Benin and Togo.42
Box 11.1 – INSECURITY DISPLACED TRADE TO LOMÉ
A Public Eye Investigation | September 2016 121
Amsterdam to West Africa through Lomé. Both vessels were chartered by Swiss trading companies.
11.3.1 – CONGER, A DIRTY GASOLINE “BLENDBOAT” IN LOMÉ
It is 15 July 2015, a sunny mid-summer’s day in the port of Am-sterdam. The Conger, a 75,000 DWT combined chemical and oil tanker (CCOT), sails the short trip, a few hundred meters, from Oiltanking Amsterdam, a terminal leased to Gunvor, to VOPAK’s terminal in the Africa harbour.
Its crew comprises young sailors from Ukraine, Georgia and Russia who regularly man the voyage transporting petroleum products from ARA to West Africa. The tanker is operated by Prime Marine Management, the same company that operated Probo Koala during the caustic washings in 2006. And her char-terer today is the controversial Swiss trader Mocoh49 for a “load of 60,000 tonnes UMS (unleaded motor spirit) in ARA for dis-charge in West Africa.”50 Mocoh told us that the “product was purchased as a finished grade of gasoline meeting the specifica-tions of the market to where the gasoline was to be delivered [...] We are not blenders nor refiners but rather shippers."
Once at VOPAK, the terminal metal pipes are hooked into the tanker's belly, and the process to blend a batch of gasoline is commenced using the following blendstocks51:
– Light Virgin Naphtha– Benzene additive – Pygas – Reformate aromatics (> 50 %)– Cracked naphtha– Light catalytic cracked gasoline.
We showed this recipe to Ton Visser, an oil blending expert, who described this gasoline blend as a “likely African blend, too tricky for a European gasoline,” adding that the pygas is a partic-ularly controversial product due to its odour and high benzene content (if not debenzinised). Apart from the Light Virgin Naphtha, the other blendstocks are also potentially hazardous (high level of sulphur, aromatics or benzenes) if not treated in a refinery (see also chapter 10). More information would be need-ed on the proportion of each blendstock used, and the proper-ties of the final product, to confirm whether this is indeed a typical African blend. 52 Asked to share the exact composition of the gasoline (for example the benzene level), Mocoh was unwill-ing to share this information with us.
Laden with the blended gasoline, the Conger sets sail for Lomé anchorage, arriving at her final destination on 1st August 2015. She stays there for three weeks, protected by armed guards, while she conducts STS operations with at least two other tankers, both smaller, we assume, to unload her gasoline. At first, the Conger transfers on 3rd August the gasoline to the Elohim, coming from Namibia, which then discharges her cargo in Lagos and returns to Lomé. Second, on 19th and 20th August, the Conger conducts another STS with Winter Oak who sails to Cotonou, at Oryx Energies’ oil terminal. After that, Winter Oak continues to Sierra Leone, where Oryx Energies is almost the sole supplier (see chapter 5).
The Conger was carrying more gasoline than she was able to discharge onto the Elohim and Winter Oak, suggesting that more STS operations took place during her three weeks offshore Lomé. We don’t know the exact whereabouts of the Conger during that period, because her AIS was lost for certain inter-vals. This made it difficult to follow her using the live tracking software, but we think she conducted STS operations with at least two additional tankers.
After almost three weeks, the Conger leaves Lomé, during the night of 20th–21th August. Her next destination is Las Palmas de Gran Canaria in the Canary Islands, where Oryx Energies also has a major storage facility, “strategically placed on the main com-mercial route between Europe, West Africa and the Americas.”54
In Las Palmas, the Conger’s name is scrubbed off her hull and replaced with “Eagle Ray”. Her new owner is unknown but she continues to be managed by Prime Marine Management and sail under the Marshall Islands’ flag.
Under her new name, the Eagle Ray stays on the ARA to West Africa route, transporting a cargo from Antwerp to Lomé and Luanda in October. Back in Europe, ST Shipping – a ship-ping subsidiary of Glencore – charters the Eagle Ray in Decem-ber to load 60,000 tonnes of petroleum product in Rotterdam for discharge in Lomé. This will be her last voyage as Eagle Ray.
Exactly five months after receiving a new name in Las Pal-mas, the Eagle Ray has her name scrubbed off again, this time while in Gibraltar in early February 2016. Her new name, “Wem-bley”, is painted on the hull. Her commercial operator is the UK based Union Maritime Limited and her new technical manager is the German company Bernard Schulte Shipmanagement. Also under this new name, the tanker stays on the West Europe to West Africa route in the first half of 2016. She transports car-goes loaded in Ventspils (Latvia) and Klaipedia (Lithuania) for discharge in Lomé and Luanda.
In less than a year, the same vessel has sailed under three dif-ferent names and owners. Only its target remained: delivering fu-els to West Africa. On at least one occasion, these fuels were dirty.
11.3.2 – MARIANNE KIRK, A REGULAR VISITOR IN WEST AFRICA
Marianne Kirk is a 51,000 DWT combined chemical and oil tanker. In autumn 2014, she is chartered by Litasco to deliver 37,000 tonnes of “gasoil”, probably diesel, to West Africa. Arriv-ing from Skoldvik (Finland) and Riga (Latvia), the tanker stops in Amsterdam for a few days in early November to load the product. Her next stop is Lomé.
While the Marianne Kirk and her Filipino crew await new orders for discharge at Lomé anchorage, she drifts far off the coastline to minimise the risk of piracy.55 Tankers, like the Mar-ianne Kirk, often drift for several weeks as floating storage until all their cargo has been discharged. On this occasion, the Mari-anne Kirk stays eight days in and around Lomé anchorage be-fore setting sail for Luanda.
This will not be the last time that the Marianne Kirk delivers petroleum products to West Africa. She is regularly chartered by ST Shipping (a shipping subsidiary of Glencore), Mercuria, and Sahara Energy.
122 DIRTY DIESEL – How Swiss Traders Flood Africa with Toxic Fuels | Chapter 11
In June and July of 2015, Sahara Energy charters the tanker to take 38,000 tonnes of jet fuel from Trinidad to Lomé. From there, she sails to Amsterdam where she loads products from Gunvor’s Oiltanking Amsterdam between the 26th and 28th
July. The tanker then travels to Lomé anchorage again, where she stays from 12th August until 3rd September. At Lomé an-chorage, the Marianne Kirk meets the 75,000 tonne tanker Torm Estrid on 1st and 2nd September.
The Torm Estrid has also come from Amsterdam where she was in the Africa harbour at VOPAK between 6th and 11th Au-gust. The two ships probably met in Lomé to perform a blending operation.
11.4 – BLENDING OFFSHORE: ANARCHY IN THE WATERS
According to lawyers from the international firm Reed Smith, there are two main benefits of “blending, doping and dyeing on board.” First, there is no need for onshore blending equipment and storage tanks, so it avoids additional costs and logistical bottle necks. Second, it allows products to be sourced from a wide geographical area and at short notice, thus avoiding wait-ing time for products to be available at the same port.56 The nat-ural motion of the vessel during voyage also facilitates the prod-uct mixing.57
Specialists from SGS subsidiary Laroute Cargo Treatment, based in Zug, Switzerland, provide oil majors and traders a help-ing hand: “Onboard blending offers many advantages to suppli-ers and trading organisations, giving you the opportunity to prepare a cargo to the required specifications without the need for onshore facilities. Our specialists can help you get the best results through laboratory hand blends and with the use of our own blending specific software.”58
STS is undertaken by manoeuvring two vessels to berth to-gether. It can be done while moored alongside the quay, to dol-phins59 or to buoys within port limits, at anchorage offshore or in transit, either steaming or drifting freely with current and the weather. When two vessels are moored together, fenders are used by the STS service providers to prevent contact between the two ships. Hoses then connect the vessels to transfer the cargo from one to the other. A typical STS blending operation involving the transfer of 30,000 tonnes of oil products and us-ing two manifold60 connections with a loading rate of 1,500 m3/hour will take about 24 hours – four hours for the approach, mooring, hose connection and departure, plus 20 hours for the product transfer.61 A single vessel can discharge to one or to several other ships.62 By discharging from more than one ship, different products can be blended to form a new product in the “receiving ship”.63
11.4.1 – RISKY BUSINESS: SHIP-TO-SHIP TRANSFERS AND ONBOARD BLENDING
While it is cheap and convenient for traders to blend products on board tankers, these operations are risky. On top of the risks for the tankers, STS transfers can also be highly hazardous. Many
countries ban STS in their coastal waters due to the potential for oil spills. One expert warns that the operations need to be carefully planned and states that the biggest risks occur when ships manoeuvre together and separate again after the cargo transfer. A collision, or “steel to steel”, must be avoided at all costs.64
In 2009, such a collision occurred during an STS between two tankers, the Conger again and the Saetta, off Southwold in the UK. Following the collision, Conger’s operator Prime Ma-rine Management reviewed its risk assessment and procedures for STS operations. It now prohibits vessels from manoeuvring or berthing after sunset.65 Meanwhile, in Lomé, offshore STS operations continue day and night.
Because STS operations provide flexibility and save costs, they have become common around the world. As a result, the MARPOL convention, the main international convention cover-ing prevention of pollution of the marine environment by ships, has been updated to prevent pollution during STS operations. The regulation requires that any oil tanker involved in STS op-erations has a plan for how to conduct STS operations on board, meeting best practice guidelines developed by, for example, the International Chamber of Shipping (ICS) and the Oil Compa-nies International Marine Forum (OCIMF).66
The OCIMF’s “Ship-to-ship Transfer Guide, Petroleum” pro-vides a list of voluntary industry guidelines for STS operations. It sets out the procedures for masters, marine superintendents and STS service providers for the planning and conduct of cargo transfers. STS service providers and oil majors also meet in the STS EMEA (Europe, Middle East and Africa) forum to discuss and improve STS practices. An expert, Ruud Cogels, observes conflicting interests at these meetings, since the majors demand safety and environmental protection but want operations to be as cost efficient as possible. “The oil traders are absent from these discussions,” he says, “they just want the operations to be as cheap as possible and are of the opinion that the safety aspect is merely the STS providers’ responsibility.”
An article in th e International Shipping News detailed a long list of risks for the logistical operations at sea and the en-vironment involved with blending on board tankers, including: inadequate mixing of the various products; complications when blend components are incompatible; individual blend compo-nents are unstable and result in a precipitation of sediment; cal-culation errors i n product quantities resulting in incorrect blends; tank cle a n ing difficulties following a blending opera-tion, for example, where blending has caused a severe “waxing” that requires both substantial costs to clean the cargo tanks and delays to the ship.67 All these risks can lead to a catastrophe if things go wrong.
A 2011 technical paper on blending on board highlighted further issues around waste, which is difficult to collect, treat, and dispose of adequately following blending on board or at sea. The paper also points out that information is often lack-ing on the extent to which blending is being done at sea and the problems associated with such practices. “In some cases, ports may refuse to accept these wastes because of such un-certainties or may simply not be capable of handling contam-inated slops.”68

A Public Eye Investigation | September 2016 123
Information relating to onboard blending practices is very scarce, although some information can be found with marine insurance companies. Gard, a major marine insurance provid-er, also acknowledges the negative aspects of onboard blend-ing: “Within the industry, onboard blending is apparently a recognised means by which the cargo may be prepared to specification (if nothing goes wrong) in the vessel’s tanks, nor-mally by volumetrically blending individual components. [...] Compared to other methods of blending, […], onboard blend-ing is a complex alternative. Some of the negative aspects of this type of blending are: greater number of variables and un-knowns; errors a re more difficult to fix; physical mixing is limited.”69 Gard recommends that if ship owners are requested by the cargo own ers to blend onboard, then this should be agreed in the charter agreement. The Swiss trading company Mercuria, for ex ample, inserts agreements on blending on-board in its Charter Agreement.70 Cyrus Mody, of the Interna-tional Maritime Bureau, in London, says the charter agreement between a ship owner and a charterer, typically a trading com-pany, “must be as detailed as possible”. Stipulating in the con-tract all the op erations, including blending, that may occur during a ship’s voyage, is the best way to avoid disputes. The shipping industr y is very old and very complex,” explains Mody. “Illegal deals happen. And you will not find anything on paper. It will not be agreed over the phone but during face-to-face meetings. Yes it happens, especially if there is no need for a financial bank guarantee and if there are a lot of jurisdic-tions involved. 71
11.4.2 – LOST IN INTERPRETATION? THE GLOBAL BAN ON BLENDING DURING SEA VOYAGES
On 1st January 2014, the IMO introduced a global ban on blend-ing bulk liquid cargoes and other production processes aboard ships during sea voyages. According to Intertanko, whose mem-bers own the majority of the world’s tanker fleet, the initial mo-tivations for this ban were concerns about the impact of blend-ing on ship safety.72 But curiously, no one seems to really know whether it is actually in force, while serious difficulties occur when one aims to interpret the definitions.
The “blending ban” is included in SOLAS – the Convention for the Safety of Life at Sea.73 The first part of the ban says “the physical blending of bulk liquid cargoes during sea voyages is prohibited. Physical blending refers to the process whereby the ship’s cargo pumps and pipelines are used to internally circulate two or more different cargoes with the intent to achieve a cargo with a new product designation.”
The second part of the ban stems directly from the 2006 Probo Koala incident (see chapter 2).74 It states that “any produc-tion process on board a ship during sea voyages is prohibited. Production processes refer to any deliberate operation whereby a chemical reaction between a ship’s cargo and any other sub-stance or cargo takes place.”75
During the regulation’s drafting process, the initial ban on all blending operations aboard ships at sea was watered down by IMO member states to be just a ban on blending during sea voyages. The International Bunker Industry Association (IBIA)
wasn’t unhappy about that intervention, stating that “the long established practice of blending whilst the ship is moored with-in port limits or alongside a stationary receiving vessel will be allowed to continue.”76
Since the ban came into force, however, its scope and imple-mentation have been uncertain.77 No universal interpretation exists, for example, on where a sea voyage starts and ends. Inter-tanko simply says that a “sea voyage” is “sailing from one port to another.”78 The marine survey company BMT Surveys high-lights certain ambiguities: “Blending operations at an anchorage en-route may not be permissible, for example, where there are no facilities for a quick response to a spillage. Blending at an anchorage within port limits may be permissible depending upon the local port regulations. This poses the question of whether or not it is permissible under the regulations to ‘blend’ during or prior to an offshore STS (ship to ship) operation. Owners should also seek advice from the relevant authorities and from their cargo insurers.”79 Dennis de Bruin from BMT Surveys suggests the IMO could have been more specific in its wording when drafting the regulation.80
Gard, the marine insurance provider, has also received en-quiries from clients wanting to know how the ban should be interpreted and implemented. It subsequently consulted the IMO for clarification. Gard concludes, first, that “during a sea voyage” refers to the moment when the ship is beyond port limits, and, second, that port authorities are responsible for defining where these limits lie and the circumstances in which blending may be undertaken in the port.81 Our research suggests that port authorities tend either to forbid STS oper-ations offshore or to regulate it. We found no special proce-dures or requirements for onboard blending.82 And while Eu-ropean countries are increasingly restricting STS operations offshore and moving them into ports because of the risk of oil spills, the West African coastline has numerous meeting plac-es between Dakar and Luanda for tankers, where STS is car-ried out.83
Regulation regarding onboard production during sea voyage is even less clear. Like the blending ban, the text leaves open the possibility of conducting industrial processes on board while at anchor. However, IMO delegates were not envisaging that any production processes would take place aboard ships, during a voyage or not, when they developed the MARPOL Convention. The MARPOL Convention, the International Convention for the Prevention of Pollution from Ships,84 covers only the waste that is generated by the ship as a vehicle. This waste includes ballast, oil, lubricants, fuels and other waste generated by the crew during maintenance or voyage, such as paint, sewage, food packaging and food waste. It does not cover the waste generated by industrial processes conducted aboard.85
It is difficult to ascertain whether dangerous and waste-pro-ducing production processes such as the caustic soda washing done by Trafigura aboard the Probo Koala in 2006 occur at an-chorage, for example offshore Lomé. Knowing more would re-quire the authorities to look deeper into this issue. But we know, however, that these processes have occurred at least one other time, in 2013 in European waters, despite the risks to crew and environment.

Breathing Geneva’s fresh air and socialising at Rooftop 42°, a bar frequented by commodity traders. Geneva, July 2016 | © Carl De Keyzer – Magnum
A Public Eye Investigation | September 2016 125
12
Conclusions: putting people before
profit
126 DIRTY DIESEL – How Swiss Traders Flood Africa with Toxic Fuels | Chapter 12
Thanks to their financial strike force and to alliances built with politically connected partners and dodgy door-openers, Swiss commodity trading companies have become major players in Africa’s downstream market. In certain countries, they have se-cured dominant positions, demonstrating prodigious appetite and ability to manoeuvre in risky contexts. By purchasing assets such as storage and networks of petrol stations across Africa, the commodity trading companies have increased their option-ality, expanded their business, and secured market shares in both their target countries and around the world.
But while this is an opportunity for business, it is a major hazard for African public health. Swiss commodity trading companies as well as others profit from weak fuel standards, es-pecially in West Africa, to sell diesel and gasoline that pollutes the environment and damages people’s health. Since they pro-duce and sell more low sulphur fuels than high sulphur fuels, they are certainly capable of providing clean products to Africa, too. But they don’t. The reason for this is simply that cheap blendstocks provide them with higher margins. Trading compa-nies make more profits by supplying dirty fuels than clean ones.
The samples we collected at pumps in eight countries show for the first time what Swiss trading companies sell in Africa. Our findings leave no room for doubt: the diesel they sell con-tains up to 380 times the European authorised limits on sulphur and more than 630 times the actual levels found in European diesel. On average, the diesel in our samples contained 200 times more sulphur than allowed by the European standard. We also found worrying levels of other toxic substances at the “Swiss pumps” in several African countries, including benzene and polyaromatics. These are regulated in Europe.
These appalling results represent just a snapshot of the real-ity, but they are backed by official documents collected in Gha-na. These documents highlight the very high levels of sulphur in the diesel supplied to Ghana by foreign companies, including many of the largest Swiss traders. Furthermore, the information that we gathered at many pumps between Lusaka and Bamako matches with macro level trade statistics. The ARA region, con-sisting of the main ports of the Netherlands and Belgium, clear-ly provides the majority of petroleum products sold to West Africa. The data we used even categorises diesel exports by their sulphur content, showing how the ARA region sends high-qual-ity diesel to regions where the standards are stringent, while 80 percent of diesel fuels shipped to West Africa are dirty diesel fuels with sulphur levels at least 100 times higher than the ARA region’s legal limits. This North-South trade becomes even more scandalous, when one remembers that West Africa supplies the world, and especially Europe, with some of the highest quality low sulphur crude oil available.
Besides selling dirty fuels, Swiss trading companies also play a decisive role in the supply of these fuels to African na-tions. This statement is not limited to the four companies that own petrol stations; it includes most of the oil trading compa-nies based in Switzerland, as well as the oil majors and other players. We had access to a database which showed Swiss trad-ing companies chartering 61 percent of the reported product tankers, which navigated the Atlantic from ARA to West Africa in 2014. In the case of Ghana, we could prove not only that they
dominate the supply, we could also see what they trade and from where. Again, Swiss trading companies delivering from Europe and the US Gulf were responsible for the imports of most dirty products into Ghana.
The ARA region is a place where blendstocks are gathered from all over the world for blending into final products for dif-ferent markets. Trading companies describe themselves as lo-gisticians pure and simple, transporting goods from wherever they are in excess to wherever they are needed, but our research proves otherwise. Trading companies do not only supply and sell dirty fuels. They deliberately produce them as African Qual-ity too. To achieve this, they use their massive storage capacity, either rented or owned, either onshore or at sea, their refineries, their worldwide network of contacts and their “blending indus-try” skills that form the bedrock of this entire business model. Their blending strategy is to take advantage of the availability of cheap and dirty blendstocks and of the weak fuel standards in Africa to “tailor”, as they say, products for this market, despite the risks to public health and the damage they may cause to the environment. A careful look at their business model can lead only to the conclusion that these aggressive, risk-taking actors do not behave like responsible corporations.
Simply put, Swiss commodity trading companies put profits before anything else, even before the health of the population, while claiming, as Vivo does for instance in Côte d’Ivoire, that “it uses all the means and tools necessary to ensure the latest inter-national standards of quality [...] so that Ivorian consumers bene-fit from what is best in terms of fuel when going to a Shell petrol stations". Our findings contravene these glossy CSR-statements. In a corporate video, Trafigura says that “Across Africa and other developing regions, our supply of affordable high-quality fuel products empowers local businesses.” Vivo Energy is the same, saying that “Our commitment to achieving and maintaining the highest international Health, Safety, Security and the Environ-ment (HSSE) standards is at the heart of our business and is a key differentiator (…) in Africa.” Not to repeat a similar promise made by Oryx Energies, that “Our commitment (…) for Africa means that we take every precaution to minimise the potential impact our products and services may have on the environment.” Com-menting on Oryx’s development in Mali, the chairman of the group, Jean Claude Gandur said: “This enables us to supply high-quality fuels (…) to an increasing number of clients.”1 The reality is quite different. Just to take Mali as an example, Oryx’s diesel in the land-locked country was the worst we found among 25 samples collected in 8 countries, with 380 times more sulphur than allowed by the European limit.
The fact that the dirty products are mainly produced in Eu-rope and the United States of America also highlights the cyni-cism of Western policy-makers who tolerate the sale of diesel and gasoline to Africa. These policy-makers know that such fuels could never be sold in their countries for the obvious health and environmental reasons. These governments cannot claim ignorance, because the main culprits of this North-South trade, the Netherlands and Belgium, even provide export statis-tics giving details of sulphur levels in the diesel exported. Policy- makers thus tolerate, at least tacitly, the worrying “regulatory arbitrage” of trading companies that play on double standards.
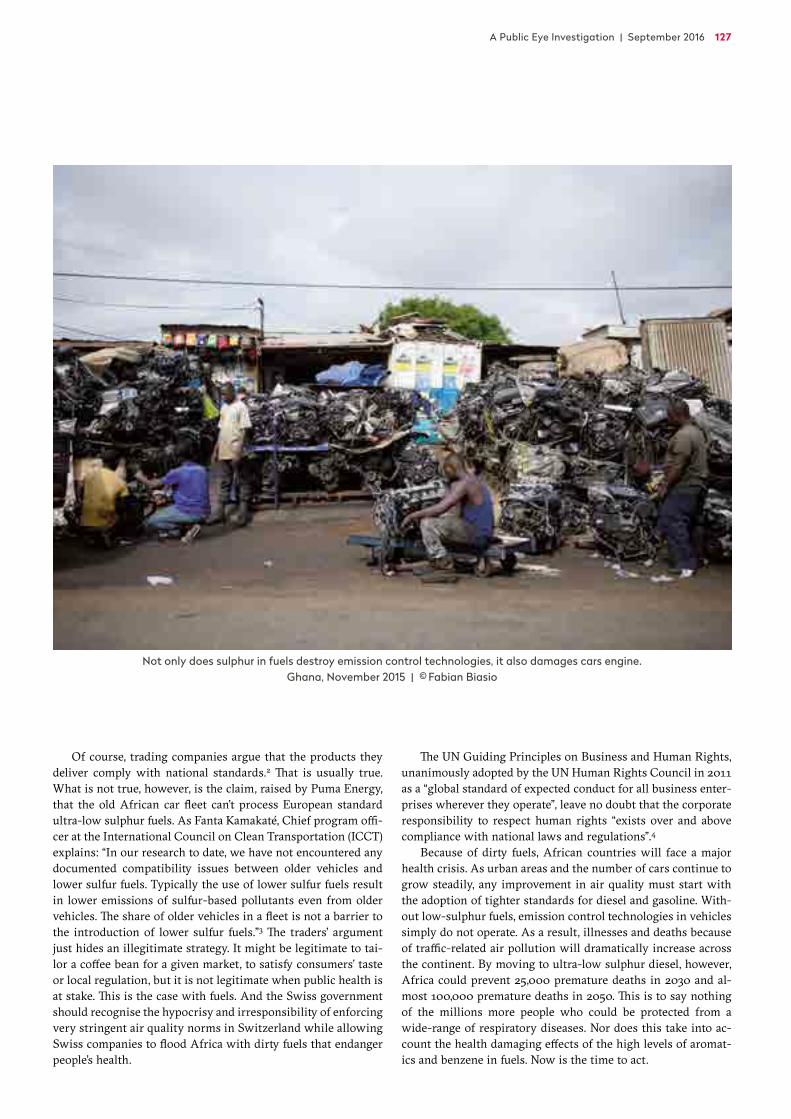
A Public Eye Investigation | September 2016 127
Of course, trading companies argue that the products they deliver comply with national standards.2 That is usually true. What is not true, however, is the claim, raised by Puma Energy, that the old African car fleet can’t process European standard ultra-low sulphur fuels. As Fanta Kamakaté, Chief program offi-cer at the International Council on Clean Transportation (ICCT) explains: “In our research to date, we have not encountered any documented compatibility issues between older vehicles and lower sulfur fuels. Typically the use of lower sulfur fuels result in lower emissions of sulfur-based pollutants even from older vehicles. The share of older vehicles in a fleet is not a barrier to the introduction of lower sulfur fuels.”3 The traders’ argument just hides an illegitimate strategy. It might be legitimate to tai-lor a coffee bean for a given market, to satisfy consumers’ taste or local regulation, but it is not legitimate when public health is at stake. This is the case with fuels. And the Swiss government should recognise the hypocrisy and irresponsibility of en forcing very stringent air quality norms in Switzerland while allowing Swiss companies to flood Africa with dirty fuels that endanger people’s health.
The UN Guiding Principles on Business and Human Rights, unanimously adopted by the UN Human Rights Council in 2011 as a “global standard of expected conduct for all business enter-prises wherever they operate”, leave no doubt that the corporate responsibility to respect human rights “exists over and above compliance with national laws and regulations”.4
Because of dirty fuels, African countries will face a major health crisis. As urban areas and the number of cars continue to grow steadily, any improvement in air quality must start with the adoption of tighter standards for diesel and gasoline. With-out low-sulphur fuels, emission control technologies in vehicles simply do not operate. As a result, illnesses and deaths because of traffic-related air pollution will dramatically increase across the continent. By moving to ultra-low sulphur diesel, however, Africa could prevent 25,000 premature deaths in 2030 and al-most 100,000 premature deaths in 2050. This is to say nothing of the millions more people who could be protected from a wide-range of respiratory diseases. Nor does this take into ac-count the health damaging effects of the high levels of aromat-ics and benzene in fuels. Now is the time to act.
Not only does sulphur in fuels destroy emission control technologies, it also damages cars engine. Ghana, November 2015 | © Fabian Biasio
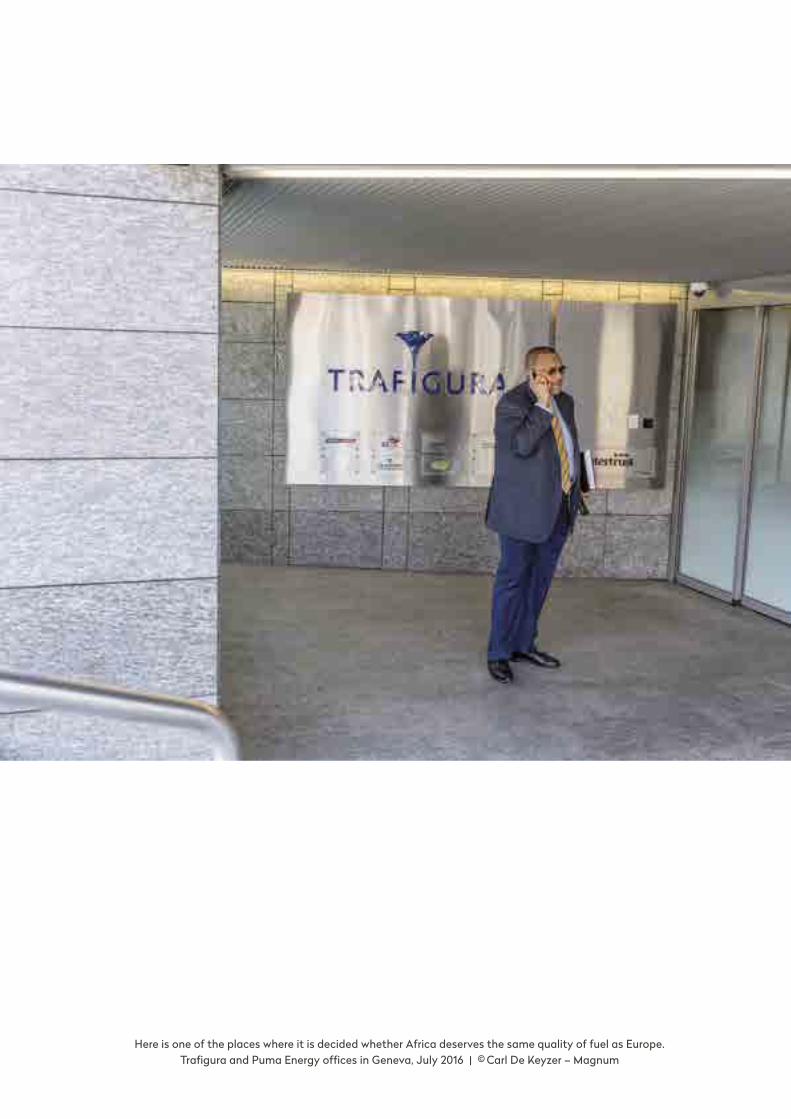
Here is one of the places where it is decided whether Africa deserves the same quality of fuel as Europe. Trafigura and Puma Energy offices in Geneva, July 2016 | © Carl De Keyzer – Magnum
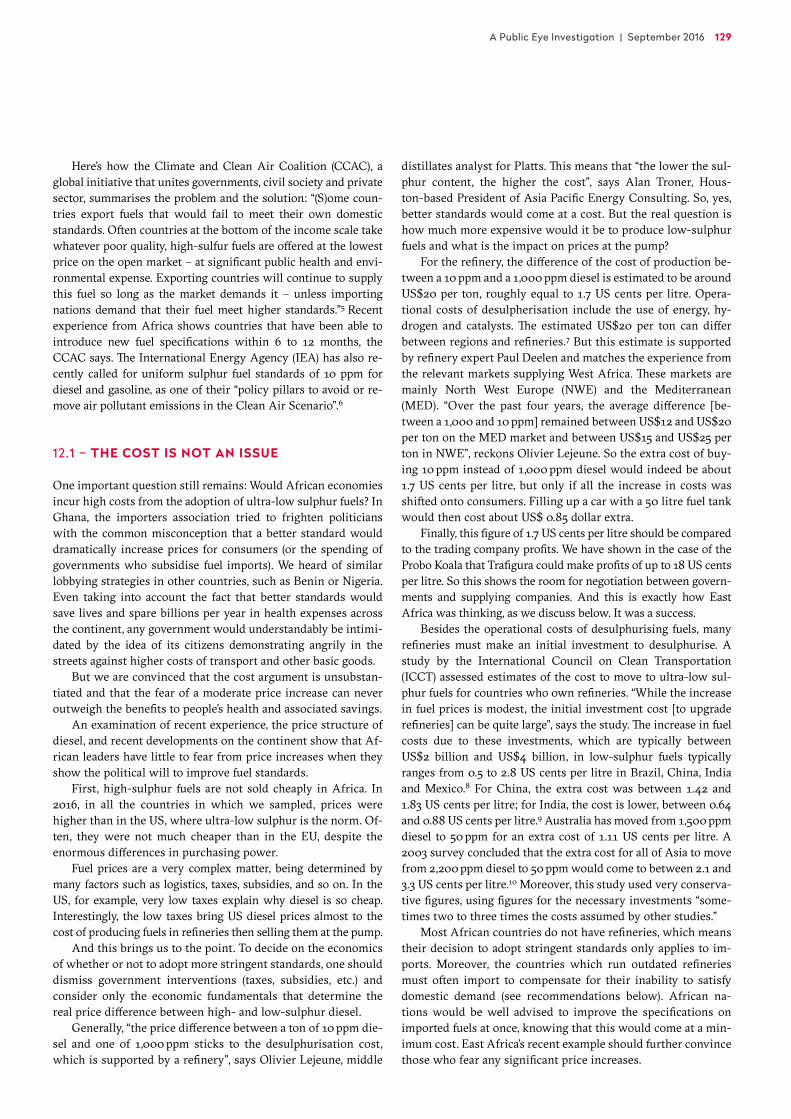
A Public Eye Investigation | September 2016 129
Here’s how the Climate and Clean Air Coalition (CCAC), a global initiative that unites governments, civil society and private sector, summarises the problem and the solution: “(S)ome coun-tries export fuels that would fail to meet their own domestic standards. Often countries at the bottom of the income scale take whatever poor quality, high-sulfur fuels are offered at the lowest price on the open market – at significant public health and envi-ronmental expense. Exporting countries will continue to supply this fuel so long as the market demands it – unless importing nations demand that their fuel meet higher standards.”5 Recent experience from Africa shows countries that have been able to introduce new fuel specifications within 6 to 12 months, the CCAC says. The International Energy Agency (IEA) has also re-cently called for uniform sulphur fuel standards of 10 ppm for diesel and gasoline, as one of their “policy pillars to avoid or re-move air pollutant emissions in the Clean Air Scenario”.6
12.1 – THE COST IS NOT AN ISSUE
One important question still remains: Would African economies incur high costs from the adoption of ultra-low sulphur fuels? In Ghana, the importers association tried to frighten politicians with the common misconception that a better standard would dramatically increase prices for consumers (or the spending of governments who subsidise fuel imports). We heard of similar lobbying strategies in other countries, such as Benin or Nigeria. Even taking into account the fact that better standards would save lives and spare billions per year in health expenses across the continent, any government would understandably be intimi-dated by the idea of its citizens demonstrating angrily in the streets against higher costs of transport and other basic goods.
But we are convinced that the cost argument is unsubstan-tiated and that the fear of a moderate price increase can never outweigh the benefits to people’s health and associated savings.
An examination of recent experience, the price structure of diesel, and recent developments on the continent show that Af-rican leaders have little to fear from price increases when they show the political will to improve fuel standards.
First, high-sulphur fuels are not sold cheaply in Africa. In 2016, in all the countries in which we sampled, prices were higher than in the US, where ultra-low sulphur is the norm. Of-ten, they were not much cheaper than in the EU, despite the enormous differences in purchasing power.
Fuel prices are a very complex matter, being determined by many factors such as logistics, taxes, subsidies, and so on. In the US, for example, very low taxes explain why diesel is so cheap. Interestingly, the low taxes bring US diesel prices almost to the cost of producing fuels in refineries then selling them at the pump.
And this brings us to the point. To decide on the economics of whether or not to adopt more stringent standards, one should dismiss government interventions (taxes, subsidies, etc.) and consider only the economic fundamentals that determine the real price difference between high- and low-sulphur diesel.
Generally, “the price difference between a ton of 10 ppm die-sel and one of 1,000 ppm sticks to the desulphurisation cost, which is supported by a refinery”, says Olivier Lejeune, middle
distillates analyst for Platts. This means that “the lower the sul-phur content, the higher the cost”, says Alan Troner, Hous-ton-based President of Asia Pacific Energy Consulting. So, yes, better standards would come at a cost. But the real question is how much more expensive would it be to produce low-sulphur fuels and what is the impact on prices at the pump?
For the refinery, the difference of the cost of production be-tween a 10 ppm and a 1,000 ppm diesel is estimated to be around US$20 per ton, roughly equal to 1.7 US cents per litre. Opera-tional costs of desulpherisation include the use of energy, hy-drogen and catalysts. The estimated US$20 per ton can differ between regions and refineries.7 But this estimate is supported by refinery expert Paul Deelen and matches the experience from the relevant markets supplying West Africa. These markets are mainly North West Europe (NWE) and the Mediterranean (MED). “Over the past four years, the average difference [be-tween a 1,000 and 10 ppm] remained between US$12 and US$20 per ton on the MED market and between US$15 and US$25 per ton in NWE”, reckons Olivier Lejeune. So the extra cost of buy-ing 10 ppm instead of 1,000 ppm diesel would indeed be about 1.7 US cents per litre, but only if all the increase in costs was shifted onto consumers. Filling up a car with a 50 litre fuel tank would then cost about US$ 0.85 dollar extra.
Finally, this figure of 1.7 US cents per litre should be compared to the trading company profits. We have shown in the case of the Probo Koala that Trafigura could make profits of up to 18 US cents per litre. So this shows the room for negotiation between govern-ments and supplying companies. And this is exactly how East Africa was thinking, as we discuss below. It was a success.
Besides the operational costs of desulphurising fuels, many refineries must make an initial investment to desulphurise. A study by the International Council on Clean Transportation (ICCT) assessed estimates of the cost to move to ultra-low sul-phur fuels for countries who own refineries. “While the increase in fuel prices is modest, the initial investment cost [to upgrade refineries] can be quite large”, says the study. The increase in fuel costs due to these investments, which are typically between US$2 billion and US$4 billion, in low-sulphur fuels typically ranges from 0.5 to 2.8 US cents per litre in Brazil, China, India and Mexico.8 For China, the extra cost was between 1.42 and 1.83 US cents per litre; for India, the cost is lower, between 0.64 and 0.88 US cents per litre.9 Australia has moved from 1,500 ppm diesel to 50 ppm for an extra cost of 1.11 US cents per litre. A 2003 survey concluded that the extra cost for all of Asia to move from 2,200 ppm diesel to 50 ppm would come to between 2.1 and 3.3 US cents per litre.10 Moreover, this study used very conserva-tive figures, using figures for the necessary investments “some-times two to three times the costs assumed by other studies.”
Most African countries do not have refineries, which means their decision to adopt stringent standards only applies to im-ports. Moreover, the countries which run outdated refineries must often import to compensate for their inability to satisfy domestic demand (see recommendations below). African na-tions would be well advised to improve the specifications on imported fuels at once, knowing that this would come at a min-imum cost. East Africa’s recent example should further convince those who fear any significant price increases.
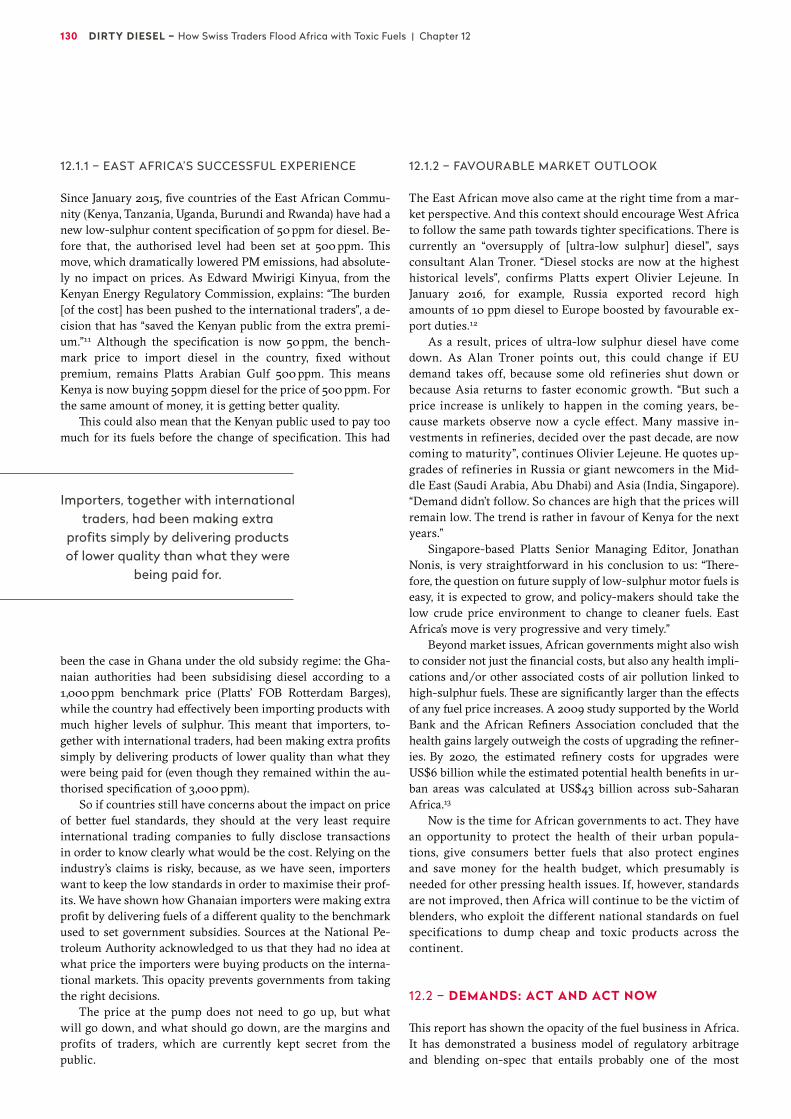
130 DIRTY DIESEL – How Swiss Traders Flood Africa with Toxic Fuels | Chapter 12
12.1.1 – EAST AFRICA’S SUCCESSFUL EXPERIENCE
Since January 2015, five countries of the East African Commu-nity (Kenya, Tanzania, Uganda, Burundi and Rwanda) have had a new low-sulphur content specification of 50 ppm for diesel. Be-fore that, the authorised level had been set at 500 ppm. This move, which dramatically lowered PM emissions, had absolute-ly no impact on prices. As Edward Mwirigi Kinyua, from the Kenyan Energy Regulatory Commission, explains: “The burden [of the cost] has been pushed to the international traders”, a de-cision that has “saved the Kenyan public from the extra premi-um.”11 Although the specification is now 50 ppm, the bench-mark price to import diesel in the country, fixed without premium, remains Platts Arabian Gulf 500 ppm. This means Kenya is now buying 50ppm diesel for the price of 500 ppm. For the same amount of money, it is getting better quality.
This could also mean that the Kenyan public used to pay too much for its fuels before the change of specification. This had
been the case in Ghana under the old subsidy regime: the Gha-naian authorities had been subsidising diesel according to a 1,000 ppm benchmark price (Platts’ FOB Rotterdam Barges), while the country had effectively been importing products with much higher levels of sulphur. This meant that importers, to-gether with international traders, had been making extra profits simply by delivering products of lower quality than what they were being paid for (even though they remained within the au-thorised specification of 3,000 ppm).
So if countries still have concerns about the impact on price of better fuel standards, they should at the very least require international trading companies to fully disclose transactions in order to know clearly what would be the cost. Relying on the industry’s claims is risky, because, as we have seen, importers want to keep the low standards in order to maximise their prof-its. We have shown how Ghanaian importers were making extra profit by delivering fuels of a different quality to the benchmark used to set government subsidies. Sources at the National Pe-troleum Authority acknowledged to us that they had no idea at what price the importers were buying products on the interna-tional markets. This opacity prevents governments from taking the right decisions.
The price at the pump does not need to go up, but what will go down, and what should go down, are the margins and profits of traders, which are currently kept secret from the public.
12.1.2 – FAVOURABLE MARKET OUTLOOK
The East African move also came at the right time from a mar-ket perspective. And this context should encourage West Africa to follow the same path towards tighter specifications. There is currently an “oversupply of [ultra-low sulphur] diesel”, says consultant Alan Troner. “Diesel stocks are now at the highest historical levels”, confirms Platts expert Olivier Lejeune. In January 2016, for example, Russia exported record high amounts of 10 ppm diesel to Europe boosted by favourable ex-port duties.12
As a result, prices of ultra-low sulphur diesel have come down. As Alan Troner points out, this could change if EU demand takes off, because some old refineries shut down or because Asia returns to faster economic growth. “But such a price increase is unlikely to happen in the coming years, be-cause markets observe now a cycle effect. Many massive in-vestments in refineries, decided over the past decade, are now coming to maturity”, continues Olivier Lejeune. He quotes up-grades of refineries in Russia or giant newcomers in the Mid-dle East (Saudi Arabia, Abu Dhabi) and Asia (India, Singapore). “Demand didn’t follow. So chances are high that the prices will remain low. The trend is rather in favour of Kenya for the next years.”
Singapore-based Platts Senior Managing Editor, Jonathan Nonis, is very straightforward in his conclusion to us: “There-fore, the question on future supply of low-sulphur motor fuels is easy, it is expected to grow, and policy-makers should take the low crude price environment to change to cleaner fuels. East Africa’s move is very progressive and very timely.”
Beyond market issues, African governments might also wish to consider not just the financial costs, but also any health impli-cations and/or other associated costs of air pollution linked to high-sulphur fuels. These are significantly larger than the effects of any fuel price increases. A 2009 study supported by the World Bank and the African Refiners Association concluded that the health gains largely outweigh the costs of upgrading the refiner-ies. By 2020, the estimated refinery costs for upgrades were US$6 billion while the estimated potential health benefits in ur-ban areas was calculated at US$43 billion across sub-Saharan Africa.13
Now is the time for African governments to act. They have an opportunity to protect the health of their urban popula-tions, give consumers better fuels that also protect engines and save money for the health budget, which presumably is needed for other pressing health issues. If, however, standards are not improved, then Africa will continue to be the victim of blenders, who exploit the different national standards on fuel specifications to dump cheap and toxic products across the continent.
12.2 – DEMANDS: ACT AND ACT NOW
This report has shown the opacity of the fuel business in Africa. It has demonstrated a business model of regulatory arbitrage and blending on-spec that entails probably one of the most
Importers, together with international traders, had been making extra
profits simply by delivering products of lower quality than what they were
being paid for.

A Public Eye Investigation | September 2016 131
Interview with Jane Akumu of UNEP – Jane Akumu is a Programme Officer in the Transport Unit, Energy Branch of the Division of Technology, Industry and Economics. Prior to joining UNEP in 2004, she worked for the Govern-ment of Kenya, first at the Ministry of Planning, then at the Ministry of Ener-gy as head of the Petroleum Monitor-ing Unit. She holds a Bachelor's degree from the University of Nairobi and a
Master of Arts degree in Economics from Carleton University in Canada.
Travelling tirelessly from her desk in Nairobi across the whole of Africa to meet government officials and other stake-holders to improve sulphur standards in fuels, Jane tells us that she is currently focused on supporting West and Southern Afri-ca regions in introducing low-sulphur diesel fuels. Her work is part of the Partnership for Clean Fuels and Vehicles (PCFV) and funded by the Climate and Clean Air Initiative (CCAC). Accord-ing to Jane the objective of the CCAC is also to reduce black carbon emissions, an important short-lived climate pollutant. The main focus of the CCAC is on reducing soot emissions from heavy duty diesel vehicles (buses and trucks). Vehicles have also attracted Jane’s interest. She is busy initiating cleaner vehicle discussions in the region through a programme called the Glob-al Fuel Efficiency Initiative (GFEI). The GFEI aims at doubling the efficiency of newly imported vehicles in the region by pro-moting policies that favour import cleaner fuel economy vehi-cles in countries. But this is dependent on low-sulphur fuels.
What is the role of UNEP with regards to cleaner fuels?UNEP started to work on the adoption of cleaner fuels in devel-oping and transitional countries after the formation of the Part-nership for Clean Fuels and Vehicles (PCFV) at the World Sum-mit on Sustainable Development in Johannesburg, South Africa, in September 2002. UNEP was selected as the secretariat for the PCFV. At the time, it was realised that while developed coun-tries were implementing various policy measures to reduce their vehicle emissions so as to improve urban air quality through cleaner fuels and vehicles standards, the reverse was true in developing countries. Three focus areas were identified to cost-effectively reduce vehicle emissions. These are the elim-ination of lead in gasoline; the phase down of sulphur in diesel and gasoline fuels; and the adoption of cleaner vehicle technolo-gies. The initial priority of the PCFV was the phasing out of leaded petrol in sub-Saharan Africa as only 1 country of the 49 countries then had eliminated leaded petrol.
Why is it important that African countries move quickly to ultra-low sulphur fuels, as so many of them still allow high sulphur in fuels?Many studies have provided the much needed evidence on the environmental, health and vehicle benefits of ultra-low sulphur
fuels. In 2012, the World Health Organisation classified diesel emissions as a leading contributor to lung cancer among other upper respiratory illnesses. It is important to note that devel-oped countries have already adopted ultra-low sulphur fuels. Ultra-low sulphur fuels are key for the efficient running of vehi-cle emission control technologies. African countries can leap-frog to reduced vehicle emissions through the adoption of ultra- low sulphur fuels and cleaner vehicle emission standards. What are the main obstacles on getting African countries to move?There are three main challenges to countries in moving to low- sulphur fuels. The number one obstacle is limited awareness on the potential benefits of cleaner fuels and vehicle standards, fol-lowed by the lack of cleaner fuels and vehicle standards, and finally the existence of old and obsolete refineries that need upgrading to produce ultra-low sulphur fuels.
Is it your experience that it is easier to improve the standard on fuels when the country relies on imports for its supply rather than on a local refinery? What are the key obstacles for import-ing countries to move?It is relatively easier for importing countries to adopt ultra-low sulphur fuels. However we also see that even for importing countries, there may be other obstacles such as infrastructure facilities especially for land-locked countries which have to rely on other countries with ports, or if one country has a significant fuel market share in the sub-region thus dictating the fuel im-port standard.
What are the lessons learned from the recent positive East African experience?One of the key lessons from East Africa is the importance of developing and adopting regionally harmonized standards due to the interdependence of countries in any sub-region. The sen-sitisation of the public and policy-makers is equally crucial.
Would the adoption of an ultra-low sulphur standard in fuels be costly for African consumers and/or governments?On the contrary, the adoption of ultra-low sulphur fuels will save governments income. For example in Kenya, vehicle emis-sions have been estimated to cost the country about US$ 1 bil-lion annually. This is the economic loss due to vehicle emission pollutants related illnesses and deaths in monetary terms for patients treated. In countries where low-sulphur fuels have been introduced, there was no price differential. However mov-ing to ultra-low sulphur fuels may come at a small premium, but the benefits outweigh the costs.
In this campaign, what is the success you have been most proud of with?The elimination of leaded petrol in the sub-Saharan Africa region as well as the progressive reduction of sulphur level in diesel fuels from predominantly high levels of over 10,000 ppm to 50–500 ppm in many countries.
Box 12.1 – THE BENEFITS OF MOVING TO ULTRA-LOW SULPHUR FUELS OUTWEIGH THE COSTS
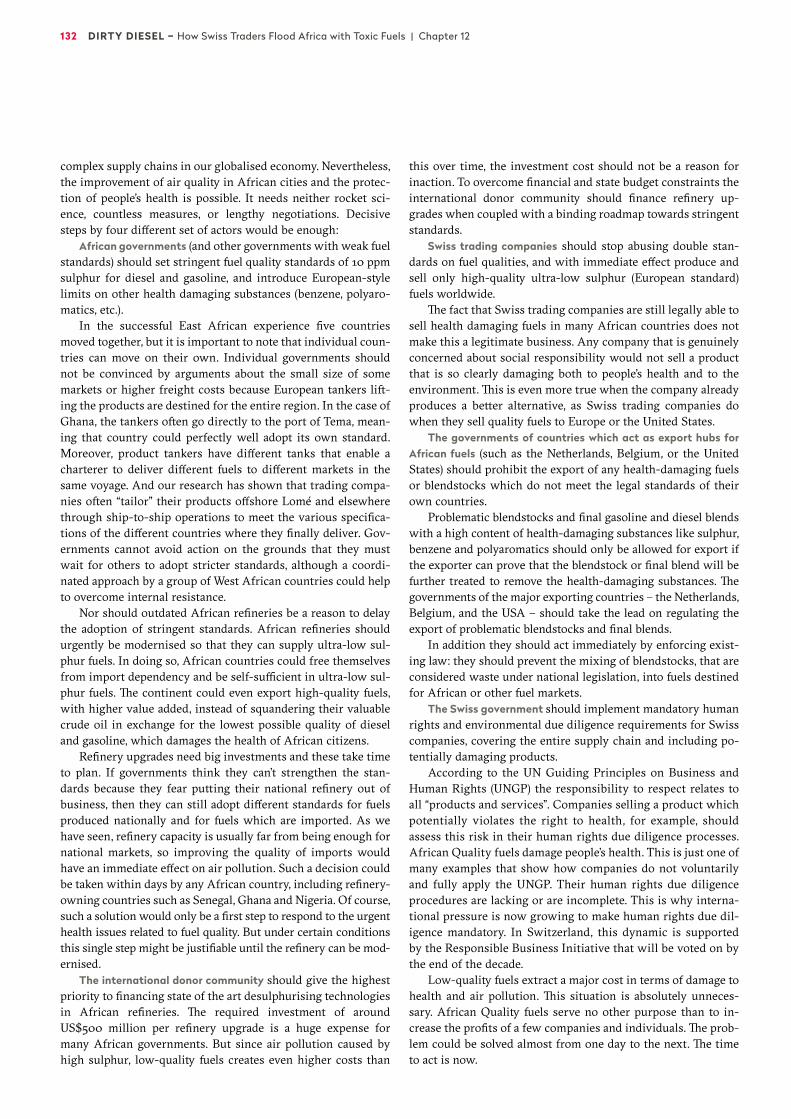
132 DIRTY DIESEL – How Swiss Traders Flood Africa with Toxic Fuels | Chapter 12
complex supply chains in our globalised economy. Nevertheless, the improvement of air quality in African cities and the protec-tion of people’s health is possible. It needs neither rocket sci-ence, countless measures, or lengthy negotiations. Decisive steps by four different set of actors would be enough:
African governments (and other governments with weak fuel standards) should set stringent fuel quality standards of 10 ppm sulphur for diesel and gasoline, and introduce European-style limits on other health damaging substances (benzene, polyaro-matics, etc.).
In the successful East African experience five countries moved together, but it is important to note that individual coun-tries can move on their own. Individual governments should not be convinced by arguments about the small size of some markets or higher freight costs because European tankers lift-ing the products are destined for the entire region. In the case of Ghana, the tankers often go directly to the port of Tema, mean-ing that country could perfectly well adopt its own standard. Moreover, product tankers have different tanks that enable a charterer to deliver different fuels to different markets in the same voyage. And our research has shown that trading compa-nies often “tailor” their products offshore Lomé and elsewhere through ship-to-ship operations to meet the various specifica-tions of the different countries where they finally deliver. Gov-ernments cannot avoid action on the grounds that they must wait for others to adopt stricter standards, although a coordi-nated approach by a group of West African countries could help to overcome internal resistance.
Nor should outdated African refineries be a reason to delay the adoption of stringent standards. African refineries should urgently be modernised so that they can supply ultra-low sul-phur fuels. In doing so, African countries could free themselves from import dependency and be self-sufficient in ultra-low sul-phur fuels. The continent could even export high-quality fuels, with higher value added, instead of squandering their valuable crude oil in exchange for the lowest possible quality of diesel and gasoline, which damages the health of African citizens.
Refinery upgrades need big investments and these take time to plan. If governments think they can’t strengthen the stan-dards because they fear putting their national refinery out of business, then they can still adopt different standards for fuels produced nationally and for fuels which are imported. As we have seen, refinery capacity is usually far from being enough for national markets, so improving the quality of imports would have an immediate effect on air pollution. Such a decision could be taken within days by any African country, including refinery- owning countries such as Senegal, Ghana and Nigeria. Of course, such a solution would only be a first step to respond to the urgent health issues related to fuel quality. But under certain conditions this single step might be justifiable until the refinery can be mod-ernised.
The international donor community should give the highest priority to financing state of the art desulphurising technologies in African refineries. The required investment of around US$500 million per refinery upgrade is a huge expense for many African governments. But since air pollution caused by high sulphur, low-quality fuels creates even higher costs than
this over time, the investment cost should not be a reason for inaction. To overcome financial and state budget constraints the international donor community should finance refinery up-grades when coupled with a binding roadmap towards stringent standards.
Swiss trading companies should stop abusing double stan-dards on fuel qualities, and with immediate effect produce and sell only high-quality ultra-low sulphur (European standard) fuels worldwide.
The fact that Swiss trading companies are still legally able to sell health damaging fuels in many African countries does not make this a legitimate business. Any company that is genuinely concerned about social responsibility would not sell a product that is so clearly damaging both to people’s health and to the environment. This is even more true when the company already produces a better alternative, as Swiss trading companies do when they sell quality fuels to Europe or the United States.
The governments of countries which act as export hubs for African fuels (such as the Netherlands, Belgium, or the United States) should prohibit the export of any health-damaging fuels or blendstocks which do not meet the legal standards of their own countries.
Problematic blendstocks and final gasoline and diesel blends with a high content of health-damaging substances like sulphur, benzene and polyaromatics should only be allowed for export if the exporter can prove that the blendstock or final blend will be further treated to remove the health-damaging substances. The governments of the major exporting countries – the Netherlands, Belgium, and the USA – should take the lead on regulating the export of problematic blendstocks and final blends.
In addition they should act immediately by enforcing exist-ing law: they should prevent the mixing of blendstocks, that are considered waste under national legislation, into fuels destined for African or other fuel markets.
The Swiss government should implement mandatory human rights and environmental due diligence requirements for Swiss companies, covering the entire supply chain and including po-tentially damaging products.
According to the UN Guiding Principles on Business and Human Rights (UNGP) the responsibility to respect relates to all “products and services”. Companies selling a product which potentially violates the right to health, for example, should assess this risk in their human rights due diligence processes. African Quality fuels damage people’s health. This is just one of many examples that show how companies do not voluntarily and fully apply the UNGP. Their human rights due diligence procedures are lacking or are incomplete. This is why interna-tional pressure is now growing to make human rights due dil-igence mandatory. In Switzerland, this dynamic is supported by the Responsible Business Initiative that will be voted on by the end of the decade.
Low-quality fuels extract a major cost in terms of damage to health and air pollution. This situation is absolutely unneces-sary. African Quality fuels serve no other purpose than to in-crease the profits of a few companies and individuals. The prob-lem could be solved almost from one day to the next. The time to act is now.
A Public Eye Investigation | September 2016 133
GlossaryAnnexesEndnotes
Glossary
AFRICAN QUALITYLow-quality fuels primarily characterised by their high sulphur content, though the term is also used for fuels exhibiting other low-quality aspects like high olefinic or aromatic content. “Afri-can Quality” is the term used by the industry for fuels destined for African markets.
BLENDSTOCKA refined oil product or chemical that is combined (blended) with other products to produce a finished petroleum product.
BUNKERINGThe process of supplying a ship with marine fuel, usually resid-ual fuel oil or marine gasoil.
FEEDSTOCKCrude oil or an intermediate oil product used as a base to pro-duce something else. Straight run fuel oil and naphtha, when used as feedstocks, are further processed by a refinery or a petro-chemical plant.
GASOIL/GAS OILAn oil product suitable for diesel engines and/or heating. Com-monly used to fuel cars (also referred to as Automotive Gas Oil in the industry or diesel), trucks, ships, power stations or as heating oil. Also used as a feedstock.
LOW-SULPHUR FUELA fuel with a sulphur content of around 50 ppm or less (~ 50 ppm), which because of its low sulphur content, enables the use of advanced control technologies for diesel vehicles. Diesel partic-ulate filters can be used with low sulphur fuel but only achieve approximately 50 % control efficiency. Selective catalytic reduc-tion can be used for over 80 % control of NOx emissions. MIDDLE DISTILLATESThe group of refined oil products coming out of the middle part of a crude distillation unit – typically includes diesel, gasoil and jet fuel.
NAPHTHAA fraction of gasoline used as a petrochemical feedstock and as a feedstock for further processing to make a high octane gaso-line blending component from low octane naphtha.
PETROLEUM PRODUCTSThe group of finished and intermediate products obtained from the processing of crude oil, natural gas and other hydrocarbon compounds. Gasoline, diesel and jet fuel are the most commonly known.
SPECIFICATIONSA standard defining a set of chemical properties for a refined (and/or blended) oil product. Petroleum products have standard specifications related to the consumer market.
ULTRA-LOW SULPHUR FUELA fuel with a sulphur content of around 10 ppm or less (~ 10 ppm) that allows for the use of NOx absorbers, increasing NOx con-trol to over 90 % in both diesel and gasoline vehicles. This enables engine design to be more fuel-efficient. Particulate fil-ters achieve maximum efficiency with ultra-low sulphur fuels, approaching 100 % control of particulate matter.
A Public Eye Investigation | September 2016 135
Annexes
ANNEX 1 – A SUMMARY OF STS OPERATIONS IN WHICH THREE BATCHES OF WASHED COKER NAPHTHA ARE OFFLOADED FROM THE PROBO KOALA
TO OFFLOAD THE FIRST BATCH OF CAUSTIC SODA WASHED COKER NAPHTHA:
– On April 29, 2006, the Probo Koala conducted a ship-to-ship (STS) operation with the Riza, a product tanker (39,155 DWT), “to discharge cargo”. The Riza then sailed straight to Nigeria, Apapa-Lagos, where it stayed for about three months before heading to South America.
Before accepting washed naphtha from the Probo Koala, the Riza had come from the Tunisian port of La Skhira where Tra-figura had recently conducted caustic soda washings onshore. Gas leakages during the operation at Tankmed led the Tuni-sian authorities to suspend the caustic soda washing opera-tions. And this suspension led Trafigura to move its opera-tions out to sea.1
– On May 17, 2006, the Probo Koala conducted another STS op-eration with the Lielupe, a product tanker (39,870 DWT), “to discharge cargo”. The Lielupe then headed straight to Nigeria, Apapa-Lagos, where it stayed for about two months. It was the tanker's last voyage before heading to Chittagong, Bangla-desh, where she was to be broken up.
Before accepting washed naphtha from the Probo Koala, the Lielupe had come from Constantza, a Romanian port in the Black Sea.
TO OFFLOAD THE SECOND BATCH OF CAUSTIC SODA WASHED COKER NAPHTHA:
– On June 14, 2006, the Probo Koala conducted an STS opera-tion with the High Consensus, a product tanker (45,896 DWT), “to discharge cargo”. The High Consensus then sailed straight to Nigeria, Apapa-Lagos, where it stayed for about a month before sailing to South America.
Before accepting the washed naphtha from the Probo Koala, the High Consensus had come from Port-de-Bouc, in France.
– On June 17, 2006, the Probo Koala conducted an STS operation with the Tikhoretsk, a Combined Chemical and Oil Tanker (40,791 DWT), “to discharge cargo”. The Tikhoretsk then went straight to Nigeria (Apapa-Lagos), where it stayed for about five weeks before sailing to Poland.
Before accepting washed naphtha from the Probo Koala, the Tikoretsk had come from the Russian port of Vitino.
TO OFFLOAD THE THIRD BATCH OF WASHED COKER NAPHTHA:
– Between June 19 and 24, the Probo Koala conducted several STS operations with the Seavinha, a tanker (39,672 DWT), “to discharge cargo”. The Seavinha then went straight to Nigeria (Apapa-Lagos), Lomé, and Tema where it stayed for around seven weeks before going to Fujairah.
Before accepting washed naphtha from the Probo Koala, the Seavinha had actually delivered the third batch of unwashed coker naphtha from the US Gulf to the Probo Koala on the 18 June.2
– On June 26, 2006, the Probo Koala conducted a last STS oper-ation with Transport, a Combined Chemical and Oil Tanker (38,987 DWT), at which point it was noted “discharging completed.” The Transport sailed straight to Benin, Cotonou, where it stayed for about two months before sailing to South America.
Before accepting washed naphtha from the Probo Koala, the Transport had come from the Turkish port of Mersin.
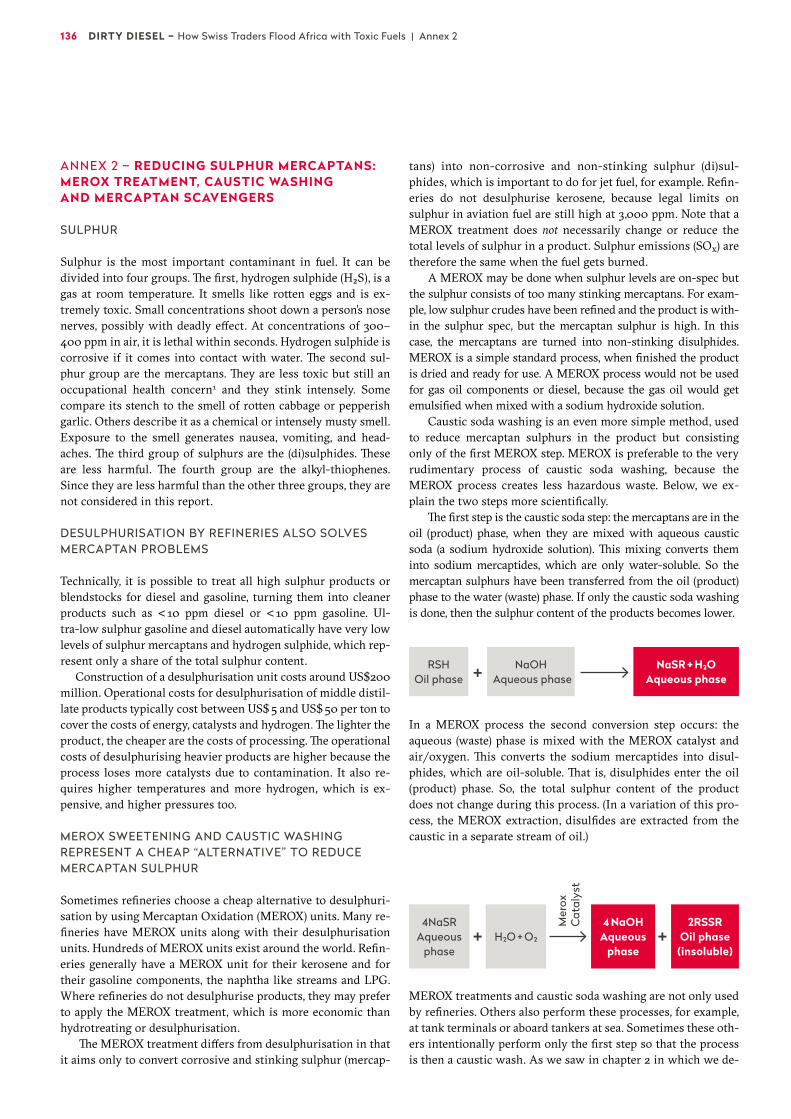
136 DIRTY DIESEL – How Swiss Traders Flood Africa with Toxic Fuels | Annex 2
ANNEX 2 – REDUCING SULPHUR MERCAPTANS: MEROX TREATMENT, CAUSTIC WASHING AND MERCAPTAN SCAVENGERS
SULPHUR
Sulphur is the most important contaminant in fuel. It can be divided into four groups. The first, hydrogen sulphide (H₂S), is a gas at room temperature. It smells like rotten eggs and is ex-tremely toxic. Small concentrations shoot down a person’s nose nerves, possibly with deadly effect. At concentrations of 300–400 ppm in air, it is lethal within seconds. Hydrogen sulphide is corrosive if it comes into contact with water. The second sul-phur group are the mercaptans. They are less toxic but still an occupational health concern1 and they stink intensely. Some compare its stench to the smell of rotten cabbage or pepperish garlic. Others describe it as a chemical or intensely musty smell. Exposure to the smell generates nausea, vomiting, and head-aches. The third group of sulphurs are the (di)sulphides. These are less harmful. The fourth group are the alkyl-thiophenes. Since they are less harmful than the other three groups, they are not considered in this report.
DESULPHURISATION BY REFINERIES ALSO SOLVES MERCAPTAN PROBLEMS
Technically, it is possible to treat all high sulphur products or blendstocks for diesel and gasoline, turning them into cleaner products such as < 10 ppm diesel or < 10 ppm gasoline. Ul-tra-low sulphur gasoline and diesel automatically have very low levels of sulphur mercaptans and hydrogen sulphide, which rep-resent only a share of the total sulphur content.
Construction of a desulphurisation unit costs around US$200 million. Operational costs for desulphurisation of middle distil-late products typically cost between US$ 5 and US$ 50 per ton to cover the costs of energy, catalysts and hydrogen. The lighter the product, the cheaper are the costs of processing. The operational costs of desulphurising heavier products are higher because the process loses more catalysts due to contamination. It also re-quires higher temperatures and more hydrogen, which is ex-pensive, and higher pressures too.
MEROX SWEETENING AND CAUSTIC WASHING REPRESENT A CHEAP “ALTERNATIVE” TO REDUCE MERCAPTAN SULPHUR
Sometimes refineries choose a cheap alternative to desulphuri-sation by using Mercaptan Oxidation (MEROX) units. Many re-fineries have MEROX units along with their desulphurisation units. Hundreds of MEROX units exist around the world. Refin-eries generally have a MEROX unit for their kerosene and for their gasoline components, the naphtha like streams and LPG. Where refineries do not desulphurise products, they may prefer to apply the MEROX treatment, which is more economic than hydrotreating or desulphurisation.
The MEROX treatment differs from desulphurisation in that it aims only to convert corrosive and stinking sulphur (mercap-
tans) into non-corrosive and non-stinking sulphur (di)sul-phides, which is important to do for jet fuel, for example. Refin-eries do not desulphurise kerosene, because legal limits on sulphur in aviation fuel are still high at 3,000 ppm. Note that a MEROX treatment does not necessarily change or reduce the total levels of sulphur in a product. Sulphur emissions (SOx) are therefore the same when the fuel gets burned.
A MEROX may be done when sulphur levels are on-spec but the sulphur consists of too many stinking mercaptans. For exam-ple, low sulphur crudes have been refined and the product is with-in the sulphur spec, but the mercaptan sulphur is high. In this case, the mercaptans are turned into non-stinking disulphides. MEROX is a simple standard process, when finished the product is dried and ready for use. A MEROX process would not be used for gas oil components or diesel, because the gas oil would get emulsified when mixed with a sodium hydroxide solution.
Caustic soda washing is an even more simple method, used to reduce mercaptan sulphurs in the product but consisting only of the first MEROX step. MEROX is preferable to the very rudimentary process of caustic soda washing, because the MEROX process creates less hazardous waste. Below, we ex-plain the two steps more scientifically.
The first step is the caustic soda step: the mercaptans are in the oil (product) phase, when they are mixed with aqueous caustic soda (a sodium hydroxide solution). This mixing converts them into sodium mercaptides, which are only water-soluble. So the mercaptan sulphurs have been transferred from the oil (product) phase to the water (waste) phase. If only the caustic soda washing is done, then the sulphur content of the products becomes lower.
In a MEROX process the second conversion step occurs: the aqueous (waste) phase is mixed with the MEROX catalyst and air/oxygen. This converts the sodium mercaptides into disul-phides, which are oil-soluble. That is, disulphides enter the oil (product) phase. So, the total sulphur content of the product does not change during this process. (In a variation of this pro-cess, the MEROX extraction, disulfides are extracted from the caustic in a separate stream of oil.)
MEROX treatments and caustic soda washing are not only used by refineries. Others also perform these processes, for example, at tank terminals or aboard tankers at sea. Sometimes these oth-ers intentionally perform only the first step so that the process is then a caustic wash. As we saw in chapter 2 in which we de-
NaSR + H2O Aqueous phase
4 NaOH Aqueous
phase
2RSSROil phase
(insoluble)
NaOH Aqueous phase
H2O + O2
RSHOil phase
4NaSRAqueous
phase
+
+ +
Mer
ox
Cat
alys
t
A Public Eye Investigation | September 2016 137
scribed the caustic soda washings of Trafigura aboard the Probo Koala, a full MEROX might be the goal, but the results may be less than 100 percent successful. This is because the second step of MEROX is difficult to do by improvising either procedures or equipment while on ships or in tanks.
MERCAPTAN SCAVENGERS ARE AN ALTERNATIVE TO MEROX TREATMENT AND CAUSTIC SODA WASHING
Industry sources tell us that, until a few years ago, caustic soda washing might have been a very common process in storage terminals at a port like Amsterdam. However, in the example of Amsterdam, terminal licenses no longer allow this process. This is what Trafigura found out in 2005 when they were looking for land-based opportunities to conduct caustic soda washing. We do not know whether terminals elsewhere such as in West Afri-ca would allow caustic soda washing. It is certainly a risky pro-cess, because the corrosive caustic soda used in the process can corrode the tank structure, with tank leakages as a result. After washing, the caustic waste (also called “spent caustic”), which still contains sulphur components, is left behind on the bottom of the tank. This tank then needs to be drained and disposed by a specialised waste processing company.
An alternative to the caustic washing of high sulphurous and stinking naphtha batches at terminals and on tankers is the use of additives, the so-called mercaptan scavengers. The addi-tives basically replace the caustic soda washing but the process is essentially quite similar. Mercaptan scavengers exist, which work as follows:– HFA 6115 for example works like a caustic soda washing. It is
sodium hydroxide dissolved in alcohol, and it makes the sul-phur sink to the bottom of the tank (thus lowering the sulphur content of the product).
– HFA 6126M for example works like a MEROX treatment.2
The additive combines caustic soda and oxidising agents with a cobalt catalyst in a semi-aqueous solution to convert the mercaptans. (It does not reduce the product’s sulphur content.)
Mercaptan scavengers are usually injected by “additive doctors” or by terminal staff on behalf of the client. A lab supervisor ex-plained to us how the use of mercaptan scavengers produces a bottom layer of corrosive waste that needs to be drained with water.3 One insider described to us a practice in which Russian ports see the injection of calculated quantities of mercaptan scav-enger into high sulphur naphtha batches. Then, when the tanker reaches its destination, Amsterdam, say, the naphtha is unloaded and the solids/disulfides which remain at the bottom of the ship’s tank are later washed overboard while at sea (tank washings). In an onshore tank the naphtha is circulated again during the un-loading, then the remaining “precipitation” of spent caustic waste is drained. The spent caustic is disposed of according to the Euro-pean waste code4 161001 (on “aqueous liquid wastes containing dangerous substances”). It should actually be disposed of accord-ing to the European waste code 050111 (“wastes from cleaning of fuels with bases”). But disposal of this type of waste is more ex-pensive, because it cannot be delivered to a port reception facility. According to the insider, this is how shore tank parks could hide
the fact that they are handling waste generated by the addition of mercaptan scavengers or caustic washing.
Oil terminals and shipowners who rent tanks and tankers to blenders should be very alert to caustic soda washing opera-tions, the use of mercaptan scavengers by their clients, and the need for correct disposal of the caustic soda waste layer. Termi-nal regulators should also be aware of these issues.
This appendix is based on information required from training documentation from a specialised training company in the field of oil products and subsequent meetings and correspondence with the trainers Paul Deelen and Ton Visser, desk research and talks with industry sources.
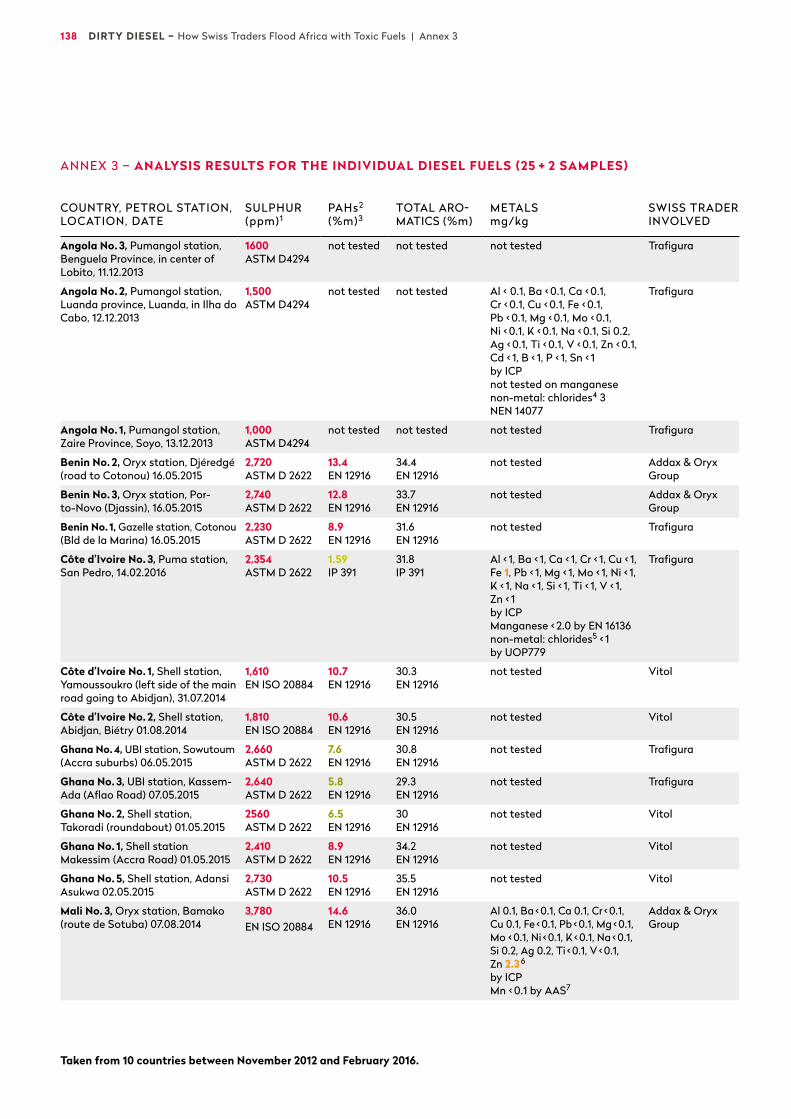
138 DIRTY DIESEL – How Swiss Traders Flood Africa with Toxic Fuels | Annex 3
ANNEX 3 – ANALYSIS RESULTS FOR THE INDIVIDUAL DIESEL FUELS (25 + 2 SAMPLES)
Taken from 10 countries between November 2012 and February 2016.
COUNTRY, PETROL STATION, LOCATION, DATE
SULPHUR(ppm)1
PAHs2
(%m)3TOTAL ARO-MATICS (%m)
METALSmg/kg
SWISS TRADER INVOLVED
Angola No. 3, Pumangol station, Benguela Province, in center of Lobito, 11.12.2013
1600ASTM D4294
not tested not tested not tested Trafigura
Angola No. 2, Pumangol station, Luanda province, Luanda, in Ilha do Cabo, 12.12.2013
1,500ASTM D4294
not tested not tested Al < 0.1, Ba < 0.1, Ca < 0.1, Cr < 0.1, Cu < 0.1, Fe < 0.1, Pb < 0.1, Mg < 0.1, Mo < 0.1, Ni < 0.1, K < 0.1, Na < 0.1, Si 0.2, Ag < 0.1, Ti < 0.1, V < 0.1, Zn < 0.1, Cd < 1, B < 1, P < 1, Sn < 1by ICPnot tested on manganesenon-metal: chlorides4 3NEN 14077
Trafigura
Angola No. 1, Pumangol station, Zaire Province, Soyo, 13.12.2013
1,000ASTM D4294
not tested not tested not tested Trafigura
Benin No. 2, Oryx station, Djéredgé (road to Cotonou) 16.05.2015
2,720ASTM D 2622
13.4EN 12916
34.4EN 12916
not tested Addax & Oryx Group
Benin No. 3, Oryx station, Por-to-Novo (Djassin), 16.05.2015
2,740ASTM D 2622
12.8EN 12916
33.7EN 12916
not tested Addax & Oryx Group
Benin No. 1, Gazelle station, Cotonou (Bld de la Marina) 16.05.2015
2,230ASTM D 2622
8.9EN 12916
31.6EN 12916
not tested Trafigura
Côte d’Ivoire No. 3, Puma station, San Pedro, 14.02.2016
2,354ASTM D 2622
1.59IP 391
31.8IP 391
Al < 1, Ba < 1, Ca < 1, Cr < 1, Cu < 1, Fe 1, Pb < 1, Mg < 1, Mo < 1, Ni < 1, K < 1, Na < 1, Si < 1, Ti < 1, V < 1, Zn < 1by ICPManganese < 2.0 by EN 16136non-metal: chlorides5 < 1 by UOP779
Trafigura
Côte d’Ivoire No. 1, Shell station, Yamoussoukro (left side of the main road going to Abidjan), 31.07.2014
1,610EN ISO 20884
10.7EN 12916
30.3EN 12916
not tested Vitol
Côte d’Ivoire No. 2, Shell station, Abidjan, Biétry 01.08.2014
1,810EN ISO 20884
10.6EN 12916
30.5EN 12916
not tested Vitol
Ghana No. 4, UBI station, Sowutoum (Accra suburbs) 06.05.2015
2,660ASTM D 2622
7.6EN 12916
30.8EN 12916
not tested Trafigura
Ghana No. 3, UBI station, Kassem- Ada (Aflao Road) 07.05.2015
2,640ASTM D 2622
5.8EN 12916
29.3EN 12916
not tested Trafigura
Ghana No. 2, Shell station, Takoradi (roundabout) 01.05.2015
2560ASTM D 2622
6.5EN 12916
30EN 12916
not tested Vitol
Ghana No. 1, Shell station Makessim (Accra Road) 01.05.2015
2,410ASTM D 2622
8.9EN 12916
34.2EN 12916
not tested Vitol
Ghana No. 5, Shell station, Adansi Asukwa 02.05.2015
2,730ASTM D 2622
10.5EN 12916
35.5EN 12916
not tested Vitol
Mali No. 3, Oryx station, Bamako (route de Sotuba) 07.08.2014
3,780EN ISO 20884
14.6EN 12916
36.0EN 12916
Al 0.1, Ba < 0.1, Ca 0.1, Cr < 0.1, Cu 0.1, Fe < 0.1, Pb < 0.1, Mg < 0.1, Mo < 0.1, Ni < 0.1, K < 0.1, Na < 0.1, Si 0.2, Ag 0.2, Ti < 0.1, V < 0.1, Zn 2.3 6by ICPMn < 0.1 by AAS7
Addax & Oryx Group

A Public Eye Investigation | September 2016 139
RED means outside European fuels standards (EN 559 Automotive fuels – Diesel – Requirements and test methods) GREEN means within European fuels standards (EN 559 Automotive fuels – Diesel – Requirements and test methods) ORANGE means on the limit of the allowable according to EN 559 Automotive fuels – Diesel – Requirements and test methods
(The EN 559 for Automotive fuels – Diesel – includes the requirements of the European Fuels Directive 98/70/EC, including amendments 2003/17/EC, 2009/30/EC and 2011/63/EU.)
COUNTRY, PETROL STATION, LOCATION, DATE
SULPHUR(ppm)1
PAHs2
(%m)3TOTAL ARO-MATICS (%m)
METALSmg/kg
SWISS TRADER INVOLVED
Mali No. 1, Shell station, Bamako (known as Shell-Fleuve) 29.07.2014
2,710EN ISO 20884
11.3EN 12916
34.0EN 12916
not tested Vitol
Mali No. 2, Shell station, Sikasso, 30.07.2014
2,930EN ISO 20884
12.1EN 12916
34.1EN 12916
not tested Vitol
Republic of the Congo No. 2, X-Oil station, Pointe Noire Foucks, rond-point CNSS, 30.09.2015
283ASTM D 2622
4.4IP 391
13.8IP 391
not tested Lynx Energy
Republic of the Congo No. 4, X-Oil station, Pointe Noire Hôpital Loandili, 30.09.2015
304ASTM D 2622
4.3IP 391
13.8IP 391
not tested Lynx Energy
Republic of the Congo No. 3, Puma station, Pointe Noire Matendé, 30.09.2015
294ASTM D 2622
4.5IP 391
14.0IP 391
not tested Trafigura
Republic of the Congo No. 1, Puma station, Pointe Noire, rond-point Loandjili, 30.09.2015
273ASTM D 2622
4.3IP 391
13.8IP 391
not tested Trafigura
Senegal No. 1, Shell station, Dakar, Avenue Pasteur, 07.11.2012
1,340EN ISO 20884/ ASTM D2622
9.9EN 12916
31.2EN 12916
Na < 0.1, K < 0.1, Cu < 0.1, P 0.2, Fe < 0.1, Mn < 0.1,Ni < 0.1, Si 0.5, Zn < 0.1, Ce < 0.1, Ca < 0.1by ICP 8
Vitol
Senegal No. 2, Shell station, Dakar, Pikine, 15.07.2013
2,940EN ISO 20884/ ASTM D2622
15.1EN 12916
43.7EN 12916
Na 0.2, K< 0.1, Cu < 0.1, P 0.2, Fe < 0.1, Mn < 0.1, Ni < 0.1, Si 0.5, Zn 0.1, Ce < 0.1, Ca < 0.1,by ICP
Vitol
Zambia No. 1, Oryx station, next to Independence Stadium), Great North Road, Lusaka (North entrance of the city), 27.08.2014
440EN ISO 20884
3.3EN 12916
28.9EN 12916
not tested Addax & Oryx Group
Zambia No. 2, Puma station, Kabwe (Independence Avenue on the left side of the road going North) 22.08.2014
2,850EN ISO 20884
7EN 12916
28.0EN 12916
not tested Trafigura
OTHER 9 NOT INVOLVING SWISS TRADERS
Mozambique, Petromoc station (Bombas da Petromoc), Maputo, Street EN2 (close to Rotunda da Praca 16 de Junho) 10.04.2014
297EN ISO 20884
4IP 391
30,6IP 391
not tested Petromoc
Togo, MRS station, Lomé (Kodjoviakopé, near Hôtel Bellevue) 12.05.2015
3,250ASTM D 2622
10.0EN 12916
33EN 12916
not tested MRS
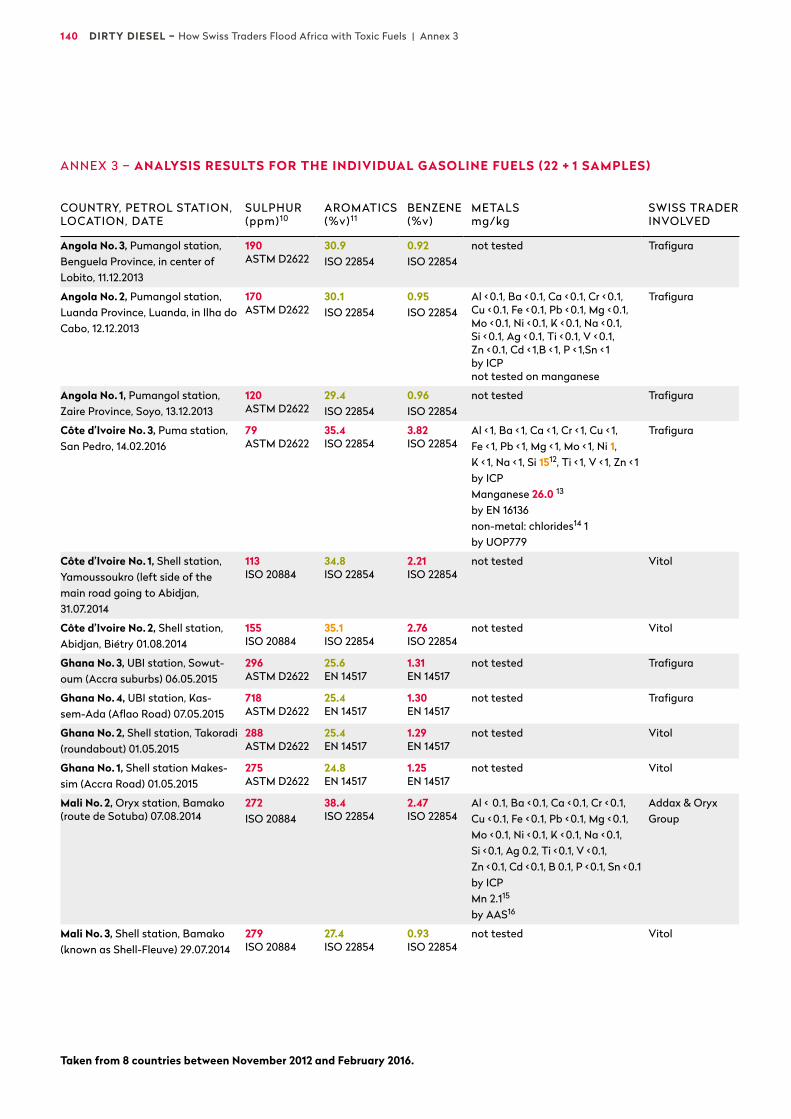
140 DIRTY DIESEL – How Swiss Traders Flood Africa with Toxic Fuels | Annex 3
ANNEX 3 – ANALYSIS RESULTS FOR THE INDIVIDUAL GASOLINE FUELS (22 + 1 SAMPLES)
Taken from 8 countries between November 2012 and February 2016.
COUNTRY, PETROL STATION, LOCATION, DATE
SULPHUR(ppm)10
AROMATICS (%v)11
BENZENE (%v)
METALSmg/kg
SWISS TRADER INVOLVED
Angola No. 3, Pumangol station, Benguela Province, in center of Lobito, 11.12.2013
190ASTM D2622
30.9ISO 22854
0.92ISO 22854
not tested Trafigura
Angola No. 2, Pumangol station, Luanda Province, Luanda, in Ilha do Cabo, 12.12.2013
170ASTM D2622
30.1ISO 22854
0.95ISO 22854
Al < 0.1, Ba < 0.1, Ca < 0.1, Cr < 0.1, Cu < 0.1, Fe < 0.1, Pb < 0.1, Mg < 0.1, Mo < 0.1, Ni < 0.1, K < 0.1, Na < 0.1, Si < 0.1, Ag < 0.1, Ti < 0.1, V < 0.1, Zn < 0.1, Cd < 1,B < 1, P < 1,Sn < 1by ICPnot tested on manganese
Trafigura
Angola No. 1, Pumangol station, Zaire Province, Soyo, 13.12.2013
120ASTM D2622
29.4ISO 22854
0.96ISO 22854
not tested Trafigura
Côte d’Ivoire No. 3, Puma station, San Pedro, 14.02.2016
79ASTM D2622
35.4ISO 22854
3.82ISO 22854
Al < 1, Ba < 1, Ca < 1, Cr < 1, Cu < 1, Fe < 1, Pb < 1, Mg < 1, Mo < 1, Ni 1, K < 1, Na < 1, Si 1512, Ti < 1, V < 1, Zn < 1by ICPManganese 26.0 13
by EN 16136non-metal: chlorides14 1by UOP779
Trafigura
Côte d’Ivoire No. 1, Shell station, Yamoussoukro (left side of the main road going to Abidjan, 31.07.2014
113ISO 20884
34.8ISO 22854
2.21 ISO 22854
not tested Vitol
Côte d’Ivoire No. 2, Shell station, Abidjan, Biétry 01.08.2014
155ISO 20884
35.1ISO 22854
2.76 ISO 22854
not tested Vitol
Ghana No. 3, UBI station, Sowut-oum (Accra suburbs) 06.05.2015
296ASTM D2622
25.6EN 14517
1.31 EN 14517
not tested Trafigura
Ghana No. 4, UBI station, Kas-sem-Ada (Aflao Road) 07.05.2015
718ASTM D2622
25.4EN 14517
1.30 EN 14517
not tested Trafigura
Ghana No. 2, Shell station, Takoradi (roundabout) 01.05.2015
288ASTM D2622
25.4EN 14517
1.29 EN 14517
not tested Vitol
Ghana No. 1, Shell station Makes-sim (Accra Road) 01.05.2015
275ASTM D2622
24.8EN 14517
1.25EN 14517
not tested Vitol
Mali No. 2, Oryx station, Bamako (route de Sotuba) 07.08.2014
272ISO 20884
38.4ISO 22854
2.47ISO 22854
Al < 0.1, Ba < 0.1, Ca < 0.1, Cr < 0.1, Cu < 0.1, Fe < 0.1, Pb < 0.1, Mg < 0.1, Mo < 0.1, Ni < 0.1, K < 0.1, Na < 0.1, Si < 0.1, Ag 0.2, Ti < 0.1, V < 0.1, Zn < 0.1, Cd < 0.1, B 0.1, P < 0.1, Sn < 0.1by ICPMn 2.115
by AAS16
Addax & Oryx Group
Mali No. 3, Shell station, Bamako (known as Shell-Fleuve) 29.07.2014
279ISO 20884
27.4ISO 22854
0.93ISO 22854
not tested Vitol
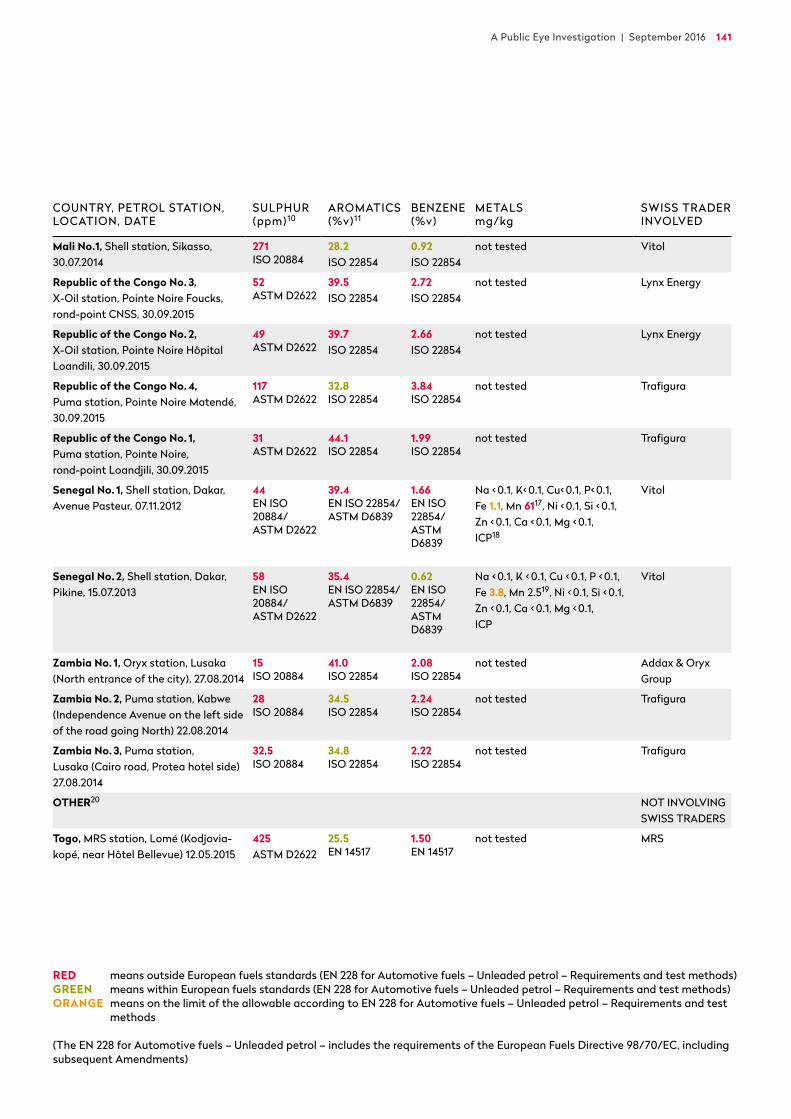
A Public Eye Investigation | September 2016 141
RED means outside European fuels standards (EN 228 for Automotive fuels – Unleaded petrol – Requirements and test methods) GREEN means within European fuels standards (EN 228 for Automotive fuels – Unleaded petrol – Requirements and test methods) ORANGE means on the limit of the allowable according to EN 228 for Automotive fuels – Unleaded petrol – Requirements and test methods
(The EN 228 for Automotive fuels – Unleaded petrol – includes the requirements of the European Fuels Directive 98/70/EC, including subsequent Amendments)
COUNTRY, PETROL STATION, LOCATION, DATE
SULPHUR(ppm)10
AROMATICS (%v)11
BENZENE (%v)
METALSmg/kg
SWISS TRADER INVOLVED
Mali No.1, Shell station, Sikasso, 30.07.2014
271ISO 20884
28.2ISO 22854
0.92ISO 22854
not tested Vitol
Republic of the Congo No. 3, X-Oil station, Pointe Noire Foucks, rond-point CNSS, 30.09.2015
52ASTM D2622
39.5ISO 22854
2.72 ISO 22854
not tested Lynx Energy
Republic of the Congo No. 2, X-Oil station, Pointe Noire Hôpital Loandili, 30.09.2015
49ASTM D2622
39.7ISO 22854
2.66ISO 22854
not tested Lynx Energy
Republic of the Congo No. 4, Puma station, Pointe Noire Matendé, 30.09.2015
117ASTM D2622
32.8ISO 22854
3.84ISO 22854
not tested Trafigura
Republic of the Congo No. 1, Puma station, Pointe Noire, rond-point Loandjili, 30.09.2015
31ASTM D2622
44.1ISO 22854
1.99ISO 22854
not tested Trafigura
Senegal No. 1, Shell station, Dakar, Avenue Pasteur, 07.11.2012
44EN ISO 20884/ ASTM D2622
39.4EN ISO 22854/ ASTM D6839
1.66EN ISO 22854/ ASTM D6839
Na < 0.1, K< 0.1, Cu< 0.1, P< 0.1, Fe 1.1, Mn 6117, Ni < 0.1, Si < 0.1, Zn < 0.1, Ca < 0.1, Mg < 0.1,ICP18
Vitol
Senegal No. 2, Shell station, Dakar, Pikine, 15.07.2013
58EN ISO 20884/ ASTM D2622
35.4EN ISO 22854/ ASTM D6839
0.62EN ISO 22854/ ASTM D6839
Na < 0.1, K < 0.1, Cu < 0.1, P < 0.1, Fe 3.8, Mn 2.519, Ni < 0.1, Si < 0.1, Zn < 0.1, Ca < 0.1, Mg < 0.1,ICP
Vitol
Zambia No. 1, Oryx station, Lusaka (North entrance of the city), 27.08.2014
15ISO 20884
41.0ISO 22854
2.08ISO 22854
not tested Addax & Oryx Group
Zambia No. 2, Puma station, Kabwe (Independence Avenue on the left side of the road going North) 22.08.2014
28ISO 20884
34.5ISO 22854
2.24ISO 22854
not tested Trafigura
Zambia No. 3, Puma station, Lusaka (Cairo road, Protea hotel side) 27.08.2014
32,5ISO 20884
34.8ISO 22854
2.22ISO 22854
not tested Trafigura
OTHER20 NOT INVOLVING SWISS TRADERS
Togo, MRS station, Lomé (Kodjovia-kopé, near Hôtel Bellevue) 12.05.2015
425ASTM D2622
25.5EN 14517
1.50EN 14517
not tested MRS
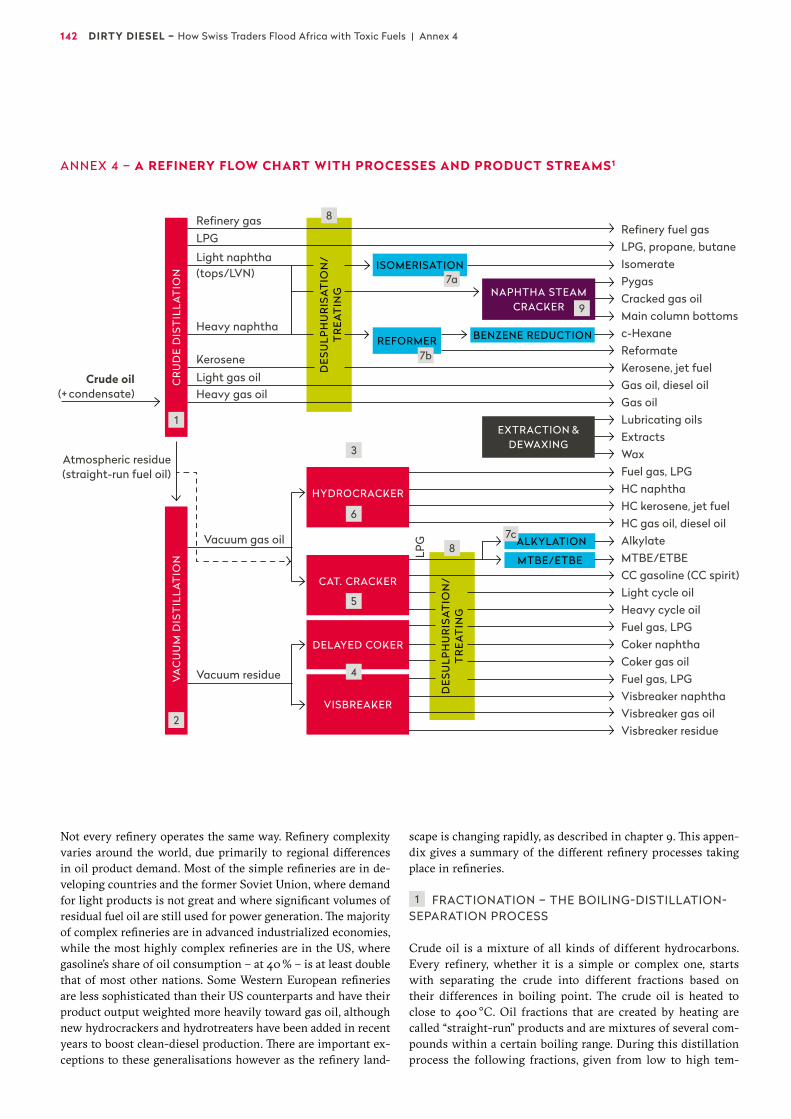
142 DIRTY DIESEL – How Swiss Traders Flood Africa with Toxic Fuels | Annex 4
Not every refinery operates the same way. Refinery complexity varies around the world, due primarily to regional differences in oil product demand. Most of the simple refineries are in de-veloping countries and the former Soviet Union, where demand for light products is not great and where significant volumes of residual fuel oil are still used for power generation. The majority of complex refineries are in advanced industrialized economies, while the most highly complex refineries are in the US, where gasoline’s share of oil consumption – at 40 % – is at least double that of most other nations. Some Western European refineries are less sophisticated than their US counterparts and have their product output weighted more heavily toward gas oil, although new hydrocrackers and hydrotreaters have been added in recent years to boost clean-diesel production. There are important ex-ceptions to these generalisations however as the refinery land-
scape is changing rapidly, as described in chapter 9. This appen-dix gives a summary of the different refinery processes taking place in refineries.
1 FRACTIONATION – THE BOILING-DISTILLATION- SEPARATION PROCESS
Crude oil is a mixture of all kinds of different hydrocarbons. Every refinery, whether it is a simple or complex one, starts with separating the crude into different fractions based on their differences in boiling point. The crude oil is heated to close to 400 °C. Oil fractions that are created by heating are called “straight-run” products and are mixtures of several com-pounds within a certain boiling range. During this distillation process the following fractions, given from low to high tem-
Refinery gasRefinery fuel gasLPG, propane, butaneIsomeratePygasCracked gas oilMain column bottomsc-HexaneReformateKerosene, jet fuelGas oil, diesel oilGas oilLubricating oilsExtractsWaxFuel gas, LPGHC naphthaHC kerosene, jet fuelHC gas oil, diesel oilAlkylateMTBE/ETBECC gasoline (CC spirit)Light cycle oilHeavy cycle oilFuel gas, LPGCoker naphthaCoker gas oilFuel gas, LPGVisbreaker naphthaVisbreaker gas oilVisbreaker residue
CR
UD
E D
IST
ILLA
TIO
N
DES
ULP
HU
RIS
ATIO
N/
TR
EAT
ING
VA
CU
UM
DIS
TIL
LAT
ION
DES
ULP
HU
RIS
ATIO
N/
TR
EAT
ING
Light naphtha(tops/LVN)
Heavy gas oilCrude oil
(+ condensate)
Atmospheric residue(straight-run fuel oil)
LPG
ISOMERISATION
Light gas oil
Heavy naphtha
Kerosene
REFORMER BENZENE REDUCTION
MTBE/ETBE
ALKYLATION
EXTRACTION &DEWAXING
NAPHTHA STEAM CRACKER
Vacuum gas oil
HYDROCRACKER
CAT. CRACKER
DELAYED COKER
VISBREAKER
Vacuum residue
1
7a
4
8
8
2
7b
5
6
9
3
7c
ANNEX 4 – A REFINERY FLOW CHART WITH PROCESSES AND PRODUCT STREAMS1
LPG

A Public Eye Investigation | September 2016 143
perature boiling ranges, are separated: refinery or fuel gas, LPG, light naphtha (also called light virgin naphtha), heavy naphtha, kerosene, light gasoil (also called “straight run” gas oil), heavy gasoil and atmospheric residue (also called bottoms or “straight run” fuel oil). These created oil fractions equal around 50 % of global crude oil barrels. Straight run light naphtha can be used as a cheap blendstock for gasoline: it is only half the price of gasoline.
2 VACUUM DISTILLATION
This refining technique is employed to process the atmospheric residue – the residual stream that was created during the prima-ry distillation process (when the oil was heated to 400 °C) but that did not evaporate. In vacuum distillation, hydrocarbons with boiling points between 400 and 600 °C evaporate. Products from the vacuum distillation are:– vacuum gasoil: around half which equals 25 % of global
crude oil barrels – vacuum residue: also around half which equals 25 % of
global crude oil barrels.
The vacuum residue, as its name implies, is heavier and more viscous than gas oil. It also ends up containing most of the orig-inal crude’s contaminating elements, including the bulk of the sulphur and the metals, since most other elements have been va-porized out. Of the vacuum residue – the heaviest of the heavy stuff – around 1 % (expressed as a percentage of global crude oil barrels) is used as asphalt, around 10 % as fuel for ships and pow-er plants, also referred to as residual heavy fuel oil (after vis-breaking cracking), and around 14 % is used for further cracking.
3 THREE TYPE OF CRACKING – CHOPPING BIG MOLECULES INTO SMALLER
Basically there are 3 types of cracking processes. The most ex-pensive method, hydrocracking, needs heat, a catalyst and hy-drogen gas. Hydrocracking technologies are fairly recent and only a small number of refineries in the world have invested in it with costs that can run up to a billion dollars (a small hydro-cracker unit with a capacity of 25,000 barrels per day (bpd) can cost as much as US $500 million: these capital costs do not yet include any additional operating costs, or any refinery down-time required during installation).
A second cracking technology uses heat and catalysts (so no hydrogen gas), and is called catalytic cracking. Many of the refin-eries have invested in these technologies which are cheaper than hydrocracking and cost around US$ 650 million. The third tech-nology is only using heat (and no catalyst and hydrogen gas) and is called thermal cracking. Thermal cracking is applied to the heaviest of the heaviest stream: the vacuum residue of which represents 25 % of global crude barrels. There are hundreds of dif-ferent thermal cracker technologies, each costing around 300 million dollars. Examples are visbreaking (for viscosity breaking) and delayed coking. Many refineries have a combination of crack-ing units, while the most complex refinery can have all three kinds of cracking technologies to make the refinery very flexible.
4 THERMAL CRACKING AND ITS COMPONENTS
Thermal crackers – the cheapest cracking technology, which is applied to the heaviest stream, the vacuum residue – operate in over 95 % of all refineries. (Thermal) visbreakers exist all over the world. Around two out of three refineries have one, espe-cially where refineries want to produce fuel oil for ships and power plants. Visbreaker residue is the most important blend-ing component for residual fuel oil. Visbreaking chops the vac-uum residue to smaller molecules, making it into a liquid that can be sold as fuel for ships. In markets with low demand for residual fuel oil (for power plants and ships) and a high demand for transportation fuels, a conversion can be attractive. It is pre-cisely because of this that the US has a lot of delayed cokers for the conversion of residue into light products such as naphtha/gasoline and gas oil. And some European refineries are consid-ering, or are in the process of replacing, their visbreaker units by delayed cokers as they see the market for residual fuel oil for ships declining. A delayed coker is cheap and costs around 300 million dollars. The disadvantage of delayed coking however is the production of high amounts of coke of poor quality with high sulphur and metal content. A solution to that is flexicok-ing, where after thermal cracking like in the delayed coker, transformation (by gasification) of cokes into fuel gas takes place. Worldwide only a few flexicokers are in use. They are very expensive, costing between 1 and 2 billion euros. The Esso re-finery in the Botlek-Rotterdam is an example.
Examples of gas oil blendstocks that are created with vis-breaking and coking are visbreaker gas oil and coker gas oil, which are very similar to the gas oil that is created with cata-lytic cracking (light cycle oil). As these blendstocks are created without hydrogen, they are olefinic and aromatic in nature. The ignition quality (cetane number) is poor – only between 25 – 30 – and the sulphur content is very high. For a calculation of how much sulphur ends up in the different blendstocks (as ratio to the total sulphur content in the crude oil), see Annex 5.
In order to make visbreaking and coker gas oil into a blend-stock for low sulphur diesel, desulphurisation and olefin satura-tion need to take place. Alternatively this blendstock can be used as a cracker feedstock, residual fuel oil component or as blendstock for African Quality diesel. The price of untreated visbreaking and coker gas oil is very low, because it is by the market price of residual fuel oil.
The naphtha components that are created with visbreaking and coking are called visbreaking and coker naphtha: they have an octane level of around 80. These streams are more similar to cat cracked spirit created at cat cracking, than to a straight run naphtha – although cat cracked spirit has a much higher octane level at around 90 – 95. As these three kinds of naphthas are cre-ated without hydrogen gas, they are gasoline blendstocks with a (very) high nitrogen and sulphur content if not desulphurised. As they are cheaply produced they could be seen as attractive blendstock for African gasoline. For a calculation of how much sulphur can end up in different blendstocks (as ratio to the total sulphur content in the crude oil) see Annex 5. For a thermally cracked naphtha the ratio is around 0.3, which means that the sulphur levels will be around a third of the sulphur level in the
144 DIRTY DIESEL – How Swiss Traders Flood Africa with Toxic Fuels | Annex 4
crude. So a sweet crude oil like the Nigerian Forcados with 2,000 ppm sulphur will create thermally cracked naphtha streams from around 600 ppm. A sour crude, like Souedie from Syria with 30,000 ppm sulphur, will create thermally cracked naphtha streams from around 9,000 ppm sulphur.
5 CAT CRACKING AND ITS PRODUCTS
Cat crackers do not run on the vacuum residue but on the vac-uum gasoil (VGO, that similar to vacuum residue, represents around 25 % of global oil barrels). VGO is a waxy stuff. There are two types of cat cracking process: the Fluid Catalytic Cracker (FCC) and the Residue Catalytic Cracker (RCC). The FCC is the traditional cat cracker. The RCC is a variant that has been mod-ified to use some atmospheric residues as a feed. Note that during cracking, coke, that deactivates the catalyst, is also formed. Metals in the feed will also deactivate the catalyst. That is why CC is typically used for vacuum gas oil and not vacuum residue. The catalyst used is aluminium and silicon oxide, a very fine powder.
The main purpose of a cat cracker is to produce more (high octane) gasoline products called CC spirit, CC gasoline or FCC gasoline. Cat crackers are very popular in areas with high gaso-line and low fuel oil demand like the US. They have also become more popular in Europe again, despite its big diesel market, to produce large amounts of propene for the chemical industry. The US as biggest consumer of gasoline globally (40 % of world con-sumption) has a crude distillation capacity of around 20 million bpd and an FCC capacity of 6.5 million bpd.
In comparison: – Western Europe has a 14.5 million bpd crude distillation capacity and a FCC capacity of only 2.1 million bpd; – Eastern Europe has 10.7 million bpd crude distillation and 0.8 FCC capacity;– Asia has 20.2 million bpd crude distillation capacity and 2.7 FCC capacity;– The Middle East has 6 million bpd crude distillation capacity
and 0.3 FCC. – Africa has 3.2 million bpd crude distillation capacity and 0.2 FCC capacity.2
The dark side of cat crackers is that it also produces low-qual-ity gasoil components and considerable amount of very dirty, high sulpherous cokes.
The cat cracker produces:Gas around 15 %3
CC spirit around 40–50 % (light and heavy) cat crack spirit: CC-spirit is slang for CC-gasoline. The amount equals to around 12 % of the crude barrel globally.LCO around 20–30 % light cycle oil (LCO or LCCCO is light cracked gas oil)HCO around 9 % heavy cycle oil or HCCCO (heavy cat cracked cycle oil)Cokes around 5%
Cat crackers also produce a very dirty stream called Slurry Oil/FCC Heavy Cycle Gas Oil/FCC residue. Around every 3 years before maintenance of the FCC unit, the aluminium and silicon from the catalysts is heavily concentrated in the Slurry Oil. After maintenance of this unit the refinery will put Slurry Oil on the market for a couple of months. As catalytic cracking is used globally (FCC very popular in US, Russia, but to be found everywhere), this Slurry Oil is also created worldwide. As the quality of this stream cannot be controlled, this stream could be qualified as waste. Usually however the stream gets blended into marine residual fuel oil.
6 HYDROCRACKING AND ITS COMPONENTS
Hydrocracking is the most expensive cracking method. Its ob-jective is to produce light and more valuable fractions. Instead of investing in cat crackers, that have become less popular be-cause of an oversupply of gasoline, since 1980 some European refineries have invested in hydrocracking. Slowly they have also appeared in other regions. For example the 116,000 bpd Oman Oil Refineries & Petroleum Industries refinery 230 km north-west of the capital of Oman recently completed installation of a hydrocracker.4
In hydrocracking processes heat, catalyst and hydrogen gas are used. Hydrocracking basically solves the problems of sul-phur and olefins. The first step before hydrocracking is desul-phurisation (see below) of the feedstock until content is at 10 ppm. It is a necessary step, as the sulphur would otherwise destroy the special catalyst that is used. This unit therefore pro-duces an almost sulphur-free product. Hydrocracking after desulphurisation is the second stage. The chopping of the big molecules is done under a hydrogen environment. The hydrogen prevents formation of olefins, solving the problem of oxidation and limited storage, and reducing the aromatic content. The quality of hydrocracked products – a hydrocracker produces gas, naphtha, kerosene and gas oil – is almost more similar to the quality of straight run products. They have a much higher qual-ity compared with the cat cracked or thermal cracked products. For example, the hydrocracker can produce high-quality jet fuel and gas oil which is not possible with a cat cracker. Hydrocrack-ers are operating on distillate feed (vacuum gas oil) because re-sidual feed (vacuum residue) would rapidly damage the catalyst. An exception is Shell’s Hycon unit in which vacuum residue is hydrocracked. The induced poisoning of the catalyst is compen-sated in the Hycon by on-stream refreshment of the catalyst.
7a 7b 7c CHEMICAL CONVERSIONS
Simple distillation does not produce products that can be di-rectly marketed as gasoline. Further processing and blending are required. In fact, most gasoline comes from processing the lighter naphtha. Light naphtha can be used as a cheap blend-stock for gasoline: it is only half the price of gasoline. But it can also be converted to higher octane isomerates. Isomerisation increases the octane number to 78–92. Another conversion process besides isomerisation employed to improve the octane number is called catalytic reforming. Reformates are one way
A Public Eye Investigation | September 2016 145
of solving the challenge to raise the octane level of naphthas. Other ways include: blending of butane; blending of alcohols like ethanol, additives like lead (historically), MTBE (used but controversial) or other additives like the controversial Methyl-cyclopentadienyl Manganese Tricarbonyl (MMT), which has been restricted in Europe to max 2 mg/l which implies in prac-tice that MMT is no longer used as an additive for European fuels.
In the catalytic reforming unit heavy naphtha is converted into light, medium and high reformate with a higher octane number. A refinery has to have such a unit if it wants to produce (high octane) gasoline. During the reforming process, hydrogen is created that refineries can use for desulphurisation. In the re-former, the octane number of the heavy naphtha is increased predominantly by the formation of aromatics which are un-healthy and therefore restricted in European gasoline. In refor-mate also benzene, toluene, xylene and ethyl benzene are pres-ent, all of them components with high octane numbers. As benzene is carcinogenic, the level of benzene is restricted to 1 % in European gasolines. Pure reformate however contains a much higher percentage. To use the reformate as a blendstock in Euro-pean gasolines, the benzene content needs to be reduced by sep-arating a benzene-rich fraction that can be sold to the chemical industry. Alternatively benzene can be converted to c-hexane in a “reverse reformer”. Reformate with reduced benzene content is also called “debenzenised reformate”. Modern reformers are able to produce high octane reformates with a low aromatic and benzene content.
A third chemical conversion process is alkylation that con-verts unsaturated LPG that is created during the cracking pro-cess to alkylates. Alkylates are very good and expensive blend-stocks: not only do they have a high octane number but they are also low in sulphur (less than 10 ppm) and are free of aromatics and olefins. Alkylates are an ideal gasoline component for “green” gasolines as the emission of polycyclic aromatic hydro-carbons (PAHs) decreases 90 % compared to a regular gasoline.
8 TREATING PROCESSES Another step in many, but not in all refineries, is purification of the fractions. This process removes sulphur compounds and other undesirable components. The higher the percentage of sulphur, the more processing will be required. Sulphur content may also be an indicator of a greater presence of trace metals like nickel and vanadium. This purification is done to meet the specifications of the final products (for example strict sulphur requirements in gasoline and diesel for the European market) or to prepare the intermediate products for the next process step in the refinery. For example if the refinery works with a hydro-cracker (a costly cracking technology) instead of a catalytic crack-er (a much cheaper cracking technology), it must first desulphu-rise the fractions.
In HydroDeSulpherisers (HDS), hydrotreaters or hydro-finishers, sulphur is removed from the oil products by means of a catalyst (a combination of cobalt and molybdenum) and a hy-drogen gas. The pure sulphur that is extracted can be used in the rubber or in the chemical industry.
9 NAPHTHA STEAM CRACKER
From the naphtha that is produced in refineries around 25 % is sold as feedstock for the petrochemical industry. Heavier naph-thenic naphtha is the preferred feedstock for reforming (to make a gasoline blendstock), while light paraffinic naphthas are typi-cally used as a feedstock for the petrochemical industry. Chem-ical plants run a thermal steam cracker to convert the naphtha into useful ethylene: a chemical building block to make all sorts of chemicals. Byproducts from the naphtha steam (thermal) cracker are: Pygas, Pyrolysis Gasoil and a residue (main Column Bottom – MCB – or Steam Cracked Residue). MCB could be qualified as a waste product because it is a residue whose qual-ity cannot be controlled. But in reality it is also used as a blend-stock for marine fuels. Pygas is in the gasoline boiling range and pyrolysis gasoil is in the gasoil boiling range. Pygas has a lower sulphur level compared to several other fuel blend components (200–300 ppm) but for European distillate fuels it is much too high. Pygas is a controversial product with an objectionable odour. It may be a risk to blend it into a gasoline in larger quan-tities as the high quantity of aromatics in combination with the very reactive, unstable (di)olefins renders the product unsuit-able. Another problem is the content of benzene (known to be carcinogenic). To use it as a blendstock for good quality fuels, the products should be desulphurised, the diolefins transformed into mono-olefins and benzenes be extracted. Pyrolysis gasoil has usually two applications: as a gas oil blending component and for the blending with marine diesel oil. The same is true for Pyrolysis gasoil: it is also a controversial product with an objec-tionable odour. And it may be risky to blend it into a gas oil in larger quantities because of the quantity of (poly)cyclic aromat-ics in combination with the very reactive, unstable diolefins. To use it as a blendstock for good quality fuels, the products should be desulphurised and diolefins transformed into mono-olefins. See Annex 2 for a description of cheap alternatives for desul-phurisation technology to reduce the mercaptan sulphur of products.
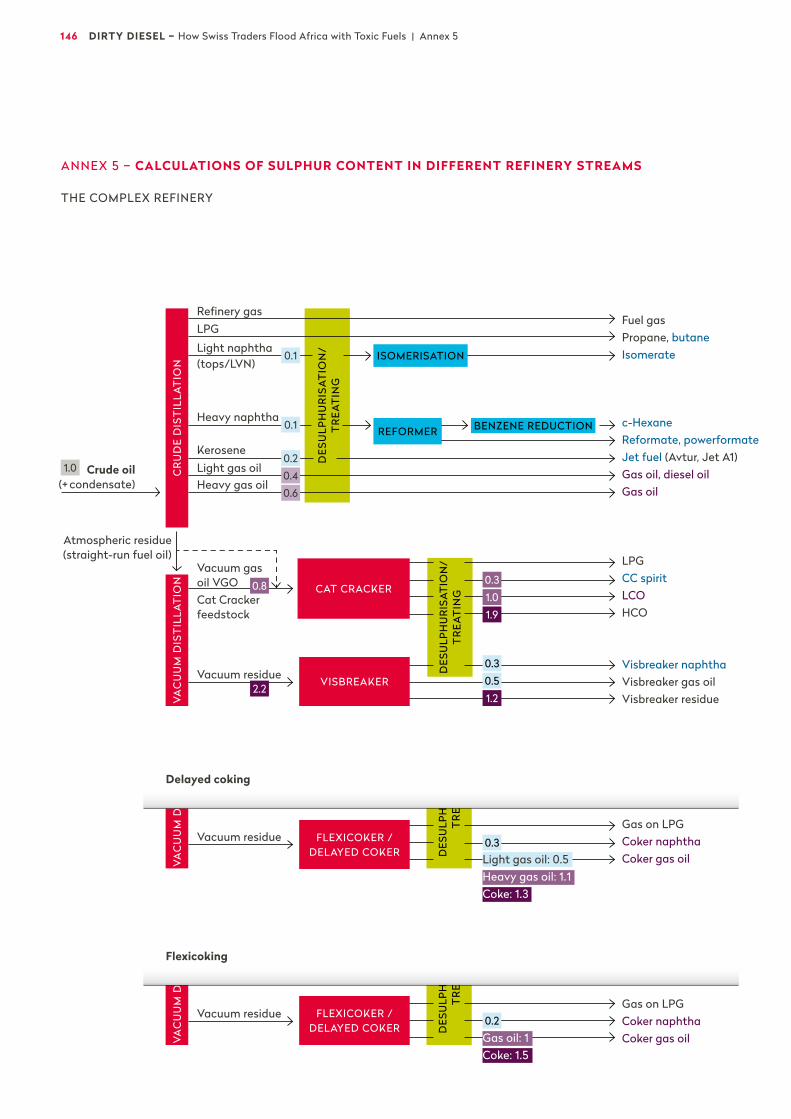
146 DIRTY DIESEL – How Swiss Traders Flood Africa with Toxic Fuels | Annex 5
DES
ULP
HU
TR
EA
Refinery gasFuel gasPropane, butaneIsomerate
c-HexaneReformate, powerformateJet fuel (Avtur, Jet A1)Gas oil, diesel oilGas oil
LPGCC spiritLCOHCO
Visbreaker naphthaVisbreaker gas oilVisbreaker residue
CR
UD
E D
IST
ILLA
TIO
N
DES
ULP
HU
RIS
ATIO
N/
TR
EAT
ING
VAC
UU
M D
IST
ILLA
TIO
NV
AC
UU
M D
DES
ULP
HU
RIS
ATIO
N/
TR
EAT
ING
Light naphtha(tops/LVN)
Heavy gas oilCrude oil
(+ condensate)
Atmospheric residue(straight-run fuel oil)
LPG
ISOMERISATION
Light gas oil
Heavy naphtha
Kerosene
REFORMER BENZENE REDUCTION
Vacuum gas oil VGOCat Cracker feedstock
CAT CRACKER
VISBREAKER
FLEXICOKER /DELAYED COKER
Vacuum residue
Vacuum residue
ANNEX 5 – CALCULATIONS OF SULPHUR CONTENT IN DIFFERENT REFINERY STREAMS
THE COMPLEX REFINERY
Delayed coking
Gas on LPGCoker naphthaCoker gas oil
DES
ULP
HU
TR
EA
VAC
UU
M D
FLEXICOKER /DELAYED COKER
Vacuum residue
Flexicoking
Gas on LPGCoker naphthaCoker gas oil
0.1
0.1
1.00.20.40.6
0.8 0.3
0.3
0.3
0.2
1.0
0.5
1.9
1.22.2
Light gas oil: 0.5 Heavy gas oil: 1.1Coke: 1.3
Gas oil: 1Coke: 1.5

A Public Eye Investigation | September 2016 147
Based on examples from existing literature1 of sulphur calcula-tions, we have calculated the ratios between the sulphur con-tent in a given crude (factor 1.0) and the respective refinery streams (before desulphurisation). This helps to gain a better understanding of where to look for the high sulphur streams. A factor of 0.5 means that the stream will have half the sulphur that was originally in the crude oil. For example if the crude oil had 10,000 ppm the visbreaker gas oil would have roughly 5,000 ppm. These figures are indicative only, but useful as a rule of thumb.
From this, we draw the following conclusions:
– Straight-run streams (the distillate streams after the first dis-tillation) are best, but are still highly sulphurous and need to be desulphurised in order to produce low sulphur gasoline and diesel. Only hydrocracking streams (not in the table) would not be equally or less sulphurous than straight run streams.
– The cracked material can have easily twice the sulphur con-tent of the sulphur in the crude oil (if not desulphurised after-wards).
– While the most important gas oil stream (straight run light gas oil) has about 40 percent of the original crude levels of sulphur, the most important gasoline stream (straight run light naphtha that often is converted into reformate) has about 10 percent.
Crude-Sulphur-Factors of different gas oil blendstocks
Crude-Sulphur-Factors of different gasoline blendstocks
Straight-run kerosene 0.2
Straight-run light gas oil 0.4
Delayed coker light gas oil 0.5
Visbreaking gas oil 0.5
Straight-run heavy gas oil 0.6
Cat cracker light cycle oil/ LCO 1.0
Flexicoker gas oil 1.0
Delayed coker heavy gas oil 1.1
Cat cracker heavy cycle oil/ HCO 1.9
Straight-run light naphtha 0.1
Straight-run heavy naphtha 0.1
Cat cracker spirit 0.3
Flexicoker naphtha 0.2
Visbreaking naphtha 0.3
Delayed Coker naphtha 0.3
148 DIRTY DIESEL – How Swiss Traders Flood Africa with Toxic Fuels | Endnotes
CHAPTER 1
1 Arku et al., (2008), “Characterizing air pollution in two low-income neighbourhoods in Accra, Ghana”, Science of the Total Environment, vol. 402, pp. 217–231.
2 UNEP Transport Unit Website.3 ICCT, (2011), “A ten-year retrospective”, p. 4.4 Office fédéral de l’environnement, (2010),
“Emissions polluantes du traffic routiers de 1990 à 2035”, p. 23.
5 See full interview with Jane Akumu p. 131.6 Berne Declaration, (2011), “Commodities:
Switzerland’s Most Dangerous Business”.7 Ghana Web, “Puma Energy to enter retail
market“, 1 March 2016.8 NZZ online, “Die Schweizer sollten stolz auf
Glencore sein”, 30 November 2011.9 Radio Télévision Suisse, Mise au point, 3 April
2011.10 Public Eye Website
CHAPTER 2
1 Free for download at the Public Eye website. 2 Verdict on Naeem Ahmed LJN (National Case
law Number): BN2149. District Court of Amsterdam, 13/846003-08 (PROMIS), para 8.3.1.6
3 According to an internal Trafigura memorand-um, dated 23rd September 2006: “Finished gasoline is a blend of different blendstocks coming from different refining processes to make specific gasoline specifications which are country specific. Refineries sell blendstocks with characteristics that allow blenders to produce these specifications. There are some streams of blendstocks that, due to the high mercaptans sulphur (“Mer-captans”) levels, need to be treated before they can economically be blended into gasoline. Mercaptans affect the odour of the gasoline in high concentration.” In an email dated 7th September 2006, Naeem Ahmed, a gasoline blender for Trafigura, reported the washing operations that had been carried out onboard the Probo Koala: “[…] We performed a full STS [ship-to-ship] operation to the Mt Probo Koala […]. Thereafter […] treated naphtha on board was used as a blendstock to make finished gasoline.“ Source: Court
verdict on Trafigura Beheer BV, 23.7 2010, LJN (National Case Law Number): BN2149, District Court of Amsterdam, 13-846003-06 (PROMIS), para 5.5
4 Amnesty International and Greenpeace (2012), “The Toxic Truth”, pp. 30–31, shows a map based on findings by the Dutch police and presented by the public prosecutor during the court hearings against Trafigura and others in the court of Amsterdam. “The Toxic Truth“ (accessed 16.9. 2015). See Annex 1 for the voyages of the six tankers that unloaded the washed naphtha from the Probo Koala.
5 A notable exception to the focus on the toxic waste is the 2008 Norwegian TV-documen-tary Dirty Cargo, which also concentrates on the gasoline produced.
6 Official reports variously record between 15 and 17 deaths caused by exposure to the Probo Koala toxic waste. An independent inquiry set up by Ivorian Prime Minster (International Commission of Inquiry on Toxic Waste, 19.2.2007, p. 2) records 15 deaths. A report by the Special Rapporteur on Toxic Waste, Okechukwu Ibeanu, “Report of the Special Rapporteur on the adverse effects of the movement and dumping of toxic and dangerous products and wastes on the enjoyment of human rights, 3.9.2009”, also cites 15 deaths. The Ivorian Ministry of Finance identifies 16 individuals as having died as a result of the toxic waste for the purposes of compensating their relatives. The Ivorian criminal court, Court of Appeal of Abidjan Ruling, No 42, Hearing of 19.3. 2008, 041, records 17 deaths.
7 Several institutes and studies have reported on the health effects. For a summary of the medical crisis, the studies and commonly reported effects on health, see pp. 51–67 of the report “The Toxic Truth” by Amnesty International and Greenpeace “The Toxic Truth“. See also Présidence de la république, COMMUNIQUE DU PORTE-PAROLE DE LA PRESIDENCE DE LA REPUBLIQUE RELATIF A L‘INDEMNISATION DES VICTIMES DES DECHETS TOXIQUES, 14.6.2007 “Déchets toxiques gouv ci“ (accessed 13.5.2016).
8 Amnesty International and Greenpeace (2012), “The Toxic Truth“ pp. 35–43 (accessed 8.11.2015), provides a summary of all the different attempts by Trafigura to dispose of
the waste both in Europe and in Africa, and of Trafigura’s refusal to dispose of the waste safely in the Netherlands because of the high costs involved.
9 “Disulphide sulphur derived from the extraction process is based on the difference between the total sulphur level and the non-extractable sulphur (approximately 6,000 ppm), taking into account an average total sulphur level of 8,000 ppm and an average mercaptan level of 2,000 ppm for the untreated naphtha.” Source: Annex 2 to Trafigura claim against BBC, Carter Ruck Reply 20 November 2009, p. 106 in the High Court of Justice, Queen’s Bench Division, Claim No: HQ09X02050
10 Internal Trafigura email dated 27 December 2005 from James McNicol to several colleagues (rec# 5893 Yao Essaie Mot-to & Others v Trafigura Limited and Trafigura Beheer BV in the High Court of Justice, Queen’s Bench Division, Claim No. HQ06X03370)
11 Internal Trafigura email dated 28 December 2005 from James McNicol to Naeem Ahmed (rec# 5914 Yao Essaie Motto & Others v Trafigura Limited and Trafigura Beheer BV in the High Court of Justice, Queen’s Bench Division, Claim No. HQ06X03370)
12 For a summary of all the different caustic washing operations on shore and at tankers, see pp. 11, 82 and 94 of the report “The Toxic Truth” by Amnesty International and Greenpeace “The Toxic Truth“ (accessed 10.11.2015)
13 Verdict on Naeem Ahmed LJN (National Case law Number): BN2149. District Court of Amsterdam, 13/846003-08 (PROMIS)
14 Internal Trafigura emails between Trafigura (Leon Christophilopoulos, Trafigura’s head of gasoline trading) to colleagues and Falcon Navigation 13 March 2006 (rec# 6580 Yao Essaie Motto & Others v Trafigura Limited and Trafigura Beheer BV in the High Court of Justice, Queen’s Bench Division, Claim No. HQ06X03370)
15 Internal Trafigura emails between Trafigura (Leon Christophilopoulos, Trafigura’s head of gasoline trading) and Falcon Navigation dated 10 and 13 March 2006 (rec# 6580 Yao Essaie Motto & Others v Trafigura Limited and Trafigura Beheer BV in the High Court of
Endnotes
A Public Eye Investigation | September 2016 149
Justice, Queen’s Bench Division, Claim No. HQ06X03370) According to information cited in Requisitoir in the court of appeal, Gerechtshof Amsterdam, submitted 17th November 2011 Falcon Navigation was an “exclusive broker from Trafigura” and considered by Trafigura as one of the “companies worldwide” (p. 18).
16 In March 2007 Jose Larocca was appointed as Trafigura’s Co-Head of Oil Trading. He is currently on the Board of Directors as Head of Oil Trading at Trafigura. He was copied in many of the emails sent at the time of the Probo Koala caustic washing.
17 Internal Trafigura email from a London based employee to colleagues including directors between Trafigura dated 28 December 2005 (rec# 7696 Yao Essaie Motto & Others v Trafigura Limited and Trafigura Beheer BV in the High Court of Justice, Queen’s Bench Division, Claim No. HQ06X03370)
18 Internal email between Trafigura and Falcon Navigation dated 21 June 2006 (rec#7400 in application notice for Claim No. HQ06X03370 and others for the High Court of Justice, Queen’s Bench Division)
19 Court verdict on Trafigura Beheer BV from 23 July 2010, LJN (National Case Law Number): BN2149, District Court of Amsterdam, 13-846003-06 (PROMIS), para 5.4.
20 To understand the difference between a Merox treatment and caustic washing, please see Annex 2.
21 Minton, Treharne & Davies Ltd “Minton report”, 14.9.2006, “Wikileaks Minton report” (accessed 13.5.2016)
22 Internal Trafigura email dated 27 December 2005 from James McNicol to Claude Dauphin (rec# 5914 Yao Essaie Motto & Others v Trafigura Limited and Trafigura Beheer BV in the High Court of Justice, Queen’s Bench Division, Claim No. HQ06X03370)
23 Based on the Minton report and an internal Trafigura document we conclude that the total sulphur still in the washed naphtha was between 608 and 680 tons – equalling between 7,156 and 8,000 ppm. The Minton report noted that “the process had achieved a 47 percent reduction of the mercaptans [in the sense of transforming into other sulphur components] and that some ended up in the aqueous waste phase and some in the oily product, but that the conversion rate was not known.“ An internal Trafigura memorandum dated 23rd September 2006 summarizes in paragraphs 1–3 how much coker naphtha was unloaded to the Probo Koala by three different vessels and the mercaptan sulphur content of it before and after the washings:
(1) 11 April 2006 M/T Seapurha: 28,829 mt, mercaptan sulphur level of 1,700 ppm and after washings 950 ppm. (2) 19 May 2006 M/T Moselle: 28,130 mt, mercaptan sulphur level of 2,014 ppm and after washings 950 ppm. (3) 18 June 2006 M/T Seavinha 28,284 mt, mercaptan sulphur level of 1,700 ppm and after washings 950 ppm.
We can make an even more precise estimati-on: Based on Trafigura’s reply to the BBC that gives a summary of the composition of the waste as estimated by the claimants in a group litigation case – and based on analysis of the Netherlands Forensic Institute – the total sulphur content of the waste dumped in Abidjan was around 66 tons. There must have been around 682 tons of total sulphur in the
85,243 ton of unwashed coker naphtha “taking into account an average total sulphur level of 8,000 ppm and an average mercaptan level of 2,000 ppm for the untreated naphtha”. That means the washed naphtha still contained 682 tons of sulphur minus 66 tons of sulphur to leave 616 tons of sulphur. Some 616 tons of sulphur in the total amount of 85,243 tons of washed coker naphtha means an equivalent of 7,226 ppm sulphur in the product. Annex 2 to Trafigura claim against BBC, Carter Ruck Reply 20 November 2009, pp. 105–107 in the High Court of Justice, Queen’s Bench Division, Claim No: HQ09X02050.
24 Greenpeace Netherlands translation of court verdict on Trafigura Beheer BV from 23 Decem-ber 2011, LJN (National Case Law Number): BU 9237, Court of Appeal, 23-003334-10, para 4.2.4
CHAPTER 3
1 Dieselnet Website, “Fuel Regulations European Union” (Accessed 15 May 2016).
2 Heavy Duty Diesel Initiative of the Climate and Clean Air Coalition, (2016), “Cleaning Up the Global On-Road Diesel Fleet: A Global Strategy to Introduce Low-Sulphur Fuels and Cleaner Diesel Vehicles”, draft, p. 17.
3 African Development Bank Website, “Urbanization in Africa”, 13 December 2012 (Accessed 6 October 2015).
4 Africa Progress Panel, (2015), “Power, People, Planet: Seizing Africa’s Energy And Climate Opportunities”
5 African Development Bank Website, “Urbanization in Africa”, 13 December 2012 (Accessed 6 October 2015); and United Nations, Department of Economic and Social Affairs, Population Division, (2014), “World Urbanization Prospects: The 2014 Revision”, p. 11.
6 E. Appoh, K.E. Anku, et al., (2016), “Sulphur content in fuels & Status of air quality implications in Ghana”, ECOWAS, p. 7.
7 International Transport Forum Website, (2014), “Four-wheeler ownership in 2010 and growth to 2050 by world region” (Accessed 4 January 2016).
8 PM10 are particulate matter of diameter less than or equal to 10 microns. Road dust adds to traffic-related PM10 concentration.
9 World Health Organisation, (2014), “WHO’s Ambient Air Pollution database”, p. 5.
10 Olajire A.A. et al., (2011), “Exposure to hazardous air pollutants along Oba Akran road, Lagos – Nigeria". Chemosphere. Vol. 84. pp. 1044–1051; and references in: WHO, (2016), “Ambient Air Pollution Database”.
11 UNEP Website, “Urban Air Pollution” (Accessed 6 October 2015).
12 T. Harrison-Prentice, UNEP, (2007), “Better Outdoor Air Quality in African Cities”
13 Arku et al., (2008), “Characterizing air pollution in two low-income neighbourhoods in Accra, Ghana”, Science of the Total Environment, vol. 402, pp. 217–231
14 Uwaegbulam and al., “Pollution threatens air quality”, The Guardian, 19 March 2015
15 Arku et al., (2008), “Characterizing air pollution in two low-income neighbourhoods in Accra, Ghana”, Science of the Total Environment, vol. 402, p. 229.
16 E. Appoh, K.E. Anku, et al., (2015), “Sulphur content in fuels & Status of air quality
implications in Ghana”, ECOWAS meeting, p. 8.
17 Essoh, (2013), “Shipping and Invasion of Second-Hand Vehicles in West African Ports: Analysing the Factors and Market Effects at the Port of Abidjan”, American Journal of Industrial and Business Management, pp. 209–221; and A. Roychowdhury, p. Chandola, (2015), “Framework for Clean Air Action Plan Learning From Each Other”, Centre for Science and Environment.
18 The estimated regional weighted average sulphur content is based on volumes of fuel corresponding to country specific legislated requirements, as well as expected market quality. Stratas Advisors cited in OPEC, (2014), “World Oil Outlook”, Table 5.4, p. 243.
19 Map computed from Stratas Advisors, February 2016.
20 S. Chambliss et al., (2013), “The Impact of Stringent Fuel and Vehicle Standards on Premature Mortality and Emissions”, ICCT’s Global Transportation Health and Climate Roadmap Series, pp. 1–11
21 N. Künzli, M.K. Joss, et al. (2015), “Global standards for global health in a globalized economy” International Journal of Public Health; See also The World Bank and Institute for Health Metrics and Evaluation, (2014), Transport for Health: The Global Burden of Disease from Motorized Road Transport. Seattle, WA: IHME, Washington, DC: The World Bank; as well as M. Brauer et al, (2012), “Exposure assessment for estimation of the global burden of disease attributable to outdoor air pollution”, Environmental Science Technology. 46 (2): pp. 652–660.
22 World Health Organisation Website, “Burden of disease from ambient and household air pollution” (Accessed 6 October 2015).
23 World Health Organisation Website, “Ambient (Outdoor) Air Quality and Health”, Factsheet No. 313, March 2014
24 International Agency for Research on Cancer (IARC), “Press Release: IARC Diesel Engine Exhaust Carcinogenic”, 12 June 2012.
25 K.O. Blumberg, M.P. Walsh et al., (2003), “Low-Sulphur Gasoline & Diesel: The Key to Lower Vehicle Emissions”, p. 17.
26 Heavy Duty Diesel Initiative of the Climate and Clean Air Coalition, (2016), “Cleaning Up the Global On-Road Diesel Fleet: A Global Strategy to Introduce Low-Sulphur Fuels and Cleaner Diesel Vehicles”, draft, p. 10
27 Heavy Duty Diesel Initiative of the Climate and Clean Air Coalition, (2016), “Cleaning Up the Global On-Road Diesel Fleet: A Global Strategy to Introduce Low-Sulphur Fuels and Cleaner Diesel Vehicles”, draft, p. 11.
28 World Health Organisation Website, “Ambient (Outdoor) Air Quality and Health”, Factsheet No. 313, March 2014.
29 Interview with Dr Reginald Quansah in Accra, 27 April 2015.
30 J. Akumu (UNEP), (2014), “Improving Air Quality in African Cities”.
31 Interview in the public clinic “Centre Communautaire de Santé de la Riviera (Cocody)” on May 22, 2015.
32 S. Chambliss et al., (2013), “The Impact of Stringent Fuel and Vehicle Standards on Premature Mortality and Emissions”, ICCT’s Global Transportation Health and Climate Roadmap Series, p. 41; and Heavy Duty Diesel Initiative of the Climate and Clean Air Coalition, (2016), “Cleaning Up the Global
150 DIRTY DIESEL – How Swiss Traders Flood Africa with Toxic Fuels | Endnotes
On-Road Diesel Fleet: A Global Strategy to Introduce Low-Sulphur Fuels and Cleaner Diesel Vehicles”, draft, p. 17.
33 Ibid, p. 40.34 SAPALDIA (Swiss Study on Air Pollution and
Lung Disease in Adults) is the only national population-based cohort study and biobank in Switzerland. Set up to study the effects of air pollution, it is also a platform for research on healthy aging. SAPALDIA is led by Prof. Nicole Probst-Hensch at the Swiss TPH in Basel, Switzerland.
35 WHO Website, “Global Burden of Disease study” (Accessed 22 February 2016).
36 Blumberg K.O., Walsh M.P., Pera C., (2003), “Low-Sulphur Gasoline & Diesel: The Key to Lower Vehicle Emissions”, The International Council on Clean Transportation (ICCT), p. 2.
37 Blumberg K.O., Walsh M.P., Pera C., (2003), “Low-Sulphur Gasoline & Diesel: The Key to Lower Vehicle Emissions”, United Nations Environment Program, p. 25 (Accessed 10 August 2016)
Jane Akumu, (2015), “West Africa Regional Low Sulphur Workshop”, p. 7 (Accessed 10 August 2016)
Jane Akumu, (2012), “Sulphur reduction process in Africa and global trend”, Cleaner public transport and low sulphur awareness program in Accra, Ghana, p. 14 (Accessed 10 August 2016)
38 UNEP (2015), “Reducing Black Carbon Can Save Lives and Help Combat Climate Change”; and UNEP Global Environment Facility (2015), “Black carbon mitigation and the role of the global environment facility”, A STAP Advisory Document, p. 21.
39 Albedo is the fraction of solar energy (shortwave radiation) reflected from the Earth back into space. It is a measure of the Earth’s surface. Source: Earth and Space Research (ESR) Website, “Glossary” (Accessed 23 February 2016).
40 Dr. Ramanathan, (2007), “Testimony for the Hearing on Black Carbon and Climate Change”, US House of Representatives Committee on Oversight and Government.
41 UNEP, (2015), “Global Environment Facility”, p. 33.
42 Climate and Clean Air Coalition (CCAC), (2015), “Reducing Black Carbon Emissions from Heavy-Duty Diesel Vehicles and Engines”.
43 UNEP, (2015), “Global Environment Facility”, p. 43.
44 Michael p. Walsh, (2009), “On and Off Road Policy Strategies”, ICCT, p. 11.
45 UNEP, (2015), “Global Environment Facility”, p. 43.
46 Michael p. Walsh, (2009), “On and Off Road Policy Strategies”, ICCT
47 World Health Organisation, (2012), “Health effects of Black Carbon”
48 Crude oils can be characterised according to the most prevalent type of hydrocarbon compound that they contain, such as: paraffins, naphthenes and aromatics. With the exception of aromatic crude oils, most crudes only contain a small percentage of aromatics.
49 Catalytic reforming is a refinery process to convert low octane naphtha to high octane naphtha (a blend stock for gasoline). See also Annex 4.
50 Platts Website. “Glossary” (Accessed 22 February 2016)
51 European Automobile Manufacturers Association (ACEA), (2013), “Worldwide Fuel Charter”, 5th edition, p. 50.
52 German Federal Environment Agency, (2012), “Polycyclic Aromatic Hydrocarbons – Harmful to the Environment! Toxic! Inevitable?”, p. 5.
53 Gong et al, (2003), “Polycyclic Aromatic Hydrocarbons and Diesel Particulates”, 26th Australasian Transport Research Forum, pp. 3–4; and WHO (2016), “List of Classifica-tions”, IARC Monographs on the Evaluation of Carcinogenic Risks to Humans, Volume 1–114.
54 German Federal Environment Agency, (2012), “Polycyclic Aromatic Hydrocarbons – Harmful to the Environment! Toxic! Inevitable?”, p. 9.
55 Tonne et al., (2004), “Predictors of personal polycyclic aromatic hydrocarbon exposures among pregnant women in New York City”. Environmental Health Perspectives, vol. 112, pp. 754–759.
56 European Automobile Manufacturers Association (ACEA), (2013), “Worldwide Fuel Charter”, 5th edition; and Concawe (2005), “Evaluation of automotive polycyclic aromatic hydrocarbon emissions”, Report No. 4/05.
57 EU Directive on the Quality of Petrol and Diesel Fuels (98/70/EC) amended by Directive 2003/17/EC.
58 EU Directive on the Quality of Petrol and Diesel Fuels (98/70/EC) amended by Directive 2009/30/EC.
59 Angola has restricted total aromatics in 2014 to a maximum 25 percent. The five East African countries that improved the sulphur standard in diesel in 2014 have also regulated polyaromatics to a maximum 11 percent. And finally South Africa has announced that when it shifts to low sulphur diesel, it will also introduce the European standard on polyaromatics, which is a maximum 8 percent. Source: Stratas Advisors, February 2016 and subsequent talks and email correspondence with Huiming Li, Stratas Advisors, in February and March 2016.
60 European Automobile Manufacturers Association (ACEA), (2013), “Worldwide Fuel Charter”, 5th edition, pp. 28–29.
61 Data from 2013 (based on 220 samples) suggests that the average aromatic content from samples taken from the major Western European countries is around 29 percent (Source: email correspondence in February, March and April 2016 with Heather Hamje, CONCAWE, Science Executive for Fuels Quality and Emissions). Concawe was established in 1963 by oil companies to carry out research on environmental issues relevant to the oil industry.
62 Angola introduced the European norm in 2014, including a maximum 35 percent of aromatics in “gasoline super 95” and levels to be reported to the respective government entity for “gasoline super 93”. South Africa also regulates aromatics but allows very high aromatic content of up to 50 percent. Remarkably the group of East African countries that reduced their sulphur limits in 2015 have not regulated aromatics in gasoline. Source: Stratas Advisors, February 2016 and subsequent talks and email correspondence with Huiming Li, Stratas Advisors, in February and March 2016.
63 European Agency for Safety and Health at Work Website, “Carcinogenic, mutagenic, reprotoxic” (Accessed 22 February 2016).
64 American Cancer Society Website, “Benzene and Cancer Risk” (Accessed 22 February 2016).
65 WHO, (2014), “Chemicals of Public Health Concern and their management in the African Region”, Regional Assesment Report, p. 5 and p. 26.
66 European Automobile Manufacturers Association (ACEA), (2013), “Worldwide Fuel Charter”, 5th edition, p. 29
67 Mozambique and Côte d’Ivoire are examples of countries which allow up to 5 percent benzene. However, in many countries, these limits do not exist (e.g. Benin, Mali, Senegal, Zambia). Other countries just require the level to be reported to the respective government entity (e.g. the Republic of the Congo for locally produced gasoline). Source: Stratas Advisors, February 2016.
68 Tonne et al., (2004), “Predictors of personal polycyclic aromatic hydrocarbon exposures among pregnant women in New York City”. Environmental Health Perspectives, vol. 112, pp. 754–759.
69 WHO, (2014), “Chemicals of Public Health Concern and their management in the African Region”, Regional Assessment Report, p. 5 and p. 27.
70 Ibid, p. 27.
CHAPTER 4
1 Javier Blas, “Commodity traders reap $250bn harvest”, Financial Times, 14 April 2013.
2 Mark Elliott, Chairman of CITAC Africa Llp, speaking at a conference in Marrakech, March 2012.
3 Chevron Website, (2008), “Press Release: Chevron sells fuels marketing business in Nigeria” (Accessed 19 May 2016).
4 See, for example, Roland Gribben, “BP sells African assets to Trafigura”, The Telegraph, 15 November 2010.
5 Marc Prosser, “Shell sells African businesses for $1bn”, Financial Times, 21. February 2011.
6 PFC Energy, (2012), “Service station networks in Africa since 2005: the end of the major’s era & the swap of marketing assets”.
7 Stéphane Graber, “Revenues, margins and misconceptions”, L’Agefi, 13 April 2015.
8 Dmitry Zhdannikov, Ron Bousso, (2013), “Top oil trader Vitol sees chance of steep oil price fall”, Reuters, 4 November 2013.
9 Steven Meersman, Roland Rechtsteiner, Graham Sharp, (2012), “The dawn of a new order in commodity trading”, Graham Sharp is a co-founder of Trafigura.
10 Puma International Financing SA, Preliminary Offering Memorandum, Dated January 17, 2014, p. 2.
11 Tom Bergin, Emma Farge, “Update 3 – BP sells Southern Africa fuel retail units”, Reuters, 15 November 2010.
12 Trafigura Website, (2015), “Trafigura’s annual results deliver a strong commercial and financial performance” (Accessed 19 May 2016).
13 Petroleum Intelligence Weekly, (2011), “Traders shake up African downstream”.
14 SARPD-Oil has a trading desk in Geneva, Switzerland.
15 Vitol Website, (2015), “Vitol 2015 key figures“, (Accessed 19 May 2016).
16 Ben Marlow, “Exclusive: Inside the commodity trader Vitol that pulls the levers of the global economy”, The Telegraph, 12 November 2015.
A Public Eye Investigation | September 2016 151
17 Vitol Website, (2015), “Vitol 2015 key figures“ (Accessed 19 May 2016).
18 Energy Intelligence Research, (2011), “Energy Fundamentals: Understanding the oil and gas industries”, p. 64.
19 Vitol Website, (2011), “Vitol, Helios and Shell reach agreement on African downstream businesses” (Accessed 19 May 2016).
20 Vitol Website, (2016), “Press Release regarding completion of Oando transaction: Oando concludes recapitalization and partial divestment of equity stake in its downstream operations to a consortium of Helios and Vitol" (Accessed 6 July 2016).
21 Jessica Jaganathan, “Trafigura places lowest bid for Mozambique’s oil products term”, Reuters, 16 December 2013 and Africa Intelligence, “Vitol on a roll”, 11 February 2014.
22 Beaudelaire Mieu, “En Côte d’Ivoire, Vivo Energy innove pour doubler Total”, Jeune Afrique, 29 March 2016.
23 Vivo Energy, (2013), Corporate Brochure. (Accessed 11 July 2016)
24 Greenpeace, Amnesty International, (2012), “The Toxic Truth. About a company called Trafigura, a ship named the Probo Koala and the dumping of toxic waste in Côte d’Ivoire”.
25 Jeune Afrique, “Sonatrach, Samir, MTN, Sonatel, Sonangol… découvrez le top 500 des entreprises africaines“, 21 April 2015.
26 Trafigura’s financial year starts on October 1st and ends on 30th of September.
27 Andy Hoffman, “Trafigura Founder Dauphin Exits as CEO for Medical Treatment”, Bloomberg, 24 March 2014.
28 Andy Hoffman, “Trafigura CEO to Make History at Swiss Commodities Summit”, Bloomberg, 17 April 2015.
29 SOURCES: market, independent consultant, respective government ministries, statistics institutes and company sources. | STATUS OF DATA: Angola [imports (7.16), storage (8.16), petrol stations (8.16)], Benin [sales (2013), storage (8.16), petrol stations (8.16)], Congo [imports (2015), sales (2012–2013), petrol stations (2012/7.16)], Côte d’Ivoire [sales (2015), storage (7.16), petrol stations (7.16)], Ghana [imports (2015), sales (2015), storage (7.16), petrol stations (8.16)], Mali [imports (7.16), storage (7.16), petrol stations (7.16)], Mozam-bique [imports (2014), storage (8.16), petrol stations (7.16)], Nigeria [imports (2013), sales (2015), storage (2015/7.16), petrol stations (2015/7.16)], Tanzania [imports (6.15), sales (6.15), storage (7.16), petrol stations (8.16)], Zambia [imports (2013), sales (2015), storage (7.16), petrol stations (7.16)], Zimbabwe [imports (2014), petrol stations (8.16)]. | DISCLAIMER: Even though Public Eye has thoroughly researched best available data to do this figure, Public Eye can’t guarantee the accuracy of those figures (respective government ministries, statistics institutes or company websites may not be constantly updated). Datas change constantly.
30 Trafigura Website, “Metals and Minerals” (Accessed 19 May 2016).
31 Puma Energy, (2015), “Corporate Brochure: Fuelling Success”; and Puma Energy Website, “Mozambique” (Accessed 19 May 2016); and Petromoc Website, 2013, “Relatorio e Contas 2013” (Accessed 2 December 2014).
32 Trafigura Group Pte Ltd, (2015), “2015 Annual Report”.
33 Puma Energy Website, “Leadership team”, (Accessed 19 May 2016).
34 Christopher Helman, “Trouble is my business”, Forbes, 5 October 2007.
35 Bobby Yip, “China’s Sinopec to buy Addax for C$8.27 billion”, Reuters, 24 June 2009.
36 Oryx Website, “Mali” (Accessed 19 May 2016).37 Asked about this barge, Gunvor stated:
“Market conditions have changed, and we no longer have this storage.”
38 In our thorough research on oil sales by African national oil companies in 2011–2013, we found that Lynx was buying crude from Congo. Source: Berne Declaration, Swissaid, Natural Resource Governance Institute, (2014), “Big Spenders”.
39 Lynx Energy Website, “X-Oil Congo”, (Accessed 19 May 2016).
40 England and Wales High Court (Commercial Court) Decisions, (2015), “Sarpd Oil Internatio-nal Limited and Addax Energy SA and Glencore Energy Uk Limited”.
41 Christophe Le Bec, “Ces traders africains qui comptent”, Jeune Afrique, 11 May 2015.
42 CITAC Africa Ltd, “sub-Saharan Africa Oil Market Report”, July and November 2014.
CHAPTER 5
1 Berne Declaration, Swissaid, the Natural Resource Governance Institute, (2014), “Big Spenders. Swiss trading companies, African oil and the risks of opacity”.
2 Kerry Dolan, “How Forbes’ estimate of Isabel Dos Santos’ fortune grew from $ 500 m to $ 3 bn in less than a year”, Forbes, 16 September 2013.
3 CIA Website, World Factbook, (Accessed 18 May 2016).
4 Puma doesn’t just run petrol stations in the country, it also owns storage facilities and three terminals. As its website says, in April 2015, Puma also opened “one of the world’s largest conventional buoy mooring systems (CBM) in Luanda Bay. The fuel-loading buoy anchored offshore serves as a strategic mooring point for Africa and will allow a wide range of carriers to berth while loading or offloading oil product.” A further 6,000 km of roads have been built using bitumen supplied by the company.
5 Preliminary Offering Memorandum, (2014), “Puma International Financing SA”.
6 This law defines an act of corruption as the receiving of economic advantage as commission, percentage, gratification or gift, in a direct or indirect form, among other acts, from a party that might have an interest that might be the subject of or seeks to benefit from an action arising from the duties of a public servant. Definition in English taken from Rafael Marques de Morais, “Trafigura and the Angolan presidential mafia”, Maka Angola, 5 January 2013.
7 Berne Declaration, (2013), “Trafigura’s business in Angola“.
8 Claude Dauphin stepped down as CEO of Trafigura in March 2014. He remained the main shareholder until he died in September 2015. According to Reuters, just a few months before Dauphin passed away, Trafigura reached an agreement with Luanda “to maintain its status as the main supplier of refined products, despite fierce competition”. Dmitry Zhdannikov, “Update1- With days numbered, Dauphin focused on Trafigura transition”, Reuters, 2 October 2015.
9 Angola’s refinery is roughly capable of supplying one third of domestic demand.
10 Puma International Financing SA, (2014), “Preliminary Offering Memorandum", p. 174
11 Michael Weiss, “The 750 million dollar man“, Foreign Policy, 12 February 2014.
12 The country previously had a refinery, but not anymore.
13 Oryx Energies Website, “Sierra Leone” (Accessed 18 May 2016).
14 Tank Storage Magazine, “A one way street”, Volume 11, Issue 4, 22 July 2015.
15 CITAC Africa Ltd, (2014), sub-Saharan Africa Oil Market Report, May Issue, p. 31.
16 Oryx Energies Website, “Press Release 24.4.14: “Oryx Energies state-of-the art petroleum jetty in Sierra Leone” (Accessed 18 May 2016).
17 Res Gehriger, “Addax Bionergy : Schweizer Bioprojekt in Schieflage”, SRF, 21 March 2016.
18 Bloomberg Business Website, “Executive Profile: Vincent Kanu” (Accessed 18 May 2016).
19 Switzerland’s Commercial Registry Zefix, “Addax Bioenergy SA”.
20 Umaru Fofana, Gemma Ware, “Sierra Leone: People to Watch – Politicians and influential tycoons”, The Africa Report, 24 October 2012.
21 Some sources claimed Mr. Kanu was a Minister of Petroleum, though we were unable to verify this. Bread for All, (2014), “Annual monitoring report on the operations of Addax Bioenergy by Sierra Leone network on the fight to food”.
23 The Patriotic Vanguard, “President Koroma signs Vincent Kanu book of condolence”, 5 February 2016.
23 NP Limited Website, “About us” (Accessed 13 October 2015).
24 Bread for All (2014), “Annual monitoring report on the operations of Addax Bioenergy by Sierra Leone network on the fight to food”.
25 The National Democratic Institute, (2008), “A directory of the Parliament of Sierra Leone, 2007–2012” (Accessed 19 May 2016).
26 Sierra Express Media, (2010), “Down with Addax’s $200M Investment”, 3 March 2010.
27 Berne Declaration, (2015), “Philia’s refined ventures in Brazzaville”.
28 PWYP Congo, Press release, 4 August 2015.29 Congo Economie: Le journal d’Unicongo,
“Dossier pétrole: une ressource d’exception”, p. 33, January 2014.
30 The SNPC is responsible for imports. Sclog then buys and sells on to retailers.
31 Africa Energy Intelligence, “Les barons du transport”, 23 July 2002.
32 High Court of Hong Kong Special Administra-tive Region, Court of First Instance, (2006), “Miscellaneous Proceedings NO. 2696”.
33 Global Witness, (2005), “The Riddle of the Sphynx. Where has Congo’s oil money gone?”
34 Christophe Le Bec, “Ces traders africains qui comptent“, Jeune Afrique, 11 May 2015.
35 England and Wales High Court (Commercial Court) Decisions, (2015), “Sarpd Oil Internatio-nal Limited and Addax Energy SA and Glencore Energy Uk Limited”.
36 Marcus Leroux, “Glencore’s Congo oil deal questioned”, The Times, 2 November 2015.
37 Verbal testimony from l’Office Central pour la Répression de la Grande Délinquance Financière on 19.06.2013 regarding the “volet Sassou Nguesso”.
38 Stolen Asset Recovery Initiative, (2005), “Africa Oil and Gas SAU (AOGC)”.
152 DIRTY DIESEL – How Swiss Traders Flood Africa with Toxic Fuels | Endnotes
39 AOGC Website. (Accessed 19 May 2016). 40 Lynx Energy Website, “X-Oil Congo” (Accessed
19 May 2016). 41 Lynx Energy Website, “Donatien Mpika”,
(Accessed 19 May 2016). 42 Congopage, “Ceux qui croyaient aux
promesses de Christel se sont faits avoir“, 2 April 2009.
43 Mediapart, “Biens mal acquis: rivières de diamants et valise de cash à Neuilly”, 10 February 2015.
44 Preliminary Offering Memorandum, (2014), “Puma International Financing SA” .
45 RFI, “Femmes noires : un congrès pour s’affirmer“, MFI Hebdo, 16 April 2008.
46 Nice Matin, “Le fastueux anniversaire de la femme du chef de l’Etat du Congo à Saint-Tropez” 12 May 2013.
47 Canal +, (2013) “Le petit journal: 70 ans de Madame Sassou“.
48 President Sassou Nguesso has ruled Congo since 1979, minus the brief democratic interlude of Pascal Lissouba’s term from 1992 to 1997. See: Fondation Congo Assistance Website, “Social: Culture de Paix et de Solidarité” (Accessed 19 May 2016)
49 Agathe Duparc, “L’affaire Gunvor ou l’anatomie d’un scandale pétrolier russo-con-golais”, Le Monde, 6 March 2013.
50 President Nguesso was the stepfather of the former Gabonese president, Omar Bongo. On BGFI, see: Berne Declaration, (2015), “Philia’s refined ventures in Brazzaville” (Accessed 19 May 2015)
51 Fondation Congo Assistance Website, “Bureau et conseil d’administration” (Accessed 19 May 2016)
52 Stéphane Graber, (2013), “Reassessing the merchant’s role in a globalized economy”, International Development Policy: Revue Internationale de Politique de Développement, pp. 153–193.
53 Nevers Mumba et al., “Open letter to the international donor community to the Republic of Zambia”, 6 June 2012.
54 CITAC Africa Ltd, “sub-Saharan Africa Oil Market Report”, April 2014, p. 26
55 Simon Goodley, Mark Hollingsworth, “Zambian minister under investigation over Trafigura contract”, The Guardian, 3 December 2012.
56 BBC, “Zambia’s President Michael Sata sacks Wynter Kabimba” 28 August 2014.
57 David Leigh, “Inside Trafigura: accusations, sour deals and friends in high places”, The Guardian, 16 September 2009.
58 An open letter to “the donor community” written by opposition party MMD, says: “Rajan Mahtani’s financial support to Sata’s cam -
paign was first acknowledged in a newspaper advertisement following the 2008 elections, in which Sata thanked his financiers for all their generous support.” Nevers Mumba et al., “Open letter to the international donor community to the Republic of Zambia”, 6 June 2012.
59 George Mweny, “Police arrest Mahtani on forgery charges”, Zambia Reports, 2 February 2015.
60 Email from Trafigura of the 12th November 2015.
61 Zambian Watchdog, “State House officials block probe of Dalbit Petroleum for overchar-ging Zambia with $103 million”, 8 June 2015.
62 Daily Nation, “Trafigura in oil scandal again!” 30 April 2015.
63 Ibid.64 Richard Sakala, “Word for word: what
Trafigura told Daily Nation newspaper”, Zambian Watchdog, 2 May 2015.
65 Daily Nation, “Trafigura oil deal in court“, 23 January 2016.
66 Email from Trafigura of the 25th January 2016.67 Sakunda Holdings is composed of three
divisions: Energy, Trading and Logistics. See: Sakunda Holdings Website, “About us” (Acces-sed 19 May 2016).
68 Zuva Petroleum Website, “Home Page” (Accessed 19 May 2016).
69 Africa Confidential, “Glencore and the fuel firms“, Vol 54, Number 21, 18 October 2013.
70 Ibid.71 Africa Confidential, “Trafigura takes over
Sakunda”, Vol. 55, Number 10, 16 May 2014.72 Preliminary Offering Memorandum, (2014),
Puma International Financing SA.73 Kayode Akinkugbe, “Insights into M&A
activities in Sub-Saharan Africa”, FBN Capital, 25 November 2014.
74 Zimbabwe Situation, “ZANU PF entrenched by “exploitative” Trafigura deal”, 27 May 2014.
75 Infrastructure Development Bank of Zimbabwe, “Directorate” (Accessed 19 May 2016). See also: Peter Burkhardt, “Trafigura geschäftet mit Mugabe-Regime”, Schweiz am Sonntag, 17 May 2014.
76 Nigeria Electricity Hub, “Zimbabwe : Govt awards Sakunda 200mw tender”, 7 January 2016.
CHAPTER 6
1 Angola is the country in the world that suffers from the highest loss in the Inequality- adjusted Human Development Index (IHDI) of the United Nations Development Programme
2 London-based African downstream consultant CITAC reckons Angolan fuel prices are the second cheapest in sub-Saharan Africa, after Nigeria, where fuels are also massively subsidised. CITAC, “Angola Country Overview”, December 2013 (report commissi-oned by Public Eye).
3 CITAC claims 74 % of diesel consumption is imported.
4 www.pumaenergy.com/en/regions/africa/angola; accessed 27.04.2016. Puma is the second biggest retail company, after Sonangol and before Sonangalp, a joint- venture between Sonangol and Portuguese Galp Energia, in which Isabel Dos Santos, the daughter of Angola’s president, has shares. On Galp, see: Forbes, “How Forbes’ estimate of Isabel Dos Santos’ fortune grew from $500m to $3b in less than a year”, 16.09.2013 (accessed 29.09.2015).
5 Four out of those 47 samples we unfortuna-tely could not take ourselves, but we received analysis data from a credible third party in confidence. Because we are of the opinion that it is important that also the population of this country knows about the quality of the fuels they buy, we decided to publish them.
6 Puma Energy, Offering Memorandum, 3 February 2014, p. 123
7 For the Puma Energy statement, see the Public Eye website.
8 Puma Energy answers to our questions. Public Eye Website.
9 In Mozambique we also sampled a diesel fuel sold by Petromoc. Petromoc is the state
owned downstream company of Mozambique, (in a joint venture with Puma to build storage capacity together). Petromoc was supplied by Vitol during the time of sampling (April 2014) but this evidence is not enough. In Togo, we sampled fuels sold by MRS, also possibly supplied by Vitol. For the same reason as for Mozambique, we left this sample aside.
10 ISO (International Standards Organization) and ASTM (American Society of Testing and Materials) are international standard setting bodies. In the industry test methods like the ISO 20884, ASTM D 4294 and ASTM D 2622 are applied for determining sulfur by wavelength dispersive X-ray fluorescence spectrometry in fuels. Test methods like the ISO 20846 and ASTM D 5453 – specifying an ultraviolet (UV) fluorescence test method are usually applied for the determination of sulphur in ultra-low sulphur fuels with sulphur levels below 10 ppm.
11 Laboratory supervisor of a petrochemical lab in the Netherlands who wishes to remain anonymous. For the purpose of our investiga-tions we conducted several talks in 2014, 2015 and 2016 with two laboratory supervisors of a petrochemical laboratory in the Netherlands.
12 Data from 2014 (based on 125 samples) suggests that the average sulphur content from diesel samples taken from the major Western European countries is 6 ppm. Source: email correspondence in February, March and April 2016 with Heather Hamje, CONCAWE, Science Executive for Fuels Quality and Emissions. Also, a survey of a number of diesel fuels sold in Germany in 2013 shows that the mean value of sulphur was 5.9 and varied between 5.9 and 7.8 ppm in the years 2009 – 2013. (Source SGS, Worldwide diesel survey – winter 2012/2013 Germany)
13 Diesel spec from 2004. Sulphur max 1,500 ppm in new spec: Decreto Executivo No. 288/14 in effect September 2014.
14 Arrêté Année 2012 No 002 / MERPMEDER /DC/ SGM/CTJ/DGHCF/SA gasoil, in effect Jan 2013.
15 Decree No. 2013 – 394 gas oil, in effect July 2013.
16 Decree 2013–220, Automotive gasoil, in effect in Jan 2014.
17 GS 141: 2013 Diesel Fuel (-gasoil), in effect in Jan 2014.
18 Arrêté Ministériel 1565 Automotive diesel, in effect, May 1990.
19 NS-09-048 Diesel oil, on-road, in effect May 2011.
20 ZS 369: 2010 Automotive Gasoil (Diesel Fuel), in effect Feb 2010.
21 ZS 718:2010 Low Sulfur Gasoil (LSGO), in effect Feb 2010.
22 German Federal Environment Agency, (2012), “Polycyclic Aromatic Hydrocarbons – Harmful to the Environment! Toxic! Inevitable?”, p. 5 (accessed 22 February 2016)
23 The other test method focused on a small group of polyaromatics present in diesel. It was not aimed at determining the total content of all polyaromatics present. This is a very interesting method which provides deeper insights into the toxicity of the diesel fuel, but we decided to continue with the industry’s more common (and cheaper) test methods, then compare those findings with the European limit (max 8 %m) and with each other.
A Public Eye Investigation | September 2016 153
24 Laboratory supervisor of a petrochemical lab in the Netherlands who wishes to remain anonymous. For the purpose of our investiga-tions we conducted several talks in 2014, 2015 and 2016 with two laboratory supervisors of a petrochemical laboratory in the Netherlands.
25 Decreto Executivo No. 288/14 sets a maximum of 25 % m in diesel, in effect in September 2014.
26 European Automobile Manufacturers Association (ACEA), (2013), “Worldwide Fuel Charter”, 5th edition, p. 50
27 Laboratory supervisor of a petrochemical lab in the Netherlands who wishes to remain anonymous. For the purpose of our investiga-tions we conducted several talks in 2014, 2015 and 2016 with two laboratory supervisors of a petrochemical laboratory in the Netherlands. And Ton Visser, blending expert from a specialized training company in the field of oil products. For the purpose of our investiga-tions we had several talks to him and subsequent email correspondence in 2014, 2015 and 2016.
28 A survey of a number of diesel fuels sold in Germany in 2013 shows that the mean value of polyaromatics was 2.73 % m in 2013 and varied between around 2.5 and 3.3 % m in the years 2009 till 2013. (Source: SGS, Worldwide diesel survey – winter 2012/2013 Germany).
29 Data from 2014 (based on 125 samples) suggests that the worldwide average PAH level in diesel is around 3.7 % m. Source: email correspondence in February, March and April 2016 with Heather Hamje, CONCAWE, Science Executive for Fuels Quality and Emissions. CONCAWE is an institute established in 1963 by oil companies to carry out research on environmental issues relevant to the oil industry,
30 Source: email correspondence in February, March and April 2016 with Heather Hamje, CONCAWE, Science Executive for Fuels Quality and Emissions
31 A survey of a number of diesel fuels sold in Germany in 2013 found that the average total aromatic content was 24.39 %m. (Source: SGS, Worldwide diesel survey – winter 2012/2013 Germany).
32 Invidual gasoline blendstocks can have up to thousands of ppm sulphur. See chapter 10.
33 Data from 2013 (based on 220 samples) suggests that the average sulphur content from gasoline samples taken from the major Western European countries is 7 ppm. (Source: email correspondence in February and March 2016 with Heather Hamje, CONCAWE, Science Executive for Fuels Quality and Emissions).
34 Benin has a sulphur standard of 3,500 ppm, similar to diesel. Arrete Anne 2012 No 002 / MERPMEDER /DC / SGM / CTJ / DGHCF / SA, in effect Jan 2013.
35 EnSys study for ICCT, 27.2.2015, EnSys ICCT Refinery Transport Fuels Baseline Analysis Study, EnSys Energy. Some refineries in West-Africa – even if they are not well equipped to desulphurise all of their petroleum products like gasoline and diesel, are able to create low sulphur gasoline. A good example is the SIR refinery in Abidjan, Côte d’Ivoire. SIR has limited desulphurisation capacity that is used to produce a low sulphur gasoline of 42 ppm average. Hydrogen is needed for the desulphurisation process. Hydrogen is produced from SIR’s reformer. This is enough for the desulpherisation of
gasoline but for the desulphurisation of gasoil a lot more hydrogen is needed, for which SIR needs to build a hydrogen plant. Also during the desulphurisation process dangerous hydrogen sulphide (H2S) is created. For the gasoline desulphurisation SIR can cope but for the desulphurisation of their straight run diesel streams SIR will need to build a H2S remover unit. Based on information acquired during a visit to the SIR refinery in Abidjan at 21.05.2015.
36 Gasoline spec at the time of sampling was from 2008. New spec 500 ppm for Gasolina Super 93 and Gasolina Super 95: Decreto Executivo No. 288/14 published in Diario da Republica – No. 178, in effect since September 2014.
37 Decree No. 2013 – 394 locally produced and imported gasoline, in effect July 2013.
38 Decree 2013-220 for Super Unleaded 91, in effect January 2014.
39 GS 140: 2013, in effect January 2014.40 Arrêté Ministériel 06-2940 for Unleaded Super
RON 91, in effect December 2006.41 NS 09-046 for Regular Gasoline and NS
09-047 for Super Gasoline, in effect May 2011.42 ZS 395: 2007 for RON 91, in effect since
January 2007.43 Laboratory supervisor of a petrochemical lab
in the Netherlands who wishes to remain anonymous. For the purpose of our investiga-tions we conducted several talks in 2014, 2015 and 2016 with two laboratory supervisors of a petrochemical laboratory in the Netherlands.
44 Data from 2013 (based on 220 samples) suggests that the average aromatic content from gasoline samples taken from the major Western European countries is around 29 %. (Source: email correspondence in February, March and April 2016 with Heather Hamje, CONCAWE, Science Executive for Fuels Quality and Emissions)
Data from a study carried out by Toyota from summer 2015 (~60 samples) from Lithuania, UK, Italy, Germany, Spain, France, Nether-lands, Poland, Sweden and Finland suggest that the average content of aromatics is 31 % vol. (Source: email correspondence with Dorothée Lahaussois Manager Energy Research Group, Fuels & Energy, Toyota Motor Europe in March 2016). A survey of a number of gasoline fuels sold in Germany shows that the mean value of aromatics was 27.91 % vol in 2013 and varied between around 25.8 and 30.6 % in the years 2009 till 2013. (Source: SGS, Worldwide gasoline survey – winter 2012/2013 Germany). The different surveys indicate that the levels are in the same ballpark. For comparison with our samples we have used the figures of the biggest survey provided by CONCAWE.
45 Data from 2013 (based on 220 samples) suggests that the average benzene content from gasoline samples taken from the major Western European countries is around 0.6 %. (Source: email correspondence in February and March 2016 with Heather Hamje, CONCAWE, Science Executive for Fuels Quality and Emissions)
Data from a study carried out by Toyota from summer 2015 (~60 samples) from Lithuania, UK, Italy, Germany, Spain, France, Nether-lands, Poland, Sweden and Finland suggest that the average content of benzene is 0.8 % vol. (Source: email correspondence with Dorothée Lahaussois Manager Energy
Research Group, Fuels & Energy, Toyota Motor Europe in March 2016). A survey of a number of gasoline fuels sold in Germany shows that the mean value of benzene was 0.715 % vol in 2013. (Source: SGS, Worldwide gasoline survey – winter 2012/2013 Germany). The different surveys indicate that the levels are in the same ballpark. For comparison with our samples we have used the figures of the biggest survey provided by CONCAWE.
46 Benzene was not regulated under the standards (from 2008) that were in place during the time of sampling. The new legal standard for Gasoline Super 95 that came into effect in September 2014 (Decreto Executivo No. 288/14) introduced the European standard of max 1 %v. The standard for Gasoline Super 93 that also came into effect regulates the benzene content to be max 3 % v (Decreto Executivo No. 288/14).
47 This is a very unusual, and may have been a mistake of the regulators as it means basically that imported gasoline can not contain any benzene but laboratories often use a detection limit of 100 ppm for benzene which is already a factor 100 higher then the legal limit of the Zambian import spec.
48 Decree No. 2013 – 394 locally produced and imported gasoline, in effect July 2013.
49 Decree 2013-220 for Super Unleaded 91, in effect January 2014.
50 GS 140: 2013, in effect January 2014.51 Arrêté Ministériel 06-2940 for Unleaded Super
RON 91, in effect December 2006.52 NS 09-046 for Regular Gasoline and NS
09-047 for Super Gasoline, in effect May 2011.53 ZS 395: 2007 for RON 91, in effect since
January 2007.54 Laboratory supervisor of a petrochemical lab
in the Netherlands who wishes to remain anonymous. For the purpose of our investiga-tions we conducted several talks in 2014, 2015 and 2016 with two laboratory supervisors of a petrochemical laboratory in the Netherlands.
55 Interview with Dorothée Lahaussois, manager of fuels and energy for Toyota, in Brussels, 07.05.2014. European standards reflect the concerns from the car industry with respect to metals and discourages the addition and presence of metals in fuel. They require that pump marking should make clear whenever diesels and gasoline contain metallic additives. “Labelling shall be clearly visible, easily legible and displayed at any point where diesel/unleaded gasoline with metallic additives is made available to consumers. The label shall contain: ‘Contains metallic additives’.” Source: European specification: Automotive fuels – Unleaded petrol – Require-ments and test methods EN 228:2012 (article 4) and European specification: Automotive fuels – Diesel – Requirements and test methods EN 590:2013 (article 4).
In addition there are specifications for two metals: phosphorus (compounds containing phosphorus shall not be added to unleaded petrol) and manganese. Source: European specification: Automotive fuels – Unleaded petrol – Requirements and test methods EN 228:2012 (article 5.3.2 5.3.3) and European specification: Automotive fuels – Diesel – Requirements and test methods EN 590:2013 (article 5.2.2)
56 European Automobile Manufacturers Association (ACEA), (2013), “Worldwide Fuel Charter”, 5th edition, p. 22–26. It also states
154 DIRTY DIESEL – How Swiss Traders Flood Africa with Toxic Fuels | Endnotes
that no detectable levels of phosphorus, silicon and chlorine should exist in gasoline or be used as components of any fuel additive package intended to improve gasoline and engine performance. Pp. 22–26. With regard to diesel it states: “Contami-nants, including some from additives, whether intentionally or inadvertently added during fuel production or distribution, also can cause significant harm to the powertrain, fuel, exhaust or emission control systems.” It states that no detectable levels of calcium, copper, sodium, manganese, potassium, phosphorus and zinc should exist in diesel fuel or be used as components of any fuel additive package intended to improve diesel fuel and engine performance. “These elements should be strictly controlled, and it may prove necessary to check and control the fuel quality at the pump.” P. 60 The elements as mentioned above can contribute even at levels as low as 0.1 ppm to the formation of deposits in fuel injector surfaces and nozzles. Injector deposits reduce combustion efficiency and increase emissions. P. 60.
57 European specification: Automotive fuels – Unleaded petrol – Requirements and test methods EN 228:2012 (article 5.3.3) and European specification: Automotive fuels – Diesel – Requirements and test methods EN 590:2013 (article 5.2.2)
58 Sierra Research, 2008, “Impacts of MMT® Use in Unleaded Gasoline on Engines, Emission Control Systems, and Emissions”, Report No. SR2008-08-01. Examples of countries allowing up to 18 mg/l are Ghana and Niger. South Africa allows up to 36 mg/l in their metal containing grade. Based on talks and email correspondence with Huiming Li, STRATAS Advisors, in February and March 2016.
59 The business of blending fuels, including blending of dubious blendstocks, is in more detail explained in chapter 9 and 10. In short, possible sources for elevated levels of silicon in gasoline:– Dirty recycled toluene, which had been
used to wash silicon chips and other electronic components during the manufac-turing process
– Recycled ethanol from the cosmetics industry where it had come into contact with silicon containing anti foam agents.
– Silicon-containing anti-foam agents used in a refinery with delayed coking process. According to the refinery expert, Paul Deelen, it is not very plausible that the silicon came from a refinery product from the SIR refinery. But if the silicon contami-nation came from a refinery product it may well have well come from coker naphtha.
60 Vivo Energy, (2015), “Corporate Brochure.” (Accessed 12.7.2016)
61 Translated from French. Vivo Energy Côte d’Ivoire, (2015), “Vivo Energy Côte d’Ivoire lance un laboratoire de qualité mobile pour faire voyager ses clients au coeur de la qualité des produits Shell” (Accessed 25 July 2016)
62 U.Z. Faruq et al. (2012), “Comparative Studies of Gasoline Samples Used in Nigeria”, Nigerian Journal of Basic and Applied Science, p. 89.
63 Ibid, p. 87.64 Asked about this, Vitol suggested we contact
Vivo Energy which hasn't answered to our detailed questions.
CHAPTER 7
1 Emmanuel Appoh et al., (2015), “Sulphur content in fuels & Status of air quality implications in Ghana”, UNEP presentation at the West Africa Sub-Regional Low Sulphur Workshop.
2 Ghana National Petroleum Authority (NPA) Website, “Regional Consumption 2010–2014”
3 IMANI Centre for Policy and Education, “Deregulation will end petro politics and satisfy Ghana’s IMF deal on fuel subsidies” 24 April 2015
4 Ghana National Petroleum Authority (NPA) Website, “Bulk Distributing Company License”
5 Ghana National Petroleum Authority (NPA) Website, “Bulk Oil Storage Depots”, (Accessed 23 May 2016)
6 News Ghana, “John Attafuah warns against cartels in new fuel pricing regime” 10 June 2015
7 Once two companies have established a regular business relationship, transactions may take place using “open credit” (without payment guarantee). This system is founded on trust, in contrast to a “letter of credit” where the acquirer places money in an account which is blocked when the transacti-on is concluded. Letters of credit are irrevocable and a model deemed very safe, yet they incur banking costs often up to tens of thousands of dollars.
8 Glencore is headquartered in Switzerland, but its oil trading desk operates mainly from London.
9 CITAC, (2015), “Sub-Saharan Africa Oil Market Report: April issue”, p. 22.
10 Cirrus Oil Services Ltd Website (Accessed 23 May 2016).
11 English and Wales High Court (Commercial Court) Decisions, (2014), “Glencore Energy UK Ltd versus Cirrus Oil Services Ltd”.
12 The source added: “I haven’t managed to find out what formal contracts are in place [between Vitol and Cirrus/Woodfields] and if these are exclusive.”
13 Cirrus Oil Services Ltd Website. “News and Events” (Accessed 23 May 2016).
14 Vitol Website, “Ghana Representative Office” and Cirrus Oil Services Ltd Website “Contact Accra” (Accessed 9 December 2015).
15 Vitol Website, “Consortium comprising Helios and Vitol to acquire an equity stake in Oando’s downstream businesses”, 30 June 2015.
16 CH Group Website, “Chase Petroleum Ghana Ltd.” (Accessed 23 May 2016).
17 Ghana Web, “Parliament adopts two reports on $80m facility for TOR”, 13 July 2004.
18 Puma Energy Website, “Ghana” (Accessed 23 May 2016).
19 Our calculations are based on 80 percent of all petroleum products that entered the country between 2004 and 2013, according to the NPA.
20 Private Infrastructure Development Group, (2004), “Emerging Africa Infrastructure Fund: Progress Review 2004” (Accessed 23 May 2016).
21 Presidency of the Republic of Ghana Website, (2014), “Remarks by President John Maha-ma-Royal African Society Business Breakfast Meeting. London, October 22, 2014” (Accessed 23 May 2016).
22 Africa Energy Intelligence, “Puma Energy teams up with a Mahama favorite” 19 April 2016.
23 Ghana Web, “Puma Energy to enter retail market” 1 March 2016.
24 Ghana National Petroleum Authority (NPA) Website, “BDCs Performance statistics 2014”.
25 Ghana National Petroleum Authority (NPA) Website, “BDCs Performance statistics (Jan-Jun 2015)”.
26 Ghana National Petroleum Authority (NPA) Website, “Bulk Oil Storage Depots” (Accessed 23 May 2016).
27 Puma Energy Website, “Ghana” (Accessed 23 May 2016).
28 News Ghana, “John Attafuah warns against cartels in new fuel pricing regime”, 10 June 2015.
29 Sahara Reporters, “Ghanaian presidential candidate Akufo-Addo reveals relationship with Ghana oil tycoon with Nigerian ties” 10 October 2015.
30 Sahara Reporters, “Ghanaian oil tycoon Kevin Okyere bought a £4.5m mansion London mansion in 2014 tied to Diezani’s looting” 14 October 2015.
31 Sahara Reporters, “Fugitive oil tycoon Kola Aluko admits paying Uk rent for Alison-Madu-eke’s mother” 11 November 2015.
32 CITAC, (2015), “Sub-Saharan Africa Oil Market Report: April 2015”, p. 21.
33 Ghana National Petroleum Authority (NPA) Website, “BDCs Performance statistics 2014”.
34 Ghana National Petroleum Authority (NPA) Website, “Storage tanks at TOR” (Accessed 23 May 2016).
35 The New Statesman, “NDC collapses TOR in oil rich Ghana” 12 November 2012.
36 According to a TOR representative presenta-tion accessible on UNEP‘s website, demand for diesel in Ghana is driven, by order of importance, by: haulage trucks, power genera-tion, mining, railway, and public transport. Emmanuel K. Darko, Mark Quist, (2012), “Low Sulphur Diesel and Refining Process, Technical and Financial Implications for Tema Oil Refinery (TOR) Limited”, UNEP.
37 Africa Oil and Gas Report, “Jubilee and WAGP are inadequate for Ghana’s growing fleet of gasfired plants”, 9 June 2014.
38 African Law & Business, “Shining a light on Ghana’s energy crisis”, 23 July 2015.
39 UNEP, Ghana NPA, (2012), “Report on Two Day Workshop on “Cleaner Fuel for Public Transport”.
40 Emmanuel Appoh and al., (2015), “Sulphur content in fuels & Status of air quality implications in Ghana”, UNEP presentation at the West Africa Sub-Regional Low Sulphur Workshop.
41 We are not authorised to disclose the name of the database, but believe it is the best available.
42 A fixture is the contract through which a trading company charters a vessel belonging to a shipping company for a single voyage (“spot cargoes” or “spot fixtures”).
43 A time charter is the contract through which a company rents a vessel under a long-term contract, e.g. one year.
44 In 2013, NS Silver delivered diesel to Tema on 31st March and 24th May.
45 In 2013, Mariella Bottiglieri delivered diesel to Tema on 30th June and 14th September.
46 In 2014, Mariella Bottiglieri delivered diesel to Tema on 11th February and 9th July.
47 Chartered since 2010 by Vitol, the Mariella Bottiglieri anchored in Tema twice in 2014, once from Antwerp and once from Lomé/Apapa-Lagos.
48 For information on Trafigura and Delaney, see chapter 8.
A Public Eye Investigation | September 2016 155
49 Import subsidies were abolished in June 2015. We return to this later.
50 UNEP, Ghana NPA, (2012), “Report on Two Day Workshop on “Cleaner Fuel for Public Transport”.
51 EnSys Energy, EnSys ICCT Refinery Transport Fuels Baseline Analysis, Final Report – All Refineries Baseline Plus 50 ppm Investment, 27.02.2015.
52 IMANI Centre for Policy and Education, “Imani: Deregulation will end petro-politics satisfy Ghana’s IMF deal on subsidy”, 24 April 2015.
53 It was Platt’s FOB NEW ROTTERDAM BARGES 1000 PPM. Paradoxically, this benchmark isn’t very relevant to the European market, because Brussels has prohibited diesel for cars with such high sulphur content. For gasoline, the benchmark is calculated on 10 ppm products – in line with European standards.
54 Ghana Minister for Finance, (2014), “The Budget Speech of the Budget Statement and Economic Policy of the Government of Ghana” (Accessed 23 May 2016)
55 Citifmonline, “Deregulation policy “noble” but “unsustainable” – BDC’s” 28 March 2015
CHAPTER 8
1 Nigerian National Petroleum Corporation NNPC, (2014), “2014 Annual statistical Bulletin”
2 British Petroleum (BP), (2015), “Statistical Review of World Energy”, 64th Edition, p.19
3 Energy Intelligence Research, (2011), “Energy Fundamentals: Understanding the Oil and Gas Industries”, 5th Edition, p. 103
4 The 11 refineries are in Angola, Cameroon, the Republic of the Congo, Gabon, Ghana, Côte d’Ivoire, Nigeria and Senegal. They were among a group of 244 refineries assessed in a study by EnSys for ICCT. For the majority of these refineries, the study reported utilization rates of 50–80 percent of capacity. Only the refinery in Cameron was reported to use 100 percent of its capacity. EnSys Energy, (2015), “EnSys ICCT Refinery Transport Fuels Baseline Analysis: Final Report”.
5 And North America had the highest utilisation rate at 88 percent. BP, (2015), Ibid, pp. 17–19.
6 Ibid.7 Emma Farge, (“Africa’s oil refining ambitions
fading”, Reuters, 20 December 2013.8 Ibid.9 For the purpose of this report, petroleum
products are defined according to the HTS category 2710 as “petroleum oils and oils obtained from bituminous minerals (excl. crude)” and their preparations, regrouping 47 subcategories for specific commodity ranging from fuel oil, gasoline and diesel to jet fuel.
10 Based on UN Comtrade. N.B. UN Comtrade is continuously-updated and the data collected is previously analysed and standardized by UN statistics experts. However, UN Comtrade acknowledges itself that “countries (or areas) do not necessarily report their trade statistics for each and every year”. The data presented in this study are therefore not exhaustive. Also, for the purpose of this report, we focus on volumes exported to West Africa since many important West African countries (for instance Togo, Nigeria, Ghana) do not report their petroleum products import statistics.
11 Platts, (2015), “FAQ: West African gasoline assessments”.
12 For the purpose of this report, high sulphur diesel is defined according to the HTS catego-ry 27101948, as “Gas Oils of Petroleum or Bituminous Minerals, with a sulphur content of >0.1 % by weight (Excl. containing Biodiesel, and for undergoing Chemical Transformation”.
13 This figure does not take into account the total volume of intra-ARA trade, 2,366,457 Mt (i.e. exports from Belgium to the Netherlands and vice versa).
14 The “European countries” figure is without taking into account Gibraltar and Intra-ARA trade.
15 N.B. This figure doesn’t take into account Intra-ARA trade. Belgium’s National Bank, “Statistique du commerce international de marchandises”, and Netherland’s Central Office for Statistics, “Statline CBS” (Accessed 28 October 2015).
16 A confidentiality agreement with the provider doesn’t allow us to disclose the name of the database, but we believe it is the best available.
17 Litasco is the trading arm of Lukoil (Russia’s largest privately held crude oil producer). “LITASCO expanded its activities, especially in Europe, after LUKOIL decided to invest into two refining assets outside Russia namely Italy and the Netherlands. The refinery [ZEELAND refinery] is located in the biggest oil refining and trading hub in North-western Europe, the ARA region (Amsterdam-Rotter-dam-Antwerp). In 2009, LUKOIL signed an agreement with TOTAL SA for acquisition of a 45 percent stake in the TRN Refinery. The refinery is one of Europe’s top performing refineries financially and has a total capacity of 7.9 million tons per year. The refinery can process significant quantities of LUKOIL crude oils, straight-run fuel and VGO of Russian origin, as well as a wide variety of third-party crudes and feedstocks.” Litasco Website, “About us”, (Accessed 19 April 2016).
18 Sahara Group Website, “About us”, (Accessed 10 March 2016).
19 Natural Resource Governance Institute NRGI, (2015), “Inside NNPC oil sales: a case for reform in Nigeria”.
20 Peter Murphy, “Trafigura to pay $198 mln settlement to Côte d’Ivoire”, Reuters, 13 February 2007.
21 Andy Hoffman, “Trafigura’s Valentini exits as Africa oil chief in shakeup”, Bloomberg, 29 February 2016.
22 Puma International Financing SA, (2014), “Preliminary Offering Memorandum”.
23 Quarhess Trading Website. “About us” (Accessed 26 April 2016).
24 Ibid and Linkedin Profile of Mr. Yusuf Yahaya Kwande (Accessed 26 April 2016).
25 In 2014, the US exported only 543,559 Mt of diesel to West Africa, while ARA exported 1,627,404 Mt. In terms of sulphur content, a comparison with the ARA zone is not possible because the US uses another type of statistical category to qualify high sulphur diesel, namely >500 ppm rather than >1,000 ppm.
26 Based on UN Comtrade HTS category 2710.27 Trafigura, (2015), “Responsibility Report 2015”.28 US Energy Information Administration,
(2014), “US Crude Oil and Natural Gas Proved Reserves”.
29 Mercuria, “Press Release: Mercuria Partners with KW Express to Construct Crude by Rail
Project in Houston”, 22 February 2013 and Mercuria Website, “Infrastructure and Logistics” (Accessed 24.11.2015).
30 Andy Hoffman, “Swiss trader Mercuria hires Andrew Good as CFO for North America”, Bloomberg, 3 February 2015.
31 Gregory Meyer, “Trafigura sells assets near booming Texas oil port”, Financial Times, 2 September 2014; and Trafigura, “Press Release: Trafigura AG Sells Majority Stake in South Texas Assets”, 2 September 2014.
CHAPTER 9
1 Stefan van Woenzel, (2016), “Oil traders’ words. A dictionary of oil trading jargon”.
2 For the purpose of our investigations we had several discussions and exchanged several emails with Ton Visser, blending expert at a company, which specializes in training and oil products. These discussions took place in 2014 and 2015 in Vlaardingen, the Netherlands.
3 Preliminary Offering Circular, Gunvor Group, 10 May 2013, pp. 83–84.
4 Vitol Group Brochure, (2013), pp. 27–28.5 Puma Energy, Offering Memorandum,
3 February 2014, p. 123.6 George Libby and Ron Bousso, Newsarticle
“Distillates offer EU refiners only temporary lifeline”, Reuters, Nov 4, 2014, “Commodities summit refinery”.
7 MathPro, (2011), “An Introduction to petroleum refining and the production of ultra low sulfur gasoline and diesel fuel“, p. 26.
8 Ibid., p. 26.9 A car driver needs a motor gasoline that
operates under all circumstances. The engine needs to start easily, also when it is cold. After starting, the engine has to warm up quickly and without interruptions. A hot engine has to run smoothly (also in hot weather). The gasoline needs to keep the engine clean. These kinds of gasoline requirements can be translated into more technical properties such as volatility, antiknock quality and composition. Regarding antiknock quality: the octane number shows the degree to which gasoline spontaneously combusts (to be avoided). If the octane number is too low, the gasoline combusts at the wrong moment and in the wrong way and a metallic sound, called knocking, can be heard. Knocking is damaging for the engine. The Research Octane Number (RON) is an indication of the gasoline’s behaviour under normal driving conditions. The Motor Octane Number (MON) is an indication of the gasoline’s behaviour under severe driving conditions. In European and African countries, RON is used but in the US the average between RON and MON is common, the so-called Anti Knock Index (AKI) or pump octane number.
10 Interview with a Geneva-based trader focused on West Africa, January 2016.
11 Laboratory supervisor of a petrochemical lab in the Netherlands who wishes to remain anonymous. For the purpose of our investiga-tions we conducted several talks in 2014, 2015 and 2016 with two laboratory supervisors of a petrochemical laboratory in the Netherlands.
12 Interview with Robert Kruijff on 11.2.2014 in Anna Palowna, the Netherlands.
13 A “tank pit” is a liquid containment facility of several tanks to prevent leaks and spillage from tanks and pipes. The walls are made of
156 DIRTY DIESEL – How Swiss Traders Flood Africa with Toxic Fuels | Endnotes
earth, sand, clay, steel, concrete, or something else impermeable. Meeting with tank terminal inspectors Simone Marchand and Marc Reedijk in Zaandam, the Netherlands on 18 March 2014.
14 Meeting with representatives of Eurotank Amsterdam Frank Blaauw, Ronald Hoogendijk, Jack de Moel on 9th May 2014.
15 CDI, ICS, OCIMF, SIGGTO, (2013) “SHIP TO SHIP Transfer Guide for Petroleum, Chemicals and Liquefied Gases”.
16 Interview with Rutger van der Hoeven and Henri van der Weide from the Port of Amsterdam on 20th February 2015. Van der Hoeven is Sales Manager from the Commerci-al Division, Cluster Energy and Van der Weide is policy advisor in the Public Division.
17 Interview with Ruud Cogels, director of Mari- Flex, STS provider, headoffice in Vlaardingen, the Netherlands on September 27, 2015.
18 SHEQ manager of VOPAK Terminals North Netherlands in Amsterdam. For the purpose of our investigations we conducted several visits to request a copy of the “Stoffenlijst” (Hazardous Compounds List) and had talks in 2014, 2015 and 2016 to SHEQ and plant managers at VOPAK Terminals North Netherlands.
19 Interview with a Geneva-based trader focused on West Africa, January 2016.
20 Baker Hughes company brochure (2010) “Fuel additives – solutions to fit your needs”.
21 Ton Visser, see footnote 2.22 Paul Deelen, oil refinery expert and founder of
a company that specializes in training and oil products. For the purpose of our investiga-tions we spoke to him several times in 2015 and 2016 in Rhenen, the Netherlands.
23 British Petroleum, (2015), “BP Statistical Review 2015 : The Middle East energy market in 2014”.
24 “The U.S. Energy Information Administration (EIA) estimates in the Annual Energy Outlook 2015, that about 4.2 million barrels per day of crude oil were produced directly from tight oil resources in the United States in 2014, or about 49 percent of total U.S. crude oil production. Tight oil is oil embedded in low-permeable shale, sandstone, and carbonate rock formations.” U.S. Energy Information Administration website (accessed 30 October 2015).
25 George Libby and Jonathan Saul “Refineries revolution to spur use of oil products supertankers”, Reuters, 9 April 2015.
26 Maude Desmarescaux, “Duty reform to support high Russian ultra low sulfur diesel exports in 2016: traders“, Platts, 7 January 2016.
27 Libby George and Ron Bousso, “Distillates offer EU refiners only temporary lifeline”, Reuters, 4 November 2014.
28 Laboratory supervisor, see footnote 11.29 FuelsEurope,(2014), Statistical Report 2014,
p. 12. and British Petroleum, (2015), “BP statistical review of world energy 2015: The EU energy market in 2014”.
30 FuelsEurope,(2014), “Statistical Report 2014”, pp. 14–15.
31 FuelsEurope,(2014), “Statistical Report 2014”, p. 17.
32 In 2012, Europe exported 35 of the total amount of around 44,000 million tonnes gasoline to the US and 54 percent to other countries than the EU and the US. FuelsEuro-pe,(2014), “Statistical Report 2014”, p. 18.
33 Steven Meersman, Roland Rechtsteiner, Graham Sharp, (2012),“The dawn of a new order in commodity trading”.
34 Puma corporate brochure (2015), “Fueling Success” p. 14 – 15.
35 International Financial and Law Review, “Why Trafigura’s oil refinery investment could change the industry”, 10 May 2012 and Trafigura website (accessed 21 October 2015).
36 Gunvor website, (accessed 18 October 2015).37 Andy Hoffman, “Gunvor confirms final stage
talks to buy kpi rotterdam refinery“, Bloomberg, 8 October 2015
38 Reuters, “KPI says completes sale of Rotterdam refinery to Gunvor – KUNA”, 1 February 2016.
39 George Libby and Ron Bousso, “Gunvor Plans to Close Crude Unit and Cut Staff at Rotterdam Refinery-Union”, Reuters, 21 October 2015.
40 ExxonMobil’s refinery in Rotterdam, for example, offers not just the primary distillation but also the flexicoker – the conversion of the vacuum residue. Its refinery in Antwerp has a so-called catalytic cracker, where vacuum gas oil and the lighter part of the fuel oil can be converted into high-quality products.
41 Preliminary Offering Circular, Gunvor Group, 10 May 2013, p. 82.
42 Gunvor website, (accessed 19 September 2015).
43 Interview with Louis Monninkhof and Ronald Backers from the Port of Rotterdam on March 6, 2015.
44 Interview with Mrs Pype, Commercial Manager Logistics – Oils and Chemicals of the Antwerp Port Authority on 27thJune, 2014. And Petrochem, “Belgische raffinaderij IBR rondt investeringstraject af”, number 6, 2014, p. 35.
45 Preliminary Offering Circular, Gunvor Group, 10 May 2013, pp. 83–84, 93.
CHAPTER 10
1 TX-mixtures are Toluene Xylene mixtures, also called C6-C8 aromatics. TX-mixtures are used in gasoline-blends or they may be further processed for use in the manufacture of industrial chemicals and solvents.
2 Paul Deelen, an oil refining expert and founder of a training company specialising in oil products. For the purpose of our research we had several interviews with him in 2015 and 2016 in the Netherlands.
3 Platts, “Platts colombias ecopetrol perfects gasoline stream”, 21 April 2016.
4 Visbreaking naphtha is created during oil refining when the residual part, bottom of the barrel, the most dirty part is thermally- cracked. It is within the boiling range of gasoline. See Annex 4 for more explanation.
5 Expert specialised in the on-location treatment of off-spec cargoes, operating globally and who wishes to remain anony-mous. Fur the purpose of our research we had several talks with him in 2014 and 2015.
6 NRK Norsk Rikskringkasting AS, Dirty Cargo, 24 June 2008. “The other ship was Ottavia, which loaded cargo in Sløvåg. When she arrived, she was nearly fully loaded with high-quality gasoline purchased by Trafigura in England. In Sløvåg, she collected 5,400 tons of waste residue from the process of
desulphurisation of coker gasoline. We have seen documents proving that this waste was mixed with the high-quality gasoline on board. Subsequently, Ottavia sailed for West Africa.” NRK, “Vest tank sweetened coker gasoline” (accessed 26.04.2016). And information from shiptracking databases confirming the voyages of the Ottavia.
7 Trafigura internal document, “factual narrative” dated 23 September 2006. In this document that got leaked Trafigura put the facts chronologically for internal use. After the Probo Koala left Amsterdam, the Dutch water police asked Trafigura on 21 July 2006 where the waste was and what they were planning to do with it. The answer: “They are on- board the cargo [sic.] and maybe blended in small percentages to different grades of petroleum blendstocks thereafter blended.” A newer internal narrative from 12 November 2006, document “EC Note – Probo Koala Amended Basic Narrative”, did not mention this option. And Volkskrant, “Trafigura wilde afval mengen in benzine”, 15 October 2009.
8 International Standard ISO 8217. Fifth edition 2012 Petroleum products – Fuels (class F) Specifications of marine fuels p. 7
9 Laboratory supervisor of a petrochemical lab in the Netherlands who wishes to remain anonymous. For the purpose of our investiga-tions, we spoke on several occasions in 2014, 2015 and 2016 with two laboratory supervisors from a petrochemical laboratory in the Netherlands.
10 A symptom of waxy (paraffinic) crude is the low density. A waxy crude also has a high K-factor (UOP factor), around 11.8 – 12.5. Waxy crude oils are often sweet.
11 Based on information on crude oil (assays) published by Total. The crude oils mentioned above have some of the following properties: AKPO blend from Nigeria: sulphur level 713 ppm, UOPK in different temperature gasoil cuts 12.1 and density 797.7 at 15°C, kg/m3; Cabinda from Angola: sulphur level 1,540 ppm, UOPK in different temperature gasoil cuts 11.9 and density 864 at 15°C, kg/m3; Rabi Light from Gabon: sulphur level 1,390 ppm, UOPK in different temperature gasoil cuts 12.1–12.2 and density 858.3 at 15°C, kg/m3. “TOTAL assays African crudes”, (Accessed 24 May 2016).
12 Paul Deelen, oil refinery expert and founder of a training company that specialises in oil products. For the purpose of our research we had several interviews with him in 2015 and 2016 in the Netherlands.
13 “The changing pattern of refining in the late 1970s/early 1980s also had an impact on diesel fuel quality. The need to use a greater proportion of the crude barrel to produce increased volumes of middle distillates resulted in cycle oils from catalytic crackers being blended into diesel fuel. Cracked material has a lower cetane quality than straight run distillate components. […] thus the use of cetane number improver additive was necessary to meet the refiner cetane specification and to provide fuels with the required ignition quality. […] with the result that cetane improvers additive is a widely used and cost effective product.” Technical Committee of Petroleum Additive Manufactu-rers in Europe, (September 2013), “Fuels and additives: use and benefits”, p. 15.
14 Laboratory supervisor of a petrochemical lab in the Netherlands who wishes to remain
A Public Eye Investigation | September 2016 157
anonymous. For the purpose of our investiga-tions we conducted several talks in 2014, 2015 and 2016 with two laboratory supervisors from a petrochemical laboratory in the Netherlands. The European standard for gasoline, the EN 228: 2012, requires that the appearance shall be determined at ambient temperature.
15 Ibid. 16 Van Campen, “Toxic tanker – the Rich boys
connection”, Dutch edition 2009, English edition, 2015.
17 Arend van Campen. For the purpose of our research we spoke to him in different occasions in 2014, 2015 and 2016 in Switzer-land and in the Netherlands.
18 Based on Shipping Intelligence data, Mercuria chartered the High Beam for a clean cargo of 37,000 tons Unleaded Motor Spirit (gasoline) loaded in ARA in March 2016 and to be discharged in West Africa.
19 From the light cat cracked gasoline (LCCG) the “Heart Cut” is distilled out. This is a sharp distilled fraction, approximately in the middle of the boiling point of the LCCG, or the point at which benzene boils. In other words, the heartcut is distilled from the LCCG to remove the benzene.
20 Africa Refiners Association Website, “AFRI specifications” (Accessed 2 May 2016).
21 Based on information from Stratas Advisors, February 2016.
22 Based on information, talks and email correspondence with Huiming Li, STRATAS Advisors, in February and March 2016.
23 Estimated prices of streams that have not been desulphurised. Prices of desulphurised streams are the specific gasoil stream in question plus operational costs to desulphuri-se (which can be around 1,7 dollar cents per litre for gasoil streams).
24 In 2014, the consumption of middle distillates was around 37 percent of the crude oil barrel BP figures: “Middle distillates’ consists of jet and heating kerosenes, and gas and diesel oils (including marine bunkers)” is 33,903,000 bpd of total consumption of 92,086,000 bpd “Bp statistical review of world energy 2015 oil section” p.13 (accessed 23.10.2015). Of the middle distillates very roughly around 2/3 ends up in diesel while around 1/3 is used as jet fuel, for home and industrial heating and marine diesel fuels.
25 How high exactly depends on the crude oil used and its sulphur content. For a calculation of how much sulphur can end up in different blendstocks (as a ratio to the sulphur content in the crude oil) see Annex 5. For thermally- cracked gas oil, sulphur levels – considering a sweet crude of 2,000 ppm and a sour crude of 30,000 ppm – mostly vary between 1,000 and 15,000 ppm. However, the heavier fractions of thermally-cracked gasoils like a Delayed Coker Heavy Gas Oil or a flexicoker gasoil will have even higher sulphur content – varying between 2,000 and 30,000 ppm.
26 From the naphtha that is produced in refineries around 25 percent is sold as feedstock for the petrochemical industry. Chemical plants run a thermal steam cracker to convert the naphtha into useful chemical building blocks (compare lego) to make all sorts of chemicals. A byproduct from the naphtha steam (thermal) cracker can be further distillated into: Pygas, Pyrolysis Gasoil and a residue known as Main Column Bottom (MCB) or Steam Cracked Residue. MCB could
be qualified as a waste product, because the quality of it – it is a residue – cannot be controlled. But in reality it is now used also as a blendstock for residual marine fuels. Pygas is in the gasoline boiling range and pyrolysis gasoil is in the gasoil boiling range. Pyrolysis gasoil has usually two applications: as a gas oil blending component and for the blending with marine diesel oil. The price of Pyrolysis gasoil is set by the market price of marine diesel. The petrochemicals industry is concentrated in Antwerp, for example, and so there is an elevated production of naphtha steamcracked products with Pyrolysis gasoil and Pygas as byproducts. These cracked products have a lower sulphur level compared to several other fuel blendcomponents (200–300 ppm) which makes it – as a trader puts it – a “good dilutant” for blenders (for non-European fuels). But for European fuels it is much too high. Also, Pyrolysis gasoil is a controversial product with an objectionable odour. It may be a risk to blend it into a gasoil in larger quantities, because the quantity of (poly-) cyclic aromatics in combination with the very reactive, unstable di-olefins renders the product unsuitable. To use it as a blendstock for good quality diesel the product should be desulphurised and di-olefins transformed into mono-olefins. For African Quality diesel, blenders might perceive that as unnecessary. Suppliers might be attracted to using it. Commercially it is interesting to use Pyrolysis gasoil as a blendstock without improving it: the price is set around the price of marine diesel oil.
27 A refinery that is oriented to make good gaso-line components, generally produces simultaneously lower quality gasoil compo-nents. Light Cycle Oil is a typical example of this. It is a bad quality gasoil blendstock due to its high aromatic content and low cetane number (between 15 and 30 only), it is smelly and has high olefin levels. Cycle Oil (Light and Heavy) is unique to a catalytic cracker. Because of its bad quality, LCO is usually used as a blendstock for marine fuels, heating oil, or as cracker feedstock. An alternative, however, is that some would consider blending it into African diesels. A laboratory supervisor from a Dutch laboratory, working closely with oil majors and traders and who wishes to remain anonymous, explains: “LCO is one of the products resulting from cracking bottom product from the refining of crude oil, it is an inexpensive blend stock, commonly used in heating oils and marine diesel oil. LCO contains about 60 percent aromatics, and has a high density of around 0.94. The percentage of LCO in diesel destined for Africa is up to 10 percent. The disadvantage of LCO is its high aromatic content, and the low cetane number makes the engine running worse. In addition, it contains too much sulphur for use in the European market and desulphurisation of the blendstock would cost extra money again. A high aromatic content can give an increase of carbon monoxide and soot emissions, and cause the engine to function less, though the latter is of course also dependent on the engine. LCO contains around 5,000 ppm sulfur. We see it here because blenders in Europe also blend components from North America where a lot of LCO is created.”
28 If the quality is good enough it will be blended into marine diesel oil (MDO) and the price
is then connected to MDO. If the quality is worse (or if there is too much supply in the market) the price will drop to the price of (marine) residual fuel oil.
29 How high exactly depends on the crude oil used and its sulphur content. For a calculation of how much sulphur can end up in different blendstocks (expressed as a ratio to the sulphur content in the crude oil) see Annex 5. For a Light Cycle Oil gas oil sulphur levels considering a sweet crude of 2,000 ppm and a sour crude of 30,000 ppm, mostly vary between 2,000 and 30,000 ppm.
30 Cat cracking is meant to produce more gasoline streams from the crude oil. Heavy cat cracked spirit (HCCS) is usually blended into gasoline. However, due to the weak demand for gasoline products in Europe, HCCS is blended into diesel instead. It is olefinic (making the product instable), aromatic by nature, and highly sulphurous. The use of HCCS is acceptable to European diesel fuels only after severe hydroprocessing to reduce the aromatic, olefinic and sulphur content.
31 How high exactly depends on the crude oil used and its sulphur content. For a calculation of how much sulphur can end up in different blendstocks (as ratio to the sulphur content in the crude oil) see Annex 5. For a straight run heavy gasoil, sulphur levels – considering a sweet crude of 2,000 ppm and a sour crude of 30,000 ppm – mostly vary between 1,200 and 18,000 ppm.
32 How high exactly depends on the crude oil used and its sulphur content. For a calculation of how much sulphur can end up in different blendstocks (expressed as a proportion of sulphur in crude) see Annex 5. For a straight run light gas oil, sulphur levels – considering a sweet crude of 2,000 ppm and a sour crude of 30,000 ppm – mostly vary between 800 and 12,000 ppm.
33 Blend kero is often heavy cat cracker spirit (HCCS) or off-spec jet fuel.
34 How high exactly depends on the crude oil used and its sulphur content. For a calculation of how much sulphur can end up in different blendstocks (expressed as a proportion of sulphur in crude) see Annex 5. For a straight run kerosene, sulphur levels – considering a sweet crude of 2,000 ppm and a sour crude of 30,000 ppm – mostly vary between 400 and 6,000 ppm.
35 Hydrocracked gasoil is on the rise but is still very small with a global consumption of approximately 25 million tons/year.
36 Biodiesel is a very small market, with a global consumption of approximately 100 million tons/year.
37 Olefins –also called alkenes – were not present in the crude but produced in the refinery and while they are, in many cases, also good octane components of gasoline, they are not a welcome component as they ruin the structure, making the gasoline and a gasoil less stable (measured by oxidation stability). Olefins are thermally unstable and may lead to gum formation and deposits in an engine’s intake system. Gasoline or gasoil with a high alkene/olefin content will age (deteriorate) much faster, making the product less storable. Usually, when the level of olefin is higher than 5%, additives need to be added to restore oxidation stability. Also from an environmental and health perspective olefins are undesirable components in fuels. Their
158 DIRTY DIESEL – How Swiss Traders Flood Africa with Toxic Fuels | Endnotes
evaporation into the atmosphere as chemically reactive species contributes to ozone formation and their combustion products form toxic dienes. The olefin content in European gasolines is restricted to be max 18 %. Due to the continuous improvement of European fuels over the last two decades, the average content of olefins in a European motor gasoline is around 10 %. (Sources: European Automobile Manufacturers Association (ACEA), (2013), “Worldwide Fuel Charter”, 5th edition, p. 34 and European specification: Automotive fuels – Unleaded petrol – Requirements and test methods EN 228:2012, talks to trainers of a specialised training company in the field of oil products based in the Netherlands and operating internationally.
38 Estimated prices for streams that have not been desulphurised. Prices of desulphurised streams are the specific naphtha stream in question plus operational costs to desulpherise (which can be around 1 cent a liter for naphtha streams).
39 In 2014 the consumption of light distillates was around 33 percent of the crude oil barrel, according to BP figures: “light distillates (consists of aviation and motor gasolines and light distillate feedstock (LDF)” is 30,131,000 bpd (equaling 1,46 billion ton/year based on BP conversion factors) from total consump-tion of 92,086,000 bpd. “Bp statistical review of world energy 2015 oil section” p.13 (accessed 23.10.2015). Of the light distillates the naphtha’s very roughly end up for 2/3 in gasoline while around 1/3 is sold to the petrochemical industry.
40 Butane is a very cheap blendstock with an estimated price of around 20 cents/liter.
41 Blenders want to add as much as possible but are limited by regulators to protect the environment and consumer (too much butane will lead to evaporation/loss of gasoline during filling the car with gasoline)
42 Usually it is further processed together with other streams, desulphurised, and not present as a separate stream on the market.
43 How high exactly depends on the crude oil used and its sulphur content. For a calculation of how much sulphur can end up in different blendstocks (expressed as a proportion of sulphur in crude), see Annex 5. For a thermally- cracked naphtha – considering a sweet crude of 2,000 ppm and a sour crude of 30,000 ppm – the figure mostly varies between 600 and 9,000 ppm.
44 Approximately half the price of gasoline. 45 Light naphtha can be used as a cheap
blendstock for gasoline: it is only half the price of gasoline. But most of it is converted to higher octane isomerates. Most of the heavy naphtha is made to reformer in the reformer unit.
46 How high exactly depends on the crude oil used and its sulphur content. For a calculation of how much sulphur can end up in different blendstocks (expressed as a proportion of sulphur in crude), see Annex 5. A straight run light naphtha – considering a sweet crude of 2,000 ppm and a sour crude of 30,000 ppm – mostly varies between 200 and 3,000 ppm.
47 Gasoline minus ~75 dollar. 48 From the naphtha that is produced in
refineries around 25 percent is sold as feedstock for the petrochemical industry. Chemical plants run a thermal steam cracker
to convert the naphtha into useful chemical building blocks (compare lego) to make all sorts of chemicals. A byproduct from the naphtha steam (thermal) cracker can be further distillated into: Pygas, Pyrolysis Gasoil and a residue, known as Main Column Bottom (MCB) or Steam Cracked Residue. MCB could be qualified as a waste product, because the quality of it – it is a residue – cannot be controlled. In reality, it is now used as a blendstock for marine fuels. Pygas is in the gasoline boiling range and pyrolysis gasoil is in the gasoil boiling range. The petrochemi-cals industry is concentrated in Antwerp, for example, and so there is an elevated production of naphtha steamcracked products with Pyrolysis gasoil and Pygas as byproduct. These cracked products have a lower sulphur level compared to several other fuel blendcomponents (200–300 ppm) which makes it – as a trader puts it – a “good dilutant” for blenders (for non-European fuels). But for European distillate fuels it is much too high. Also, pygas is a controversial product with an objectionable odour. It may be a risk to blend it into a gasoline in larger quantities as the high quantity of aromatics in combination with the very reactive, unstable di-olefins renders the product unsuitable. Another problem is the content of benzene (a known carcinogenic). To use it as a blendstock for high-quality fuels, the products should be desulphurised, di-olefins transformed into mono-olefins, and the benzenes extracted. For African Quality gasoline that might be perceived by blenders as unnecessary. And according to a refinery expert, independent suppliers might be attracted to using it. During our research we came across examples of Swiss traders applying Pygas as a blend component for African gasoline. See also chapter 10 on the tanker High Beam and chapter 11 on the tanker Conger. Commercially it is interesting to use Pygas as a blendstock without improving it: the price is around the price of gasoline minus ~75 dollar.
49 Gasoline minus ~75 dollar. 50 Gasoline price plus ~50 dollar.51 When a refinery has a modern reformer it
produces low aromatic high octane reformate – with minus we mean with an octane level considerably lower than a “reformate plus”.
52 This naphtha is usually going into the steam cracker or the reformer and will be hardly available on the market as such.
53 Alkylation converts unsaturated LPG that is created during cracking process to alkylates. Alkylates are very good and expensive blendstocks: not only do they have a high octane number but it is also low in sulphur (less than 10 ppm) and free of aromatics and olefins.
54 Ethers like Methyl Tertiary Butyl Ether (MTBE) are high-octane organic compounds containing carbon, hydrogen and oxygen. MTBE is an ether manufactured via a chemical reaction between methanol and isobutylene, both of which can be derived from natural gas. In the United States it is associated with large-scale contamination of groundwater supplies that affects the taste and odour of water. US refiners have largely removed this additive from their supply. Ethyl Tertiary Butyl Ether is an ether produced by
reacting ethanol and isobutylene with a catalyst under heat and pressure. It is widely used in Europe and Canada.
55 Gasoline consists for a large part of toluene from reformate or Pygas blended into gasoline. Traders and blenders also add toluene and xylene by blending TX mixtures. BTX-mixtures also exist on the market, but are less common. If (European) refineries can separate the benzene (and also xylene), they will do so because it is more commercially interesting to sell benzene to the chemical industry. In addition, BTX–mixtures cannot be blended into European gasoline because of the maximum limits of benzene. (B)TX mixtures are used to spike the gasoline – it increases the octane number.
56 Costs depend on availability as there are also other options for this component.
57 Alcohols like Ethanol are high octane blending components on the markets. Alcohols are a product of the fermentation of sugars in crops and other biological sources.
58 Costs depend on availability as there are also other options for this component.
59 Internal Trafigura email dated 28 December 2005 from James McNicol to Naeem Ahmed (rec# 5914 Yao Essaie Motto & Others v Trafigura Limited and Trafigura Beheer BV in the High Court of Justice, Queen’s Bench Division, Claim No. HQ06X03370)
60 An internal Trafigura memorandum dated 23rd
September 2006 summarizes in paragraphs 1–3 how much coker naphtha was unloaded to the Probo Koala by three different vessels: (1) 11 April 2006 M/T Seapurha: 28,829 mt (2) 19 May 2006 M/T Moselle: 28,130 mt (3) 18 June 2006 M/T Seavinha 28,284 mt. This is in total 84,243 mt equalling 115,163,293 liters.
61 Laboratory supervisors of a petrochemical lab in the Netherlands who wish to remain anonymous. For the purpose of our investiga-tions, we spoke on several occasions in 2014, 2015 and 2016 with two laboratory supervisors from a petrochemical laboratory in the Netherlands.
62 Dioxins are highly toxic and can cause cancer, reproductive and developmental problems, damage to the immune system. They can also interfere with hormones. They are dangerous even at extremely low levels. Dioxins are formed when products containing carbon and chlorine are burned. Even very small amounts of chlorine can produce dioxins. From the US Environmental Agency Website, “Epa gov learn about dioxin” and “Epa gov epa waste”, (Accessed 16 October 2015).
63 European Automobile Manufacturers Association (ACEA), (2013), “Worldwide Fuel Charter”, 5th edition, p. 26.
64 Paul Deelen, oil refinery expert and founder of a training company specialising in oil products. For the purpose of our research we had several interviews with him in 2015 and 2016 in the Netherlands.
65 In the Netherlands organohalogens and PCB are restricted in fuels: Max 50 mg/kg EOX and max 0.5 mg/kg PCB-congeneen. According to this legislation, “fuels and mixtures that exceed the standard may not: be used as a fuel component in the Netherlands; be imported as fuel into the Netherlands; be kept; be available; be offered for sale; be in stock for sale or sold.” Regulation BOHN (Besluit organisch halogeengehalte brandstoffen), ‘Belastingdienst milieugevaarli-
A Public Eye Investigation | September 2016 159
jke stoffen bepaalde minerale olien” and “Besluit organisch-halogeengehalte van brandstoffen”, (Accessed 29.12.2015). For the determination of organic halogen, method “NEN-EN 14077:2004” is directly applicable to the determination of low contents (2 mg/kg to 100 mg/kg) of organic halogen in petroleum products such as gasolines, middle distillates, and residual fuels. Except for fluorine (F), the organic halogens chlorine (Cl), bromine (Br) and iodine (I) that may be present in the sample are determined quantitatively. The halogen is reported as the equivalent number of chloride ions. NEN-EN 14077:2004 en Petroleum products – Determi-nation of organic halogen content” (Accessed 31 December 2015).
66 Email correspondence with Frank De Greve, Federal Government of Belgium, Economic department, in May 2016.
67 Paul Deelen, oil refinery expert and founder of a training company specialising in oil products. For the purpose of our research we had several interviews with him in 2015 and 2016 in the Netherlands.
68 Expert specialised in the on-location treatment of off-spec cargoes, operating globally and who wishes to remain anony-mous. For the purpose of our research we had several talks with him in 2014 and 2015.
69 Based on the following sources: Stockholm Convention “Pops Implementation PCBs” (Accessed 28 December 2015); Basel Convention, “Updated technical guidelines for the environmentally sound management of wastes consisting of, containing or contami-nated with polychlorinated biphenyls (PCBs), polychlorinated terphenyls (PCTs) or poly- brominated biphenyls (PBBs)”, 23 March 2007; “Pops Implementation PCBs” , (Accessed 28 December 2015); US EPA Website: “Epa learn about polychlorinated biphenyl”; CE Delft, May 2011, Report “Blends in Beeld – een analyse van de bunkerolieketen”, p. 15.
70 The Basel Convention on the Control of Transboundary Movement of Hazardous Wastes and their Disposal, the Rotterdam Convention on the Prior Informed Consent Procedure for Certain Hazardous Chemicals and Pesticides in International Trade and the Stockholm Convention on Persistent Organic Pollutants (POPs).
71 While most of the 12 chemicals covered by the Stockholm Convention were subject to an immediate ban, widespread reliance on PCB-containing equipment (notably certain electrical transformers and capacitors) has led to an exception to allow for continued use until 2025, as long as countries ensure leaks are prevented and efforts are invested towards safe management and eventual disposal of the equipment. Many national programmes are in place to safely destroy PCB oils and contaminated equipment through breaking their molecular bonds using either chemical or thermal energy. Based on the following sources: Basel Convention Website, “PCBs and other POPS in context of Basel Convention” (Accessed 28.04.2016); Stockholm Convention, United Nations Environment Programme, PCB Transformers and Capacitors – From Management to Reclassification and Disposal – First Issue, May 2002, Polychlorinated biphenyls (PCBs) and other Persistent Organic Pollutants (POPs) in the context of the Basel Conventi-
on, “Guidance documents on PCBs” (accessed 29 December 2015) “Pops Status of Ratifica-tions” and “Pops PCBs hour glass” (Accessed 28 February 2016).
72 CE Delft, (2011), “Blends in Beeld – een analyse van de bunkerolieketen”, p. 70.
73 Paul Deelen, oil refinery expert and founder of a specialised training company in the field of oil products. For the purpose of our research we had several interviews with him in 2015 and 2016 in the Netherlands.
74 Mercuria Website, (Accessed 19 January 2016). 75 XOS, September 2012, “Technical paper Under-
standing the silicon issue” and Petroleum Systems Services Corporation, (2010), “Avoid silicon-based antifoams in manufacturing ethanol”,(Accessed 14 January 2016).
76 European Automobile Manufacturers Association (ACEA), (2013), “Worldwide Fuel Charter”, 5th edition, p. 26 (Accessed 17 February 2016).
77 Talk Vietnam, “Acetone rate in contaminated Vietnam petrol higher than thought”, 4 September 2006.
78 Saigon-Gpdaily, “Contaminated petrol can be cleaned but still troublesome”, 8 September 2006.
79 Asian Clean Fuels Association, (March/April 2007), “Acfa newsletters”, Vol. 5, Issue 3, pp. 3–6.
80 Thanhniennews, “Vietnam companies compensate consumers for adulterated gas”, 19 November 2006.
81 Paul Deelen, oil refinery expert and founder of a specialised training company in the field of oil products. For the purpose of our research we had several interviews with him in 2015 and 2016 in the Netherlands.
82 Agathe Duparc, “Après un scandale, Gunvor est expulsée du Nigeria”, Bilan, 4 June 2008.
83 Gunvor Group, Preliminary Offering Circular, 10 May 2013, pp. 83–84.
84 Oando Website, (Accessed 17 February 2016). 85 Agathe Duparc, “Après un scandale, Gunvor
est expulsée du Nigeria”, Bilan, 4 June 2008. 86 Agathe Duparc, “Après un scandale, Gunvor
est expulsée du Nigeria”, Bilan, 4 June 2008. 87 All countries have phased out leaded gasoline
except Algeria, Iraq and Yemen. UNEP, (January 2015), “Leaded Petrol Phase-out: Global Status as at January 2015”, “UNEP world map lead” and UNEP, (January 2016), “Status of leaded gasoline phase out Africa, “Map lead Africa”.
88 Environment News Service, “Leaded Transport Fuel Fades Into History”, 11 November 2011.
89 The Guardian, “UK firm Octel bribed Iraqis to keep buying toxic fuel additive” 30 June 2010. The Guardian, “Innospec executive fined over bribes to boost sales of toxic fuel additives”, 9 August 2010. The Telegraph, “British company ‘selling toxic lead fuel to poor countries’”, 14 January 2013. Reuters, “Ex-Innospec directors found guilty over bribes to sell toxic fuel additives”, 18 June 2014.
90 ICCT, “Icct update mmt”, 16 February 2012 and Afton Chemical, “In 2004 Ethyl Petroleum Additives, Inc. changes its name to Afton Chemical Corporation”.
91 Afton Chemical, “Afton chemical octane improver” and Manila Times “Manganese fuel additive safe” , 16 October 2013.
92 ICCT, “Icct update mmt”, 16 February 2012. 93 ICCT, “Icct update mmt”, 16 February 2012. 94 Paul Deelen, oil refinery expert and founder of
a training company specialising in oil
products. For the purpose of our research we had several interviews with him in 2015 and 2016 in the Netherlands.
95 “Recommended dosage: Typical treat rates range from 8 mg Mn/litre to 18 mg Mn/litre although in specific markets higher levels can often be employed for maximum octane improvement. Treat-rates may vary depending on base fuels.” From Afton Chemical, company brochure “Afton chemical HiTEC3062” (Accessed 17 February 2016) and ICCT, (2009), “Methylcyclopentadienyl Manganese Tricarbonyl (MMT): A Science and Policy Review”, pp. 7–8.
96 Afton Chemical website, “Afton chemical Octane Improver” (Accessed 3 January 2016).
97 ICCT, 2009, “Methylcyclopentadienyl Manganese Tricarbonyl (MMT): A Science and Policy Review” (Accessed 16 February 2016)and ICCT, Ray Minjares 16 February 2012, Update: MMT, “Blog update mmt” (Accessed 3 January 2016).
CHAPTER 11
1 According to the MasterCard Global Destination Cities Index Amsterdam ranks no 13 in the world top 20 destination cities by International Overnight Visitors (7.4 million in 2015). MasterCard, “MasterCard 2012 Global Destination Cities Index” p. 8 (Accessed 31 May 2016).
2 Port of Amsterdam, (2014), “Factsheet Energy”; and Port of Amsterdam Website, “Port of Amsterdam liquid and dry bulk” (Accessed 10 May 2016).
3 This is about all outgoing cargo by commodi-ty in 2013: 26.2 million tonnes liquid and dry bulk and general cargo (where liquid bulk with “refined products” is by far the biggest commodity group). Nigeria lists 4 with 2.4 million tonnes, Togo lists 5 with 2.3 million tonnes, Ghana lists 6 with 1 million tonnes and Guinea list 10 with 0.5 million tonnes. Port of Amsterdam, “statistics” (Accessed 26 May 2015).
4 Meeting with Rutger van der Hoeven, Port of Amsterdam Sales Manager from the Commercial Division, Cluster Energy, and Henri van der Weide, Policy Advisor in the Harbour Master’s division, in Amsterdam, 20 February 2015.
5 Meeting with Rose-Marie Pype, Commercial Manager Logistics – Oils and Chemicals at the Port of Antwerp, in Antwerp, 27 June 2014.
6 A ship engaged in the “tramp trade” is one that does not have a fixed schedule or published ports of call. In comparison to freight liners, tramp ships trade on the spot market with no fixed schedule or itinerary/ports-of-call(s).
7 Port of Rotterdam, “Port of Rotterdam throughput 2012 and 2013” and “Port of Rotterdam throughput 2014 and 2015”.
8 Meeting with Rutger van der Hoeven, Port of Amsterdam Sales Manager from the Commercial Division, Cluster Energy, and Henri van der Weide, Policy Advisor in the Harbour Master’s division, in Amsterdam, 20 February 2015.
9 US International Trade Commission (USITC). “Harmonized Tariff Schedule”.
10 Meeting with Ms Rose-Marie Pype, Commerci-al Manager Logistics – Oils and Chemicals at
160 DIRTY DIESEL – How Swiss Traders Flood Africa with Toxic Fuels | Endnotes
the Port of Antwerp, in Antwerp, 27 June 2014.
11 Port of Rotterdam, (2015), “Port Statistics: A wealth of information. Make it happen”, p. 18 ; and Port of Rotterdam Website, “Facts and figures about the port”; and Port of Rotterdam Website, “Buoys and Dolphins”, (Accessed 10 May 2016).
12 Meeting with Louis Monninkhof, Business Developer Oil and Refining & Russia, and Ronald Backers, Advisor Business Intelligence, Liquid Bulk, from the Port of Rotterdam, in Rotterdam, 6 March 2015.
13 Port of Amsterdam, “Ports Statistics 2013”, p. 2. In 2013, Amsterdam had a throughput of 38,593,000 tonnes “refined products” (of this 17,704,000 tonnes came in and 20,889,000 tonnes went out). Port of Antwerp Website, “Port of Antwerp handles 190.8 million tonnes of freight in 2013 (definitive figures)” Press Release, 24 January 2014 (Accessed 10 May 2016).
14 Meeting with Ms Rose-Marie Pype from the Port of Antwerp, 27 June 2014.
15 Port Of Antwerp, (2014), “Antwerp, allround in liquids – Tank storage”.
16 “VTTI is 100 % owned by the Vitol Investment Partnership Limited, an investment vehicle of the Vitol Group”. VTTI Website, “Who we Are” (Accessed 17 February 2016).
17 Oiltanking Website, “Oiltanking Amsterdam”, (Accessed 22 September 2015).
18 Meeting with a person who works in the port and is in contact with the ships. This source wishes to stay anonymous. For the purpose of our research we had several meetings with him in 2014 and 2015.
19 Oiltanking Website, “Oiltanking signs storage agreement with international trador Gunvor”, Press release, 19 April 2006; and Gunvor Group, (2013), “Preliminary Offering Circular”, p. 84.
20 VTTI Website, “ETA, Amsterdam, The Netherlands” (Accessed 2 November 2015).
21 Meeting with Mr Frank Blaauw, Mr. Ronald Hoogendijk and Mr Jack de Moel from Eurotank Amsterdam in Amsterdam, 9 May 2014.
22 Meeting with Louis Monninkhof and Ronald Backers from the Port of Rotterdam, 6 March 2015.
23 Meeting with Ms Rose-Marie Pype from the Port of Antwerp, 27 June 2014.
24 DIRECTIVE 2012/18/EU OF THE EUROPEAN PARLIAMENT AND OF THE COUNCIL of 4 July 2012 on the control of major-accident hazards involving dangerous substances, amending and subsequently repealing Council Directive 96/82/EC. Act on the risk of major accidents 2015, “Besluit risico’s zware ongevallen 2015”, Art 6 (7); and Regulation on the risks of major accidents, “Regeling risico’s zware ongevallen”, Art 18.
25 Meeting with Frank Blaauw, Ronald Hoogendijk and Jack de Moel from Eurotank Amsterdam, in Amsterdam, 9 May 2014.
26 We collected Hazardous Components Lists from the following terminals: Oiltanking Amsterdam (on 14 March 2014 and 15 July 2015), BP Oil Terminal (on 14 March 2014), Eurotank Amsterdam (11 June 2014), VOPAK (18 March 2014, 15 July 2015 and 30 March 2016), Nustar (1 April 2014), Hydrocarbon Hotel (20 March 2014).
27 Status of data 26 July 2016. When asked whether OTA is still one of Gunvor's main
blending and storage facilities for gasoline and gasoil, Gunvor stated that it could not comment as “it relates to commercially sensitive information.”
28 Meeting with a person, who works in the port and is in contact with the ships. He wishes to stay anonymous. For the purpose of our research we had several meetings with him in 2014 and 2015.
29 Platts, (2015), “Frequently asked questions: West African gasoline assessments”, p. 2.
30 Daddo Maritime Services Togo Website, “DMS Togo”, (Accessed 26 November 2015).
31 Lomé asks for an anchorage fee of €1,525.50 per 15 days, while mooring at a dolphin in Amsterdam’s Africa harbour can be done at a rate of €1,039 per 24 hours. West of England Website, “Togo Port Information and New Anti-Piracy Measures”, 13 July 2012 (Accessed 12 May 2016) and Port of Amsterdam, (2016), “Harbour dues sea shipping 2016: General terms and Conditions”, pp. 48–49.
32 An example of a tanker used as floating storage/production is the 84,040 DWT tanker “African Leader”, operated by the Danish bunker supplier Monjasa. Marine Traffic describes the African leader as floating storage/production. Marine Traffic, “African Leader” (Accessed 12 May 2016).
33 Daddo Maritime Services Togo Website, “DMS Togo” (Accessed 26 November 2015).
34 Mother ships are normally the larger of the vessels engaged in STS transfer operations. In conventional STS operations, the Mother ship is the Discharging ship. However, in a reverse lightering operation the Mother ship may be the Receiving ship. A daughter vessel is normally the smaller of the vessels engaged in STS transfer operations. In conventional STS operations, the Daughter vessel is the Receiving ship. However, in a reverse lightering operation the Daughter vessel may be a Discharging ship.
35 The deadweight tonnage (DWT) of a ship is a measure of how much mass a ship can safely carry and an indication of the cargo carrying capacity. DWT is the sum of the weights of cargo, fuel, fresh water, ballast water, provisions, passengers and crew and excludes the weight of the ship. Deadweight gives an indication of the cargo carrying capacity.
36 The term “demurrage” is used in vessel chartering and refers to the period when the charterer remains in possession of the vessel after the period planned to load and unload cargo (laytime). Demurrage refers to the penalty that the charterer pays to the ship owner for its extra use of the vessel.
37 Interview with a Geneva-based trader focused on West Africa, who spoke to us under the condition that he remains anonymous,
14 January 2016.38 Gray Page Website, “Maritime threats and
incidents” (Accessed 12 December 2016) ; and Defense WEB, “Pirate attacks in West Africa could double next year” 27 November 2013; and Nowergian Hull Club Website, “General assessment of the maritime security situation in the Gulf of Guinea, 1st quarter 2016” (Accessed 13 May 2016).
39 Interview with Cyrus Mody, assistant director of the International Maritime Bureau in London, 18 December 2014.
40 Gray Page, “BIGHT OF BENIN – Threat: vessel hijack and refined petroleum product cargo
theft in the Gulf of Guinea, 10 October 2013, last updated 18 January 2016” (Accessed 13 May 2016).
41 Dyrad Maritime, “MT Kerala Hijack – Game Changer or Inside Job?” (Accessed 12 May 2014).
42 Gray Page, “Graypage expanded jwc listed area” (Accessed 4 October 2013).
43 Interview with Emmanuel Quartey, working by the African Refiners Association, in Tema (Ghana) 30 April 2015.
44 Interview with a trader based in Cotonou who wishes to remain anonymous, Benin, 13 May 2015.
45 Gunvor Group, (2013), “Preliminary Offering Circular”, pp. 83–84.
46 Platts, “Trafigura charters two VLCCs with storage option to move gasoil”, 27 August 2015.
47 Interview with a person working for Oryx Energies who wishes to remain anonymous, in Cotonou (Benin) on 14 May 2015.
48 For example, when charter information on geographical areas or dates was not completely in line with live ship tracking information, we attributed more value to live observations under the assumption that new orders or redirected ships is not unusual.
49 Mocoh’s branch in South Africa had senior ANC politician Tokyo Sexwale as a sharehol-der. The company was implicated by a UN report for paying kickbacks to Iraqi officials under UN’s Oil for food programme. See for example: Mail and Guardian, “The Oil for food scandal so far”, 21 October 2011.
50 Fixture information from a shipping intelligen-ce database.
51 From notes and conversations with SHEQ and plant managers of VOPAK Terminals North Netherlands during several visits to the VOPAK terminal in Amsterdam 2014, 2015 and 2016 to request a copy of the “Stoffenlijst” (Hazardous Compounds List).
52 Based on meetings and subsequent email correspondence with Ton Visser, who is a blending expert at Oiltraining B.V. in the field of oil products and blending, on different occasions in 2014 and 2015, in Vlaardingen, the Netherlands. And based on several talks to Paul Deelen, oil refinery expert and founder of Oiltraining B.V. in the field of oil products, in 2015 in Rhenen, the Netherlands.
53 Marine Traffic showing the track of the vessel during certain periods. Screenshot was taken on 14 August 2015, 15:27 CET.
54 Oryx Energies Website, “Canary Islands” (Accessed 13 May 2016).
55 Meeting with a person, who works in the port, is in contact with the ships, and who wishes to remain anonymous. For the purpose of our research we had several meetings with him in 2014 and 2015.
56 Paul Skeet et al., (2011), “The risks and benefits of blending on board – are you getting the right mix?”.
57 Secretariat of the Basel Convention, “The application of the Basel Convention to hazardous wastes and other wastes generated on board ships”, 4 April 2011.
58 SGS Website, “Fuel Blending” (Accessed 12 May 2016).
59 A dolphin is a man-made marine structure that extends above the water level and is not connected to shore. Dolphins are usually installed to provide a fixed structure, a point for vessels to moor to. It is considered a more safe (stable) alternative to STS at the buoy.
A Public Eye Investigation | September 2016 161
60 A manifold is a pipe or chamber having multiple inlets or outlets for making connections to distribute or collect fluids. These manifolds are where the vessel is connected to a terminal or another ship by hoses, kick arms etc.
61 Interview with Ruud Cogels, Director of MariFlex, in the headoffice in Vlaardingen (the Netherlands), 27 September 2015.
62 UK Department of Transport, (2010), “Explana-tory memorandum to the merchant shipping (STS transfers) regulations 2010”, No. 1228, p. 9.
63 Interview with Ruud Cogels, Director of MariFlex, in the headoffice in Vlaardingen (the Netherlands), 27 September 2015
64 Ibid.65 Marine Accident Investigation Branch, (2010),
“Report on the investigation of the collision between MT Saetta and MT Conger on completion of a ship to ship transfer 9.5 miles south east of Southwold, UK on 10 August 2009”, p. 1 and pp. 31–32.
66 IMO, (2009), “MEPC 59/24/Add.1”, Annex 22, p. 2 and Gibraltar Port Authority Website, “STS” (Accessed 12 May 2016).
67 Hellenic Shipping News, “Tankers on board blending”, International Shipping News, 17 June 2015.
68 Secretariat of the Basel Convention, “The application of the Basel Convention to hazardous wastes and other wastes generated on board ships”, Annex, 4 April 2011.
69 Gard, “LOIs for commingling or blending cargo on board”, Insight 171, 1 August 2003.
70 “Comingling: Charterer to have the right to order the vessel to commingle and/or circulate the cargo in vessel’s tanks and/or add additives (including but not limited to dye, pour point depressants, anti-static additives, metal deactivators and H2S scavengers) subject always to vessel’s safety. Blending: charterer has the option of blending afloat.”
Mercuria Energy Trading, (2007), “Chartering Terms”, p. 10. When asked what Mercuria’s current Chartering Terms state regarding blending onboard, Mercuria answered that co-mingling is a standard procedure. There is always a clause in the contract, that is not always used, but always included to keep the option open should Mercuria need it.
71 Interview with Cyrus Mody, assistant director of the International Maritime Bureau in London, 18 December 2014.
72 Correspondence with Dr Phillip Belcher, Marine Director by Intertanko in 2014 and 2015; and IMO, (2009), “MSC 86/WP.15”, paragraph 5: “In considering this issue, the group noted that, whilst concerns about blending during the sea voyage have been triggered in relation to the production of biofuel blends, the principles behind such blending operations at sea could apply to many cargoes.”
73 IMO’s Maritime Safety Committee (MSC) has adopted, during its 90th session in 2012, resolution MSC. 325(90) by which a new SOLAS regulation prohibits the blending of bulk liquid cargoes and production processes during sea voyages. IMO, (2012), “MSC 90/28/Add.1”, Annex 1, p. 4.
74 Dutch Ministry of Infrastructure and Environ-ment Website, “Productieprocessen aan boord van zeeschepen in de toekomst verboden”, 30 May 2012 (Accessed 12 May 2016); and Maritime New Zealand, “Maritime Rules Various SOLAS Catch-up Amendments 2015”, p. 4.
75 IMO, (2012), “MSC 90/28/Add.1”, Annex 1, p. 4.76 PortNews, “IBIA stops IMO ban on blending
afloat”, 23 July 2009.77 Norway, Panama, Marshall Islands, Liberia, ICS,
BIMCO and INTERTANKO submitted the document MSC 93/20/8 on 25 March 2014 for IMO, Maritime Safety Committee to ask for a clarification of the ban. IMO, “Clarification Prohibition of the blending of bulk liquid cargoes and production processes during sea voyages”.
78 Correspondence with Dr Phillip Belcher, Marine Director by Intertanko in 2014 and 2015.
79 Hellenic Shipping News, “Tankers on board blending”, International Shipping News, 17 June 2015.
80 Correspondence with Dennis de Bruin, Marine Director of BMT Surveys, 7 December 2015.
81 Gard, “Guidance: SOLAS prohibition of the blending of liquid bulk cargoes and production processes during sea voyages”, 15 April 2014.
82 In the Netherlands for example, STS and blending operations are only allowed in ports, not offshore. In Antwerp, STS outside port limits is forbidden. In Germany, STS is forbidden outside of ports. (HELCOM Secretariat, Joint HELCOM/OSPAR Task Group, (2014), “Information on ship-to-ship cargo transfers and bunkering operations in the Baltic Sea region”). In the UK, outside of ports, STS transfers are prohibited within coastal waters, the area which extends 12 nautical miles (22.2 km) out from the shoreline. With the exception of one designated area near Southwold on the southeastern coast, STS transfers in this area must comply with detailed technical requirements including the need to provide 72 hours notice to the Maritime and Coastguard Agency (MCA). Beyond the UK’s coastal waters, but still within the UK Pollution Control Zone, which extends to a maximum 200 nautical miles (370 km) from the UK coast, STS transfers are permitted but the MCA must be informed at least 48 hours before the transfer. The British regulations contain no mention of blending. (UK Maritime and Coastguard Agency (MCA), “Ship to Ship Transfer Regulations”, No. 2010/201228.05.2012; and Platts, “UK ship-to-ship oil transfer rule change seen having little impact”, 21 January 2011. In Denmark STS operations take place offshore Skaw and Kalundborg at anchor with port pilot and port tug boats. “GAC transfer Services” (Accessed 6 June 2016).
83 Examples of busy meeting places for tankers are Lagos, Lomé and Tema while STS providers offer their services for many other places offshore West Africa.
84 International Convention for the Prevention of Pollution from Ships, 1973, as modified by the Protocol of 1978 relating thereto (MARPOL).
85 None of the studies conducted by the IMO to prepare the MARPOL Convention considered the possibility of waste generated by industrial processes carried out onboard a ship. Nor did the MARPOL Convention contain any reference to port reception facilities for receiving this type of waste. Based on the study carried out by the Center for Internatio-nal Environmental Law of the preparatory work and studies for the MARPOL Convention. Center for International Environmental Law, “Issue Brief”, 26 June 2012.
CHAPTER 12
1 L’Agefi, “Oryx Energies inaugure 16 stations service au Mali”, 18 May 2016.
2 For the answers of the companies to our questions see the Public Eye website.
3 Email exchange with Fanta Kamakaté, 27 June 2016.
4 United Nations Human Rights, (2011), “Guiding Principles on Business and Human Rights”, p. 13.
5 Heavy Duty Diesel Initiative of the Climate and Clean Air Coalition, “Cleaning Up the Global On-Road Diesel Fleet, A Global Strategy to Introduce Low-sulphur Fuels and Cleaner Diesel Vehicles” (Draft), March 2016, p. 34.
6 International Energy Agency, (2016), “Energy and Air Pollution”, World Energy Outlook Special Report, p. 66.
7 Of these three types of costs, the costs of hydrogen is usually highest. Depending on the efficiency of the hydrogen plants, costs for desulphurisation can vary.
8 Hart Energy and MathPro Inc., (2012), “Technical and economic analysis of the transition to ultra-low sulfur fuels in Brazil, China, India, and Mexico”.
9 ICCT, “Creating a roadmap for clean fuels and vehicles for West Africa”, May 18, 2015.
10 Clean Air Initiative for Asian cities, (2008), “A roadmap for cleaner fuels and vehicles in Asia”, p. 56.
11 Email of the 22nd of April 2015.12 Platts, (2016), “Duty reform to support high
Russian ultra low sulfur diesel exports in 2016” (Accessed 8 June 2016).
13 Calculated from a scenario that assumes reduced sulfur content in transportation fuels, vehicles with improved emission controls, development of an inspection and maintenance (I&M) program, and phase-out of 2-stroke engines.
The World Bank, ESMAP (2009), “Sub-Saharan Africa Refinery Study”, Extractive Industries for Development Series, No. 12 (Accessed 22 February 2016); and United Nations Environmental Program, (2015), “Speaking Points by Jane Akumu”, ECOWAS Workshop in Abidjan (Accessed 22 February 2016).
ANNEX 1
1 “Between January and March 2006, Trafigura conducted two caustic soda washing operations at Tankmed’s premises at the port of La Skhira. On 1 March 2006, or thereabouts, gases leaked from Tankmed’s facilities, causing a serious odour problem. Some of Tankmed’s workers experienced breathing difficulties, and three people were reportedly admitted to hospital following exposure to the fumes.” “Trafigura then decided to undertake caustic washing on board a ship.” From Report “The Toxic Truth” by Amnesty International and Greenpeace. P. 27 and p. 80 "The Toxic Truth" (Accessed 9 November 2015).
2 An internal Trafigura memorandum, 23.9. 2006 noted that a batch of 28,284 mt coker naphtha was unloaded to the Probo Koala by the M/T Seavinha on 18 June 2006.
162 DIRTY DIESEL – How Swiss Traders Flood Africa with Toxic Fuels | Endnotes
ANNEX 2
1 “Concentrations of over 500 ppm mass can occur in some pentanes and up to 50 ppm in some naphthas. It should be noted that the TLV is 0,5 ppm so the toxicity hazards, and the precautions necessary, are very similar to H2S.” Energy Institute (2004). HM 40 GUIDE-LINES FOR THE CRUDE OIL WASHING OF SHIPS’ TANKS AND THE HEATING OF CRUDE OIL BEING TRANSPORTED BY SEA. p. 17
2 HFA is the brand name of the oil additives sup-plied by WRT, a major Dutch additive supplier, which has a presence on four continents. “Mercaptans can cause many problems ranging from malodours to metal corrosion. Because of the volatility of mercaptans, they tend to evolve into vapour spaces, where their offensive odours create problems in and around storage areas and throughout pipelines and shipping systems used for transportation. Our additives remove mercaptans from all oil streams.” “wrtbv” (Accessed 3 November 2015)
3 Laboratory supervisor of a petrochemical laboratory who wishes to remain anonymous. For the purpose of our investigations we conducted several talks in 2014, 2015 and 2016 with two laboratory supervisors of a petrochemical laboratory in the Netherlands.
4 There is a European waste classification in which around 800 waste materials are mentioned and tagged with 6 digit waste codes. There is also an indication in the list when a particular waste material is hazardous. See “Commission Decision 2014/955/EU)”. The European list of wastes provides a common terminology throughout the Community with the purpose to improve the efficiency of waste management activities. The codes have an important impact on the transport of waste, installation permits (which are usually granted for the processing of specific waste codes), decisions about recyclability of the waste or as a basis for waste statistics.
ANNEX 3
1 Parts per million or ppm means out of a million. One ppm sulphur is equivalent to 1 milligram of sulphur per litre of fuel (mg/l) or 1 milligram of sulphur per kilogramme fuel (mg/kg).
2 The Angola diesel samples have also been analysed for polyaromatics. Since they were analysed by another laboratory using different testing methods, which focus on a small group of polyaromatics, the results cannot be compared with European limits or with each other. So we left these results out of this report.
3 The terms %m and %v represent respectively the mass fraction and the volume fraction.
4 The sample was tested for chlorides, meaning an organic compound containing at least one bonded atom of chlorine. The method used is to determine the presence of chloride in liquid hydrocarbons in concentrations ranging from approximately 0.3 to 1,000 ppm. The method determines the total organic chloride. Some inorganic chloride present as salts is not included. Except for fluoride, other halogens (like bromine, iodine and astatine) that may be present in the sample are defined as chloride.
5 The sample was tested for chlorides, meaning an organic compound containing at least
one bonded atom of chlorine. The method used is to determine the presence of chloride in liquid hydrocarbons in concentrations ranging from approximately 0.3 to 1,000 ppm. The method determines the total organic chloride. Some inorganic chloride present as salts is not included. Except for fluoride, other halogens (like bromine, iodine and astatine) that may be present in the sample are defined as chloride.
6 Since this is a high value, the laboratory analysed for zinc again in order to exclude the possibility that this was an outlying finding. The second finding confirmed the first finding.
7 AAS stands for Atomic Absorption Spectrome-try; a metal analysis technique in petroleum products, which measures a single element at a time.
8 ICP is also referred to as inductively coupled plasma optical emission spectrometry, or ICP-OES. This is a technique to analyse for metals in petroleum products by scanning for a range of metals all at one time.
9 We also sampled a few petrol stations, aiming to establish a connection with a Swiss trading company. As this could not be done with certainty, the findings of these samples are excluded from the interpretations in the report text (chapter 6). In Mozambique we also sampled a diesel fuel sold by Petromoc. Petromoc is the state owned downstream company of Mozambique, (in a joint venture with Puma to build storage capacity together). Petromoc was supplied by Vitol during the time of sampling (April 2014) but this evidence is not enough. In Togo, we sampled fuels sold by MRS, also possibly supplied by Vitol. For the same reason as for Mozambique, we left this sample aside.
10 Parts per million or ppm means out of a million. One ppm sulphur is equivalent to 1 milligram of sulphur per litre of fuel (mg/l) or 1 milligram of sulphur per kilogramme fuel (mg/kg).
11 The terms % m and %v represent respectively the mass fraction and the volume fraction.
12 Since this is a very high amount, we wanted to test the sample again in order to exclude any outlying finding. But, due to a shortage of sample material, this was not possible.
13 At the time this sample was taken, an interim limit of 2 mg of manganese per liter of fuel was applicable in the EU. 20.4 mg/l was reported by the lab, this is equivalent to 26 mg/kg.
14 Sample is tested for chlorides, meaning an organic compound containing at least one bonded atom of chlorine. The method used is for determining chloride in liquid hydrocarbons at concentrations ranging from approximately 0.3 to 1,000 ppm. The method determines the total organic chloride. Some inorganic chloride present as salts is not included. Except for fluoride, other halogens (like bromine, iodine and astatine) that may be present in the sample are defined as chloride.
15 In 2009, the European Union adopted amendments to its fuel quality directive that set an interim limit of 6 mg of manganese per litre of fuel, falling to 2 mg/l in 2014, and demanded the labelling of fuels that contain metallic additives. 2.1 mg/kg is equivalent to 1.6 mg/l and would fall within the European limit.
16 AAS stands for Atomic Absorption Spectrome-try; a metal analysis technique in petroleum
products, which measures a single element at a time.
17 At the time this sample was taken, an interim limit of 6 mg of manganese per liter of fuel was applicable in the EU. 61 mg/kg is equivalent to 47 mg/l.
18 ICP is also referred to as inductively coupled plasma optical emission spectrometry, or ICP-OES. This is a technique to analyse for metals in petroleum products by scanning for a range of metals all at one time.
19 2.5 mg/kg is equivalent to 1.9 mg/l.20 We also sampled a few petrol stations, aiming
to establish a connection with a Swiss trading company. Since this could not be done with any certainty, the findings of these samples are excluded from the interpretations in the report text (chapter 6). In Togo, we sampled fuels sold by MRS, possibly supplied by Vitol, but this evidence was not enough.
ANNEX 4
1 This appendix is based on information required from training documentation from a specialised training company in the field of oil products and subsequent meetings and correspondence with the trainers Paul Deelen and Ton Visser, refinery literature like Energy Intelligence Research, 2011, “Energy Fundamen-tals: Understanding The Oil & Gas Industries, 5th Edition” and talks to industry sources.
2 Oil & Gas Journal Dec 2001 3 If the refinery has processes to process the
LPG fractions of the cat cracker into alkylate, MTBE or polymerate (all three gasoline components), it would produce the highest gasoline output.
4 Newsarticle “ORPIC completes installation of Oman’s first hydrocracker” Oil and Gas Journal, 17 August 2015 by Robert Brelsford, www.ogj.com/articles/2015/08/orpic-comple-tes-installation-of-oman-s-first-hydrocracker.html (Accessed 14 September 2015).
ANNEX 5
1 Fundamentals of Petroleum Refining, by Fahim et al. (2010)


PUBLIC EYE (formerly the Berne Declaration) is a non-profit, independent Swiss organisation with around 25,000 members. Public Eye has been campaigning for more equitable relations between Switzerland and underprivileged countries for more than forty years. Among its most important concerns are the global safeguarding of human rights, the socially and ecologically responsible conduct of business enterprises and the promotion of fair economic relations. www.publiceye.ch
Avenue Charles-Dickens 4CH-1006 Lausanne Phone +41 (0)21 620 03 03 Fax +41 (0)21 620 03 [email protected]
Dienerstrasse 12Postfach | CH-8021 ZurichPhone +41 (0)44 2 777 999Fax +41 (0)44 2 777 [email protected]
Swiss commodity trading companies take advantage of weak fuel standards in Africa to produce, deliver and sell diesel and gasoline, which is damaging to people’s health. Their business model relies on an illegi timate strategy of deliberately lowering the quality of fuels in order to increase their profits. Using a common industry practice called blending, trading companies mix cheap but toxic intermediate petroleum products to make what the industry calls “African Quality” fuels. These intermediate products contain high levels of sulphur as well as other toxic substances such as benzene and aromatics. By selling such fuels at the pump in Africa, the traders increase outdoor air pollution, causing respiratory disease and premature death. This affects West Africa in particular, because this is the region where the authorised levels of sulphur in fuels remain very high. West Africa does not have the refining capacity to produce enough petroleum and diesel for its own consumption, and so it must import the majority of its fuels from Europe and the US, where fuel standards are strict.