Embed Size (px)
Citation preview
8/13/2019 DIRECTV InvestorDay Dec 12 2013 Print (1)
http://slidepdf.com/reader/full/directv-investorday-dec-12-2013-print-1 1/87
DIRECTV Investor DayDecember 12, 2013
DIRECTV Investor DayMartin SheehanVice President,Investor Relations
All trademarks and service marks are the property of their respective owners
8/13/2019 DIRECTV InvestorDay Dec 12 2013 Print (1)
http://slidepdf.com/reader/full/directv-investorday-dec-12-2013-print-1 2/87
3
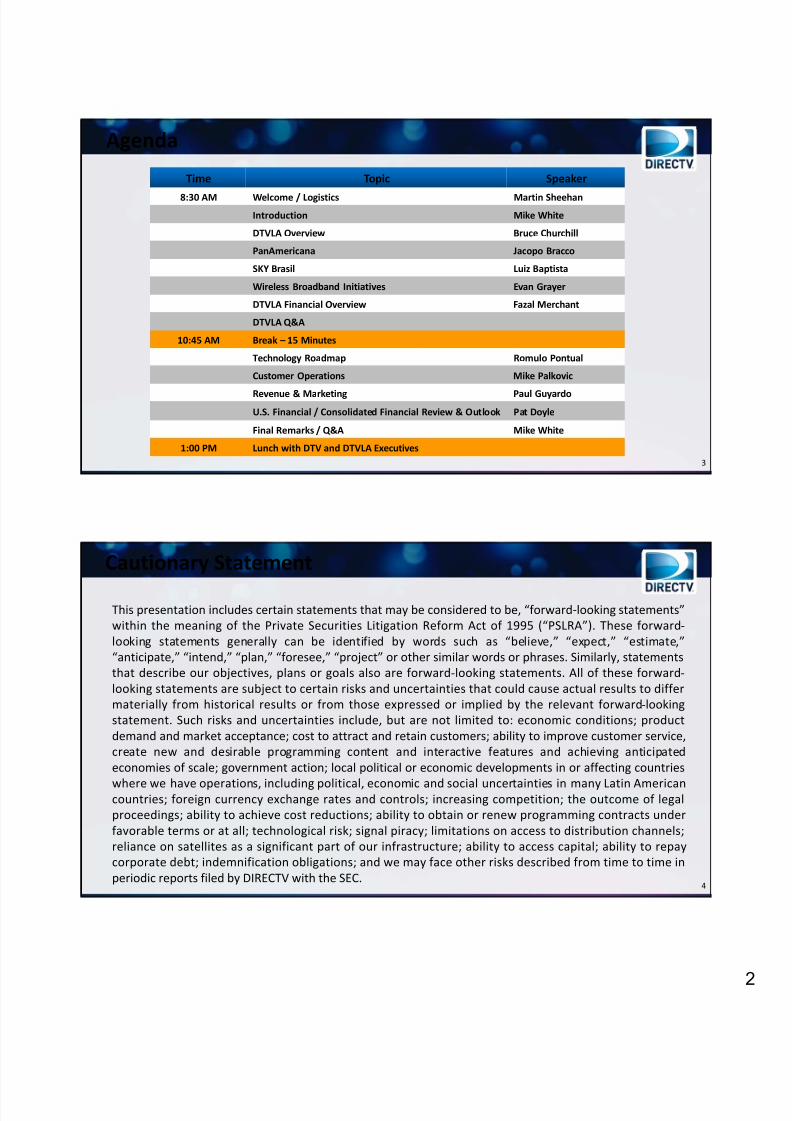
Agenda
Time Topic Speaker
8:30 AM Welcome / Logistics Martin SheehanIntroduction Mike White
DTVLA Overview Bruce Churchill
PanAmericana Jacopo Bracco
SKY Brasil Luiz Baptista
Wireless Broadband Initiatives Evan Grayer
DTVLA Financial Overview Fazal Merchant
DTVLA Q&A
10:45 AM Break – 15 Minutes
Technology Roadmap Romulo Pontual
Customer Operations Mike Palkovic
Revenue & Marketing Paul GuyardoU.S. Financial / Consolidated Financial Review & Outlook Pat Doyle
Final Remarks / Q&A Mike White
1:00 PM Lunch with DTV and DTVLA Executives
4
Cautionary Statement
This presentation includes certain statements that may be considered to be, “forward ‐looking statements”within the meaning of the Private Securities Litigation Reform Act of 1995 (“PSLRA”). These forward ‐looking statements generally can be identified by words such as “believe,” “expect,” “estimate,”“anticipate,” “intend,” “plan,” “foresee,” “project” or other similar words or phrases. Similarly, statementsthat describe our objectives, plans or goals also are forward ‐looking statements. All of these forward ‐looking statements are subject to certain risks and uncertainties that could cause actual results to differmaterially from historical results or from those expressed or implied by the relevant forward ‐lookingstatement. Such risks and uncertainties include, but are not limited to: economic conditions; productdemand and market acceptance; cost to attract and retain customers; ability to improve customer service,create new and desirable programming content and interactive features and achieving anticipatedeconomies of scale; government action; local political or economic developments in or affecting countries
where we have operations, including political, economic and social uncertainties in many Latin Americancountries; foreign currency exchange rates and controls; increasing competition; the outcome of legalproceedings; ability to achieve cost reductions; ability to obtain or renew programming contracts underfavorable terms or at all; technological risk; signal piracy; limitations on access to distribution channels;reliance on satellites as a significant part of our infrastructure; ability to access capital; ability to repaycorporate debt; indemnification obligations; and we may face other risks described from time to time inperiodic reports filed by DIRECTV with the SEC.
8/13/2019 DIRECTV InvestorDay Dec 12 2013 Print (1)
http://slidepdf.com/reader/full/directv-investorday-dec-12-2013-print-1 3/87
5
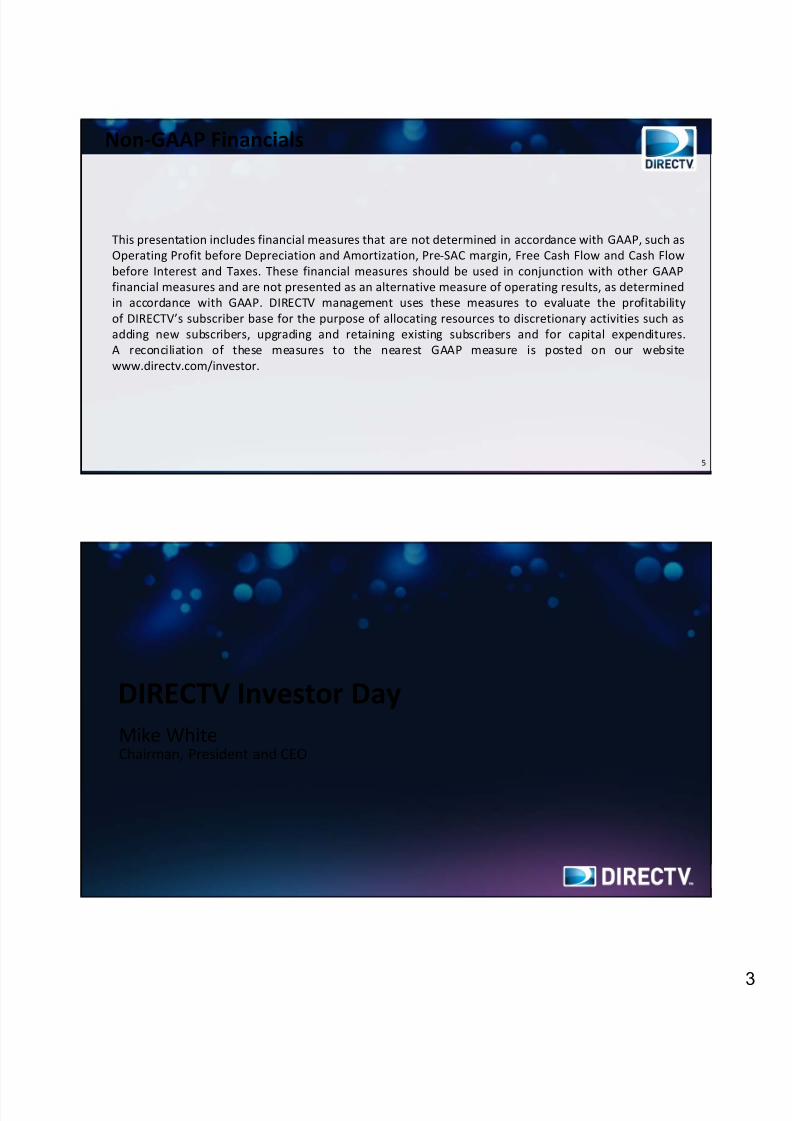
Non ‐GAAP Financials
This presentation includes financial measures that are not determined in accordance with GAAP, such asOperating Profit before Depreciation and Amortization, Pre ‐SAC margin, Free Cash Flow and Cash Flowbefore Interest and Taxes. These financial measures should be used in conjunction with other GAAPfinancial measures and are not presented as an alternative measure of operating results, as determinedin accordance with GAAP. DIRECTV management uses these measures to evaluate the profitabilityof DIRECTV’s subscriber base for the purpose of allocating resources to discretionary activities such asadding new subscribers, upgrading and retaining existing subscribers and for capital expenditures.A reconciliation of these measures to the nearest GAAP measure is posted on our websitewww.directv.com/investor.
DIRECTV Investor DayMike WhiteChairman, President and CEO
8/13/2019 DIRECTV InvestorDay Dec 12 2013 Print (1)
http://slidepdf.com/reader/full/directv-investorday-dec-12-2013-print-1 4/87
7
SKY Brasil (93% owned)
Subscribers: 5.4M
PanAmericana(100% owned)
Subscribers: 6.3M
SKY Mexico(41% owned)
Subscribers: 6.1M (Not consolidated)
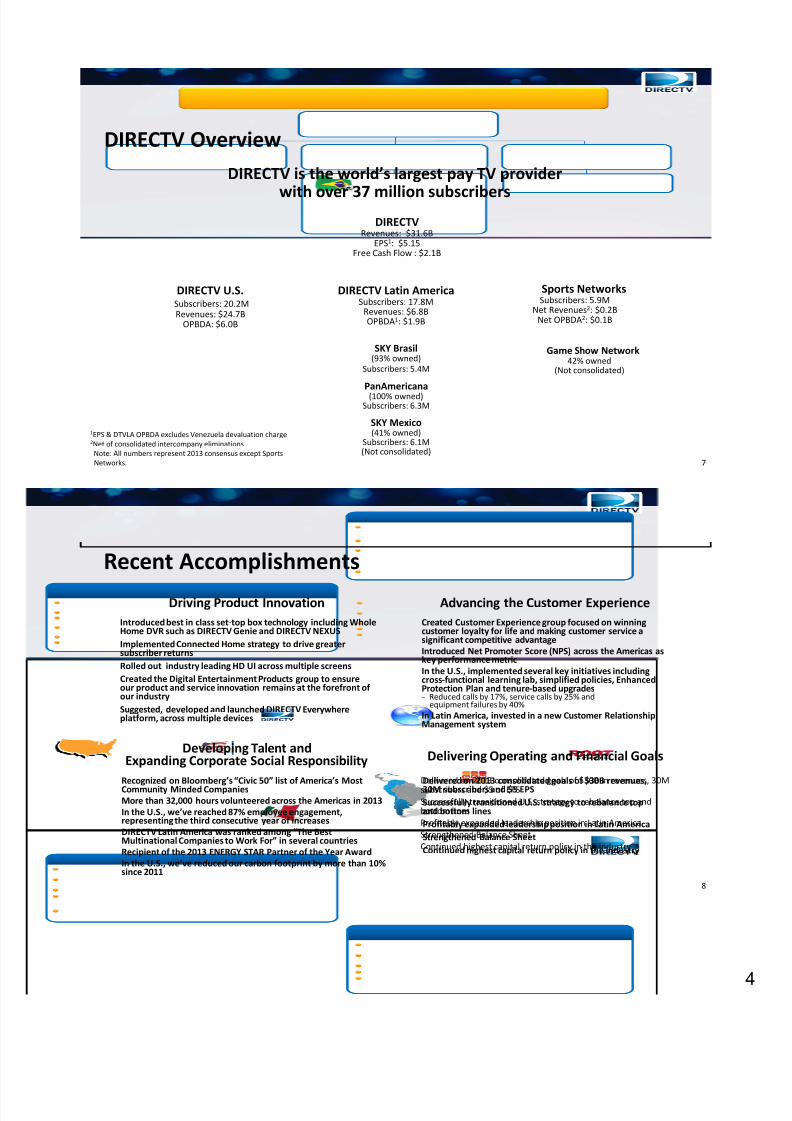
DIRECTV Overview
DIRECTV Revenues: $31.6B
EPS1: $5.15Free Cash Flow : $2.1B
DIRECTV Latin America Subscribers: 17.8M
Revenues: $6.8B OPBDA1: $1.9B
Sports Networks Subscribers: 5.9M
Net Revenues 2: $0.2BNet OPBDA2: $0.1B
Game Show Network42% owned
(Not consolidated)
DIRECTV U.S.Subscribers: 20.2MRevenues: $24.7B
OPBDA: $6.0B
1EPS & DTVLA OPBDA excludes Venezuela devaluation charge2Net of consolidated intercompany eliminationsNote: All numbers represent 2013 consensus except Sports Networks.
DIRECTV is the world’s largest pay TV provider
with over 37 million subscribers
8
Advancing the Customer Experience
Developing Talent and Expanding Corporate Social Responsibility
Recent Accomplishments
Created Customer Experience group focused on winning customer loyalty for life and making customer service a significant competitive advantageIntroduced Net Promoter Score (NPS) across the Americas as key performance metricIn the U.S., implemented several key initiatives including cross ‐functional learning lab, simplified policies, Enhanced Protection Plan and tenure ‐based upgrades – Reduced calls by 17%, service calls by 25% and
equipment failures by 40%In Latin America, invested in a new Customer Relationship Management system
Delivered on 2013 consolidated goals of $30B in revenues, 30M subscribers and $5 of EPSSuccessfully transitioned U.S. strategy to rebalance top and bottom linesProfitably expanded leadership position in Latin AmericaStrengthened Balance SheetContinued highest capital return policy in the industry
Recognized on Bloomberg’s “Civic 50” list of America’s Most Community Minded CompaniesMore than 32,000 hours volunteered across the Americas in 2013In the U.S., we’ve reached 87% employee engagement, representing the third consecutive year of increasesDIRECTV Latin America was ranked among “The Best Multinational Companies to Work For” in several countriesRecipient of the 2013 ENERGY STAR Partner of the Year AwardIn the U.S., we’ve reduced our carbon footprint by more than 10% since 2011
Delivering Operating and Financial Goals
Delivered on 2013 consolidated goals of $30B revenues, 30M subscribers and $5 EPSSuccessfully transitioned U.S. strategy to rebalance top and bottom linesProfitably expanded leadership position in Latin AmericaStrengthened Balance SheetContinued highest capital return policy in the industry
Driving Product InnovationIntroduced best in class set ‐top box technology including Whole Home DVR such as DIRECTV Genie and DIRECTV NEXUSImplemented Connected Home strategy to drive greater subscriber returnsRolled out industry leading HD UI across multiple screensCreated the Digital Entertainment Products group to ensure our product and service innovation remains at the forefront of our industrySuggested, developed and launched DIRECTV Everywhere platform, across multiple devices
8/13/2019 DIRECTV InvestorDay Dec 12 2013 Print (1)
http://slidepdf.com/reader/full/directv-investorday-dec-12-2013-print-1 5/87
9
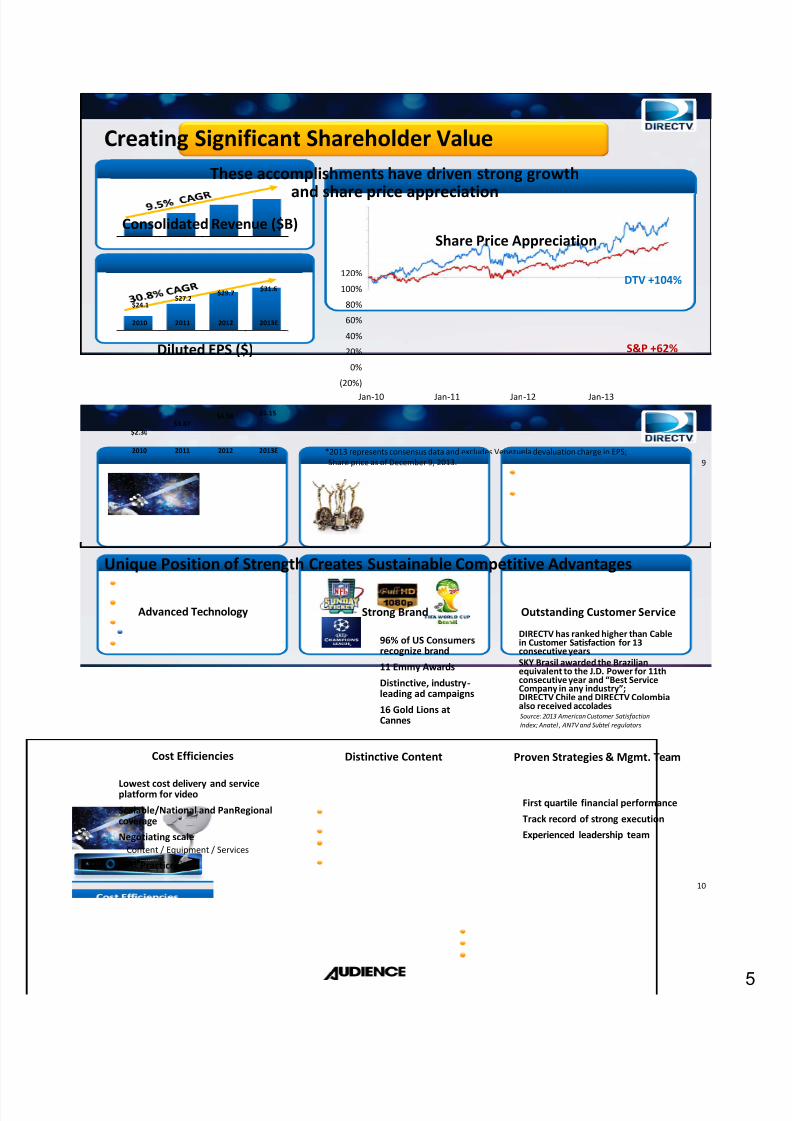
Creating Significant Shareholder Value
Share Price AppreciationConsolidated Revenue ($B)
Diluted EPS ($)
*2013 represents consensus data and excludes Venezuela devaluation charge in EPS; Share price as of December 9, 2013.
These accomplishments have driven strong growth
and share price appreciation
$24.1 $27.2 $29.7 $31.6
2010 2011 2012 2013E
$2.30$3.47
$4.58 $5.15
2010 2011 2012 2013E
120%
100%
80%
60%
40%
20%
0%
(20%)Jan ‐10 Jan ‐11 Jan ‐12 Jan ‐13
DTV +104%
S&P +62%
10
DIRECTV has ranked higher than Cable in Customer Satisfaction for 13 consecutive yearsSKY Brasil awarded the Brazilian equivalent to the J.D. Power for 11th consecutive year and “Best Service Company in any industry”; DIRECTV Chile and DIRECTV Colombia also received accoladesSource: 2013 American Customer Satisfaction Index; Anatel , ANTV and Subtel regulators
Outstanding Customer Service
Unique Position of Strength Creates Sustainable Competitive Advantages
Lowest cost delivery and service platform for video
Scalable/National and PanRegional coverage
Negotiating scaleContent / Equipment / Services
Best Practices
Cost Efficiencies Proven Strategies & Mgmt. Team
Strong Brand
Distinctive Content
Advanced Technology
First quartile financial performance
Track record of strong execution
Experienced leadership team
96% of US Consumers recognize brand
11 Emmy Awards
Distinctive, industry ‐leading ad campaigns
16 Gold Lions at Cannes
8/13/2019 DIRECTV InvestorDay Dec 12 2013 Print (1)
http://slidepdf.com/reader/full/directv-investorday-dec-12-2013-print-1 6/87
11
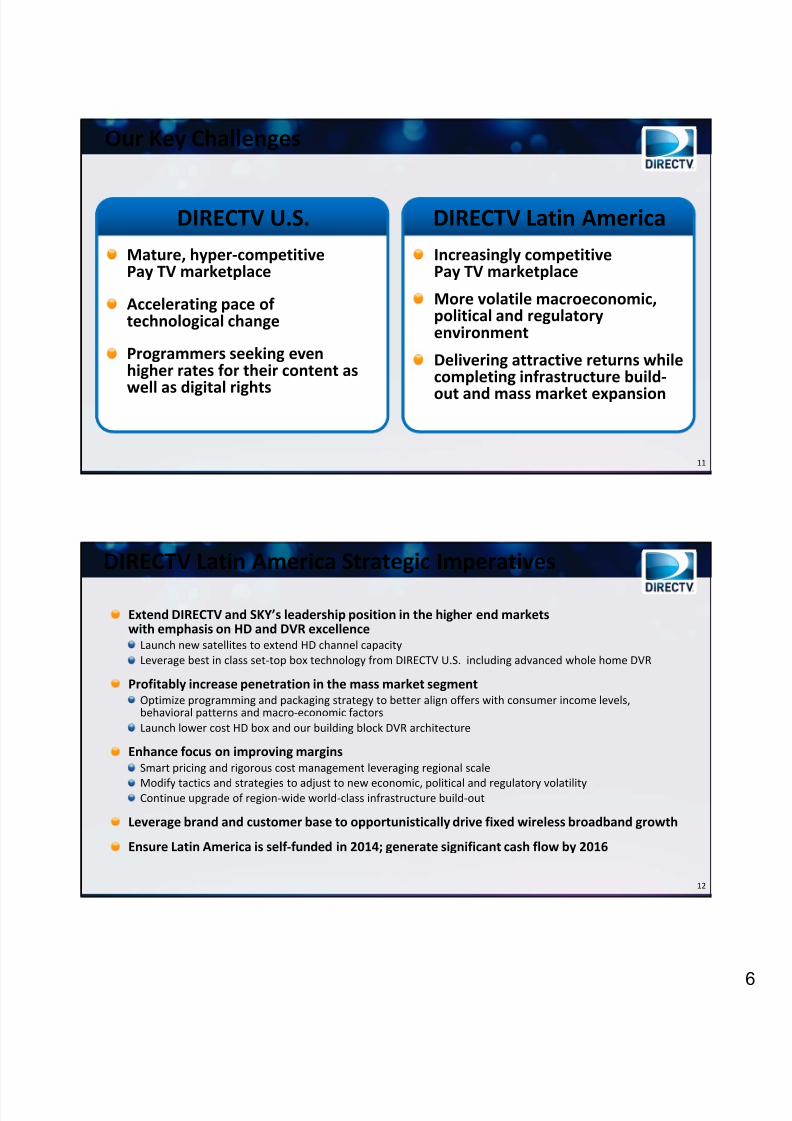
Our Key Challenges
Increasingly competitive Pay TV marketplace
More volatile macroeconomic, political and regulatory environment
Delivering attractive returns while completing infrastructure build ‐out and mass market expansion
Mature, hyper ‐competitive Pay TV marketplace
Accelerating pace of technological change
Programmers seeking even higher rates for their content as
well as
digital
rights
DIRECTV Latin AmericaDIRECTV U.S.
12
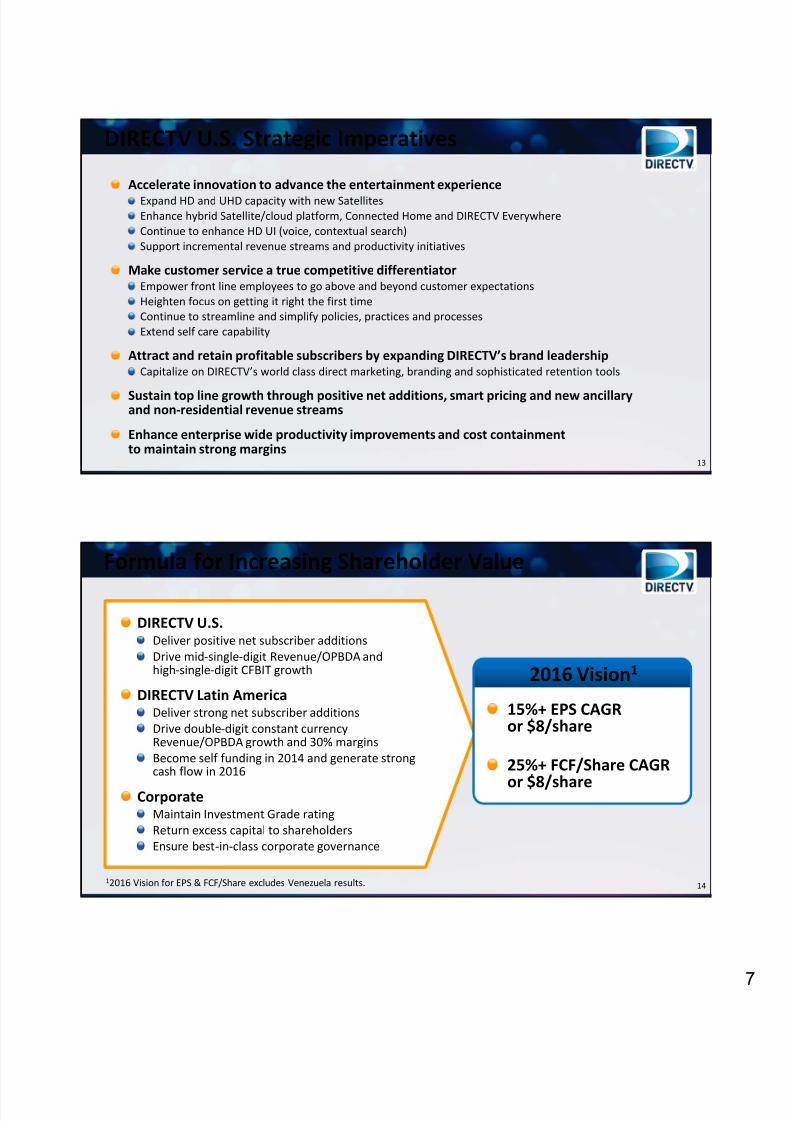
DIRECTV Latin America Strategic Imperatives
Extend DIRECTV and SKY’s leadership position in the higher end markets with emphasis on HD and DVR excellence
Launch new satellites to extend HD channel capacityLeverage best in class set ‐top box technology from DIRECTV U.S. including advanced whole home DVR
Profitably increase penetration in the mass market segment Optimize programming and packaging strategy to better align offers with consumer income levels, behavioral patterns and macro ‐economic factorsLaunch lower cost HD box and our building block DVR architecture
Enhance focus on improving marginsSmart pricing and rigorous cost management leveraging regional scale
Modify tactics and strategies to adjust to new economic, political and regulatory volatilityContinue upgrade of region ‐wide world ‐class infrastructure build ‐out
Leverage brand and customer base to opportunistically drive fixed wireless broadband growth
Ensure Latin America is self ‐funded in 2014; generate significant cash flow by 2016
8/13/2019 DIRECTV InvestorDay Dec 12 2013 Print (1)
http://slidepdf.com/reader/full/directv-investorday-dec-12-2013-print-1 7/87
13
DIRECTV U.S. Strategic Imperatives
Accelerate innovation to advance the entertainment experienceExpand HD and UHD capacity with new SatellitesEnhance hybrid Satellite/cloud platform, Connected Home and DIRECTV Everywhere Continue to enhance HD UI (voice, contextual search)Support incremental revenue streams and productivity initiatives
Make customer service a true competitive differentiatorEmpower front line employees to go above and beyond customer expectationsHeighten focus on getting it right the first timeContinue to streamline and simplify policies, practices and processesExtend self care capability
Attract and retain profitable subscribers by expanding DIRECTV’s brand leadership Capitalize on DIRECTV’s world class direct marketing, branding and sophisticated retention tools
Sustain top line growth through positive net additions, smart pricing and new ancillary and non ‐residential revenue streams
Enhance enterprise wide productivity improvements and cost containment to maintain strong margins
14
Formula for Increasing Shareholder Value
DIRECTV U.S.Deliver positive net subscriber additionsDrive mid‐single ‐digit Revenue/OPBDA and high‐single ‐digit CFBIT growth
DIRECTV Latin AmericaDeliver strong net subscriber additionsDrive double ‐digit constant currency Revenue/OPBDA growth and 30% marginsBecome self funding in 2014 and generate strong cash flow in 2016
CorporateMaintain Investment Grade ratingReturn excess capital to shareholdersEnsure best ‐in‐class corporate governance
2016 Vision 1
15%+ EPS CAGR or $8/share
25%+ FCF/Share CAGR
or $8/share
12016 Vision for EPS & FCF/Share excludes Venezuela results.
8/13/2019 DIRECTV InvestorDay Dec 12 2013 Print (1)
http://slidepdf.com/reader/full/directv-investorday-dec-12-2013-print-1 8/87
DIRECTV Latin America Investor DayBruce ChurchillPresident, DIRECTV Latin America
16
Agenda
DTVLA Investor Day Agenda
Market Overview and Update Bruce Churchill
DIRECTV PanAmericana Jacopo Bracco
SKY Brasil Luiz E. Baptista da Rocha
Broadband Evan Grayer
Financial Overview Fazal Merchant
DTVLA Q&A Executive Team
16
8/13/2019 DIRECTV InvestorDay Dec 12 2013 Print (1)
http://slidepdf.com/reader/full/directv-investorday-dec-12-2013-print-1 9/87
17
Platform Overview
17
18
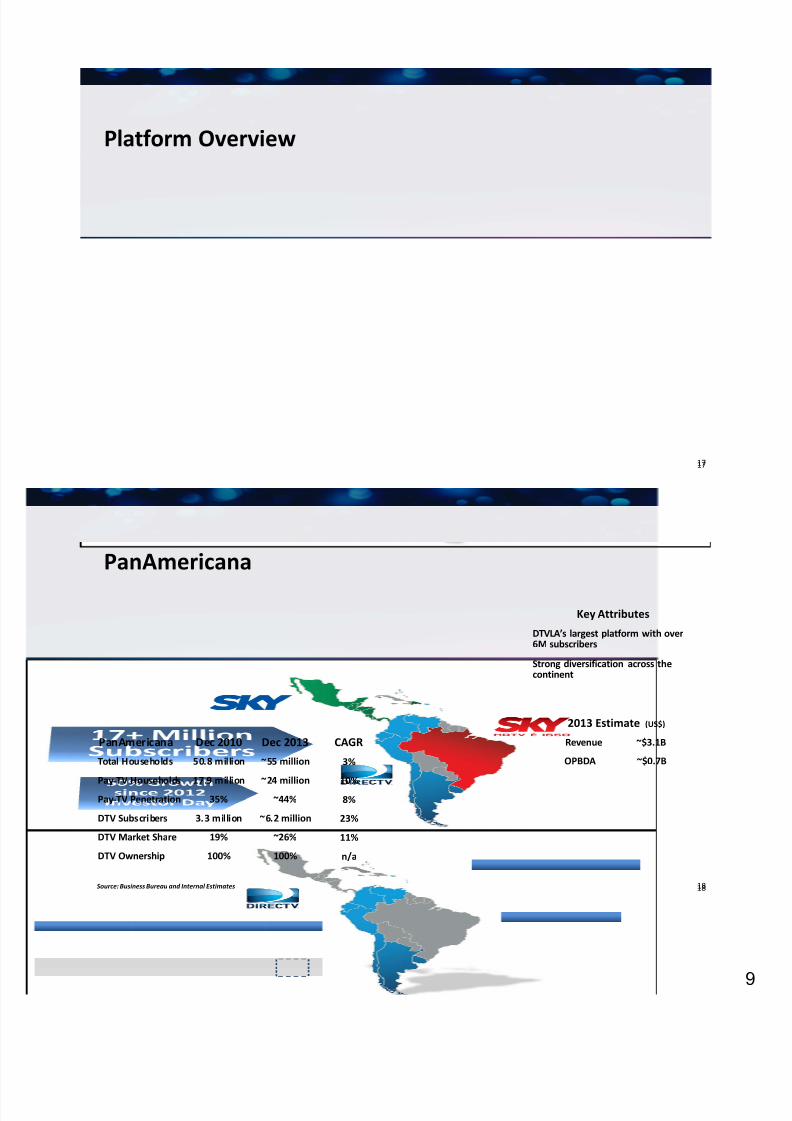
PanAmericana
PanAmericana Dec 2010 Dec 2013 CAGR
Total Households 50.8 million ~55 million 3%
Pay‐TV Households 17.9 million ~24 million 10%
Pay‐TV Penetration 35% ~44% 8%
DTV Subscribers 3.3 million ~6.2 million 23%
DTV Market Share 19% ~26% 11%
DTV Ownership 100% 100% n/a
Key Attributes
DTVLA’s largest platform with over 6M subscribers
Strong diversification across the continent
2013 Estimate (US$)
Revenue ~$3.1B
OPBDA ~$0.7B
Source: Business Bureau and Internal Estimates 18
8/13/2019 DIRECTV InvestorDay Dec 12 2013 Print (1)
http://slidepdf.com/reader/full/directv-investorday-dec-12-2013-print-1 10/871
19
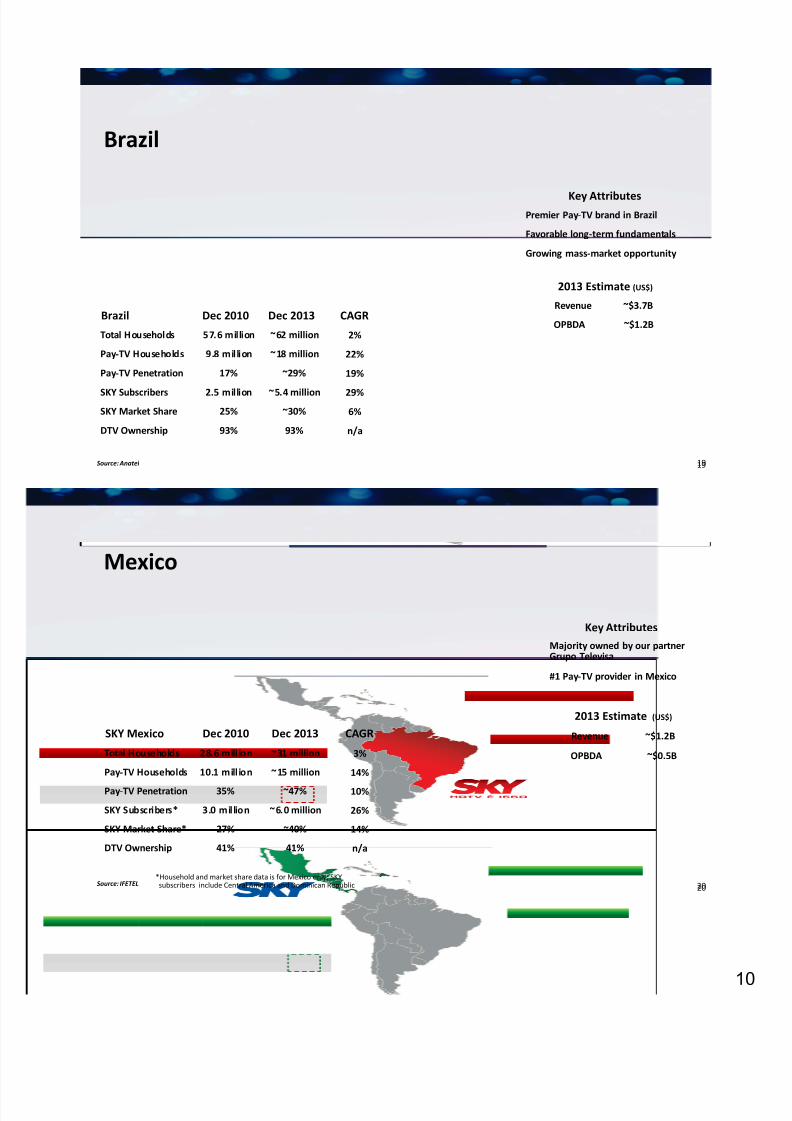
Brazil
Brazil Dec 2010 Dec 2013 CAGR
Total Households 57.6 million ~62 million 2%
Pay‐TV Households 9.8 million ~18 million 22%
Pay‐TV Penetration 17% ~29% 19%
SKY Subscribers 2.5 million ~5.4 million 29%SKY Market Share 25% ~30% 6%
DTV Ownership 93% 93% n/a
Key Attributes Premier Pay‐TV brand in Brazil
Favorable long ‐term fundamentals
Growing mass ‐market opportunity
2013 Estimate (US$)
Revenue ~$3.7B
OPBDA ~$1.2B
Source: Anatel 19
20
SKY Mexico Dec 2010 Dec 2013 CAGR
Total Households 28.6 million ~31 million 3%
Pay‐TV Households 10.1 million ~15 million 14%
Pay‐TV Penetration 35% ~47% 10%
SKY Subscribers* 3.0 million ~6.0 million 26%
SKY Market Share* 27% ~40% 14%
DTV Ownership 41% 41% n/a
Mexico
Key AttributesMajority owned by our partner Grupo Televisa
#1 Pay‐TV provider in Mexico
*Household and market share data is for Mexico only; SKY subscribers include Central America and Dominican Republic
2013 Estimate (US$)
Revenue ~$1.2B
OPBDA ~$0.5B
Source: IFETEL 20
8/13/2019 DIRECTV InvestorDay Dec 12 2013 Print (1)
http://slidepdf.com/reader/full/directv-investorday-dec-12-2013-print-1 11/871
21
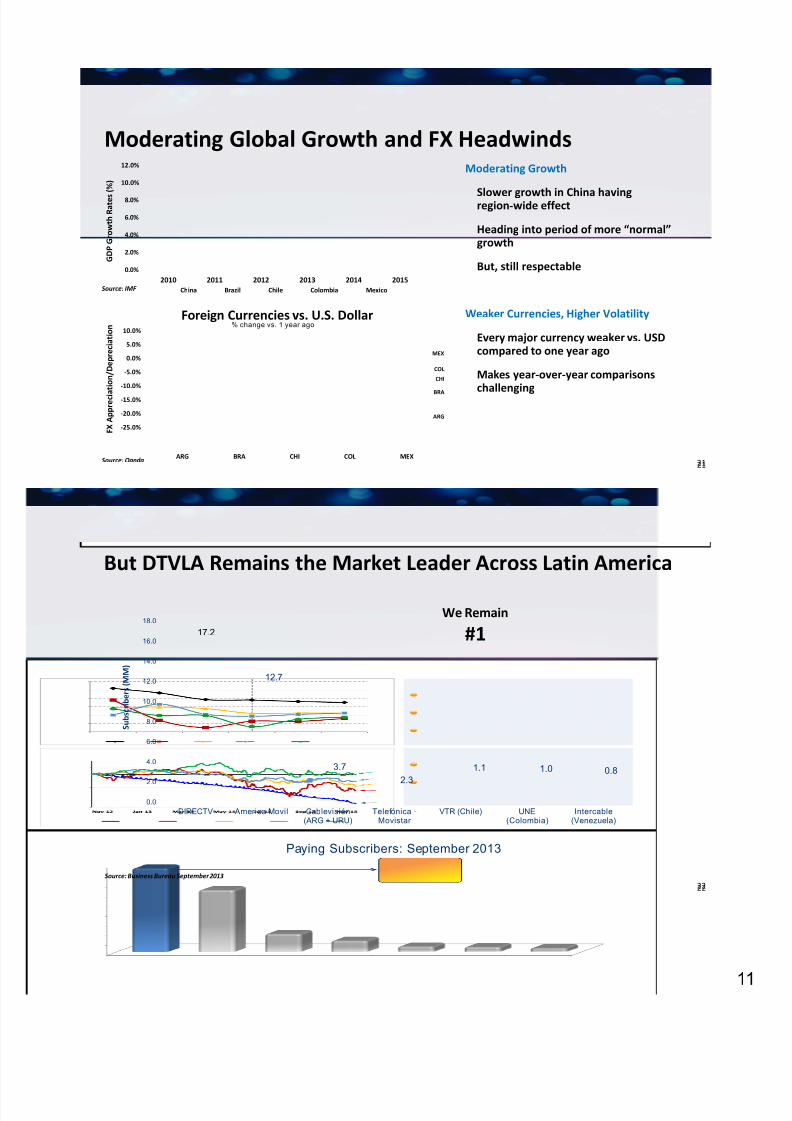
‐25.0%
‐20.0%
‐15.0%
‐10.0%
‐5.0%
0.0%
5.0%
10.0%
Foreign Currencies vs. U.S. Dollar
ARG BRA CHI COL MEX
% change vs. 1 year ago
MEX
COL
CHI
ARG
BRA
0.0%
2.0%
4.0%
6.0%
8.0%
10.0%
12.0%
2010 2011 2012 2013 2014 2015China Brazil Chile Colombia Mexico
Moderating Global Growth and FX HeadwindsModerating Growth
Slower growth
in
China
having
region ‐wide effect
Heading into period of more “normal” growth
But, still respectable
Source: IMF
G D P G r o w t h R a t e s
( % )
F X A p p r e c i a t i o n
/ D e p r e c i a t i o n
Source: Oanda
Weaker Currencies, Higher Volatility
Every major currency weaker vs. USD compared to one year ago
Makes year ‐over ‐year comparisons
challenging
21
22
But DTVLA Remains the Market Leader Across Latin America
0.0
2.0
4.0
6.0
8.0
10.0
12.0
14.0
16.0
18.0
DIRECTV America Movil Cablevisión(ARG + URU)
Telefónica -Movistar
VTR (Chile) UNE(Colombia)
Intercable(Venezuela)
17.2
12.7
3.72.3
1.1 1.0 0.8
We Remain
#1
Paying Subscribers: September 2013
S u b s c r i b e r s
( M M )
Source: Business Bureau September 2013
22
8/13/2019 DIRECTV InvestorDay Dec 12 2013 Print (1)
http://slidepdf.com/reader/full/directv-investorday-dec-12-2013-print-1 12/871
23
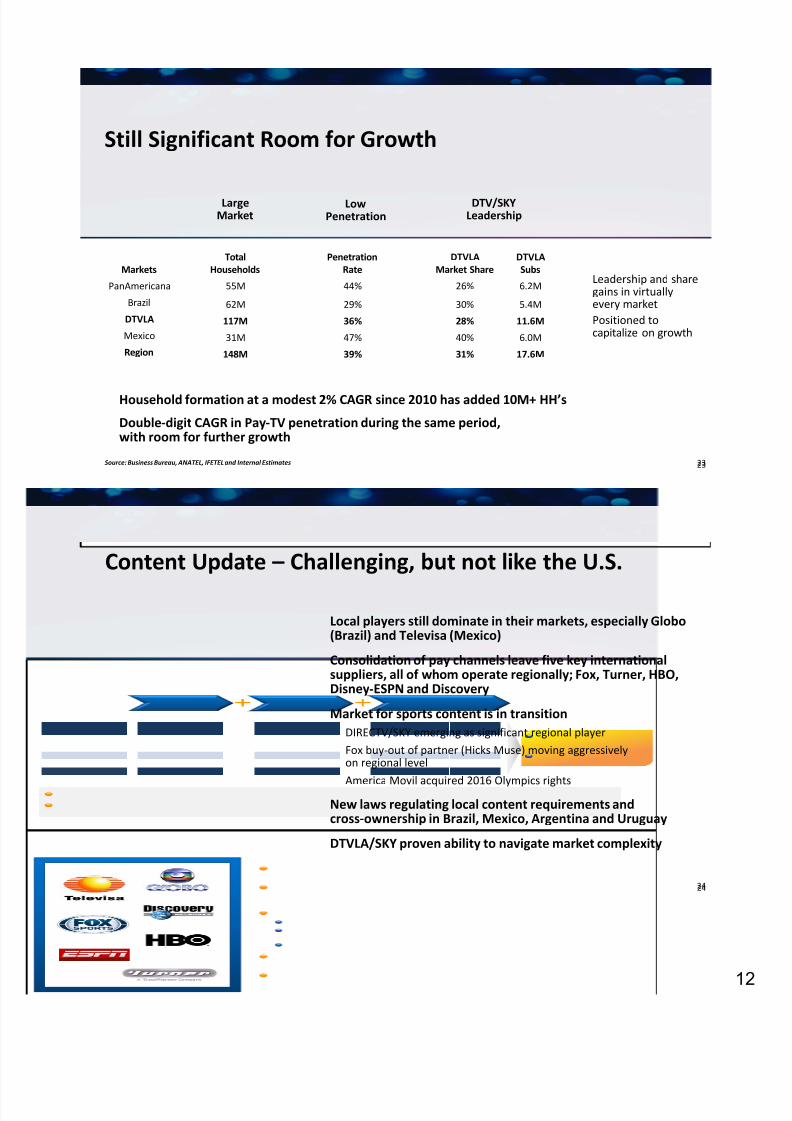
Leadership and share gains in virtually every marketPositioned to capitalize on growth
Still Significant Room for Growth
Large Market
Low Penetration
DTV/SKY Leadership
TotalHouseholds
55M
62M
117M
31M
148M
Markets
PanAmericana
Brazil
DTVLA
Mexico
Region
Penetration Rate
44%
29%
36%
47%
39%
DTVLAMarket Share
DTVLA Subs
26% 6.2M
30% 5.4M
28% 11.6M
40% 6.0M
31% 17.6M
Household formation at a modest 2% CAGR since 2010 has added 10M+ HH’s
Double ‐digit CAGR in Pay‐TV penetration during the same period, with room for further growth
Source: Business Bureau, ANATEL, IFETEL and Internal Estimates 23
24
Content Update – Challenging, but not like the U.S.
Local players still dominate in their markets, especially Globo (Brazil) and Televisa (Mexico)
Consolidation of pay channels leave five key international suppliers, all of whom operate regionally; Fox, Turner, HBO, Disney ‐ESPN and Discovery
Market for sports content is in transitionDIRECTV/SKY emerging as significant regional playerFox buy ‐out of partner (Hicks Muse) moving aggressively on regional level
America Movil
acquired
2016
Olympics
rights
New laws regulating local content requirements and cross ‐ownership in Brazil, Mexico, Argentina and Uruguay
DTVLA/SKY proven ability to navigate market complexity
24
8/13/2019 DIRECTV InvestorDay Dec 12 2013 Print (1)
http://slidepdf.com/reader/full/directv-investorday-dec-12-2013-print-1 13/871
25
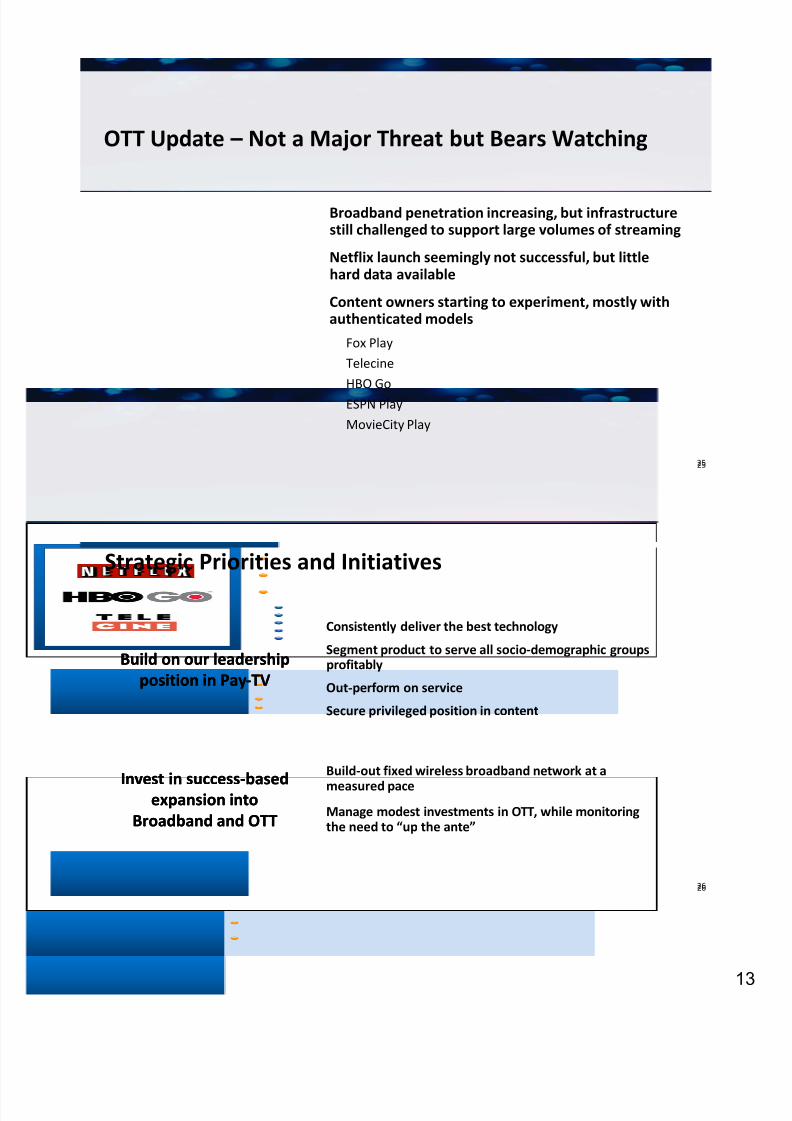
OTT Update – Not a Major Threat but Bears Watching
Broadband penetration increasing, but infrastructure still challenged to support large volumes of streaming
Netflix launch seemingly not successful, but little hard data available
Content owners starting to experiment, mostly with authenticated models
Fox PlayTelecineHBO GoESPN PlayMovieCity Play
25
26
Strategic Priorities and Initiatives
Consistently deliver the best technology
Segment product to serve all socio ‐demographic groups profitably
Out ‐perform on service
Secure privileged position in content
Build on our leadership position in Pay‐TV
Build on our leadership position in Pay‐TV
Build‐out fixed wireless broadband network at a
measured paceManage modest investments in OTT, while monitoring the need to “up the ante”
Invest in
success
‐based
expansion into
Broadband and OTT
Invest in
success
‐based
expansion into
Broadband and OTT
26
8/13/2019 DIRECTV InvestorDay Dec 12 2013 Print (1)
http://slidepdf.com/reader/full/directv-investorday-dec-12-2013-print-1 14/871
27
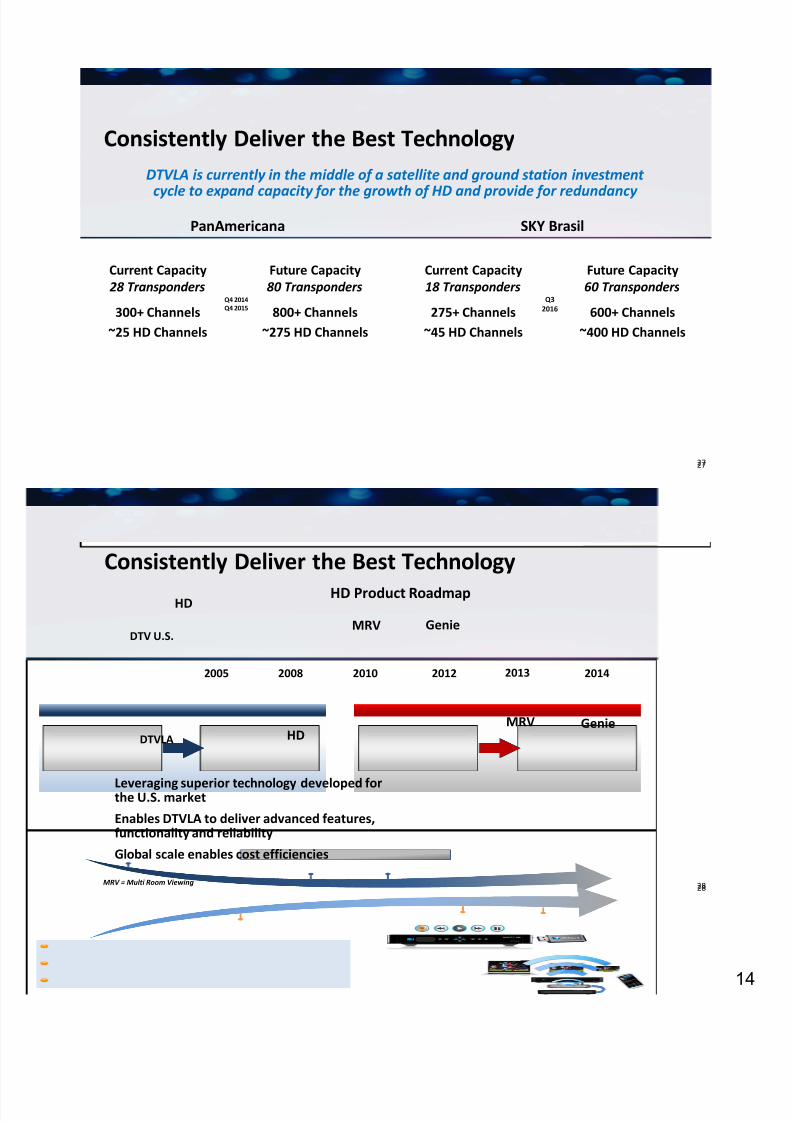
Future Capacity80 Transponders
800+ Channels~275 HD Channels
Consistently Deliver the Best Technology
Current Capacity28 Transponders
300+ Channels~25 HD Channels
DTVLA is currently in the middle of a satellite and ground station investment
cycle to
expand
capacity
for
the
growth
of
HD
and
provide
for
redundancy
Current Capacity18 Transponders
275+ Channels~45 HD Channels
Future Capacity60 Transponders
600+ Channels~400 HD Channels
Q3 2016
PanAmericana SKY Brasil
27
Q4 2014Q4 2015
28
Consistently Deliver the Best Technology
DTV U.S.
DTVLA HDMRV Genie
HD Product Roadmap
20102005 2012 2013 20142008
HD
MRV Genie
Leveraging superior technology developed for the U.S. market
Enables DTVLA to deliver advanced features, functionality and reliability
Global scale enables cost efficiencies
28MRV = Multi Room Viewing
8/13/2019 DIRECTV InvestorDay Dec 12 2013 Print (1)
http://slidepdf.com/reader/full/directv-investorday-dec-12-2013-print-1 15/871
29
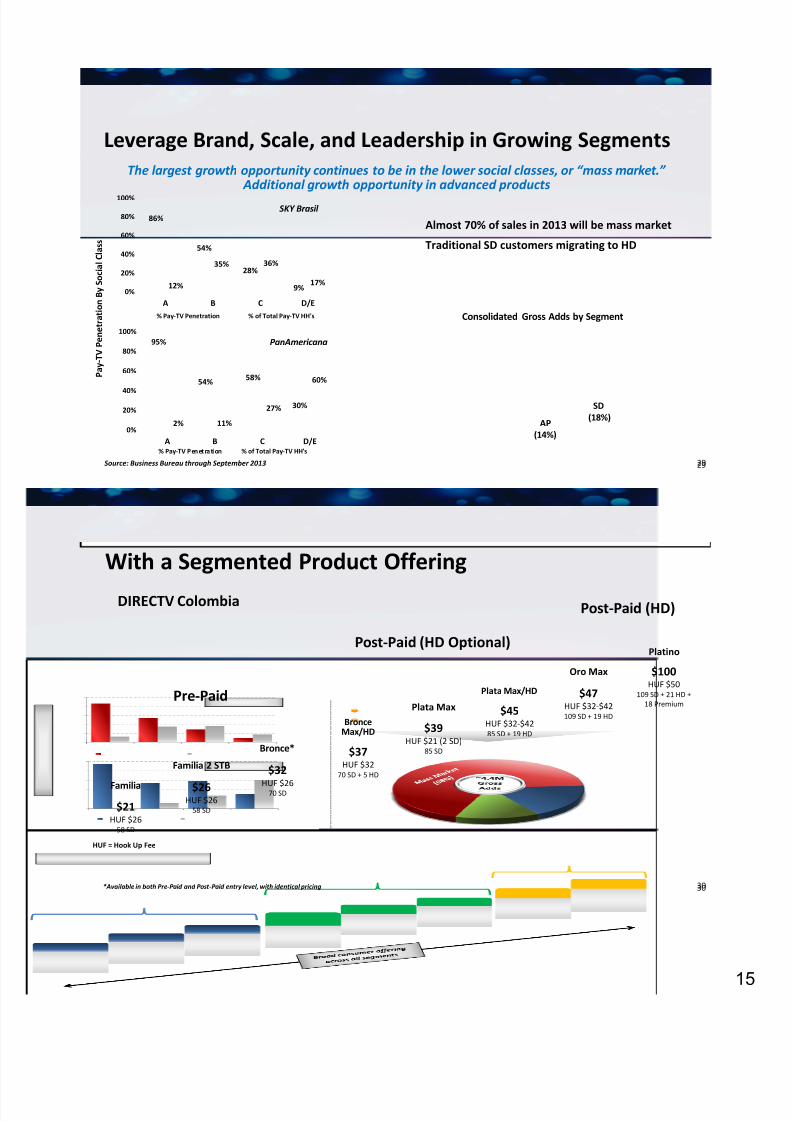
86%
54%
28%
9%12%
35% 36%
17%0%
20%
40%
60%
80%
100%
A B C D/E% Pay‐TV Penetration % of Total Pay‐TV HH's
95%
54% 58%
30%
2% 11%
27%
60%
0%
20%
40%
60%
80%
100%
A B C D/E% Pay‐TV Penetra tion % of Total Pay‐TV HH's
P a y ‐ T V P e n e t r a t i o n B y
S o c i a l C
l a s s
Leverage Brand, Scale, and Leadership in Growing Segments
SKY Brasil
PanAmericana
The largest growth opportunity continues to be in the lower social classes, or “mass market.” Additional growth opportunity in advanced products
Source: Business Bureau through September 2013
Almost 70% of sales in 2013 will be mass market
Traditional SD customers migrating to HD
SD(18%)AP
(14%)
Consolidated Gross Adds by Segment
29
30
With a Segmented Product Offering
DIRECTV Colombia
*Available in both Pre ‐Paid and Post ‐Paid entry level, with identical pricing
$47HUF $32 ‐$42109 SD + 19 HD
Oro Max
$21 HUF $26
58 SD
Familia $26HUF $26
58 SD
Familia 2 STB $32
HUF $2670 SD
Bronce*
$45HUF $32 ‐$4285 SD + 19 HD
Plata Max/HD
$100HUF $50
109 SD + 21 HD + 18 Premium
Platino
Pre ‐Paid
Post ‐Paid (HD Optional)
Post ‐Paid (HD)
$39HUF $21 (2 SD)
85 SD
Plata Max
$37HUF $32
70 SD + 5 HD
Bronce Max/HD
HUF = Hook Up Fee
30
8/13/2019 DIRECTV InvestorDay Dec 12 2013 Print (1)
http://slidepdf.com/reader/full/directv-investorday-dec-12-2013-print-1 16/871
31
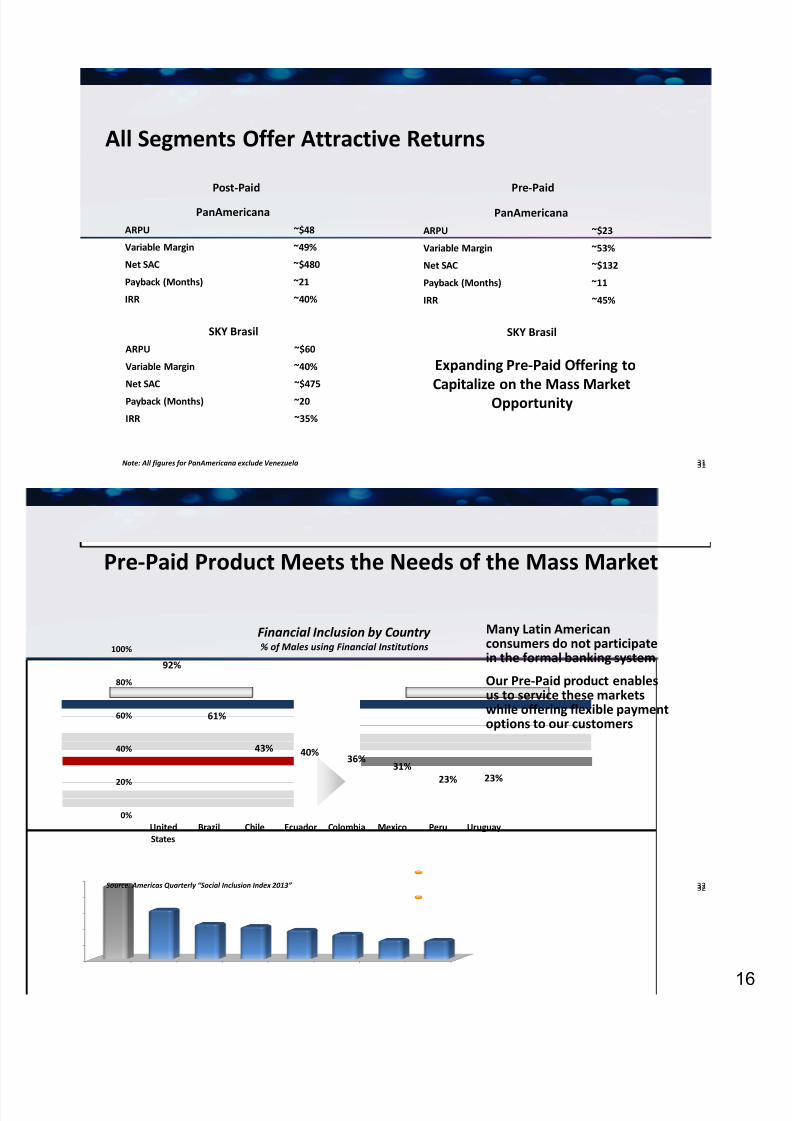
PanAmericanaARPU ~$48
Variable Margin ~49%
Net SAC ~$480
Payback (Months) ~21
IRR ~40%
PanAmericanaARPU ~$23
Variable Margin ~53%
Net SAC ~$132
Payback (Months) ~11
IRR ~45%
All Segments Offer Attractive Returns
Note: All figures for PanAmericana exclude Venezuela
SKY BrasilARPU ~$60
Variable Margin ~40%
Net SAC ~$475
Payback (Months) ~20
IRR ~35%
SKY Brasil
Expanding Pre ‐Paid Offering to Capitalize on the Mass Market
Opportunity
Post ‐Paid Pre ‐Paid
31
32
0%
20%
40%
60%
80%
100%
UnitedStates
Brazil Chile Ecuador Colombia Mexico Peru Uruguay
92%
61%
43% 40%36%
31%23% 23%
Source: Americas Quarterly “Social Inclusion Index 2013”
Financial Inclusion by Country % of Males using Financial Institutions
Many Latin American consumers do not participate in the formal banking system
Our Pre ‐Paid product enables us to service these markets while offering flexible payment options to our customers
Pre ‐Paid Product Meets the Needs of the Mass Market
32
8/13/2019 DIRECTV InvestorDay Dec 12 2013 Print (1)
http://slidepdf.com/reader/full/directv-investorday-dec-12-2013-print-1 17/871
33
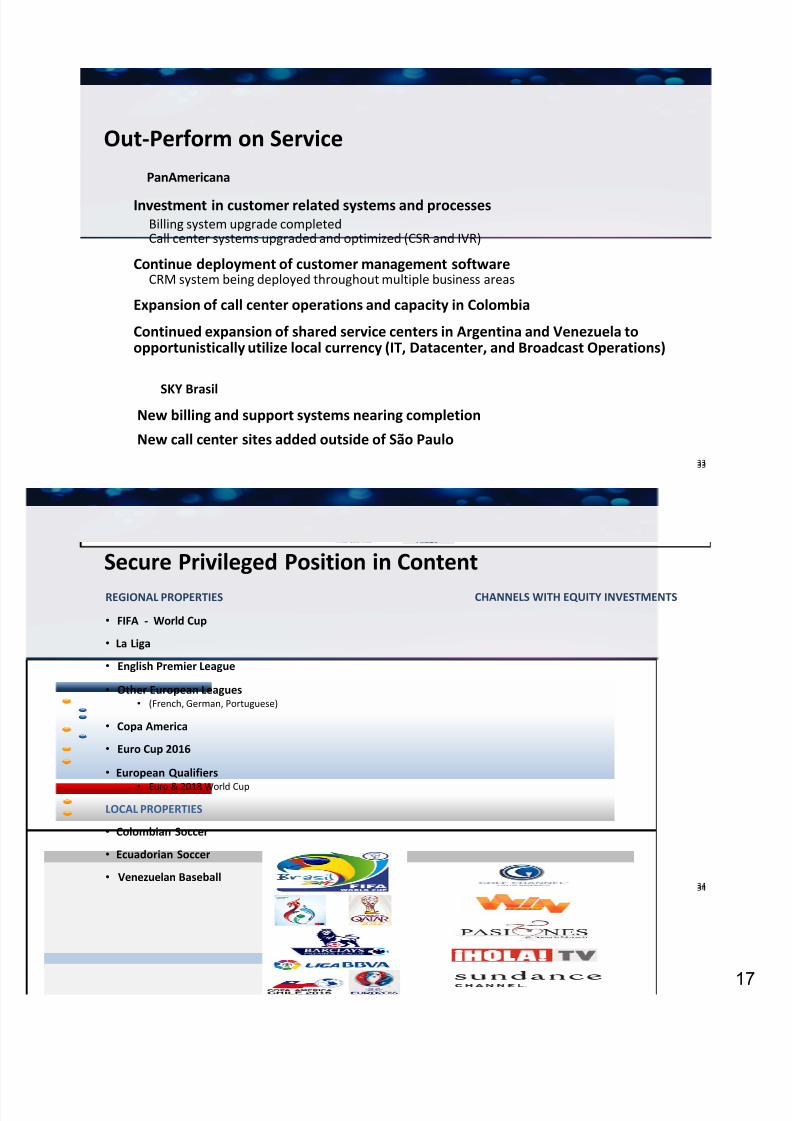
Out ‐Perform on Service
Investment in customer related systems and processesBilling system upgrade completedCall center systems upgraded and optimized (CSR and IVR)
Continue deployment of customer management softwareCRM system being deployed throughout multiple business areas
Expansion of call center operations and capacity in Colombia
Continued expansion of shared service centers in Argentina and Venezuela to opportunistically utilize local currency (IT, Datacenter, and Broadcast Operations)
New billing and support systems nearing completion
New call center sites added outside of São Paulo
PanAmericana
SKY Brasil
33
34
REGIONAL PROPERTIES
• FIFA ‐ World Cup
• La Liga
• English Premier League
• Other European Leagues• (French, German, Portuguese)
• Copa America
• Euro Cup 2016
• European Qualifiers• Euro & 2018 World Cup
LOCAL PROPERTIES
• Colombian Soccer
• Ecuadorian Soccer
• Venezuelan Baseball
Secure Privileged Position in Content CHANNELS WITH EQUITY INVESTMENTS
34
8/13/2019 DIRECTV InvestorDay Dec 12 2013 Print (1)
http://slidepdf.com/reader/full/directv-investorday-dec-12-2013-print-1 18/87
8/13/2019 DIRECTV InvestorDay Dec 12 2013 Print (1)
http://slidepdf.com/reader/full/directv-investorday-dec-12-2013-print-1 19/871
37
During our 2012 Investor Day we discussed three main objectives:
Expand our business in Colombia as PanAmericana’s next major marketCapture mass ‐market opportunity by enhancing customer segmentationLeverage operating scale advantages from regional platform synergies
Where we are today:We have more than doubled our subscriber base in ColombiaWe have increased our Gross Additions by ~45% and rolled out Pre ‐Paid in all markets We have improved the customer experience resulting in a 20%+ reduction in Calls per Subscriber and lower Post ‐Paid churn
And also:We have sustained our undisputed brand leadershipNew differentiated content has been addedWe have maintained our technology leadership with new product launches
PanAmericana Update
PanAmericana 37
38
Competition is evolvingCompetitors ramping up HD, with offers up to 50 channels35% of regional cable HH’s are digitalInexpensive triple plays are increasingA number of OTT platforms are coming online (e.g. Movistar Play, Claro Video)
A Strong Competitor Exists in Most Local Markets
PanAmericana 38
8/13/2019 DIRECTV InvestorDay Dec 12 2013 Print (1)
http://slidepdf.com/reader/full/directv-investorday-dec-12-2013-print-1 20/872
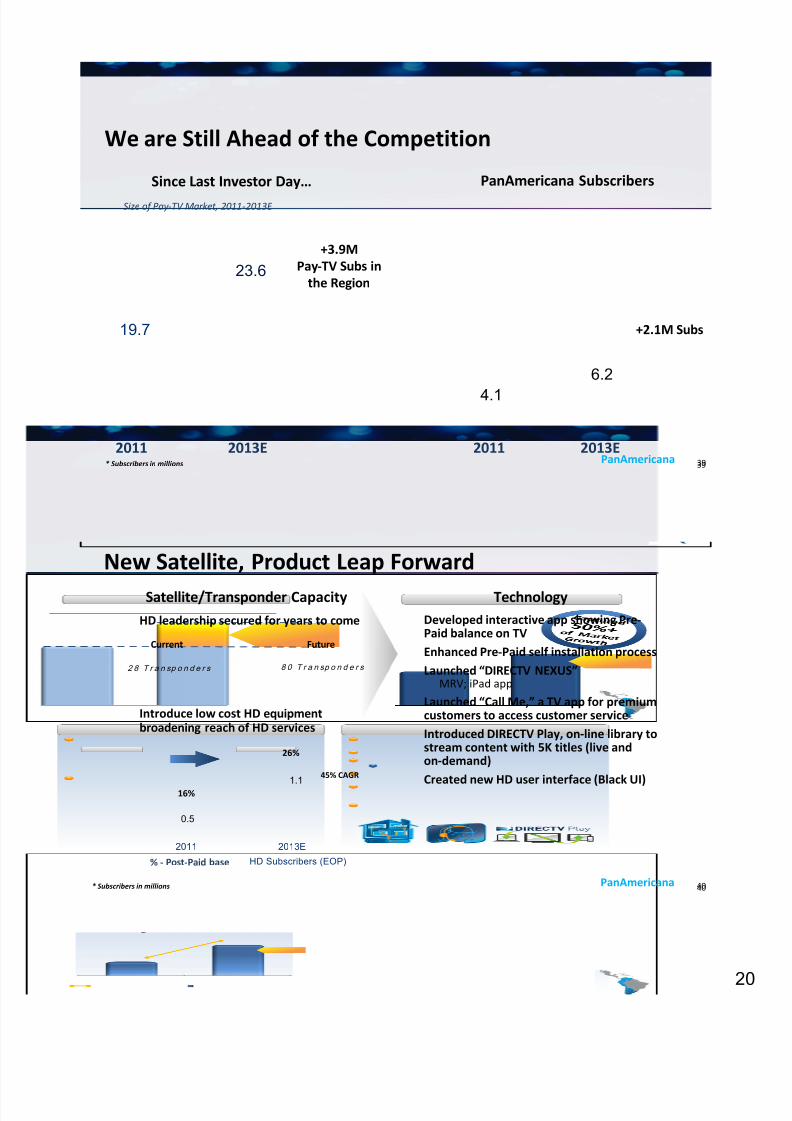
39
19.7
23.6
We are Still Ahead of the Competition
2011 2013E* Subscribers in millions
Since Last Investor Day…Size of Pay ‐TV Market, 2011 ‐2013E
+3.9M Pay‐TV Subs in
the Region
4.1
6.2
2011 2013E
PanAmericana Subscribers
+2.1M Subs
PanAmericana 39
40
HD leadership secured for years to come
Introduce low cost HD equipment broadening reach of HD services
New Satellite, Product Leap ForwardTechnologySatellite/Transponder Capacity
Developed interactive app showing Pre ‐Paid balance on TVEnhanced Pre ‐Paid self installation processLaunched “DIRECTV NEXUS”
MRV; iPad app
Launched “Call Me,” a TV app for premium customers to access customer serviceIntroduced DIRECTV Play, on ‐line library to stream content with 5K titles (live and on ‐demand)
Created new
HD
user
interface
(Black
UI)
2 8 T r a n sp o n d e r s 8 0 T r a n sp o n d e r s
FutureCurrent
2011 2013E
0.5
1.1
HD Subscribers (EOP)
16%
26%
% ‐ Post ‐Paid base
45% CAGR
* Subscribers in millions PanAmericana 40
8/13/2019 DIRECTV InvestorDay Dec 12 2013 Print (1)
http://slidepdf.com/reader/full/directv-investorday-dec-12-2013-print-1 21/872
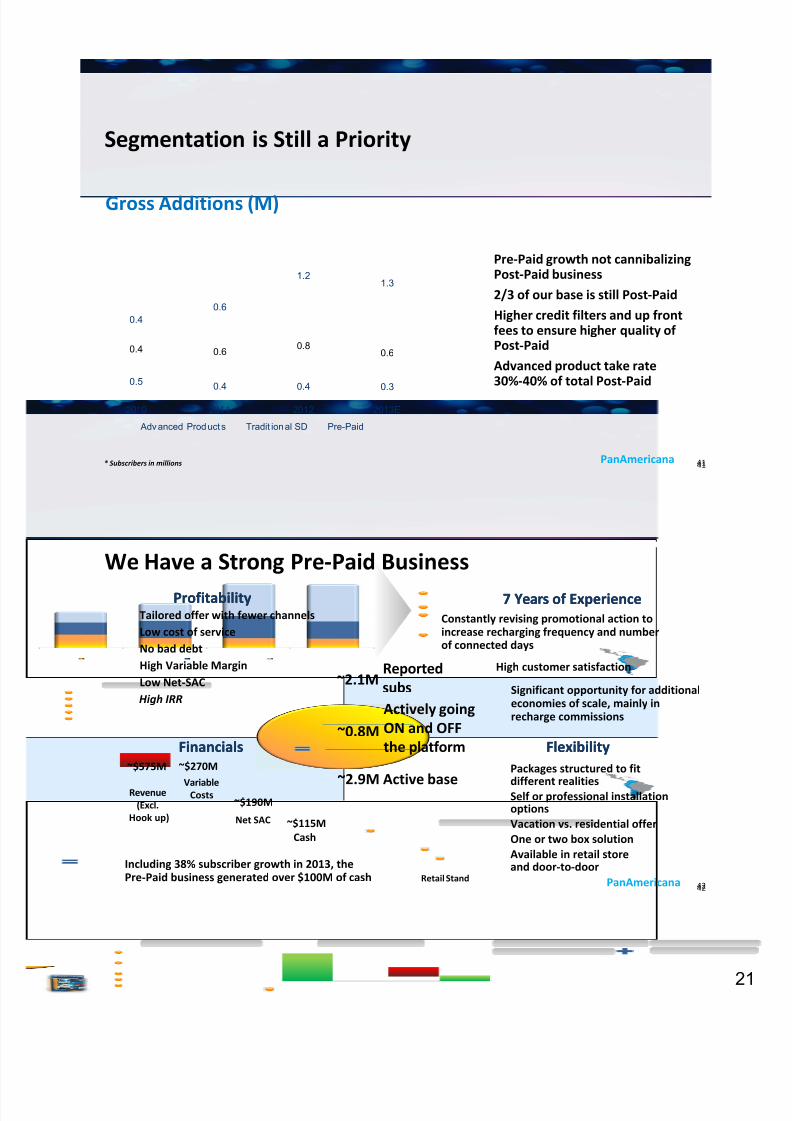
41
Segmentation is Still a Priority
Pre ‐Paid growth not cannibalizing Post ‐Paid business2/3 of our base is still Post ‐PaidHigher credit filters and up front fees to ensure higher quality of Post ‐PaidAdvanced product take rate 30%‐40% of total Post ‐Paid
2010 2011 2012 2013E
0.5 0.4 0.4 0.3
0.4 0.60.8
0.6
0.40.6
1.21.3
Adv anced Prod uct s Tradit ion al SD Pre-Paid
Gross Additions (M)
* Subscribers in millions PanAmericana 41
42PanAmericana
Variable Costs
Tailored offer with fewer channelsLow cost of serviceNo bad debtHigh Variable Margin Low Net ‐SACHigh IRR
We Have a Strong Pre ‐Paid Business
~0.8M
~2.9M Active base
Actively goingON and OFF the platform
~2.1M Reportedsubs
ProfitabilityProfitability
FinancialsFinancials
Revenue(Excl.
Hook up)
~$575M ~$270M
~$190M
Net SAC
Cash~$115M
Including 38% subscriber growth in 2013, the Pre ‐Paid business generated over $100M of cash
FlexibilityFlexibility
Retail Stand
Packages structured to fit
different realities
Self or professional installation optionsVacation vs. residential offerOne or two box solutionAvailable in retail store and door ‐to ‐door
7 Years of Experience7 Years of ExperienceConstantly revising promotional action to increase recharging frequency and number of connected days
Significant opportunity for additional economies of scale, mainly in recharge commissions
High customer satisfaction
42
8/13/2019 DIRECTV InvestorDay Dec 12 2013 Print (1)
http://slidepdf.com/reader/full/directv-investorday-dec-12-2013-print-1 22/87
8/13/2019 DIRECTV InvestorDay Dec 12 2013 Print (1)
http://slidepdf.com/reader/full/directv-investorday-dec-12-2013-print-1 23/872
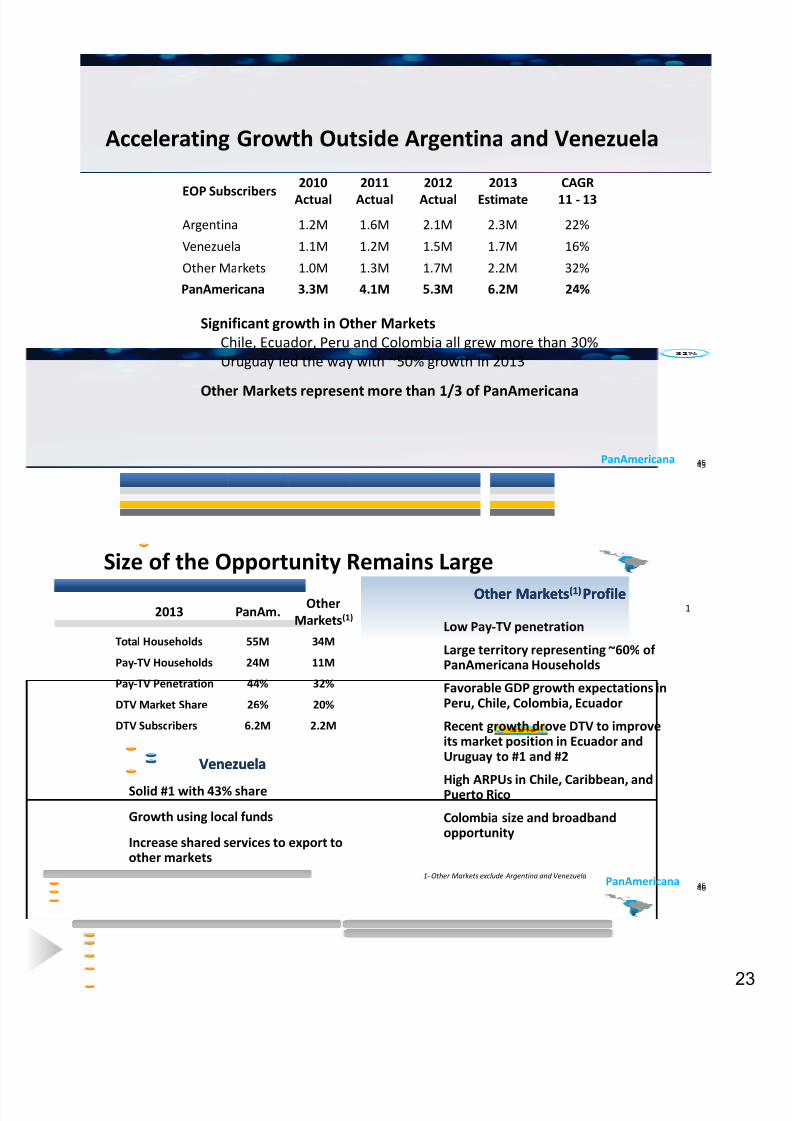
45
Accelerating Growth Outside Argentina and Venezuela
EOP Subscribers
2010Actual
2011Actual
2012Actual
2013Estimate
CAGR 11 ‐ 13
Argentina 1.2M 1.6M 2.1M 2.3M 22%
Venezuela 1.1M 1.2M 1.5M 1.7M 16%
Other Markets 1.0M 1.3M 1.7M 2.2M 32%
PanAmericana 3.3M 4.1M 5.3M 6.2M 24%
PanAmericana
Significant growth in Other MarketsChile, Ecuador, Peru and Colombia all grew more than 30%Uruguay led the way with ~50% growth in 2013
Other Markets represent more than 1/3 of PanAmericana
45
46
Size of the Opportunity Remains Large
2013 PanAm. Other Markets (1)
Total Households 55M 34M
Pay‐TV Households 24M 11M
Pay‐TV Penetration 44% 32%
DTV Market Share 26% 20%
DTV Subscribers 6.2M 2.2M
Low Pay‐TV penetration
Large territory representing ~60% of PanAmericana Households
Favorable GDP growth expectations in Peru, Chile, Colombia, Ecuador
Recent growth drove DTV to improve its market position in Ecuador and Uruguay to #1 and #2
High ARPUs
in
Chile,
Caribbean,
and
Puerto Rico
Colombia size and broadband opportunity
Other Markets (1) ProfileOther Markets (1) Profile1
1‐ Other Markets exclude Argentina and Venezuela
VenezuelaVenezuela
Solid #1 with 43% share
Growth using local funds
Increase shared services to export to other markets
PanAmericana46
8/13/2019 DIRECTV InvestorDay Dec 12 2013 Print (1)
http://slidepdf.com/reader/full/directv-investorday-dec-12-2013-print-1 24/872
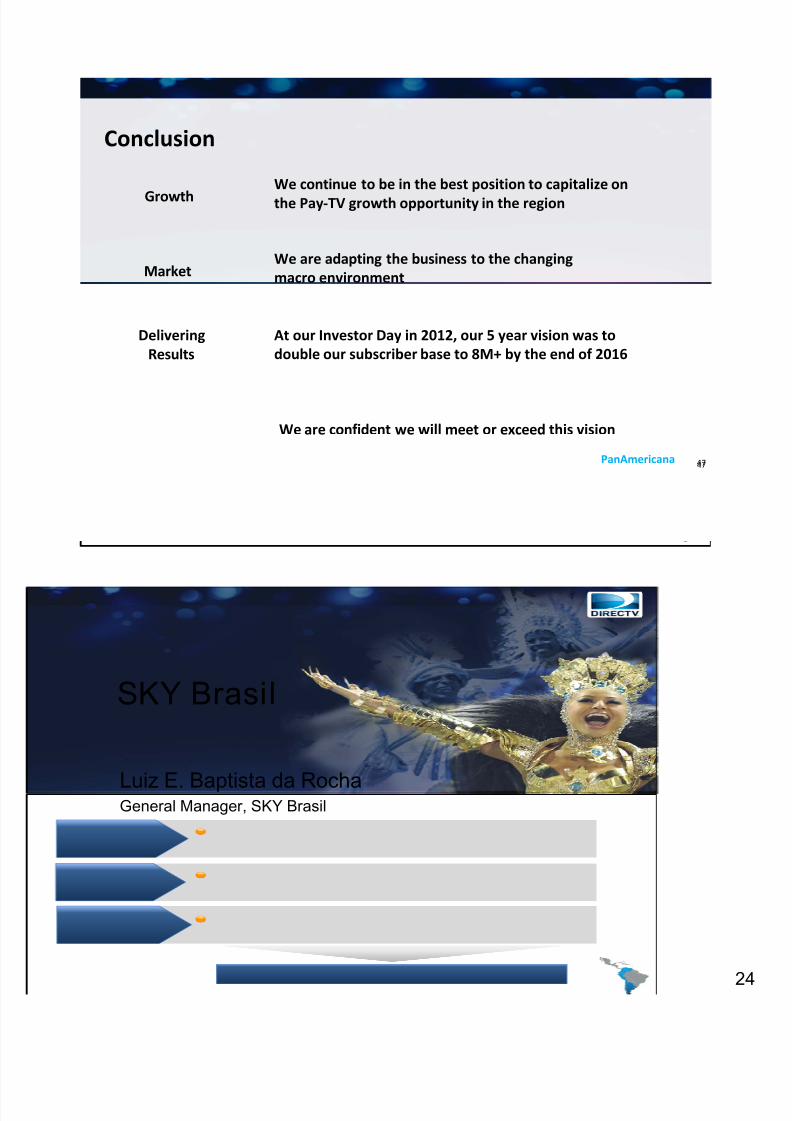
47
Conclusion
We are adapting the business to the changing macro environment
Growth
Delivering Results
Market
We continue to be in the best position to capitalize on the Pay‐TV growth opportunity in the region
At our Investor Day in 2012, our 5 year vision was to double our subscriber base to 8M+ by the end of 2016
PanAmericana
We are confident we will meet or exceed this vision
47
Luiz E. Baptista da RochaGeneral Manager, SKY Brasil
SKY Brasil
8/13/2019 DIRECTV InvestorDay Dec 12 2013 Print (1)
http://slidepdf.com/reader/full/directv-investorday-dec-12-2013-print-1 25/872
49
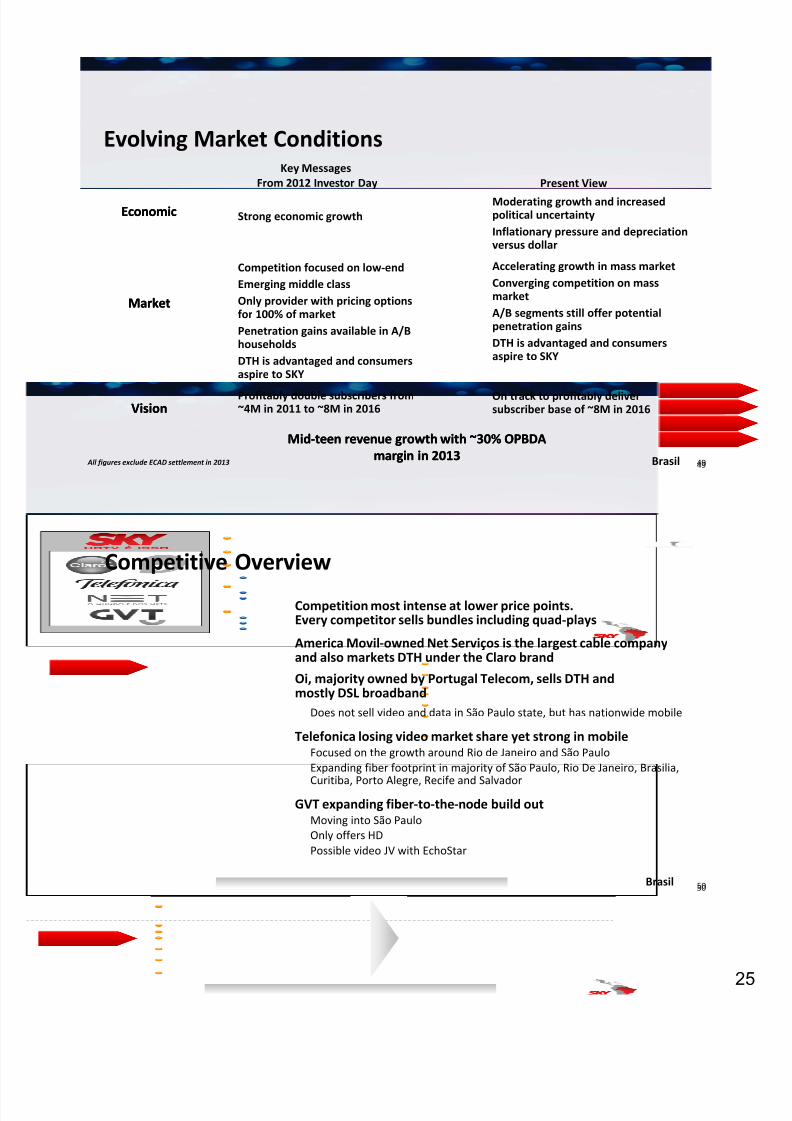
Moderating growth and increased political uncertaintyInflationary pressure and depreciation versus dollar
Accelerating growth in mass marketConverging competition on mass marketA/B segments still offer potential penetration gainsDTH is advantaged and consumers aspire to SKY
On track to profitably deliver subscriber base of ~8M in 2016
Key MessagesFrom 2012 Investor Day
Evolving Market Conditions
EconomicEconomic
VisionVision
MarketMarket
Present View
Strong economic growth
Competition focused on low ‐end Emerging middle classOnly provider with pricing options for 100% of marketPenetration gains available in A/B householdsDTH is advantaged and consumers aspire to SKY
Profitably double subscribers from ~4M in 2011 to ~8M in 2016
Brasil
Mid‐teen revenue growth with ~30% OPBDA margin in 2013
Mid‐teen revenue growth with ~30% OPBDA margin in 2013
49 All figures exclude ECAD settlement in 2013
50
Competition most intense at lower price points. Every competitor sells bundles including quad ‐plays
America Movil‐owned Net Serviços is the largest cable company and also markets DTH under the Claro brand
Oi, majority owned by Portugal Telecom, sells DTH and mostly DSL broadband
Does not sell video and data in São Paulo state, but has nationwide mobile
Telefonica losing video market share yet strong in mobileFocused on the growth around Rio de Janeiro and São Paulo Expanding fiber footprint in majority of São Paulo, Rio De Janeiro, Brasilia,
Curitiba, Porto
Alegre,
Recife
and
Salvador
GVT expanding fiber ‐to ‐the ‐node build outMoving into São PauloOnly offers HDPossible video JV with EchoStar
Competitive Overview
Brasil 50
8/13/2019 DIRECTV InvestorDay Dec 12 2013 Print (1)
http://slidepdf.com/reader/full/directv-investorday-dec-12-2013-print-1 26/872
51
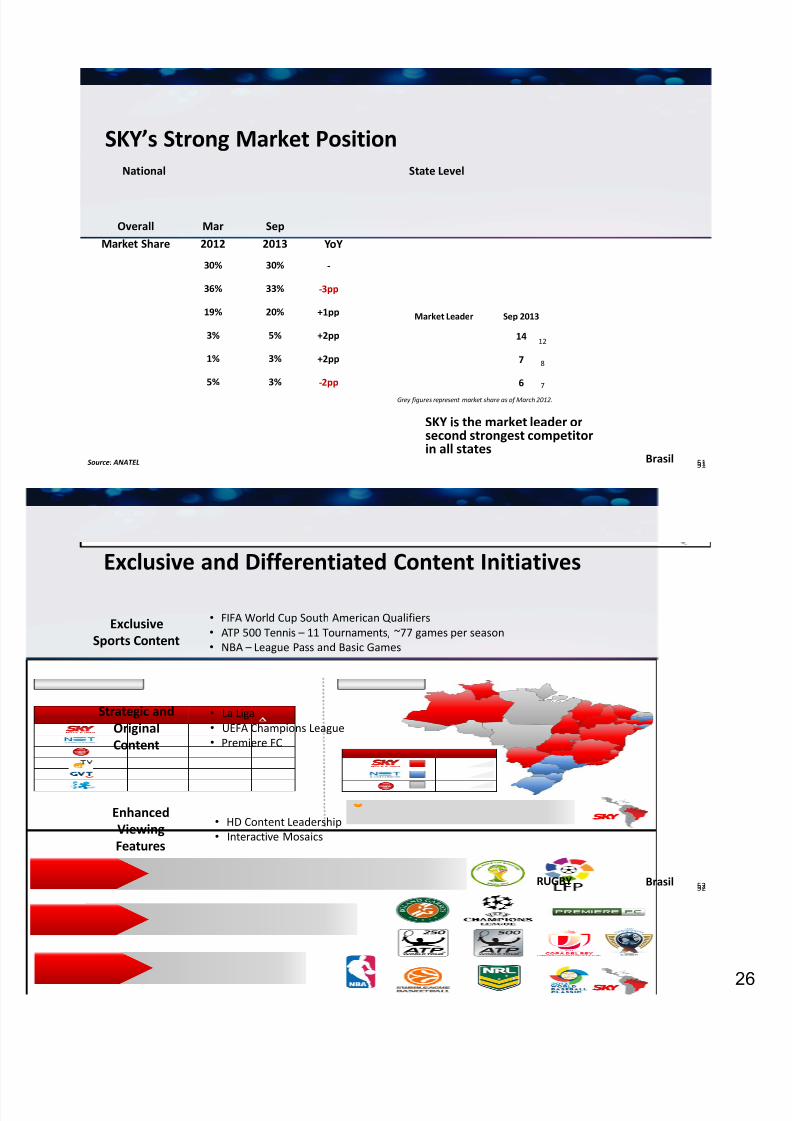
SKY is the market leader or second strongest competitor in all states
Market Leader Sep 2013
14
7
6
SKY’s Strong Market Position
Overall Market Share
Mar 2012
Sep 2013 YoY
30% 30% ‐
36% 33% ‐3pp
19% 20% +1pp
3% 5% +2pp
1% 3% +2pp
5% 3% ‐2pp
12
8
7
National State Level
Grey figures represent market share as of March 2012.
Brasil 51Source: ANATEL
52
• HD Content Leadership• Interactive Mosaics
• La Liga• UEFA Champions League• Premiere FC
• FIFA World Cup South American Qualifiers• ATP 500 Tennis – 11 Tournaments, ~77 games per season• NBA – League Pass and Basic Games
RUGBY
Exclusive and Differentiated Content Initiatives
Exclusive Sports Content
Enhanced Viewing Features
Strategic and Original Content
Brasil 52
8/13/2019 DIRECTV InvestorDay Dec 12 2013 Print (1)
http://slidepdf.com/reader/full/directv-investorday-dec-12-2013-print-1 27/872
53
Continued Leadership in Service2012
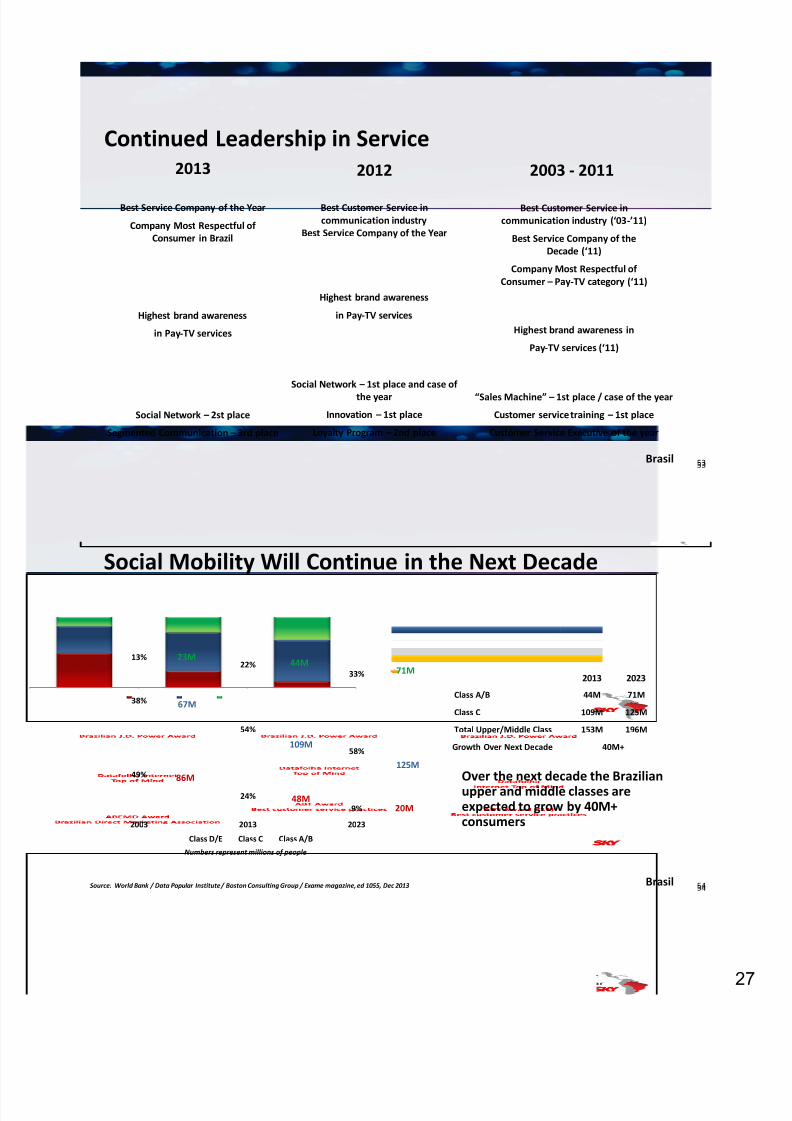
Highest brand awareness in
Pay‐TV services (‘11)
“Sales Machine” – 1st place / case of the year
Customer service training – 1st place
Customer Service Executive of the year
2003 ‐ 2011
Best Customer Service incommunication industry (‘03‐’11)
Best Service Company of theDecade (‘11)
Company Most Respectful of Consumer – Pay‐TV category (‘11)
2013
Best Service Company of the Year
Company Most Respectful of Consumer in Brazil
Highest brand awareness
in Pay‐TV services
Highest brand awareness
in Pay‐TV services
Best Customer Service incommunication industry
Best Service Company of the Year
Social Network – 1st place and case of the year
Innovation – 1st place
Loyalty Program – 2nd place
Social Network – 2st place
Segmented Communication – 3rd place
Brasil 53
54
Over the next decade the Brazilian upper and middle classes are expected to grow by 40M+ consumers
Source: World Bank / Data Popular Institute / Boston Consulting Group / Exame magazine, ed 1055, Dec 2013
Social Mobility Will Continue in the Next Decade
49%
24%9%
38%
54%
58%
13%22%
33%
2003 2013 2023
Class D/E Class C Class A/B
86M
48M20M
125M
109M
67M
23M 44M71M
Numbers represent millions of people
Brasil
2013 2023
Class A/B 44M 71M
Class C 109M 125M
Total Upper/Middle Class 153M 196M
Growth Over Next Decade 40M+
54
8/13/2019 DIRECTV InvestorDay Dec 12 2013 Print (1)
http://slidepdf.com/reader/full/directv-investorday-dec-12-2013-print-1 28/872
55
Continued Subscriber Growth
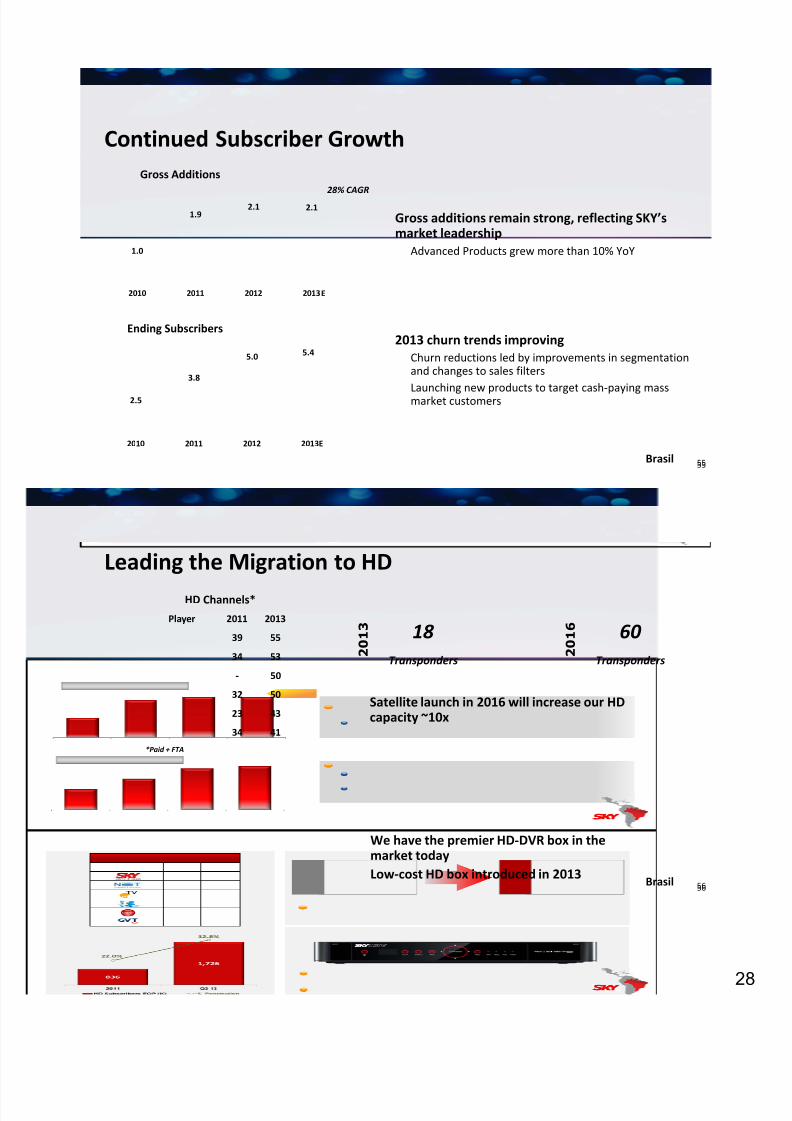
Gross additions remain strong, reflecting SKY’s market leadership
Advanced Products grew more than 10% YoY
2.5
3.8
5.0
2010 2011 2012 2013
5.4
Gross Additions
Brasil
Ending Subscribers2013 churn trends improving
Churn reductions led by improvements in segmentation and changes to sales filters
Launching new
products
to
target
cash
‐paying
mass
market customers
28% CAGR
1.0
1.92.1 2.1
2010 2011 2012 2013
55
E
E
56
Leading the Migration to HD
18 Transponders
2 0 1 3
HD Channels*
Player 2011 2013
39 55
34 53
‐ 50
32 50
23 43
34 41
*Paid + FTA
60 Transponders
2 0 1 6
Satellite launch in 2016 will increase our HD capacity ~10x
We have the premier HD‐DVR box in the market today Low‐cost HD box introduced in 2013 Brasil 56
8/13/2019 DIRECTV InvestorDay Dec 12 2013 Print (1)
http://slidepdf.com/reader/full/directv-investorday-dec-12-2013-print-1 29/872
57Brasil
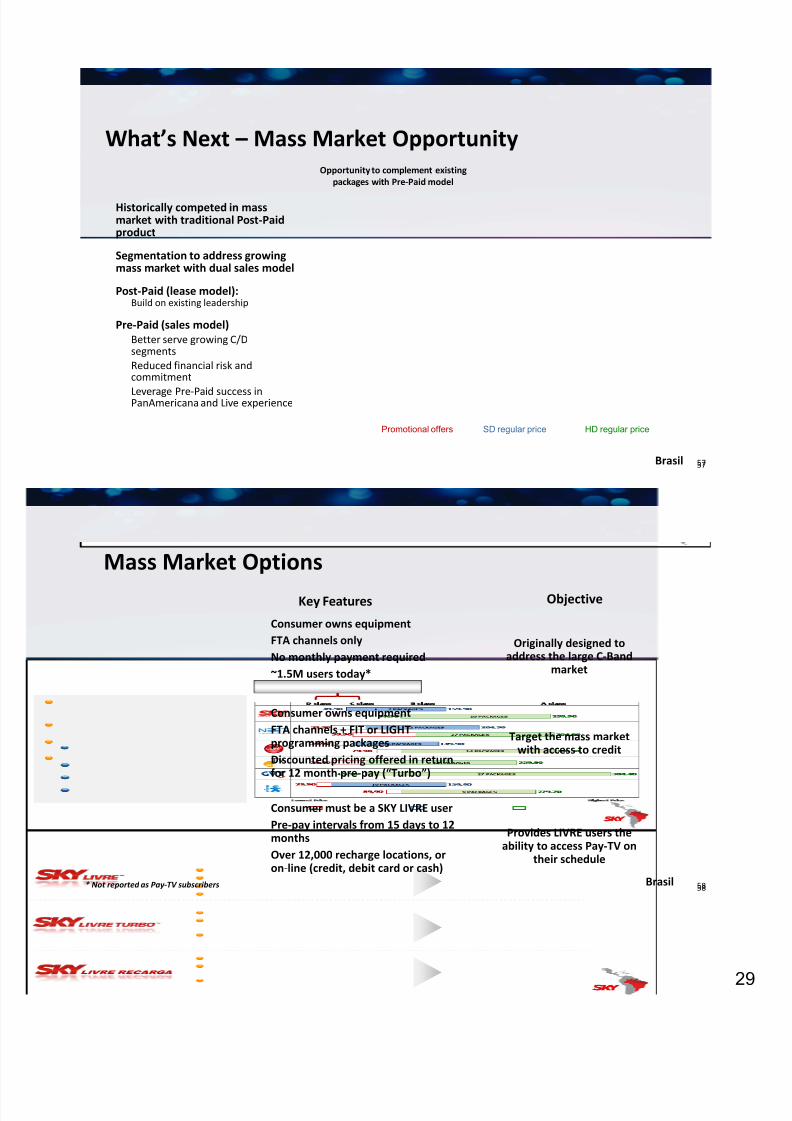
What’s Next – Mass Market Opportunity
SD regular price HD regular pricePromotional offers
Historically competed in mass market with traditional Post ‐Paid product
Segmentation to address growing mass market with dual sales model
Post ‐Paid (lease model): Build on existing leadership
Pre ‐Paid (sales model)Better serve growing C/D segmentsReduced financial risk and commitment
Leverage Pre ‐Paid success in PanAmericana and Live experience
Opportunity to complement existing packages with Pre ‐Paid model
57
58
Key Features
Mass Market Options
Consumer owns equipmentFTA channels onlyNo monthly payment required~1.5M users today*
Consumer owns equipmentFTA channels + FIT or LIGHT programming packagesDiscounted pricing offered in return for 12 month pre ‐pay (“Turbo”)
Consumer must be a SKY LIVRE userPre ‐pay intervals from 15 days to 12 monthsOver 12,000 recharge locations, or on ‐line (credit, debit card or cash)
Brasil
Objective
Originally designed to address the large C‐Band
market
Target the mass market with access to credit
Provides LIVRE users the ability to access Pay ‐TV on
their schedule
* Not reported as Pay ‐TV subscribers 58
8/13/2019 DIRECTV InvestorDay Dec 12 2013 Print (1)
http://slidepdf.com/reader/full/directv-investorday-dec-12-2013-print-1 30/873
59
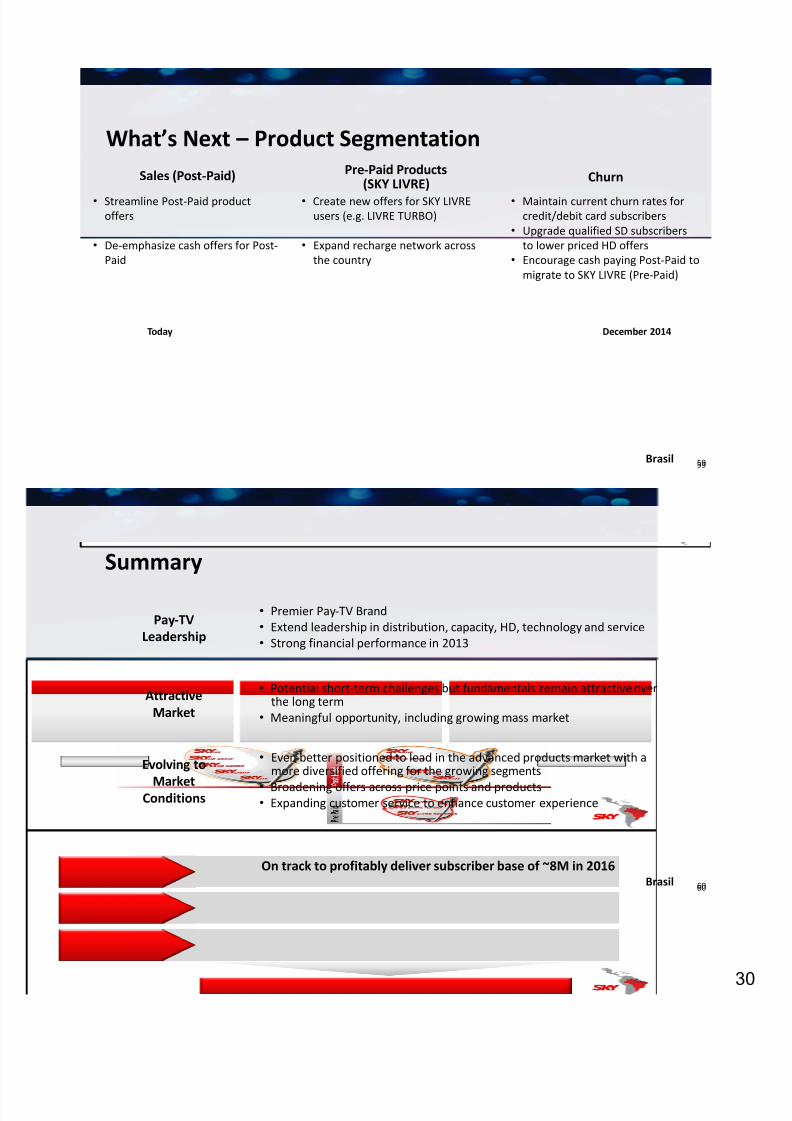
What’s Next – Product Segmentation
• Streamline Post ‐Paid product offers
• De‐emphasize cash offers for Post ‐Paid
Sales (Post ‐Paid)
• Create new offers for SKY LIVRE users (e.g. LIVRE TURBO)
• Expand recharge network across the country
Pre ‐Paid Products(SKY LIVRE)
• Maintain current churn rates for credit/debit card subscribers
• Upgrade qualified SD subscribers to lower priced HD offers
• Encourage cash paying Post ‐Paid to migrate to SKY LIVRE (Pre ‐Paid)
Churn
Today December 2014
Brasil 59
60
• Even better positioned to lead in the advanced products market with a more diversified offering for the growing segments
• Broadening offers across price points and products• Expanding customer service to enhance customer experience
• Potential short ‐term challenges but fundamentals remain attractive over the long term
• Meaningful opportunity, including growing mass market
AttractiveMarket
Evolving to
Market
Conditions
Summary
Brasil
• Premier Pay‐TV Brand• Extend leadership in distribution, capacity, HD, technology and service• Strong financial performance in 2013
Pay‐TVLeadership
On track to profitably deliver subscriber base of ~8M in 201660
8/13/2019 DIRECTV InvestorDay Dec 12 2013 Print (1)
http://slidepdf.com/reader/full/directv-investorday-dec-12-2013-print-1 31/87
8/13/2019 DIRECTV InvestorDay Dec 12 2013 Print (1)
http://slidepdf.com/reader/full/directv-investorday-dec-12-2013-print-1 32/873
63
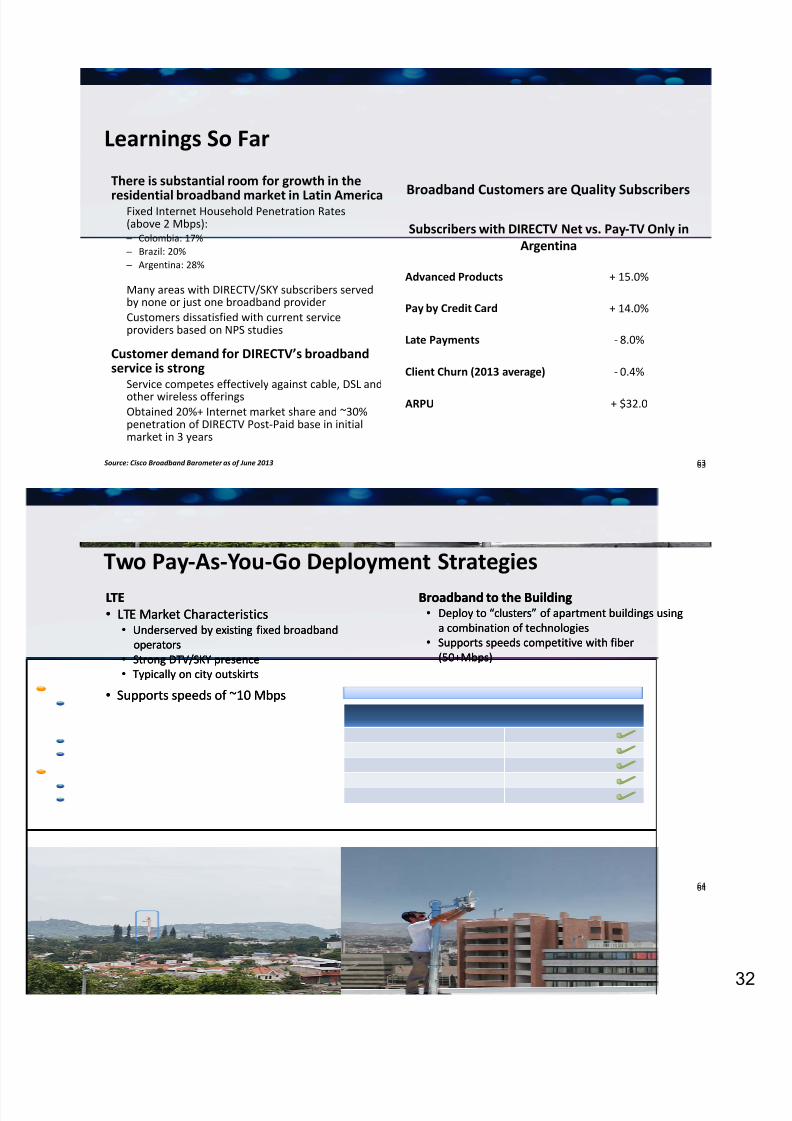
Learnings So Far
Subscribers with DIRECTV Net vs. Pay‐TV Only in Argentina
Advanced Products + 15.0%
Pay by Credit Card + 14.0%
Late Payments ‐ 8.0%
Client Churn (2013 average) ‐ 0.4%
ARPU + $32.0
There is substantial room for growth in the
residential broadband market in Latin AmericaFixed Internet Household Penetration Rates (above 2 Mbps): ─ Colombia: 17% ─ Brazil: 20% ─ Argentina: 28%
Many areas with DIRECTV/SKY subscribers served by none or just one broadband providerCustomers dissatisfied with current service providers based on NPS studies
Customer demand for DIRECTV’s broadband service is strong
Service competes effectively against cable, DSL and other wireless offeringsObtained 20%+ Internet market share and ~30% penetration of DIRECTV Post ‐Paid base in initial market in 3 years
Source: Cisco Broadband Barometer as of June 2013
Broadband Customers
are
Quality
Subscribers
63
64
Two Pay‐As‐You‐Go Deployment StrategiesLTE• LTE Market Characteristics
• Underserved by existing fixed broadband operators
• Strong DTV/SKY presence• Typically on city outskirts
• Supports speeds of ~10 Mbps
LTE• LTE Market Characteristics
• Underserved by existing fixed broadband operators
• Strong DTV/SKY presence• Typically on city outskirts
• Supports speeds of ~10 Mbps
Broadband to the Building• Deploy to “clusters” of apartment buildings using
a combination of technologies• Supports speeds competitive with fiber
(50+Mbps)
Broadband to the Building• Deploy to “clusters” of apartment buildings using
a combination of technologies• Supports speeds competitive with fiber
(50+Mbps)
64
8/13/2019 DIRECTV InvestorDay Dec 12 2013 Print (1)
http://slidepdf.com/reader/full/directv-investorday-dec-12-2013-print-1 33/873
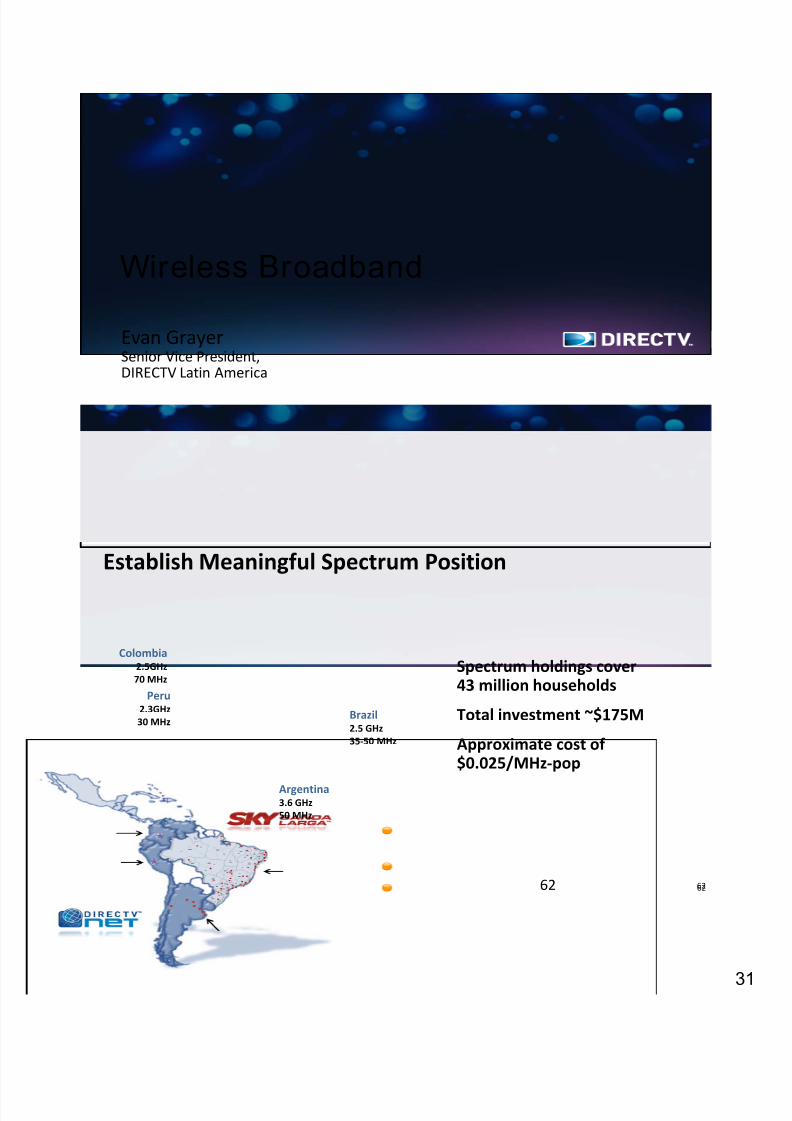
65
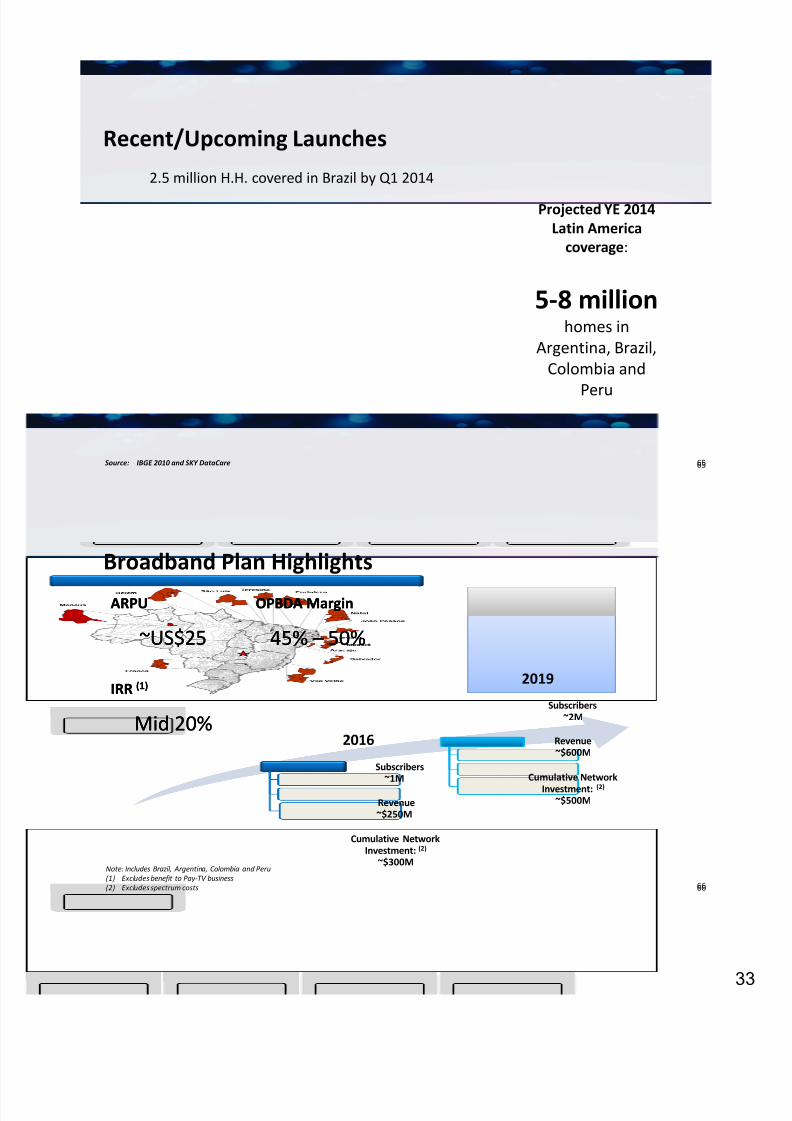
Recent/Upcoming Launches2.5 million H.H. covered in Brazil by Q1 2014
5‐8 million homes in
Argentina, Brazil, Colombia and
Peru
Source: IBGE 2010 and SKY DataCare 65
Projected YE 2014 Latin America
coverage :
66
Broadband Plan Highlights
2016
Subscribers~1M
Revenue~$250M
Cumulative Network Investment: (2)
~$300M
2019
Subscribers~2M
Revenue~$600M
Cumulative Network Investment: (2)
~$500M
Note: Includes Brazil, Argentina, Colombia and Peru(1) Excludes benefit to Pay ‐TV business(2) Excludes spectrum costs
ARPU
~US$25
ARPU
~US$25
OPBDA Margin
45% – 50%
OPBDA Margin
45% – 50%
IRR (1)
Mid 20%
IRR (1)
Mid 20%
66
8/13/2019 DIRECTV InvestorDay Dec 12 2013 Print (1)
http://slidepdf.com/reader/full/directv-investorday-dec-12-2013-print-1 34/873
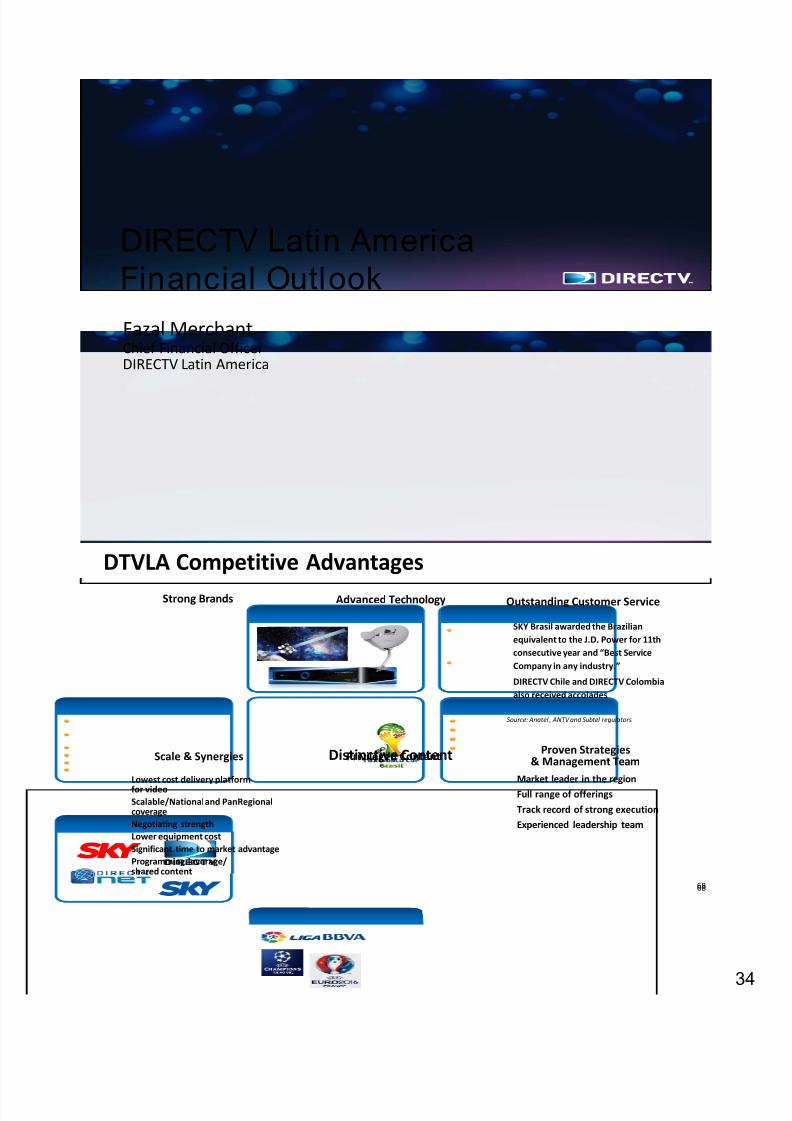
DIRECTV Latin AmericaFinancial OutlookFazal MerchantChief Financial OfficerDIRECTV Latin America
68
Market leader in the regionFull range of offeringsTrack record of strong executionExperienced leadership team
DTVLA Competitive Advantages
Lowest cost delivery platform for videoScalable/National and PanRegional coverageNegotiating strengthLower equipment costSignificant time to market advantageProgramming leverage/shared content
Scale & Synergies
Advanced Technology
SKY Brasil awarded the Brazilian equivalent to the J.D. Power for 11th consecutive year and “Best Service Company in any industry.”
DIRECTV Chile and DIRECTV Colombia also received accolades
Source: Anatel , ANTV and Subtel regulators
Outstanding Customer Service
Proven Strategies & Management TeamDistinctive ContentPrivileged Content
Strong Brands
68
8/13/2019 DIRECTV InvestorDay Dec 12 2013 Print (1)
http://slidepdf.com/reader/full/directv-investorday-dec-12-2013-print-1 35/873
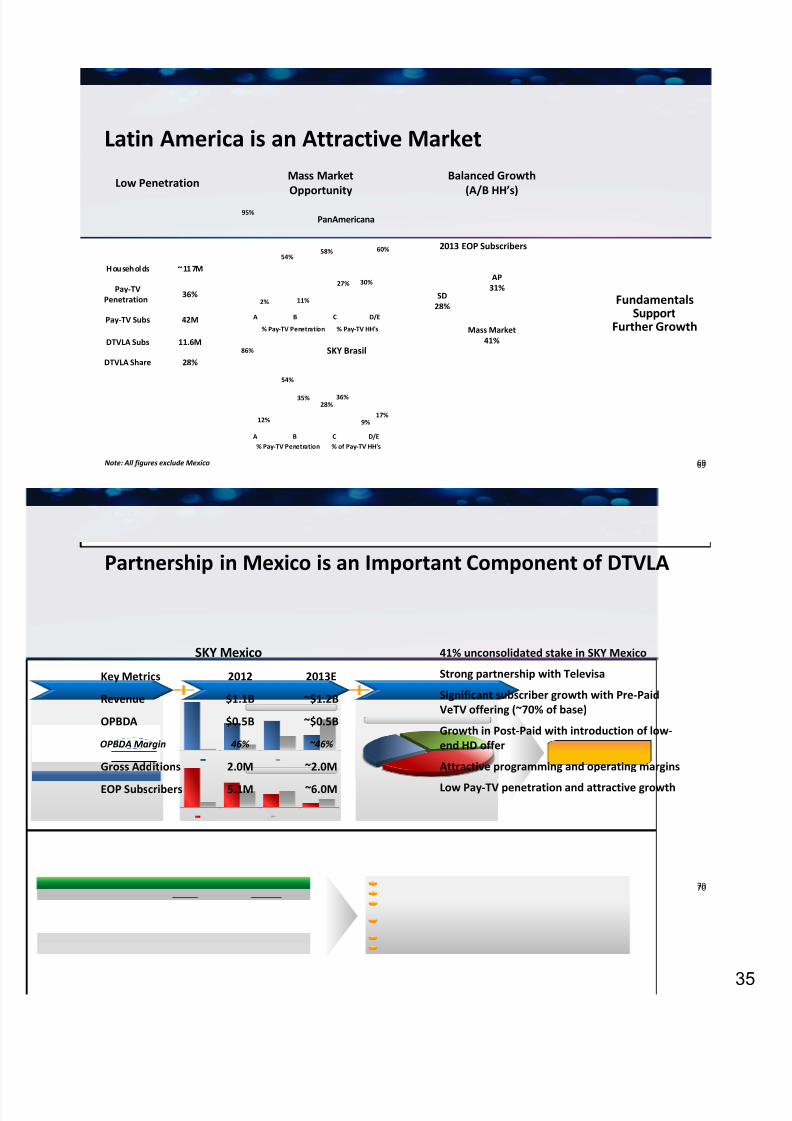
69
Households ~117M
Pay ‐TV Penetration 36%
Pay ‐TV Subs 42M
DTVLA Subs 11.6M
DTVLA Share 28%86%
54%
28%
9%12%
35% 36%
17%
A B C D/E% Pay‐TV Penetration % of Pay‐TV HH's
95%
54%58%
30%
2% 11%
27%
60%
A B C D/E
% Pay‐TV Penetration % Pay‐TV HH's
Fundamentals Support
Further Growth
Latin America is an Attractive Market
Low Penetration Mass Market
OpportunityBalanced Growth
(A/B HH’s)
69
SD28%
AP31%
Mass Market41%
Note: All figures exclude Mexico
2013 EOP Subscribers
PanAmericana
SKY Brasil
70
Partnership in Mexico is an Important Component of DTVLA
SKY Mexico
Key Metrics 2012 2013E
Revenue $1.1B ~$1.2B
OPBDA $0.5B ~$0.5B
OPBDA Margin 46% ~46%
Gross Additions 2.0M ~2.0M
EOP Subscribers 5.1M ~6.0M
41% unconsolidated stake in SKY Mexico
Strong partnership with Televisa
Significant subscriber growth with Pre ‐Paid VeTV offering (~70% of base)
Growth in Post ‐Paid with introduction of low ‐end HD offer
Attractive programming and operating margins
Low Pay ‐TV penetration and attractive growth
70
8/13/2019 DIRECTV InvestorDay Dec 12 2013 Print (1)
http://slidepdf.com/reader/full/directv-investorday-dec-12-2013-print-1 36/873
71
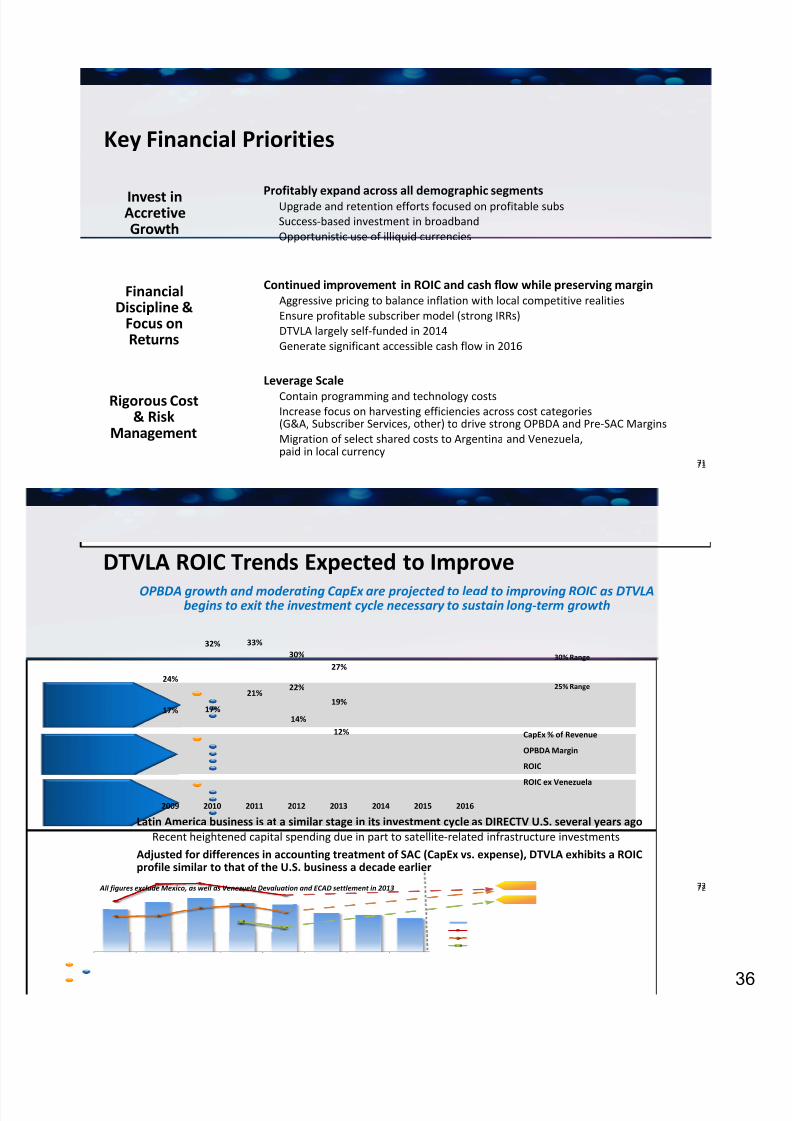
Key Financial Priorities
71
Continued improvement in ROIC and cash flow while preserving marginAggressive pricing to balance inflation with local competitive realitiesEnsure profitable subscriber model (strong IRRs)DTVLA largely self ‐funded in 2014Generate significant accessible cash flow in 2016
Invest in Accretive Growth
Rigorous Cost & Risk
Management
Financial Discipline &
Focus on Returns
Profitably expand
across
all
demographic
segmentsUpgrade and retention efforts focused on profitable subs
Success ‐based investment in broadbandOpportunistic use of illiquid currencies
Leverage ScaleContain programming and technology costsIncrease focus on harvesting efficiencies across cost categories (G&A, Subscriber Services, other) to drive strong OPBDA and Pre ‐SAC MarginsMigration of select shared costs to Argentina and Venezuela, paid in local currency
72
24%
32% 33%30%
27%
17% 17%
21% 22%
19%
14%12%
2009 2010 2011 2012 2013 2014 2015 2016
CapEx % of Revenue
OPBDA Margin
ROIC
ROIC ex
Venezuela
DTVLA ROIC Trends Expected to ImproveOPBDA growth and moderating CapEx are projected to lead to improving ROIC as DTVLA
begins to exit the investment cycle necessary to sustain long ‐term growth
Latin America business is at a similar stage in its investment cycle as DIRECTV U.S. several years agoRecent heightened capital spending due in part to satellite ‐related infrastructure investments
Adjusted for differences in accounting treatment of SAC (CapEx vs. expense), DTVLA exhibits a ROIC profile similar to that of the U.S. business a decade earlier
72
25% Range
30% Range
All figures exclude Mexico, as well as Venezuela Devaluation and ECAD settlement in 2013
8/13/2019 DIRECTV InvestorDay Dec 12 2013 Print (1)
http://slidepdf.com/reader/full/directv-investorday-dec-12-2013-print-1 37/873
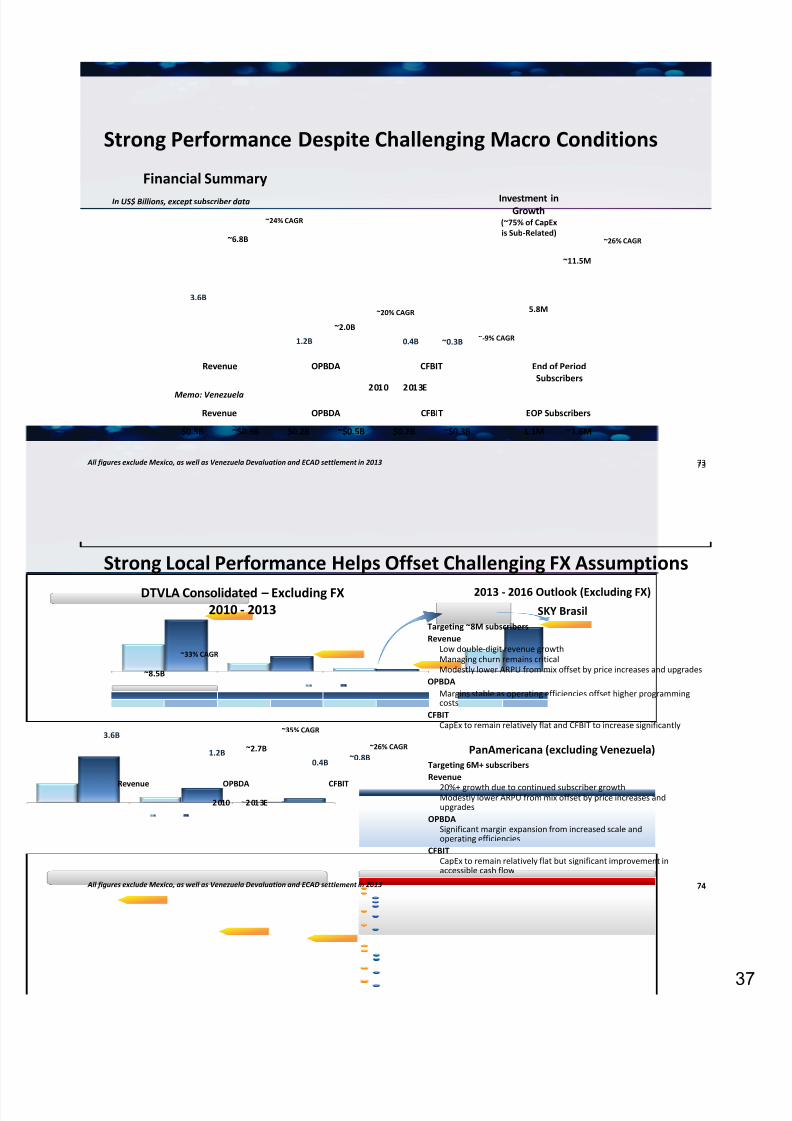
73
Revenue OPBDA CFBIT
2010 2013E
End of PeriodSubscribers
Strong Performance Despite Challenging Macro Conditions
Financial Summary
~24% CAGR
In US$ Billions, except subscriber data
All figures exclude Mexico, as well as Venezuela Devaluation and ECAD settlement in 2013
~20% CAGR
~‐9% CAGR
~26% CAGR
5.8M
~11.5M
Investment in Growth
(~75% of CapExis Sub‐Related)
73
Revenue OPBDA CFBIT EOP Subscribers
$0.5B ~$0.9B $0.2B ~$0.5B $0.2B ~$0.3B 1.1M ~1.6M
~6.8B
~2.0B
3.6B
1.2B 0.4B ~0.3B
Memo: Venezuela
74
Revenue OPBDA CFBIT2010 2013E
Strong Local Performance Helps Offset Challenging FX Assumptions
74
PanAmericana (excluding Venezuela)
~8.5B
~2.7B
3.6B
1.2B
SKY BrasilDTVLA Consolidated – Excluding FX
2010 ‐ 2013
~0.8B0.4B
2013 ‐ 2016 Outlook (Excluding FX)
Targeting ~8M subscribersRevenue
Low double ‐digit revenue growthManaging churn remains criticalModestly lower ARPU from mix offset by price increases and upgrades
OPBDAMargins stable as operating efficiencies offset higher programming costs
CFBITCapEx to remain relatively flat and CFBIT to increase significantly
Targeting 6M+ subscribersRevenue
20%+ growth due to continued subscriber growthModestly lower ARPU from mix offset by price increases and upgrades
OPBDASignificant margin expansion from increased scale and operating efficiencies
CFBITCapEx to remain relatively flat but significant improvement in accessible cash flow
~33% CAGR
~35% CAGR
~26% CAGR
All figures exclude Mexico, as well as Venezuela Devaluation and ECAD settlement in 2013
8/13/2019 DIRECTV InvestorDay Dec 12 2013 Print (1)
http://slidepdf.com/reader/full/directv-investorday-dec-12-2013-print-1 38/873
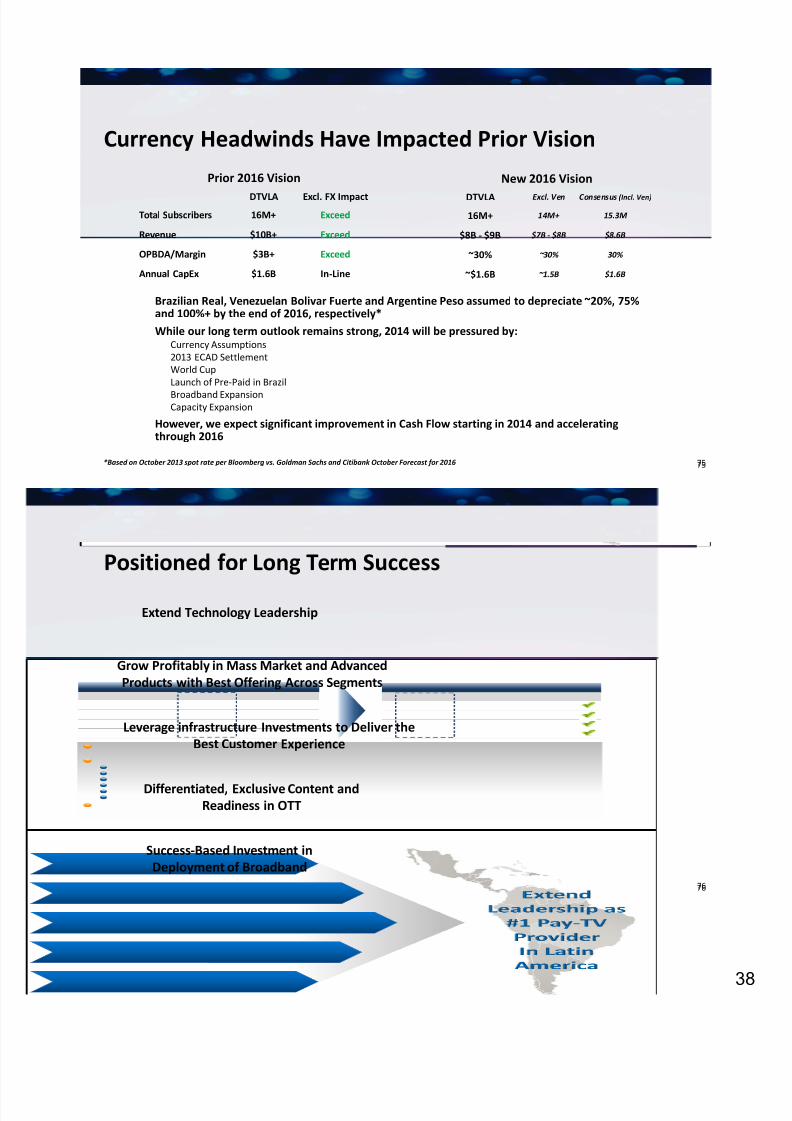
75
Currency Headwinds Have Impacted Prior Vision
75
Prior 2016 Vision
DTVLA Excl. FX ImpactTotal Subscribers 16M+ Exceed
Revenue $10B+ Exceed
OPBDA/Margin $3B+ Exceed
Annual CapEx $1.6B In‐Line
New 2016 Vision
DTVLA Excl. Ven Consensus (Incl. Ven)
16M+ 14M+ 15.3M
$8B ‐ $9B $7B ‐ $8B $8.6B
~30% ~30% 30%
~$1.6B ~1.5B $1.6B
Brazilian Real, Venezuelan Bolivar Fuerte and Argentine Peso assumed to depreciate ~20%, 75% and 100%+ by the end of 2016, respectively*While our long term outlook remains strong, 2014 will be pressured by:
Currency Assumptions2013 ECAD SettlementWorld CupLaunch of Pre ‐Paid in BrazilBroadband ExpansionCapacity Expansion
However, we expect significant improvement in Cash Flow starting in 2014 and accelerating through 2016
*Based on October 2013 spot rate per Bloomberg vs. Goldman Sachs and Citibank October Forecast for 2016
76
Positioned for Long Term Success
Extend Technology Leadership
Leverage infrastructure Investments to Deliver the Best Customer Experience
Differentiated, Exclusive Content and Readiness in OTT
Success ‐Based Investment in Deployment of Broadband
Grow Profitably in Mass Market and Advanced Products with Best Offering Across Segments
76
8/13/2019 DIRECTV InvestorDay Dec 12 2013 Print (1)
http://slidepdf.com/reader/full/directv-investorday-dec-12-2013-print-1 39/873
Q&A
Technology RoadmapRômulo PontualExecutive Vice President& Chief Technology Officer
All trademarks and service marks are the property of their respective owners
8/13/2019 DIRECTV InvestorDay Dec 12 2013 Print (1)
http://slidepdf.com/reader/full/directv-investorday-dec-12-2013-print-1 40/874
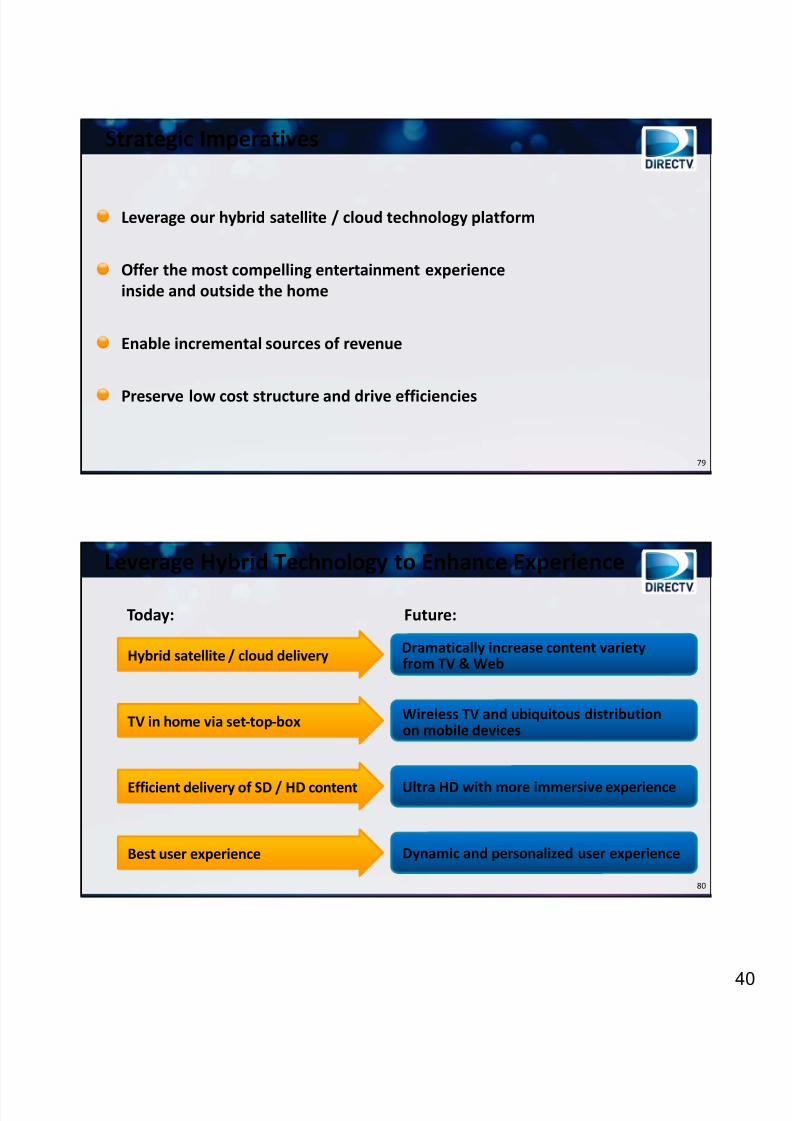
79
Strategic Imperatives
Leverage our hybrid satellite / cloud technology platform
Offer the most compelling entertainment experience inside and outside the home
Enable incremental sources of revenue
Preserve low cost structure and drive efficiencies
80
Leverage Hybrid Technology to Enhance Experience
Hybrid satellite / cloud delivery Dramatically increase content variety from TV & Web
Today: Future:
Efficient delivery of SD / HD content Ultra HD with more immersive experience
TV in home via set ‐top ‐box Wireless TV and ubiquitous distribution on mobile devices
Best user experience Dynamic and personalized user experience
8/13/2019 DIRECTV InvestorDay Dec 12 2013 Print (1)
http://slidepdf.com/reader/full/directv-investorday-dec-12-2013-print-1 41/874
81
Hybrid Delivery Network is Competitive Differentiator
High quality video and audio
Efficiently delivering live‐TV
Pre ‐load DVR (cache)
Most viewed PPV movies
Recommended shows for on ‐demand viewing
Agile national software updates
Rely on four CDN providers with fail safe technology
Expanded content variety
Providing in and out ‐of ‐home streaming
90% of usage is for VOD on the big screen
Two screen experience reliant on synchronous satellite and cloud experience
Satellite Cloud
82
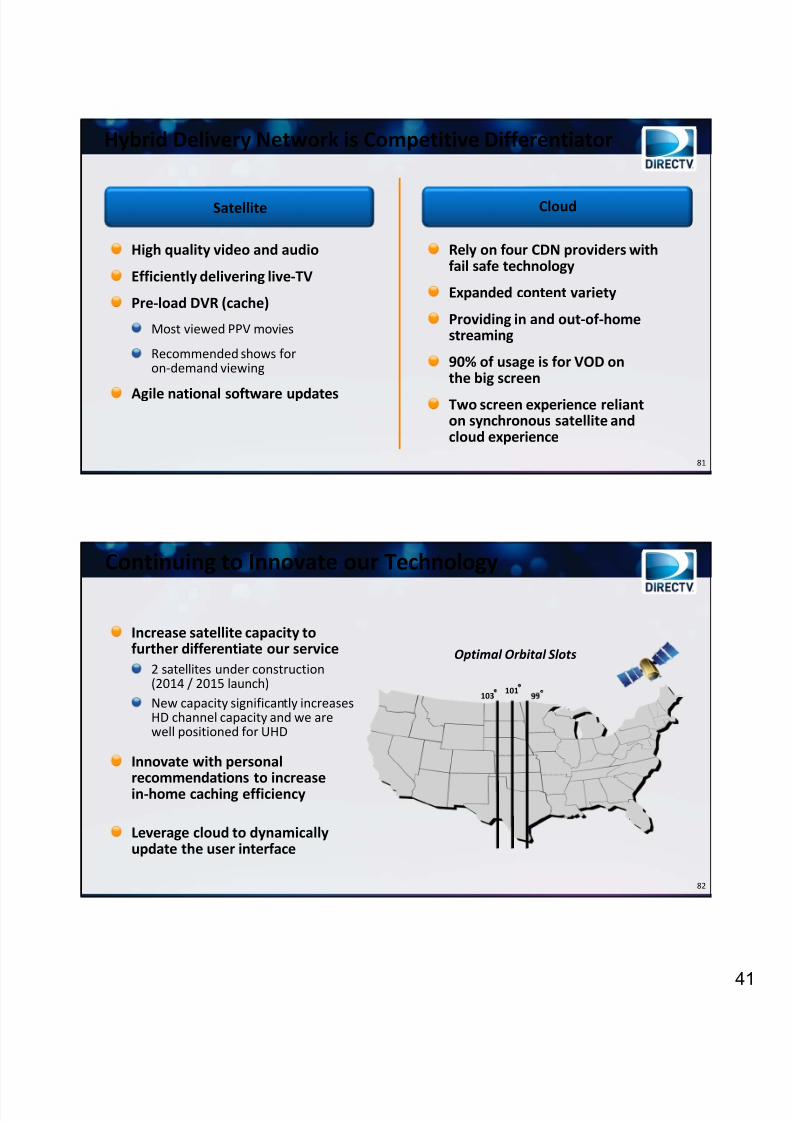
Continuing to Innovate our Technology
Increase satellite capacity to further differentiate our service
2 satellites under construction(2014 / 2015 launch)New capacity significantly increases HD channel capacity and we are well positioned for UHD
Innovate with personal recommendations to increase in‐home caching efficiency
Leverage cloud to dynamically update the user interface
101
103
Optimal Orbital Slots
8/13/2019 DIRECTV InvestorDay Dec 12 2013 Print (1)
http://slidepdf.com/reader/full/directv-investorday-dec-12-2013-print-1 42/874
83
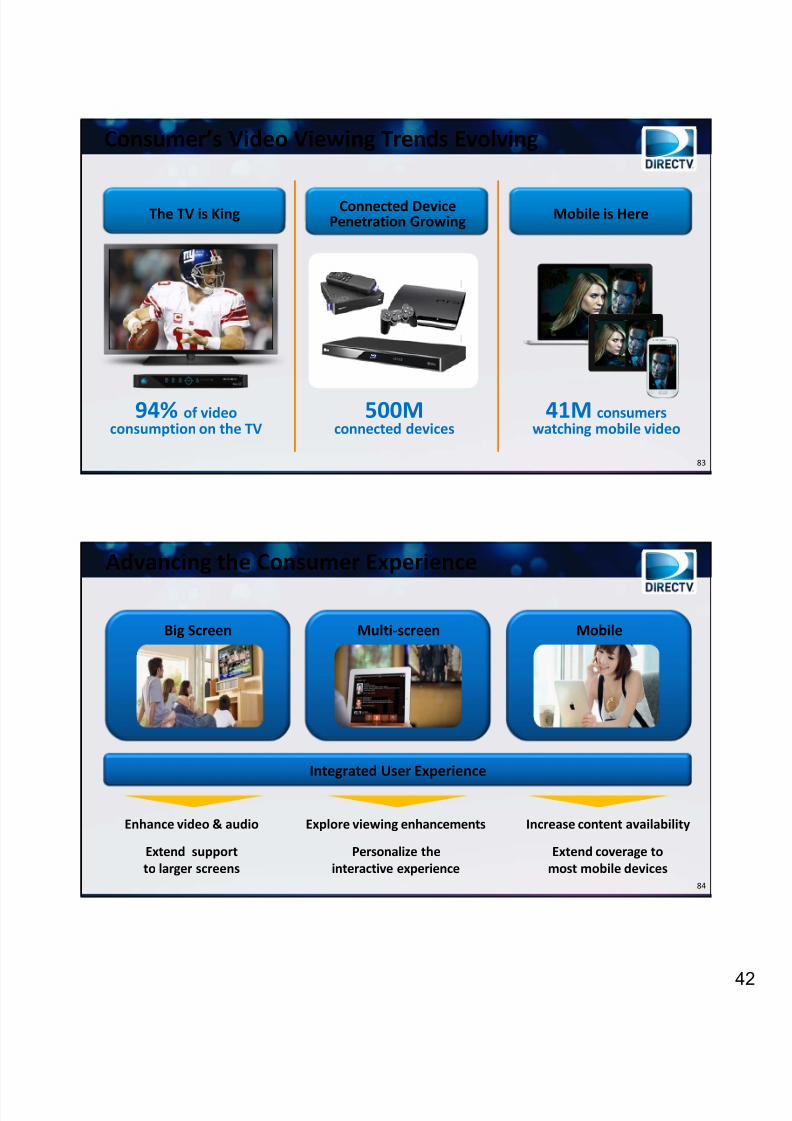
Consumer’s Video Viewing Trends Evolving
The TV is King Connected Device Penetration Growing Mobile is Here
94% of video consumption on the TV
500M connected devices
41M consumers watching mobile video
84
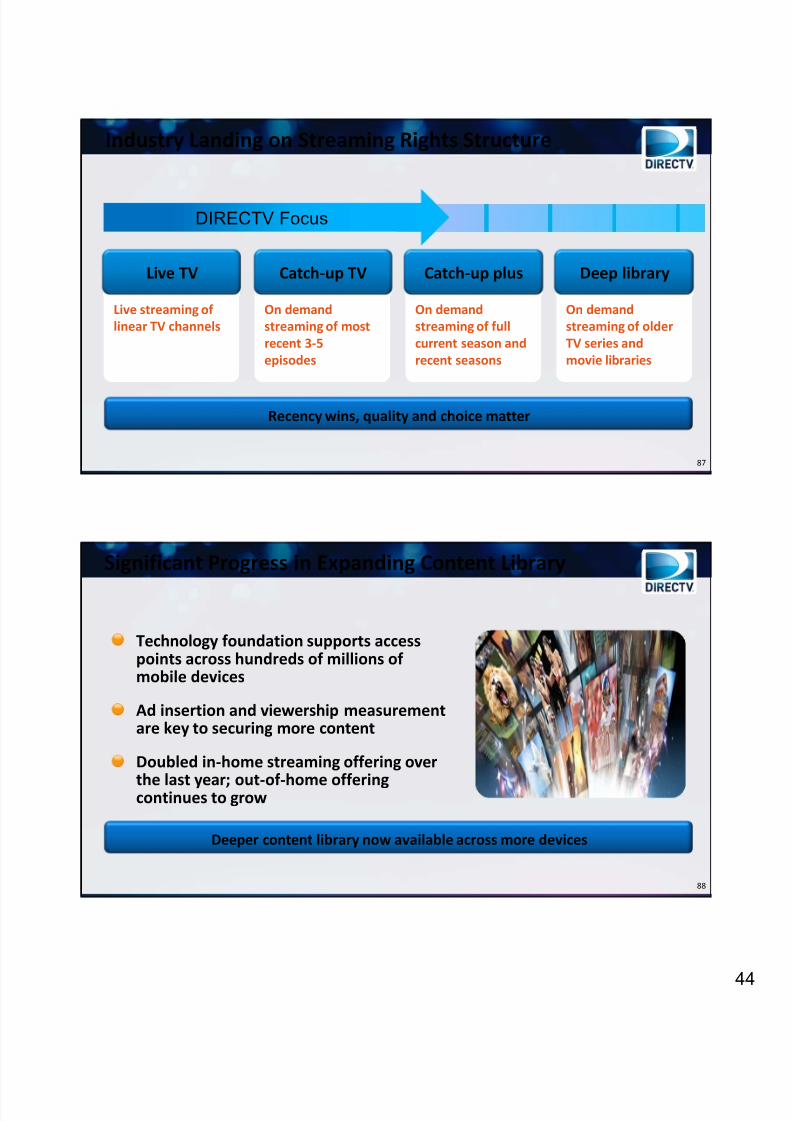
Advancing the Consumer Experience
Enhance video & audio
Extend support to larger screens
Explore viewing enhancements
Personalize the interactive experience
Increase content availability
Extend coverage to most mobile devices
Integrated User Experience
Big Screen Multi ‐screen Mobile
8/13/2019 DIRECTV InvestorDay Dec 12 2013 Print (1)
http://slidepdf.com/reader/full/directv-investorday-dec-12-2013-print-1 43/874
85
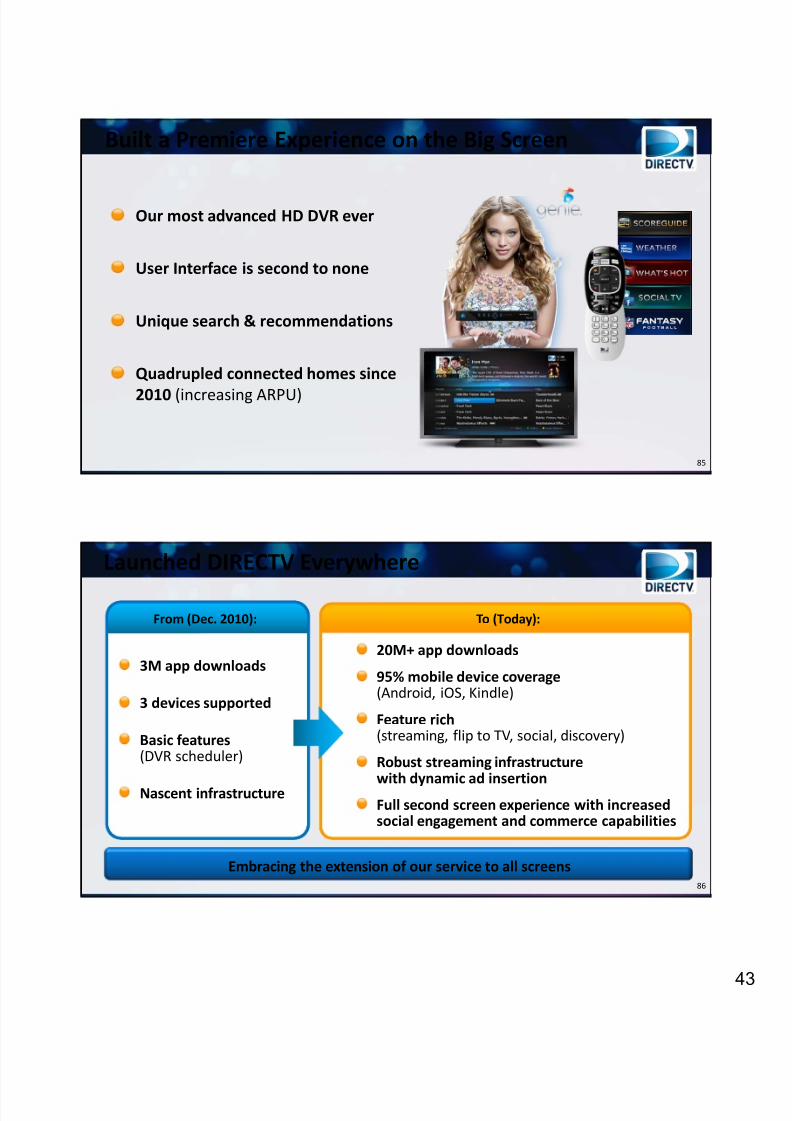
Built a Premiere Experience on the Big Screen
Our most advanced HD DVR ever
User Interface is second to none
Unique search & recommendations
Quadrupled connected homes since
2010 (increasing ARPU)
86
Embracing the extension of our service to all screens
Launched DIRECTV Everywhere
20M+ app downloads
95% mobile device coverage (Android, iOS, Kindle)
Feature rich(streaming, flip to TV, social, discovery)
Robust streaming infrastructure
with dynamic
ad
insertion
Full second screen experience with increased social engagement and commerce capabilities
To (Today):
3M app downloads
3 devices supported
Basic features(DVR scheduler)
Nascent infrastructure
From (Dec. 2010):
8/13/2019 DIRECTV InvestorDay Dec 12 2013 Print (1)
http://slidepdf.com/reader/full/directv-investorday-dec-12-2013-print-1 44/87
8/13/2019 DIRECTV InvestorDay Dec 12 2013 Print (1)
http://slidepdf.com/reader/full/directv-investorday-dec-12-2013-print-1 45/874
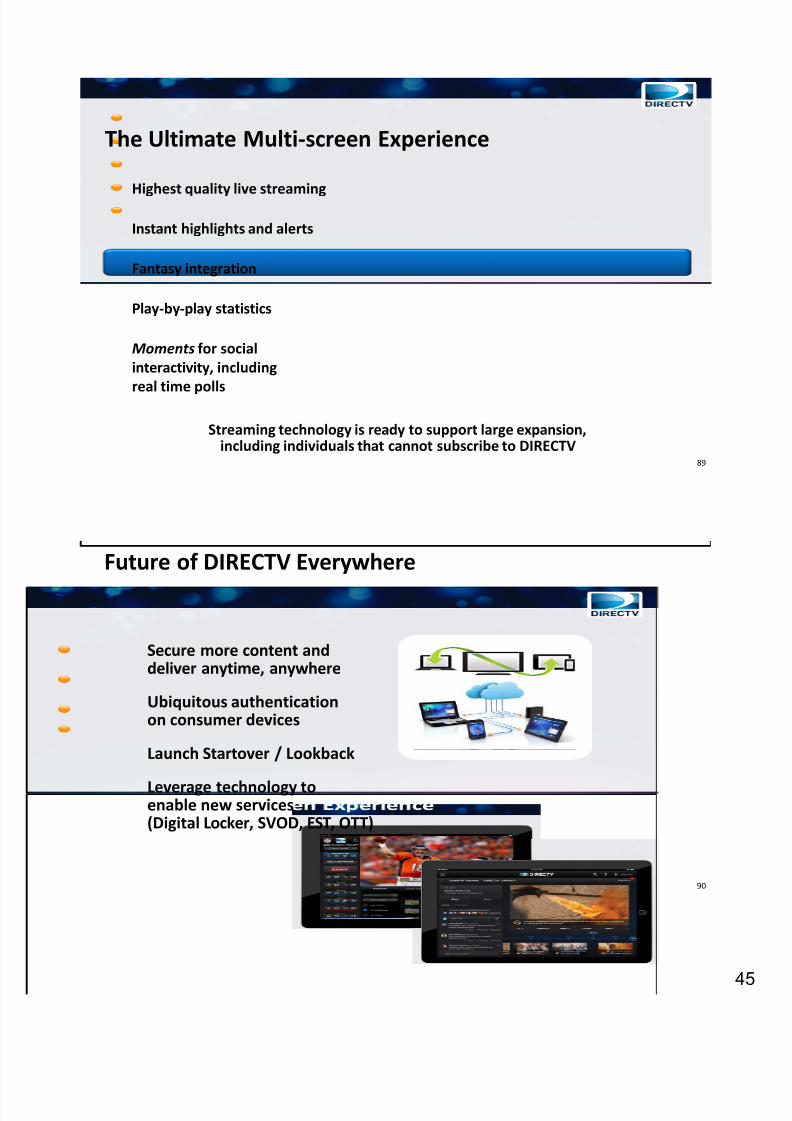
89
Streaming technology is ready to support large expansion, including individuals that cannot subscribe to DIRECTV
The Ultimate Multi ‐screen Experience
Highest quality
live
streaming
Instant highlights and alerts
Fantasy integration
Play ‐by‐play statistics
Moments for social interactivity, including
real time
polls
90
Future of DIRECTV Everywhere
Secure more content anddeliver anytime, anywhere
Ubiquitous authentication on consumer devices
Launch Startover / Lookback
Leverage technology to enable new services (Digital Locker, SVOD, EST, OTT)
8/13/2019 DIRECTV InvestorDay Dec 12 2013 Print (1)
http://slidepdf.com/reader/full/directv-investorday-dec-12-2013-print-1 46/874
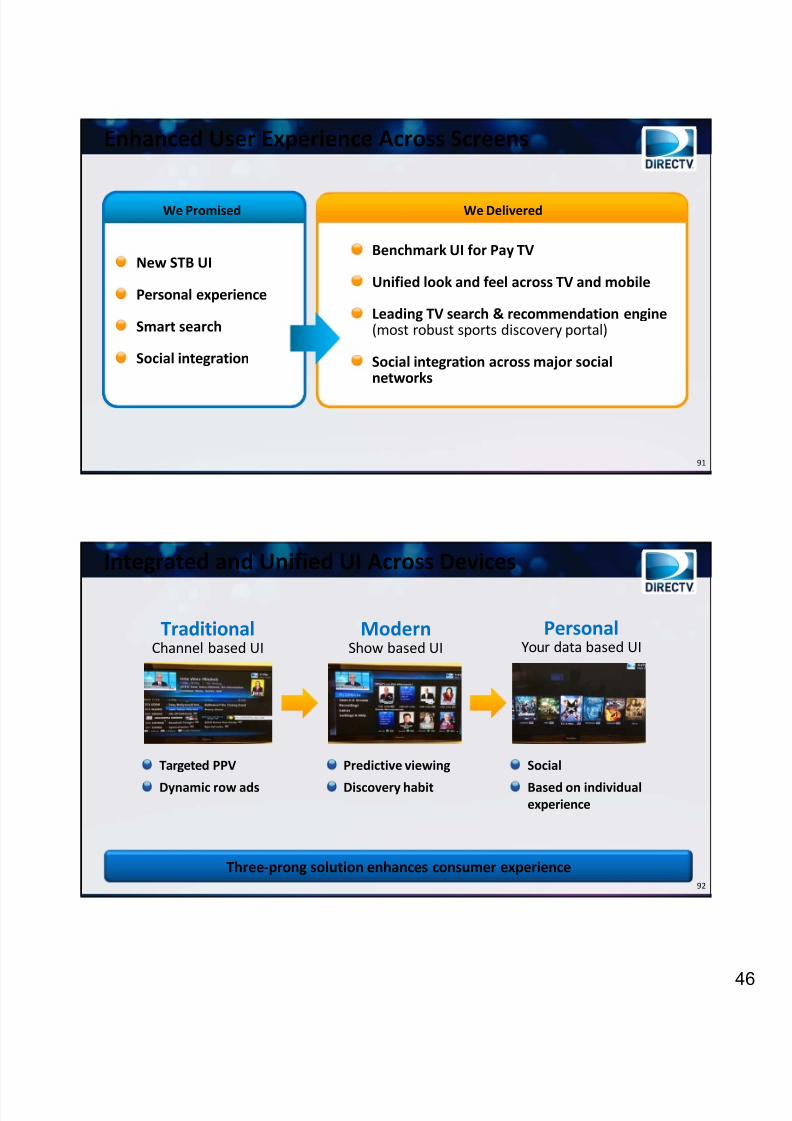
91
Enhanced User Experience Across Screens
New STB UI
Personal experience
Smart search
Social integration
We Promised We Delivered
Benchmark UI for Pay TV
Unified look and feel across TV and mobile
Leading TV search & recommendation engine(most robust sports discovery portal)
Social integration across major social networks
92
Integrated and Unified UI Across Devices
TraditionalChannel based UI
ModernShow based UI
PersonalYour data based UI
Targeted PPV
Dynamic row ads
Predictive viewing
Discovery habit
Social
Based on individual experience
Three ‐prong solution enhances consumer experience
8/13/2019 DIRECTV InvestorDay Dec 12 2013 Print (1)
http://slidepdf.com/reader/full/directv-investorday-dec-12-2013-print-1 47/874
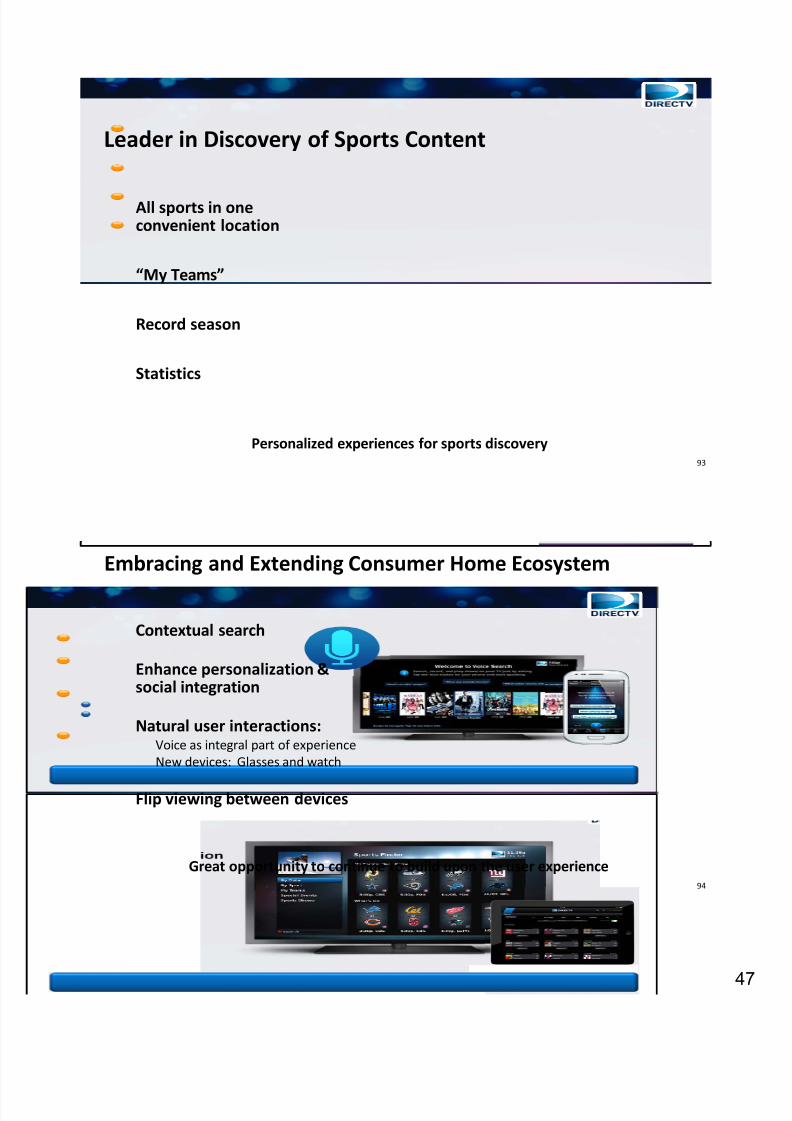
93
Leader in Discovery of Sports Content
All sports in one convenient location
“My Teams”
Record season
Statistics
Personalized experiences for sports discovery
94
Embracing and Extending Consumer Home Ecosystem
Contextual search
Enhance personalization & social integration
Natural user interactions:Voice as integral part of experienceNew devices: Glasses and watch
Flip viewing between devices
Great opportunity to continue to build upon the user experience
8/13/2019 DIRECTV InvestorDay Dec 12 2013 Print (1)
http://slidepdf.com/reader/full/directv-investorday-dec-12-2013-print-1 48/874
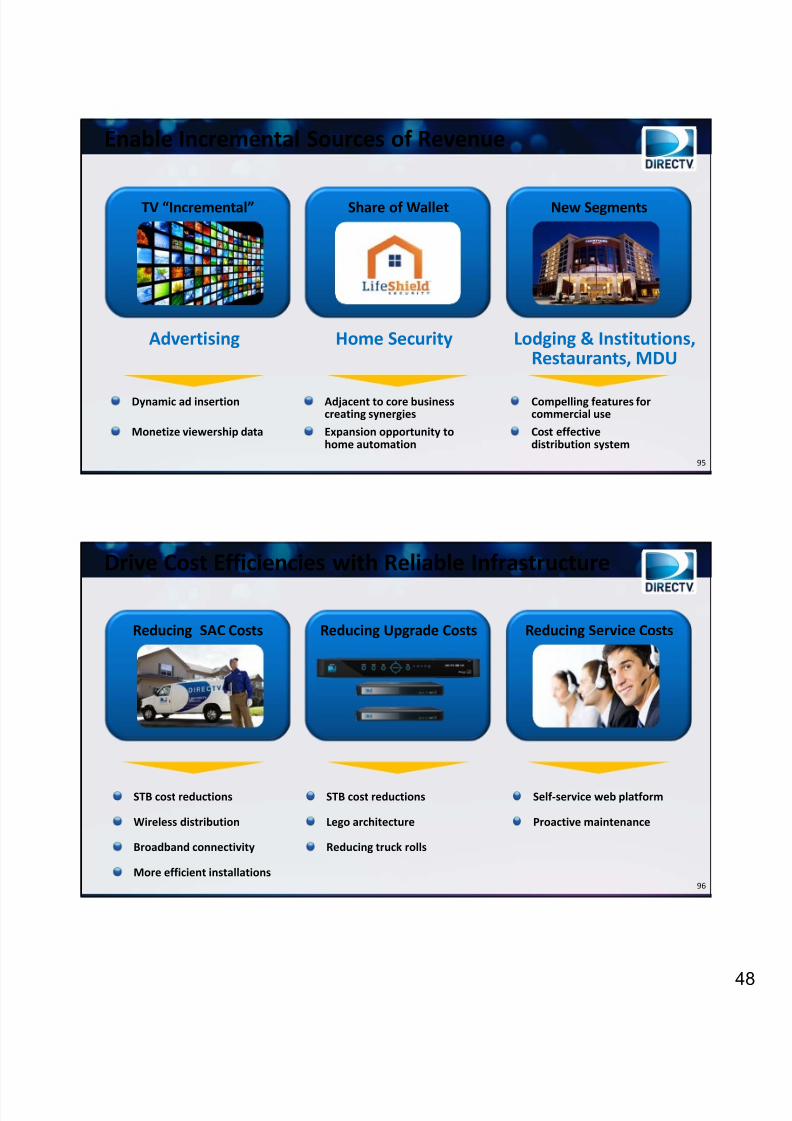
95
TV “Incremental” Share of Wallet New Segments
Enable Incremental Sources of Revenue
Advertising Home Security Lodging & Institutions, Restaurants, MDU
Dynamic ad insertion
Monetize viewership data
Adjacent to core businesscreating synergiesExpansion opportunity to home automation
Compelling features for commercial useCost effective distribution system
96
Reducing SAC Costs Reducing Upgrade Costs Reducing Service Costs
Drive Cost Efficiencies with Reliable Infrastructure
STB cost reductions
Wireless distribution
Broadband connectivity
More efficient installations
STB cost reductions
Lego architecture
Reducing truck rolls
Self ‐service web platform
Proactive maintenance
8/13/2019 DIRECTV InvestorDay Dec 12 2013 Print (1)
http://slidepdf.com/reader/full/directv-investorday-dec-12-2013-print-1 49/874
97
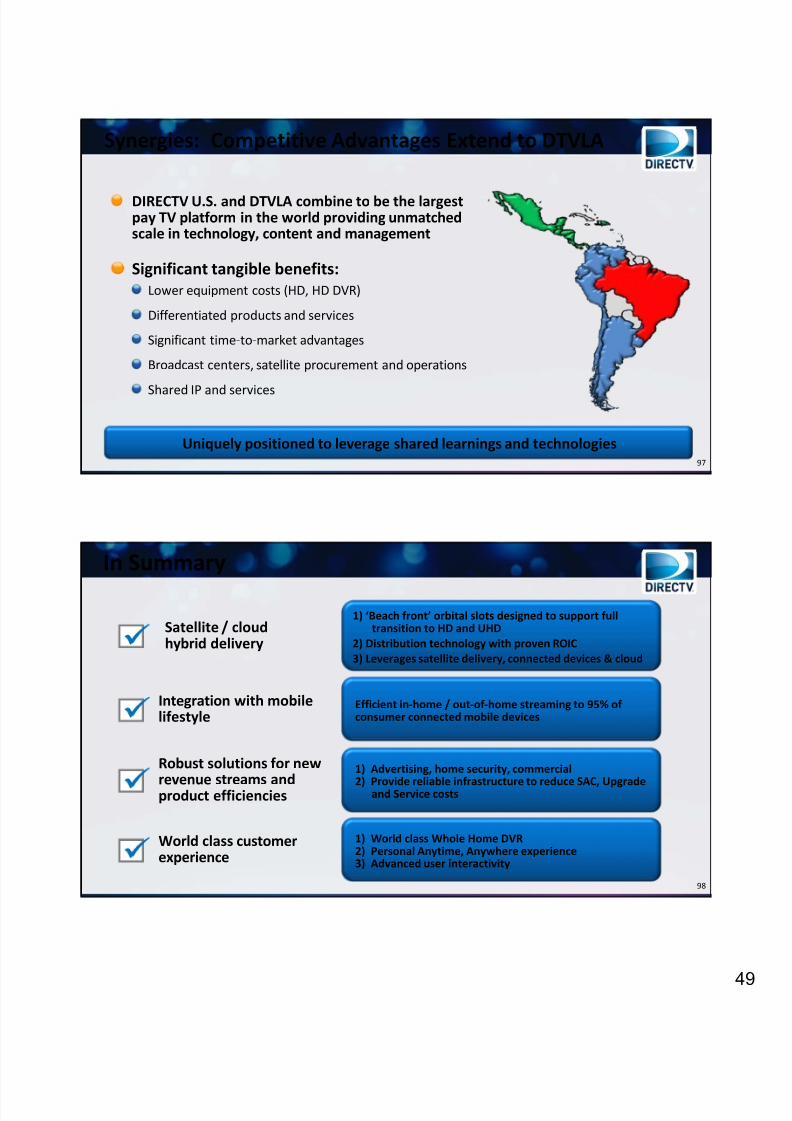
Synergies: Competitive Advantages Extend to DTVLA
DIRECTV U.S. and DTVLA combine to be the largest pay TV platform in the world providing unmatched scale in technology, content and management
Significant tangible benefits:Lower equipment costs (HD, HD DVR)
Differentiated products and services
Significant time ‐to ‐market advantages
Broadcast centers, satellite procurement and operations
Shared IP and services
Uniquely positioned to leverage shared learnings and technologies
98
In Summary
Satellite / cloud hybrid delivery
Integration with mobile lifestyle
Robust solutions for new
revenue streams
and
product efficiencies
World class customer experience
1) World class Whole Home DVR2) Personal Anytime, Anywhere experience3) Advanced user interactivity
1) ‘Beach front’ orbital slots designed to support full transition to HD and UHD
2) Distribution technology with proven ROIC3) Leverages satellite delivery, connected devices & cloud
Efficient in‐home / out ‐of ‐home streaming to 95% of consumer connected mobile devices
1) Advertising, home security, commercial
2) Provide
reliable
infrastructure
to
reduce
SAC,
Upgradeand Service costs
8/13/2019 DIRECTV InvestorDay Dec 12 2013 Print (1)
http://slidepdf.com/reader/full/directv-investorday-dec-12-2013-print-1 50/875
Transforming the Customer ExperienceMike PalkovicExecutive Vice President, Customer Operations
All trademarks and service marks are the property of their respective owners
100
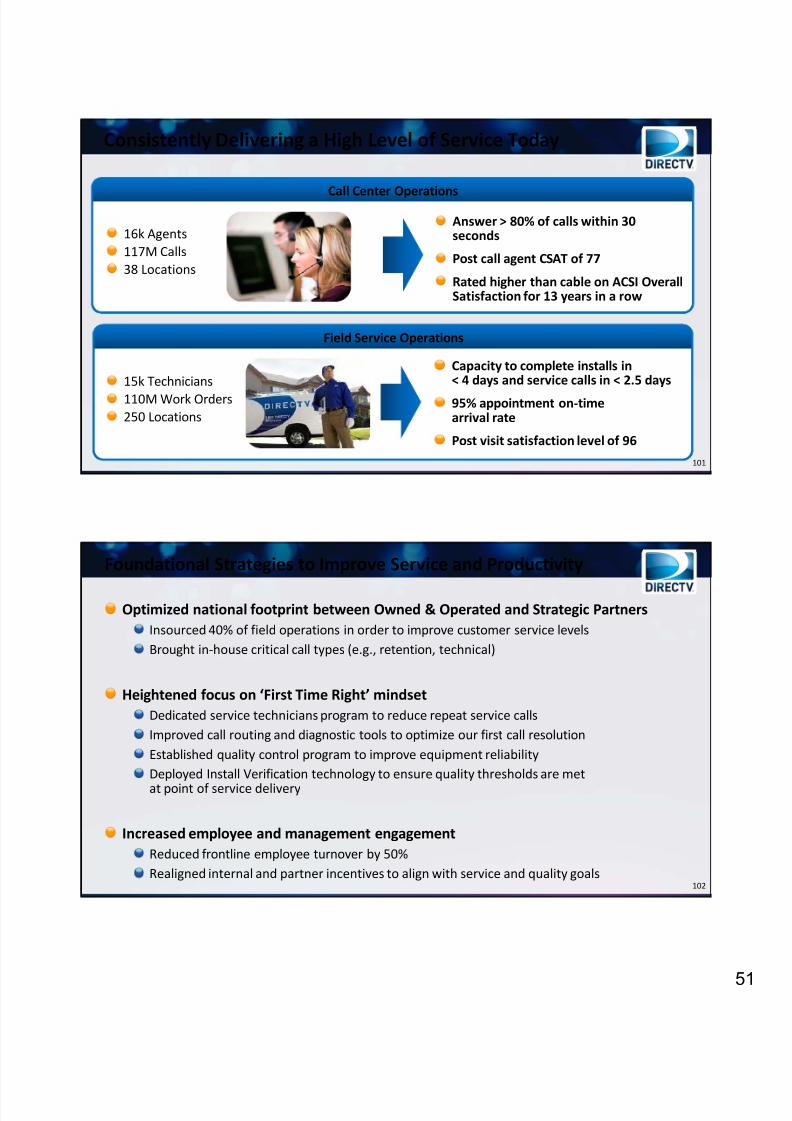
Customer Service Strategy
EnablersIntegrated Customer Data Analytics | Rapid Test & Learn Lab | Empowered workforce
Winning customerloyalty for life and making customer service a
competitive advantage
Significant care and field capability to efficiently service 20m customersBest customer service in industry beating cable competitors 13 years
running
Consistent Service Delivery
Invest in our best customersOptimize end ‐to ‐end customer journeys Empower customers through self ‐service Engage and empower our frontline through lean management methods
Increase Customer Loyalty
Eliminate unnecessary call volume and truck rollsLeverage technology to drive improvements in productivity
Improve Productivity and Efficiency
8/13/2019 DIRECTV InvestorDay Dec 12 2013 Print (1)
http://slidepdf.com/reader/full/directv-investorday-dec-12-2013-print-1 51/875
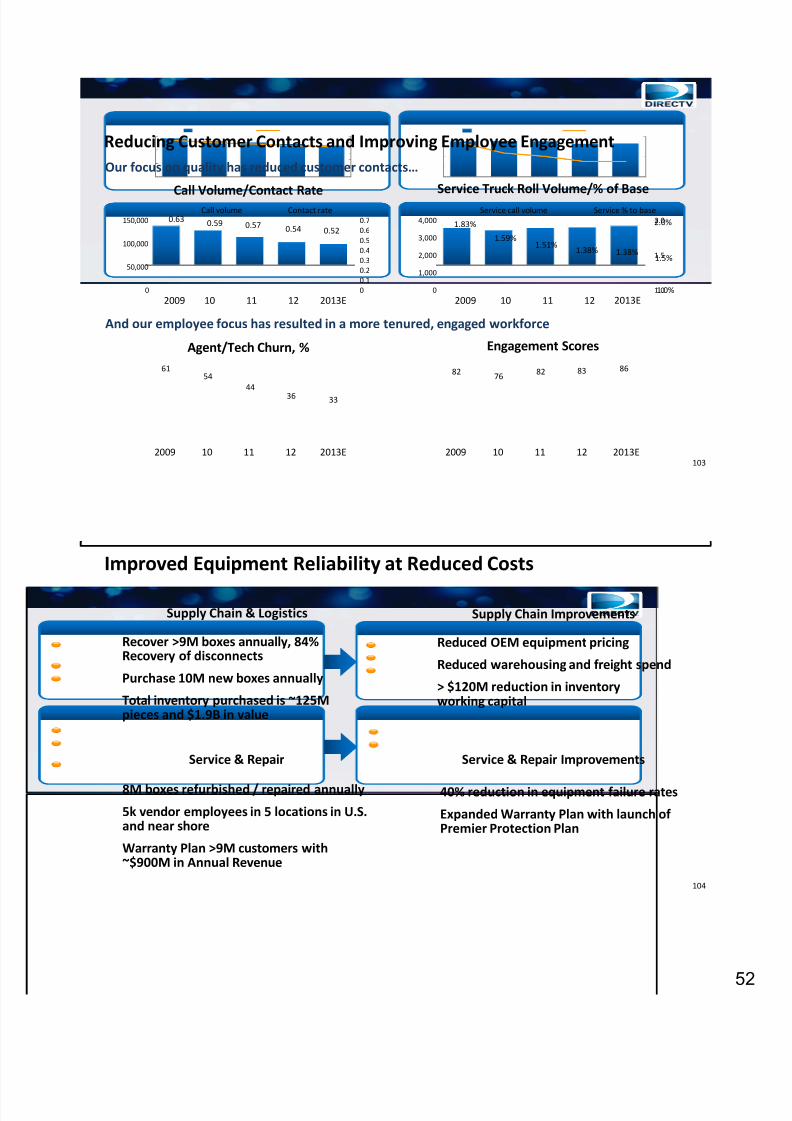
101
Call Center
Operations
Field Service Operations
Consistently Delivering a High Level of Service Today
Answer > 80% of calls within 30 seconds
Post call agent CSAT of 77
Rated higher than cable on ACSI Overall Satisfaction for 13 years in a row
Capacity to complete installs in < 4 days and service calls in < 2.5 days
95% appointment on ‐time arrival rate
Post visit satisfaction level of 96
16k Agents117M Calls38 Locations
15k Technicians110M Work Orders250 Locations
102
Optimized national footprint between Owned & Operated and Strategic PartnersInsourced 40% of field operations in order to improve customer service levelsBrought in‐house critical call types (e.g., retention, technical)
Heightened focus on ‘First Time Right’ mindsetDedicated service technicians program to reduce repeat service callsImproved call routing and diagnostic tools to optimize our first call resolutionEstablished quality control program to improve equipment reliabilityDeployed Install Verification technology to ensure quality thresholds are met at point of service delivery
Increased employee and management engagement Reduced frontline employee turnover by 50%Realigned internal and partner incentives to align with service and quality goals
Foundational Strategies to Improve Service and Productivity
8/13/2019 DIRECTV InvestorDay Dec 12 2013 Print (1)
http://slidepdf.com/reader/full/directv-investorday-dec-12-2013-print-1 52/875
103
Call Volume/Contact
Rate
Agent/Tech Churn, %
Service Truck Roll Volume/% of Base
Engagement Scores
1.51%1.38% 1.38%
1.0
1.5
2.0
0
1,000
2,000
3,000
4,000
Reducing Customer Contacts and Improving Employee Engagement
0.59 0.57 0.54 0.52
00.10.20.30.40.50.60.7
0
50,000
100,000
150,000
1211102009 2013E
0.63Contact rateCall volume
1110
1.59%
2009
1.83%
2013E12
Service % to baseService call volume
6154
4436 33
1211102009 2013E
82 76 82 83 86
2013E1211102009
Our focus on quality has reduced customer contacts…
And our employee focus has resulted in a more tenured, engaged workforce
2.0%
1.5%
1.0%
104
Supply Chain & Logistics
Service & Repair
Supply Chain Improvements
Service & Repair Improvements
8M boxes refurbished / repaired annually5k vendor employees in 5 locations in U.S. and near shore
Warranty Plan >9M customers with ~$900M in Annual Revenue
Recover >9M boxes annually, 84% Recovery of disconnects
Purchase 10M new boxes annually
Total inventory purchased is ~125M pieces and $1.9B in value
Improved Equipment Reliability at Reduced Costs
40% reduction in equipment failure rates
Expanded Warranty Plan with launch of Premier Protection Plan
Reduced OEM equipment pricing
Reduced warehousing and freight spend
> $120M reduction in inventory working capital
8/13/2019 DIRECTV InvestorDay Dec 12 2013 Print (1)
http://slidepdf.com/reader/full/directv-investorday-dec-12-2013-print-1 53/875
105
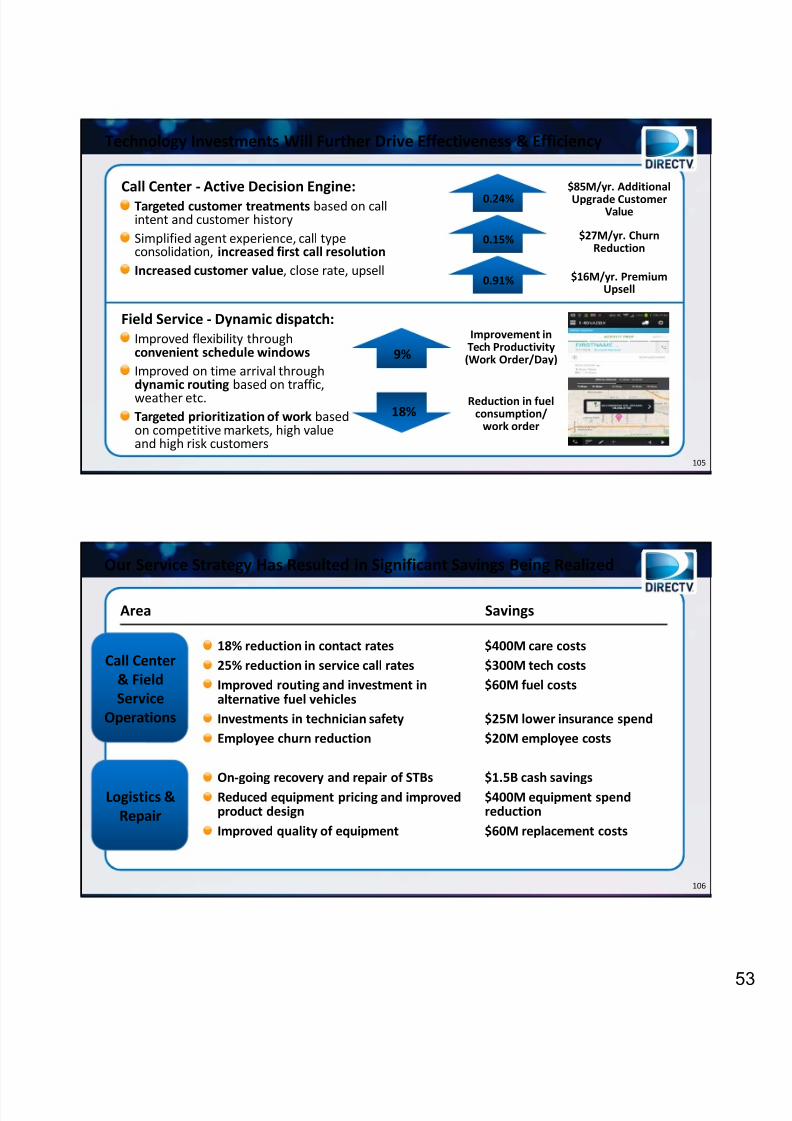
Technology Investments Will Further Drive Effectiveness & Efficiency
Call Center ‐ Active Decision Engine:Targeted customer treatments based on call intent and customer historySimplified agent experience, call type consolidation, increased first call resolutionIncreased customer value , close rate, upsell
0.24%
0.15%
0.91%
$85M/yr. AdditionalUpgrade Customer
Value
$27M/yr. ChurnReduction
$16M/yr. PremiumUpsell
Field Service ‐ Dynamic dispatch:Improved flexibility through convenient schedule windowsImproved on time arrival through dynamic routing based on traffic, weather etc.Targeted prioritization of work based on competitive markets, high value and high risk customers
9%Improvement in Tech Productivity (Work Order/Day)
Reduction in fuel consumption/
work order18%
106
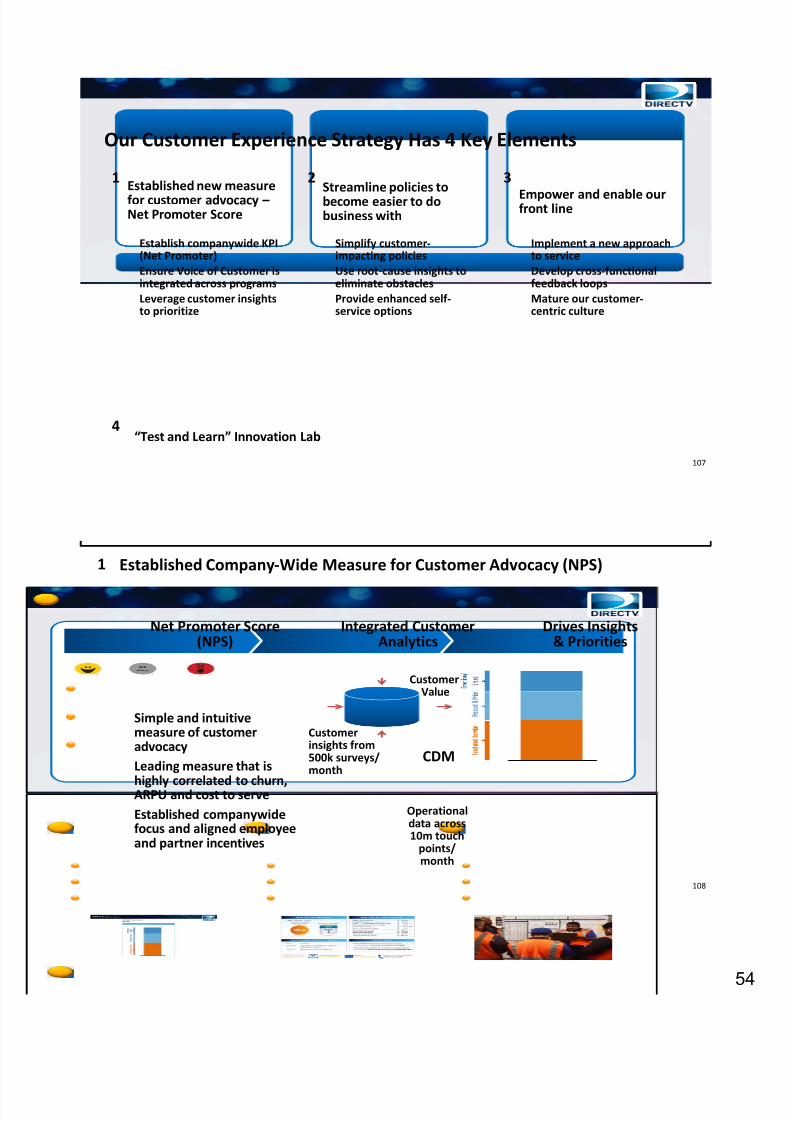
Our Service Strategy Has Resulted in Significant Savings Being Realized
$400M care costs$300M tech costs$60M fuel costs
$25M lower insurance spend$20M employee costs
$1.5B cash savings$400M equipment spend reduction$60M replacement costs
18% reduction in contact rates 25% reduction in service call rates Improved routing and investment in alternative fuel vehicles Investments in technician safetyEmployee churn reduction
On‐going recovery and repair of STBs Reduced equipment pricing and improved product design Improved quality of equipment
SavingsArea
Call Center & Field Service
Operations
Logistics & Repair
8/13/2019 DIRECTV InvestorDay Dec 12 2013 Print (1)
http://slidepdf.com/reader/full/directv-investorday-dec-12-2013-print-1 54/87
8/13/2019 DIRECTV InvestorDay Dec 12 2013 Print (1)
http://slidepdf.com/reader/full/directv-investorday-dec-12-2013-print-1 55/875
109
Improved Self ‐care Drives Productivity
Simplify Offers
and
Billing Increase
Loyalty
Through
Targeted
Upgrades
Impact
5% reduction in YOY contact rate
20% reduction in YOY escalations
58% take rate for Enhanced Protection Plan
Increased product engagement ‐ 40% of base on Whole Home DVR platform
Streamlining Policies to Become Easier to Do Business With2
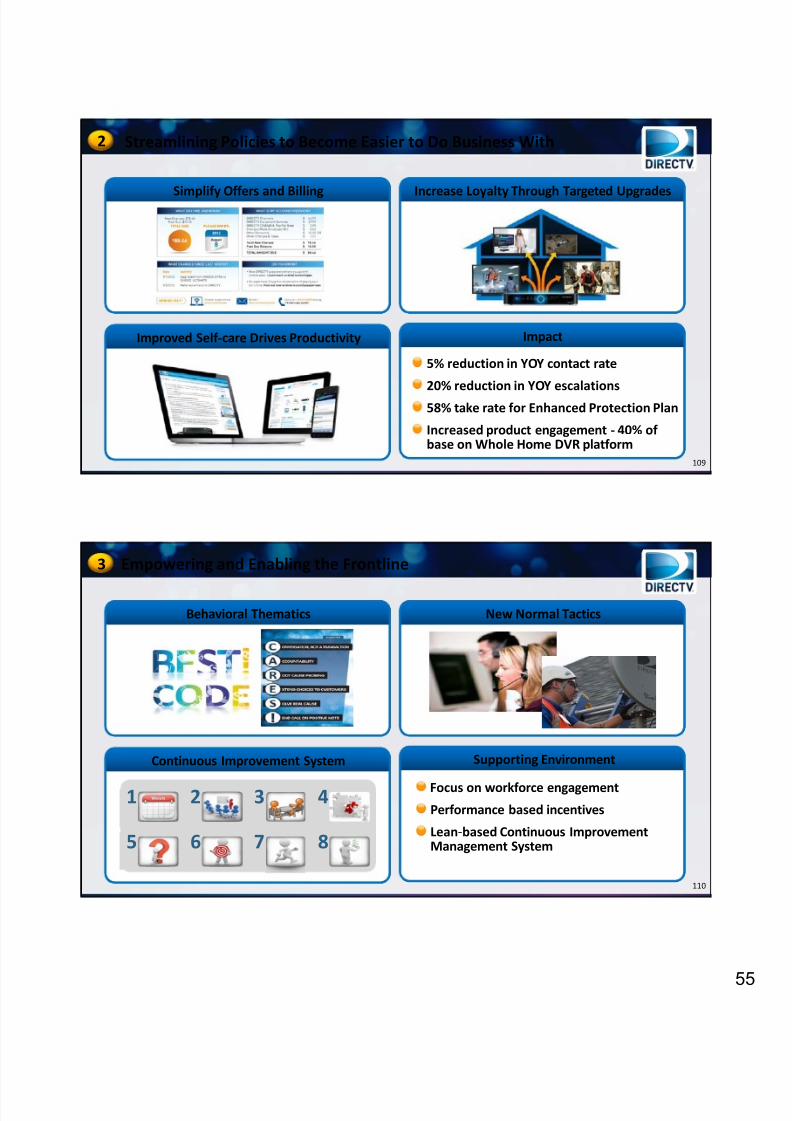
110
Continuous Improvement System
Behavioral Thematics New Normal Tactics
Supporting Environment
Empowering and Enabling the Frontline
5 6 87
1 2 3 4 Focus on workforce engagementPerformance based incentives
Lean ‐based Continuous Improvement Management System
3
8/13/2019 DIRECTV InvestorDay Dec 12 2013 Print (1)
http://slidepdf.com/reader/full/directv-investorday-dec-12-2013-print-1 56/875
111
Frontline Video3
112
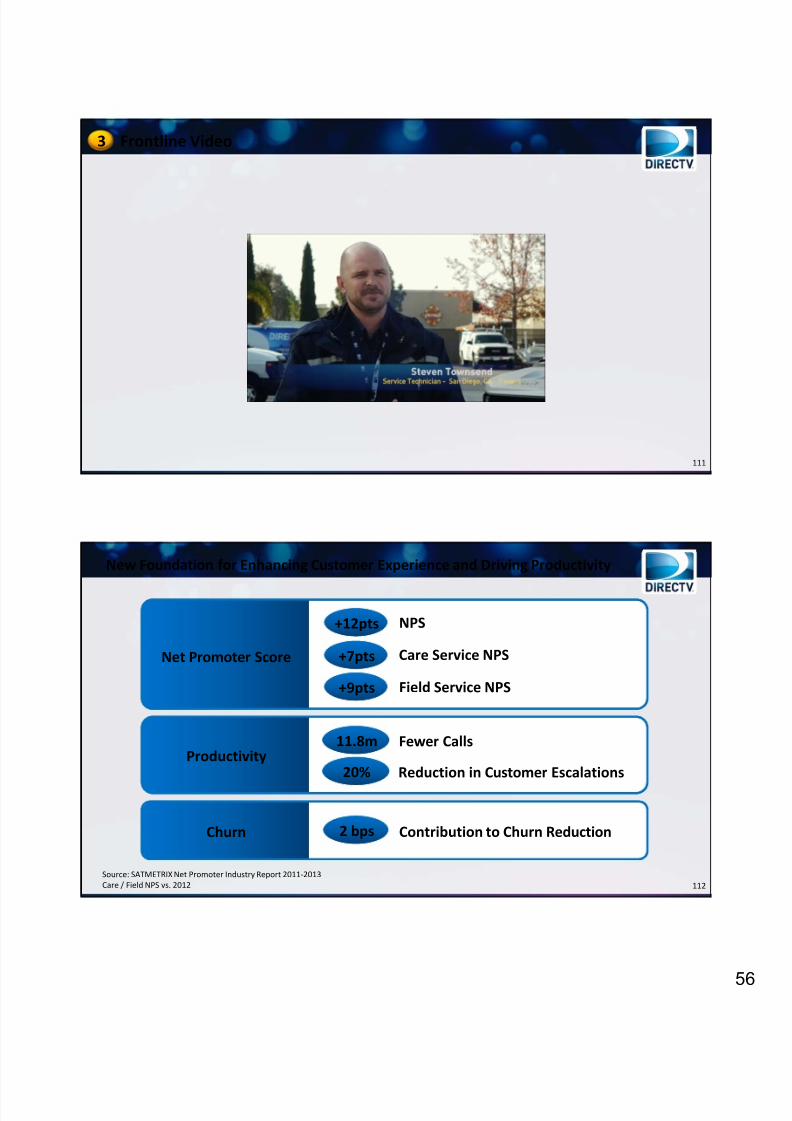
New Foundation for Enhancing Customer Experience and Driving Productivity
Source: SATMETRIX Net Promoter Industry Report 2011 ‐2013Care / Field NPS vs. 2012
Net Promoter Score
11.8m Fewer Calls
+12pts NPS
+7pts Care Service NPS
2 bps
+9pts Field Service NPS
Productivity
Churn
20% Reduction in Customer Escalations
Contribution to Churn Reduction
8/13/2019 DIRECTV InvestorDay Dec 12 2013 Print (1)
http://slidepdf.com/reader/full/directv-investorday-dec-12-2013-print-1 57/875
Revenue & MarketingPaul GuyardoExecutive Vice PresidentChief Revenue & Marketing Officer
All trademarks and service marks are the property of their respective owners
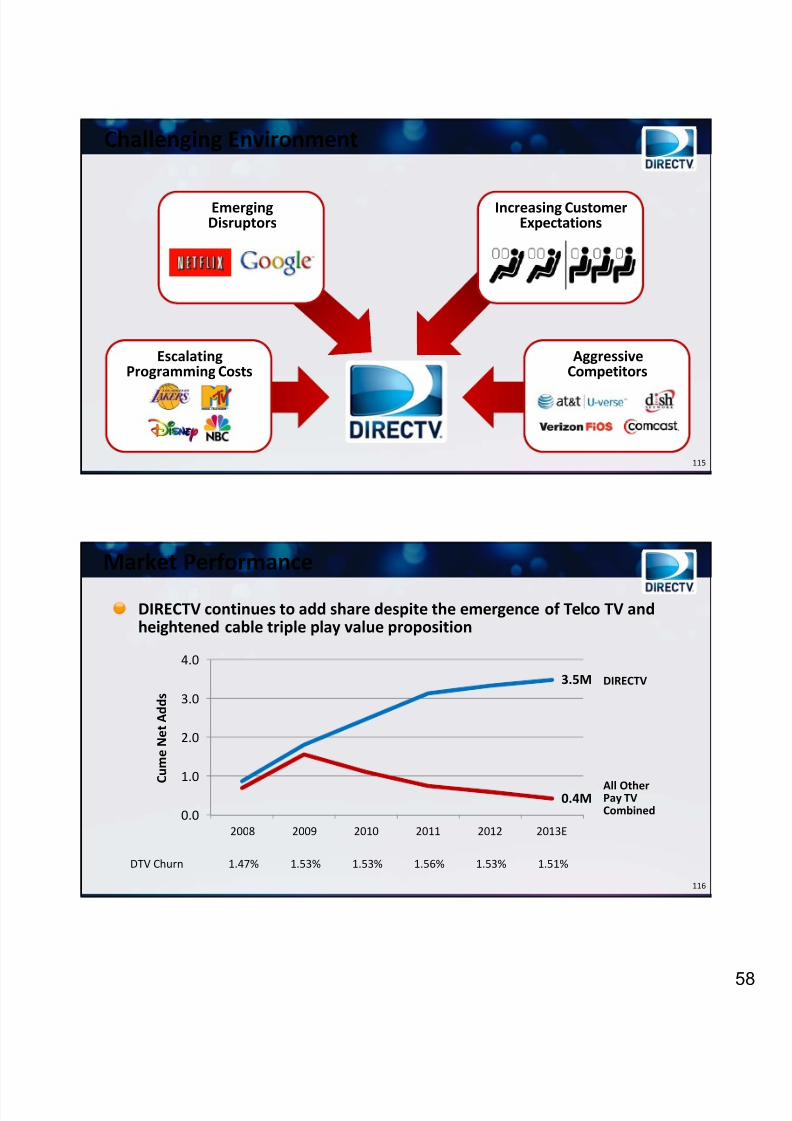
114
Drivers of Pricing Power and Subscriber Growth
Differentiated Technology, Content and Service
World ‐ClassAdvertising & Marketing
TargetHigh‐Value Customers
8/13/2019 DIRECTV InvestorDay Dec 12 2013 Print (1)
http://slidepdf.com/reader/full/directv-investorday-dec-12-2013-print-1 58/875
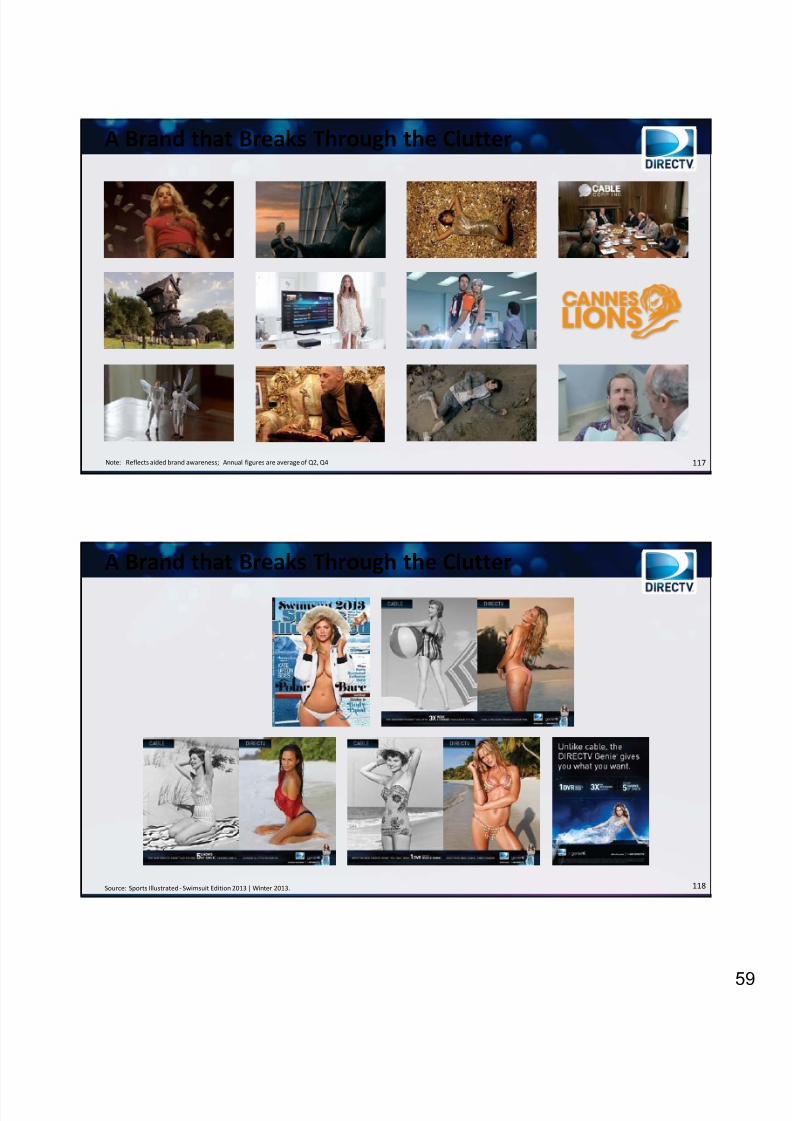
115
Escalating Programming Costs
Aggressive Competitors
Challenging Environment
Increasing Customer Expectations
Emerging Disruptors
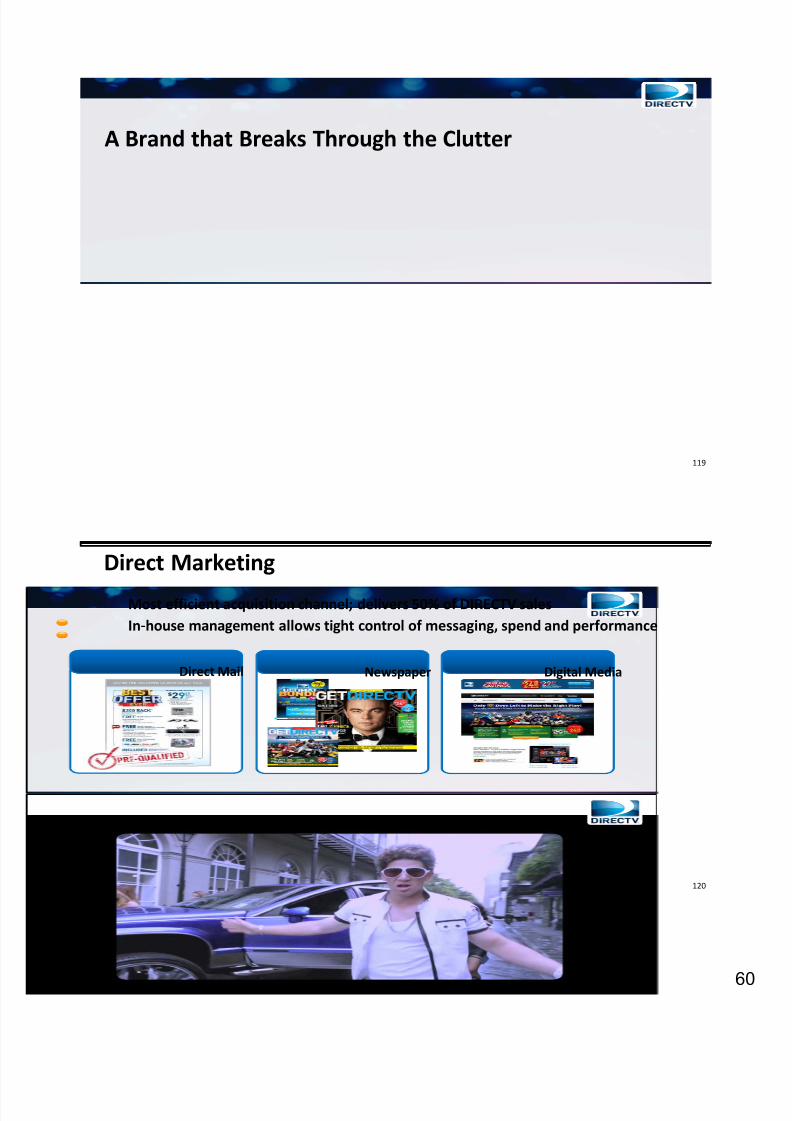
116
Market Performance
0.0
1.0
2.0
3.0
4.0
2008 2009 2010 2011 2012 2013E
C u m e N e t A d d s
DIRECTV continues to add share despite the emergence of Telco TV and heightened cable triple play value proposition
DTV Churn 1.47% 1.53% 1.53% 1.56% 1.53% 1.51%
3.5M
0.4M
DIRECTV
All Other Pay TVCombined
8/13/2019 DIRECTV InvestorDay Dec 12 2013 Print (1)
http://slidepdf.com/reader/full/directv-investorday-dec-12-2013-print-1 59/87
8/13/2019 DIRECTV InvestorDay Dec 12 2013 Print (1)
http://slidepdf.com/reader/full/directv-investorday-dec-12-2013-print-1 60/87
8/13/2019 DIRECTV InvestorDay Dec 12 2013 Print (1)
http://slidepdf.com/reader/full/directv-investorday-dec-12-2013-print-1 61/876
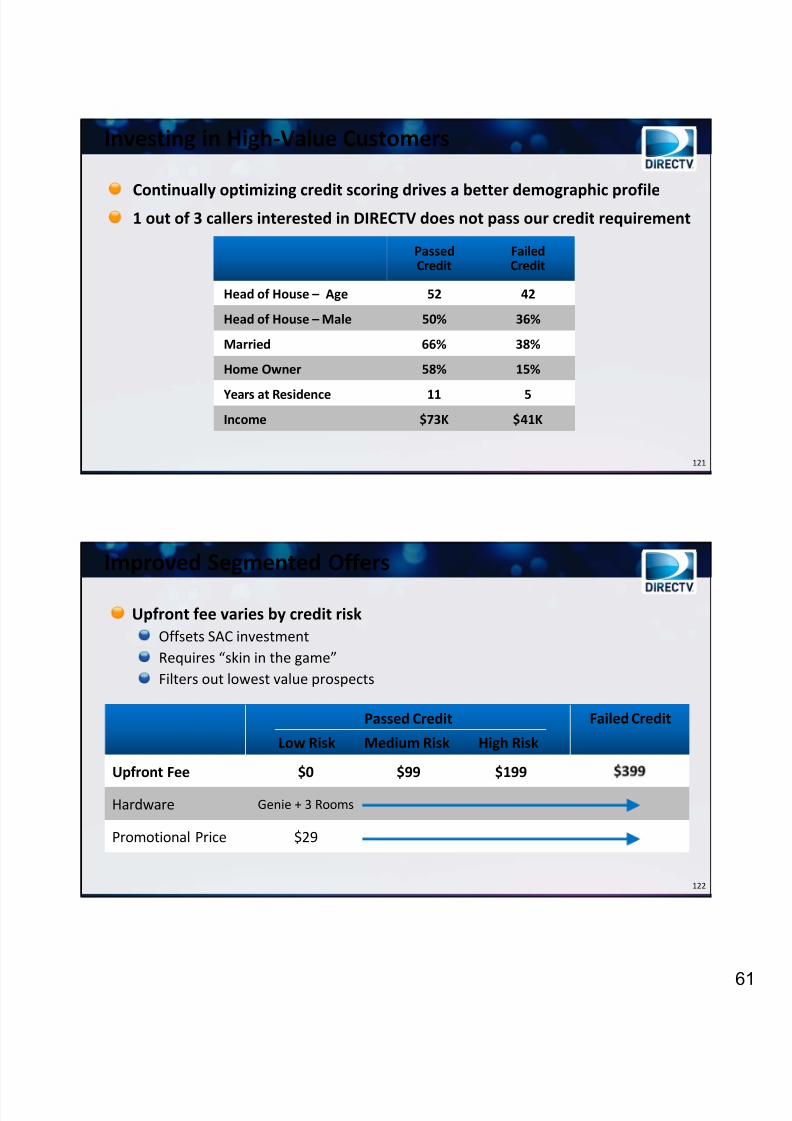
121
Investing in High‐Value Customers
Continually optimizing
credit
scoring
drives
a better
demographic
profile
1 out of 3 callers interested in DIRECTV does not pass our credit requirement
PassedCredit
FailedCredit
Head of House – Age 52 42
Head of House – Male 50% 36%
Married 66% 38%
Home Owner 58% 15%
Years at Residence 11 5Income $73K $41K
122
Improved Segmented Offers
Upfront fee varies by credit risk Offsets SAC investment Requires “skin in the game”Filters out lowest value prospects
Passed Credit
Low Risk Medium Risk High Risk
Failed Credit
Upfront Fee $0 $99 $199
Hardware Genie + 3 Rooms
Promotional Price $29
8/13/2019 DIRECTV InvestorDay Dec 12 2013 Print (1)
http://slidepdf.com/reader/full/directv-investorday-dec-12-2013-print-1 62/876
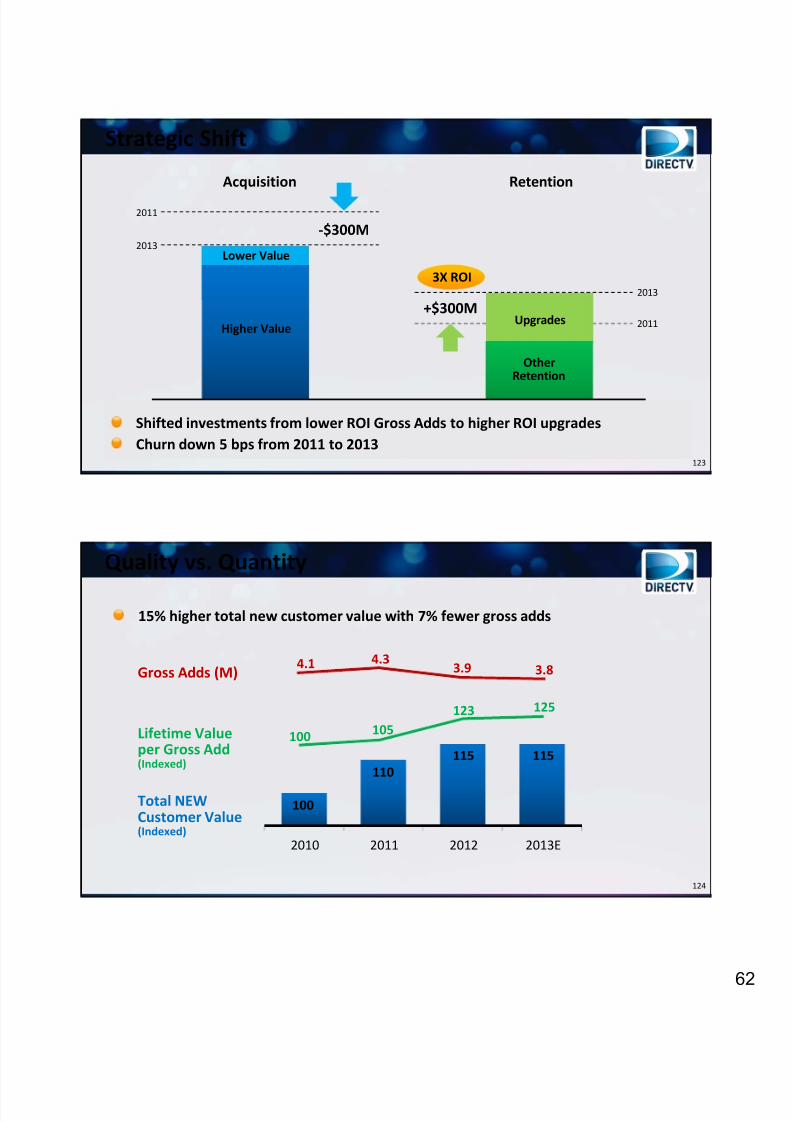
123
Strategic Shift
Acquisition Retention
2011
3X ROI
Upgrades
Lower Value
Higher Value
Other Retention
Shifted investments from lower ROI Gross Adds to higher ROI upgradesChurn down 5 bps from 2011 to 2013
2013
2011
2013
+$300M
‐$300M
124
2010 2011 2012 2013E
100
110115 115
Quality vs. Quantity
15% higher total new customer value with 7% fewer gross adds
Total NEW Customer Value (Indexed)
Lifetime Value per Gross Add(Indexed)
100 105123 125
4.1 4.33.9 3.8Gross Adds (M)
8/13/2019 DIRECTV InvestorDay Dec 12 2013 Print (1)
http://slidepdf.com/reader/full/directv-investorday-dec-12-2013-print-1 63/876
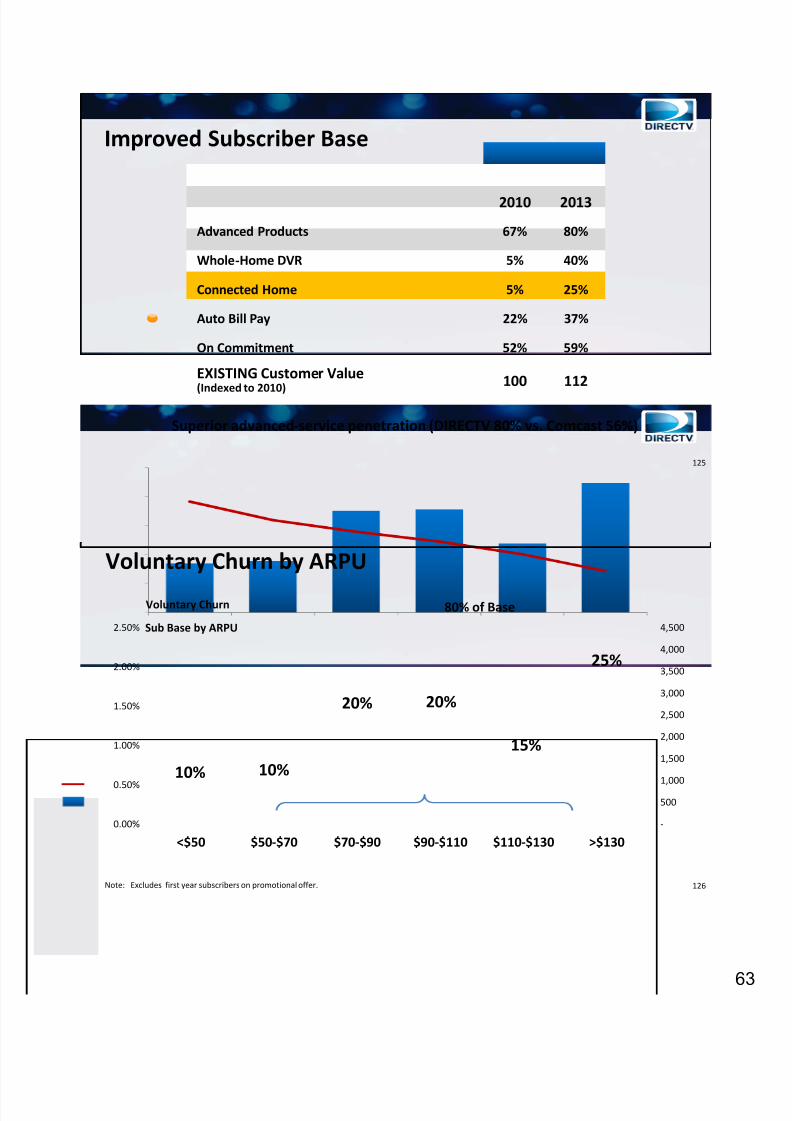
125
Improved Subscriber Base
Superior advanced ‐service penetration (DIRECTV 80% vs. Comcast 56%)
2010 2013
Advanced Products 67% 80%
Whole ‐Home DVR 5% 40%
Connected Home 5% 25%
Auto Bill Pay 22% 37%
On Commitment 52% 59%
EXISTING Customer Value
(Indexed to 2010)
100 112
126
Voluntary Churn by ARPU
Note: Excludes first year subscribers on promotional offer.
10% 10%
20% 20%
15%
25%
‐
500
1,000
1,500
2,000
2,500
3,000
3,500
4,000
4,500
0.00%
0.50%
1.00%
1.50%
2.00%
2.50%
<$50 $50 ‐$70 $70 ‐$90 $90 ‐$110 $110 ‐$130 >$130
80% of BaseVoluntary Churn
Sub Base by ARPU
8/13/2019 DIRECTV InvestorDay Dec 12 2013 Print (1)
http://slidepdf.com/reader/full/directv-investorday-dec-12-2013-print-1 64/876
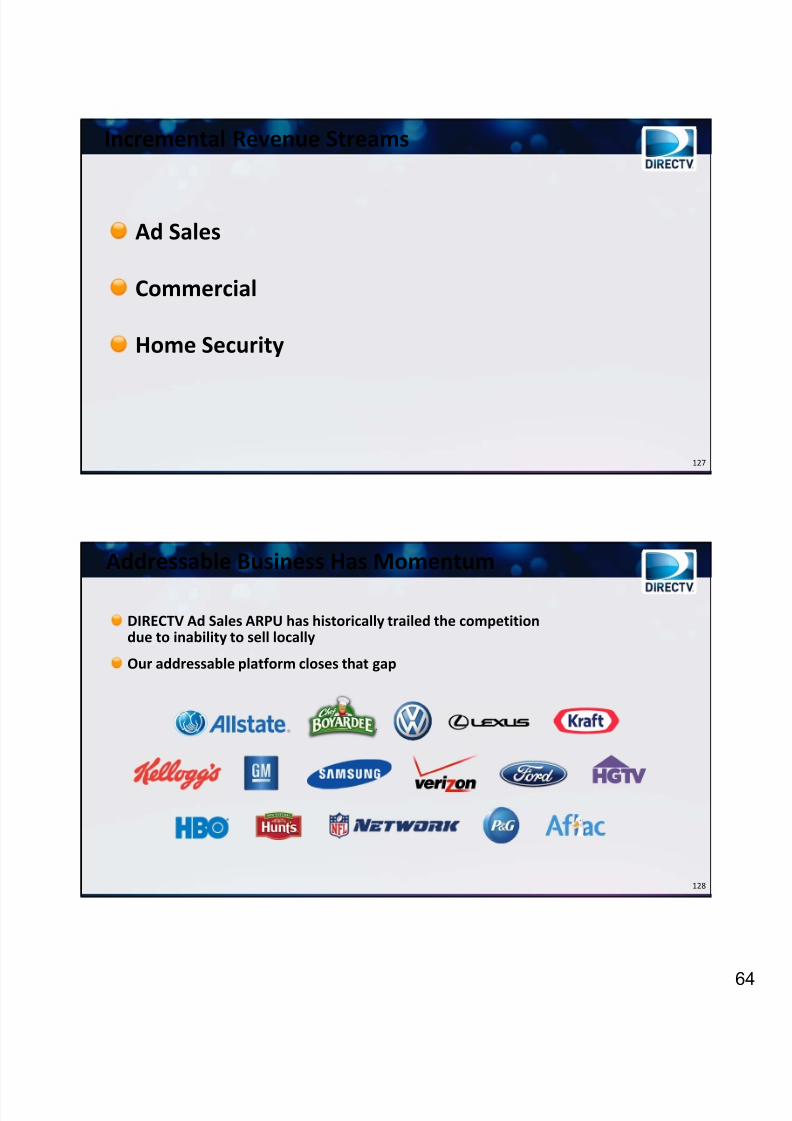
127
Ad Sales
Commercial
Home Security
Incremental Revenue Streams
128
Addressable Business Has Momentum
DIRECTV Ad Sales ARPU has historically trailed the competition due to inability to sell locally
Our addressable platform closes that gap
8/13/2019 DIRECTV InvestorDay Dec 12 2013 Print (1)
http://slidepdf.com/reader/full/directv-investorday-dec-12-2013-print-1 65/876
129
130
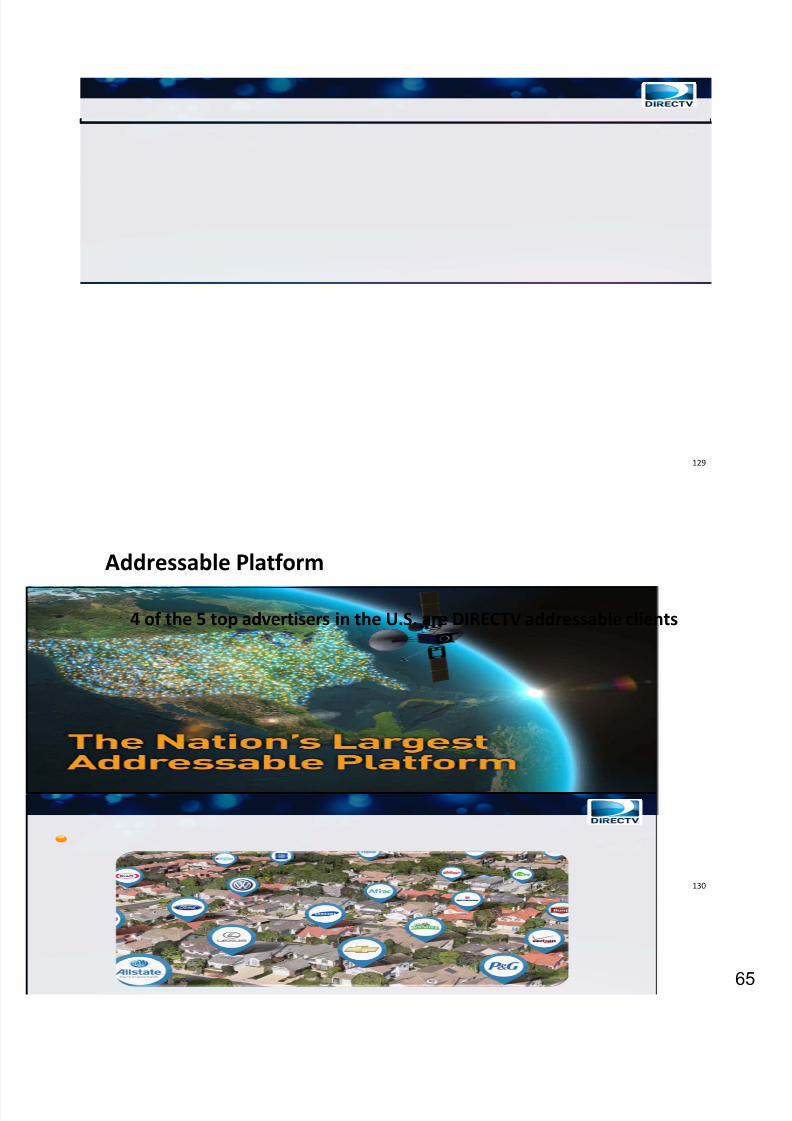
Addressable Platform
4 of the 5 top advertisers in the U.S. are DIRECTV addressable clients
8/13/2019 DIRECTV InvestorDay Dec 12 2013 Print (1)
http://slidepdf.com/reader/full/directv-investorday-dec-12-2013-print-1 66/876
131
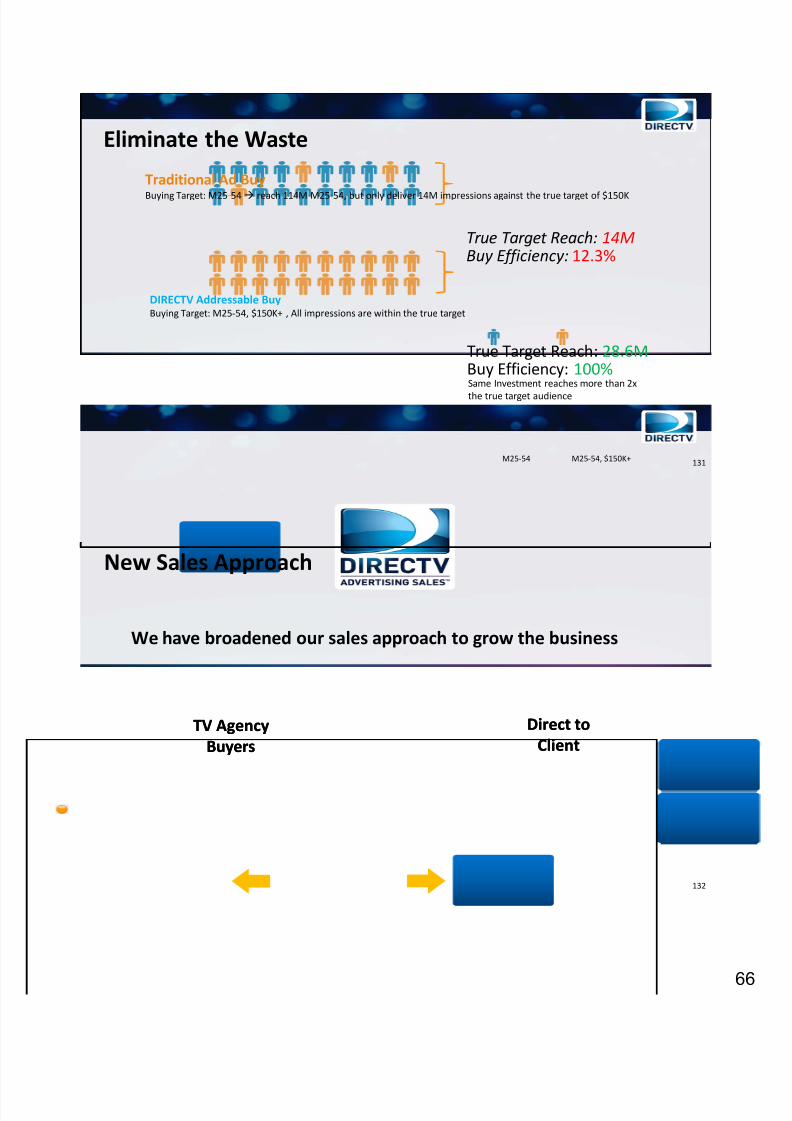
Traditional Ad BuyBuying Target: M25 ‐54 reach 114M M25 ‐54, but only deliver 14M impressions against the true target of $150K
True Target Reach: 14MBuy Efficiency: 12.3%
DIRECTV Addressable Buy Buying Target: M25 ‐54, $150K+ , All impressions are within the true target
Same Investment reaches more than 2x the true target audience
True Target Reach : 28.6MBuy Efficiency: 100%
M25 ‐54 M25 ‐54, $150K+
Eliminate the Waste
132
New Sales Approach
TV AgencyBuyers
TV AgencyBuyers
Direct to Client
Direct to Client
We have broadened our sales approach to grow the business
8/13/2019 DIRECTV InvestorDay Dec 12 2013 Print (1)
http://slidepdf.com/reader/full/directv-investorday-dec-12-2013-print-1 67/876
133
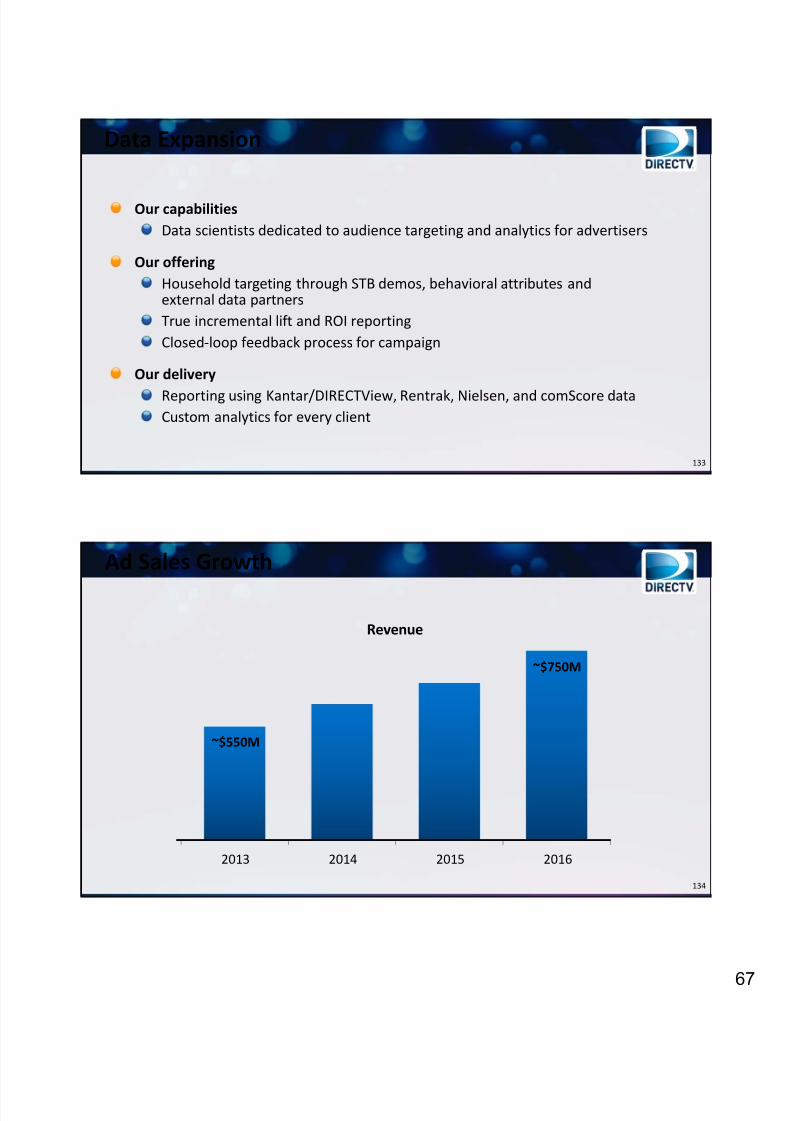
Data Expansion
Our capabilitiesData scientists dedicated to audience targeting and analytics for advertisers
Our offeringHousehold targeting through STB demos, behavioral attributes and external data partnersTrue incremental lift and ROI reporting Closed ‐loop feedback process for campaign
Our delivery
Reporting using Kantar/DIRECTView, Rentrak, Nielsen, and comScore dataCustom analytics for every client
134
Ad Sales Growth
2013 2014 2015 2016
~$550M
Revenue
~$750M
8/13/2019 DIRECTV InvestorDay Dec 12 2013 Print (1)
http://slidepdf.com/reader/full/directv-investorday-dec-12-2013-print-1 68/876
135
Ad Sales
Commercial
Home Security
Incremental Revenue Streams
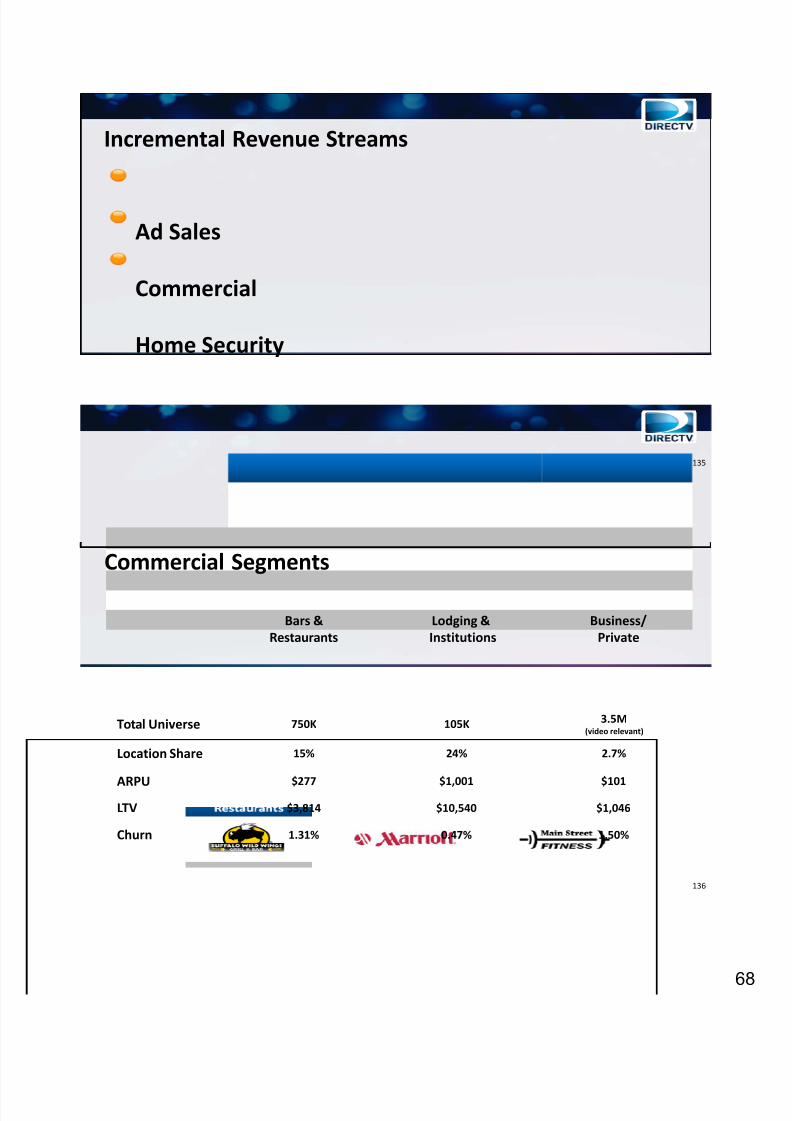
136
Bars & Restaurants
Lodging &Institutions
Business/Private
Total Universe 750K 105K 3.5M (video relevant)
Location Share 15% 24% 2.7%
ARPU
$277 $1,001 $101LTV $3,814 $10,540 $1,046
Churn 1.31% 0.47% 1.50%
Commercial Segments
8/13/2019 DIRECTV InvestorDay Dec 12 2013 Print (1)
http://slidepdf.com/reader/full/directv-investorday-dec-12-2013-print-1 69/876
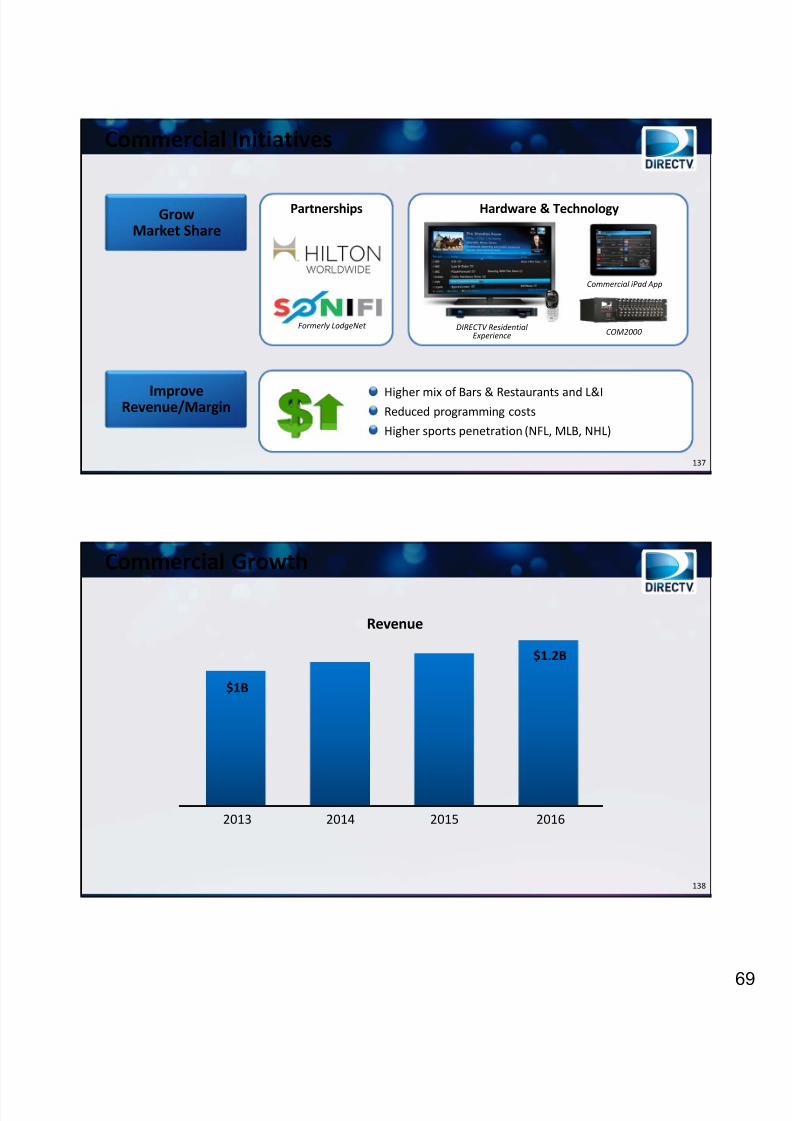
137
Hardware & Technology
Commercial Initiatives
Grow Market Share
Improve Revenue/Margin Higher mix of Bars & Restaurants and L&IReduced programming costs
Higher sports penetration (NFL, MLB, NHL)
Partnerships
DIRECTV Residential Experience
Commercial iPad App
COM2000Formerly LodgeNet
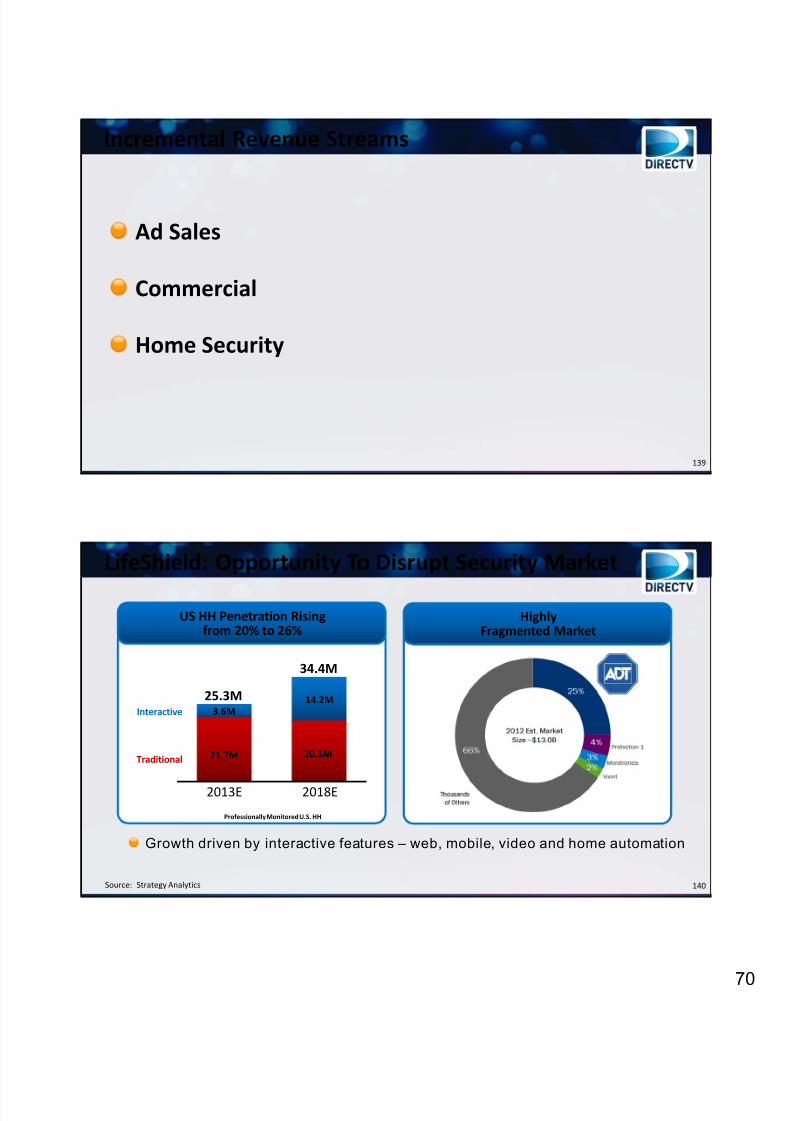
138
Commercial Growth
2016201520142013
$1B
Revenue
$1.2B
8/13/2019 DIRECTV InvestorDay Dec 12 2013 Print (1)
http://slidepdf.com/reader/full/directv-investorday-dec-12-2013-print-1 70/877
139
Ad Sales
Commercial
Home Security
Incremental Revenue Streams
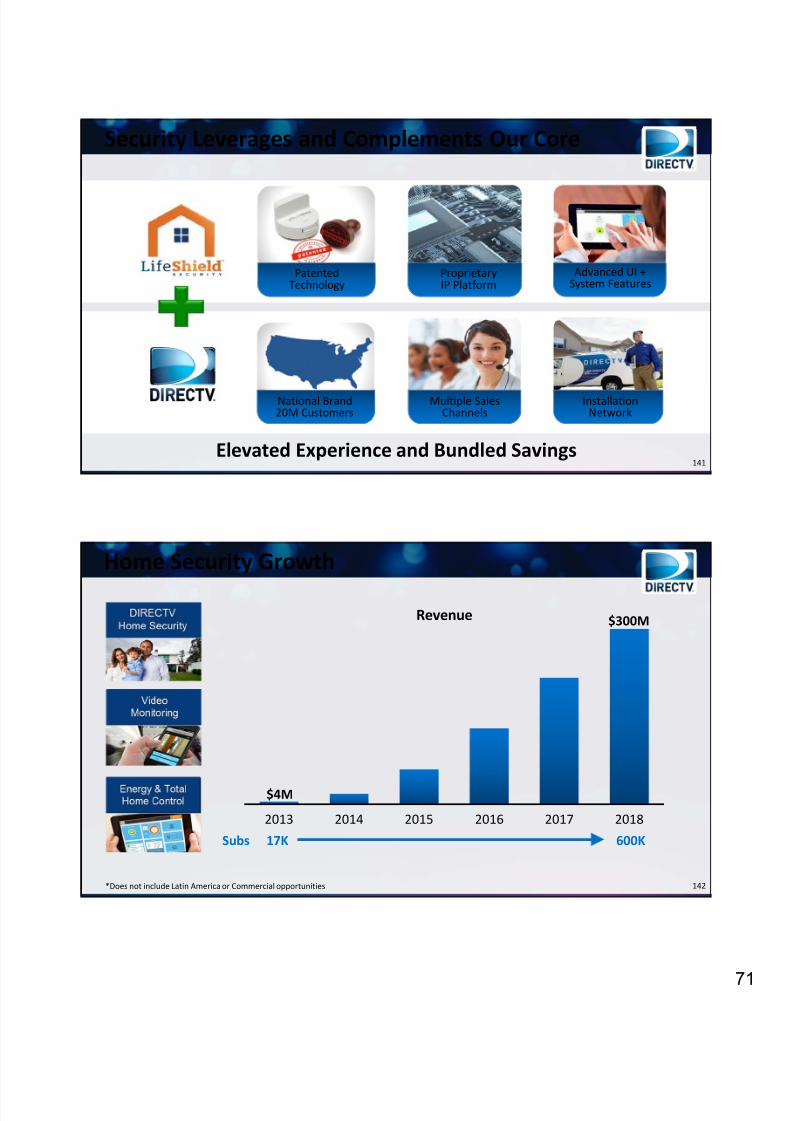
140
US HH Penetration Rising from 20% to 26%
HighlyFragmented Market
LifeShield: Opportunity To Disrupt Security Market
Professionally Monitored U.S. HH
Traditional
34.4M
2013E
Interactive
2018E
3.6M
21.7M
14.2M
20.1M
25.3M
Source: Strategy Analytics
Growth driven by interactive features – web, mobile, video and home automation
8/13/2019 DIRECTV InvestorDay Dec 12 2013 Print (1)
http://slidepdf.com/reader/full/directv-investorday-dec-12-2013-print-1 71/877
141
Security Leverages and Complements Our Core
Elevated Experience and Bundled Savings
InstallationNetwork
National Brand20M Customers
Multiple SalesChannels
Advanced UI + System Features
Patented Technology
ProprietaryIP Platform
142
Home Security Growth
2016201520142013
$4M
2018
$300M
2017
Subs 17K 600K
*Does not include Latin America or Commercial opportunities
Revenue
8/13/2019 DIRECTV InvestorDay Dec 12 2013 Print (1)
http://slidepdf.com/reader/full/directv-investorday-dec-12-2013-print-1 72/877
143
Our Path Forward
Continue to innovate and execute core business with excellence
Further develop pricing & packaging for price ‐conscious segment
Generate significant incremental annual revenue within 3 to 5 years through Ad Sales, Commercial and Home Security
Develop additional revenue streams (SVOD, EST)
Explore alternative business models and lower ‐SAC solutions to expand beyond existing traditional subscriber base (OTT)
Play TV Commercials
8/13/2019 DIRECTV InvestorDay Dec 12 2013 Print (1)
http://slidepdf.com/reader/full/directv-investorday-dec-12-2013-print-1 73/877
DIRECTV U.S.Driving Sustainable Profitable GrowthPat DoyleExecutive Vice President and CFO
All trademarks and service marks are the property of their respective owners
146
Driving Sustainable Profitable Growth
Our Consistent Track RecordDrive Value in the Core Video Business
Attaining Mid‐Single Digit Revenue GrowthFocusing on Higher Quality and High LTV Gross AdditionsTargeting High Return Upgrade and Retention OffersEffectively Manage ChurnDriving Average Margin per User GrowthAggressively Manage Costs
Generate Incremental Ancillary Revenue StreamsCommercial
Ad‐SalesHome Security Monitoring
SVOD/EST/OTTEfficient Capital Allocation
Driving strong ROICHow we measure Financial Success
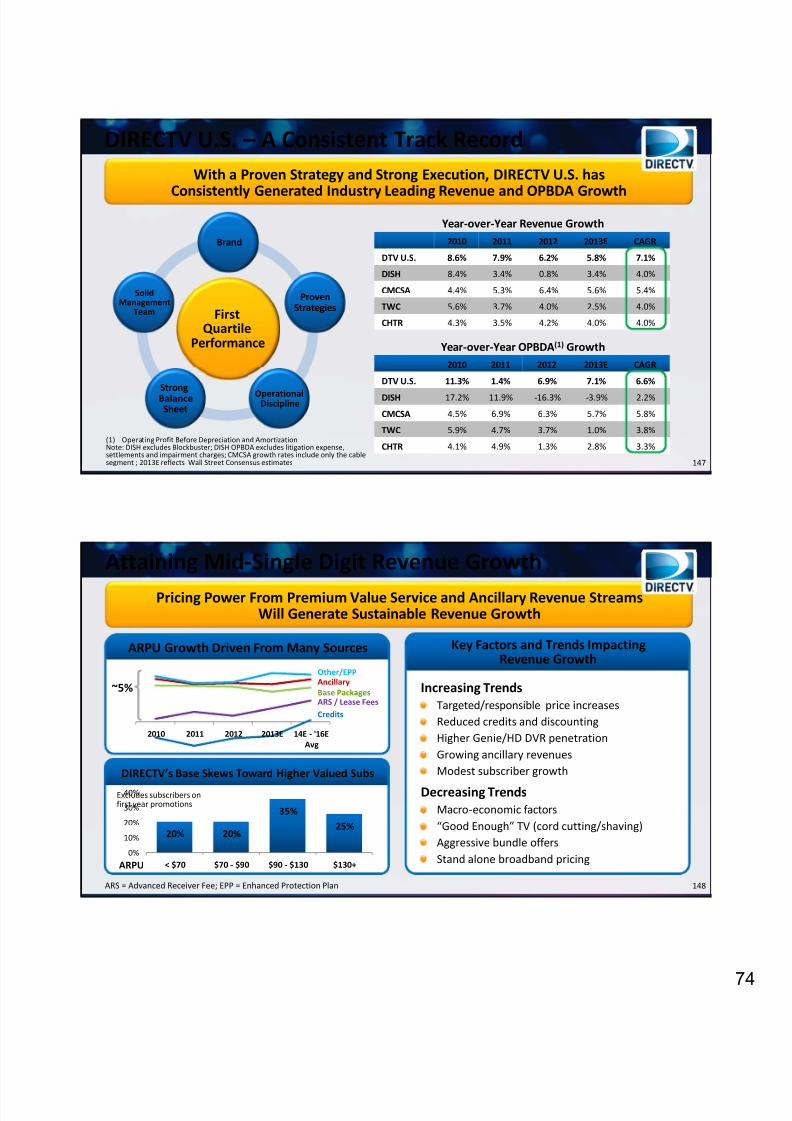
8/13/2019 DIRECTV InvestorDay Dec 12 2013 Print (1)
http://slidepdf.com/reader/full/directv-investorday-dec-12-2013-print-1 74/877
147
(1) Operating Profit Before Depreciation and AmortizationNote: DISH excludes Blockbuster; DISH OPBDA excludes litigation expense, settlements and impairment charges; CMCSA growth rates include only the cable segment ; 2013E reflects Wall Street Consensus estimates
DIRECTV U.S. – A Consistent Track Record
Year ‐over ‐Year Revenue Growth2010 2011 2012 2013E CAGR
DTV U.S. 8.6% 7.9% 6.2% 5.8% 7.1%
DISH 8.4% 3.4% 0.8% 3.4% 4.0%
CMCSA 4.4% 5.3% 6.4% 5.6% 5.4%
TWC 5.6% 3.7% 4.0% 2.5% 4.0%
CHTR 4.3% 3.5% 4.2% 4.0% 4.0%
Year ‐over ‐Year OPBDA(1) Growth2010 2011 2012 2013E CAGR
DTV U.S. 11.3% 1.4% 6.9% 7.1% 6.6%
DISH 17.2% 11.9% ‐16.3% ‐3.9% 2.2%
CMCSA 4.5% 6.9% 6.3% 5.7% 5.8%
TWC 5.9% 4.7% 3.7% 1.0% 3.8%
CHTR 4.1% 4.9% 1.3% 2.8% 3.3%
With a Proven Strategy and Strong Execution, DIRECTV U.S. has
Consistently Generated
Industry
Leading
Revenue
and
OPBDA
Growth
First Quartile
Performance
Brand
ProvenStrategies
Operational Discipline
Strong BalanceSheet
SolidManagement
Team
148
Key Factors and Trends Impacting Revenue Growth
DIRECTV’s Base Skews Toward Higher Valued Subs
Attaining Mid ‐Single Digit Revenue Growth
Increasing TrendsTargeted/responsible price increasesReduced credits and discountingHigher Genie/HD DVR penetrationGrowing ancillary revenuesModest subscriber growth
Decreasing TrendsMacro ‐economic factors“Good Enough” TV (cord cutting/shaving)Aggressive bundle offersStand alone broadband pricing
Pricing Power From Premium Value Service and Ancillary Revenue Streams Will Generate Sustainable Revenue Growth
ARS = Advanced Receiver Fee; EPP = Enhanced Protection Plan
ARPU Growth Driven From Many Sources
Credits
AncillaryOther/EPP
Base PackagesARS / Lease Fees
2010 2011 2012 2013E 14E ‐ '16EAvg
20% 20%
35%25%
0%
10%
20%
30%
40%
< $70 $70 ‐ $90 $90 ‐ $130 $130+
Excludes subscribers on first year promotions
ARPU
~5%
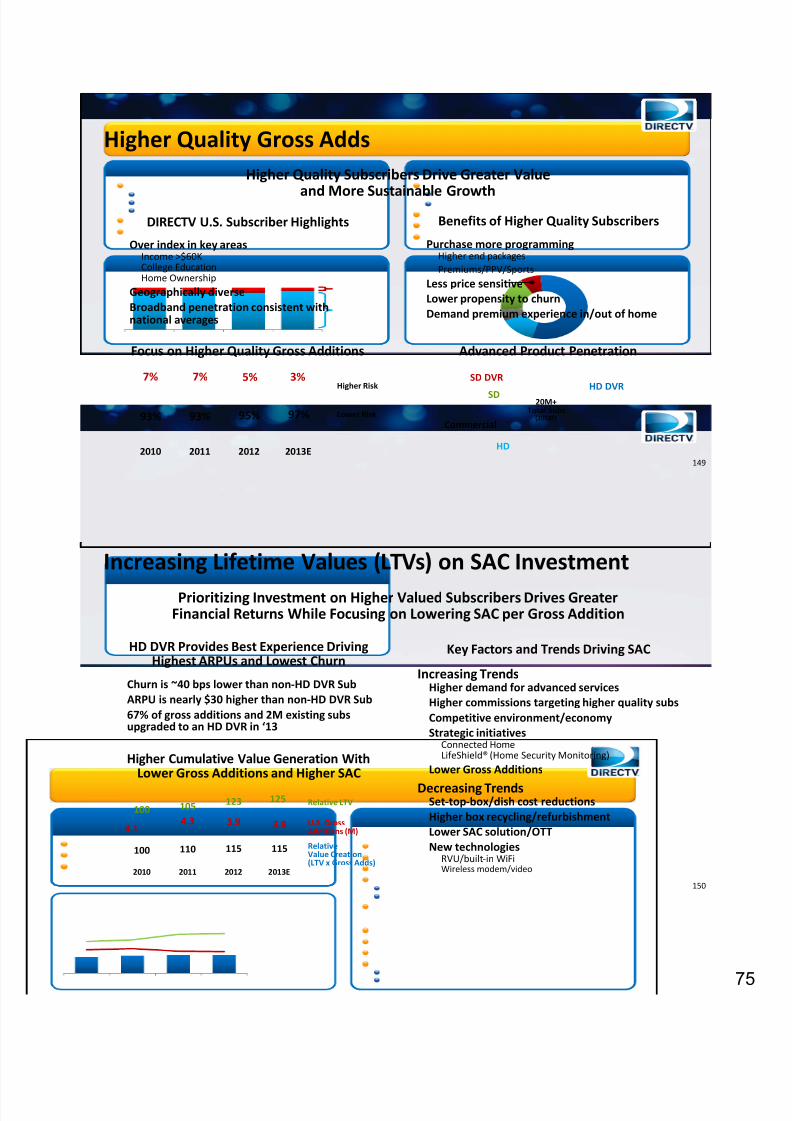
8/13/2019 DIRECTV InvestorDay Dec 12 2013 Print (1)
http://slidepdf.com/reader/full/directv-investorday-dec-12-2013-print-1 75/877
149
Focus on Higher Quality Gross Additions Advanced Product Penetration
Benefits of Higher Quality SubscribersDIRECTV U.S. Subscriber Highlights
Higher Quality Gross Adds
Over index in key areasIncome >$60K College EducationHome Ownership
Geographically diverseBroadband penetration consistent with national averages
Higher Quality Subscribers Drive Greater Value
and More
Sustainable
Growth
Purchase more programmingHigher end packagesPremiums/PPV/Sports
Less price sensitiveLower propensity to churnDemand premium experience in/out of home
20M+ Total Subs
(2013E)Commercial
SD
SD DVRHD DVR
HD
93% 93% 95% 97%
7% 7% 5% 3%
2010 2011 2012 2013E
Lower Risk
Higher Risk
150
Higher Cumulative Value Generation With Lower Gross Additions and Higher SAC
HD DVR Provides Best Experience Driving Highest ARPUs and Lowest Churn
Key Factors and Trends Driving SAC
Increasing Lifetime Values (LTVs) on SAC Investment
Increasing TrendsHigher demand for advanced servicesHigher commissions targeting higher quality subsCompetitive environment/economyStrategic initiatives
Connected HomeLifeShield® (Home Security Monitoring)
Lower Gross Additions
Decreasing TrendsSet ‐top ‐box/dish cost reductionsHigher box recycling/refurbishmentLower SAC solution/OTTNew technologies
RVU/built‐in WiFiWireless modem/video
Relative LTV
U.S. Gross Additions (M)
Relative Value Creation (LTV x Gross Adds)
Churn is ~40 bps lower than non ‐HD DVR Sub ARPU is nearly $30 higher than non ‐HD DVR Sub 67% of gross additions and 2M existing subs upgraded to an HD DVR in ‘13
Prioritizing Investment on Higher Valued Subscribers Drives Greater Financial Returns While Focusing on Lowering SAC per Gross Addition
100 110 115 115
4.1 4.3 3.9 3.8 100 105 123 125
2010 2011 2012 2013E
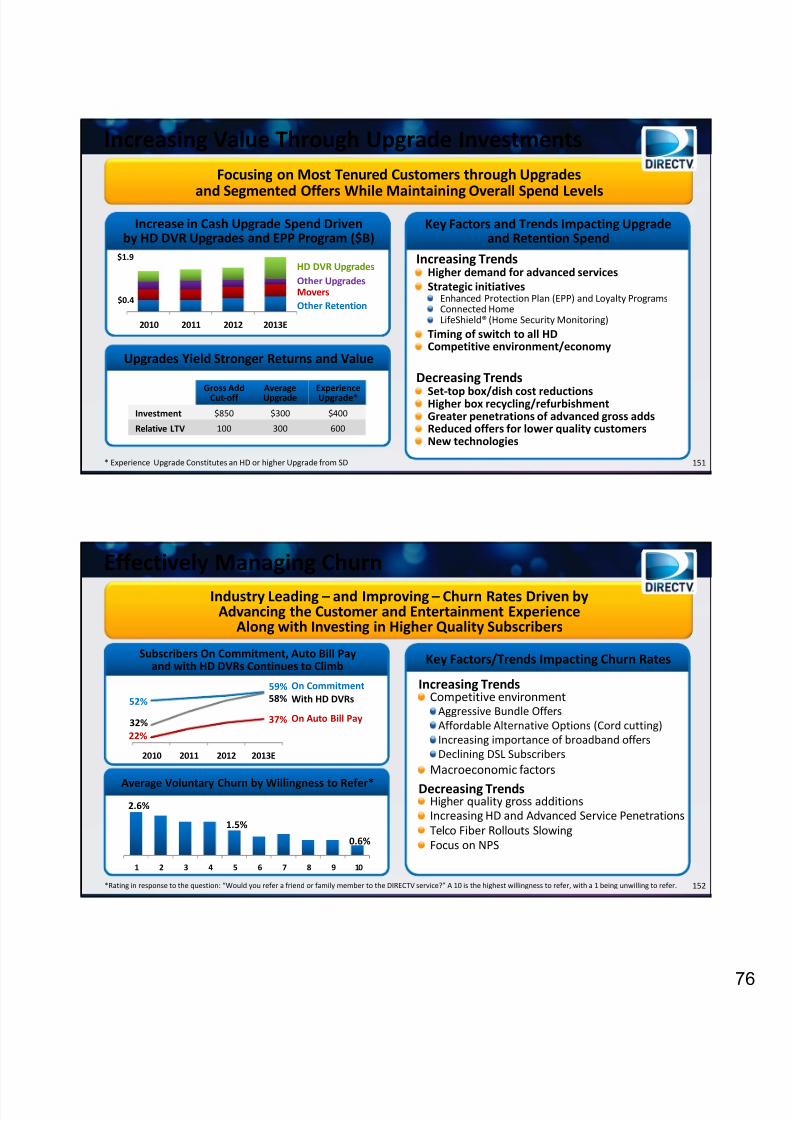
8/13/2019 DIRECTV InvestorDay Dec 12 2013 Print (1)
http://slidepdf.com/reader/full/directv-investorday-dec-12-2013-print-1 76/877
151
Upgrades Yield Stronger Returns and Value
Increase in Cash Upgrade Spend Driven by HD DVR Upgrades and EPP Program ($B)
Key Factors and Trends Impacting Upgrade and Retention Spend
Increasing Value Through Upgrade Investments
Increasing TrendsHigher demand for advanced servicesStrategic initiatives
Enhanced Protection Plan (EPP) and Loyalty ProgramsConnected HomeLifeShield® (Home Security Monitoring)
Timing of switch to all HDCompetitive environment/economy
Decreasing TrendsSet ‐top box/dish cost reductionsHigher box recycling/refurbishmentGreater penetrations of advanced gross addsReduced offers for lower quality customersNew technologies
Other RetentionMovers
HD DVR UpgradesOther Upgrades
Gross AddCut‐off
Average Upgrade
Experience Upgrade*
Investment $850 $300 $400
Relative LTV 100 300 600
* Experience Upgrade Constitutes an HD or higher Upgrade from SD
Focusing on Most Tenured Customers through Upgrades
and Segmented
Offers
While
Maintaining
Overall
Spend
Levels
2010 2011 2012 2013E
$1.9
$0.4
152*Rating in response to the question: “Would you refer a friend or family member to the DIRECTV service?” A 10 is the highest willingness to refer, with a 1 being unwilling to refer.
Subscribers On Commitment, Auto Bill Pay and with HD DVRs Continues to Climb Key Factors/Trends Impacting Churn Rates
Effectively Managing Churn
Increasing TrendsCompetitive environment
Aggressive Bundle OffersAffordable Alternative Options (Cord cutting)Increasing importance of broadband offersDeclining DSL Subscribers
Macroeconomic factors
Decreasing TrendsHigher quality gross additionsIncreasing HD and Advanced Service PenetrationsTelco Fiber Rollouts SlowingFocus on NPS
Industry Leading – and Improving – Churn Rates Driven by Advancing the Customer and Entertainment Experience
Along with Investing in Higher Quality Subscribers
Average Voluntary Churn by Willingness to Refer*
On Commitment
On Auto Bill Pay
With HD DVRs52%59%
22%
37%32%
58%
2010 2011 2012 2013E
1 2 3 4 5 6 7 8 9 10
2.6%
1.5%
0.6%
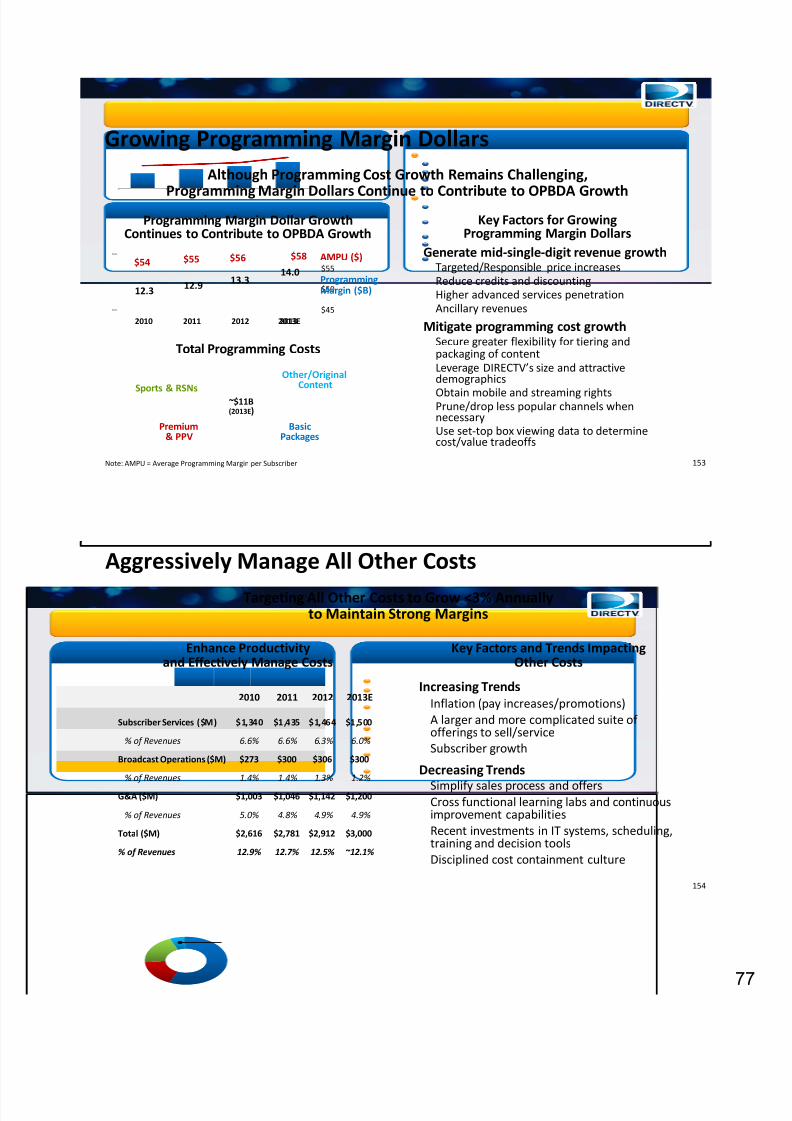
8/13/2019 DIRECTV InvestorDay Dec 12 2013 Print (1)
http://slidepdf.com/reader/full/directv-investorday-dec-12-2013-print-1 77/877
153
Total Programming Costs
Programming Margin Dollar Growth Continues to Contribute to OPBDA Growth
Key Factors for Growing Programming Margin Dollars
Growing Programming Margin Dollars
Generate mid ‐single ‐digit revenue growthTargeted/Responsible price increasesReduce credits and discountingHigher advanced services penetrationAncillary revenues
Mitigate programming cost growthSecure greater flexibility for tiering and packaging of contentLeverage DIRECTV’s size and attractive demographics
Obtain mobile and streaming rightsPrune/drop less popular channels when necessary Use set ‐top box viewing data to determine cost/value tradeoffs
Note: AMPU = Average Programming Margin per Subscriber
Although Programming Cost Growth Remains Challenging,
Programming Margin
Dollars
Continue
to
Contribute
to
OPBDA
Growth
12.3 12.9 13.3 14.0 $54 $55 $56 $58
$45
$50
$55
10.0
15.0
2010 2011 2012 2013
ProgrammingMargin ($B)
AMPU ($)
2013E
~$11B(2013E)
Other/Original Content
Sports &
RSNs
Premium & PPV
Basic Packages
154
Enhance Productivity and Effectively Manage Costs
Key Factors and Trends Impacting Other Costs
Aggressively Manage All Other Costs
Increasing TrendsInflation (pay increases/promotions)A larger and more complicated suite of offerings to sell/serviceSubscriber growth
Decreasing Trends
Simplify sales process and offersCross functional learning labs and continuous improvement capabilitiesRecent investments in IT systems, scheduling, training and decision toolsDisciplined cost containment culture
2010 2011 2012 2013E
Subscriber Services ($M) $1,340 $1,435 $1,464 $1,500
% of Revenues 6.6% 6.6% 6.3% 6.0%
Broadcast Operations ($M) $273 $300 $306 $300
% of Revenues 1.4% 1.4% 1.3% 1.2%
G&A ($M) $1,003 $1,046 $1,142 $1,200
% of Revenues 5.0% 4.8% 4.9% 4.9%
Total ($M) $2,616 $2,781 $2,912 $3,000
% of Revenues 12.9% 12.7% 12.5% ~12.1%
Targeting All Other Costs to Grow <3% Annually to Maintain Strong Margins
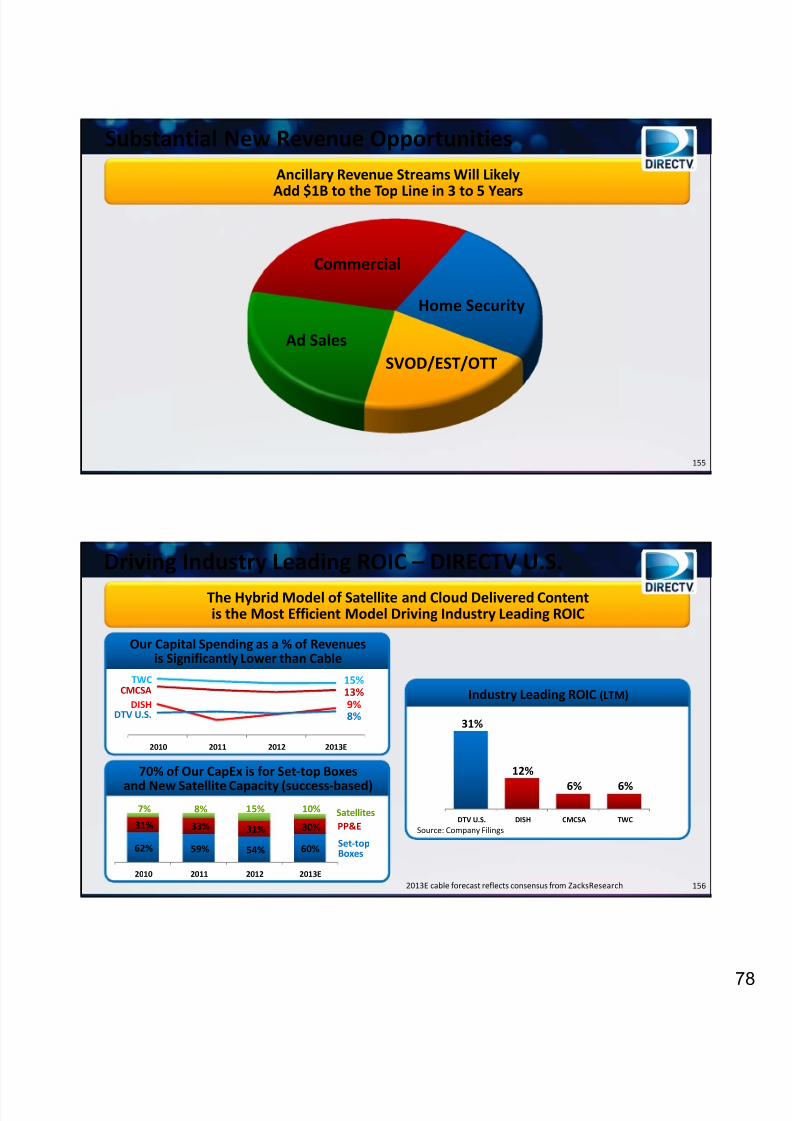
8/13/2019 DIRECTV InvestorDay Dec 12 2013 Print (1)
http://slidepdf.com/reader/full/directv-investorday-dec-12-2013-print-1 78/877
155
Substantial New Revenue Opportunities
Commercial
SVOD/EST/OTT
Home Security
Ad Sales
Ancillary Revenue Streams Will Likely
Add $1B
to
the
Top
Line
in
3
to
5
Years
156
70% of Our CapEx is for Set ‐top Boxes
and New Satellite Capacity (success ‐based)
Our Capital Spending as a % of Revenues is Significantly Lower than Cable
Driving Industry Leading ROIC – DIRECTV U.S.
PP&E
Set ‐top Boxes
Satellites
The Hybrid Model of Satellite and Cloud Delivered Content is the Most Efficient Model Driving Industry Leading ROIC
Industry Leading ROIC (LTM)
DTV U.S. DISH CMCSA TWC
31%
12%
6% 6%
Source: Company Filings
2010 2011 2012 2013E
TWCCMCSA
DTV U.S.DISH
13%15%
9%8%
62% 59% 54% 60%
31% 33% 31% 30%
7% 8% 15% 10%
2010 2011 2012 2013E2013E cable forecast reflects consensus from ZacksResearch
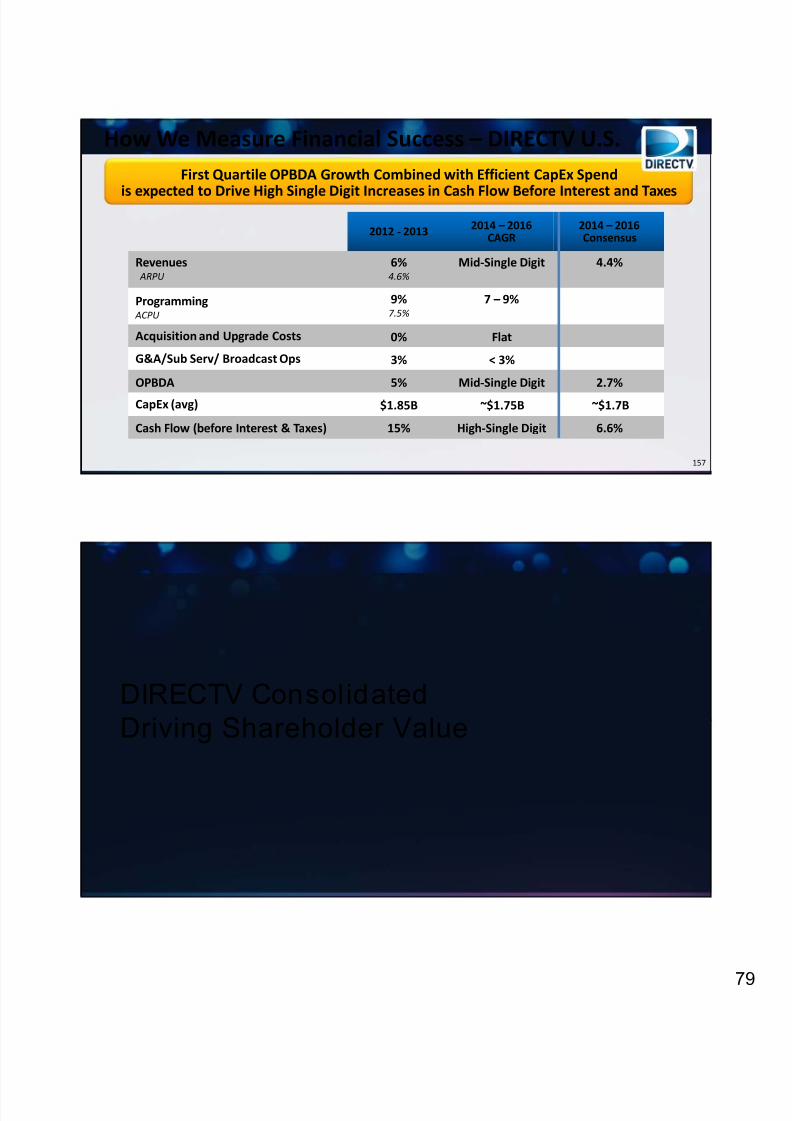
8/13/2019 DIRECTV InvestorDay Dec 12 2013 Print (1)
http://slidepdf.com/reader/full/directv-investorday-dec-12-2013-print-1 79/877
157
How We Measure Financial Success – DIRECTV U.S.
2012 ‐ 2013 2014 – 2016 CAGR
2014 – 2016 Consensus
Revenues ARPU
6%4.6%
Mid ‐Single Digit 4.4%
Programming ACPU
9%7.5%
7 – 9%
Acquisition and Upgrade Costs 0% Flat
G&A/Sub Serv/ Broadcast Ops 3% < 3%
OPBDA 5% Mid‐Single Digit 2.7%
CapEx (avg) $1.85B ~$1.75B ~$1.7B
Cash Flow (before Interest & Taxes) 15% High ‐Single Digit 6.6%
First Quartile OPBDA Growth Combined with Efficient CapEx Spend
is expected
to
Drive
High
Single
Digit
Increases
in
Cash
Flow
Before
Interest
and
Taxes
DIRECTV ConsolidatedDriving Shareholder Value
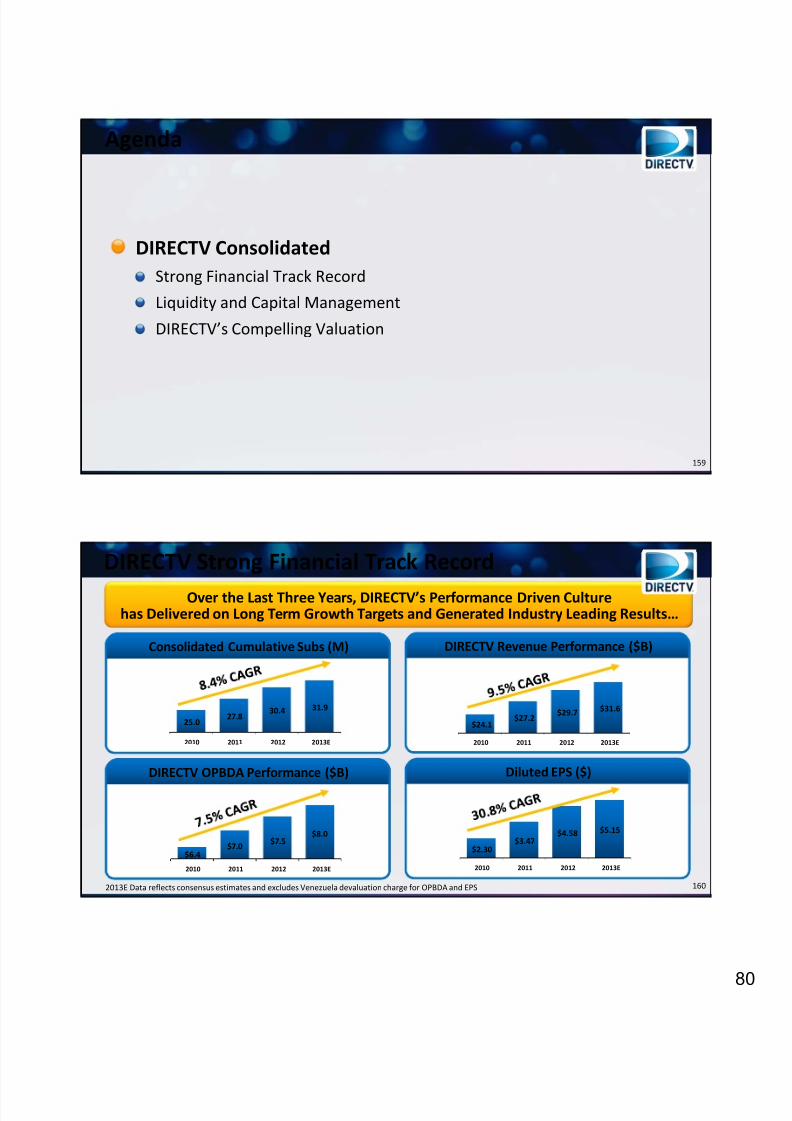
8/13/2019 DIRECTV InvestorDay Dec 12 2013 Print (1)
http://slidepdf.com/reader/full/directv-investorday-dec-12-2013-print-1 80/878
159
Agenda
DIRECTV Consolidated Strong Financial Track Record
Liquidity and Capital Management
DIRECTV’s Compelling Valuation
160
DIRECTV OPBDA Performance ($B)
2010 2011 2012 2013E
Consolidated Cumulative Subs (M) DIRECTV Revenue Performance ($B)
Diluted EPS ($)
DIRECTV Strong Financial Track Record
25.0 27.8
30.4 31.9
2010 2011 2012 2013E
$24.1 $27.2 $29.7 $31.6
2010 2011 2012 2013E
$2.30$3.47
$4.58 $5.15
2010 2011 2012 2013E
Over the Last Three Years, DIRECTV’s Performance Driven Culture has Delivered on Long Term Growth Targets and Generated Industry Leading Results…
$6.4$7.0 $7.5
$8.0
2013E Data reflects consensus estimates and excludes Venezuela devaluation charge for OPBDA and EPS
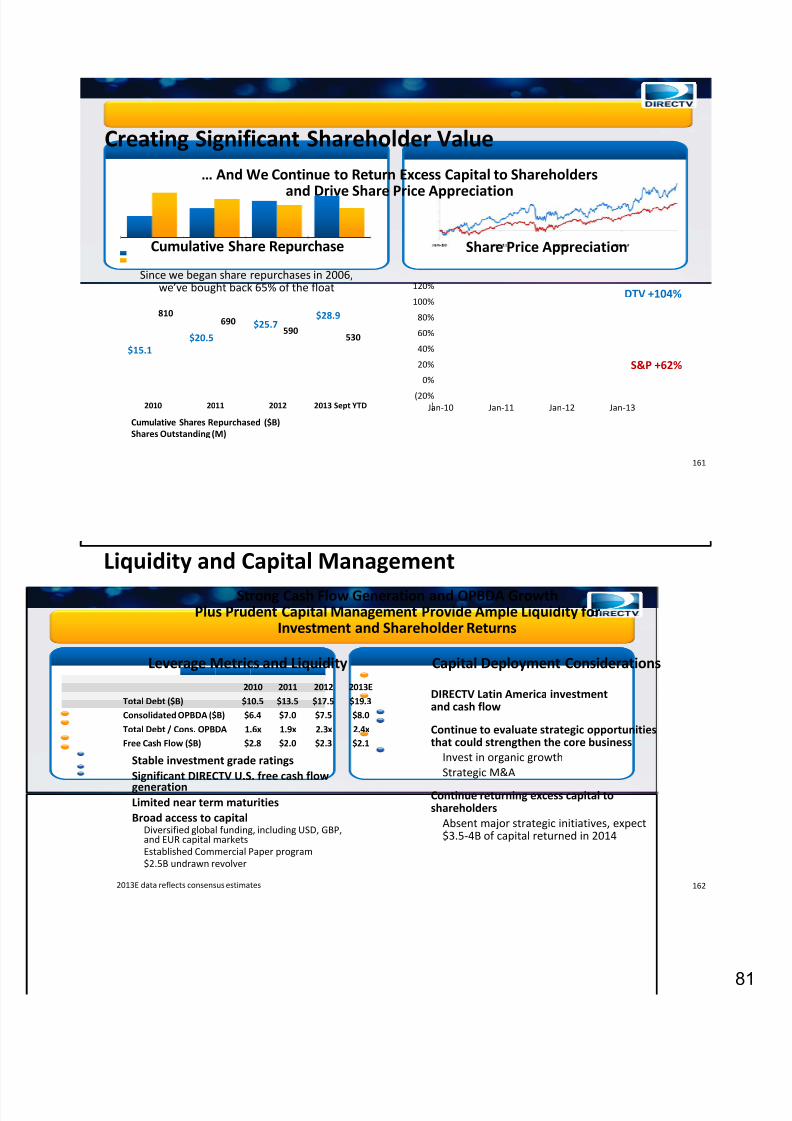
8/13/2019 DIRECTV InvestorDay Dec 12 2013 Print (1)
http://slidepdf.com/reader/full/directv-investorday-dec-12-2013-print-1 81/878
161
Share Price AppreciationCumulative Share Repurchase
Creating Significant Shareholder Value
810690
590530
$15.1$20.5
$25.7$28.9
2010 2011 2012 2013 Sept YTD
Since we began share repurchases in 2006, we’ve bought back 65% of the float
… And We Continue to Return Excess Capital to Shareholders
and Drive
Share
Price
Appreciation
Cumulative Shares Repurchased ($B) Shares Outstanding (M)
DTV +104%
S&P +62%
120%
100%
80%
60%
40%
20%
0%
(20%)Jan‐10 Jan‐11 Jan ‐12 Jan ‐13
162
Leverage Metrics and Liquidity Capital Deployment Considerations
Liquidity and Capital Management
DIRECTV Latin America investment and cash flow
Continue to evaluate strategic opportunities that could strengthen the core business
Invest in organic growthStrategic M&A
Continue returning excess capital to shareholders
Absent major strategic initiatives, expect $3.5 ‐4B of capital returned in 2014
Stable investment grade ratingsSignificant DIRECTV U.S. free cash flow generationLimited near term maturitiesBroad access to capital
Diversified global funding, including USD, GBP, and EUR capital marketsEstablished Commercial Paper program$2.5B undrawn revolver
2010 2011 2012 2013ETotal Debt ($B) $10.5 $13.5 $17.5 $19.3Consolidated OPBDA ($B) $6.4 $7.0 $7.5 $8.0Total Debt / Cons. OPBDA 1.6x 1.9x 2.3x 2.4xFree Cash Flow ($B) $2.8 $2.0 $2.3 $2.1
2013E data reflects consensus estimates
Strong Cash Flow Generation and OPBDA Growth Plus Prudent Capital Management Provide Ample Liquidity for
Investment and Shareholder Returns
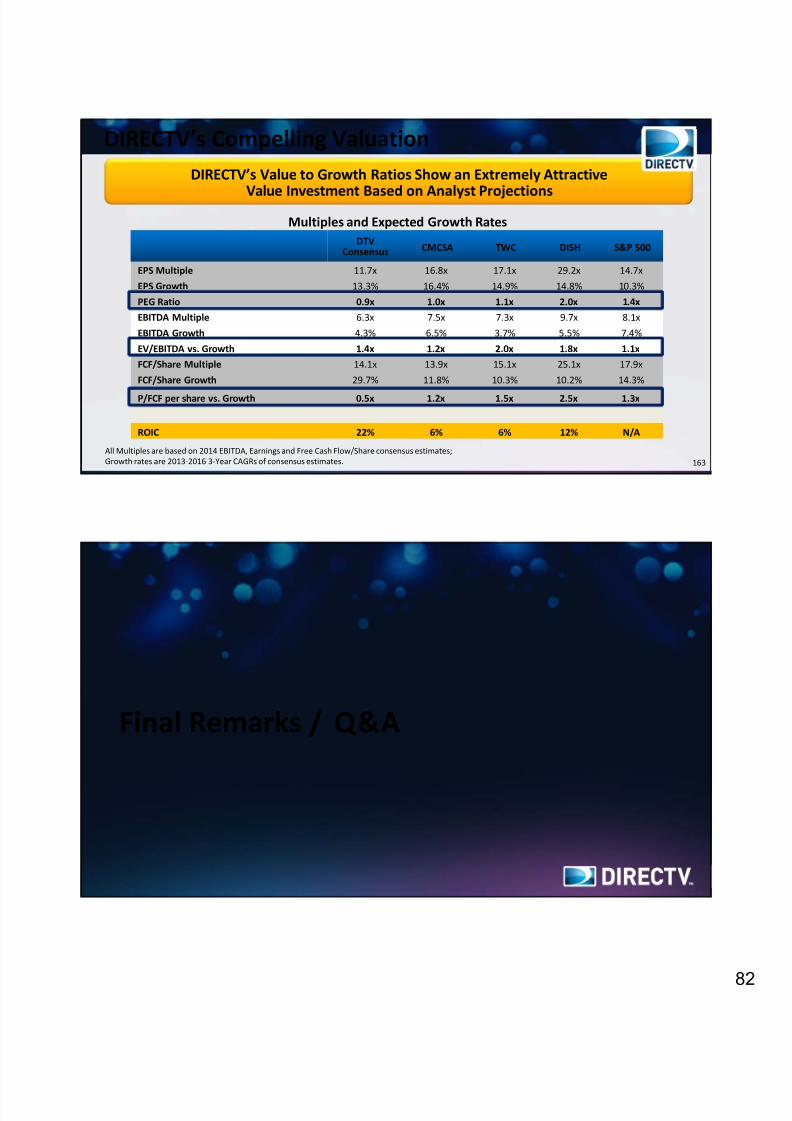
8/13/2019 DIRECTV InvestorDay Dec 12 2013 Print (1)
http://slidepdf.com/reader/full/directv-investorday-dec-12-2013-print-1 82/878
163
DIRECTV’s Compelling ValuationDIRECTV’s Value to Growth Ratios Show an Extremely Attractive
Value Investment
Based
on
Analyst
Projections
Multiples and Expected Growth RatesDTV
Consensus CMCSA TWC DISH S&P 500
EPS Multiple 11.7x 16.8x 17.1x 29.2x 14.7x
EPS Growth 13.3% 16.4% 14.9% 14.8% 10.3%
PEG Ratio 0.9x 1.0x 1.1x 2.0x 1.4xEBITDA Multiple 6.3x 7.5x 7.3x 9.7x 8.1x
EBITDA Growth 4.3% 6.5% 3.7% 5.5% 7.4%
EV/EBITDA vs. Growth 1.4x 1.2x 2.0x 1.8x 1.1xFCF/Share Multiple 14.1x 13.9x 15.1x 25.1x 17.9x
FCF/Share Growth 29.7% 11.8% 10.3% 10.2% 14.3%
P/FCF per share vs. Growth 0.5x 1.2x 1.5x 2.5x 1.3x
ROIC 22% 6% 6% 12% N/A
All Multiples are based on 2014 EBITDA, Earnings and Free Cash Flow/Share consensus estimates; Growth rates are 2013 ‐2016 3‐Year CAGRs of consensus estimates.
Final Remarks / Q&A
8/13/2019 DIRECTV InvestorDay Dec 12 2013 Print (1)
http://slidepdf.com/reader/full/directv-investorday-dec-12-2013-print-1 83/878
165
Conclusions
DIRECTV U.S. will continue to deliver on the proven strategies established to advance the entertainment experience and provide world class customer service commensurate with the DIRECTV brand
In addition, to sustain profitable growth, we will heighten our focus on generating incremental revenue streams and enhancing productivity improvements and cost containment initiatives
DIRECTV Latin America’s advantaged competitive position, operating strengths and the overall market potential continue to provide us with significant growth opportunities
DTVLA will be agile and adapt its tactics and strategies to the challenging
macro ‐economic conditions
These strategies along with the highest return of capital policy in the industry and our transparent corporate governance will continue to create significant shareholder value for years to come
DIRECTV is poised to continue delivering first quartile growth
and superior shareholder returns

8/13/2019 DIRECTV InvestorDay Dec 12 2013 Print (1)
http://slidepdf.com/reader/full/directv-investorday-dec-12-2013-print-1 84/87
Regulation GDisclosure of Non-GAAP Financial Measures
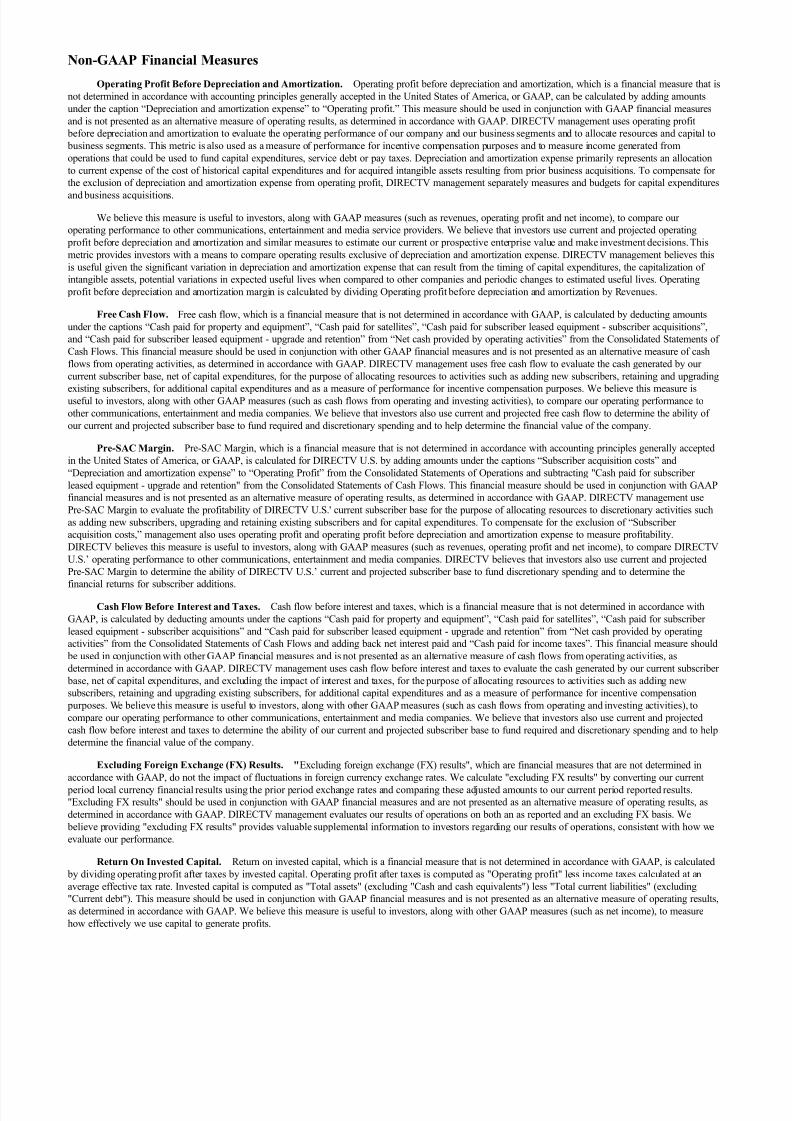
8/13/2019 DIRECTV InvestorDay Dec 12 2013 Print (1)
http://slidepdf.com/reader/full/directv-investorday-dec-12-2013-print-1 85/87
Non-GAAP Financial Measures
Operating Profit Before Depreciation and Amortization. Operating profit before depreciation and amortization, which is a financial measure that isnot determined in accordance with accounting principles generally accepted in the United States of America, or GAAP, can be calculated by adding amountsunder the caption “Depreciation and amortization expense” to “Operating profit.” This measure should be used in conjunction with GAAP financial measuresand is not presented as an alternative measure of operating results, as determined in accordance with GAAP. DIRECTV management uses operating profit
before depreciation and amortization to evaluate the operating performance of our company and our business segments and to allocate resources and capital to business segments. This metric is also used as a measure of performance for incentive compensation purposes and to measure income generated fromoperations that could be used to fund capital expenditures, service debt or pay taxes. Depreciation and amortization expense primarily represents an allocationto current expense of the cost of historical capital expenditures and for acquired intangible assets resulting from prior business acquisitions. To compensate forthe exclusion of depreciation and amortization expense from operating profit, DIRECTV management separately measures and budgets for capital expenditures
and business acquisitions.
We believe this measure is useful to investors, along with GAAP measures (such as revenues, operating profit and net income), to compare ouroperating performance to other communications, entertainment and media service providers. We believe that investors use current and projected operating
profit before depreciation and amortization and similar measures to estimate our current or prospective enterprise value and make investment decisions. Thismetric provides investors with a means to compare operating results exclusive of depreciation and amortization expense. DIRECTV management believes thisis useful given the significant variation in depreciation and amortization expense that can result from the timing of capital expenditures, the capitalization ofintangible assets, potential variations in expected useful lives when compared to other companies and periodic changes to estimated useful lives. Operating
profit before depreciation and amortization margin is calculated by dividing Operating profit before depreciation and amortization by Revenues.
Free Cash Flow. Free cash flow, which is a financial measure that is not determined in accordance with GAAP, is calculated by deducting amountsunder the captions “Cash paid for property and equipment”, “Cash paid for satellites”, “Cash paid for subscriber leased equipment - subscriber acquisitions”,and “Cash paid for subscriber leased equipment - upgrade and retention” from “Net cash provided by operating activities” from the Consolidated Statements ofCash Flows. This financial measure should be used in conjunction with other GAAP financial measures and is not presented as an alternative measure of cashflows from operating activities, as determined in accordance with GAAP. DIRECTV management uses free cash flow to evaluate the cash generated by ourcurrent subscriber base, net of capital expenditures, for the purpose of allocating resources to activities such as adding new subscribers, retaining and upgrading
existing subscribers, for additional capital expenditures and as a measure of performance for incentive compensation purposes. We believe this measure isuseful to investors, along with other GAAP measures (such as cash flows from operating and investing activities), to compare our operating performance toother communications, entertainment and media companies. We believe that investors also use current and projected free cash flow to determine the ability ofour current and projected subscriber base to fund required and discretionary spending and to help determine the financial value of the company.
Pre-SAC Margin. Pre-SAC Margin, which is a financial measure that is not determined in accordance with accounting principles generally acceptedin the United States of America, or GAAP, is calculated for DIRECTV U.S. by adding amounts under the captions “Subscriber acquisition costs” and“Depreciation and amortization expense” to “Operating Profit” from the Consolidated Statements of Operations and subtracting "Cash paid for subscriberleased equipment - upgrade and retention" from the Consolidated Statements of Cash Flows. This financial measure should be used in conjunction with GAAPfinancial measures and is not presented as an alternative measure of operating results, as determined in accordance with GAAP. DIRECTV management usePre-SAC Margin to evaluate the profitability of DIRECTV U.S.' current subscriber base for the purpose of allocating resources to discretionary activities suchas adding new subscribers, upgrading and retaining existing subscribers and for capital expenditures. To compensate for the exclusion of “Subscriberacquisition costs,” management also uses operating profit and operating profit before depreciation and amortization expense to measure profitability.DIRECTV believes this measure is useful to investors, along with GAAP measures (such as revenues, operating profit and net income), to compare DIRECTVU.S.’ operating performance to other communications, entertainment and media companies. DIRECTV believes that investors also use current and projectedPre-SAC Margin to determine the ability of DIRECTV U.S.’ current and projected subscriber base to fund discretionary spending and to determine the
financial returns for subscriber additions.Cash Flow Before Interest and Taxes. Cash flow before interest and taxes, which is a financial measure that is not determined in accordance with
GAAP, is calculated by deducting amounts under the captions “Cash paid for property and equipment”, “Cash paid for satellites”, “Cash paid for subscriberleased equipment - subscriber acquisitions” and “Cash paid for subscriber leased equipment - upgrade and retention” from “Net cash provided by operatingactivities” from the Consolidated Statements of Cash Flows and adding back net interest paid and “Cash paid for income taxes”. This financial measure should
be used in conjunction with other GAAP financial measures and is not presented as an alternative measure of cash flows from operating activities, asdetermined in accordance with GAAP. DIRECTV management uses cash flow before interest and taxes to evaluate the cash generated by our current subscriber
base, net of capital expenditures, and excluding the impact of interest and taxes, for the purpose of allocating resources to activities such as adding newsubscribers, retaining and upgrading existing subscribers, for additional capital expenditures and as a measure of performance for incentive compensation
purposes. We believe this measure is useful to investors, along with other GAAP measures (such as cash flows from operating and investing activities), tocompare our operating performance to other communications, entertainment and media companies. We believe that investors also use current and projectedcash flow before interest and taxes to determine the ability of our current and projected subscriber base to fund required and discretionary spending and to helpdetermine the financial value of the company.
Excluding Foreign Exchange (FX) Results. " Excluding foreign exchange (FX) results", which are financial measures that are not determined inaccordance with GAAP, do not the impact of fluctuations in foreign currency exchange rates. We calculate "excluding FX results" by converting our current
period local currency financial results using the prior period exchange rates and comparing these adjusted amounts to our current period reported results."Excluding FX results" should be used in conjunction with GAAP financial measures and are not presented as an alternative measure of operating results, asdetermined in accordance with GAAP. DIRECTV management evaluates our results of operations on both an as reported and an excluding FX basis. We
believe providing "excluding FX results" provides valuable supplemental information to investors regarding our results of operations, consistent with how weevaluate our performance.
Return On Invested Capital. Return on invested capital, which is a financial measure that is not determined in accordance with GAAP, is calculated by dividing operating profit after taxes by invested capital. Operating profit after taxes is computed as "Operating profit" less income taxes calculated at anaverage effective tax rate. Invested capital is computed as "Total assets" (excluding "Cash and cash equivalents") less "Total current liabilities" (excluding"Current debt"). This measure should be used in conjunction with GAAP financial measures and is not presented as an alternative measure of operating results,as determined in accordance with GAAP. We believe this measure is useful to investors, along with other GAAP measures (such as net income), to measurehow effectively we use capital to generate profits.
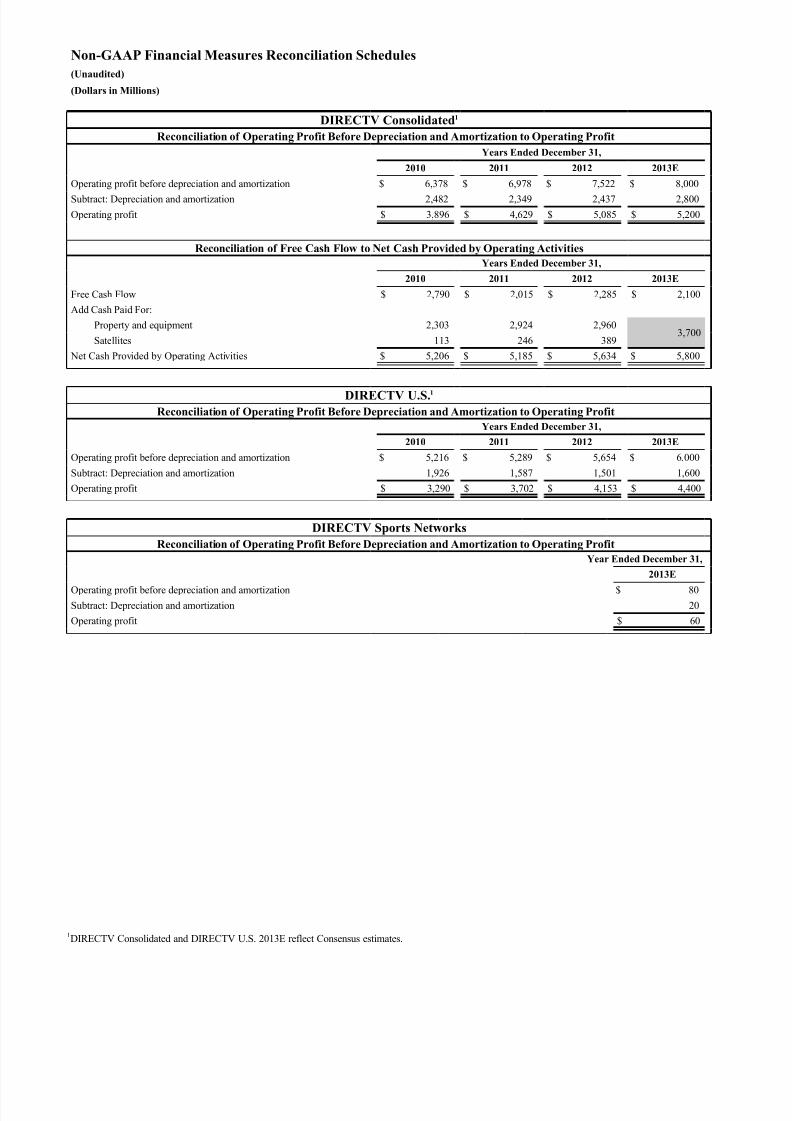
8/13/2019 DIRECTV InvestorDay Dec 12 2013 Print (1)
http://slidepdf.com/reader/full/directv-investorday-dec-12-2013-print-1 86/87
Non-GAAP Financial Measures Reconciliation Schedules(Unaudited)
(Dollars in Millions)
DIRECTV Consolidated 1
Reconciliation of Operating Profit Before Depreciation and Amortization to Operating ProfitYears Ended December 31,
2010 2011 2012 2013E
Operating profit before depreciation and amortization $ 6,378 $ 6,978 $ 7,522 $ 8,000
Subtract: Depreciation and amortization 2,482 2,349 2,437 2,800Operating profit $ 3,896 $ 4,629 $ 5,085 $ 5,200
Reconciliation of Free Cash Flow to Net Cash Provided by Operating ActivitiesYears Ended December 31,
2010 2011 2012 2013E
Free Cash Flow $ 2,790 $ 2,015 $ 2,285 $ 2,100Add Cash Paid For:
Property and equipment 2,303 2,924 2,9603,700
Satellites 113 246 389 Net Cash Provided by Operating Activities $ 5,206 $ 5,185 $ 5,634 $ 5,800
DIRECTV U.S. 1
Reconciliation of Operating Profit Before Depreciation and Amortization to Operating ProfitYears Ended December 31,
2010 2011 2012 2013E
Operating profit before depreciation and amortization $ 5,216 $ 5,289 $ 5,654 $ 6,000Subtract: Depreciation and amortization 1,926 1,587 1,501 1,600Operating profit $ 3,290 $ 3,702 $ 4,153 $ 4,400
DIRECTV Sports NetworksReconciliation of Operating Profit Before Depreciation and Amortization to Operating Profit
Year Ended December 31,
2013E
Operating profit before depreciation and amortization $ 80Subtract: Depreciation and amortization 20Operating profit $ 60
1DIRECTV Consolidated and DIRECTV U.S. 2013E reflect Consensus estimates.
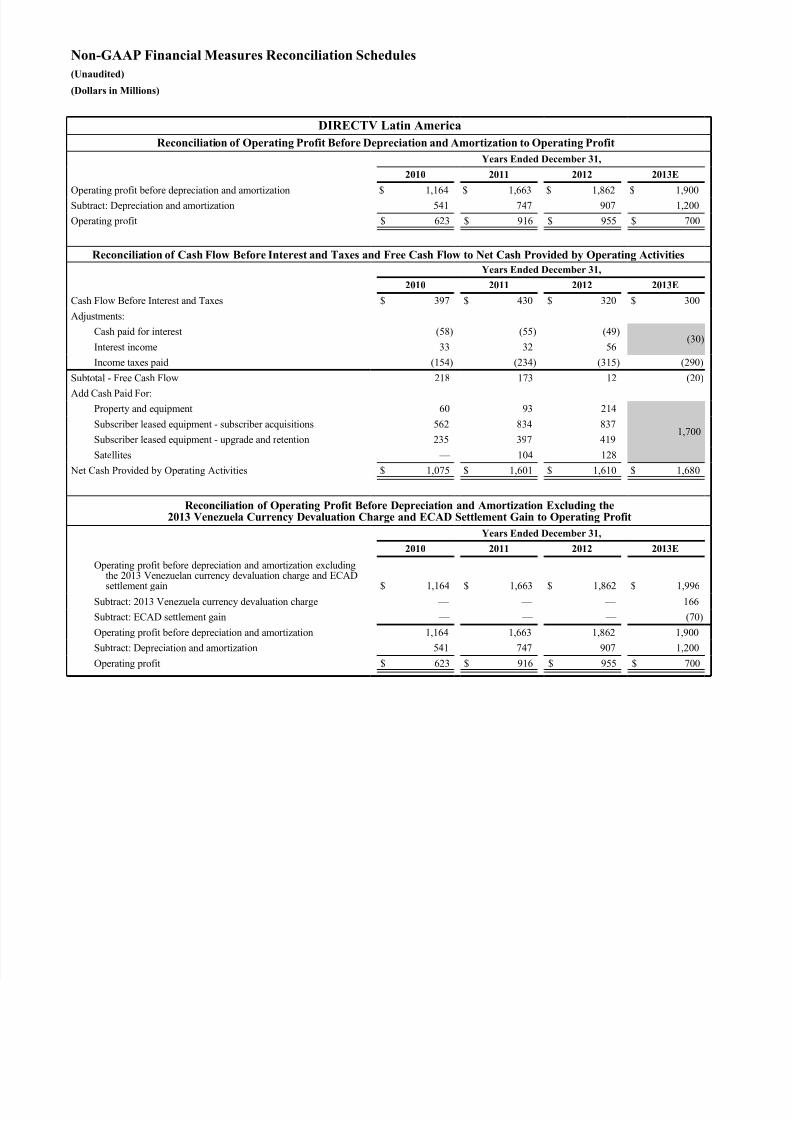
8/13/2019 DIRECTV InvestorDay Dec 12 2013 Print (1)
http://slidepdf.com/reader/full/directv-investorday-dec-12-2013-print-1 87/87