Embed Size (px)
Citation preview

Director’s Report Dear Shareholders,
I welcome you all on behalf of the Board of Directors to this Annual General Meeting of Galfar Engineering & Contracting SAOG and to present the Annual Report for the Year ended 31st December 2010.
Business Environment
In 2010, Oman celebrated 40 years of growth and progress. The country also managed to stay clear of the economic downturn. The stable economy and the increased spending on infrastructure during the 8th Five Year Plan (2011‐15) have attracted many competitors to already developed contracting community.
Infrastructure Projects in India are continuing at a rapid pace, the major thrust presently is in Roads and Ports. Many utility projects are being tendered out and these are being funded through external agencies/countries. After completing one road project six months ahead of schedule allowing us to collect toll earlier than planned and providing a good start, we have already signed another EPC contract with our own SPV company. In the third DBFOT Project in India (Bhubaneshwar‐Chandikhole Road), we have taken on the role of Operation & Maintenance considering that this activity together with toll collection starts immediately without waiting for the construction to be over with.
Your Company Galfar has during the period acquired significant interest in a Kuwaiti construction company named Shaheen Alghanim Roads and Bridges contracting KSCC and its name has been changed into Galfar Engineering & Contracting‐Kuwait KSCC. Presently the Company is executing the construction of a 25 km road in Boubyan Island.
Operations
Galfar has continued to be a preferred contractor in the Sultanate of Oman for many clients as we are considered as a reliable and safety conscious contractor.
Details on the operating results of the Company for the year 2010 and outlook for the industry for 2011 are reflected in the ‘Management Discussion & Analysis’ report included in the Annual Report for the year 2009.

Associates & Subsidiaries
Galfar Kuwait and the subsidiary, Galfar‐Wazen General Contracting ‐Libya are new additions to the Galfar SAOG network along with Galfar India, a subsidiary with 99.9% shareholding.
Galfar Training Institute LLC, a wholly owned subsidiary of your company, plays a vital role in training young Omanis for the construction industry.
Al Khalij Heavy Equipment & Engineering LLC, the Company’s subsidiary in Oman, engaged in transportation and logistics business has achieved turnover of RO 1.805 million during the year 2010 as compared to RO 2.089 million in 2009. More than 75% of this revenue is from services provided to Customers other than Galfar.
Corporate Governance
The Company follows high standards of Corporate Governance. A detailed Corporate Governance Report is included in the Annual Report for the year ended 2010.
Quality, Health, Safety and Environment
The Company’s Quality, Health, Safety & Environmental Management System certifications have now been upgraded to the current versions which are ISO 9001:2008 for Quality Management, ISO 14001:2004 for Environmental Management and OHSAS 18001:2007 for Occupational Health & Safety Management. The Nizwa Industrial Facility is certified for ‘U’ Stamp by the American Society for Mechanical Engineers (ASME) for the Construction of Pressure Vessels & parts thereof.
During the course of the year 2010, the Company’s Vehicles have driven 137 million kms and the Company has worked 105 million man‐hours across all units. Our Lost Time Injury Frequency (LTIF) for the year 2010 stands at 0.30 as against 0.49 in the year 2009. We have worked 15 Million man‐hours without Lost Time Injury during the year 2010.
Outlook
During 2010 the Company bagged Riyal Omani 380m Million worth of Projects to maintain the order book back log at RO 614 Million at the starting of this year; this includes the strategic Project of Redevelopment of the Salalah Airport. Our endeavour will be to continue to maintain this level of order book while improving it in a sustainable manner. With numerous projects both in the Oil & Gas and the other infrastructure development sectors already in the tender

stage and likely to be tendered, we expect to consolidate and register a growth for Galfar in 2011 and the future.
The Government has planned major Road development projects including the dualization of many strategic corridors and construction of the New Batinah Expressway linking with the Muscat Expressway. These Projects and the upcoming development in the Ports and Harbour sector will form a very important part of Galfar’s strategies in the near future in Oman. The Sultanate has also preparing itself for a major rail network. There are major activities planned in the Real‐estate Market with Oman taking the lead in developments.
It is expected overall that the next five years should also see a marked expenditure increase in utilities with more and more water & power transmission and distribution systems being tendered out.
The Oil & Gas project scenario in Oman looks very promising even apart from the service contracts. With our EPC capabilities now being delivered in‐house, Galfar has begun to seek every opportunity in the EPC projects being tendered out. In the Oil and Gas sector, PDO too has an ambitious plan to develop some of the low production fields using Enhanced Oil Recovery Techniques.
We continue to focus on the infrastructure sector in the Indian market with having submitted several prequalifications for Roads and Ports Projects in the Design Build Finance Operate and Transfer (DBFOT) model. This is expected to enhance the group revenue and margins in the near future. We are also actively looking for projects in the Ports, pipelines in both Oil & Gas and Water Transmission sectors. We also expect opportunities in the dedicated rail freight corridor project and subsequent SEZs that have been on the anvil for some time. There are several opportunities in the privatized port projects especially in the western states where these terminals are being used for gas transfers to the industries.
While the Libyan market promises to be highly rewarding especially in the Oil and Gas sector, we will have to wait till abating of the present situation in the North African Countries as a whole.
On Record
We are grateful to His Majesty Sultan Qaboos Bin Said for his visionary leadership and providing opportunities for the private and public sector in participating in the development of the Oman’s economy.
The Board would like to thank all Ministries, Capital Market Authority, Muscat Securities Market, Muscat Depository and Security Registration Company, Muscat Municipality, Royal
Oman Police, Petroleum Development of Oman and other Companies working in the Oil & Gas sector in Oman, Commercial Banks and Financial Institutions in Oman and abroad where we have relationships, Consultants, Sub Contractors, Dealers and all Clients of the Company, for their generous cooperation and continued support.
We would also like to thank all the employees, staff and management of the Company for the efforts extended to improve & enhance the performance of the Company.
Salim Said Hamad Al Fannah Al Araimi Chairman

1
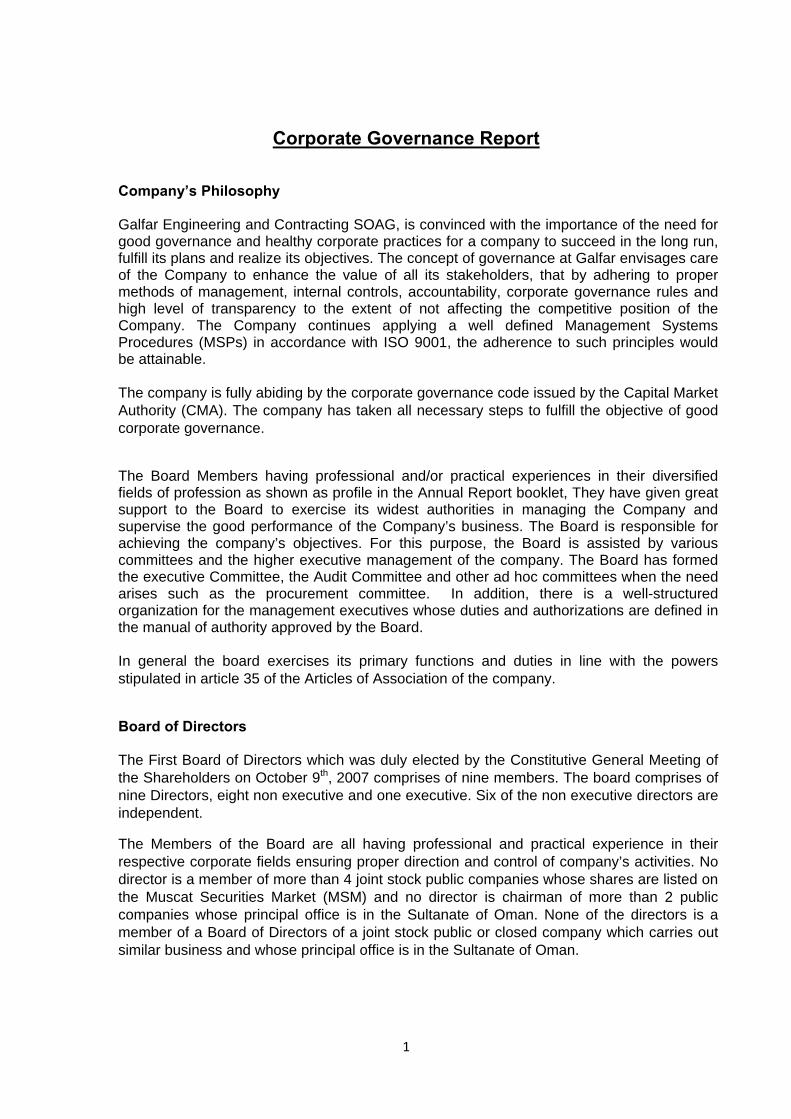
Corporate Governance Report
Company’s Philosophy Galfar Engineering and Contracting SOAG, is convinced with the importance of the need for good governance and healthy corporate practices for a company to succeed in the long run, fulfill its plans and realize its objectives. The concept of governance at Galfar envisages care of the Company to enhance the value of all its stakeholders, that by adhering to proper methods of management, internal controls, accountability, corporate governance rules and high level of transparency to the extent of not affecting the competitive position of the Company. The Company continues applying a well defined Management Systems Procedures (MSPs) in accordance with ISO 9001, the adherence to such principles would be attainable.
The company is fully abiding by the corporate governance code issued by the Capital Market Authority (CMA). The company has taken all necessary steps to fulfill the objective of good corporate governance.
The Board Members having professional and/or practical experiences in their diversified fields of profession as shown as profile in the Annual Report booklet, They have given great support to the Board to exercise its widest authorities in managing the Company and supervise the good performance of the Company’s business. The Board is responsible for achieving the company’s objectives. For this purpose, the Board is assisted by various committees and the higher executive management of the company. The Board has formed the executive Committee, the Audit Committee and other ad hoc committees when the need arises such as the procurement committee. In addition, there is a well-structured organization for the management executives whose duties and authorizations are defined in the manual of authority approved by the Board.
In general the board exercises its primary functions and duties in line with the powers stipulated in article 35 of the Articles of Association of the company.
Board of Directors
The First Board of Directors which was duly elected by the Constitutive General Meeting of the Shareholders on October 9th, 2007 comprises of nine members. The board comprises of nine Directors, eight non executive and one executive. Six of the non executive directors are independent.
The Members of the Board are all having professional and practical experience in their respective corporate fields ensuring proper direction and control of company’s activities. No director is a member of more than 4 joint stock public companies whose shares are listed on the Muscat Securities Market (MSM) and no director is chairman of more than 2 public companies whose principal office is in the Sultanate of Oman. None of the directors is a member of a Board of Directors of a joint stock public or closed company which carries out similar business and whose principal office is in the Sultanate of Oman.

2
Sr. No.
Name of Directors & Representatives Designation Category
Directorship in other Joint Stock Companies
1 Sheikh Dr.Salim Said Hamed Al Fannah Al Araimi Chairman Non -
Executive
Bank Sohar S.A.O.G Oman Medical College S.A.O.C
2 Dr.P. Mohamed Ali
Vice Chairman & Managing Director
Executive
Tabreed Oman S.A.O.C Oman Medical College S.A.O.C
3 Dr.Hamed Hashim Mohamed Al Dhahab Director
Non - Executive
Indepenent
Majan Electricity Company S.A.O.C
4 Dr.Adil Abdulaziz Yahya Al Kindy Director Non -
Executive Indepenent
NIL
5 Dr.Hatem Bakheit Saeed Al Shanfari Director Non -
Executive Indepenent
Gulf Investment Services Co. S.A.O.G Gulf Baader Capital Markets Co. S.A.O.C
6 Sheikh Salim Abdullah Saeed Badr Al Rawas Director
Non - Executive
Indepenent
Oman Oil Marketing Company S.A.O.G Oman Oil Company S.A.O.C
7 Sheikh Yahya Abdullah Al Fannah Al Araimi Director
Non - Executive
Indepenent NIL
8 Engr.Ali Mohamed Ali Al Mahrouqi Director Non -
Executive Indepenent
A'sharqiya Investment Holding Co. S.A.O.G
9 Ms.Budoor Mohamed Rashid Al Fannah Al Araimi Director Non -
Executive
Gulf Plastic Industries Co. S.A.O.G A'sharqiya Investment Holding Co. S.A.O.G Oman Medical College S.A.O.C
3
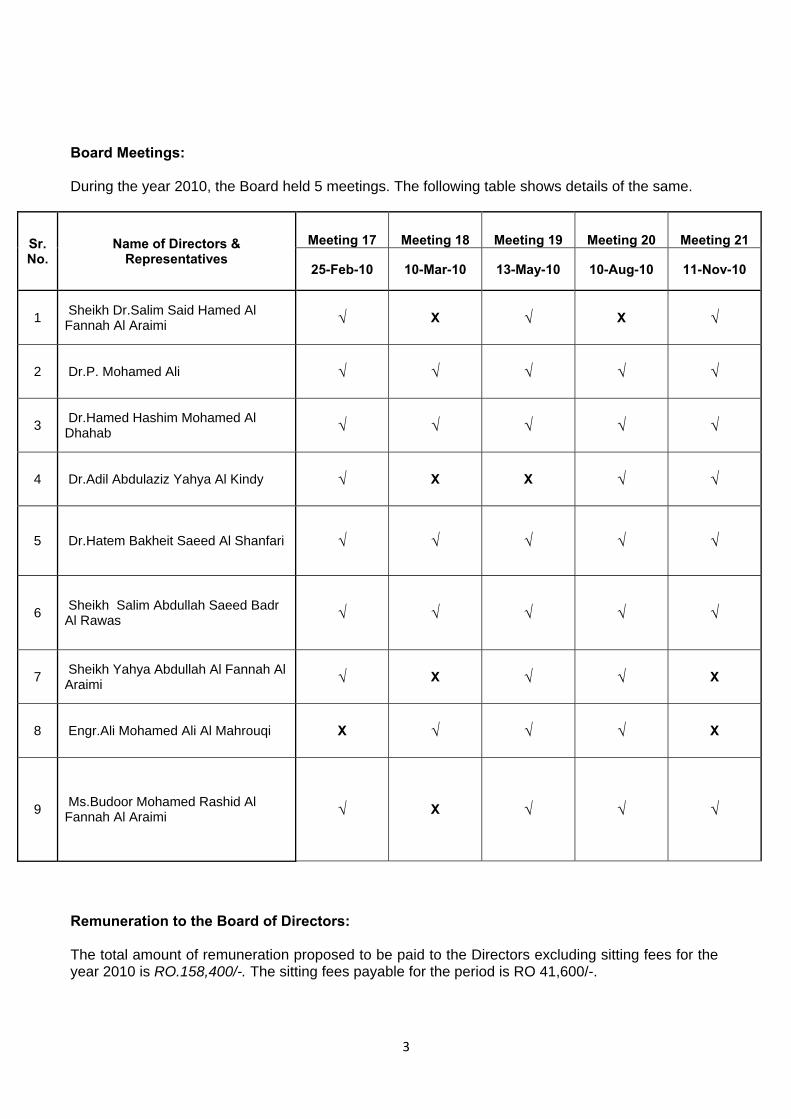
Board Meetings:
During the year 2010, the Board held 5 meetings. The following table shows details of the same.
Sr. No.
Name of Directors & Representatives
Meeting 17 Meeting 18 Meeting 19 Meeting 20 Meeting 21
25-Feb-10 10-Mar-10 13-May-10 10-Aug-10 11-Nov-10
1 Sheikh Dr.Salim Said Hamed Al Fannah Al Araimi √ X √ X √
2 Dr.P. Mohamed Ali √ √ √ √ √
3 Dr.Hamed Hashim Mohamed Al Dhahab √ √ √ √ √
4 Dr.Adil Abdulaziz Yahya Al Kindy √ X X √ √
5 Dr.Hatem Bakheit Saeed Al Shanfari √ √ √ √ √
6 Sheikh Salim Abdullah Saeed Badr Al Rawas √ √ √ √ √
7 Sheikh Yahya Abdullah Al Fannah Al Araimi √ X √ √ X
8 Engr.Ali Mohamed Ali Al Mahrouqi X √ √ √ X
9 Ms.Budoor Mohamed Rashid Al Fannah Al Araimi √ X √ √ √
Remuneration to the Board of Directors: The total amount of remuneration proposed to be paid to the Directors excluding sitting fees for the year 2010 is RO.158,400/-. The sitting fees payable for the period is RO 41,600/-.

4
Board Secretary Mr.Abdelbagi Daffalla, of a legal profession career, was appointed secretary of the Board. The secretary records minutes of the Board meetings as well as the resolutions passed. He handles liaison works between the Board, Board committees and follow-up actions to be taken and informing concerned parties.
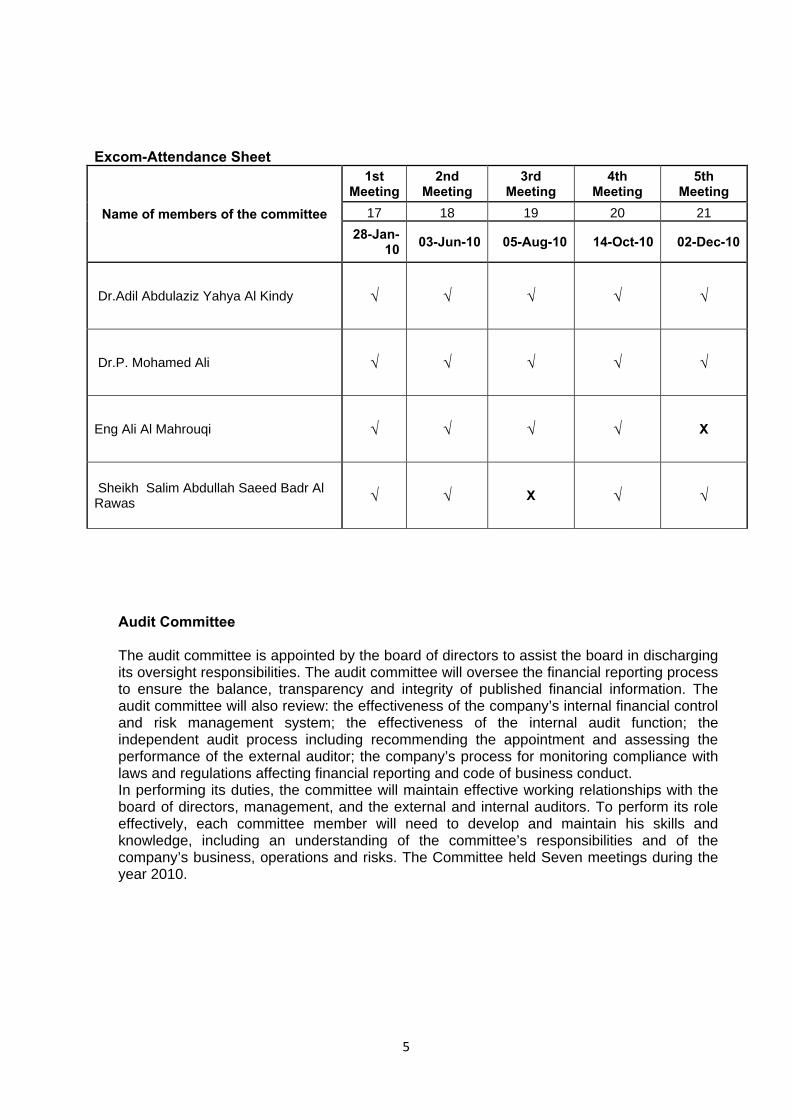
Other Committees: Executive Committee: The Board has formed, an Executive Committee which consists of 4 members, to oversee in general, setting of business and strategic plans, policies of the Company, review decisions taken on various matters concerning the operation of the company and any other matters assigned by the Board. The Executive Committee exercises its functions in accordance with the Executive Committee Charter. The committee held five meetings during the year 2010
Name of members of the committee Designation
Dr.Adil Abdulaziz Yahya Al Kindy Chairman
Dr.P. Mohamed Ali Member
Eng Ali Al Mahrouqi Member
Sheikh Salim Abdullah Saeed Badr Al Rawas Member
5
Excom-Attendance Sheet
Name of members of the committee
1st Meeting
2nd Meeting
3rd Meeting
4th Meeting
5th Meeting
17 18 19 20 21 28-Jan-
10 03-Jun-10 05-Aug-10 14-Oct-10 02-Dec-10
Dr.Adil Abdulaziz Yahya Al Kindy √ √ √ √ √
Dr.P. Mohamed Ali √ √ √ √ √
Eng Ali Al Mahrouqi √ √ √ √ X
Sheikh Salim Abdullah Saeed Badr Al Rawas √ √ X √ √
Audit Committee The audit committee is appointed by the board of directors to assist the board in discharging its oversight responsibilities. The audit committee will oversee the financial reporting process to ensure the balance, transparency and integrity of published financial information. The audit committee will also review: the effectiveness of the company’s internal financial control and risk management system; the effectiveness of the internal audit function; the independent audit process including recommending the appointment and assessing the performance of the external auditor; the company’s process for monitoring compliance with laws and regulations affecting financial reporting and code of business conduct. In performing its duties, the committee will maintain effective working relationships with the board of directors, management, and the external and internal auditors. To perform its role effectively, each committee member will need to develop and maintain his skills and knowledge, including an understanding of the committee’s responsibilities and of the company’s business, operations and risks. The Committee held Seven meetings during the year 2010.

6
Audit Committee Members Designation
Dr Hamed Al Dhahab Chairman
HE Yahya Al Fannah Al Araimi Member
Dr Hatem Al Shanfari Member
Ms. Budoor Al Fannah Al Araimi Member
Audit Committee Meeting & Attendance Details - Year 2010
Audit Committee Members
Meeting Dates / Attendance
1st Meeting
2nd Meeting
3rd Meeting
4th Meeting
5th Meeting
6th Meeting
7th Meeting
09-Mar-10
12-May-10
16-Jun-10
11-Aug-10
23-Sep-10
10-Nov-10
22-Dec-10
Dr Hamed Al Dhahab √ √ √ √ √ √ √
HE Yahya Al Fannah Al Araimi X X X √ √ √ X
Dr Hatem Al Shanfari √ √ √ √ √ √ √
Ms. Budoor Al Fannah Al Araimi √ √ √ √ √ √ X
Procedure for Standing as a Candidate for the Board:
The right to stand as a candidate for membership of the Board of Directors of the Company is open to shareholders and non shareholders.
In case of a shareholder, whether in personal capacity or representing a juristic person, he must have a minimum equity of not less than 10000 shares.

7
Remuneration:
Total remuneration during the financial year 2010 to top Management (top 5) was RO 847,254.
Compliance with Rules and Regulations:
The Company has been compliant with all the applicable rules and regulations issued by MSM, CMA and that stipulated in the Commercial Companies Law 1974 as amended. An Audit Team from Capital Market Authority (CMA) conducted a general audit over the Year 2009, to ensure the company’s commitment to the Corporate Governance Code of SAOG companies and other regulations and laws issued by the CMA. Their respective report, commended the Company’s commitment towards Corporate Governance and other regulations and laws. Communication with Shareholders and Investors:
The company maintains good communication relations with the shareholders and Investors and responds as much as possible to their queries and requests in line with the disclosures rules. The company, during the period, conducted several phone interviews with financial analysts and investors.
The company publishes its un-audited financial results in the newspapers on a quarterly basis and the audited financial statements annually. Detailed financial statements are sent to shareholders on request. The company publishes its quarterly and annual results in MSM website. Detailed financial statements are sent to shareholders on request. The company posts its quarterly and annual results on MSM website, and also on the Company’s website: www.galfar.com. All the Company’s announcements are posted on MSM’s website.
The Management discussions and analysis report forms an integral part of the Annual Report.
8
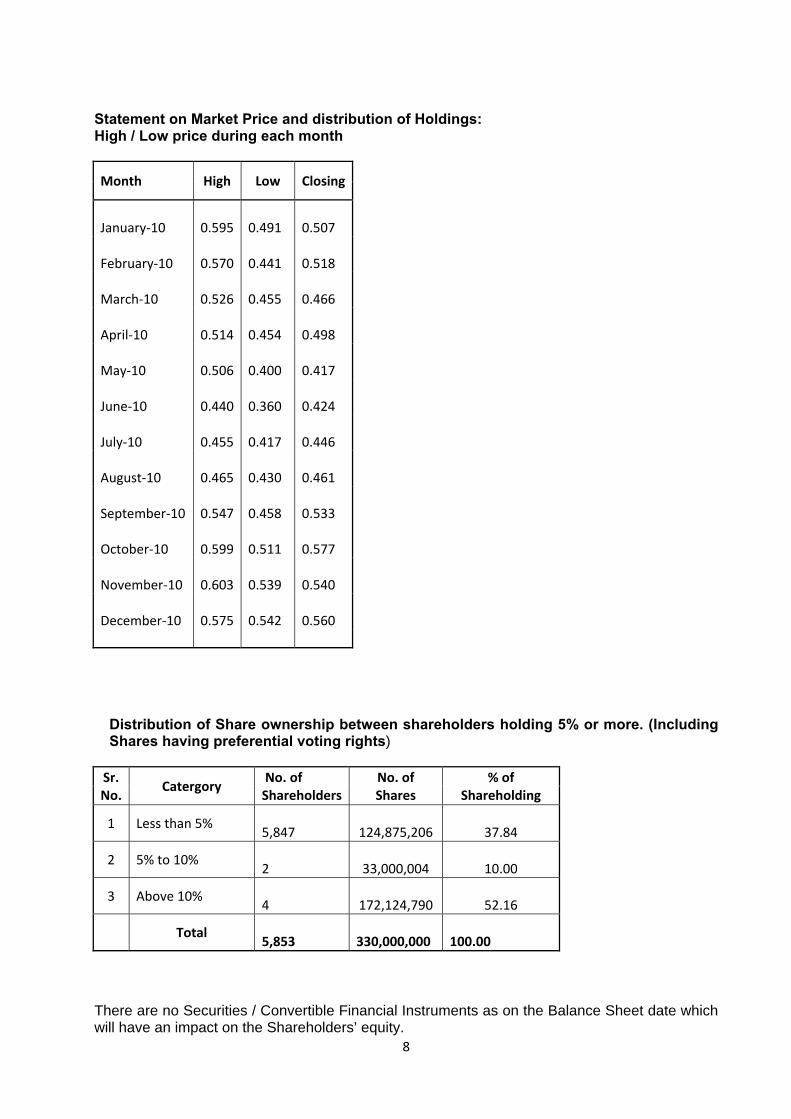
Statement on Market Price and distribution of Holdings: High / Low price during each month
Month High Low Closing
January‐10 0.595
0.491
0.507
February‐10 0.570
0.441
0.518
March‐10 0.526
0.455
0.466
April‐10 0.514
0.454
0.498
May‐10 0.506
0.400
0.417
June‐10 0.440
0.360
0.424
July‐10 0.455
0.417
0.446
August‐10 0.465
0.430
0.461
September‐10 0.547
0.458
0.533
October‐10 0.599
0.511
0.577
November‐10 0.603
0.539
0.540
December‐10 0.575
0.542
0.560
Distribution of Share ownership between shareholders holding 5% or more. (Including Shares having preferential voting rights)
Sr. No.
Catergory No. of Shareholders
No. of Shares
% of Shareholding
1 Less than 5% 5,847
124,875,206
37.84
2 5% to 10% 2
33,000,004
10.00
3 Above 10% 4
172,124,790
52.16
Total 5,853
330,000,000
100.00
There are no Securities / Convertible Financial Instruments as on the Balance Sheet date which will have an impact on the Shareholders’ equity.
9
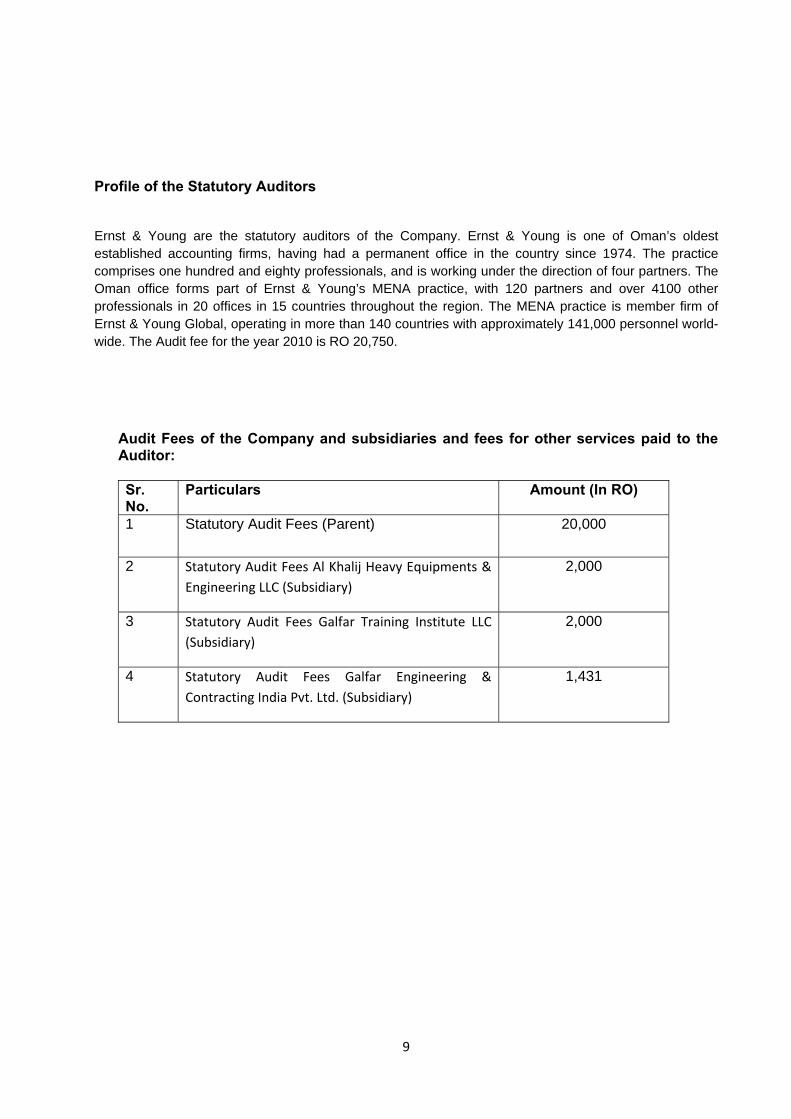
Profile of the Statutory Auditors Ernst & Young are the statutory auditors of the Company. Ernst & Young is one of Oman’s oldest established accounting firms, having had a permanent office in the country since 1974. The practice comprises one hundred and eighty professionals, and is working under the direction of four partners. The Oman office forms part of Ernst & Young’s MENA practice, with 120 partners and over 4100 other professionals in 20 offices in 15 countries throughout the region. The MENA practice is member firm of Ernst & Young Global, operating in more than 140 countries with approximately 141,000 personnel world-wide. The Audit fee for the year 2010 is RO 20,750.
Audit Fees of the Company and subsidiaries and fees for other services paid to the Auditor:
Sr. No.
Particulars Amount (In RO)
1 Statutory Audit Fees (Parent) 20,000
2 Statutory Audit Fees Al Khalij Heavy Equipments & Engineering LLC (Subsidiary)
2,000
3 Statutory Audit Fees Galfar Training Institute LLC (Subsidiary)
2,000
4 Statutory Audit Fees Galfar Engineering & Contracting India Pvt. Ltd. (Subsidiary)
1,431
10
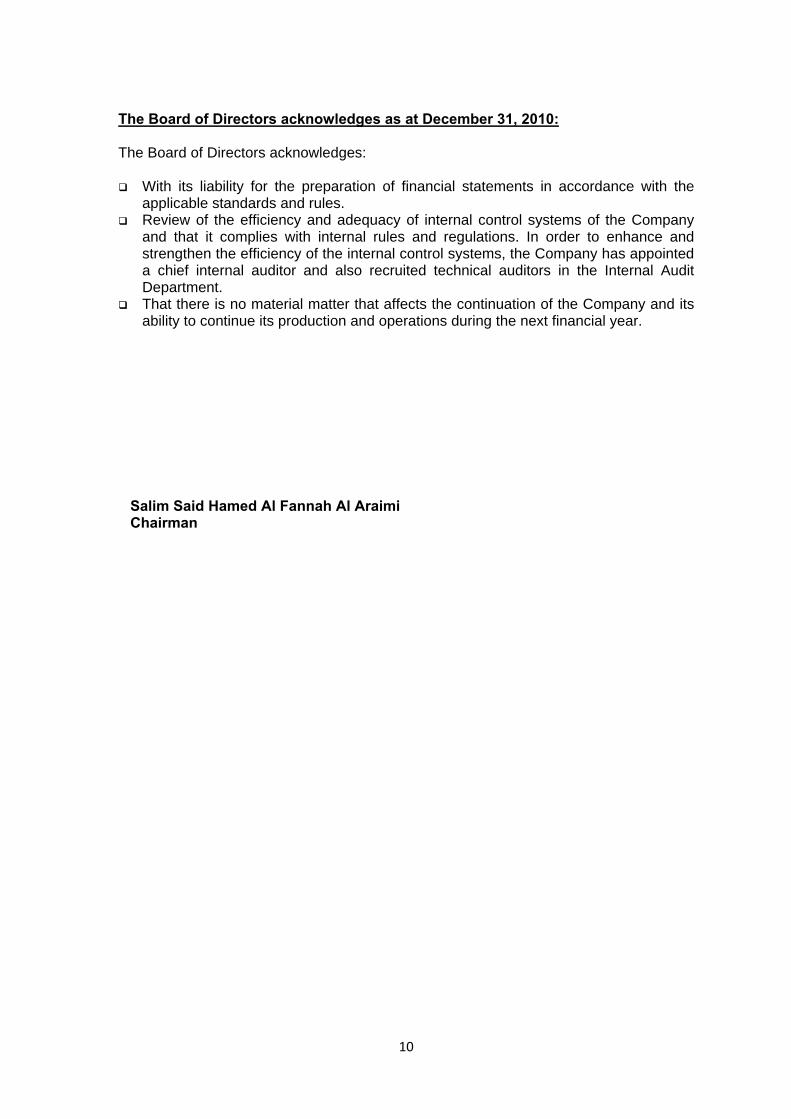
The Board of Directors acknowledges as at December 31, 2010:
The Board of Directors acknowledges:
With its liability for the preparation of financial statements in accordance with the
applicable standards and rules. Review of the efficiency and adequacy of internal control systems of the Company
and that it complies with internal rules and regulations. In order to enhance and strengthen the efficiency of the internal control systems, the Company has appointed a chief internal auditor and also recruited technical auditors in the Internal Audit Department.
That there is no material matter that affects the continuation of the Company and its ability to continue its production and operations during the next financial year.
Salim Said Hamed Al Fannah Al Araimi Chairman

Management Discussion and Analysis Report
Overview
Galfar Engineering and Contracting SAOG, continues to be one of the largest multi-disciplined engineering & contracting companies in the Sultanate of Oman.
A majority of our projects performed within the established industry standard margins. The complicated project which caused erosion of the margins has been substantially completed and put to use. The year 2010 also saw the entry of various new players in the market.
Main Objectives and Operational Results
During the end of 2010 Galfar had begun its initiative to optimise the organizational Effectiveness.
The Company has now the capacity and capability to execute the most challenging jobs in the various streams of infrastructure development. The company has engaged the services of an external consultants M/s Celerant, to assist the company in further improving its operational efficiency through various techniques of process improvements and cost control.
The Company’s experience in the three major construction & infrastructure sectors of, Oil & Gas, Roads & Bridges and Civil & Utilities remains unparalleled by any other competitor. The turnover of the Company including subsidiaries was RO 371.527 in 2010 as compared to RO 412.133 Million in 2009. The Company recorded a profit after tax of RO 6.00 Million in 2010 as compared to RO 3.754 Million in 2009, showing a growth of 59.80%.
We have substantially completed the most challenging project, Muscat Expressway. The Company is in the process of resolving the pending issues with the Clients and the Clients’ Engineers.
During the year 2010 the cost for quality manpower and the corresponding recruitment costs were on an unprecedented increasing trend which is due to the shortage of quality manpower in our main source area that is the Indian Subcontinent. This along with the increase in material costs and sub contract have built up significant cost pressures on the Company on the major cost heads.
The growth achieved by the company in the last five years is summarized below:
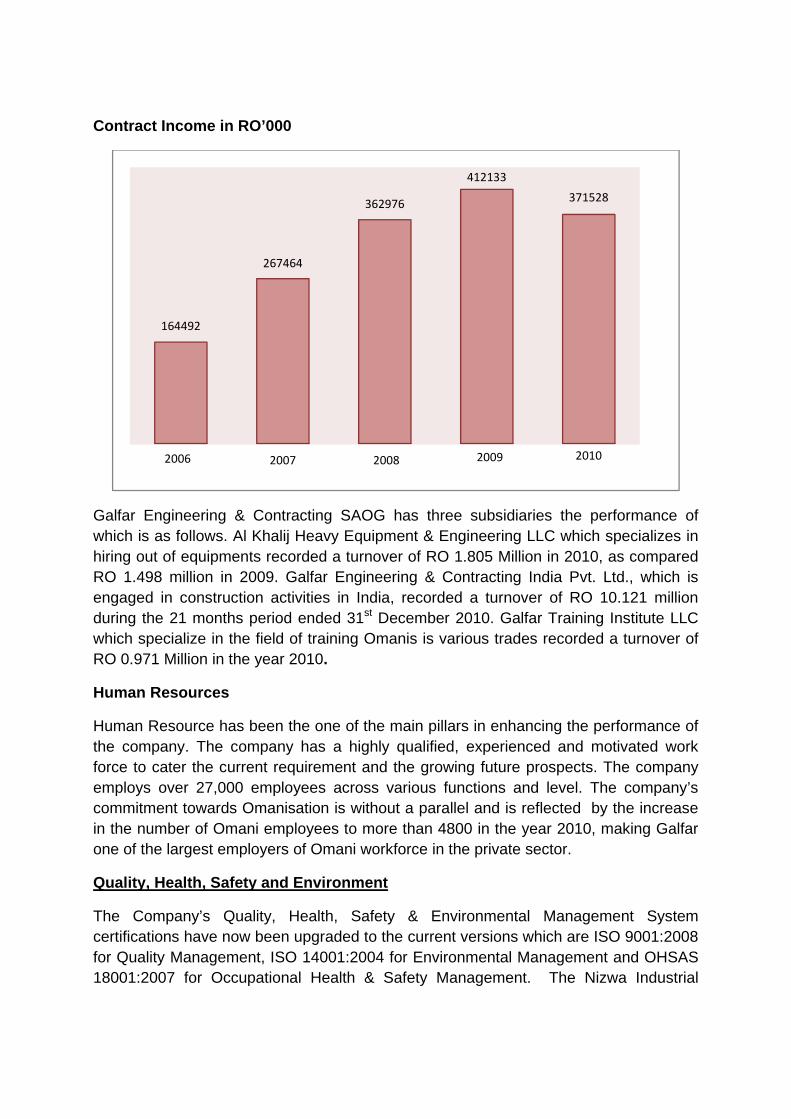
Contract Income in RO’000
Galfar Engineering & Contracting SAOG has three subsidiaries the performance of which is as follows. Al Khalij Heavy Equipment & Engineering LLC which specializes in hiring out of equipments recorded a turnover of RO 1.805 Million in 2010, as compared RO 1.498 million in 2009. Galfar Engineering & Contracting India Pvt. Ltd., which is engaged in construction activities in India, recorded a turnover of RO 10.121 million during the 21 months period ended 31st December 2010. Galfar Training Institute LLC which specialize in the field of training Omanis is various trades recorded a turnover of RO 0.971 Million in the year 2010.
Human Resources
Human Resource has been the one of the main pillars in enhancing the performance of the company. The company has a highly qualified, experienced and motivated work force to cater the current requirement and the growing future prospects. The company employs over 27,000 employees across various functions and level. The company’s commitment towards Omanisation is without a parallel and is reflected by the increase in the number of Omani employees to more than 4800 in the year 2010, making Galfar one of the largest employers of Omani workforce in the private sector.
Quality, Health, Safety and Environment
The Company’s Quality, Health, Safety & Environmental Management System certifications have now been upgraded to the current versions which are ISO 9001:2008 for Quality Management, ISO 14001:2004 for Environmental Management and OHSAS 18001:2007 for Occupational Health & Safety Management. The Nizwa Industrial
2006 2007 2008 2009 2010
164492
267464
362976
412133
371528
Facility is certified for ‘U’ Stamp by the American Society for Mechanical Engineers (ASME) for the Construction of Pressure Vessels & parts thereof.
During the course of the year 2010, the Company’s Vehicles have driven 137 million kms and the Company has worked 105 million man-hours across all units. Our Lost Time Injury Frequency (LTIF) for the year 2010 stands at 0.30 as against 0.49 in the year 2009. We have worked 15 Million man-hours without Lost Time Injury during the year 2010.
Risks
Management of Risks through suitable mitigation processes and careful planning continues to be of great importance in our existence in the construction industry.
The volume of work available in the market makes it attractive for new players to enter the market. Also the decline of developmental activities in the neighboring countries due to the global economic slowdown has positioned Oman as an attractive place for business.
Notwithstanding this we expect our 2011 results to be better than 2010.
Our resource mobilization capabilities continue to be our major strength. The equipment spread available within Galfar remains unparalleled in the local market. Augmenting this periodically has been an ongoing exercise and Galfar continues to invest a significant sum in adding equipment to the fleet.
The Company has a policy of reviewing its Fixed Assets needs either to add new capacity or to replace Plant and Equipment. During the current year the addition to fixed assets was RO 10 Million.
Internal Controls Systems
The Board assures that there is a detailed delegation of authority to the various levels of management and adequate corporate control of the organization. The Management is also fully aware of its responsibility towards all the stakeholders. The Company addresses these issues by maintaining clearly defined operating procedures which are updated as and when necessary.
The process of implementation of the new ERP system is well underway with the phase 1 already rolled out.
The company has engaged the services of M/s Ernst & Young to develop the Accounting Manual, which will further strengthen our internal control systems by clearly defining the policies and the procedures to be adopted and followed. This manual will be ready for implementation by mid of the year 2011.
Outlook
The Oman market continues to remain upbeat with the announcement of several projects in the Roads, Airports, Water & Wastewater and the Power generation and transmission sectors. Galfar has the capability to meet this demand and the challenges posed by the competition.
The Company remains confident of growing. Galfar’s Order Book stood at RO 614 Million at the beginning of the year 2011.
The appreciably healthy order book during the beginning of the year is indicative of further significant order booking prospects for the year and we are confident of acquiring many more contracts during the year.
We have active presence in all the sectors namely Oil& Gas, Roads & Bridges, Civil, Utilities and Services including Operation and Maintenance, and have the preparedness to take up any challenge whether in Roads, Ports, Airports, Power, Water and Wastewater Sectors. We have establishments in every part of Oman, be it Jabal Akhdar, Musandam, Hasik, Sohar, Sur, Duqm or Salalah to start up projects swiftly.
Having capabilities in all sections of construction industry and Galfar’s execution experience in prestigious large scale jobs with high end technological challenges like Kauther Gas plant, Harweel Cluster Project and contracts & EPC in Lekhwair and Qarn Alam etc., we are placed in a unique position amongst our competitors.
With the delivery of high quality buildings, hotels, museums, large show rooms etc. we have added to our credentials evidences of high level workmanship coupled with quality execution and management capabilities. The Bank Muscat Head Quarters has been handed over to the clients to the fullest satisfaction and the MEED has recognized Bank Muscat as a ‘Quality Project’ in the entire GCC.
This kind of versatility in operations and the wide logistic base are difficult for others to establish thus making Galfar a trusted one stop solution provider for our esteemed customers.
The Indian operations of Galfar which had taken off with one project awarded, has been awarded two more projects. The first project was completed five months ahead of schedule and with excellent returns. We expect these operations to grow significantly in the Public Private Participation (PPP) models as well as cash contracts in Roads, Ports, Airports and the Oil and Gas sectors.
We are now exploring the North African region with a view to acquire projects in the Oil and Gas sectors. We also expect to be involved with the infrastructure projects in this region, however all such projects are likely to materialize towards the last quarter of this year.
Under the visionary leadership of His Majesty Sultan Qaboos, who in 40 years of his rule has turned this country into a powerful modern country well known in the region, we endeavour to reach even higher standards of project delivery through continuous introspection of our procedures and systems and will lead by action in Omanisation as a true Omani enterprise.
Galfar’s broad image as a premier Omani company with international presence, is without comparison and we can deliver projects in all the sections of construction industry – be it EPC or construction – with high quality standards in a safe and timely manner to the entire satisfaction of all stake holders.
Dr. P Mohamed Ali
Managing Director
Galfar Engineering and Contracting SAOG and its Subsidiaries
STATEMENT OF CONSOLIDATED COMPREHENSIVE INCOME Year ended 31 December 2010
3
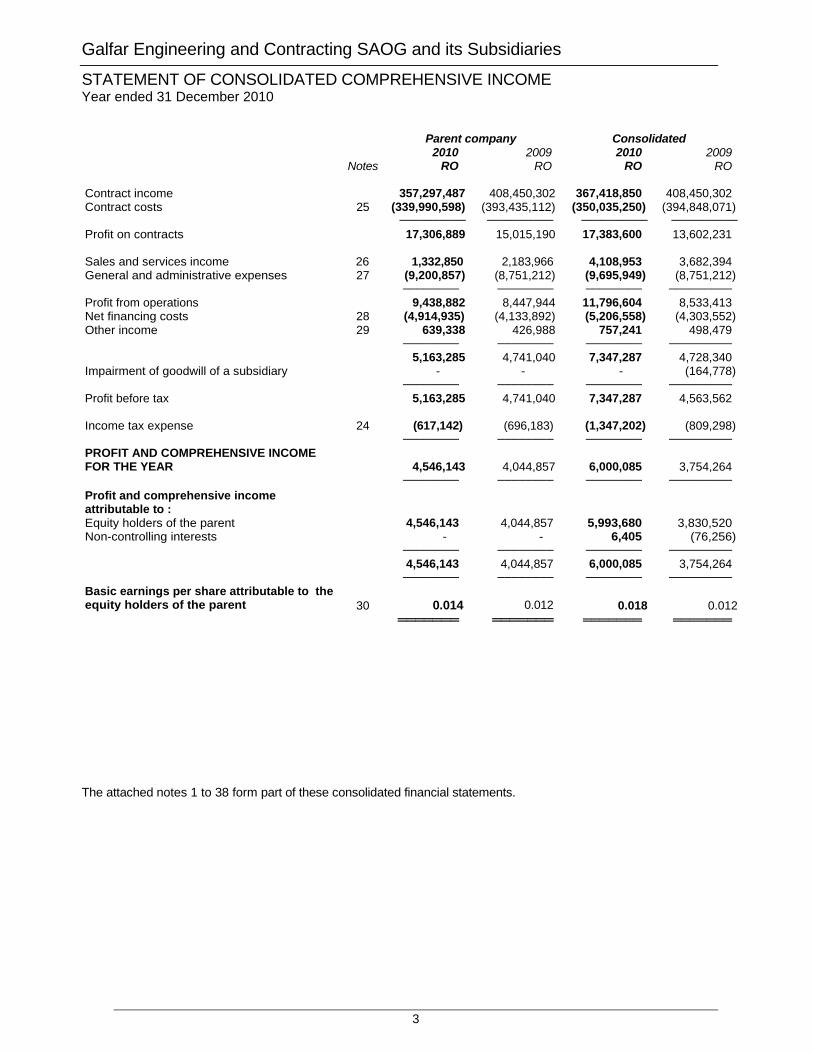
Parent company Consolidated 2010 2009 2010 2009 Notes RO RO RO RO Contract income 357,297,487 408,450,302 367,418,850 408,450,302 Contract costs 25 (339,990,598) (393,435,112) (350,035,250) (394,848,071) ────────── ────────── ────────── ──────────Profit on contracts 17,306,889 15,015,190 17,383,600 13,602,231 Sales and services income 26 1,332,850 2,183,966 4,108,953 3,682,394 General and administrative expenses 27 (9,200,857) (8,751,212) (9,695,949) (8,751,212) ──────── ──────── ──────── ─────────Profit from operations 9,438,882 8,447,944 11,796,604 8,533,413 Net financing costs 28 (4,914,935) (4,133,892) (5,206,558) (4,303,552)Other income 29 639,338 426,988 757,241 498,479 ──────── ──────── ──────── ───────── 5,163,285 4,741,040 7,347,287 4,728,340 Impairment of goodwill of a subsidiary - - - (164,778) ──────── ──────── ──────── ─────────Profit before tax 5,163,285 4,741,040 7,347,287 4,563,562 Income tax expense 24 (617,142) (696,183) (1,347,202) (809,298) ──────── ──────── ──────── ─────────PROFIT AND COMPREHENSIVE INCOME FOR THE YEAR 4,546,143
4,044,857 6,000,085 3,754,264
──────── ──────── ──────── ─────────Profit and comprehensive income attributable to :
Equity holders of the parent 4,546,143 4,044,857 5,993,680 3,830,520Non-controlling interests - - 6,405 (76,256) ──────── ──────── ──────── ───────── 4,546,143 4,044,857 6,000,085 3,754,264 ──────── ──────── ──────── ─────────Basic earnings per share attributable to the equity holders of the parent 30 0.014 0.012 0.018 0.012 ═══════ ═══════ ═══════ ═══════ The attached notes 1 to 38 form part of these consolidated financial statements.

Galfar Engineering and Contracting SAOG and its Subsidiaries
STATEMENT OF CONSOLIDATED FINANCIAL POSITION At 31 December 2010
4
Parent company Consolidated 2010 2009 2010 2009 Notes RO RO RO RO ASSETS Non-current assets Property, plant and equipment 4 117,026,103 131,003,254 121,999,537 134,401,799 Investment in subsidiaries 5 756,542 748,500 - - Investment in associates 6 8,342,606 1,066,573 8,342,606 1,066,573 Available for sale investments 7 125,000 125,000 145,000 145,000 Retentions receivable 16,405,068 25,299,837 16,405,293 25,299,840 ────────── ────────── ────────── ──────────Total non-current assets 142,655,319 158,243,164 146,892,436 160,913,212 ────────── ────────── ────────── ──────────Current assets Inventories 8 24,094,862 23,185,222 24,190,076 23,244,741 Trade receivables 9 181,579,107 122,518,419 184,630,471 122,863,904 Work in progress 10 45,382,126 45,449,611 45,576,484 45,449,611 Prepayments, advances and other receivables
11
15,854,542
12,424,620
15,338,891
12,747,825
Deposits with banks 12 2,244,946 2,756,367 2,392,924 2,759,007 Cash and bank balances 13 1,389,191 1,644,473 1,708,830 1,797,461 ────────── ────────── ────────── ──────────Total current assets 270,544,774 207,978,712 273,837,676 208,862,549 ────────── ────────── ────────── ──────────TOTAL ASSETS 413,200,093 366,221,876 420,730,112 369,775,761 ════════ ═══════ ═══════ ═══════EQUITY AND LIABILITIES Equity Share capital 14 33,000,000 30,000,000 33,000,000 30,000,000 Share premium 15 16,502,842 17,502,842 16,502,842 17,502,842 Statutory reserve 17 11,000,000 10,000,000 11,084,401 10,000,000 Retained earnings 18 22,949,005 24,402,861 24,422,362 24,513,083 ────────── ───────── ────────── ─────────Equity attributable to equity holders of the parent company 83,451,847 81,905,703 85,009,605 82,015,925 Non controlling interests - - 657,441 651,036 ────────── ───────── ────────── ─────────Total equity 83,451,847 81,905,703 85,667,046 82,666,961 ────────── ───────── ────────── ─────────Non-current liabilities Term loans 19 21,048,611 25,580,434 21,663,176 26,728,952 Employees’ end of service indemnity 20 7,208,589 6,050,869 7,307,956 6,147,266 Deferred tax liability 24 7,604,628 6,987,486 7,821,910 7,219,652 Creditors for purchase of property, plant and equipment 1,732,646 3,909,088 1,756,659 3,992,105 Finance lease liability 33 4,809,697 2,897,155 4,809,697 2,897,155 Advances on contracts 14,064,085 9,854,446 14,064,085 9,854,445
────────── ───────── ────────── ─────────Total non-current liabilities 56,468,256 55,279,478 57,423,483 56,839,575
────────── ───────── ────────── ─────────Current liabilities Bank borrowings 21 47,477,440 22,878,878 47,649,527 22,962,433 Short term loans 22 18,000,000 22,499,920 18,000,000 22,499,920 Term loans - current portion 19 20,872,901 20,000,616 21,406,850 20,796,479 Current portion of finance lease liability 33 3,139,692 2,648,431 3,139,692 2,648,431 Trade and other payables 23 183,789,957 161,008,850 186,698,570 161,361,962 Provision for taxation - - 744,944 - ────────── ────────── ────────── ──────────Total current liabilities 273,279,990 229,036,695 277,639,583 230,269,225 ────────── ────────── ────────── ──────────Total liabilities 329,748,246 284,316,173 335,063,066 287,108,800 ────────── ────────── ────────── ──────────TOTAL EQUITY AND LIABILITIES 413,200,093 366,221,876 420,730,112 369,775,761 ════════ ═══════ ═══════ ═══════Net assets per share 0.253 0.273 0.257 0.273 ────────── ────────── ────────── ────────── The consolidated financial statements were approved on
Chairman Chief Financial Officer The attached notes 1 to 38 form part of these consolidated financial statements.
Galfar Engineering and Contracting SAOG and its Subsidiaries
STATEMENT OF CHANGES IN EQUITY – PARENT COMPANY Year ended 31 December 2010
6
Parent company Share
capital ( note 14)
Share premium
( note 15)
Statutory reserve
( note 17)
Retained earnings
Total
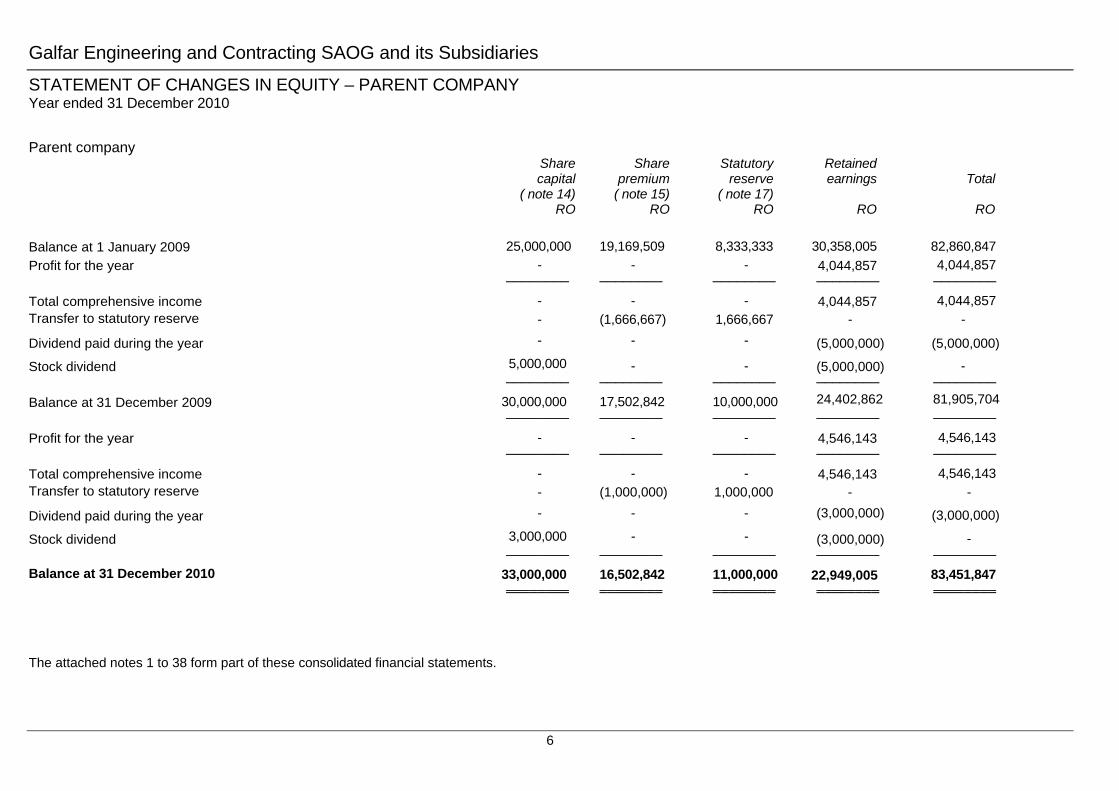
RO RO RO RO RO Balance at 1 January 2009 25,000,000 19,169,509 8,333,333 30,358,005 82,860,847 Profit for the year - - - 4,044,857 4,044,857 ──────── ──────── ──────── ──────── ──────── Total comprehensive income - - - 4,044,857 4,044,857 Transfer to statutory reserve - (1,666,667) 1,666,667 - -
Dividend paid during the year - - - (5,000,000) (5,000,000)
Stock dividend 5,000,000 - - (5,000,000) - ──────── ──────── ──────── ──────── ──────── Balance at 31 December 2009 30,000,000 17,502,842 10,000,000 24,402,862 81,905,704 ──────── ──────── ──────── ──────── ──────── Profit for the year - - - 4,546,143 4,546,143 ──────── ──────── ──────── ──────── ──────── Total comprehensive income - - - 4,546,143 4,546,143 Transfer to statutory reserve - (1,000,000) 1,000,000 - -
Dividend paid during the year - - - (3,000,000) (3,000,000)
Stock dividend 3,000,000 - - (3,000,000) - ──────── ──────── ──────── ──────── ──────── Balance at 31 December 2010 33,000,000 16,502,842 11,000,000 22,949,005 83,451,847 ════════ ════════ ════════ ════════ ════════ The attached notes 1 to 38 form part of these consolidated financial statements.
Galfar Engineering and Contracting SAOG and its Subsidiaries
STATEMENT OF CHANGES IN EQUITY – PARENT COMPANY Year ended 31 December 2010
6
Attributable to the equity holders of the parent Non-
controlling
Consolidated Share capital
(note 14)
Share premium (note 15)
Statutory reserve
(note 17)
Retained earnings (note 18)
Total
interests Total
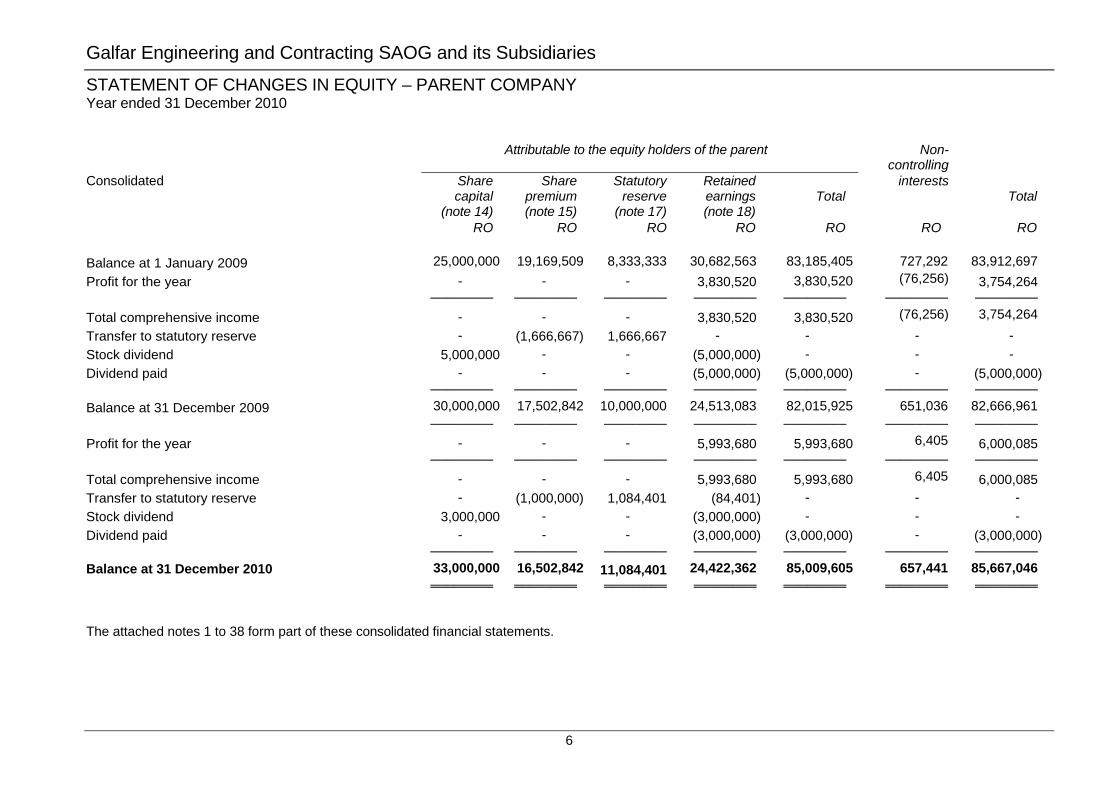
RO RO RO RO RO RO RO Balance at 1 January 2009 25,000,000 19,169,509 8,333,333 30,682,563 83,185,405 727,292 83,912,697 Profit for the year - - - 3,830,520 3,830,520 (76,256) 3,754,264 ──────── ──────── ──────── ──────── ──────── ──────── ──────── Total comprehensive income - - - 3,830,520 3,830,520 (76,256) 3,754,264 Transfer to statutory reserve - (1,666,667) 1,666,667 - - - - Stock dividend 5,000,000 - - (5,000,000) - - - Dividend paid - - - (5,000,000) (5,000,000) - (5,000,000) ──────── ──────── ──────── ──────── ──────── ──────── ──────── Balance at 31 December 2009 30,000,000 17,502,842 10,000,000 24,513,083 82,015,925 651,036 82,666,961 ──────── ──────── ──────── ──────── ──────── ──────── ──────── Profit for the year - - - 5,993,680 5,993,680 6,405 6,000,085 ──────── ──────── ──────── ──────── ──────── ──────── ──────── Total comprehensive income - - - 5,993,680 5,993,680 6,405 6,000,085 Transfer to statutory reserve - (1,000,000) 1,084,401 (84,401) - - - Stock dividend 3,000,000 - - (3,000,000) - - - Dividend paid - - - (3,000,000) (3,000,000) - (3,000,000) ──────── ──────── ──────── ──────── ──────── ──────── ──────── Balance at 31 December 2010 33,000,000 16,502,842 11,084,401 24,422,362 85,009,605 657,441 85,667,046 ════════ ════════ ════════ ════════ ════════ ════════ ════════ The attached notes 1 to 38 form part of these consolidated financial statements.

Galfar Engineering and Contracting SAOG and its Subsidiary
STATEMENTS OF CONSOLIDATED CASH FLOWS Year ended 31 December 2010
5
Parent company Consolidated 2010 2009 2010 2009 RO RO RO RO OPERATING ACTIVITIES Profit before tax 5,163,285 4,741,040 7,347,287 4,563,562Adjustments for: Depreciation of property, plant and equipment 23,280,610 22,136,893 24,192,426 22,837,017 Gain on disposal of property, plant and equipment
(89,254) (62,997)
(167,688) (124,638)
Net transfer to employees’ end of service indemnity
1,157,720 966,489
1,160,690 965,568
Goodwill impairment - - - 164,778Finance costs 4,964,179 4,719,288 5,265,681 4,888,948 Interest income (49,244) (585,396) (59,123) (585,396) ─────── ─────── ─────── ───────Operating profit before changes in working Capital 34,427,296 31,915,317 37,739,273 32,709,839Changes in working capital: Trade receivables and work in progress (58,993,203) (17,531,917) (61,893,440) (17,106,495)Prepayments, advances and other Receivables (3,429,922) 1,896,108 (2,591,066) 1,468,394 Inventories (909,640) 23,030,636 (945,335) 23,041,553Trade and other payables 22,781,107 24,914,040 25,336,608 23,132,021 ─────── ─────── ─────── ───────Net cash (used in) from operations (6,124,362) 64,224,184 (2,353,960) 63,245,312 Change in retentions receivable-long term 8,894,769 (9,307,179) 8,894,547 (9,307,179)Change in advances on contract’s long term 4,209,639 (14,399,347) 4,209,640 (14,399,347)Changes in creditors for property, plant and equipment (2,176,442) (1,925,253) (2,235,446) (1,842,236)Income tax paid - (878,143) - (878,143) ─────── ─────── ─────── ───────Net cash from operating activities 4,803,604 37,594,607 8,514,781 36,698,752 ─────── ─────── ─────── ───────INVESTING ACTIVITIES Payments for purchase of property, plant and equipment
(10,103,449) (27,791,851)
(12,593,736) (28,775,188)
Proceeds from sale of property, plant and equipment
889,247 1,647,982
971,260 1,722,497
Change in term deposits 511,420 9,658,177 366,083 9,658,177 Interest received 49,244 585,396 59,123 585,396Investment in associates (7,284,075) (1,215,073) (7,276,033) (1,066,573) ─────── ─────── ─────── ───────Net cash used in investing activities (15,937,613) (17,115,369) (18,473,303) (17,875,691) ─────── ─────── ─────── ───────FINANCING ACTIVITIES Change in bank borrowings 24,598,561 (15,942,531) 24,687,094 (15,912,057)Change in term loans and lease finance liability
(1,255,735) 118,366
(2,051,602) 2,062,744
Change in short term loans (4,499,920) 4,828,228 (4,499,920) 4,828,228 Interest paid (4,964,179) (4,719,288) (5,265,681) (4,888,948)Dividend paid (3,000,000) (5,000,000) (3,000,000) (5,000,000) ─────── ─────── ─────── ───────Net cash from (used) in financing activities 10,878,727 (20,715,225) 9,869,891 (18,910,033) ─────── ─────── ─────── ───────NET DECREASE IN CASH AND CASH EQUIVALENTS (255,282) (235,987) (88,631) (86,972) Cash and cash equivalents, at the beginning of the year 1,644,473 1,880,460 1,797,461 1,884,433 ─────── ─────── ─────── ───────CASH AND CASH EQUIVALENTS, AT THE END OF THE YEAR 1,389,191 1,644,473 1,708,830 1,797,461 ════════ ═══════ ════════ ════════ The attached notes 1 to 38 form part of these consolidated financial statements.

Galfar Engineering and Contracting SAOG and its Subsidiaries
NOTES TO THE CONSOLIDATED FINANCIAL STATEMENTS At 31 December 2010
8
1 CORPORATE INFORMATION The consolidated financial statements were authorised for issue in accordance with a resolution of the directors on 10 March 2011.Galfar Engineering and Contracting SAOG (“the parent company”) is an Omani joint stock company registered under the Commercial Companies Law of the Sultanate of Oman. The registered address of the Company is P O Box 533, Muscat, Postal Code 100, Sultanate of Oman. The principal activities of Galfar Engineering and Contracting SAOG and its subsidiary (“the group”) are civil and mechanical construction, public health engineering, road construction, electrical, plumbing and maintenance contracts. 2 SIGNIFICANT ACCOUNTING POLICIES Basis of preparation These consolidated financial statements have been prepared in accordance with International Financial Reporting Standards, and applicable requirements of the Commercial Companies Law and the Capital Market Authority of the Sultanate of Oman. These consolidated financial statements have been presented in Rial Omani which is the functional and reporting currency for these consolidated financial statements. Accounting Convention These consolidated financial statements have been prepared under the historical cost convention modified to include the fair value adjustment for investment in associates in the parent company financial statements and available for sale investments. Changes in accounting policy and disclosures The accounting policies are consistent with those used in the previous financial year except as follows: The group has adopted the following new and amended IFRS and IFRIC interpretations as of 1 January 2010:
IFRS 2 Share-based Payment: Group Cash-settled Share-based Payment Transactions effective1 January 2010
IFRS 3 Business Combinations (Revised) and IAS 27 Consolidated and Separate Financial Statements (Amended) effective 1 July 2009, including consequential amendments to IFRS 2, IFRS 5, IFRS 7, IAS 7, IAS 21, IAS 28, IAS 31 and IAS 39
IAS 39 Financial Instruments: Recognition and Measurement – Eligible Hedged Items effective 1 July 2009
IFRIC 17 Distributions of Non-cash Assets to Owners effective 1 July 2009 Improvements to IFRSs (May 2008) Improvements to IFRSs (April 2009)
The adoption of the above did not have any impact on the accounting policies, financial position or performance of the group. Details regarding standards issued but not yet effective are set out in note 3. Accounting Policies The significant accounting policies adopted by the group are as follows:
Basis of consolidation The consolidated financial statements comprise those of Galfar Engineering and Contracting SAOG and its subsidiary as at 31 December each year. A subsidiary is a company in which the parent company owns, directly or indirectly more than half of the voting power.

Galfar Engineering and Contracting SAOG and its Subsidiaries
NOTES TO THE CONSOLIDATED FINANCIAL STATEMENTS At 31 December 2010
9
2 SIGNIFICANT ACCOUNTING POLICIES (continued)
Basis of consolidation (continued) The subsidiary is consolidated from the date on which control is transferred to the group and ceases to be consolidated from the date on which control is transferred out of the group. The financial statements of the subsidiary are prepared for the same reporting period as the parent company using consistent accounting policies. Adjustments are made to bring into line any dissimilar accounting policies which may exist. All intercompany balances, income and expenses, unrealised gains and losses and dividends resulting from intra-group transactions are eliminated. A change in the ownership interest of a subsidiary, without a change of control, is accounted for as an equity transaction. Losses are attributed to the non-controlling interest even if that results in a deficit balance. If the group loses control over a subsidiary, it:
• Derecognises the assets (including goodwill) and liabilities of the subsidiary • Derecognises the carrying amount of any non-controlling interest • Derecognises the cumulative translation differences, recorded in equity • Recognises the fair value of the consideration received • Recognises the fair value of any investment retained • Recognises any surplus or deficit in profit or loss • Reclassifies the parent’s share of components previously recognised in other comprehensive income
to profit or loss. In the parent company’s separate financial statements, the investment in the subsidiary is carried at cost less impairment. Business combinations and goodwill Business combinations are accounted for using the acquisition method. The cost of an acquisition is measured as the aggregate of the consideration transferred, measured at the acquisition date fair value, and the amount of any non-controlling interest in the acquiree. For each business combination, the acquirer measures the non-controlling interest in the acquiree either at fair value or at the proportionate share of the acquiree’s identifiable net assets. Acquisition costs incurred are expensed and included in administrative expenses. When the group acquires a business, it assesses the financial assets and liabilities assumed for appropriate classification and designation in accordance with the contractual terms, economic circumstances and pertinentconditions as at the acquisition date. This includes the separation of embedded derivatives in host contracts by the acquiree. If the business combination is achieved in stages, the acquisition date fair value of the acquirer’s previously held equity interest in the acquiree is remeasured to fair value at the acquisition date through profit or loss. Any contingent consideration to be transferred by the acquirer will be recognised at fair value at the acquisition date. Subsequent changes to the fair value of the contingent consideration which is deemed to be an asset or liability will be recognised in accordance with IAS 39 either in profit or loss or as a change to other comprehensive income. If the contingent consideration is classified as equity, it should not be remeasured until it is finally settled within equity. Goodwill is initially measured at cost being the excess of the aggregate of the consideration transferred and the amount recognised for non-controlling interest, over the net identifiable assets acquired and liabilities assumed. If this consideration is lower than the fair value of the net assets of the subsidiary acquired, the difference is recognised in profit or loss.
Galfar Engineering and Contracting SAOG and its Subsidiaries
NOTES TO THE CONSOLIDATED FINANCIAL STATEMENTS At 31 December 2010
10
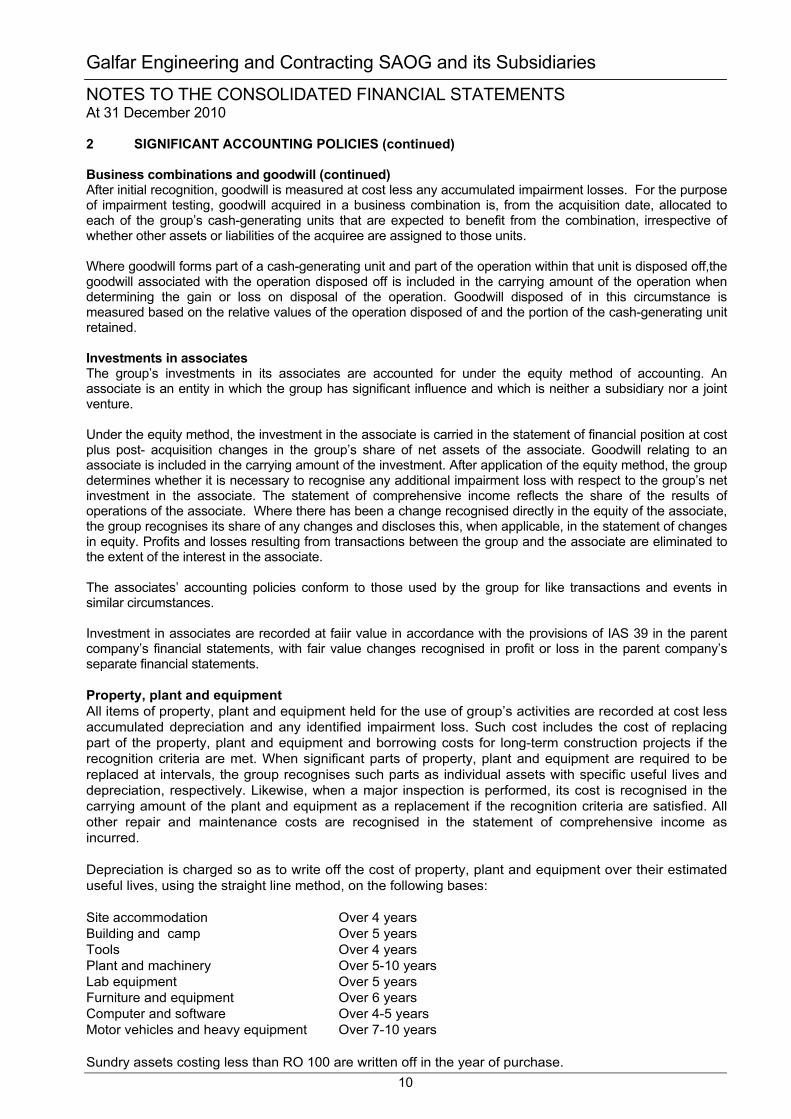
2 SIGNIFICANT ACCOUNTING POLICIES (continued) Business combinations and goodwill (continued) After initial recognition, goodwill is measured at cost less any accumulated impairment losses. For the purpose of impairment testing, goodwill acquired in a business combination is, from the acquisition date, allocated to each of the group’s cash-generating units that are expected to benefit from the combination, irrespective of whether other assets or liabilities of the acquiree are assigned to those units. Where goodwill forms part of a cash-generating unit and part of the operation within that unit is disposed off,the goodwill associated with the operation disposed off is included in the carrying amount of the operation when determining the gain or loss on disposal of the operation. Goodwill disposed of in this circumstance is measured based on the relative values of the operation disposed of and the portion of the cash-generating unit retained. Investments in associates The group’s investments in its associates are accounted for under the equity method of accounting. An associate is an entity in which the group has significant influence and which is neither a subsidiary nor a joint venture. Under the equity method, the investment in the associate is carried in the statement of financial position at cost plus post- acquisition changes in the group’s share of net assets of the associate. Goodwill relating to an associate is included in the carrying amount of the investment. After application of the equity method, the group determines whether it is necessary to recognise any additional impairment loss with respect to the group’s net investment in the associate. The statement of comprehensive income reflects the share of the results of operations of the associate. Where there has been a change recognised directly in the equity of the associate, the group recognises its share of any changes and discloses this, when applicable, in the statement of changes in equity. Profits and losses resulting from transactions between the group and the associate are eliminated to the extent of the interest in the associate. The associates’ accounting policies conform to those used by the group for like transactions and events in similar circumstances. Investment in associates are recorded at faiir value in accordance with the provisions of IAS 39 in the parent company’s financial statements, with fair value changes recognised in profit or loss in the parent company’s separate financial statements. Property, plant and equipment All items of property, plant and equipment held for the use of group’s activities are recorded at cost less accumulated depreciation and any identified impairment loss. Such cost includes the cost of replacing part of the property, plant and equipment and borrowing costs for long-term construction projects if the recognition criteria are met. When significant parts of property, plant and equipment are required to be replaced at intervals, the group recognises such parts as individual assets with specific useful lives and depreciation, respectively. Likewise, when a major inspection is performed, its cost is recognised in the carrying amount of the plant and equipment as a replacement if the recognition criteria are satisfied. All other repair and maintenance costs are recognised in the statement of comprehensive income as incurred. Depreciation is charged so as to write off the cost of property, plant and equipment over their estimated useful lives, using the straight line method, on the following bases: Site accommodation Over 4 years Building and camp Over 5 years Tools Over 4 years Plant and machinery Over 5-10 years Lab equipment Over 5 years Furniture and equipment Over 6 years Computer and software Over 4-5 years Motor vehicles and heavy equipment Over 7-10 years Sundry assets costing less than RO 100 are written off in the year of purchase.

Galfar Engineering and Contracting SAOG and its Subsidiaries
NOTES TO THE CONSOLIDATED FINANCIAL STATEMENTS At 31 December 2010
11
2 SIGNIFICANT ACCOUNTING POLICIES (continued) Property, plant and equipment (continued) The assets’ residual values, useful lives and methods of depreciation are reviewed at each financial year end.Where the carrying value of an asset is greater than its estimated recoverable amount, it is written down immediately to its recoverable amount. An item of property, plant and equipment and any significant part initially recognised is derecognised upon disposal or when no future economic benefits are expected from its use or disposal. Any gain or loss arising on derecognition of the asset, calculated as the difference between the net disposal proceeds and the carrying amount of the asset is recognised in the statement of comprehensive income when the asset is derecognised. Capital work in progress Properties in the course of construction for production, rental or administrative purposes, or for purposes not yet determined, are carried at cost, less any recognised impairment loss. Depreciation of these assets, on the same basis as other property assets, commences when the assets are ready for their intended use. Available-for-sale investments Available-for-sale investments are initially recognised at cost, which includes transaction costs, and are, in general, subsequently carried at fair value. Available-for-sale equity investments that do not have a quoted market price in an active market, and for which other methods of reasonably estimating fair value are inappropriate, are measured at cost, as reduced by allowances for estimated impairment. Inventories Inventories are stated at the lower of cost and net realizable value. Cost comprises purchase price and all direct costs incurred in bringing the inventories to their present location and condition. Cost is calculated using the weighted average method. Net realizable value represents the estimated selling price less all estimated costs to be incurred in marketing, selling and distribution. Contract work in progress Work in progress on long term contracts is calculated at cost plus attributable profit, to the extent that this is reasonably certain after making provision for contingencies, less any losses foreseen in bringing contracts to completion and less amounts received and receivable as progress payments. Cost for this purpose includes direct labour, direct expenses and an appropriate allocation of overheads. For any contracts where receipts plus receivables exceed the book value of work done, the excess is included in accounts payable and accruals. Impairment of non-financial assets At each reporting date, the group reviews the carrying amounts of its assets to determine whether there is any indication that those assets have suffered an impairment loss. If any such indication exists, the recoverable amount of the asset is estimated in order to determine the extent of the impairment loss, if any. An asset’s recoverable amount is the higher of an asset’s or cash-generating unit’s fair value less costs to sell and its value in use and is determined for an individual asset, unless the asset does not generate cash inflows that are largely independent of those from other assets or groups of assets.
The loss arising on an impairment of an asset is determined as the difference between the recoverable amount and carrying amount of the asset and is recognised immediately in the statement of comprehensive income. An assessment is made at each reporting date as to whether there is any indication that previously recognised impairment losses may no longer exist or may have decreased. Where an impairment loss subsequently reverses, the carrying amount of the asset is increased to the revised estimate of its recoverable amount and the increase is recognised as income immediately, provided that the increased carrying amount does not exceed the carrying amount that would have been determined, had no impairment loss been recognised earlier.
Galfar Engineering and Contracting SAOG and its Subsidiaries
NOTES TO THE CONSOLIDATED FINANCIAL STATEMENTS At 31 December 2010
12
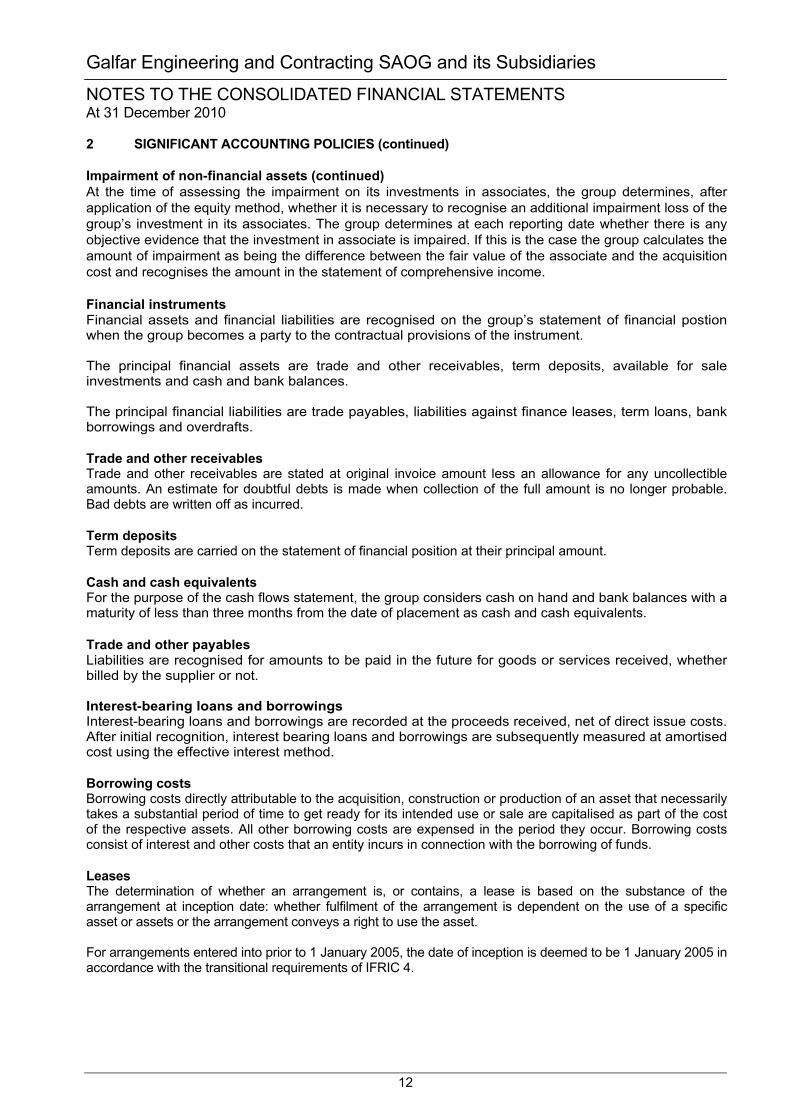
2 SIGNIFICANT ACCOUNTING POLICIES (continued) Impairment of non-financial assets (continued) At the time of assessing the impairment on its investments in associates, the group determines, after application of the equity method, whether it is necessary to recognise an additional impairment loss of the group’s investment in its associates. The group determines at each reporting date whether there is any objective evidence that the investment in associate is impaired. If this is the case the group calculates the amount of impairment as being the difference between the fair value of the associate and the acquisition cost and recognises the amount in the statement of comprehensive income. Financial instruments Financial assets and financial liabilities are recognised on the group’s statement of financial postion when the group becomes a party to the contractual provisions of the instrument. The principal financial assets are trade and other receivables, term deposits, available for sale investments and cash and bank balances. The principal financial liabilities are trade payables, liabilities against finance leases, term loans, bank borrowings and overdrafts. Trade and other receivables Trade and other receivables are stated at original invoice amount less an allowance for any uncollectible amounts. An estimate for doubtful debts is made when collection of the full amount is no longer probable. Bad debts are written off as incurred. Term deposits Term deposits are carried on the statement of financial position at their principal amount. Cash and cash equivalents For the purpose of the cash flows statement, the group considers cash on hand and bank balances with a maturity of less than three months from the date of placement as cash and cash equivalents. Trade and other payables Liabilities are recognised for amounts to be paid in the future for goods or services received, whether billed by the supplier or not. Interest-bearing loans and borrowings Interest-bearing loans and borrowings are recorded at the proceeds received, net of direct issue costs. After initial recognition, interest bearing loans and borrowings are subsequently measured at amortised cost using the effective interest method. Borrowing costs Borrowing costs directly attributable to the acquisition, construction or production of an asset that necessarily takes a substantial period of time to get ready for its intended use or sale are capitalised as part of the cost of the respective assets. All other borrowing costs are expensed in the period they occur. Borrowing costs consist of interest and other costs that an entity incurs in connection with the borrowing of funds. Leases The determination of whether an arrangement is, or contains, a lease is based on the substance of the arrangement at inception date: whether fulfilment of the arrangement is dependent on the use of a specific asset or assets or the arrangement conveys a right to use the asset. For arrangements entered into prior to 1 January 2005, the date of inception is deemed to be 1 January 2005 in accordance with the transitional requirements of IFRIC 4.

Galfar Engineering and Contracting SAOG and its Subsidiaries
NOTES TO THE CONSOLIDATED FINANCIAL STATEMENTS At 31 December 2010
13
2 SIGNIFICANT ACCOUNTING POLICIES (continued) Leases (continued) Group as a lessee Finance leases, which transfer to the group substantially all the risks and benefits incidental to ownership of the leased item, are capitalised at the commencement of the lease at the fair value of the leased property or, if lower, at the present value of the minimum lease payments. Lease payments are apportioned between finance charges and reduction of the lease liability so as to achieve a constant rate of interest on the remaining balance of the liability. Finance charges are recognised in the statement of comprehensive income. Leased assets are depreciated over the useful life of the asset. However, if there is no reasonable certainty that the group will obtain ownership by the end of the lease term, the asset is depreciated over the shorter of the estimated useful life of the asset and the lease term. Derecognition of financial assets and liabilities A financial asset (or, where applicable a part of a financial asset or part of a group of similar financial assets) is derecognised when:
• The rights to receive cash flows from the asset have expired; or • The group has transferred its rights to receive cash flows from the asset or has assumed an
obligation to pay the received cash flows in full without material delay to a third party under a ‘pass-through’ arrangement; and either:
the group has transferred substantially all the risks and rewards of the asset, or the group has neither transferred nor retained substantially all the risks and rewards of the
asset, but has transferred control of the asset. A financial liability is derecognised when the obligation under the liability is discharged or cancelled or expires. When an existing financial liability is replaced by another from the same lender on substantially different terms, or the terms of an existing liability are substantially modified, such an exchange or modification is treated as a derecognition of the original liability and the recognition of a new liability, and the difference in the respective carrying amounts is recognised in the statement of comprehensive income. Impairment of financial assets The group assesses at each reporting date whether there is objective evidence that a financial asset or a group of financial assets is impaired. A financial asset or a group of financial assets is impaired and an impairment loss is incurred if, and only if, there is objective evidence of impairment as a result of one or more events that occurred after the initial recognition of the asset (a ‘loss event’) and that loss event (or events) has an impact on the estimated future cash flows of the financial asset or group of financial assets that can be reliably estimated. Impairment is determined as follows: (a) For assets carried at fair value, impairment is the difference between cost and fair value; (b) For assets carried at cost, impairment is the difference between cost and the present value of future
cash flows discounted at the current market rate of return for a similar financial asset. (c) For assets carried at amortised cost, impairment is the difference between carrying amount and the
present value of future cash flows discounted at the original effective interest rate. Offsetting Financial assets and financial liabilities are offset and the net amount reported in the statement of financial position only when there is a legally enforceable right to set off the recognised amounts and the group intends to either settle on a net basis, or to realise the asset and settle the liability simultaneously. Provisions Provisions are recognised when the group has a present obligation as a result of a past event which it is probable will result in an outflow of economic benefits that can be reasonably estimated.
Galfar Engineering and Contracting SAOG and its Subsidiaries
NOTES TO THE CONSOLIDATED FINANCIAL STATEMENTS At 31 December 2010
14
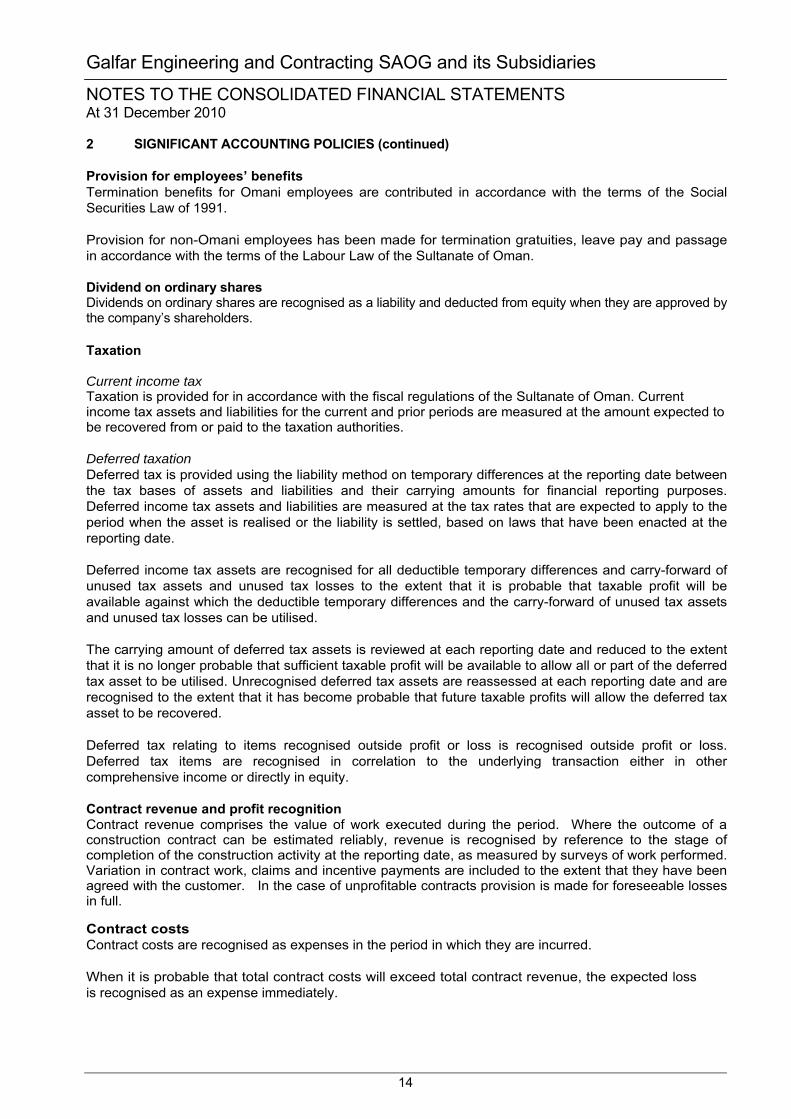
2 SIGNIFICANT ACCOUNTING POLICIES (continued) Provision for employees’ benefits Termination benefits for Omani employees are contributed in accordance with the terms of the Social Securities Law of 1991. Provision for non-Omani employees has been made for termination gratuities, leave pay and passage in accordance with the terms of the Labour Law of the Sultanate of Oman. Dividend on ordinary shares Dividends on ordinary shares are recognised as a liability and deducted from equity when they are approved by the company’s shareholders. Taxation Current income tax Taxation is provided for in accordance with the fiscal regulations of the Sultanate of Oman. Current income tax assets and liabilities for the current and prior periods are measured at the amount expected to be recovered from or paid to the taxation authorities. Deferred taxation Deferred tax is provided using the liability method on temporary differences at the reporting date between the tax bases of assets and liabilities and their carrying amounts for financial reporting purposes. Deferred income tax assets and liabilities are measured at the tax rates that are expected to apply to the period when the asset is realised or the liability is settled, based on laws that have been enacted at the reporting date. Deferred income tax assets are recognised for all deductible temporary differences and carry-forward of unused tax assets and unused tax losses to the extent that it is probable that taxable profit will be available against which the deductible temporary differences and the carry-forward of unused tax assets and unused tax losses can be utilised. The carrying amount of deferred tax assets is reviewed at each reporting date and reduced to the extent that it is no longer probable that sufficient taxable profit will be available to allow all or part of the deferred tax asset to be utilised. Unrecognised deferred tax assets are reassessed at each reporting date and are recognised to the extent that it has become probable that future taxable profits will allow the deferred tax asset to be recovered. Deferred tax relating to items recognised outside profit or loss is recognised outside profit or loss. Deferred tax items are recognised in correlation to the underlying transaction either in other comprehensive income or directly in equity. Contract revenue and profit recognition Contract revenue comprises the value of work executed during the period. Where the outcome of a construction contract can be estimated reliably, revenue is recognised by reference to the stage of completion of the construction activity at the reporting date, as measured by surveys of work performed. Variation in contract work, claims and incentive payments are included to the extent that they have been agreed with the customer. In the case of unprofitable contracts provision is made for foreseeable losses in full. Contract costs Contract costs are recognised as expenses in the period in which they are incurred. When it is probable that total contract costs will exceed total contract revenue, the expected loss is recognised as an expense immediately.
Galfar Engineering and Contracting SAOG and its Subsidiaries
NOTES TO THE CONSOLIDATED FINANCIAL STATEMENTS At 31 December 2010
15
2 SIGNIFICANT ACCOUNTING POLICIES (continued) Interest income Interest revenue is recognised as the interest accrues. Dividend income Dividend income is recognised when the right to receive the dividend is established. Directors’ remuneration The Parent Company follows the Commercial Companies Law 1974 (as amended), and other latest relevant directives issued by CMA, in regard to determination of the amount to be paid as Directors’ remuneration. Directors’ remuneration is charged to the statement of comprehensive income in the year to which they relate. Foreign currency translation Each entity in the group determines its own functional currency and items included in the financial statements of each entity are measured using that functional currency. Transactions in foreign currencies are initially recorded in the functional currency rate ruling at the date of the transaction. Monetary assets and liabilities denominated in foreign currencies are retranslated at the functional currency rate of exchange ruling at the reporting date. All differences are taken to the statement of comprehensive income. Non-monetary items that are measured in terms of historical cost in a foreign currency are translated using the exchange rates as at the dates of the initial transactions. Non-monetary items measured at fair value in a foreign currency are translated using the exchange rates at the date when the fair value was determined. Translation of foreign operations Exchange differences arising on equity accounting of foreign associates are taken directly to the foreign currency translation reserve. Foreign currency translation reserve is recognised in equity under cumulative changes in fair value. On disposal of the foreign associate, such exchange differences are recognised in the statement of comprehensive income as part of the profit or loss on sale. A write down of the carrying amount of a foreign operation does not constitute a disposal. Segment reporting A segment is a distinguishable component of the group that is engaged in providing products or services (business segment) or in providing products or services within a particular economic environment (geographical segment), which is subject to risks and rewards that are different from those of other segments. The segment information is set out in note 34.
Galfar Engineering and Contracting SAOG and its Subsidiaries
NOTES TO THE CONSOLIDATED FINANCIAL STATEMENTS At 31 December 2010
16
2 SIGNIFICANT ACCOUNTING POLICIES (continued) Significant accounting judgments, estimates and assumptions The preparation of the consolidated financial statements requires management to make judgements, estimates and assumptions that affect the reported amount of financial assets and liabilities at the date of the financial statements and the resultant provisions and changes in fair value for the year. Such estimates are necessarily based on assumptions about several factors involving varying, and possibly significant, degrees of judgment and uncertainty and actual results may differ from management’s estimates resulting in future changes in estimated assets and liabilities. The assumptions concerning the key sources of estimation uncertainty at the reporting date are set out in note 37. 3 STANDARDS ISSUED BUT NOT YET EFFECTIVE The following IASB standards, amendments and interpretations are not yet effective: IAS 24 Related Party Disclosures (Amendment) The amended standard is effective for annual periods beginning on or after 1 January 2011. It clarified the definition of a related party to simplify the identification of such relationships and to eliminate inconsistencies in its application. The revised standard introduces a partial exemption of disclosure requirements for government related entities. The group does not expect any impact on its financial position or performance. Early adoption is permitted for either the partial exemption for government-related entities or for the entire standard. IAS 32 Financial Instruments: Presentation – Classification of Rights Issues (Amendment) The amendment to IAS 32 is effective for annual periods beginning on or after 1 February 2010 and amended the definition of a financial liability in order to classify rights issues (and certain options or warrants) as equity instruments in cases where such rights are given pro rata to all of the existing owners of the same class of an entity’s non-derivative equity instruments, or to acquire a fixed number of the entity’s own equity instruments for a fixed amount in any currency. This amendment will have no impact on the group after initial application. IFRS 9 Financial Instruments: Classification and Measurement IFRS 9 as issued reflects the first phase of the IASBs work on the replacement of IAS 39 and applies to classification and measurement of financial assets as defined in IAS 39. The standard is effective for annual periods beginning on or after 1 January 2013. In subsequent phases, the IASB will address classification and measurement of financial liabilities, hedge accounting and derecognition. The completion of this project is expected in early 2011. The adoption of the first phase of IFRS 9 will have an effect on the classification and measurement of the Group’s financial assets. IFRIC 14 Prepayments of a minimum funding requirement (Amendment) The amendment to IFRIC 14 is effective for annual periods beginning on or after 1 January 2011 with retrospective application. The amendment provides guidance on assessing the recoverable amount of a net pension asset. The amendment permits an entity to treat the prepayment of a minimum funding requirement as an asset. The amendment is expected to have no impact on the financial statements of the Group. IFRIC 19 Extinguishing Financial Liabilities with Equity Instruments IFRIC 19 is effective for annual periods beginning on or after 1 July 2010. The interpretation clarifies that equity instruments issued to a creditor to extinguish a financial liability qualify as consideration paid. The equity instruments issued are measured at their fair value. In case that this cannot be reliably measured, the instruments are measured at the fair value of the liability extinguished. Any gain or loss is recognised immediately in profit or loss. The adoption of this interpretation will have no effect on the financial statements of the Group.

Galfar Engineering and Contracting SAOG and its Subsidiaries
NOTES TO THE CONSOLIDATED FINANCIAL STATEMENTS At 31 December 2010
17
3 STANDARDS ISSUED BUT NOT YET EFFECTIVE (continued) Improvements to IFRSs (issued in May 2010) The IASB issued Improvements to IFRSs, an omnibus of amendments to its IFRS standards. The amendments have not been adopted as they become effective for annual periods on or after either 1 July 2010 or 1 January 2011. The amendments listed below, are considered to be relevant for the group: • IFRS 3 Business Combinations • IFRS 7 Financial Instruments: Disclosures • IAS 1 Presentation of Financial Statements • IAS 27 Consolidated and Separate Financial Statements • IFRIC 13 Customer Loyalty Programmes
The group, however, expects no impact from the adoption of the amendments on its financial position or performance.
Galfar Engineering and Contracting SAOG and its Subsidiaries
NOTES TO THE CONSOLIDATED FINANCIAL STATEMENTS At 31 December 2010
18
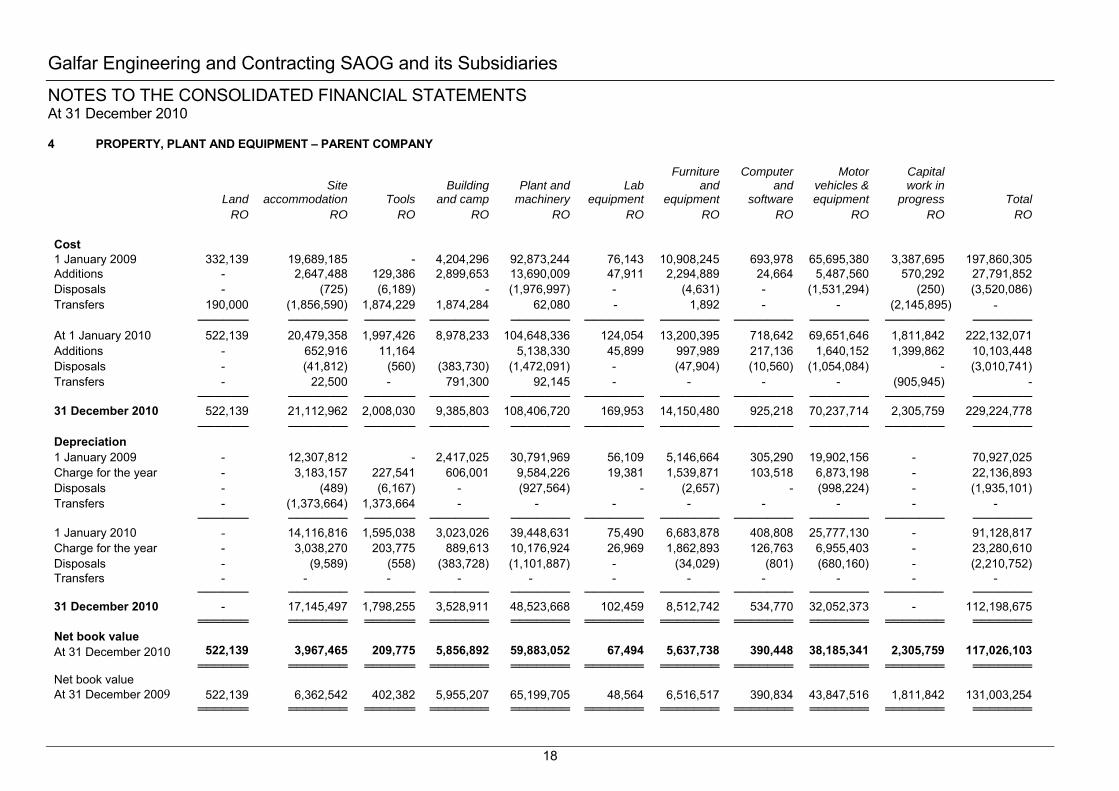
4 PROPERTY, PLANT AND EQUIPMENT – PARENT COMPANY
Land Site
accommodation Tools Building
and camp Plant and
machinery Lab
equipment
Furniture and
equipment
Computer and
software
Motor vehicles & equipment
Capital work in
progress Total RO RO RO RO RO RO RO RO RO RO RO
Cost 1 January 2009 332,139 19,689,185 - 4,204,296 92,873,244 76,143 10,908,245 693,978 65,695,380 3,387,695 197,860,305 Additions - 2,647,488 129,386 2,899,653 13,690,009 47,911 2,294,889 24,664 5,487,560 570,292 27,791,852 Disposals - (725) (6,189) - (1,976,997) - (4,631) - (1,531,294) (250) (3,520,086) Transfers 190,000 (1,856,590) 1,874,229 1,874,284 62,080 - 1,892 - - (2,145,895) -
────── ─────── ────── ─────── ─────── ─────── ─────── ─────── ─────── ─────── ─────── At 1 January 2010 522,139 20,479,358 1,997,426 8,978,233 104,648,336 124,054 13,200,395 718,642 69,651,646 1,811,842 222,132,071 Additions - 652,916 11,164 5,138,330 45,899 997,989 217,136 1,640,152 1,399,862 10,103,448 Disposals - (41,812) (560) (383,730) (1,472,091) - (47,904) (10,560) (1,054,084) - (3,010,741) Transfers - 22,500 - 791,300 92,145 - - - - (905,945) -
────── ─────── ────── ─────── ─────── ─────── ─────── ─────── ─────── ─────── ─────── 31 December 2010 522,139 21,112,962 2,008,030 9,385,803 108,406,720 169,953 14,150,480 925,218 70,237,714 2,305,759 229,224,778
────── ─────── ────── ─────── ─────── ─────── ─────── ─────── ─────── ─────── ─────── Depreciation 1 January 2009 - 12,307,812 - 2,417,025 30,791,969 56,109 5,146,664 305,290 19,902,156 - 70,927,025 Charge for the year - 3,183,157 227,541 606,001 9,584,226 19,381 1,539,871 103,518 6,873,198 - 22,136,893 Disposals - (489) (6,167) - (927,564) - (2,657) - (998,224) - (1,935,101) Transfers - (1,373,664) 1,373,664 - - - - - - - -
────── ─────── ────── ─────── ─────── ─────── ─────── ─────── ─────── ─────── ─────── 1 January 2010 - 14,116,816 1,595,038 3,023,026 39,448,631 75,490 6,683,878 408,808 25,777,130 - 91,128,817 Charge for the year - 3,038,270 203,775 889,613 10,176,924 26,969 1,862,893 126,763 6,955,403 - 23,280,610 Disposals - (9,589) (558) (383,728) (1,101,887) - (34,029) (801) (680,160) - (2,210,752) Transfers - - - - - - - - - - -
────── ─────── ────── ─────── ─────── ─────── ─────── ─────── ─────── ─────── ─────── 31 December 2010 - 17,145,497 1,798,255 3,528,911 48,523,668 102,459 8,512,742 534,770 32,052,373 - 112,198,675
══════ ═══════ ══════ ═══════ ═══════ ═══════ ═══════ ═══════ ═══════ ═══════ ═══════ Net book value At 31 December 2010 522,139 3,967,465 209,775 5,856,892 59,883,052 67,494 5,637,738 390,448 38,185,341 2,305,759 117,026,103
══════ ═══════ ══════ ═══════ ═══════ ═══════ ═══════ ═══════ ═══════ ═══════ ═══════ Net book value At 31 December 2009 522,139 6,362,542 402,382 5,955,207 65,199,705 48,564 6,516,517 390,834 43,847,516 1,811,842 131,003,254
══════ ═══════ ══════ ═══════ ═══════ ═══════ ═══════ ═══════ ═══════ ═══════ ═══════

Galfar Engineering and Contracting SAOG and its Subsidiaries
NOTES TO THE CONSOLIDATED FINANCIAL STATEMENTS At 31 December 2010
19
4 PROPERTY, PLANT AND EQUIPMENT – CONSOLIDATED
Land
Site accommoda
tion Tools Building
and camp Plant and
machinery
Lab equipme
nt
Furniture and
equipment
Computer and
software
Motor vehicles & equipment
Capital work in
progress Total RO RO RO RO RO RO RO RO RO RO RO
Cost 1 January 2009 332,139 19,689,185 - 4,204,296 96,586,923 79,153 10,993,791 693,978 69,977,645 3,387,695 205,944,805 Additions - 2,647,488 129,386 2,899,653 14,473,396 47,911 2,297,413 24,664 5,685,060 573,292 28,778,263 Disposals - (725) (6,189) - (1,976,997) (3,010) (4,631) - (1,746,294) (250) (3,738,096) Transfers 190,000 (1,856,590) 1,874,229 1,874,284 62,080 - 1,892 - - (2,145,895) -
────── ─────── ────── ─────── ─────── ───── ─────── ─────── ─────── ─────── ─────── At 1 January 2010 522,139 20,479,358 1,997,426 8,978,233 109,145,402 124,054 13,288,465 718,642 73,916,411 1,811,842 230,984,972 Additions - 670,961 11,164 148,495 6,427,546 45,899 1,108,023 228,867 2,552,927 1,399,862 12,593,744 Disposals - (41,812) (560) (383,730) (1,575,449) - (47,904) (10,560) (1,674,563) - (3,734,578) Transfers - 22,500 - 791,300 92,145 - - - - (905,945) -
────── ─────── ────── ─────── ─────── ───── ─────── ─────── ─────── ─────── ─────── 31 December 2010 522,139 21,131,007 2,008,030 9,534,298 114,089,644 169,953 14,348,584 936,949 74,794,775 2,305,759 239,841,138
────── ─────── ────── ─────── ─────── ───── ─────── ─────── ─────── ─────── ─────── Depreciation 1 January 2009 - 12,307,812 - 2,417,026 32,661,336 56,264 5,226,144 305,290 22,909,537 - 75,883,409 Charge for the year - 3,183,156 227,546 606,000 10,176,553 19,380 1,545,847 103,518 6,975,017 - 22,837,017 Disposals - (489) (6,167) - (927,564) - (2,657) - (1,200,350) - (2,137,227) Transfers - (1,373,664) 1,373,664 - - (156) 156 - - - -
────── ─────── ────── ─────── ─────── ───── ─────── ─────── ─────── ─────── ─────── 1 January 2010 14,116,815 1,595,043 3,023,026 41,910,325 75,488 6,769,490 408,808 28,684,204 - 96,583,199 Charge for the year - 3,039,812 203,769 892,108 10,769,163 26,969 1,878,913 127,793 7,253,899 - 24,192,426 Disposals - (9,589) (558) (383,728) (1,205,239) - (34,029) (801) (1,297,080) - (2,931,024) Transfers - - - - - - - - - - -
────── ─────── ────── ─────── ─────── ───── ─────── ─────── ─────── ─────── ─────── 31 December 2010 - 17,147,038 1,798,254 3,531,406 51,474,249 102,457 8,614,374 535,800 34,641,023 - 117,844,601
══════ ═══════ ══════ ═══════ ═══════ ═════ ═══════ ═══════ ═══════ ═══════ ═══════ Net book value At 31 December 2010 522,139 3,983,969 209,776 6,002,892 62,615,395 67,496 5,734,210 401,149 40,153,752 2,305,759 121,999,537
══════ ═══════ ══════ ═══════ ═══════ ═════ ═══════ ═══════ ═══════ ═══════ ═══════ Net book value At 31 December 2009 522,139 6,362,542 402,382 5,955,207 67,235,077 48,566 6,521,985 390,834 45,232,207 1,811,842 134,401,799
══════ ═══════ ══════ ═══════ ═══════ ══════ ═══════ ═══════ ═══════ ═══════ ═══════
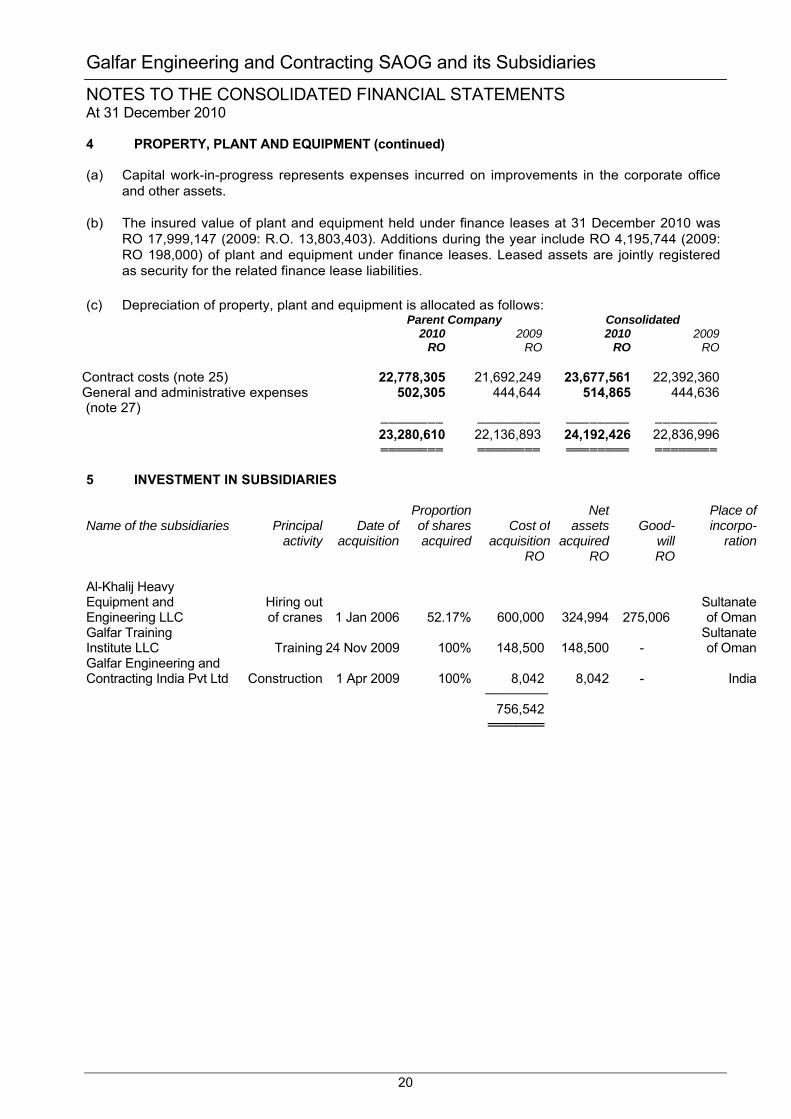
Galfar Engineering and Contracting SAOG and its Subsidiaries
NOTES TO THE CONSOLIDATED FINANCIAL STATEMENTS At 31 December 2010
20
4 PROPERTY, PLANT AND EQUIPMENT (continued) (a) Capital work-in-progress represents expenses incurred on improvements in the corporate office
and other assets. (b) The insured value of plant and equipment held under finance leases at 31 December 2010 was
RO 17,999,147 (2009: R.O. 13,803,403). Additions during the year include RO 4,195,744 (2009: RO 198,000) of plant and equipment under finance leases. Leased assets are jointly registered as security for the related finance lease liabilities.
(c) Depreciation of property, plant and equipment is allocated as follows:
Parent Company Consolidated 2010 2009 2010 2009 RO RO RO RO Contract costs (note 25) 22,778,305 21,692,249 23,677,561 22,392,360 General and administrative expenses 502,305 444,644 514,865 444,636 (note 27) ──────── ──────── ──────── ──────── 23,280,610 22,136,893 24,192,426 22,836,996 ════════ ════════ ════════ ════════ 5 INVESTMENT IN SUBSIDIARIES Proportion Net Place ofName of the subsidiaries Principal Date of of shares Cost of assets Good- incorpo- activity acquisition acquired acquisition acquired will ration RO RO RO Al-Khalij Heavy Equipment and Hiring out SultanateEngineering LLC of cranes 1 Jan 2006 52.17% 600,000 324,994 275,006 of OmanGalfar Training SultanateInstitute LLC Training 24 Nov 2009 100% 148,500 148,500 - of OmanGalfar Engineering and Contracting India Pvt Ltd Construction 1 Apr 2009 100% 8,042 8,042 - India ──────── 756,542 ══════
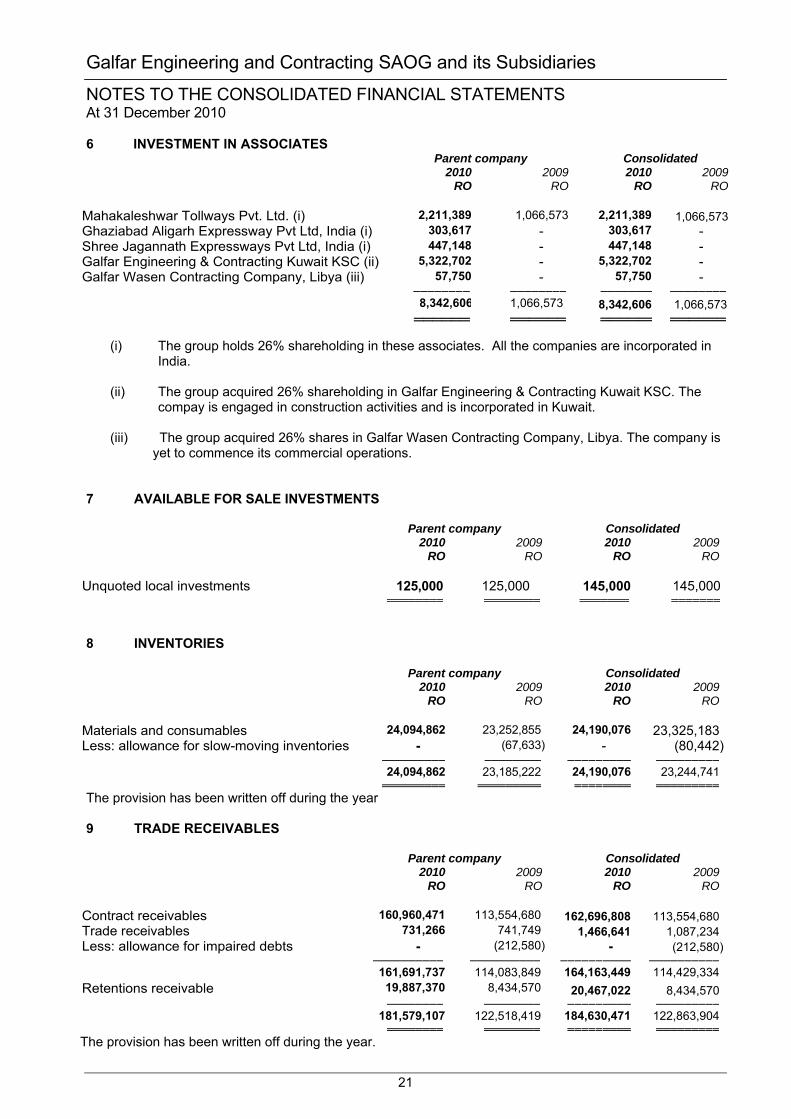
Galfar Engineering and Contracting SAOG and its Subsidiaries
NOTES TO THE CONSOLIDATED FINANCIAL STATEMENTS At 31 December 2010
21
6 INVESTMENT IN ASSOCIATES Parent company Consolidated 2010 2009 2010 2009 RO RO RO RO Mahakaleshwar Tollways Pvt. Ltd. (i) 2,211,389 1,066,573 2,211,389 1,066,573 Ghaziabad Aligarh Expressway Pvt Ltd, India (i) 303,617 - 303,617 - Shree Jagannath Expressways Pvt Ltd, India (i) 447,148 - 447,148 - Galfar Engineering & Contracting Kuwait KSC (ii) 5,322,702 - 5,322,702 - Galfar Wasen Contracting Company, Libya (iii) 57,750 - 57,750 - ──────── ──────── ──────── ──────── 8,342,606 1,066,573 8,342,606 1,066,573 ══════ ══════ ══════ ══════
(i) The group holds 26% shareholding in these associates. All the companies are incorporated in India.
(ii) The group acquired 26% shareholding in Galfar Engineering & Contracting Kuwait KSC. The compay is engaged in construction activities and is incorporated in Kuwait.
(iii) The group acquired 26% shares in Galfar Wasen Contracting Company, Libya. The company is
yet to commence its commercial operations. 7 AVAILABLE FOR SALE INVESTMENTS
Parent company Consolidated 2010 2009 2010 2009 RO RO RO RO Unquoted local investments 125,000 125,000 145,000 145,000 ════════ ════════ ═══════ ═══════ 8 INVENTORIES
Parent company Consolidated 2010 2009 2010 2009 RO RO RO RO Materials and consumables 24,094,862 23,252,855 24,190,076 23,325,183 Less: allowance for slow-moving inventories - (67,633) - (80,442) ───────── ──────── ───────── ───────── 24,094,862 23,185,222 24,190,076 23,244,741 ═════════ ═════════ ════════ ═════════The provision has been written off during the year 9 TRADE RECEIVABLES
Parent company Consolidated 2010 2009 2010 2009 RO RO RO RO Contract receivables 160,960,471 113,554,680 162,696,808 113,554,680 Trade receivables 731,266 741,749 1,466,641 1,087,234 Less: allowance for impaired debts - (212,580) - (212,580) ────────── ────────── ────────── ────────── 161,691,737 114,083,849 164,163,449 114,429,334 Retentions receivable 19,887,370 8,434,570 20,467,022 8,434,570 ──────── ──────── ───────── ───────── 181,579,107 122,518,419 184,630,471 122,863,904 ════════ ════════ ═════════ ═════════The provision has been written off during the year.

Galfar Engineering and Contracting SAOG and its Subsidiaries
NOTES TO THE CONSOLIDATED FINANCIAL STATEMENTS At 31 December 2010
22
10 CONTRACTS IN PROGRESS AT THE REPORTING DATE
a) Recognized and included in the financial statements as amount due: Parent company Consolidated 2010 2009 2010 2009 RO RO RO RO
Work in progress on long term contracts at cost plus attributable profit
45,382,126
45,449,611 45,576,484 45,449,611 ════════ ════════ ════════ ════════To customers under construction contracts recorded as billings in excess of work done
(note 23) (27,474,293) (15,903,223) (28,945,968) (15,903,223) ════════ ════════ ════════ ════════
11 PREPAYMENTS, ADVANCES AND OTHER RECEIVABLES Parent company Consolidated 2010 2009 2010 2009 RO RO RO RO Deposits 537,029 460,395 625,134 460,395 Prepaid expenses 3,920,076 3,576,863 3,956,414 3,591,930 Insurance claims 3,365,928 1,924,333 3,365,928 1,924,333 Advance on sub contracts 1,967,944 1,051,949 1,967,944 1,051,949 Due from employees 480,470 327,572 503,764 327,999 Due from related parties (note 32) 3,334,295 897,512 2,365,273 1,179,706 Advance tax paid 128,280 128,280 432,374 150,410 Other receivables 2,120,520 4,057,716 2,122,060 4,061,103 ──────── ──────── ──────── ──────── 15,854,542 12,424,620 15,338,891 12,747,825 ════════ ════════ ════════ ════════ 12 DEPOSITS WITH BANKS Parent company Consolidated 2010 2009 2010 2009 RO RO RO
Term deposits 1,573,728 1,506,985 1,585,008 1,506,985 Margin deposits 671,218 1,249,382 807,916 1,252,022 ──────── ──────── ──────── ─────── 2,244,946 2,756,367 2,392,924 2,759,007 ════════ ════════ ════════ ═══════ The term deposits carry interest rates of 1.00% to 2.75% per annum (2009 - 1.75 % to 4% per annum) and are kept for a period of more than three months from the date of placement.

Galfar Engineering and Contracting SAOG and its Subsidiaries
NOTES TO THE CONSOLIDATED FINANCIAL STATEMENTS At 31 December 2010
23
13 CASH AND BANK BALANCES Parent company Consolidated 2010 2009 2010 2009 RO RO RO RO Cash on hand 147,056 341,402 158,946 342,296 Bank balances:
Current accounts 1,242,135 1,303,071 1,549,884 1,455,165 ──────── ──────── ──────── ─────── 1,389,191 1,644,473 1,708,830 1,797,461 ════════ ════════ ════════ ═══════ 14 SHARE CAPITAL Consolidated 2010 2009 RO RO Authorised: 500,000,000 (2009 - 500,000,000) ordinary shares
of par value RO 0.100 (2009 - RO 0.100) each 50,000,000 50,000,000 ───────── ────────Issued and fully paid: At 1 January 30,000,000 25,000,000 Increased during the year – bonus shares
3,000,000
5,000,000 ───────── ────────At 31 December 33,000,000 30,000,000 ═════════ ═════════ At the reporting date the issued and fully paid share capital comprises of 330,000,000 (2009- 300,000,000) shares having a par value of RO 0.100 (2009 - RO 0.100) each. Pursuant to the terms of its IPO, as detailed below, the share capital of the parent company has been divided into two classes comprising of 231,000,000 ordinary shares and 99,000,000 preferential voting rights shares (2009:210,000,000 ordinary shares and 90,000,000 preferential voiting rights shares). The preferential voting rights shares will be held by the promoting shareholders and shall carry two votes at all general meetings while otherwise ranking pari-passu with ordinary shares in all rights including the dividend receipt.
In 2007 pursuant to the parent company’s IPO, the promoting shareholders of the Company offered a portion of their shares to the public for subscription and proposed to increase the Company’s share capital through a fresh issue of share capital. As part of the IPO process, the par value of the shares was split from RO 1 per share to RO 0.100 per share thereby increasing the number of shares from then existing 21,000,000 to 210,000,000. 15 Share premium Under the terms of the IPO, 100 million shares were offered for subscription to the general public at RO 0.600 per share representing RO 0.100 nominal value and RO 0.500 share premium. This resulted in a cash inflow of RO 60 million. Of the amount collected, RO 36 million (comprising premium of RO 30 million and nominal value of RO 6 million for 60 million shares of RO 0.100 per share) was repaid to the promoting shareholders as consideration for their shares offered for sale, while the remaining RO 24,000,000 accrued to the Company resulting in a share premium of RO 20,000,000 and an increase in share capital of RO 4,000,000 for 40 million shares of RO 0.100 per share. Share premium is stated net of share issue expenses of RO 830,491. During the year, RO 1,000,000 (2009 – RO 1,666,667) was transferred to statutory reserve account.
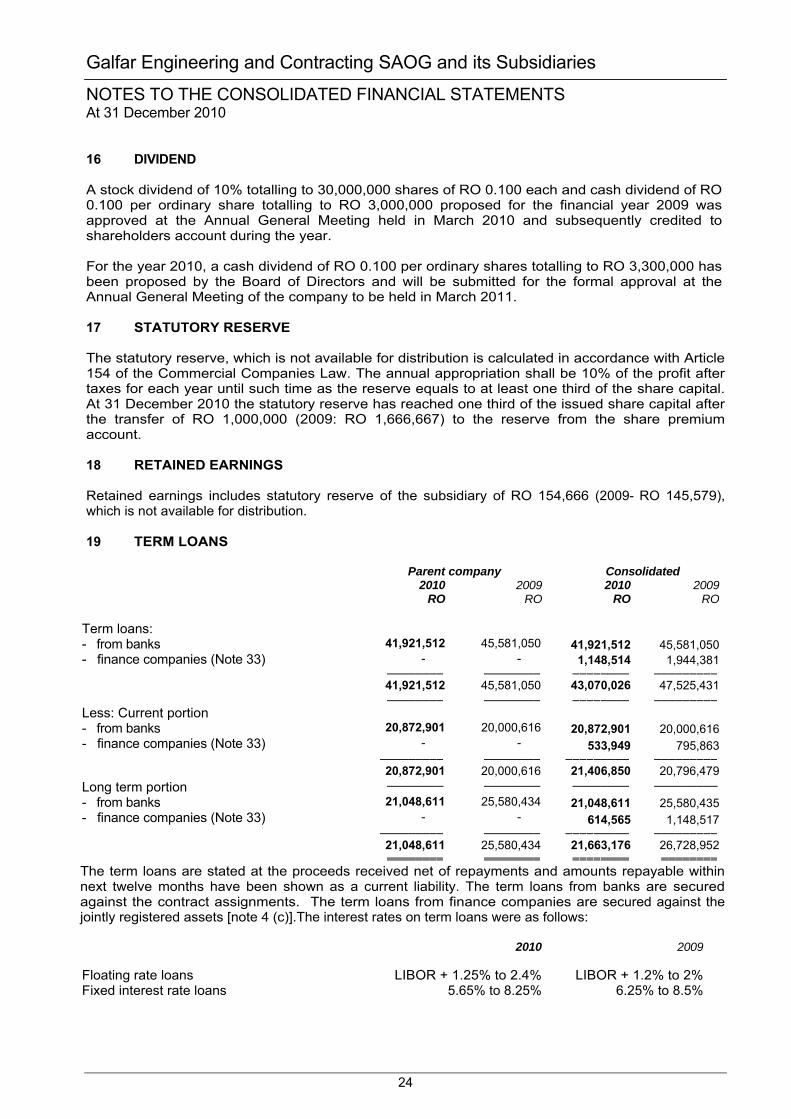
Galfar Engineering and Contracting SAOG and its Subsidiaries
NOTES TO THE CONSOLIDATED FINANCIAL STATEMENTS At 31 December 2010
24
16 DIVIDEND A stock dividend of 10% totalling to 30,000,000 shares of RO 0.100 each and cash dividend of RO 0.100 per ordinary share totalling to RO 3,000,000 proposed for the financial year 2009 was approved at the Annual General Meeting held in March 2010 and subsequently credited to shareholders account during the year. For the year 2010, a cash dividend of RO 0.100 per ordinary shares totalling to RO 3,300,000 has been proposed by the Board of Directors and will be submitted for the formal approval at the Annual General Meeting of the company to be held in March 2011. 17 STATUTORY RESERVE The statutory reserve, which is not available for distribution is calculated in accordance with Article 154 of the Commercial Companies Law. The annual appropriation shall be 10% of the profit after taxes for each year until such time as the reserve equals to at least one third of the share capital. At 31 December 2010 the statutory reserve has reached one third of the issued share capital after the transfer of RO 1,000,000 (2009: RO 1,666,667) to the reserve from the share premium account. 18 RETAINED EARNINGS Retained earnings includes statutory reserve of the subsidiary of RO 154,666 (2009- RO 145,579), which is not available for distribution. 19 TERM LOANS
Parent company Consolidated 2010 2009 2010 2009 RO RO RO RO Term loans: - from banks 41,921,512 45,581,050 41,921,512 45,581,050 - finance companies (Note 33) - - 1,148,514 1,944,381 ──────── ──────── ──────── ───────── 41,921,512 45,581,050 43,070,026 47,525,431 ──────── ──────── ──────── ─────────Less: Current portion - from banks 20,872,901 20,000,616 20,872,901 20,000,616 - finance companies (Note 33) - - 533,949 795,863 ───────── ──────── ───────── ───────── 20,872,901 20,000,616 21,406,850 20,796,479 Long term portion ──────── ──────── ──────── ─────────
- from banks 21,048,611 25,580,434 21,048,611 25,580,435 - finance companies (Note 33) - - 614,565 1,148,517 ───────── ──────── ───────── ───────── 21,048,611 25,580,434 21,663,176 26,728,952 ════════ ════════ ════════ ════════The term loans are stated at the proceeds received net of repayments and amounts repayable within next twelve months have been shown as a current liability. The term loans from banks are secured against the contract assignments. The term loans from finance companies are secured against the jointly registered assets [note 4 (c)].The interest rates on term loans were as follows: 2010 2009 Floating rate loans LIBOR + 1.25% to 2.4% LIBOR + 1.2% to 2% Fixed interest rate loans 5.65% to 8.25% 6.25% to 8.5%
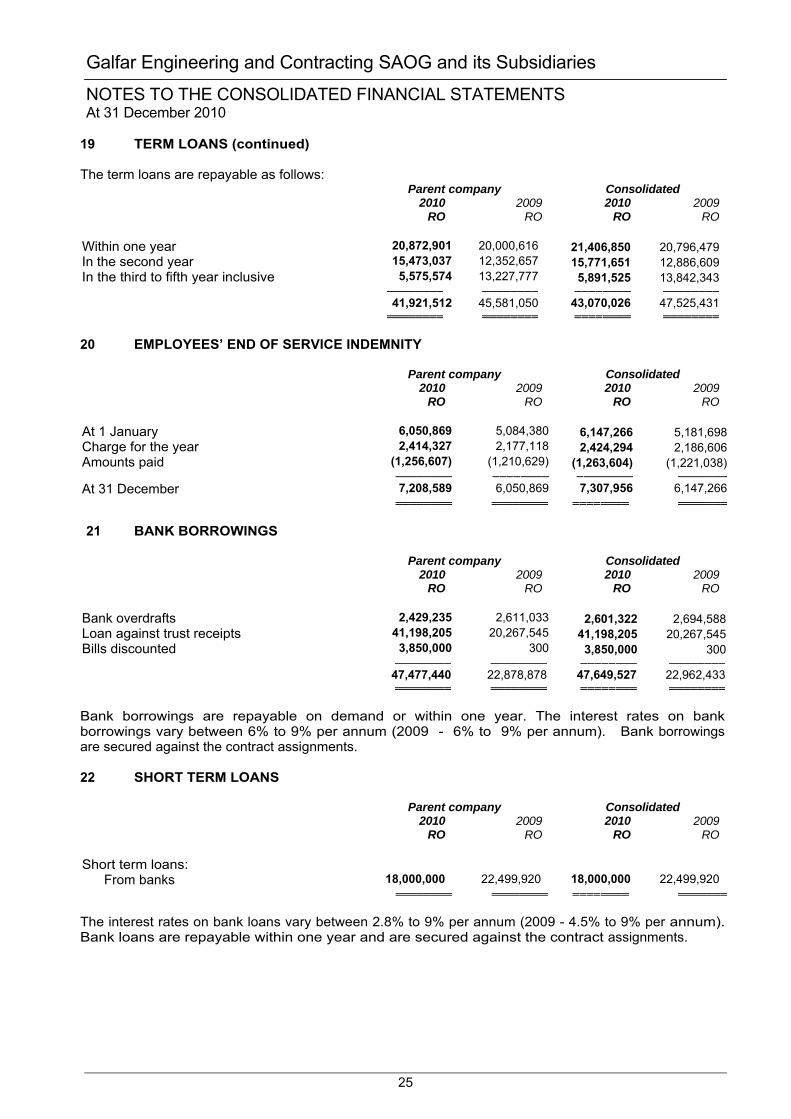
Galfar Engineering and Contracting SAOG and its Subsidiaries
NOTES TO THE CONSOLIDATED FINANCIAL STATEMENTS At 31 December 2010
25
19 TERM LOANS (continued) The term loans are repayable as follows: Parent company Consolidated 2010 2009 2010 2009 RO RO RO RO Within one year 20,872,901 20,000,616 21,406,850 20,796,479 In the second year 15,473,037 12,352,657 15,771,651 12,886,609 In the third to fifth year inclusive 5,575,574 13,227,777 5,891,525 13,842,343 ──────── ──────── ──────── ──────── 41,921,512 45,581,050 43,070,026 47,525,431 ════════ ════════ ════════ ════════ 20 EMPLOYEES’ END OF SERVICE INDEMNITY Parent company Consolidated 2010 2009 2010 2009 RO RO RO RO At 1 January 6,050,869 5,084,380 6,147,266 5,181,698 Charge for the year 2,414,327 2,177,118 2,424,294 2,186,606 Amounts paid (1,256,607) (1,210,629) (1,263,604) (1,221,038) ──────── ──────── ──────── ───────At 31 December 7,208,589 6,050,869 7,307,956 6,147,266 ════════ ════════ ════════ ═══════ 21 BANK BORROWINGS
Parent company Consolidated 2010 2009 2010 2009 RO RO RO RO Bank overdrafts 2,429,235 2,611,033 2,601,322 2,694,588 Loan against trust receipts 41,198,205 20,267,545 41,198,205 20,267,545 Bills discounted 3,850,000 300 3,850,000 300 ──────── ──────── ──────── ──────── 47,477,440 22,878,878 47,649,527 22,962,433 ════════ ════════ ════════ ════════ Bank borrowings are repayable on demand or within one year. The interest rates on bank borrowings vary between 6% to 9% per annum (2009 - 6% to 9% per annum). Bank borrowings are secured against the contract assignments. 22 SHORT TERM LOANS Parent company Consolidated 2010 2009 2010 2009 RO RO RO RO Short term loans:
From banks 18,000,000 22,499,920 18,000,000 22,499,920 ════════ ════════ ════════ ═══════ The interest rates on bank loans vary between 2.8% to 9% per annum (2009 - 4.5% to 9% per annum). Bank loans are repayable within one year and are secured against the contract assignments.
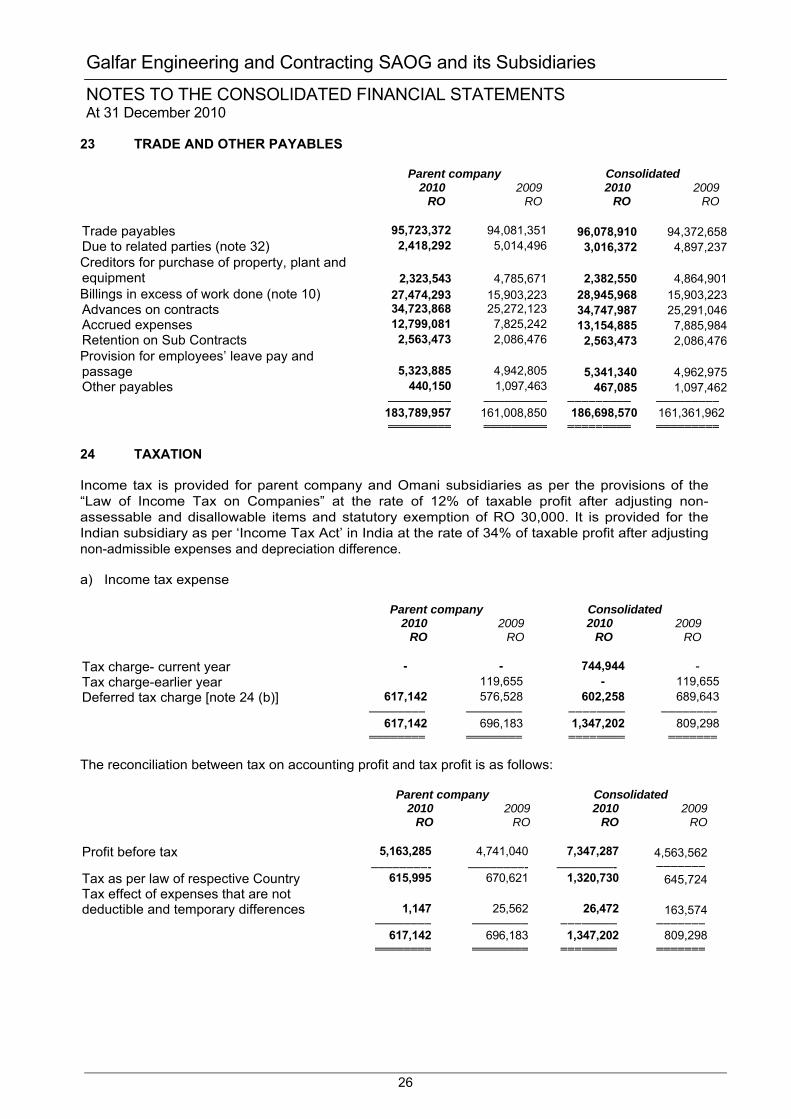
Galfar Engineering and Contracting SAOG and its Subsidiaries
NOTES TO THE CONSOLIDATED FINANCIAL STATEMENTS At 31 December 2010
26
23 TRADE AND OTHER PAYABLES
Parent company Consolidated 2010 2009 2010 2009 RO RO RO RO Trade payables 95,723,372 94,081,351 96,078,910 94,372,658Due to related parties (note 32) 2,418,292 5,014,496 3,016,372 4,897,237 Creditors for purchase of property, plant and equipment 2,323,543 4,785,671 2,382,550 4,864,901 Billings in excess of work done (note 10) 27,474,293 15,903,223 28,945,968 15,903,223 Advances on contracts 34,723,868 25,272,123 34,747,987 25,291,046 Accrued expenses 12,799,081 7,825,242 13,154,885 7,885,984Retention on Sub Contracts 2,563,473 2,086,476 2,563,473 2,086,476Provision for employees’ leave pay and passage 5,323,885 4,942,805 5,341,340 4,962,975 Other payables 440,150 1,097,463 467,085 1,097,462 ───────── ───────── ───────── ───────── 183,789,957 161,008,850 186,698,570 161,361,962 ═════════ ═════════ ═════════ ═════════ 24 TAXATION Income tax is provided for parent company and Omani subsidiaries as per the provisions of the “Law of Income Tax on Companies” at the rate of 12% of taxable profit after adjusting non-assessable and disallowable items and statutory exemption of RO 30,000. It is provided for the Indian subsidiary as per ‘Income Tax Act’ in India at the rate of 34% of taxable profit after adjusting non-admissible expenses and depreciation difference. a) Income tax expense Parent company Consolidated 2010 2009 2010 2009 RO RO RO RO Tax charge- current year - - 744,944 - Tax charge-earlier year 119,655 - 119,655 Deferred tax charge [note 24 (b)] 617,142 576,528 602,258 689,643 ──────── ──────── ──────── ──────── 617,142 696,183 1,347,202 809,298 ════════ ════════ ════════ ═══════ The reconciliation between tax on accounting profit and tax profit is as follows: Parent company Consolidated 2010 2009 2010 2009 RO RO RO RO Profit before tax 5,163,285 4,741,040 7,347,287 4,563,562 ────────- ────────- ────────- ───────Tax as per law of respective Country 615,995 670,621 1,320,730 645,724 Tax effect of expenses that are not deductible and temporary differences 1,147 25,562 26,472 163,574 ──────── ──────── ──────── ─────── 617,142 696,183 1,347,202 809,298 ════════ ════════ ════════ ═══════
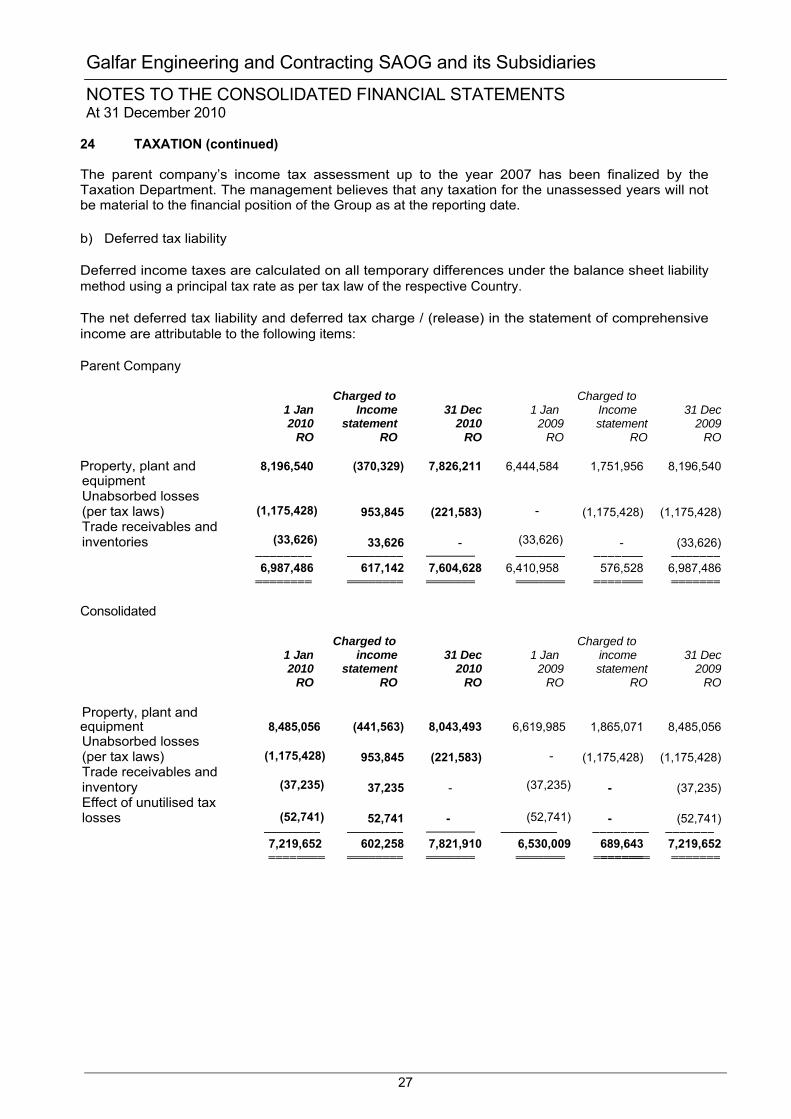
Galfar Engineering and Contracting SAOG and its Subsidiaries
NOTES TO THE CONSOLIDATED FINANCIAL STATEMENTS At 31 December 2010
27
24 TAXATION (continued) The parent company’s income tax assessment up to the year 2007 has been finalized by the Taxation Department. The management believes that any taxation for the unassessed years will not be material to the financial position of the Group as at the reporting date. b) Deferred tax liability
Deferred income taxes are calculated on all temporary differences under the balance sheet liability method using a principal tax rate as per tax law of the respective Country. The net deferred tax liability and deferred tax charge / (release) in the statement of comprehensive income are attributable to the following items: Parent Company Charged to Charged to 1 Jan
2010 Income
statement 31 Dec
20101 Jan
2009 Income statement
31 Dec2009
RO RO RO RO RO RO Property, plant and 8,196,540 (370,329) 7,826,211 6,444,584 1,751,956 8,196,540 equipment Unabsorbed losses (per tax laws) (1,175,428) 953,845 (221,583) - (1,175,428) (1,175,428)Trade receivables and inventories
(33,626) 33,626 -
(33,626) - (33,626)
──────── ──────── ─────── ─────── ─────── ─────── 6,987,486 617,142 7,604,628 6,410,958 576,528 6,987,486 ════════ ════════ ═══════ ═══════ ═══════ ═══════ Consolidated Charged to Charged to 1 Jan
2010 income
statement 31 Dec
20101 Jan
2009 income statement
31 Dec2009
RO RO RO RO RO RO Property, plant and
equipment 8,485,056 (441,563) 8,043,493 6,619,985 1,865,071 8,485,056Unabsorbed losses (per tax laws) (1,175,428) 953,845 (221,583) - (1,175,428) (1,175,428)Trade receivables and inventory
(37,235) 37,235 - (37,235) - (37,235)
Effect of unutilised tax losses (52,741) 52,741 - (52,741) - (52,741) ──────── ──────── ─────── ──────── ──────── ─────── 7,219,652 602,258 7,821,910 6,530,009 689,643 7,219,652 ════════ ═══════
════════ ═══════ ═══════ ═══════ ═══════

Galfar Engineering and Contracting SAOG and its Subsidiaries
NOTES TO THE CONSOLIDATED FINANCIAL STATEMENTS At 31 December 2010
28
25 CONTRACT COSTS Parent company Consolidated 2010 2009 2010 2009 RO RO RO RO Materials 123,601,445 175,011,095 127,218,398 175,304,685Manpower costs 86,947,363 82,498,252 88,320,506 83,076,284Sub-contracting 68,968,326 76,953,140 70,613,596 76,953,140Depreciation of property, plant and equipment [note 4 (c)] 22,778,305 21,692,249 23,677,561 22,392,360Hire of equipment and vehicles 7,478,066 6,469,148 7,980,425 6,085,454Fuel 15,824,341 14,674,053 16,674,444 14,674,053General and admintration expenses (note 27) 12,821,214 13,953,201 13,615,985 14,085,244 Repair and maintenance -plant & equipment 1,571,538 1,994,811 1,747,309 2,087,688Training expenses - 189,163 187,026 189,163 ────────── ────────── ────────── ────────── 339,990,598 393,435,112 350,035,250 394,848,071 ══════════ ══════════ ══════════ ═════════ 26 SALES AND SERVICES INCOME Parent company Consolidated 2010 2009 2010 2009 RO RO RO RO Sales 1,332,850 1,824,706 1,332,850 1,824,706Hiring services - - 1,805,560 1,498,428Training services - 359,260 970,543 359,260 ────────── ────────── ────────── ────────── 1,332,850 2,183,966 4,108,953 3,682,394 ══════════ ══════════ ══════════ ═════════
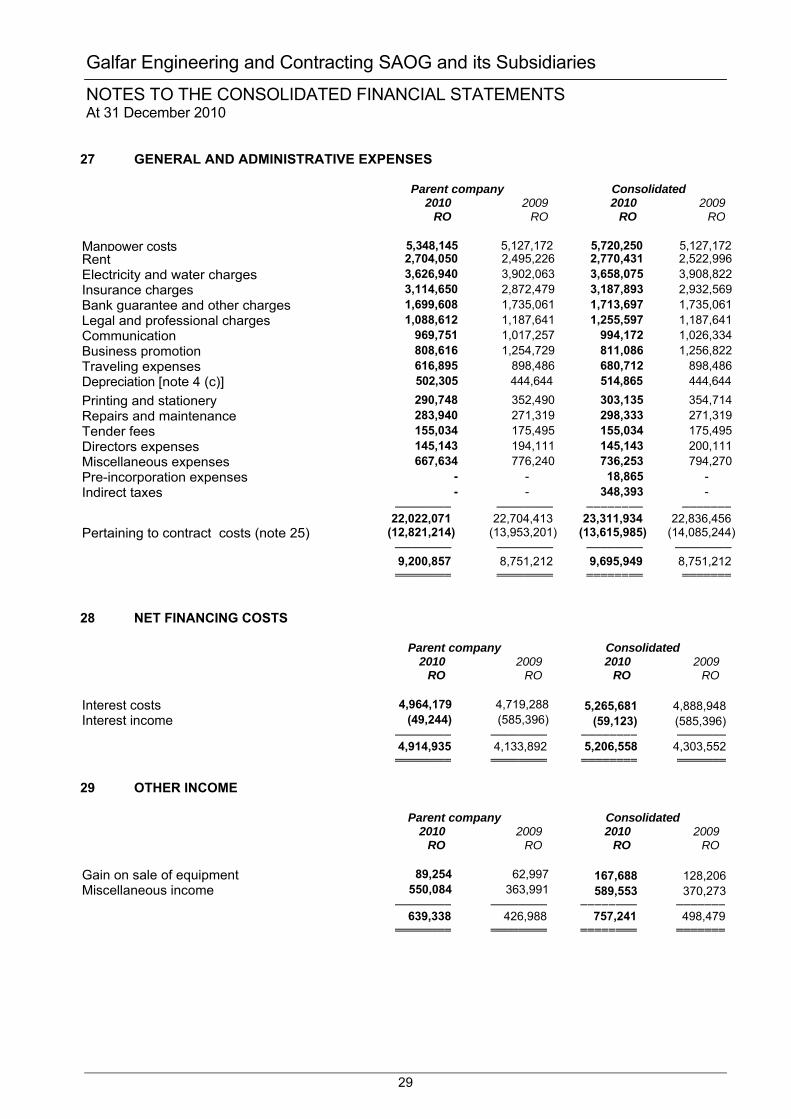
Galfar Engineering and Contracting SAOG and its Subsidiaries
NOTES TO THE CONSOLIDATED FINANCIAL STATEMENTS At 31 December 2010
29
27 GENERAL AND ADMINISTRATIVE EXPENSES Parent company Consolidated 2010 2009 2010 2009 RO RO RO RO Manpower costs 5,348,145 5,127,172 5,720,250 5,127,172Rent 2,704,050 2,495,226 2,770,431 2,522,996Electricity and water charges 3,626,940 3,902,063 3,658,075 3,908,822Insurance charges 3,114,650 2,872,479 3,187,893 2,932,569Bank guarantee and other charges 1,699,608 1,735,061 1,713,697 1,735,061Legal and professional charges 1,088,612 1,187,641 1,255,597 1,187,641Communication 969,751 1,017,257 994,172 1,026,334Business promotion 808,616 1,254,729 811,086 1,256,822Traveling expenses 616,895 898,486 680,712 898,486Depreciation [note 4 (c)] 502,305 444,644 514,865 444,644
Printing and stationery 290,748 352,490 303,135 354,714Repairs and maintenance 283,940 271,319 298,333 271,319Tender fees 155,034 175,495 155,034 175,495Directors expenses 145,143 194,111 145,143 200,111Miscellaneous expenses 667,634 776,240 736,253 794,270Pre-incorporation expenses - - 18,865 - Indirect taxes - - 348,393 - ──────── ──────── ──────── ─────── 22,022,071 22,704,413 23,311,934 22,836,456Pertaining to contract costs (note 25) (12,821,214) (13,953,201) (13,615,985) (14,085,244) ──────── ──────── ──────── ──────── 9,200,857 8,751,212 9,695,949 8,751,212 ════════ ════════ ════════ ═══════ 28 NET FINANCING COSTS Parent company Consolidated 2010 2009 2010 2009 RO RO RO RO Interest costs 4,964,179 4,719,288 5,265,681 4,888,948 Interest income (49,244) (585,396) (59,123) (585,396) ──────── ──────── ──────── ─────── 4,914,935 4,133,892 5,206,558 4,303,552 ════════ ════════ ════════ ═══════ 29 OTHER INCOME Parent company Consolidated 2010 2009 2010 2009 RO RO RO RO Gain on sale of equipment 89,254 62,997 167,688 128,206 Miscellaneous income 550,084 363,991 589,553 370,273 ──────── ──────── ──────── ─────── 639,338 426,988 757,241 498,479 ════════ ════════ ════════ ═══════
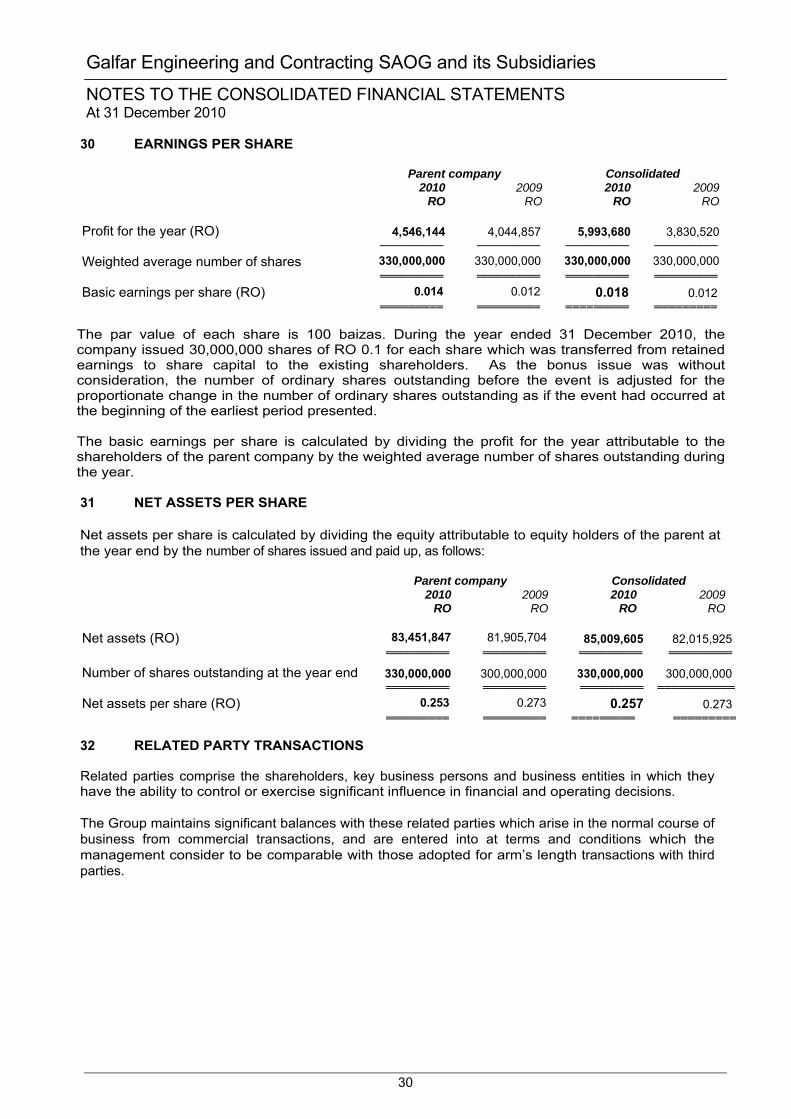
Galfar Engineering and Contracting SAOG and its Subsidiaries
NOTES TO THE CONSOLIDATED FINANCIAL STATEMENTS At 31 December 2010
30
30 EARNINGS PER SHARE Parent company Consolidated 2010 2009 2010 2009 RO RO RO RO Profit for the year (RO) 4,546,144 4,044,857 5,993,680 3,830,520 ───────── ───────── ───────── ─────────
Weighted average number of shares 330,000,000 330,000,000 330,000,000 330,000,000 ═════════ ═════════ ═════════ ═════════
Basic earnings per share (RO) 0.014 0.012 0.018 0.012 ═════════ ═════════ ═════════ ═════════ The par value of each share is 100 baizas. During the year ended 31 December 2010, the company issued 30,000,000 shares of RO 0.1 for each share which was transferred from retained earnings to share capital to the existing shareholders. As the bonus issue was without consideration, the number of ordinary shares outstanding before the event is adjusted for the proportionate change in the number of ordinary shares outstanding as if the event had occurred at the beginning of the earliest period presented. The basic earnings per share is calculated by dividing the profit for the year attributable to the shareholders of the parent company by the weighted average number of shares outstanding during the year. 31 NET ASSETS PER SHARE Net assets per share is calculated by dividing the equity attributable to equity holders of the parent at the year end by the number of shares issued and paid up, as follows: Parent company Consolidated 2010 2009 2010 2009 RO RO RO RO Net assets (RO) 83,451,847 81,905,704 85,009,605 82,015,925 ═════════ ═════════ ═════════ ═════════
Number of shares outstanding at the year end 330,000,000 300,000,000 330,000,000 300,000,000 ═════════ ═════════ ═════════ ═══════════
Net assets per share (RO) 0.253 0.273 0.257 0.273 ═════════ ═════════ ═════════ ═════════ 32 RELATED PARTY TRANSACTIONS Related parties comprise the shareholders, key business persons and business entities in which they have the ability to control or exercise significant influence in financial and operating decisions. The Group maintains significant balances with these related parties which arise in the normal course of business from commercial transactions, and are entered into at terms and conditions which the management consider to be comparable with those adopted for arm’s length transactions with third parties.
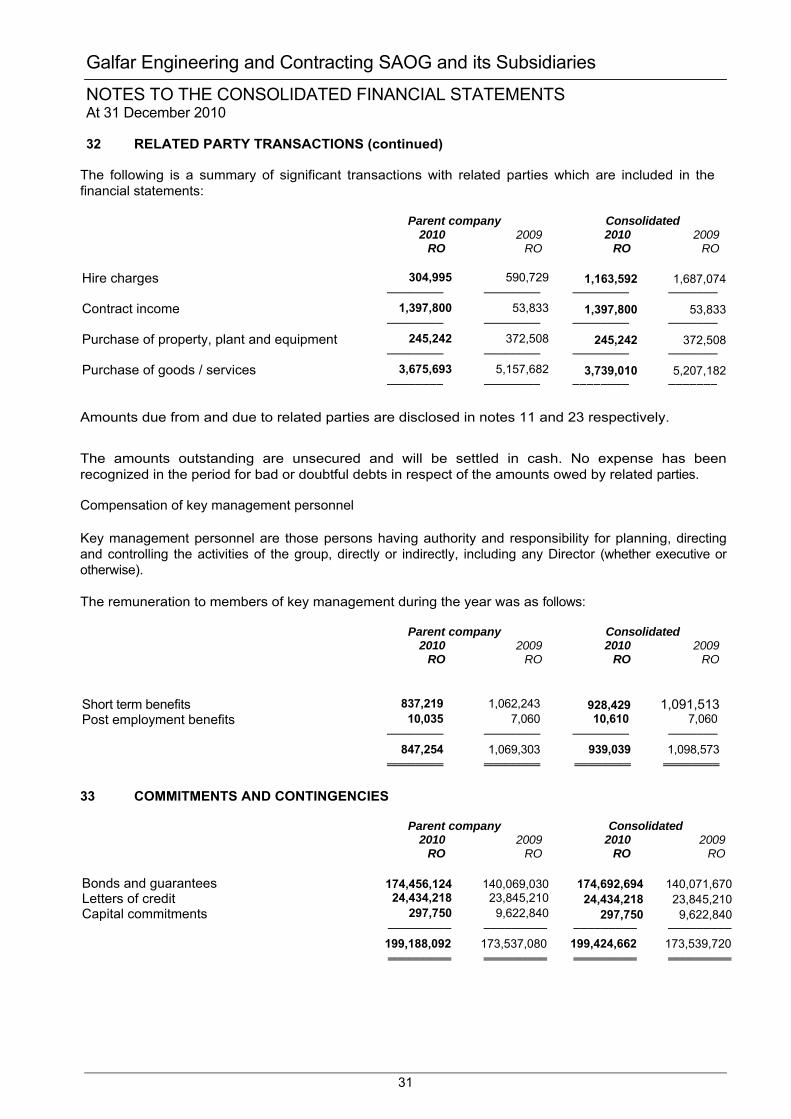
Galfar Engineering and Contracting SAOG and its Subsidiaries
NOTES TO THE CONSOLIDATED FINANCIAL STATEMENTS At 31 December 2010
31
32 RELATED PARTY TRANSACTIONS (continued) The following is a summary of significant transactions with related parties which are included in the financial statements: Parent company Consolidated 2010 2009 2010 2009 RO RO RO RO Hire charges 304,995 590,729 1,163,592 1,687,074 ──────── ──────── ──────── ───────
Contract income 1,397,800 53,833 1,397,800 53,833 ──────── ──────── ──────── ───────
Purchase of property, plant and equipment 245,242 372,508 245,242 372,508 ──────── ──────── ──────── ───────
Purchase of goods / services 3,675,693 5,157,682 3,739,010 5,207,182 ──────── ──────── ──────── ─────── Amounts due from and due to related parties are disclosed in notes 11 and 23 respectively. The amounts outstanding are unsecured and will be settled in cash. No expense has been recognized in the period for bad or doubtful debts in respect of the amounts owed by related parties.
Compensation of key management personnel Key management personnel are those persons having authority and responsibility for planning, directing and controlling the activities of the group, directly or indirectly, including any Director (whether executive or otherwise). The remuneration to members of key management during the year was as follows: Parent company Consolidated 2010 2009 2010 2009 RO RO RO RO Short term benefits 837,219 1,062,243 928,429 1,091,513 Post employment benefits 10,035 7,060 10,610 7,060 ──────── ──────── ──────── ───────
847,254 1,069,303 939,039 1,098,573 ════════ ════════ ════════ ════════
33 COMMITMENTS AND CONTINGENCIES Parent company Consolidated 2010 2009 2010 2009 RO RO RO RO Bonds and guarantees 174,456,124 140,069,030 174,692,694 140,071,670 Letters of credit 24,434,218 23,845,210 24,434,218 23,845,210 Capital commitments 297,750 9,622,840 297,750 9,622,840 ───────── ───────── ───────── ─────────
199,188,092 173,537,080 199,424,662 173,539,720 ═════════ ═════════ ═════════ ═════════
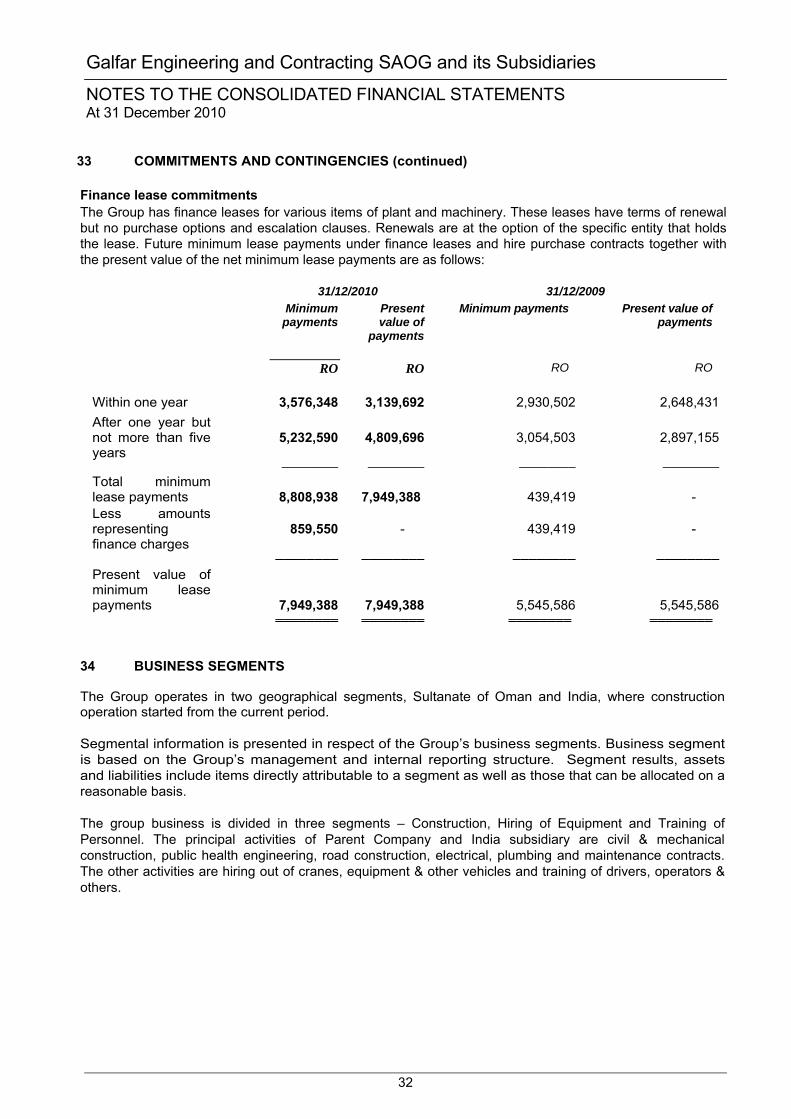
Galfar Engineering and Contracting SAOG and its Subsidiaries
NOTES TO THE CONSOLIDATED FINANCIAL STATEMENTS At 31 December 2010
32
33 COMMITMENTS AND CONTINGENCIES (continued) Finance lease commitments The Group has finance leases for various items of plant and machinery. These leases have terms of renewal but no purchase options and escalation clauses. Renewals are at the option of the specific entity that holds the lease. Future minimum lease payments under finance leases and hire purchase contracts together with the present value of the net minimum lease payments are as follows:
31/12/2010 31/12/2009 Minimum payments
Present value of
payments
Minimum payments Present value of payments
RO RO RO RO
Within one year 3,576,348 3,139,692 2,930,502 2,648,431 After one year but not more than five years
5,232,590 4,809,696
3,054,503
2,897,155
──────── ──────── ──────── ────────Total minimum lease payments
8,808,938 7,949,388
439,419
-
Less amounts representing finance charges
859,550 -
439,419
-
──────── ──────── ──────── ────────Present value of minimum lease payments 7,949,388 7,949,388 5,545,586 5,545,586 ════════ ════════ ════════ ════════
34 BUSINESS SEGMENTS The Group operates in two geographical segments, Sultanate of Oman and India, where construction operation started from the current period. Segmental information is presented in respect of the Group’s business segments. Business segment is based on the Group’s management and internal reporting structure. Segment results, assets and liabilities include items directly attributable to a segment as well as those that can be allocated on a reasonable basis. The group business is divided in three segments – Construction, Hiring of Equipment and Training of Personnel. The principal activities of Parent Company and India subsidiary are civil & mechanical construction, public health engineering, road construction, electrical, plumbing and maintenance contracts. The other activities are hiring out of cranes, equipment & other vehicles and training of drivers, operators & others.
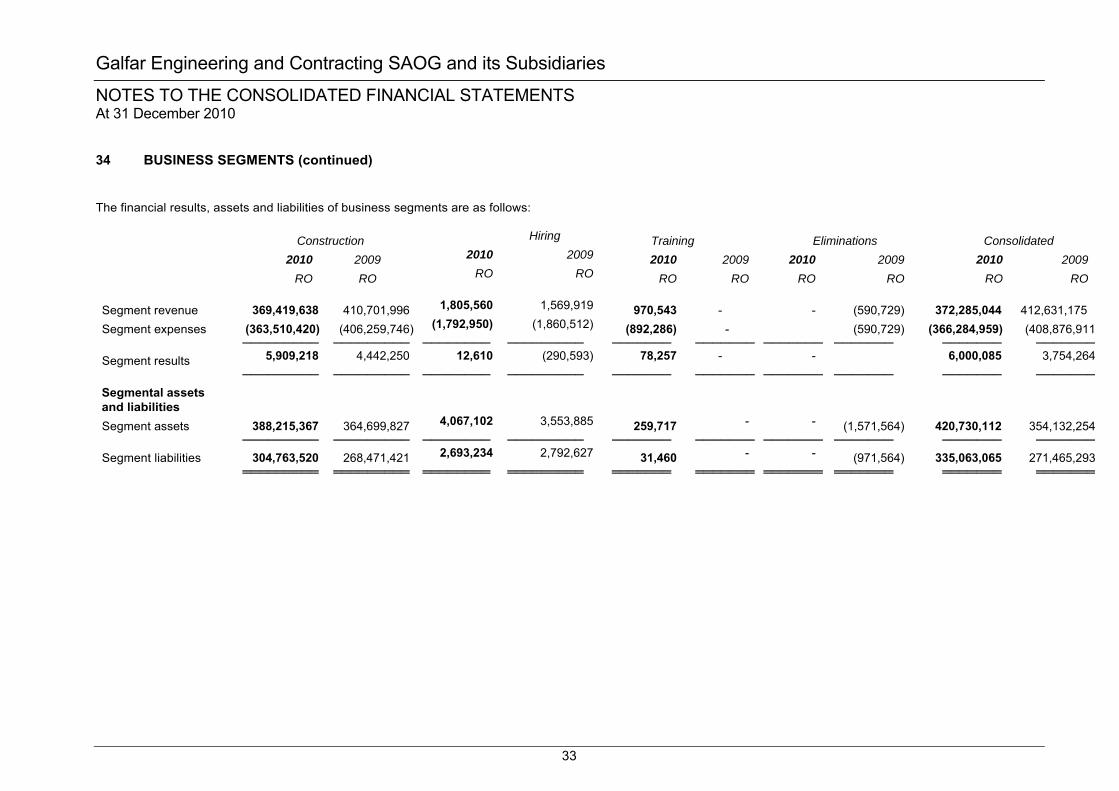
Galfar Engineering and Contracting SAOG and its Subsidiaries
NOTES TO THE CONSOLIDATED FINANCIAL STATEMENTS At 31 December 2010
33
34 BUSINESS SEGMENTS (continued)
The financial results, assets and liabilities of business segments are as follows:
Construction Hiring Training Eliminations Consolidated 2010 2009 2010 2009 2010 2009 2010 2009 2010 2009
RO RO RO RO RO RO RO RO RO RO
Segment revenue 369,419,638 410,701,996 1,805,560 1,569,919 970,543 - - (590,729) 372,285,044 412,631,175 Segment expenses (363,510,420) (406,259,746) (1,792,950) (1,860,512) (892,286) - (590,729) (366,284,959) (408,876,911
───────── ───────── ──────── ───────── ─────── ─────── ─────── ─────── ─────── ───────Segment results 5,909,218 4,442,250 12,610 (290,593) 78,257 - - 6,000,085 3,754,264
───────── ───────── ──────── ───────── ─────── ─────── ─────── ─────── ─────── ───────Segmental assets and liabilities
Segment assets 388,215,367 364,699,827 4,067,102 3,553,885 259,717 - - (1,571,564) 420,730,112 354,132,254───────── ───────── ──────── ───────── ─────── ─────── ─────── ─────── ─────── ───────
Segment liabilities 304,763,520 268,471,421 2,693,234 2,792,627 31,460 - - (971,564) 335,063,065 271,465,293═════════ ═════════ ════════ ═════════ ═══════ ═══════ ═══════ ═══════ ═══════ ═══════
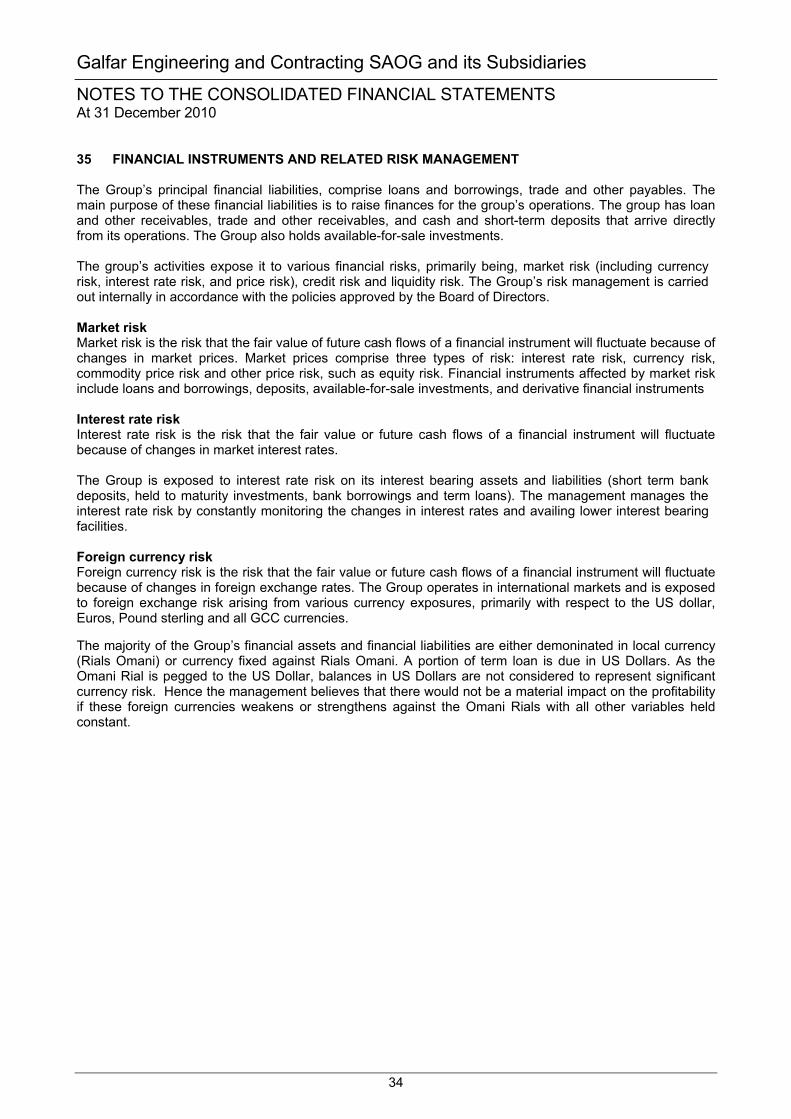
Galfar Engineering and Contracting SAOG and its Subsidiaries
NOTES TO THE CONSOLIDATED FINANCIAL STATEMENTS At 31 December 2010
34
35 FINANCIAL INSTRUMENTS AND RELATED RISK MANAGEMENT The Group’s principal financial liabilities, comprise loans and borrowings, trade and other payables. The main purpose of these financial liabilities is to raise finances for the group’s operations. The group has loan and other receivables, trade and other receivables, and cash and short-term deposits that arrive directly from its operations. The Group also holds available-for-sale investments. The group’s activities expose it to various financial risks, primarily being, market risk (including currency risk, interest rate risk, and price risk), credit risk and liquidity risk. The Group’s risk management is carried out internally in accordance with the policies approved by the Board of Directors.
Market risk Market risk is the risk that the fair value of future cash flows of a financial instrument will fluctuate because of changes in market prices. Market prices comprise three types of risk: interest rate risk, currency risk, commodity price risk and other price risk, such as equity risk. Financial instruments affected by market risk include loans and borrowings, deposits, available-for-sale investments, and derivative financial instruments Interest rate risk Interest rate risk is the risk that the fair value or future cash flows of a financial instrument will fluctuate because of changes in market interest rates. The Group is exposed to interest rate risk on its interest bearing assets and liabilities (short term bank deposits, held to maturity investments, bank borrowings and term loans). The management manages the interest rate risk by constantly monitoring the changes in interest rates and availing lower interest bearing facilities. Foreign currency risk Foreign currency risk is the risk that the fair value or future cash flows of a financial instrument will fluctuate because of changes in foreign exchange rates. The Group operates in international markets and is exposed to foreign exchange risk arising from various currency exposures, primarily with respect to the US dollar, Euros, Pound sterling and all GCC currencies. The majority of the Group’s financial assets and financial liabilities are either demoninated in local currency (Rials Omani) or currency fixed against Rials Omani. A portion of term loan is due in US Dollars. As the Omani Rial is pegged to the US Dollar, balances in US Dollars are not considered to represent significant currency risk. Hence the management believes that there would not be a material impact on the profitability if these foreign currencies weakens or strengthens against the Omani Rials with all other variables held constant.
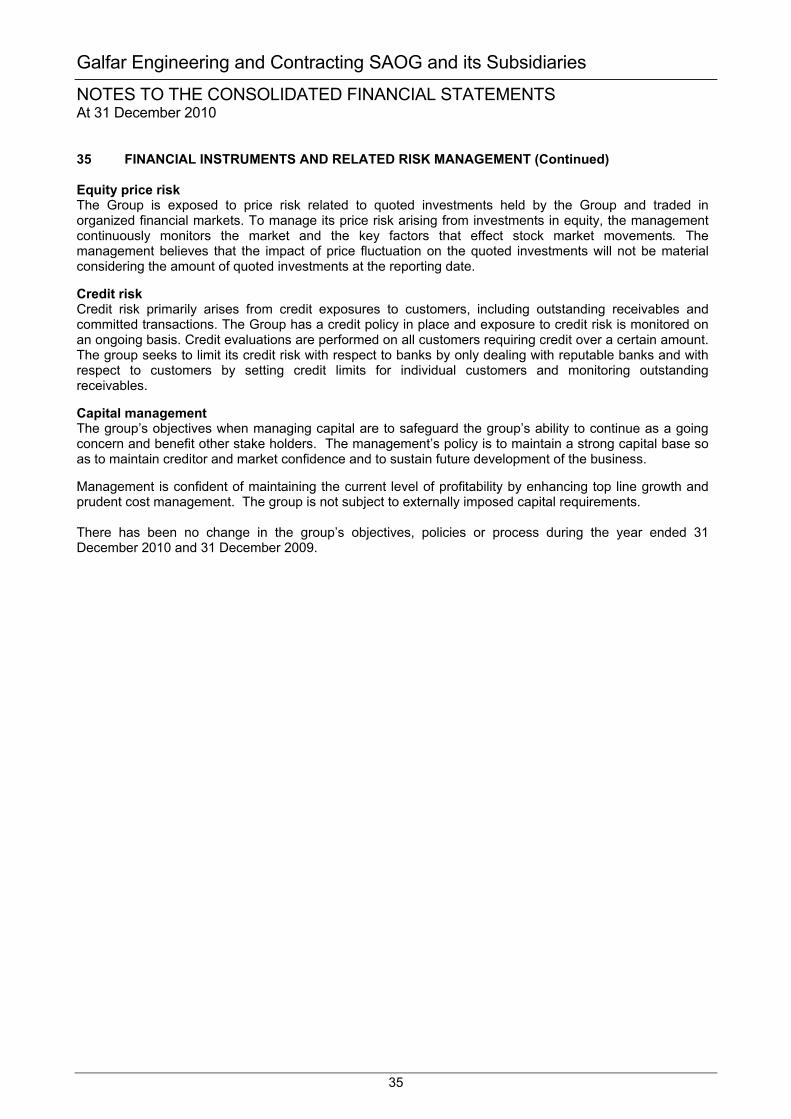
Galfar Engineering and Contracting SAOG and its Subsidiaries
NOTES TO THE CONSOLIDATED FINANCIAL STATEMENTS At 31 December 2010
35
35 FINANCIAL INSTRUMENTS AND RELATED RISK MANAGEMENT (Continued) Equity price risk The Group is exposed to price risk related to quoted investments held by the Group and traded in organized financial markets. To manage its price risk arising from investments in equity, the management continuously monitors the market and the key factors that effect stock market movements. The management believes that the impact of price fluctuation on the quoted investments will not be material considering the amount of quoted investments at the reporting date. Credit risk Credit risk primarily arises from credit exposures to customers, including outstanding receivables and committed transactions. The Group has a credit policy in place and exposure to credit risk is monitored on an ongoing basis. Credit evaluations are performed on all customers requiring credit over a certain amount. The group seeks to limit its credit risk with respect to banks by only dealing with reputable banks and with respect to customers by setting credit limits for individual customers and monitoring outstanding receivables. Capital management The group’s objectives when managing capital are to safeguard the group’s ability to continue as a going concern and benefit other stake holders. The management’s policy is to maintain a strong capital base so as to maintain creditor and market confidence and to sustain future development of the business. Management is confident of maintaining the current level of profitability by enhancing top line growth and prudent cost management. The group is not subject to externally imposed capital requirements. There has been no change in the group’s objectives, policies or process during the year ended 31 December 2010 and 31 December 2009.
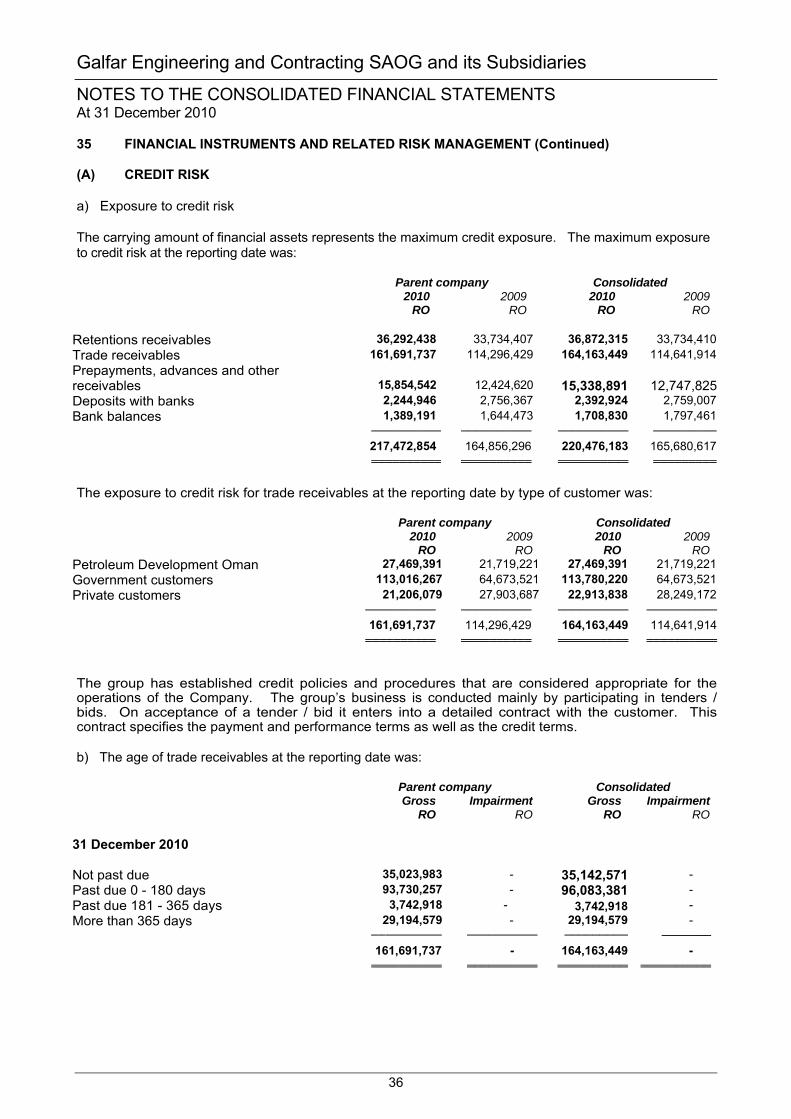
Galfar Engineering and Contracting SAOG and its Subsidiaries
NOTES TO THE CONSOLIDATED FINANCIAL STATEMENTS At 31 December 2010
36
35 FINANCIAL INSTRUMENTS AND RELATED RISK MANAGEMENT (Continued) (A) CREDIT RISK a) Exposure to credit risk The carrying amount of financial assets represents the maximum credit exposure. The maximum exposure to credit risk at the reporting date was:
Parent company Consolidated 2010 2009 2010 2009 RO RO RO RO Retentions receivables 36,292,438 33,734,407 36,872,315 33,734,410Trade receivables 161,691,737 114,296,429 164,163,449 114,641,914Prepayments, advances and other receivables 15,854,542 12,424,620 15,338,891 12,747,825Deposits with banks 2,244,946 2,756,367 2,392,924 2,759,007Bank balances 1,389,191 1,644,473 1,708,830 1,797,461 ────────── ────────── ────────── ─────────
217,472,854 164,856,296 220,476,183 165,680,617 ══════════ ══════════ ══════════ ═════════
The exposure to credit risk for trade receivables at the reporting date by type of customer was:
Parent company Consolidated 2010 2009 2010 2009 RO RO RO RO Petroleum Development Oman 27,469,391 21,719,221 27,469,391 21,719,221Government customers 113,016,267 64,673,521 113,780,220 64,673,521Private customers 21,206,079 27,903,687 22,913,838 28,249,172 ────────── ────────── ────────── ──────────
161,691,737 114,296,429 164,163,449 114,641,914 ══════════ ══════════ ══════════ ══════════
The group has established credit policies and procedures that are considered appropriate for the operations of the Company. The group’s business is conducted mainly by participating in tenders / bids. On acceptance of a tender / bid it enters into a detailed contract with the customer. This contract specifies the payment and performance terms as well as the credit terms. b) The age of trade receivables at the reporting date was:
Parent company Consolidated Gross Impairment Gross Impairment RO RO RO RO 31 December 2010 Not past due 35,023,983 - 35,142,571 - Past due 0 - 180 days 93,730,257 - 96,083,381 - Past due 181 - 365 days 3,742,918 - 3,742,918 - More than 365 days 29,194,579 - 29,194,579 - ────────── ────────── ───────── ───────
161,691,737 - 164,163,449 - ══════════ ══════════ ══════════ ══════════
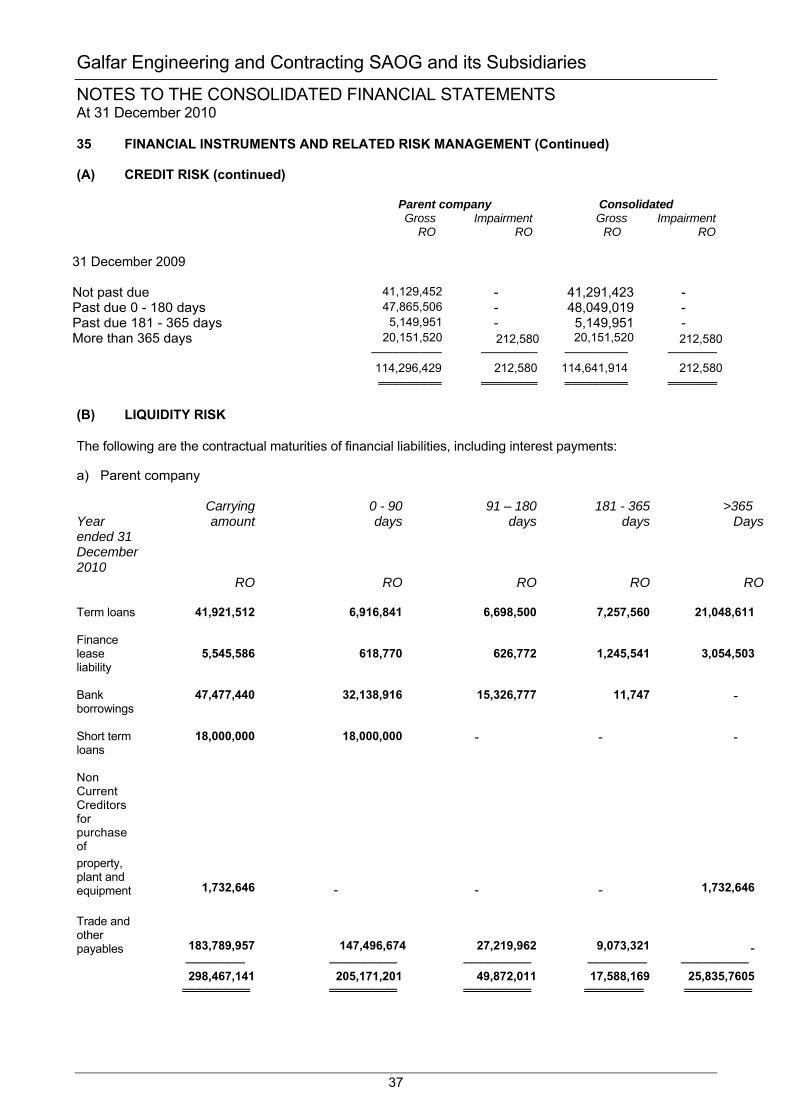
Galfar Engineering and Contracting SAOG and its Subsidiaries
NOTES TO THE CONSOLIDATED FINANCIAL STATEMENTS At 31 December 2010
37
35 FINANCIAL INSTRUMENTS AND RELATED RISK MANAGEMENT (Continued) (A) CREDIT RISK (continued)
Parent company Consolidated Gross Impairment Gross Impairment RO RO RO RO 31 December 2009 Not past due 41,129,452 - 41,291,423 - Past due 0 - 180 days 47,865,506 - 48,049,019 - Past due 181 - 365 days 5,149,951 - 5,149,951 - More than 365 days 20,151,520 212,580 20,151,520 212,580 ────────── ──────── ───────── ───────
114,296,429 212,580 114,641,914 212,580 ═════════ ════════ ═════════ ═══════
(B) LIQUIDITY RISK The following are the contractual maturities of financial liabilities, including interest payments: a) Parent company Year ended 31 December 2010
Carrying amount
0 - 90 days
91 – 180 days
181 - 365 days
>365 Days
RO RO RO RO RO Term loans 41,921,512 6,916,841 6,698,500 7,257,560 21,048,611
Finance lease liability
5,545,586
618,770
626,772
1,245,541
3,054,503
Bank borrowings
47,477,440 32,138,916 15,326,777
11,747
-
Short term loans
18,000,000 18,000,000 -
- -
Non Current Creditors for purchase of
property, plant and equipment
1,732,646 -
-
-
1,732,646
Trade and other payables
183,789,957 147,496,674
27,219,962
9,073,321
- ─────── ──────── ──────── ─────── ──────── 298,467,141 205,171,201 49,872,011 17,588,169 25,835,7605 ════════ ════════ ════════ ═══════ ════════
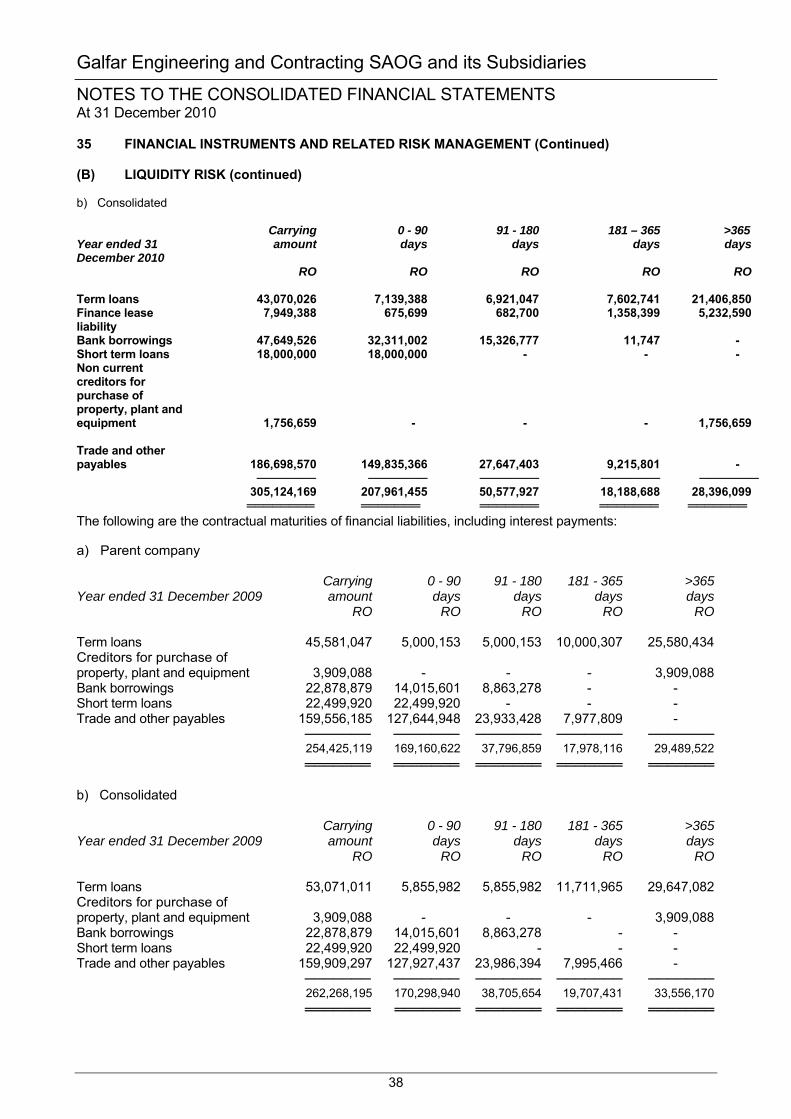
Galfar Engineering and Contracting SAOG and its Subsidiaries
NOTES TO THE CONSOLIDATED FINANCIAL STATEMENTS At 31 December 2010
38
35 FINANCIAL INSTRUMENTS AND RELATED RISK MANAGEMENT (Continued) (B) LIQUIDITY RISK (continued) b) Consolidated Year ended 31 December 2010
Carrying amount
0 - 90 days
91 - 180 days
181 – 365 days
>365 days
RO RO RO RO RO Term loans 43,070,026 7,139,388 6,921,047 7,602,741 21,406,850Finance lease liability
7,949,388 675,699 682,700 1,358,399 5,232,590
Bank borrowings 47,649,526 32,311,002 15,326,777 11,747 - Short term loans Non current
18,000,000
18,000,000
-
-
-
creditors for purchase of property, plant and equipment
1,756,659
-
-
-
1,756,659
Trade and other payables
186,698,570 149,835,366 27,647,403 9,215,801 -
─────── ─────── ─────── ─────── ─────── 305,124,169 207,961,455 50,577,927 18,188,688 28,396,099 ════════ ═══════ ═══════ ═══════ ═══════The following are the contractual maturities of financial liabilities, including interest payments: a) Parent company Year ended 31 December 2009
Carrying amount
0 - 90 days
91 - 180 days
181 - 365 days
>365 days
RO RO RO RO RO Term loans 45,581,047 5,000,153 5,000,153 10,000,307 25,580,434 Creditors for purchase of property, plant and equipment 3,909,088 - - - 3,909,088 Bank borrowings 22,878,879 14,015,601 8,863,278 - - Short term loans 22,499,920 22,499,920 - - - Trade and other payables 159,556,185 127,644,948 23,933,428 7,977,809 - ─────── ─────── ─────── ─────── ─────── 254,425,119 169,160,622 37,796,859 17,978,116 29,489,522 ═══════ ═══════ ═══════ ═══════ ═══════ b) Consolidated Year ended 31 December 2009
Carrying amount
0 - 90 days
91 - 180 days
181 - 365 days
>365 days
RO RO RO RO RO Term loans 53,071,011 5,855,982 5,855,982 11,711,965 29,647,082 Creditors for purchase of property, plant and equipment 3,909,088 - - - 3,909,088 Bank borrowings 22,878,879 14,015,601 8,863,278 - - Short term loans 22,499,920 22,499,920 - - - Trade and other payables 159,909,297 127,927,437 23,986,394 7,995,466 - ─────── ─────── ─────── ─────── ─────── 262,268,195 170,298,940 38,705,654 19,707,431 33,556,170 ═══════ ═══════ ═══════ ═══════ ═══════
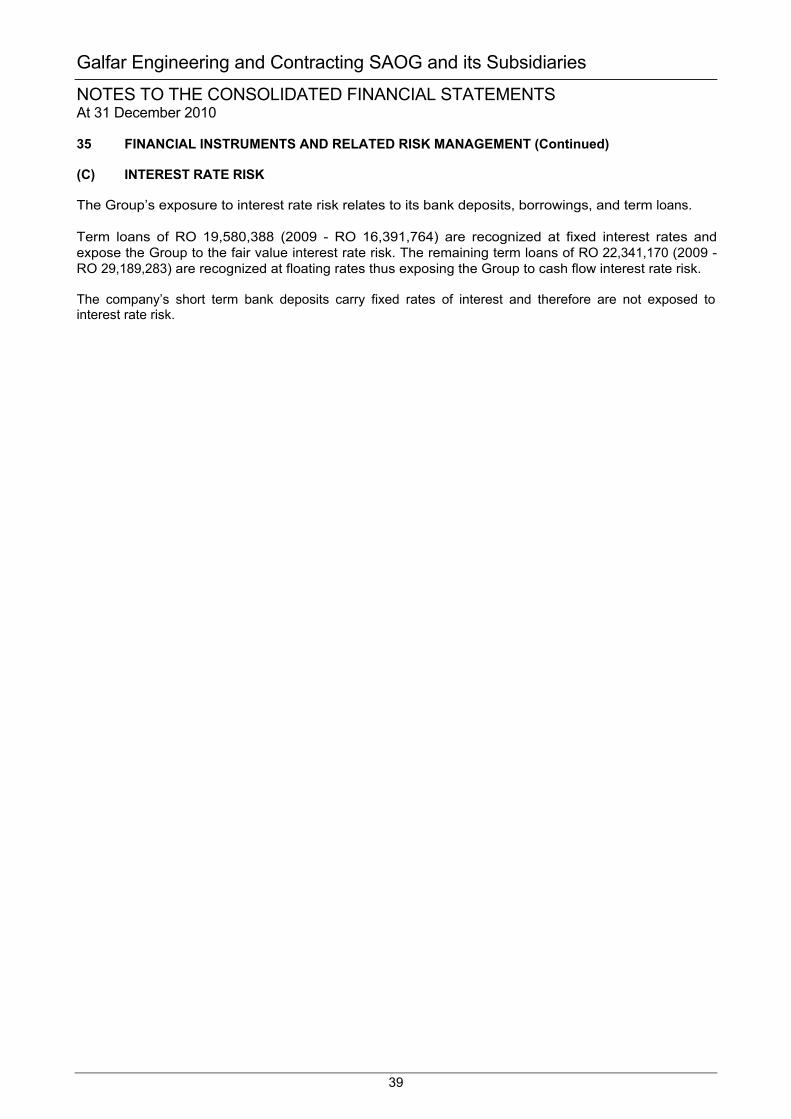
Galfar Engineering and Contracting SAOG and its Subsidiaries
NOTES TO THE CONSOLIDATED FINANCIAL STATEMENTS At 31 December 2010
39
35 FINANCIAL INSTRUMENTS AND RELATED RISK MANAGEMENT (Continued) (C) INTEREST RATE RISK The Group’s exposure to interest rate risk relates to its bank deposits, borrowings, and term loans. Term loans of RO 19,580,388 (2009 - RO 16,391,764) are recognized at fixed interest rates and expose the Group to the fair value interest rate risk. The remaining term loans of RO 22,341,170 (2009 - RO 29,189,283) are recognized at floating rates thus exposing the Group to cash flow interest rate risk. The company’s short term bank deposits carry fixed rates of interest and therefore are not exposed to interest rate risk.

Galfar Engineering and Contracting SAOG and its Subsidiaries
NOTES TO THE CONSOLIDATED FINANCIAL STATEMENTS At 31 December 2010
40
36 FAIR VALUES OF FINANCIAL INSTRUMENTS Fair values Financial instruments comprise financial asset and financial liabilities. Financial assets consist of bank balances, receivables and available for sale investments. Financial liabilities consist of term loans and payables. Set out below is a comparison by class of the carrying amounts and fair value of the Group’s financial instruments that are carried in the financial statements. Carrying amount Fair value
2010 2009 2010 2009 Group Parent Group Parent Group Parent Group Parent RO RO RO RO RO RO RO RO Financial assets Trade and other receivables 184,630,471 181,579,107 122,122,155 121,776,670 184,630,471 181,579,107 122,122,155 121,776,670 Available for sale investments 145,000 125,000 145,000 125,000 145,000 125,000 145,000 125,000 Due from related parties 2,365,273 3,334,295 1,179,706 897,512 2,365,273 3,334,295 1,179,706 897,512 Bank balances and deposits 4,101,754 3,634,137 1,648,961 1,644,473 4,101,754 3,634,137 1,648,961 1,644,473 Investment in associates 8,342,831 8,217,606 1,066,573 1,066,573 8,342,831 8,217,606 1,066,573 1,066,573 ──────── ──────── ──────── ──────── ──────── ──────── ──────── ──────── Total 199,585,329 196,890,145 126,162,395 125,510,228 199,585,329 196,890,145 126,162,395 125,510,228
════════ ════════ ════════ ════════ ════════ ════════ ════════ ════════ Financial liabilities Trade and other payables 96,078,910 95,723,372 159,909,297 159,556,185 96,078,910 95,723,372 159,909,297 159,556,185 Due to related parties 3,016,372 2,418,292 4,897,237 5,014,496 3,016,372 2,418,292 4,897,237 5,014,496 Bank borrowings 47,649,526 47,477,440 22,962,434 22,878,879 47,649,526 47,477,440 22,962,434 22,878,879 Term loans 61,070,026 59,921,512 75,570,934 68,679,962 61,070,026 59,921,512 75,570,934 68,679,962 ──────── ──────── ──────── ──────── ──────── ──────── ──────── ──────── Total 207,814,834 205,540,616 263,339,902 256,129,522 207,814,834 205,540,616 263,339,902 256,129,522 ════════ ════════ ════════ ════════ ════════ ════════ ════════ ════════

Galfar Engineering and Contracting SAOG and its Subsidiaries
NOTES TO THE CONSOLIDATED FINANCIAL STATEMENTS At 31 December 2010
41
37 KEY SOURCES OF ESTIMATION UNCERTAINTY Estimates and assumptions The key assumptions concerning the future and other key sources of estimation uncertainty at the reporting date, that have a significant risk of causing a material adjustment to the carrying amounts of assets and liabilities within the next financial year are discussed below : Impairment of accounts receivable An estimate of the collectible amount of trade accounts receivable is made when collection of the full amount is no longer probable. For individually significant amounts, this estimation is performed on an individual basis. Amounts which are not individually significant, but which are past due, are assessed collectively and a provision applied according to the length of time past due. At the reporting date, gross trade accounts receivable were RO 184,630,471(2009: RO 122,863,904), and the provision for doubtful debts was RO nil (2009: RO 212,580). Any difference between the amounts actually collected in future periods and the amounts expected will be recognised in the statement of comprehensive income. Percentage of completion The company uses the survey method when accounting for contract revenue. Use of the survey method requires the company to reliably estimate the costs by reference to the stage of completion of the construction activity at the reporting date. The accuracy of this estimate has a material impact on the amount of revenue and related profits recognised. Any revision to profit arising from changes in estimates is accounted for in the period when the changes become known. Impairment of inventories Inventories are held at the lower of cost and net realisable value. When inventories become old or obsolete, an estimate is made of their net realisable value. For individually significant amounts this estimation is performed on an individual basis. Amounts which are not individually significant, but which are old or obsolete, are assessed collectively and a provision applied according to the inventory type and the degree of ageing or obsolescence, based on anticipated selling prices. At the reporting date, gross inventories were RO 24,094,862(2009: RO 23,325,183 ) with provisions for old and obsolete inventories of RO Nil (2009: RO 80,442) respectively. Any difference between the amounts actually realised in future periods and the amounts expected will be recognised in the statement of comprehensive income. Useful lives of property, plant and equipment The group's management determines the estimated useful lives of its property, plant and equipment for calculating depreciation. This estimate is determined after considering the expected usage of the asset or physical wear and tear. Management reviews the residual value and useful lives annually and future depreciation charge would be adjusted where the management believes the useful lives differ from previous estimates. Impairment of equity investments The group treats available-for-sale equity investments as impaired when there has been a significant or prolonged decline in the fair value below its cost or where other objective evidence of impairment exists. The determination of what is ‘significant’ or ‘prolonged’ requires judgment, which is critically evaluated by the group on a case to case basis.
Galfar Engineering and Contracting SAOG and its Subsidiaries
NOTES TO THE CONSOLIDATED FINANCIAL STATEMENTS At 31 December 2010
42
37 KEY SOURCES OF ESTIMATION UNCERTAINTY (continued) Taxes Uncertainties exist with respect to the interpretation of tax regulations and the amount and timing of future taxable income. Given the wide range of business relationships and nature of existing contractual agreements, differences arising between the actual results and the assumptions made, or future changes to such assumptions, could necessitate future adjustments to tax income and expense already recorded. The group establishes provisions, based on reasonable estimates, for possible consequences of finalisation of tax assessments of respective group companies. The amount of such provisions is based on various factors, such as experience of previous tax assessments and differing interpretations of tax regulations by the taxable entity and the responsible tax authority. 38 COMPARATIVE AMOUNTS Certain of the corresponding figures for 2009 have been reclassified in order to conform with the presentation for the current year. Such reclassifications do not affect previously reported profit or shareholder’s equity.