Embed Size (px)
Citation preview

1
“Out line of MIGAS and overview of Gas in Indonesia”
Presented on:Program Formulation Course
Meeting on JCCP HRD & Technical Cooperation Program For MIGAS
By:Arif Rahman Hakim
Novita MariyanaEdy Wijaya Tarigan
Directorate General of Oil and Gas (Migas)Ministry of Energy and Mineral Resources
Republic of Indonesia JCCP Course Program Japan, July 23 – August 1, 2018

VISION AND MISSIONDIRECTORATE GENERAL OF OIL AND GAS
Being a policy and regulation creator which is competence and also being a good service executor in industrial Oil and Gas area
Directorate General of Oil and Gas

VISION AND MISSIONDIRECTORATE GENERAL OF OIL AND GAS
M I S I O N
Directorate General of Oil and Gas
•Improve the interest, human resource integrity and professionalism•Improve the coordination and togetherness•Create conducive environmental and good image•Produce a policy and regulation appropriately and precisely prima service and also good services in industrial Oil & Gas area

4
DUTY AND FUNCTION DIRECTORATE GENERAL OF OIL AND GAS
Directorate General of Oil and Gas
Directorate General Oil and Gas has duties to formulate and implement technical standardization and policy in Oil and Gas sector
THE DUTY
• Preparation of policy formula Department in Oil and Gas sector.• Implementation of policy in Oil and Gas sector.• Compilation of standard, norm, guidance, criterion, and procedure in oil and gas sector.• Giving of technical tuition and evaluation.• Implementation administration of Directorate General Oil and Gas
THE FUNCTION

Director General of Oil and Gas
DR. IR DJOKO SISWANTO, M.B.A
Director of Oil and Gas Program Development
Director of Oil and Gas Upstream Business
DevelopmentEDIAR
Director of Oil and Gas Downstream Business
DevelopmentYULI RAHMAWATI
Director of Oil and Gas Engineering and
EnvironmentSOERJANINGSIH
Director of Oil and Gas Planning and Infrastructure
DevelopmetALIMUDDIN BASO, ST, M.B.A
Secretary of Directorate General For Oil and Gas
BUDIYANTONO
Directorate General of Oil and Gas
ORGANIZATION STRUCTURE
NEW DIRECTORATE

6
UNIT
GENERAL OVERVIEW OF HUMAN RESOURCEDIRECTORATE GENERAL OF OIL AND GAS
Directorate General of Oil and Gas

7
SEX
GENERAL OVERVIEW… Cont’
Directorate General of Oil and Gas
GENERAL OVERVIEW OF HUMAN RESOURCEDIRECTORATE GENERAL OF OIL AND GAS

8
GENERAL OVERVIEW OF HUMAN RESOURCEDIRECTORATE GENERAL OF OIL AND GAS
EDUCATION
Directorate General of Oil and Gas

9
EDUCATION
BACKGROUND
Directorate General of Oil and Gas

6.0%
4.1%
30.4%
42.5%
7.6%
9.4%
China30.6%
Australia19.79%
Indonesia16.34%
1,53%Indonesia Of world Total Reserves
North America has 6.0%of world reserves, whereUSA accounted for 4.7%
Central and SouthAmerica has 4.1% of
total of world reserveswhere Venezuelaholds 3.1% of it
Africa holds 7.6% ofworld reserves whereNigeria dan Algeria
accounted for 2.4 %.
Middle east holds42.5% dari of worldreserves where Iran
and Qatar holds morethan 15% of it
Europe and Eurasia holds30.4% dari of world
reserves, where Russiaholds 17.3%
Asia Pasific holds 9.4%of world reserves where
China holds 2.9%Asia pacific Holdsof world reser ves9,4%
Status: end of 2016
CURRENT ISSUES ABOUT NATURAL GAS

23%
25%
30%
22%
20%2025
400 MTOE
31%25%
24%
20501.012 MTOE
Renewable EnergyOilGasCoal
TARGET IN2025
TARGET IN2050
37,1%
2016
Referring to Indonesia’s General Plan of National Energy (RUEN)
7,6%
31,4%
23,8%
2016*)
169 MTOE
Target in theNational Energy Policy (KEN)
2025 2050
Role of Energy Driver of economic growth
Portion of Gas in Energy Mix 22% 24%Energy Supply > 400 MTOE > 1.000 MTOE
Power Generation > 115 GW > 430 GW
Energy Elasticity < 1 < 1Power/capita/year 2.500 kWh 7.000 kWh
Electrification Ratio ∼100% ∼100%

Source: Transparency Market Research Analysis, 2017
10
Virtual PipelineDeliver Natural Gas to marketswithout pipeline access tocompliment the conventionalsupply of gas via pipelinenetworks
Virtual Pipeline Cluster ConceptIntend to develop Virtual Pipeline ClusterConcept (VPCC) to supply LNG to scatteredislands in Indonesia by small scale LNGdistribution
Virtual Pipeline ofTanker TrucksUsing trucks to supply LNGdirectly to end-users startedgaining traction with Chinesesmokestack industries – suchas steel and cementmanufacturer
China
Indonesia
Virtual Pipeline systems are arranged shipments ofgas from one point to another
supply natural gas to industries, electricity generationplants, and commercial & residential customers.
geographically challenging to justify aninvestment in pipeline construction or toosmall for normal LNG large-scale carriersThe global virtual pipeline systems market islikely to be worth US$1,821.3 m by the endof 2025 from US$1,070.0 m in 2016.
Malaysia

The management ofgas must be
sustainable in orderto support the
continuity ofnational economic
development
Gas must beaccessible to
users in allregions
Gas prices must beoptimally affordable for allsegments of gas users
The availability of gasmust be guaranteed tomeet domesticdemand
Gas Regulations in Indonesia• Provision & Procedure of Gas Allocation, Utilization, &
Pricing
• Stipulation of Gas Prices
• Procedure of Stipulation of Particular Gas Users & Prices
• Gas Prices for Particular Industries
• Gas Prices for Industries in Medan & Surrounding Areas
• Utilization of Gas for Power Generation
• Acceleration of Gas Utilization for Transportation
• Utilization & Prices of Flare Gas in Upstream Oil & GasIndustry
• Stipulation of Gas Allocation & Utilization for PowerGeneration

Finding more gasresources and how we cantransfer it to add to theproven reserves• Maintaining exploration to
find hydrocarbon and addingmore gas reserves
Developing gas supply tomeet the ever growingdemand• Gas Supply and Demand
Management
Ensuring attractiveness ofupstream gas activities• Low production cost• Fair share of revenue
There is shifting energy fromoil dominant to gas dominant• Maintaining the oil production
using EOR and IOR

4.397 4.4164.202
4.0083.820 3.775 3.681
4.3364.078
3.631
3.4023.237
3.0902.860 2.618
1.480 1.466 1.513
2.3412.527
2.913
3.323 3.3793.267
3.550
3.7743.632
3.882 3.9973.855
-
500
1.000
1.500
2.000
2.500
3.000
3.500
4.000
4.500
5.000
2003 2004 2005 2006 2007 2008 2009 2010 2011 2012
Domestic
2013 2014 2015 2016 2017
BBTU
D
Ekspor Domestik
Average growth of domestic gas demand (2003 – 2016): 9%Portion of domestic gas demand in 2017 : 58%
Utilization of Gas in Indonesia (2017)
Electricity13.67%
Fertilizer11.15%
Industry23.53%
Oil Lifting2.77%
City Gas0.05%
Gas for Transportation0.08%
Piped Gas Export12.62%
LNG for Export28.49%
LNG for Domestic5.53%
LPG for Domestic2.11%
Export

3 5 0 . 0 0
3 0 0 . 0 0
2 5 0 . 0 0
2 0 0 . 0 0
1 5 0 . 0 0
1 0 0 . 0 0
5 0 . 0 0
0 . 0 0
4 0 0 . 0 0
4 5 0 . 0 0
5 0 0 . 0 0
2 0 1 7 2 0 1 8 2 0 1 9 2 0 2 0 2 0 2 1 2 0 2 2 2 0 2 3 2 0 2 4 2 0 2 5 2 0 2 6 2 0 2 7 2 0 2 8 2 0 2 9 2 0 3 0
K o m it m e n L N G E k s p o r
U n c o m m it t e d t o s e l l ( I n c l u d e M a s e la )Committed LNG ExportsUncommitted to Sell (Including Masela)Domestic LNG CommitmentUncommitted (Reserved for PLN based on Ministerial Decree 1750)Total Production
in Cargo

1. Indonesia Gas Balance
3

dalam MMSCFD
GAS PRODUCTION PROJECTION 2015 – 2050
4

2019START TO IMPOR GAS
National Energy Agency Forecast: Gas demand in 2025 will make up to 20% of National Energy Mix (7,134 BOED), or 8,249 BBTUD
GAS BALANCE INDONESIA 2015 – 2030
5

GAS UTILIZATION IN INDONESIA 2016
Electrical 14.96%
Fertilizer10.50%
22.10%
LiftingMinyak3.02%
City Gas0.05%
BBG Transportasi0.06%
Ekspor Gas Pipa11.80%
29.10%
LNG Domestik5.91%
LPG Domestik2.50%
1,400
1,200 1,136.39
1,024.601,000
718.09
1,510.91
206.20
3.13 3.78
758.76
1,814.76
321.05
3.51 8.50
-
600
800
1,800
1,600
2,000
Kelistrikan Pupuk Industri LiftingMinyak CityGas
BBTU
D
Realizationof GasDistribution byPipeforDomestic Use Tahun2016
Realisasi (BBTUD) Kontrak
Status s.d. Mei 2016
6

535
4.000
3.500
1.500
1.000
2.500
3.000
2.000
500
5.500
4.500
5.000
785
5.3154.550
1.8102.230
3.270
2.1902.190
1.085
3.950
2.120
2.195
1.435
2.2702.600
2.025
+4%
2.065
15 YearsAVE CAGR
OE Production
4%
In mboepdIn 2015 the gap between national supply and demand begins.
0
2012 2013National Supply
2014 2015NationalDemand
2020 2025 2030 2040 2050
214| 7

15 YearsCAGR Average
7%Gas
Consumption
Industry (98,26%)Household (0,11%)Commercial (1,34%)Transportation(0,29%)
In mmscfdIn 2021 the gap between national supply and demand begins.
18.000
16.000
14.000
12.000
10.000
8.000
6.000
4.000
2.0000
4.1003.640
5.800
9.100
3.995
7.0008.130 8.145
3.650 3.9105.700
8.1108.165
13.600+7%
3.400
11.300
16.300
2.500
2012 2013 2014 2015 2020 2025 2030 2040 2050National Supply
KKKementerianESDM Republik Indonesia
NationalDemand | 8

2. Gas Infrastructure Existing
99

MOSQUITO GUARANTEE OF LIQUID GAS (LNG) IN INDONESIA
Known as PT arun NGL is Indonesia's natural liquid producer company. In the 1990s, the arun refinery is one of the largest LNG producers in the world, PT arun is a pertamina subsidiary located in lhokseumawe aceh, north aceh. Gas supply reached 17.1 trillion cubic feet with a pressure of 499 kg / cm, 177˚c temperature, with a thickness of 300 meters. The amount is estimated to supply six units of processing kitchen (train) with capacity of 300 millions SCFD each (standard cubic feet day), currently pt arun only mengeperasikan 2 units train or processing kitchen, because the reserve mentioned above has been thinned.
PT. Arun Natural Gas Liquefacrtion

The largest LNG plant in Indonesia and one of the largest in the world. Its located in bontang east Kalimantan. The refinery has 8 processing kitchens (Train) A-H. which is capable of producing 22.5 Mtpa LNG (Millions of LNG matrices per year). And is the largest contributor of foreign exchange for the city and Indonesia.
PT. badak natural gas liquefication

The tough LNG is a mega project that builds an LNG plant in Bintuni bay in western Papua, to accommodate natural gas coming from several blocks around bay bintuni, such as berau block, wiriagar blog and muturi block. Currently the strong LNG still has 2 train or processing kitchen for the third train is still in the development stage. Currently, with a strong 1 and 2 LNG train already generating 3.8 million tonnes per year is expected when train 3 is completed to produce 11.4 million tonnes per year.
LNG Tangguh

LNG Donggi senoro
This refinery is one of the mega projects that completed in this year, this refinery is located banggai district precisely in the uso village of central Sulawesi. The refinery is the work of Pertamina, Medco Energy, Mitsubishi, Korean Gas Corporation. And the refinery produces 2 million tons per year

3. Gas Infrastructure Development
99

1. Lack of large gas reser ves, Reser ves Replacement Ratio (R3) <1, where the gas production rateis greater than the rate of reser ves discover y
2. The discover y of natural gas reser ves shifted to Eastern Indonesia with deep watercharacteristics
3. With the current oil price conditions some marginal gas fields are not yet economical tomonetize
1. Indonesia's geographical is a challenge in integrating Indonesia's natural gas infrastructure2. The location of natural gas sources is far from natural gas consumers(high transportation
costs)3. Fluctuation of gas absorption, depends on industrial growth and other substitute energy prices
such as oil and coal4. Growth of gas consumers has been stagnant in recent years
UPSTREAM
DOWNSTREAM
OUR CONDITION

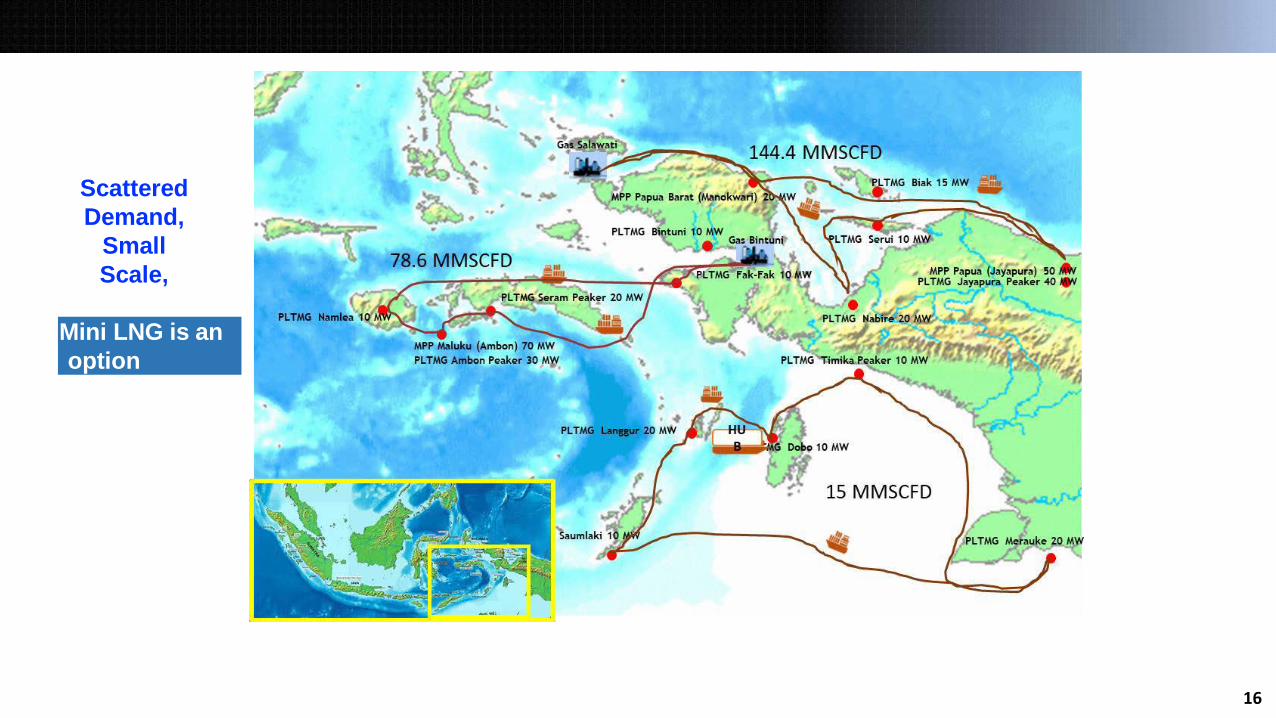
Indonesia’s existing infrastructure is mostly located in Western Indonesia Due to geographical conditions in Eastern Indonesia (deep sea and scattered
demand in remote areas), LNG is the preferred mode of energy to be utilized
15
INDONESIA’S GAS INFRASTRUCTURE ROADMAP
Ditjen MigasESDM Juni 2018

EXISTING
ROADMAP2016 – 2030
Natural Gas Infrastructur Existing & Planning
1010
KEBUTUHAN INVESTASI(Miliar USD)
Pipa12
Liquefaction25.6
SPBG +CNG1.93
TOTAL48.2
Regasification6.1
Jargas2.2
LPG0.4
16
ScatteredDemand,
SmallScale,
Mini LNG is anoption
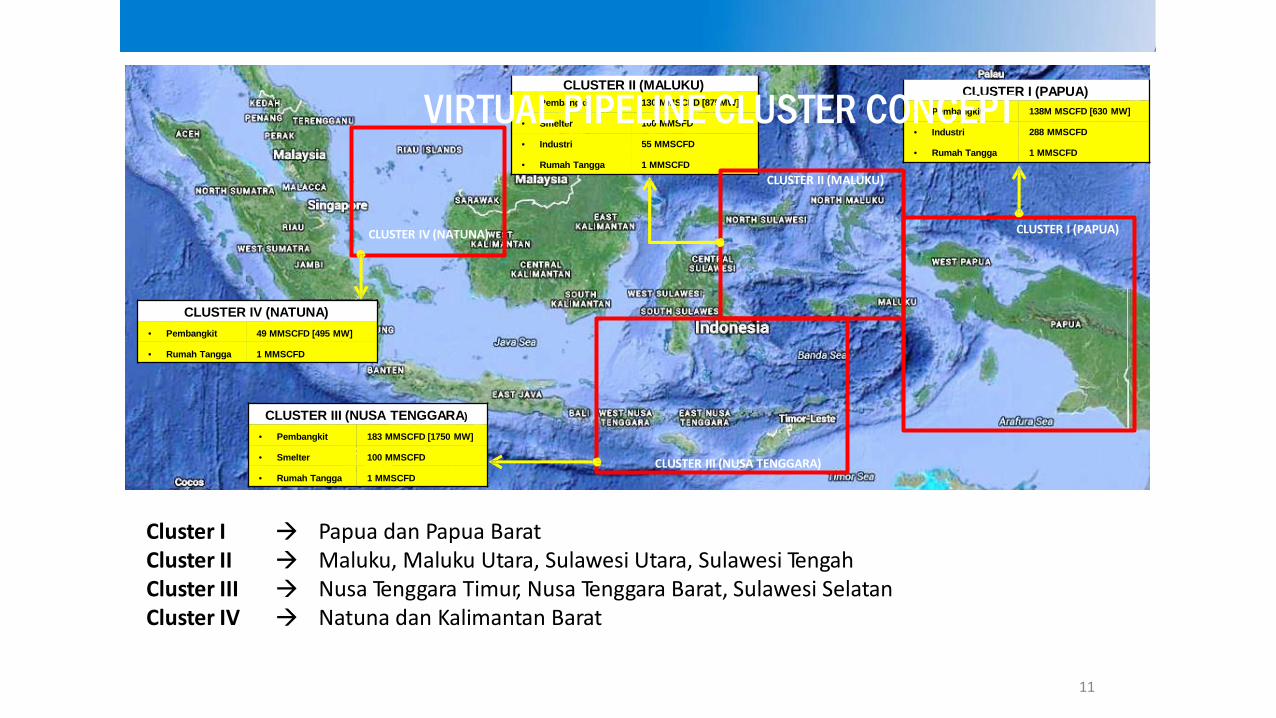
CLUSTER II (MALUKU)• Pembangkit 130 MMSCFD [875MW]
• Smelter 100 MMSFD
• Industri 55 MMSCFD
• Rumah Tangga 1 MMSCFD
CLUSTER I (PAPUA)
CLUSTER II (MALUKU)
CLUSTER III (NUSA TENGGARA)
CLUSTER IV (NATUNA)
CLUSTER I (PAPUA)• Pembangkit 138M MSCFD [630 MW]
• Industri 288 MMSCFD
• Rumah Tangga 1 MMSCFD
CLUSTER III (NUSA TENGGARA)
• Pembangkit 183 MMSCFD [1750 MW]
• Smelter 100 MMSCFD
• Rumah Tangga 1 MMSCFD
CLUSTER IV (NATUNA)• Pembangkit 49 MMSCFD [495 MW]
• Rumah Tangga 1 MMSCFD
VIRTUAL PIPELINE CLUSTER CONCEPT
1111
Cluster I Papua dan Papua BaratCluster II Maluku, Maluku Utara, Sulawesi Utara, Sulawesi TengahCluster III Nusa Tenggara Timur, Nusa Tenggara Barat, Sulawesi SelatanCluster IV Natuna dan Kalimantan Barat
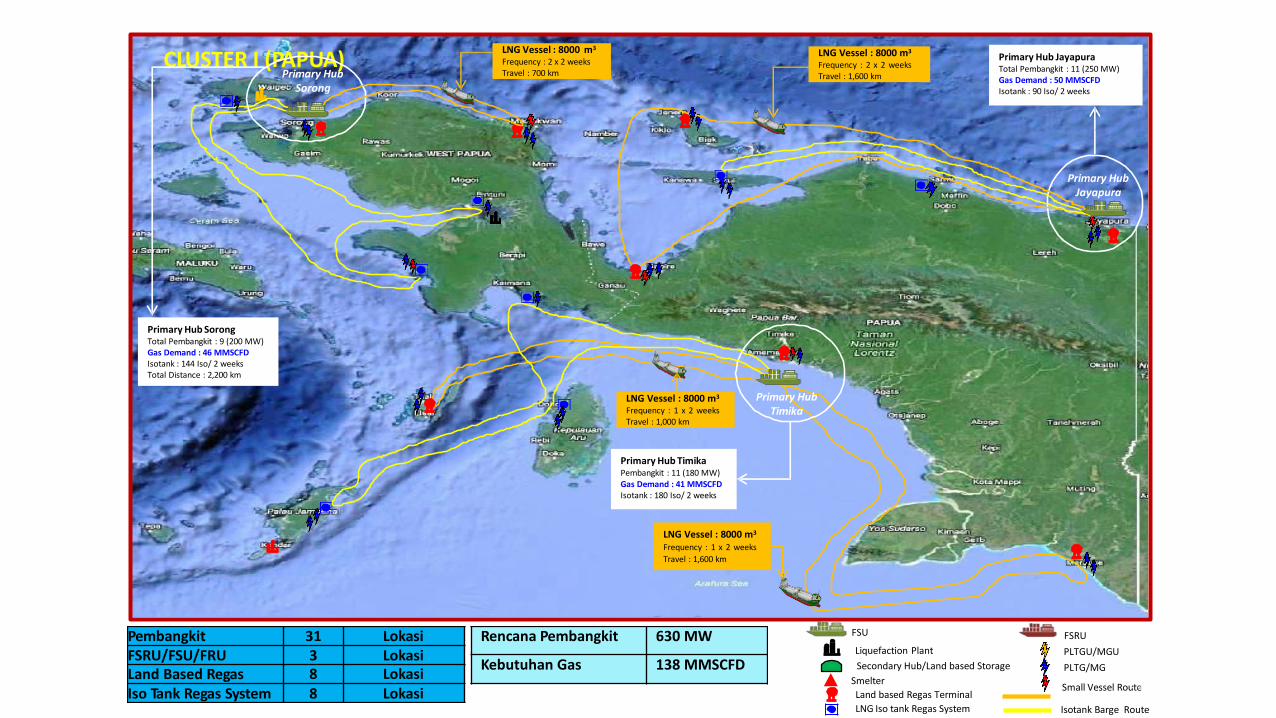
Primary HubSorong
CLUSTER I (PAPUA)
Primary HubJayapura
Primary Hub JayapuraTotal Pembangkit : 11 (250 MW)Gas Demand : 50 MMSCFDIsotank : 90 Iso/ 2 weeks
LNG Vessel : 8000 m3
Frequency : 2 x 2 weeksTravel : 1,600 km
Primary Hub SorongTotal Pembangkit : 9 (200 MW)Gas Demand : 46 MMSCFDIsotank : 144 Iso/ 2 weeksTotal Distance : 2,200 km
Primary Hub TimikaPembangkit : 11 (180 MW)Gas Demand : 41 MMSCFDIsotank : 180 Iso/ 2 weeks
LNG Vessel : 8000 m3
Frequency : 2 x 2 weeksTravel : 700 km
LNG Vessel : 8000 m3
Frequency : 1 x 2 weeksTravel : 1,600 km
LNG Vessel : 8000 m3
Frequency : 1 x 2 weeksTravel : 1,000 km
Primary HubTimika
FSU
Liquefaction PlantSecondary Hub/Land based Storage
SmelterLand based Regas TerminalLNG Iso tank Regas System
FSRUPLTGU/MGUPLTG/MG
Small Vessel Rou1te2Isotank Barge Route
Pembangkit 31 Lokasi Rencana Pembangkit 630 MWFSRU/FSU/FRU 3 Lokasi Kebutuhan Gas 138 MMSCFDLand Based Regas 8 LokasiIso Tank Regas System 8 Lokasi

CLUSTER II (MALUKU)
Primary HubMaba
Primary Hub AmbonPembangkit : 9 Plant (200 MW)Gas Demand : 32 MMSCFDIsotank : 255 EA / 2 weeks
Primary Hub MabaPembangkit : 12 (225 MW)Gas Demand : 147 MMSCFDSmelter : 1 Plant (100 MMSCFD)Isotank : 198 EA / 2 weeks
Primary Hub ManadoPembangkit : 3 (450 MW)Gas Demand : 46 MMSCFDIsotank : N/A
LNG Vessel : 8000 m3
Frequency : 1 x 2 weeksTravel : 580 km
Primary HubManado
LNG Vessel : 8000 m3
Frequency : 1 x 2 weeksTravel : 1, 000km
Primary HubAmbon
FSRUPLTGU/MGUPLTG/MG
Liquefaction PlantSecondary Hub/Land based Storage
SmelterLand based Regas TerminalLNG Iso tank Regas System
MP1P3
Small Vessel Rou1te3Isotank Barge Route
Rencana Pembangkit
Kebutuhan Gas
875 MW
130 MMSCFD
Kebutuhan Gas Smelter 100 MMSCFD
Pembangkit 24 LocationFSRU/FSU/FRU 3 LocationLand Based Regas 5 LocationIso Tank Regas System 10 Location
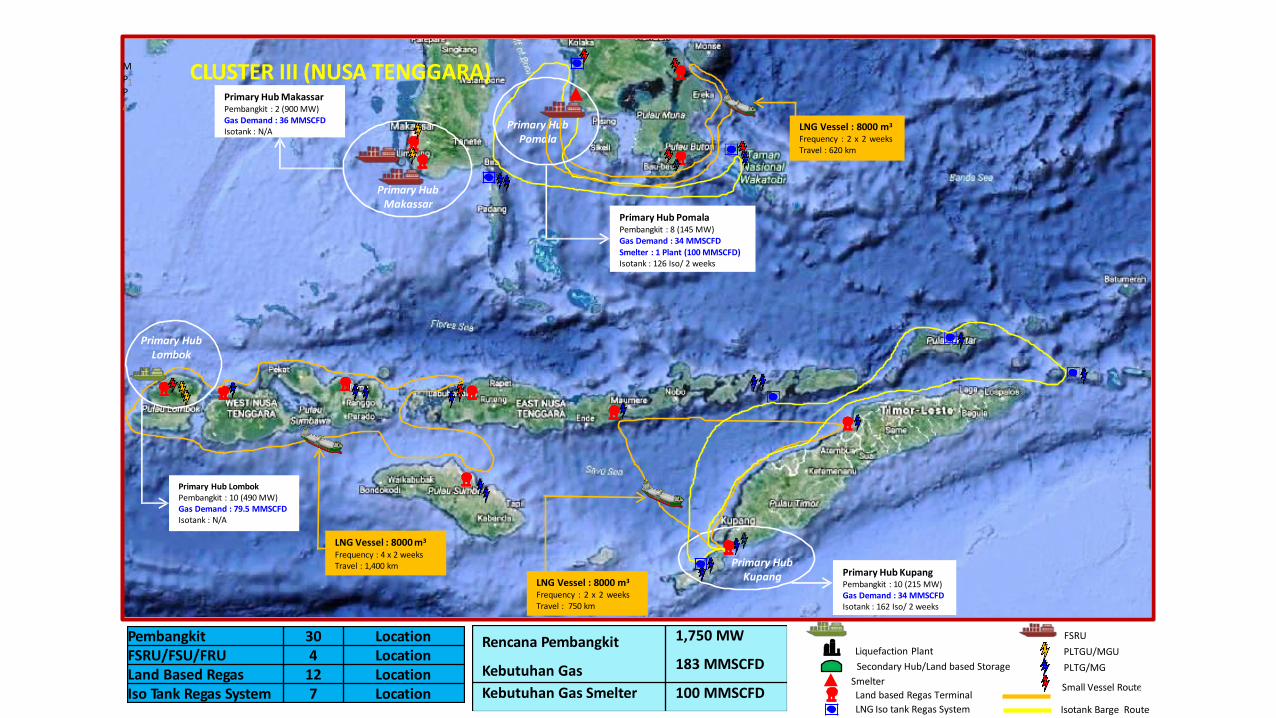
CLUSTER III (NUSA TENGGARA)
Primary HubMakassar
Primary HubLombok
Primary HubPomala
Primary HubKupang
Primary Hub MakassarPembangkit : 2 (900 MW)Gas Demand : 36 MMSCFDIsotank : N/A
Primary Hub KupangPembangkit : 10 (215 MW)Gas Demand : 34 MMSCFDIsotank : 162 Iso/ 2 weeks
Primary Hub PomalaPembangkit : 8 (145 MW)Gas Demand : 34 MMSCFDSmelter : 1 Plant (100 MMSCFD)Isotank : 126 Iso/ 2 weeks
Primary Hub LombokPembangkit : 10 (490 MW)Gas Demand : 79.5 MMSCFDIsotank : N/A
LNG Vessel : 8000 m3
Frequency : 2 x 2 weeksTravel : 620 km
LNG Vessel : 8000 m3
Frequency : 2 x 2 weeksTravel : 750 km
LNG Vessel : 8000 m3
Frequency : 4 x 2 weeksTravel : 1,400 km
FSRUPLTGU/MGUPLTG/MG
Liquefaction PlantSecondary Hub/Land based Storage
SmelterLand based Regas TerminalLNG Iso tank Regas System
MP1P4
Small Vessel Rou1te4Isotank Barge Route
Pembangkit 30 LocationFSRU/FSU/FRU 4 LocationLand Based Regas 12 LocationIso Tank Regas System 7 Location
Rencana Pembangkit
Kebutuhan Gas
1,750 MW
183 MMSCFD
Kebutuhan Gas Smelter 100 MMSCFD

CLUSTER IV (NATUNA)
Primary HubPontianak
Primary Hub PontianakPembangkit : 5 (495 MW)Gas Demand : 49 MMSCFD
LNG Vessel : 8000 m3
Frequency : 1 x 2 weeksTravel : 475 km
FSRU PLTGU/MGU PLTG/MG MP1P 5
Liquefaction PlantSecondary Hub/Land based Storage
SmelterLand based Regas TerminalLNG Iso tank Regas System
Small Vessel Rou1te5Isotank Barge Route
Pembangkit 5 Location Rencana Pembangkit 495 MWFSRU/FSU/FRU 1 Location Kebutuhan Gas 49 MMSCFDLand Based Regas 1 LocationIso Tank Regas System - Location

6
Based on Indonesian Regulation*(referring to Marine Safety Committee 95,
International Marine Organization):Sulphur Content for marine fuel must not exceed 3,5% m/m** before
January 1st 2020 and 0,5% m/m after January 1st 2020
Existing Ships in Indonesia Existing Ports in Indonesia
LNG – Fueled Ship
Commercial PortsCommercial Shipping RoutePioneer Shipping Route
*) Transportation Ministerial Regulation No. 29 / 2014 about Maritime Environment Pollution Prevention
LNG for Marine Potential
LNG for Marine Transportation
**) m/m: microgram/mililiterKementerianESDM Republik Indonesia
Passenger Ship 535 Commercial Ports 112
Cargo Ship 20,346 Non-Commercial Ports 1,129
Fishing Ship 16,028 Special Purpose Terminals 1,045
Total 36,909 Total 2,289
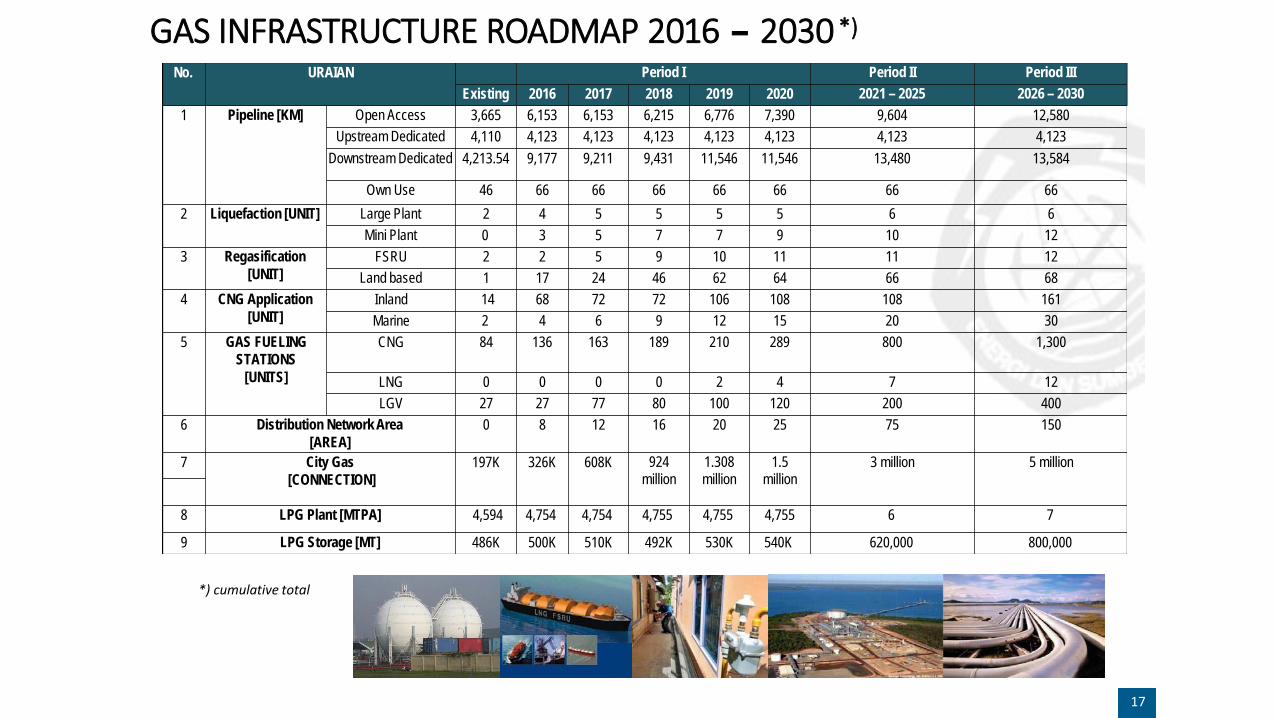
GAS INFRASTRUCTURE ROADMAP 2016 – 2030 *)
*) cumulative total
17
No. URAIAN Period I Period II Period IIIExisting 2016 2017 2018 2019 2020 2021 – 2025 2026 – 2030
1 Pipeline [KM] Open Access 3,665 6,153 6,153 6,215 6,776 7,390 9,604 12,580Upstream Dedicated 4,110 4,123 4,123 4,123 4,123 4,123 4,123 4,123
Downstream Dedicated 4,213.54 9,177 9,211 9,431 11,546 11,546 13,480 13,584
Own Use 46 66 66 66 66 66 66 662 Liquefaction [UNIT] Large Plant 2 4 5 5 5 5 6 6
Mini Plant 0 3 5 7 7 9 10 123 Regasification
[UNIT]FSRU 2 2 5 9 10 11 11 12
Land based 1 17 24 46 62 64 66 684 CNG Application
[UNIT]Inland 14 68 72 72 106 108 108 161Marine 2 4 6 9 12 15 20 30
5 GAS FUELINGSTATIONS
[UNITS]
CNG 84 136 163 189 210 289 800 1,300
LNG 0 0 0 0 2 4 7 12LGV 27 27 77 80 100 120 200 400
6 Distribution Network Area[AREA]
0 8 12 16 20 25 75 150
7 City Gas[CONNECTION]
197K 326K 608K 924million
1.308million
1.5million
3 million 5 million
8 LPG Plant [MTPA] 4,594 4,754 4,754 4,755 4,755 4,755 6 7
9 LPG Storage [MT] 486K 500K 510K 492K 530K 540K 620,000 800,000
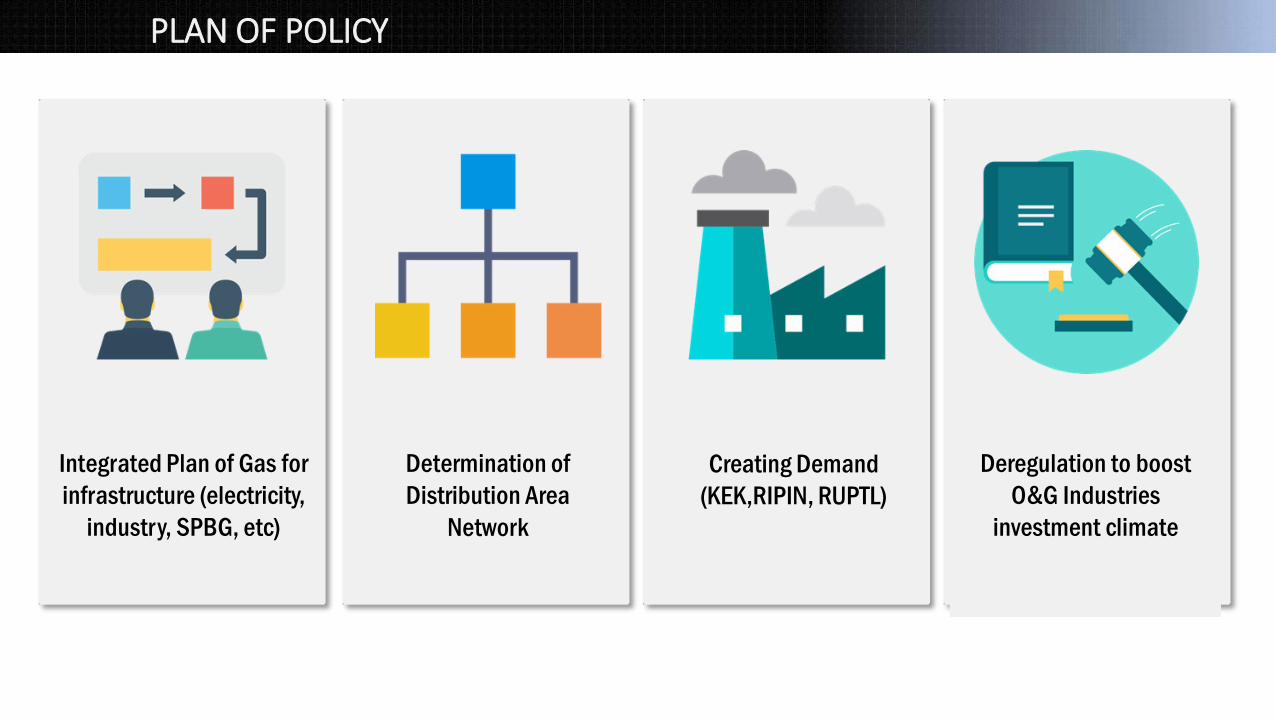
Creating Demand(KEK,RIPIN, RUPTL)
Deregulation to boostO&G Industries
investment climate
Integrated Plan of Gas forinfrastructure (electricity,
industry, SPBG, etc)
Determination ofDistribution Area
Network
PLAN OF POLICY

• Supply & demand gap for natural gas will start in 2019 in whichIndonesia will start importing gas.
• Until 2025, there will be surplus & deficit of LNG Cargo. This calls for astrategy to manage supply and demand of LNG.
• The gas infrastructure roadmap until 2030 needs US$ 48.2 billion ofinvestment.
• Virtual pipeline will supply gas using shipping routes in 4 clusters, inwhich key components for successful virtual pipeline implementation:State Owned Enterprise, PLN, experienced companies, & local content.
• Current challenge: formulating gas prices to stimulate economicgrowth.
• Acceleration of regulatory reform is currently under progress to increaseinvestment attractiveness, simplify permitting processes & promotesafety.
18
CHALLENGE OF POLICY

42
Envolving employees to training, courses & seminars outside the company Envolving employees to international training courses , seminars & fairs
(e.g. jccp, ADIPEC and etc.), Scholarship for Employees which is cooperate with University in domestic
and abroad
HRD Programs and Technical CooperationOur HRD Programs

43
• Keep Maintain recruiting and training our Human Resources
“Through this meeting / course, we hope for good cooperation established andmore staff assistance training program from JCCP”
conduct appropriate training for any level tittle of employee in the DirectorateGeneral Oil and Gas and dealing with performance issues and helping to managepeople so that people and the organization are performing at maximum capabilityin highly fulfilling manner
Providing training and development opportunities to improve employees’ skillswill be achieved morale, productivity, performance and maximaze results
Key Agenda with JCCP Cooperation

44
Technical Training
Structural Training
General Training
Functional Training
Competency
Atitude
TYPE OF TRAINING
Programs are expected from JCCPgroup of training programs which we expect establish according to our human resourcesbackground

-どうもありがとうございました
- Dōmo arigatōgozaimashita–- Terima Kasih -- Thank You –www.migas.esdm.go.id

2018年7月25日プレゼンの様子@JCCP