Embed Size (px)
Citation preview

Ecodesign Preparatory Study (Directive 2009/125/EC)
ENTR Lot 6: Air-conditioning and ventilation systems
Contract No. ENTR / 2009/ 035/ LOT6/ SI2.549494Service Contract to European Commission, DG EnterpriseService Contract to European Commission, DG Enterprise
Sustainable Industrial Policy –Building on the Ecodesign Directive – Energy‐Using Product Group Analysis/2
Main contractor: Armines (FR)Consortium:
Armines (FR), Air Conditioning SystemsVHK (NL), Ventilation Systems
1BRE (UK), Market Analysis Support

ENTR LOT 6 : Air Conditioning productsTasks 1 to 5
30 September 2011
2nd St k h ld ti2nd Stakeholder meeting30 Sept 2011
P. Rivière, Armines
2

Task 1 – Product definition, standards and legislation
3

Air conditioning systems Standards Legislation
Cooling basics
1)Cooling processIn general convective or convective + radiative heat– In general, convective or convective + radiative heattransfer from a cold fluid via a heat echanger• Refrigeration cycle• Vapor compression• Absorption cycle• Direct use of cold water
– Evaporative and desiccant cooling• Evaporative cooling• Desiccant coolinges cca t coo g
2)Main type = refrigeration cycle
4

Air conditioning systems Standards Legislation
Systems and products: main system types
All air systems, made of• a chilled water plant an AHU the water loop that feeds the cooling coil of the• a chilled water plant, an AHU, the water loop that feeds the cooling coil of the
AHU, ducts for air distribution, terminal units that can supply complementary heating/cooling and possibly additional functions.
Water Air Refrigerant
Expansion
LEGENDAHU
Cooling tower
Cooling towerCondenser Evaporator
Expansion valve Fan Compressor
Building with
diffusers
• Constant air volume (CAV) Vs Variable air volume (VAV)• Zoning (terminal reheat dual duct )
Water cooled chiller Exhaust air
5
• Zoning (terminal reheat, dual duct, ...)

Air conditioning systems Standards Legislation
Systems and products: main system types
Water based systems, made of• a chilled water plant an AHU for ventilation the water loop that feeds the• a chilled water plant, an AHU for ventilation, the water loop that feeds the
terminal units (and potentially the cooling coil of the AHU), ducts for air distribution, terminal water to air units that can supply heating/cooling and possibly additional functions (like dehumidification and air filtration).
Terminal units Differences depending on terminal unit typeTerminal units
• Fan coil
• Cold beams
• Cooled surfaces (radiative)
Air cooled chiller Building
( )
• Water to air package air conditioners
6

Air conditioning systems Standards Legislation
Systems and products: main system types
DX systems• Direct expansion air conditioners no secondary fluid as water for water• Direct expansion air conditioners, no secondary fluid as water for water
based units between the refrigerant and the cooled air. Package (includes rooftops), split, multi‐split, VRF systems
Split / multisplitsystem
VRF system with heat recovery
P kPackage- w/wo ventilation
7
Air conditioning systems Standards Legislation
Products in ENTR Lot 6 scope
1. Air conditioners > 12 kW and air conditioning condensing units
Package, split and multi split air conditioner [air‐to‐air > 12 kW, water‐to‐air, evaporatively cooled] and positive temperature air condensing units [air‐cooled, water‐cooled, evaporatively‐cooled], VRF systems (centralized air conditioning systems with refrigerant fluid as the main media to circulate and extract heat from the building) [air‐to‐air and water‐to‐air]to‐air and water‐to‐air]
2. Chillers for air conditioning applications [air‐to‐water, water‐to‐water, evaporatively‐cooled]cooled]
3. Terminal units to extract heat from the space to be conditioned
Fan coilsFan coils
4. Heat rejection units means from the cooling system
Cooling towers Dry cooler
8
Cooling towers, Dry cooler

Air conditioning systems Standards Legislation
Scope limits
1. Cooling generators
Air conditioners < 12 kW, low temperature chillers and refrigeration condensing units
2. AHU and more generally ventilation function of air conditioning products
AHU are studied in ENTR Lot 6 on the ventilation part
BUT cooling systems integrated in AHU are included
3. Motors, fans, circulators, ,
Circulators already covered in ENER Lot 11 study and part of them by regulation
Fans and motors partly covered by regulation
4. Heating function
Heating function of reversible chiller, ENER Lot 1
Heating function of reversible air conditioners, ENER Lot 21
9
Heating function of reversible air conditioners, ENER Lot 21

Air conditioning systems Standards Legislation
Comments regarding the scope
1. Comments regarding the AHU briefing
Main lines
‐ AHU may supply cooling but this requires a cooling(heating) system
‐ The ventilation/cooling(heating) functions are treated separately (as is done today)
‐ AHU are the subject of the ventilation part of ENTR Lot 6
‐ Cooling generators in in AHU included here
2. Refrigeration and process chillers
Latest comments received: process chillers (ie other than AC) should not be treated herebut in ENTR Lot 1
Main reason – not the same operating conditions
10

Air conditioning systems Standards Legislation
Categories and performance parameters
Cooling generators– Categories
– Performance parameters• Cooling (heating) capacity
• Electricity consumption or EER Eurovent• Sink and source type
• W/wo fan pressure available (or circulator included or not)
• Electricity consumption or EER, EuroventFCEER (FCCOP)
• Noise
H t j ti– Performance parameters: • cooling (heating) capacity and
SHR
Heat rejection– Categories
• Dry cooler, closed/open cooling tower,• EER, SEER, COP, SCOP …
• TEWI
• Noise
Dry cooler, closed/open cooling tower, evaporatively‐cooled dry cooler
– Performance parameters• Cooling capacity
Fan coils– Categories
d ( 0 6 )
• Cooling capacity
• Electricity consumption or EER
• Noise
11
• Ducted or not (50 or 65 Pa)
• reversibility

Air conditioning systems Standards Legislation
Main standards – cooling generators• Electric- Full load EN 14511, Part load prEN14825, Evaporatively-cooled condenser EN 15218- Sound EN 12102
Safety and environmental requirements EN 378- Safety and environmental requirements EN 378Issues- 14825 Part load of multi-split / VRF systems- 14825 Adaptation of low power modes as for air conditioners < 12 kW ? p p- 14825 Adaptation of climatic/load curve data for larger generators ?- 14825 Part load conditions missing for evaporatively-cooled condensers and dry coolers- Missing information for EPBD application- No standard regarding condensing units for AHU
• Engine driven compressor- No standard identified.
• Gas firedEN 12309 2009
12
EN 12309: 2009Issues: missing temperature levels, part load testing and conditions, electric auxiliaries
(incl head losses for heat exchangers as in EN14511), sound power

Air conditioning systems Standards Legislation
Main standards – terminal units
• Fan coils Testing and rating EN 1397:1998
Issues: - not completely in line with industry standards (e.g Eurovent –ducted / non ducted), speed setting, could be refreshed- sound power ?
• Chilled ceilings Testing and rating EN 14240:2004
• Chilled beams Testing and rating EN 14518:2005
• Active chilled beams Testing and rating EN 15116:2008 • Active chilled beams Testing and rating EN 15116:2008
• Floor cooling Testing and rating EN 1264:2009
13

Air conditioning systems Standards Legislation
Main standards – heat rejection
• Dry cooler Testing and rating EN 1048:1998Issues: - Seasonal performance standard could be useful to show gains of better part load
control- Sound power
• Cooling towers– EN 14705:2005 - Measurement and evaluation of thermal performances of
t li twet cooling towers– EN 13741:2004 - Thermal performance acceptance testing of mechanical
draught series wet cooling towers
Issues: Issues: - Fan power not included- Rating conditions for AC full load and part load not defined- Seasonal performance standard could be useful to show gains of better part load
14
control- Sound power

Air conditioning systems Standards Legislation
Product performance requirements
• Most requirements for electric cooling generatorsBoth f ll load and part load req irements– Both full load and part load requirements
– Air cooled and water cooled (separated requirements)
– Australia included low power modes for AC up to 65 kWp p
• Requirements also forRequirements also for– Absorption (gas or steam) / lower levels than for electric ones
– Engine air conditioners (UK)
– Heat rejection (US) – at design cooling conditions
15• No requirements for fan coils

Air conditioning systems Standards Legislation
Product performance requirements – Air conditioners EER
3,2
3,4
3
MEPS Australia
MEPS France
MEPS UK
2,6
2,8
EER kW
/kW MEPS China non ducted
MEPS China ducted
MEPS USA Split ‐ Pack CO ‐ VRF
2,4
,E
MEPS USA Split ‐ Pack Rev ‐ VRF HR
MEPS USA SVP
MEPS Japan Split Wall
l h
2
2,2MEPS Japan Split other
MEPS Japan Ducted
MEPS Japan Multi‐split
16
2
0 50 100 150 200 250
Cooling capacity kW

Air conditioning systems Standards Legislation
Product performance requirements – chillers
• Air cooled chillers IPLV
4,80
5,00
4 00
4,20
4,40
4,60
/590
IPLV
MEPS USA & CANADA
3,40
3,60
3,80
4,00
AHRI 550/
MEPS Australia
MEPS Australia future
3,00
3,20
0 500 1000 1500 2000
C li i (k )
17
Cooling capacity (kW)

Air conditioning systems Standards Legislation
Product performance requirements –water cooled chillers IPLV
6,5 MEPS UK
5,5
6MEPS Taipei Vol comp
Label China grade 1
Label China grade 5 (MEPS)
L b l E t A
4,5
5
ER
Label Eurovent A
Label Eurovent G
MEPS Australia
MEPS Australia futur path A
3 5
4
,5E MEPS Australia futur path A
MEPS Australia futur path B
MEPS USA & CAN pos displ Path A
MEPS USA & CAN pos displ Path B
3
3,5 MEPS USA & CAN pos displ Path B
MEPS USA & CAN cent Path A
MEPS USA & CAN cent Path B
MEPS Taipei Cent comp
18
2,5
0 500 1000 1500 2000
Cooling capacity (kW)
MEPS Taipei Cent comp
MEPS France
Air conditioning systems Standards Legislation
Product performance requirements
• Heat rejection units: only in the USA
ASHRAE 90.1:2010 Cooling towers MEPS gpm/hp min kWcool/kWelec min
Open‐circuit cooling towersOpen circuit cooling towers
35 °C entering water, 29.4 °C leaving water, 23.9 °C entering wet bulbPropeller or axial fan open‐circuit cooling
tower 38,2 75,0
Centrifugal fan open‐circuit cooling towers 20 39,3
Closed‐circuit cooling towers
38.9 °C entering water, 32.2 °C leaving water, 23.9 °C entering wet bulbPropeller or axial fan closed‐circuit cooling
tower 14 33,0
Centrifugal fan closed‐circuit cooling towers 7 16,5
19

Task 2 – Economic and Market AnalysisTask 2 – Economic and Market Analysis
20

Contents
• Overview• Production, imports, exports• Modelling• Overview of stock and sales of products
• Market data per product classChillers• Sales, technology, characteristics, stock, future stock
Air‐conditioners• Rooftops, single‐splits, multisplits, VRFs
Fan‐coil units
• Costs• Country‐scale data concerning chillers and fan‐coil units
P i li f h d
21
• Price lists for other products

Production, Imports and Exports
– PRODCOM data : too aggregated → not very informative
– Chillers• Italy and France significant exporters• Other countries largely importers
– Rooftop units– Rooftop units• Several manufacturers predominantly supply national markets• Production is divided between European and overseas manufacturers (USA)
– Single split, multisplit and VRF systems• Same main manufacturers• Products are mainly manufactured outside Europe
– Fan‐coil units• Mainly domestic production• Except Italy, which is also an exporter
22
• Except Germany and, to a lesser degree, Spain, which are also significant importers

Modelling
Italy Chiller Sales: first-time and replacement
30000
35000
40000
• Data sources– Eurovent EU‐27 product sales data
– BSRIA market research reports for 6
10000
15000
20000
25000
30000countries
– BSRIA historical product sales
– Other data sources (national i ti h t )
0
5000
1992
1993
1994
1995
1996
1997
1998
1999
2000
2001
2002
2003
2004
2005
2006
2007
2008
2009
model first-timesales actual model total sales
associations, research centres …)
• Modelling details– Distinction drawn between first‐time
and replacement sales
– Typical product lifes : known orsupposed
• Work based on sales data, usually from 1992 onwards
supposed
– 10% of sales : countries with no availablehistorical sales figures
– 2010 sales adjusted from 2008 sales
• Market modelling is calibrated to sales data. The market diffusion model is the
Bass model
23
based on Eurostat forecastsBass model.

Sales of cooling generators
Market share of Cooling 2008
6%
3%
14%
6%
ChillerDucted splitsSingle splits
59%
4%
14%Multi splitsVRFRooftop
• Chillers account for 60% of the cooling capacity sold. About 18.9 GW
• Chillers with process cooling as the main function are not included• Chillers with process cooling as the main function are not included
• VRF systems and non‐ducted single‐split systems > 12kW are also significant. About 2.6 GW each
• Rooftop units : 1.1 GW
• Ducted split systems : 0.8 GW
24
• Multisplit systems : 0.6 GW

Stock of cooling generators
• Continuous growth of the stock
Estimated stock of central air conditioning products (cooling capacity)
400
500
– Continued new installations of chiller‐based systems
100
200
300
400
GW
– Important growth in VRF systems
– Market saturation in 2025 for products
01990 1995 2000 2005 2010 2015 2020 2025
VRF Multisplit Ducted split > 12 kWSingle split >12 kW Rooftop Chillers
Market saturation in 2025 for products other than chillers and VRF systems
– Large number of split systems because
Estimated stock of central air conditioning products (number)
10.00
of small cooling capacity
2.00
4.00
6.00
8.00
Mill
ions
25
0.001990 1995 2000 2005 2010 2015 2020 2025
VRF Multisplit Ducted split > 12 kWSingle split >12 kW Rooftop Chillers
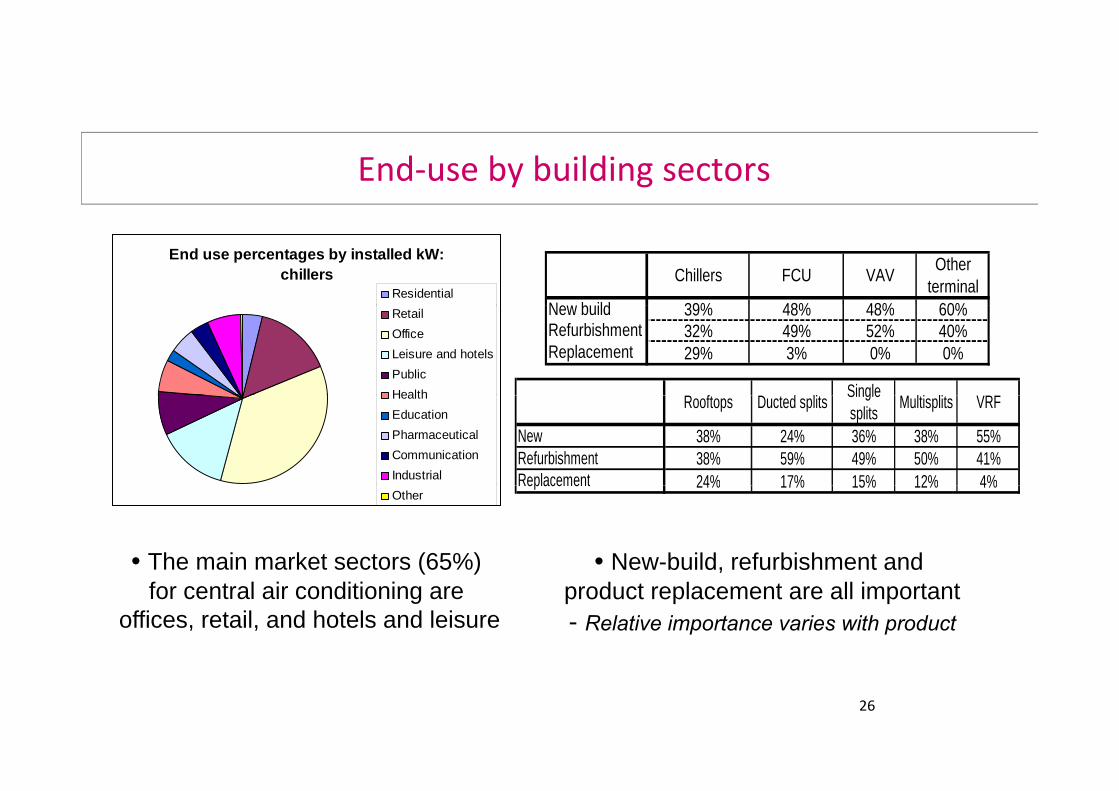
End‐use by building sectors
End use percentages by installed kW: chillers
ResidentialChillers FCU VAV Other
terminalNew build 39% 48% 48% 60%Retail
OfficeLeisure and hotelsPublicHealth
New build 39% 48% 48% 60%Refurbishment 32% 49% 52% 40%Replacement 29% 3% 0% 0%
R ft D t d lit Single M lti lit VRFHealthEducationPharmaceuticalCommunicationIndustrial
Rooftops Ducted splits Single splits Multisplits VRF
New 38% 24% 36% 38% 55%Refurbishment 38% 59% 49% 50% 41%Replacement 24% 17% 15% 12% 4%
Other
• The main market sectors (65%) • New-build, refurbishment and
Replacement 24% 17% 15% 12% 4%
for central air conditioning are offices, retail, and hotels and leisure
product replacement are all important- Relative importance varies with product
26

Reversibility of products
Product Percentage reversible (by number)
Chillers 47%16% by capacity
Ducted single split systemsDucted single split systems > 12 kW 82%
Non-ducted single split systems > 12 kW 66%
Multisplit systems 64%Multisplit systems 64%VRF systems 88% (includes products with heat recovery)Rooftop units 62% (an additional 11% have gas heating function)
• ChillersChillers– More than 50% of small capacity products (< 50 kW) are reversible
– Reversible products are mainly air‐cooled chillers (if not : ground‐source heat pumps)
• Air‐conditioners– Percentage of reversible products by capacity sold should be close to the figures by number of
units sold
27

Chiller prices
• Available dataChiller Price Euro/kW
200
250
– Average product prices for 6 countries (market research reports) + several price lists
50
100
150
– Decrease in price with an increase in cooling capacity
0France Germany Greece Italy Spain UK
< 100 kW 100 to 350 kW > 350 kW
– Cheaper low capacity products in France in Italy
– Water‐cooled chillers 30% to 40% cheaper than air‐cooled chillers
28

Required information and feedback
• Market information – Air‐conditioning condensing units
– Packaged air conditioners other than rooftop unitsPackaged air conditioners other than rooftop units
– Dry coolers / Evaporatively‐cooled dry coolers
– Cooling towers for air conditioning
• Typical product and system pricesM i li fi fi– More price lists to refine current figures
29

Task 3 – User requirementsq
30

IMPACT OF INFORMATION USE PHASE : IMPACTING PARAMETERS END‐OF‐LIFE BEHAVIOUR
Contents
• Impact of information – Choice of a product• Key role of the building manager• Technical data from manufacturers• Noise
• Use phase : impacting parameters• Sizing• Climate• Controls
l d i• Faults and maintenance• Building types• Other parameters
• End‐of‐life behaviour• Decommissioning and recycling• Refrigerant collection
31
• Refrigerant collection

USE PHASE : MAIN PARAMETERS END‐OF‐LIFE BEHAVIOURIMPACT OF INFORMATION
Building manager
• Main concern : initial capital costs (equipment + installation)
• Lack of information on costs vs. benefits
• Product lifetime → too long time horizon : payback time is minimized
• Building sold or rented to another company/individual : use‐phase costs of negligible importance
• Small/medium companies : investments must be minimized
• Only mature investors from large companies / public sector have a real interest in innovative products if convinced of a cost‐benefit optimizationinnovative products if convinced of a cost benefit optimization
→ Most of the time, energy efficiency is not a driving factor if a premium must be paid for itpaid for it
→ Large‐scale projects with larger cooling capacities benefit from a better cost‐benefit optimization
32

END‐OF‐LIFE BEHAVIOURIMPACT OF INFORMATION USE PHASE : MAIN PARAMETERS
Technical data from manufacturers
• A large amount of data (off design and part‐load performances) is required butoften not directly provided
• The certification of manufacturers’ data software is not yet fully standardized
• There is a lack of information on the decrease in performance due to differentfault types
• The controls available to the end‐users are poorly understood, concerning themeaning of interface symbols and proper control strategies
→ Pushing for standardization of certified data sets could be an output of ENTRLot 6
33

END‐OF‐LIFE BEHAVIOURIMPACT OF INFORMATION USE PHASE : MAIN PARAMETERS
Noise
• No correlation between the standard noise level of a product and its standard efficiency (here for terminal units)
• End‐users focus more on the noise emitted by air conditioning products in smaller rooms (small offices vs. large open plan offices)
• Greater impact on the decision‐making process in buildings where end‐users can express their concerns → smaller buildings, smaller needed cooling capacities
34
g , g p

END‐OF‐LIFE BEHAVIOURIMPACT OF INFORMATION USE PHASE : MAIN PARAMETERS
Sizing
• Most systems are oversized. “Rules of thumb” are still widespread
– More time spent at lower capacity ratios and so poorer energy efficiency
– Poorer thermal comfort because of increased cycling → risk of lower indoorPoorer thermal comfort because of increased cycling → risk of lower indoortemperature setpoints to ensure comfort
– Higher initial capital costs and operational costs during the use phase
Si lifi d f th d d t l l t li /h ti l d• Simplified reference methods are used to calculate cooling/heating loads
• Large‐scale projects with larger cooling capacities benefit from a bettercooling/heating load assessment and so system sizing
• Reversible products are generally sized on the basis of their cooling function.
• Heat pump function
– Backed by an additional heating system at low temperatures under coldac ed by a add t o a eat g syste at o te pe atu es u de co dclimates
– Only part of all the installed units are used in warm climates
35

END‐OF‐LIFE BEHAVIOURIMPACT OF INFORMATION USE PHASE : MAIN PARAMETERS
Heat recovery for reversible products
36

END‐OF‐LIFE BEHAVIOURIMPACT OF INFORMATION USE PHASE : MAIN PARAMETERS
Climate impact
• Heat island effect : a majority of Lot 6 products installed in densely populated urban areas
→ increased cooling loads and peak demand
• Local climate : parameter with the greatest impact on cooling/heating energy demand
g p
• Climate change : risk of consequently increased cooling loads and peak demand in 2025
→ i d li l d d d d h ti l d• Climate zones can be distinguished by degree
days 37
→ increased cooling load and decreased heating load

END‐OF‐LIFE BEHAVIOURUSE PHASE : MAIN PARAMETERSIMPACT OF INFORMATION
Degree days calculation
• Weather data taken from ASHRAE’s IWEC database
• More than one representative city per country when necessary• More than one representative city per country when necessary
• Sensible cooling degree days : Tbase = 15°C
• Latent cooling degree days : wbase = 0.0106 kgwater/kgair• Heating degree days : T = 15°C• Heating degree days : Tbase = 15 C
38

END‐OF‐LIFE BEHAVIOURUSE PHASE : MAIN PARAMETERSIMPACT OF INFORMATION
Control system
• Common use : constant indoor setpoint temperature over a pre‐defined daily time period (IDA‐C3 in EN 15232:2008)
• Centralized controls believed to be the common situation in buildings equipped with Lot 6 products• Centralized controls believed to be the common situation in buildings equipped with Lot 6 products
• Local controls might be only used in specific cases (small/medium capacity terminal units that cool small rooms)
• Cooling setpoint : generally between 22°C and 24°C but can be as low as 20°C
• Heating setpoint : generally between 20°C and 22°C
39

END‐OF‐LIFE BEHAVIOURUSE PHASE : MAIN PARAMETERSIMPACT OF INFORMATION
Faults and maintenance• Faults
– Soft faults : cause a degradation in performance but allow continued operation of the product
→ direct impact on energy efficiency ≠ hard failures
– Examples • Refrigerant leakage/undercharge → most frequent soft fault
• Condenser/Evaporator fouling on the air side
• Reduced condenser/evaporator water flowReduced condenser/evaporator water flow
→ No sufficient statistical data for base‐case modelling in Task 4
• Maintenance issues– Proper maintenance is only cost‐effective in specific conditions (warm climates)
– Information provided for maintenance is only indicative Correct practices are not compulsoryInformation provided for maintenance is only indicative. Correct practices are not compulsory
– Main maintenance tasks reported by the AREA are replacement of components and refrigerant charge checking → no apparent focus on the energy efficiency of the product
→ A main technical improvement : Fault Detection and Diagnosis electronic systems40

END‐OF‐LIFE BEHAVIOURUSE PHASE : MAIN PARAMETERSIMPACT OF INFORMATION
Building types
• Main building sectors using Lot 6 air conditioningproducts described in Task 2
• 8 typical buildings out of the 4 main building sectorsmodelled with a specific software
• Thermal characteristics of building envelopes,occupancy/equipment/lighting scenarios derived fromseveral modelling works at the study team’s disposal
• Air conditioning product in other building sectors (e.g.pharmaceutical, telecommunication) believed to bemainly related to the offices located in the correspondingbuildingsbuildings
41

END‐OF‐LIFE BEHAVIOURUSE PHASE : MAIN PARAMETERSIMPACT OF INFORMATION
Decommissioning and recycling
1400 kW centrifugal chiller 8.8 kW split-system
Mechanical contractorScrap value of equipment 80 € / ton x 7.34 ton = 590 € 80 € / ton x 0.12 ton = 9.6 €Disposal cost to contractor 405 € 3.2 €
Contractor net profit 155 € 6.4 €Scrap metal dealer
Value of unit’s metallic content 4370 € 78 €Scrap dealer cost 1260 € 21 €
Scrap dealer net profit 3110 € 57 €
• Products with high metallic contents (chillers, outdoor units of split/VRF systems, rooftop units) are easilyrecyclable
C d l i i i f i t ti l l l bl• Copper and aluminium pieces of equipment are particularly valuable.
• Large capacity units are more interesting to recycle than small capacity units
• Casings of terminal units (fan‐coil units, indoor units of split/VRF systems, chilled beams) are largely made ofplastics→ recycling issue
• Identifying the constituents of products is a main barrier to an improved recyclingde y g e co s ue s o p oduc s s a a ba e o a p o ed ecyc g
42

END‐OF‐LIFE BEHAVIOURUSE PHASE : MAIN PARAMETERSIMPACT OF INFORMATION
Refrigerant collectionCountry Number of known ODS destruction facilities in
operationAustria 1Belgium 2
Czech Republic 1Denmark 3E t i 1Estonia 1Finland 1France 2
Germany 7Hungary 5
Italy 12Netherlands 6Netherlands 6
Poland 1Slovakia 1
Spain 1Sweden 4
United Kingdom 5
• Refrigerant collected on site ≠ dedicated facility : increased risk of recovery losses
• Disposed air conditioning products might often be left outside buildings, then collected by ordinaryscrap metal recycling facilities→ refrigerant collection is uncertain
• Important discharged refrigerant shipment distances to destruction facilities : between 200 and 1000Important discharged refrigerant shipment distances to destruction facilities : between 200 and 1000km
• HFC refrigerants can fall under numerous restrictions for cross border treatment and transport
→ Some manufacturers are already developing refrigerant recovery machines
43

Questions ?
44

Task 4 – Base case definition
45

BASE‐CASES AND
ENERGY MODELLINGENVIRONMENTAL IMPACT LIFE CYCLE COSTS
Contents
• Base‐cases and energy modelling• Energy modelling methodology• Product repartitions in available statistical database• Base‐case technical characteristics• Refrigerant use
• Environmental impact• Life cycle analysis per base‐case producty y p p• EU‐total environmental impact
• Life cycle costsy• Methodology and deduced initial investment costs• Ecoreport results
46

BASE‐CASES AND
ENERGY MODELLINGENVIRONMENTAL IMPACT LIFE CYCLE COSTS
Energy modelling methodology (1/3)
• Main points
A first set of simulations is done on a building modelling software to derive thecooling/heating demand of 8 typical buildings under 3 typical climates (Task 3)
9 typical systems in cooling mode and 4 typical systems in heating mode are thensimulated on a second software. Each system is simulated in each typical building andunder each typical climate
E h i l d f b dEach system includes one or more type of base‐case product
The systems software has been programmed by the study team, on the basis ofi tifi l ith d b d t h t i tiscientific algorithms and base‐case product characteristics
A final step based on matrix calculations allows to derive the EU‐27 electricityconsumption of each base case product from the system simulation resultsconsumption of each base‐case product from the system simulation results
47

BASE‐CASES AND
ENERGY MODELLINGENVIRONMENTAL IMPACT LIFE CYCLE COSTS
Energy modelling methodology (2/3)
• Technical characteristics of the base‐case products :
Rating characteristics are determined from the analysis of existing database and EU marketg y gshares, when available (Task 2)
Full‐load characteristics of cooling generators are fitted from off‐design data sets displayed bysome main manufacturers Fitted products have nominal characteristics as close as possible tosome main manufacturers. Fitted products have nominal characteristics as close as possible tothe characteristics of the base‐case products
Part‐load characteristics of cooling generators are derived from technical catalogues oravailable database. Concerning chillers, they are calculated to meet the SEER of the base‐cases
The characteristics of other base‐case products and system components are deduced from theanalysis of the Eurovent database, technical catalogues or European standardsanalysis of the Eurovent database, technical catalogues or European standards
The study team chooses standard control strategies
48

BASE‐CASES AND
ENERGY MODELLINGENVIRONMENTAL IMPACT LIFE CYCLE COSTS
Energy modelling methodology (3/3)• EU‐27 electricity use computations for the different base‐case products :
System simulation outputs : for each product, Electricity Use per installed Cooling Capacity (EUCC)
Per typical building + climate→ Per typical building + climate
For products modelled in several different chiller‐based systems, average EU market shares of water‐based systems(Task 2) are used to weight‐average the electricity consumption of the products
For each product, links between building sectors and modelled typical buildings (Task 3 and Ventilation Task 4) allow toderive electricity consumptions per building sector, under each of the 3 modelled climates
For each product in each building sector, EUCC values are then derived per EU country on the basis of CDDs / HDDsestimated per country (Task 3)
Sales/Stock of installed capacities of chillers and DX‐systems per country and per building sector (Task 2) allow then to/ p y p y p g ( )calculate the total electricity consumption of the products per building sector, for each EU country
For each product, adding up electricity consumptions per country and per building sector allow to estimate a totalelectricity consumption for the EU‐27
49
electricity consumption for the EU 27
BASE‐CASES AND
ENERGY MODELLINGENVIRONMENTAL IMPACT LIFE CYCLE COSTS
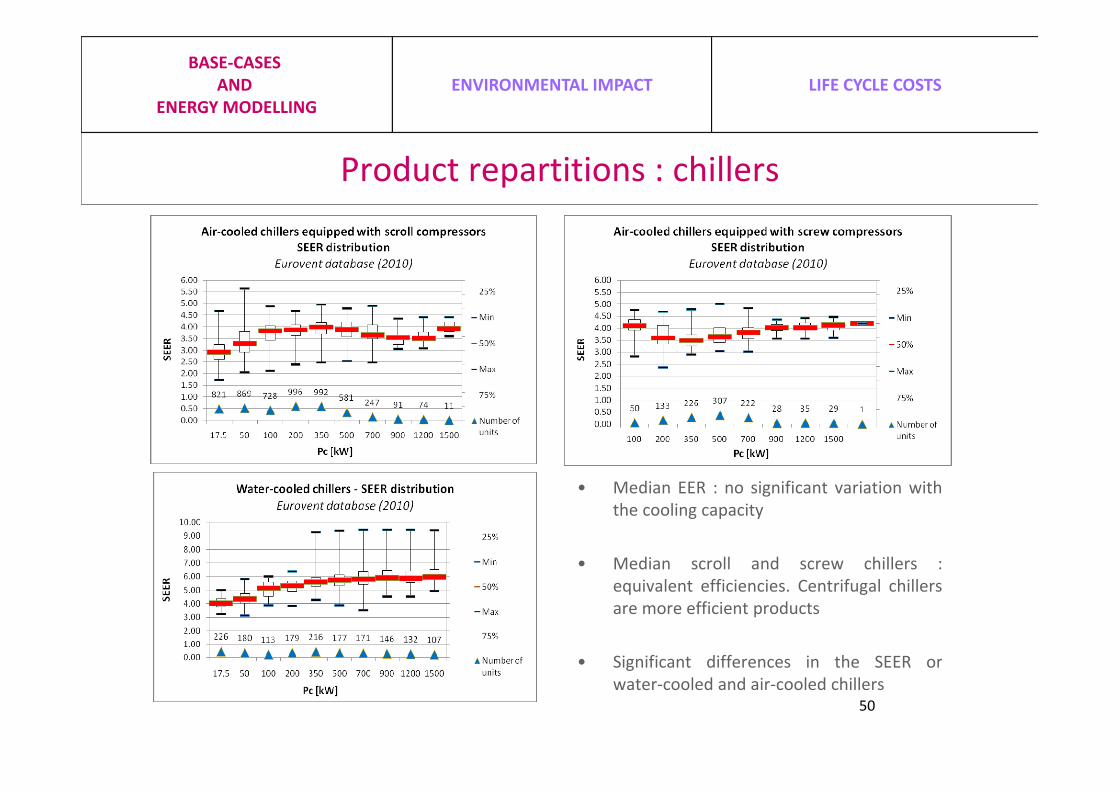
Product repartitions : chillers
• Median EER : no significant variation with• Median EER : no significant variation withthe cooling capacity
• Median scroll and screw chillers :equivalent efficiencies. Centrifugal chillersare more efficient products
• Significant differences in the SEER orSignificant differences in the SEER orwater‐cooled and air‐cooled chillers
50

BASE‐CASES AND
ENERGY MODELLINGENVIRONMENTAL IMPACT LIFE CYCLE COSTS
Product repartitions : DX systems
• Rooftop units : lack of statistical data on high capacity products
• Split systems : most products have a cooling capacity lower than 20 kW
N i ifi t EER diff b t lti lit d i l lit t• No significant EER difference between multisplit and single split systems
• VRF systems : homogeneous repartition of outdoor units. Great range of coolingcapacities but small differences in EER and part‐load characteristics
51

BASE‐CASES AND
ENERGY MODELLINGENVIRONMENTAL IMPACT LIFE CYCLE COSTS
Product repartitions : fan‐coil units
• Very large number of certified products (> 1000)
• No significant difference between 2‐pipes and 4‐pipes units
• A majority of certified products with small cooling capacities
• A majority of certified products with a 3‐speeds fan. 5‐speed fans are also frequent
• Changes in rated capacity and efficiency with the fan speed differ greatly from a manufacturer to another onemanufacturer to another one
52

BASE‐CASES AND
ENERGY MODELLINGENVIRONMENTAL IMPACT LIFE CYCLE COSTS
Product repartitions : dry coolers
• Modular products. All combinations of coil dimensions, fan number, size and speed can becertified→ 20 000 certified products reported in the database
• High capacity products are less efficient → possibly manufacturers’ choice to reduce the coilsize and so the footprintsize and so the footprint
• Median efficiencies : ranging from 50 to 80
• Lower efficiency reported : 14
• Higher efficiencies reported : more than 200g e e c e c es epo ted : o e t a 00
53

BASE‐CASES AND
ENERGY MODELLINGENVIRONMENTAL IMPACT LIFE CYCLE COSTS
Base‐case Chillers
Characteristics Air-cooled chillerScrew compressor
Water-cooled chillerScrew compressor
Sales Stock Sales StockPC, nominal 400 kW 900 kWEER 2 72 2 29 4 77 3 82EERnominal 2.72 2.29 4.77 3.82
SEER 3.76 3.16 5.72 4.58τmin 25% 25%
EER (τ = τmin) 1.06 * EERfull-load 0.92 * EERfull-load
• Screw chillers chosen on the basis of Task 2 analysis, rather than scroll chillers
• Low capacity ranges (< 50 kW) represent a too small overall capacity installed to justify p y g p p y j ya supplementary base‐case
• Numerous off‐design data sets are available and allow to model the full‐load behaviour
• Part‐load performances can be fitted from the knowledge of the SEER
54
BASE‐CASES AND
ENERGY MODELLINGENVIRONMENTAL IMPACT LIFE CYCLE COSTS
Base‐case DX systems : cooling mode
Characteristics Rooftop unit Single split system VRF system
Sales Stock Sales Stock Sales StockP 80 kW 14 kW 50 kWPC, nominal 80 kW 14 kW 50 kW
EERnominal 2.84 2.28 2.81 2.363.43
Outdoor unit
2.45Outdoor
unit
τmin 55% 37% 100%C li 38%τmin 55% 37% Cycling 38%
EER (τ = τmin) 1.05 * EERfull-load1.18 *
EERfull-load- 1.24 * EERfull-load
Capacity Correction Factor - - 0.93
• Rooftop unit chosen on the basis of Task 2 analysis and Eurovent database
Si l lit t h th b i f E t d t b• Single split system chosen on the basis of Eurovent database
• VRF system chosen on the basis of the ETPL database of UK’s ECA
55

BASE‐CASES AND
ENERGY MODELLINGENVIRONMENTAL IMPACT LIFE CYCLE COSTS
Base‐case DX systems : heating mode
Characteristics Rooftop unit Single split system VRF system
Sales Stock Sales Stock Sales StockP 80 kW 16 kW 55 kWPH, nominal 80 kW 16 kW 55 kW
COPnominal 3.17 3.01 3.34 2.883.98
Outdoor unit
3.16Outdoor
unit
τ 55% 37% 100% 60%τmin 55% 37% Cycling 60%
COP (τ = τmin) COPfull-load1.09 *
COPfull-load- 1.04 * COPfull-load
Capacity Correction Factor - - 0.96
• Rooftop unit : more efficient in heating mode because of blower‐added heat
VRF t f i h ti d l i i ffi i t t l d
Factor
• VRF system performance in heating mode : lower gain in efficiency at part‐load conditions, according to the statistical analysis of reported products
56

BASE‐CASES AND
ENERGY MODELLINGENVIRONMENTAL IMPACT LIFE CYCLE COSTS
Base‐case Fan‐coil unit
2-pipes Non-Ducted Fan-coil unit
Cooling modeSales Stock
• 2010 and 2000 Eurovent database toestimate sales and stock base‐case
Sales StockPc FL
(total cooling capacity)2nd speed
3 kW
Ps FL (sensible cooling capacity)
2nd speed2.25 kW
characteristics
• Rated efficiency ratio is takent t f d t th
p
Pc / Pf FL 54 44
Qv AIR (air flow rate)
2nd speed525 m3/h
constant from a speed to another
• Constant water flow rate
Qm WATER (water flow rate) 0.180 kg/s
Heating modeSales Stock
For each fan speed fan consumptions air and
• Air flow rate : depending on theload, the unit is cycling at 1st speed,between 2 speeds or operating
All characteristicsFor each fan speed, fan consumptions, air and
water flow rates are the same as in cooling mode.
between 2 speeds or operatingconstantly at 3rd speed
57

BASE‐CASES AND
ENERGY MODELLINGENVIRONMENTAL IMPACT LIFE CYCLE COSTS
Base‐case Heat rejection units
Dry coolerSales base-case
PHR, nominal 200 kWPHR nominal / PF All fans 70
• 2010 Eurovent database to estimate thecharacteristics of the base‐case dry cooler(sales)
HR, nominal / F, All fans 0PF, All Fans 2.9 kWQv All Fans 15.3 m3/s
Number of fans 5Water temperature at the inlet of the
condenser : setpoint 25°C
• Baltimore VXT range to estimate thecharacteristics of the base‐case coolingtower (stock)
Cooling towerStock base-case
P ( i l h t j ti
( )
• Constant water flow rate
PHR,nominal (nominal heat rejection capacity) 1000 kW
Number of fan speeds 2PF (electrical power input of the fan)
1st speed 5.6 kW
Qv Air (outdoor air flow rate) 11 3 m3/s
• When possible, the water temperature atthe inlet of the chiller condenser is kept ata setpoint value.
Air ( )1st speed 11.3 m3/s
PF (electrical power input of the fan)2nd speed 18.5 kW
Qv Air (outdoor air flow rate)2nd speed 16.9 m3/s
Water temperature at the inlet of the
• Air flow rate :
• Dry cooler : staged 1‐speed fans
• Cooling tower : one 2‐speeds fan
58
Water temperature at the inlet of the condenser : setpoint 20°C

LIFE CYCLE COSTSBASE‐CASES
AND ENERGY MODELLING
ENVIRONMENTAL IMPACT
Energy simulation results
• Different product types are not alwaysinstalled, on average, under the same climate
Annual electricity use
Cooling mode
Annual electricity use
Heating mode→ Important differences between split systemsand VRF systems
• Equivalent split system :
Base-case product[kWh/kWcool] [kWh/kWcool]
Sales Stock Sales Stock
N t N t • Equivalent split system :– A non‐ducted single split system is simulated
– Sales of ducted single split and multiplisitsystems are taken into account
– A correction coefficient is used between a non‐
Air-cooled chiller 136 159 Not modelled
Not modelled
Water-cooled chiller 101 116 -Rooftop air-conditioner 165 232 396 457
Equivalent split 165 231 327 434 A correction coefficient is used between a nonducted and a ducted unit
• Equivalent fan‐coil unit :A f lit t t k i t t l f
Equivalent split system 165 231 327 434
VRF system 93 128 367 436Equivalent fan-coil
unit 10.6 13.0 8.84 11.8
– As for split systems, takes into account sales ofducted units
Dry cooler 16.7 - -
Cooling tower - 21.1 -
59

BASE‐CASES AND
ENERGY MODELLINGENVIRONMENTAL IMPACT LIFE CYCLE COSTS
Refrigerant charge and GWP
• Not all sales or stock products chargedwith the same refrigerant
Base-case d t
Refrigerant h
Equivalent EU-27 GWP100 years
• Important differences in GWP from arefrigerant to another (R‐134a and R‐410A,for instance)
product charge
Sales Stock
Air-cooledhill 0.25 kg / kW for instance)
• An equivalent GWP to take into accountthe different refrigerants on the market
chiller g
1455 1587
Water-cooled chiller 0.20 kg / kW
the different refrigerants on the market
• Greater refrigerant charges per coolingcapacity for split and VRF systems
Rooftop 0.25 kg / kW
1914 1772Split system 0.4 kg / kW p y p y
→ refrigerant distribution piping systemVRF system 0.5 kg / kW
60

BASE‐CASES AND
ENERGY MODELLINGENVIRONMENTAL IMPACT LIFE CYCLE COSTS
Refrigerant losses scenarios
Refrigerant losses Refrigerant losses
• No statistical data at EU scale
Base-case product
gover product life
Low estimate
gover product life
High estimate
Air cooled chiller 30% of factory 130% of factory
• Comparison between several referencestudies
lAir-cooled chiller charge charge
Water-cooled chiller 30% of factory charge
145% of factory charge
30% of factory 95% of factory
• Two losses scenarios :
– Low estimate : only losses intrinsic to theproduct (mainly technical faults leading to
Rooftop 30% of factory charge
95% of factory charge
Split system 35% of factory charge
170% of factory charge
product (mainly technical faults leading toleakage)
– High estimate : takes also into account
VRF system 35% of factory charge
170% of factory charge
accidental releases, poorly installed field‐interconnecting tube, maintenance issues,end‐of‐life management …
61

BASE‐CASES AND
ENERGY MODELLINGENVIRONMENTAL IMPACT LIFE CYCLE COSTS
LCA for 1 unit, scenario 1
• Main sources of emission : use phase and refrigerant losses
• Reversible products consume at least thrice as much electricity as cooling‐onlyproducts
• Refrigerant losses more sensitive for split systems and VRF systems
62

BASE‐CASES AND
ENERGY MODELLINGENVIRONMENTAL IMPACT LIFE CYCLE COSTS
LCA for 1 unit, scenario 2
• Life cycle analysis is very sensitive to refrigerant losses
• No distinction in sales data between cooling only and reversible products :→ Cooling‐only products installed in warmer climates : higher electricity consumptionthan estimated here
63

BASE‐CASES AND
ENERGY MODELLINGENVIRONMENTAL IMPACT LIFE CYCLE COSTS
Fan‐coil and heat rejection units LCA
• Fan‐coil unit : production and recycling phase not negligible. Low electricity consumption andhigh plastics content
• Dry cooler : higher importance of the production phase because of coil manufacturingDry cooler : higher importance of the production phase because of coil manufacturing
64
BASE‐CASES AND
ENERGY MODELLINGENVIRONMENTAL IMPACT LIFE CYCLE COSTS
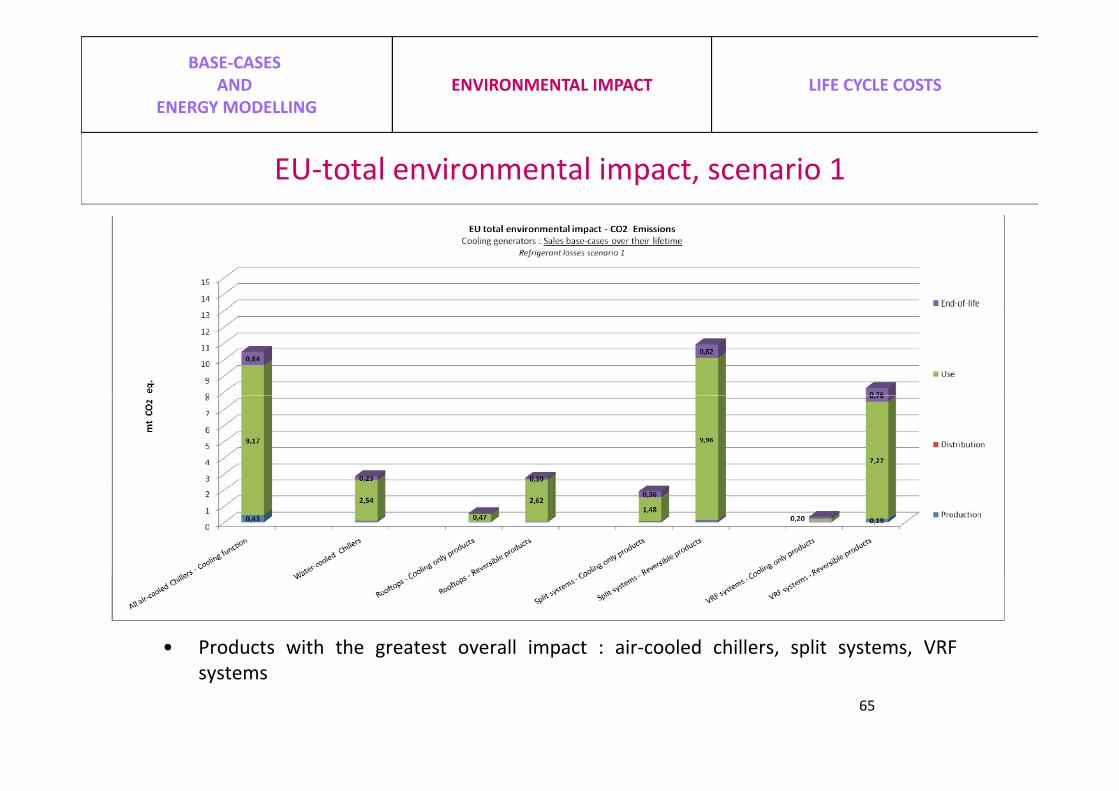
EU‐total environmental impact, scenario 1
• Products with the greatest overall impact : air‐cooled chillers, split systems, VRF
65
systems

BASE‐CASES AND
ENERGY MODELLINGENVIRONMENTAL IMPACT LIFE CYCLE COSTS
EU‐total environmental impact, scenario 2
• Products with the greatest overall impact : air‐cooled chillers, split systems, VRF
66
systems

BASE‐CASES AND
ENERGY MODELLINGENVIRONMENTAL IMPACT LIFE CYCLE COSTS
EU‐total environmental impact, other products
• Fan‐coil units total environmental impact : more than cooling‐only VRFs and cooling‐only rooftops, less than water‐cooled chillers and reversible rooftops
→ Limited but non‐negligible impact
• Heat rejection units : half of the environmental impact fan‐coil units
→ Limited but non‐negligible impact
67

BASE‐CASES AND
ENERGY MODELLINGENVIRONMENTAL IMPACT LIFE CYCLE COSTS
Methodology
• No price distinctions between cooling‐only and reversible products
• Costs structure adapted from the reference work RSMeans Mechanical Cost Datap
• Bare material costs calculated from market analysis and price lists reported in Task 2, as wellas other case studies
• Bare labour costs transposed from RSMeans Mechanical Cost Data and case studies
• Information provided by stakeholders on VRF systems
• Overhead & Profit margin taken equal to 20%
• No precise information on maintenance costs→ standard 4% of total investment costs
68

BASE‐CASES AND
ENERGY MODELLINGENVIRONMENTAL IMPACT LIFE CYCLE COSTS
Initial investment costs
Data Air-cooled chiller Water-cooled chiller
Rooftop Split system VRF system Fan-coil unit Dry cooler
Cooling / Heat rejection capacity 400 900 80 14 50 3 200j p y
[kW]
MSP, unit alone[€] 40000 63000 12000 3500
16000 (outdoor unit) + 11700 (indoor units)
500 13000
Piping Valves, controls, Pumps & piping
MSP, additional equipment
[€]
Control panel, sensors
Control panel, sensors
Ductwork, insulation Piping, wiring kit
Piping, accessories,
remote control
chilled water piping, condensate
drains
Pumps & piping, condenser control
system
9200 14400 400 200 4600 1100 4900
Total MSP 49200 77400 12400 3700 32300 1600 17900[€] 49200 77400 12400 3700 32300 1600 17900
Total bare labour costs
[€]6900 10800 5500 700 11400 1200 4400
Total installation costs,
with O & P[€]
67300 105800 21500 5300 52400 3400 26700
69

BASE‐CASES AND
ENERGY MODELLINGENVIRONMENTAL IMPACT LIFE CYCLE COSTS
Life cycle costs
70

BASE‐CASES AND
ENERGY MODELLINGENVIRONMENTAL IMPACT LIFE CYCLE COSTS
Total EU‐27 expenditure
71
BASE‐CASES AND
ENERGY MODELLINGENVIRONMENTAL IMPACT LIFE CYCLE COSTS
Results interpretation
• Lower relative investment costs : rooftop units, chillers and split systems
• High relative investment costs for VRFs by comparison with other coolinggenerators
• High investment costs for terminal units and heat rejection units because oflow electricity consumptions and associated equipment
• Very high investment costs for fan‐coil units because costs of the waterdistribution system are included
• Maintenance costs probably underestimated
72

Conclusion Task 4
• Energy consumption makes the greater part of the environmental impactsEnergy consumption makes the greater part of the environmental impacts
• The total expenditure in 2010 is estimated to be about 20 billion euros.
• The stock of cooling products in 2010 is estimated to consume 74 TWh/y, which correspond to about 34 MtCO2eq/y regarding emissions due to electricity Incorrespond to about 34 MtCO2eq/y regarding emissions due to electricity. In addition, it is estimated that between 4 and 15 MtCO2eq/y for direct emissions
• All in all, the energy consumption estimate matches pretty well with the li i ti t i t k 1 f thi t (90 TWh h ti l lipreliminary estimates in task 1 of this report (90 TWh heating plus cooling
electricity consumption). The global electricity consumption is lower, but the reversible chiller electricity consumption for heating was not taken into account, which can be estimated to about 15 TWhwhich can be estimated to about 15 TWh.
• Amongst the 4 product groups, the contribution of terminal units and of heat rejection units is relatively low, 2 TWh for fan coils and 1 TWh for heat rejection
itunits.
73
Task 5 – BAT and BNAT
74

IMPROVEMENT POTENTIAL
ELECTRIC MECHANICAL VAPOR COMPRESSION CYCLES
TERMINAL UNITS HEAT REJECTION UNITS
Contents
• IMPROVEMENT POTENTIAL UNDER THE ECODESIGN DIRECTIVE
• ELECTRICALLY DRIVEN MECHANICAL VAPOR COMPRESSION CYCLES• ELECTRICALLY DRIVEN MECHANICAL VAPOR COMPRESSION CYCLES IMPROVEMENT
TERMINAL UNITS• TERMINAL UNITS
• HEAT REJECTION UNITS
75

IMPROVEMENT POTENTIAL
ELECTRIC MECHANICAL VAPOR COMPRESSION CYCLES
TERMINAL UNITS HEAT REJECTION UNITS
ErP improvement potential
Extended productsExtended products
Multi-function products• Products supplying cooling OR heating• Simultaneous cooling AND heating (or hot water)
- Water based- Refrigerant based
• Cooling, heating and ventilation
Energy efficiency and peak efficiency
76

IMPROVEMENT POTENTIAL
ELECTRIC MECHANICAL VAPOR COMPRESSION CYCLES
TERMINAL UNITS HEAT REJECTION UNITS
Design options for main cooling generators
Refrigerant fluidMotorCompressorHeat exchangers Evaporatively-cooled condenser
ComponentsEvaporatively cooled condenserFansExpansion valveAuxiliary power modes (including Auxiliary power modes (including
controllers)
Air conditionersProducts Air conditionersChillers
Products
Alternatives to electrically driven vapour compression
77
units using grid electricity

IMPROVEMENT POTENTIAL
ELECTRIC MECHANICAL VAPOR COMPRESSION CYCLES
TERMINAL UNITS HEAT REJECTION UNITS
Refrigerant fluid
Refrigerant fluid choice– Present fluids R134a, R407C, R410A (ammonia, propane)– Alternatives: Propane, Ammonia, R32, CO2, HFOs– GWPs lower, but also performance (average and peak)– TEWI analysis required and LCC also
Refrigerant management– Leak from the product and from refrigerant managementp g g– Importance of the 2006/842/EC directive
Refrigerant charge and leakageRefrigerant charge and leakage– micro-channel heat exchangers, leak detection, components
for hermetically sealed products (EN 16084:2011)
78

IMPROVEMENT POTENTIAL
ELECTRIC MECHANICAL VAPOR COMPRESSION CYCLES
TERMINAL UNITS HEAT REJECTION UNITS
Motors and VFD
EC motor regulationEC motor regulation- Not covered motors in (semi-)hermetic compressors and < 750
W
EC motor is a key BATEC motor is a key BAT- BAT motor peak efficiency from 85 % for ~ 100 W till more
than 95 % for 50 kW motor output
EC motor + VFD alsoEC motor + VFD also- VFD also very efficient with EC motors, losses less than 2 %
peak load, and less than 5 % part load
Source (Barrett, 2011)50 kW rated motor input
79

IMPROVEMENT POTENTIAL
ELECTRIC MECHANICAL VAPOR COMPRESSION CYCLES
TERMINAL UNITS HEAT REJECTION UNITS
CompressorsDesign efficiency Off design efficiencyg y
- Rotary BAT -> Scroll- Scroll BAT 80 % (Is. eff)- Screw BAT 85 % (Is. eff)
Off design efficiency- Choice of the peak. eff- Variable peak eff- Economizer
- Centrifugal BAT ?
Unloading10
ESEER - Water cooled package chillers
- VFD versus tandem operation for scroll
- VFD + fix scroll for VRFVFD for screw
6
7
8
9
10
- VFD for screw- EC + VFD + magnetic
bearings for centrifugal compressors = oil free 1
2
3
4
5
centrifugal chiller
Oil flooded compression (BNAT)
0
1
1,5 2,5 3,5 4,5 5,5 6,5 7,5EER
(BNAT)80

IMPROVEMENT POTENTIAL
ELECTRIC MECHANICAL VAPOR COMPRESSION CYCLES
TERMINAL UNITS HEAT REJECTION UNITS
Heat exchangers
Increase heat transfer intensity
Increase heat transfer area at Increase heat transfer area at fixed kW (and flow)
Cassette indoor unit (ECCJ, 2008)
Decrease pressure dropReduce heat exchanger Reduce heat exchanger
volume (refrigerant charge)
Minichannel heat exchangers (Carrier 2007)
81
Minichannel heat exchangers (Carrier, 2007)

IMPROVEMENT POTENTIAL
ELECTRIC MECHANICAL VAPOR COMPRESSION CYCLES
TERMINAL UNITS HEAT REJECTION UNITS
Evaporatively‐cooled condensers25,0
r dry
• Wet pad or direct coil aspersion
• Important potential in dry climates and at peak conditions.
S ill b i i
15,0
20,0
oincident a
verage per
erature bin)
STRASBOURG
• Still may be interesting on a seasonal basis
• The maximum gains range from 15 % to 25 % in average from Helsinki
5,0
10,0
bulb te
mpe
rature (co
bulb te
mpe HELSINKI
ATHENS
MILAN
% to 25 % in average from Helsinki to Athens. In Milan, reputed as a hot and humid climate, performance gains are still about 15
0,0
0 10 20 30 40
Wet
Outdoor dry bulb temperature °C
%.
• For one product, simple calculations (California) show that the water consumption to wet the pad isconsumption to wet the pad is lower than the water economized from avoided electricity production form power plants, which are cedengineering.com
among the largest water consumers. 82

IMPROVEMENT POTENTIAL
ELECTRIC MECHANICAL VAPOR COMPRESSION CYCLES
TERMINAL UNITS HEAT REJECTION UNITS
FansOutdoor fan Indoor fan
Air cooled chillers Propeller fan ‐Centrifugal fan (ducted outdoor unit) ‐
Split, multi‐split and VRF air conditioners Propeller fan TangentialCentrifugal
Air conditioner integrated in AHUs Propeller fan CentrifugalAir conditioner integrated in AHUs Propeller fan CentrifugalFan coils ‐ Tangential
‐ CentrifugalDry coolers Propeller fan ‐
Cooling tower Propeller fan ‐Centrifugal ‐
Fan coils ‐ Tangential‐ Centrifugal
• Developments on all fan types for AC products, with noise as a primary concern.
• Plastic fans are gaining popularity
• Tangential fans are reputed to have lowerefficiencies, but information is scarce
(ECCJ, 2008)
83
• Fan drive efficiency, EC + VFD, Belt (up to 97 % efficiency)
(ECCJ, 2008)

IMPROVEMENT POTENTIAL
ELECTRIC MECHANICAL VAPOR COMPRESSION CYCLES
TERMINAL UNITS HEAT REJECTION UNITS
Air conditioners
• Best available productsBest available products– Only the full load is known,
ex split EER 4 and COP 4.4 6,0
– Other markets may help (AHRI catalogue extract for minisplit)
4,0
5,0
p )
• Size constraints2,0
3,0EER
SEER
0,0
1,0
12 14 16 18 20
• Air conditioners in AHU‐ Free cooling, hybrid
evaporative desiccantkW cooling capacity
evaporative, desiccant
84

IMPROVEMENT POTENTIAL
ELECTRIC MECHANICAL VAPOR COMPRESSION CYCLES
TERMINAL UNITS HEAT REJECTION UNITS
Chillers
• NPLV (for non standard part load value operations) efficient optionsefficient options– High temperature difference chilled water design
– Optimized multiple chiller operationp p p
• Chiller free cooling– Direct operation via the refrigerant cycle
– By addition of a supplementary water/air coil
85
IMPROVEMENT POTENTIAL
ELECTRIC MECHANICAL VAPOR COMPRESSION CYCLES
TERMINAL UNITS HEAT REJECTION UNITS
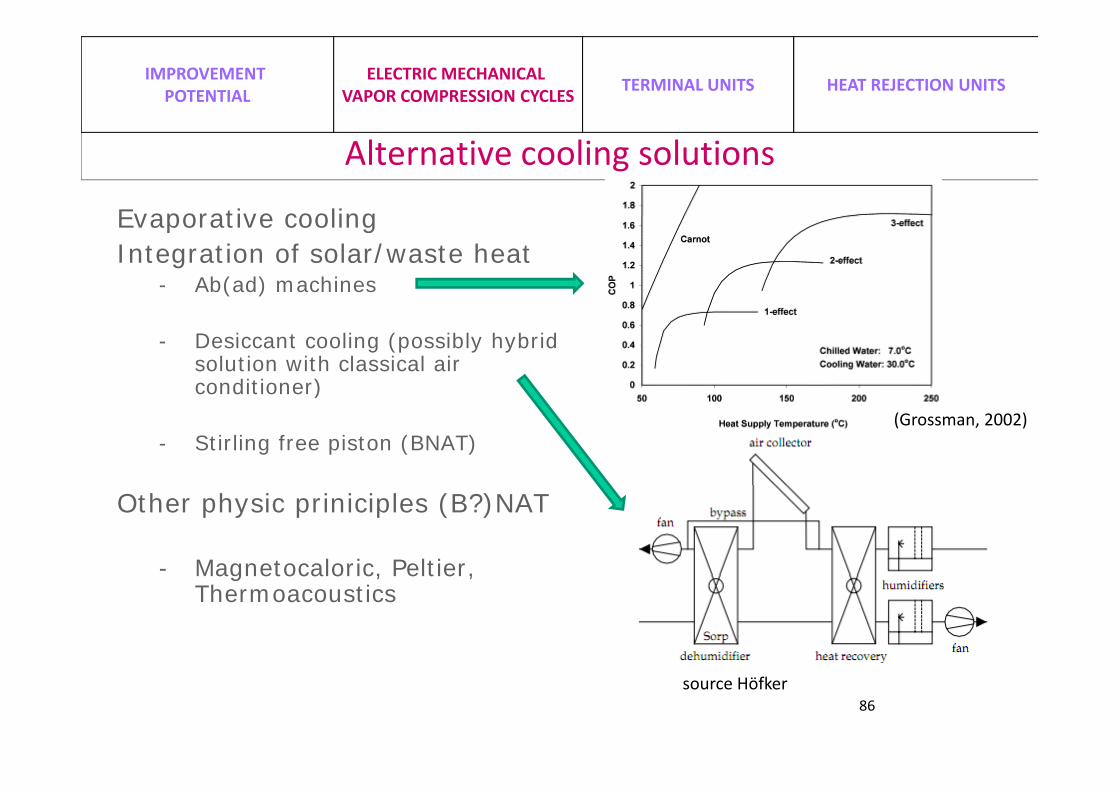
Alternative cooling solutions
Evaporative coolingEvaporative coolingIntegration of solar/waste heat
- Ab(ad) machines
- Desiccant cooling (possibly hybrid solution with classical air conditioner))
- Stirling free piston (BNAT)(Grossman, 2002)
Other physic priniciples (B?)NAT
- Magnetocaloric, Peltier, Magnetocaloric, Peltier, Thermoacoustics
86source Höfker

IMPROVEMENT POTENTIAL
ELECTRIC MECHANICAL VAPOR COMPRESSION CYCLES
TERMINAL UNITS HEAT REJECTION UNITS
Terminal units
• Fan coil units– Same type of improvement (larger heat exhcnage coefficients
or/and surface)
– EC motor with VFD
Control consumption– Control consumption
• Chilled beams (BAT ?)( )– Comparison with fan coil is system dependent
– Need to characterize the chillers for higher water temperaturel l ( f )levels (see for instance ENER Lot 1)
87
IMPROVEMENT POTENTIAL
ELECTRIC MECHANICAL VAPOR COMPRESSION CYCLES
TERMINAL UNITS HEAT REJECTION UNITS
Heat rejection units
• Dry cooler units• Dry cooler units– Same type of improvement (larger heat exhcnage coefficients
or/and surface)
– EC motor with VFD
– Control consumption
• Alternative heat rejection means– Evaporatively‐cooled dry cooler
Open cooling tower– Open cooling tower
– Closed cooling tower
– The comparison would require a product extended approachp q p pp(water cooled generator + heat rejection means)
– Suggestion: improve individual ratings of products before and include the corresponding operating conditions in prEN14825include the corresponding operating conditions in prEN14825
88

Questions ?
89