Embed Size (px)
Citation preview
1
Supporting Information
Directing single-molecule emission with DNA
origami-assembled optical antennas
Kristina Hübner1, Mauricio Pilo-Pais2, 5, Florian Selbach1, Tim Liedl2, Philip Tinnefeld1*,
Fernando D. Stefani3,4* and Guillermo P. Acuna5*
1 Department of Chemistry and Center for NanoScience, Ludwig-Maximilians-Universität
München, Butenandtstr. 5-13 Haus E, 81377 München, Germany
2Faculty of Physics and Center for NanoScience, Ludwig-Maximilians-Universität München,
Geschwister-Scholl-Platz 1, 80539 München, Germany
3Centro de Investigaciones en Bionanociencias (CIBION), Consejo Nacional de Investigaciones
Científicas y Técnicas (CONICET), Godoy Cruz 2390, C1425FQD Ciudad Autónoma de
Buenos Aires, Argentina
4Departamento de Física, Facultad de Ciencias Exactas y Naturales, Universidad de Buenos
Aires, Güiraldes 2620, C1428EHA Ciudad Autónoma de Buenos Aires, Argentina
5Department of Physics, University of Fribourg, Chemin du Musée 3, Fribourg CH-1700,
Switzerland
2
1. Gold Nanoparticle Fabrication
Synthesis of gold nanoparticles (Au NPs): 60 nm spherical gold NPs were synthesized by a
four-step seed growth and etching method1,2. Small gold clusters were prepared by reduction of
Au3+ ions with sodium borohydride in cetyltrimethylammonium bromide (CTAB) solution. These
clusters were grown to small seed nanoparticles by further addition of Au3+ ions and ascorbic acid
in CTAB solution. Further larger polyhedron nanoparticles were formed by anisotropic growth of
seed particles in cetyltrimethylammonium chloride (CTAC) solution with Au3+ ions and ascorbic
acid. Spherical NPs were obtained by etching the surface of nanopolyhedrons by addition of Au3+
ions in CTAB solution. The experimental details of the individual steps are specified below.
Clusters: HAuCl4 solution (10 mM, 250 µL) was mixed with a CTAB solution (100 mM,
9.75 mL), followed by rapid injection of a freshly prepared ice-cold NaBH4 solution (10 mM,
600 µL). The mixture was left undisturbed for 3 h at 30 °C.
Seeds: The prepared cluster solution (300 µL) was injected into a growth solution of CTAB
(100 mM, 2.44 mL), deionized water (D.I. water; 47.5 mL), HAuCl4 solution (10 mM, 1 mL), and
ascorbic acid solution (100 mM, 3.75 mL). The reaction mixture was gently shaken and then left
undisturbed for 3 h at 30 °C. The colloid was washed by centrifugation (11500 × g, 40 min) and
redispersed in D.I. water (12.5 mL).
Nanopolyhedrons: The seed solution (3.6 mL) was added into a CTAC solution (25 mM, 300 mL).
After the sequential addition of ascorbic acid solution (100 mM, 7.5 mL) and HAuCl4 solution
(10 mM, 15 mL), the mixture solution was kept undisturbed for 3 h at 30 °C and then washed by
centrifugation (1750 × g, 30 min) and redispersion in CTAB solution (20 mM, 5 mL).
3
Au NPs: The nanopolyhedron solution (5 mL) was diluted by the addition of CTAB solution
(20 mM, 250 mL), followed by the addition of HAuCl4 solution (10 mM, 1.9 mL). After stirring
(550 rpm, 2 h, 40 °C), the mixture was washed twice with D.I. water (centrifugation at 1750 × g
for 30 min) and redispersed finally in D.I. water (10 mL).
2. Sample Preparation
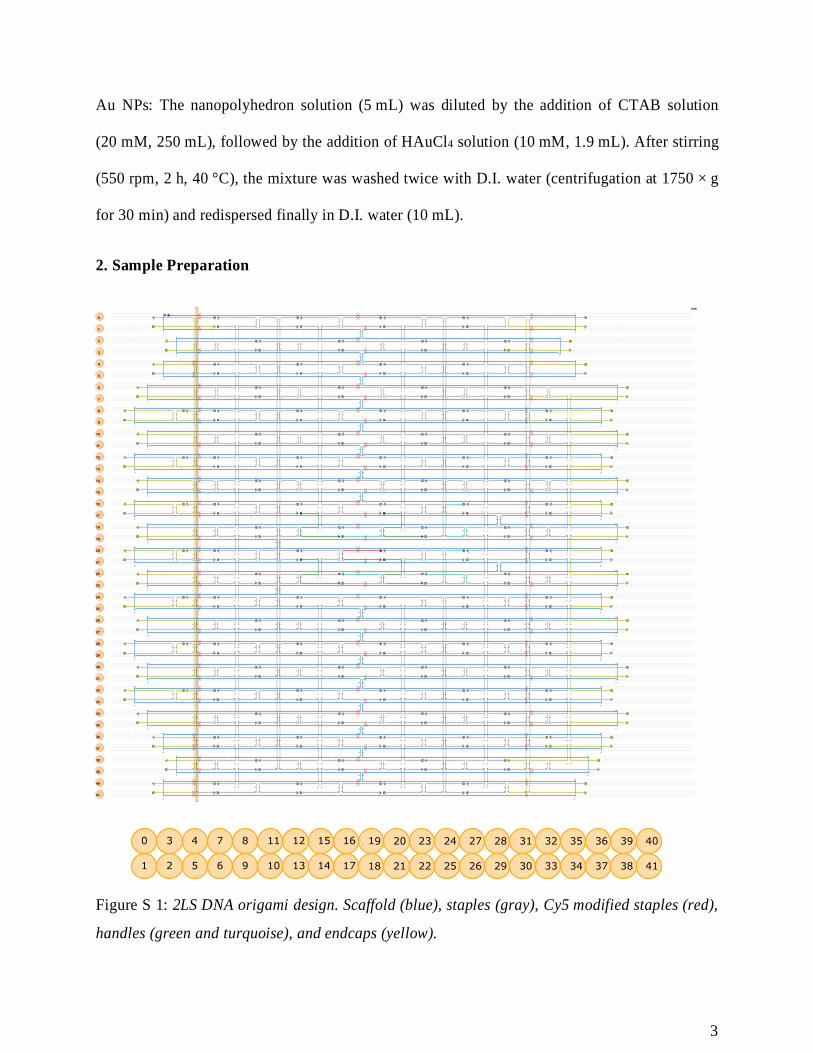
Figure S 1: 2LS DNA origami design. Scaffold (blue), staples (gray), Cy5 modified staples (red),
handles (green and turquoise), and endcaps (yellow).
4
The DNA origami structure was designed using CaDNAno3 and visualized for twist correction
using CanDo4. It consists of a square lattice design that folds onto a 2-layers sheet (2LS) of size
~60 nm×50 nm×5 nm. An attachment binding site with four 15-nuclotides long handles (15xA) is
located at the center of each of the two layers of the 2LS origami. Each binding site is aimed to
attach a single 60 nm Au NP. The CaDNAno design is shown in Figure S1, with the scaffold
portrayed in blue, the core staples in gray, the handles on each layer in green and turquoise, the
staple with Cy5 in red, and the endcaps in yellow. The endcaps contain CCCC extensions to
prevent base-stacking interactions between origamis.
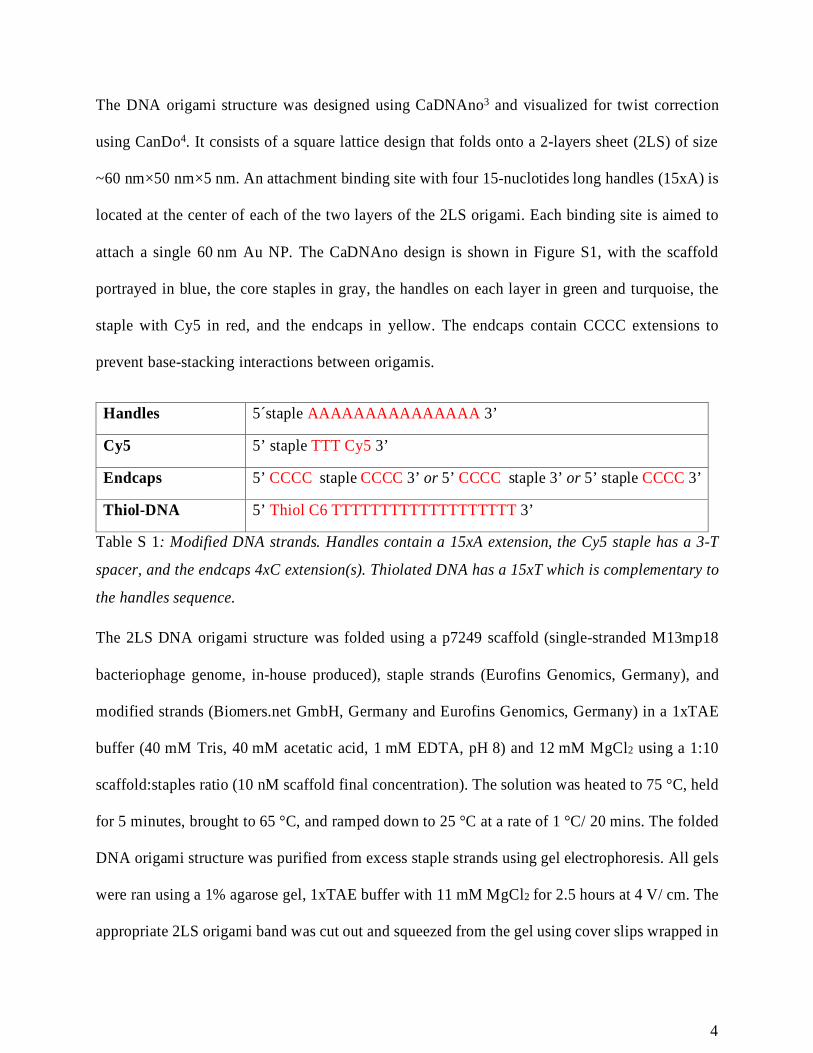
Handles 5´staple AAAAAAAAAAAAAAA 3’
Cy5 5’ staple TTT Cy5 3’
Endcaps 5’ CCCC staple CCCC 3’ or 5’ CCCC staple 3’ or 5’ staple CCCC 3’
Thiol-DNA 5’ Thiol C6 TTTTTTTTTTTTTTTTTTT 3’
Table S 1: Modified DNA strands. Handles contain a 15xA extension, the Cy5 staple has a 3-T
spacer, and the endcaps 4xC extension(s). Thiolated DNA has a 15xT which is complementary to
the handles sequence.
The 2LS DNA origami structure was folded using a p7249 scaffold (single-stranded M13mp18
bacteriophage genome, in-house produced), staple strands (Eurofins Genomics, Germany), and
modified strands (Biomers.net GmbH, Germany and Eurofins Genomics, Germany) in a 1xTAE
buffer (40 mM Tris, 40 mM acetatic acid, 1 mM EDTA, pH 8) and 12 mM MgCl2 using a 1:10
scaffold:staples ratio (10 nM scaffold final concentration). The solution was heated to 75 °C, held
for 5 minutes, brought to 65 °C, and ramped down to 25 °C at a rate of 1 °C/ 20 mins. The folded
DNA origami structure was purified from excess staple strands using gel electrophoresis. All gels
were ran using a 1% agarose gel, 1xTAE buffer with 11 mM MgCl2 for 2.5 hours at 4 V/ cm. The
appropriate 2LS origami band was cut out and squeezed from the gel using cover slips wrapped in
5
parafilm. Only side lanes of the gel were post-stained and used as markers to cut the appropriate
band to avoid staining the origami used on this study. The concentration was determined via
UV-Vis absorption spectroscopy (Nanodrop).
Thiolated DNA (Thiol-C6-15xT, Biomers.net GmbH, Germany) was mixed with ultrasmooth
Au NPs (see section 1), adjusted to 0.03% SDS and frozen for 30 mins5. Excess DNA was removed
using gel electrophoresis. This step also ensures the removal of any self-aggregated dimer formed
during the NP functionalization. The concentration was determined via UV-Vis absorption
spectroscopy (Nanodrop).
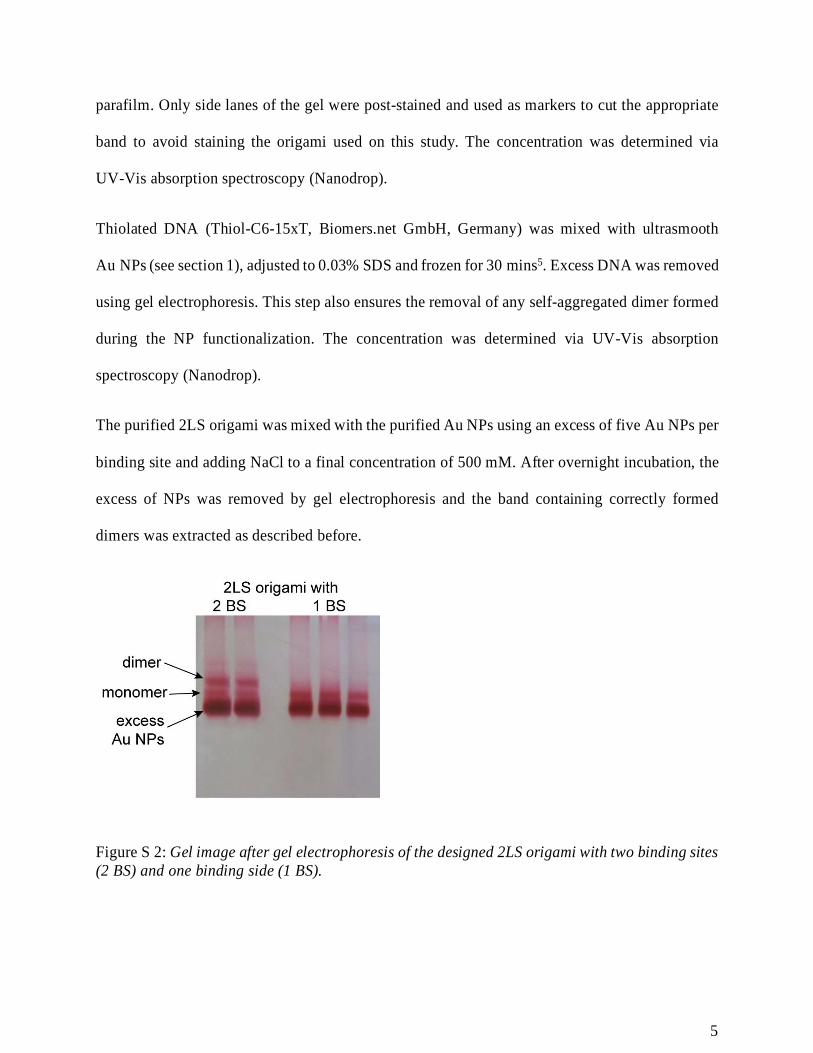
The purified 2LS origami was mixed with the purified Au NPs using an excess of five Au NPs per
binding site and adding NaCl to a final concentration of 500 mM. After overnight incubation, the
excess of NPs was removed by gel electrophoresis and the band containing correctly formed
dimers was extracted as described before.
Figure S 2: Gel image after gel electrophoresis of the designed 2LS origami with two binding sites (2 BS) and one binding side (1 BS).
6
3. Surface Preparation and Sample Immobilization
For immobilization of the OA structures, the glass cover slips were first rinsed with water and then
cleaned in a UV cleaning system (PSD Pro System, Novascan Technologies, USA). Afterwards,
the surfaces were passivated with a BSA-biotin in PBS solution (1 mg/mL) for 1 h, neutrAvidin in
PBS solution (0.5 mg/mL) for 20 min and single stranded DNA (7T for the reference and 7A for
the monomer and dimer samples) with a biotin attached to the 5’-end (10 nM) for 20 min. In
between all the steps, the surfaces were washed with 0.5xTE buffer containing 10 mM MgCl2. The
samples were incubated on the surface for 5 min and afterwards washed with buffer. Confocal and
wide-field measurements were performed under oxygen removal and ROXS using
trolox/troloxquinone in 1xTAE with 12 mM MgCl2.6,7
4. Imaging Systems
4.1 Wide-Field Setup
Wide-field measurements were performed on a custom-built wide-field setup based on an inverted
Olympus IX71 microscope. As excitation source a red diode laser with a wavelength of 644 nm is
used (ibeam smart, Toptica Photonics, Germany). The laser gets spectrally cleaned by a cleanup
filter (Brightline HC 650/13, Semrock, USA) before passing the lambda quarter (AQWP05M
400-800 nm, Thorlabs, Germany)/ lambda half waveplate (AHWP05M 400-800 nm, Thorlabs,
Germany) and afterwards being focused in the back focal plane of the objective (UApo N 60x,
NA = 1.49, WD = 0.1 mm, Olympus, Germany). For stabilization of the sample an actively
stabilized optical table (TS-300, JRS Scientific Instruments, Switzerland) and a nosepiece stage
(IX2-NPS, Olympus, Germany) were implemented to the microscope. Then the light is directed
7
through the objective and the sample is illuminated. Fluorescence will get collected by the same
objective and separated from the excitation light by a dichroic beamsplitter (Dual Line zt532/640
rpc, AHF Analysentechnik, Germany). Afterwards the fluorescence light is filtered with an
emission filter (ET 700/75, Chroma, USA) and focused by a lens on an EMCCD camera (iXon X3
DU-897, Andor, North Ireland). The videos are recorded by the open source microscopy ImageJ
software Micro-Manager8.
4.2 Confocal Setup
Confocal measurements were performed on a custom-build confocal setup based on an inverted
Olympus IX81 microscope. The excitation source is a 78 MHz-pulsed laser (SuperK Extreme,
NKT Photonics, Denmark), that can be tuned in a region from 400 to 2400 nm. In these
experiments working at 639 nm to excite the Cy5 dye. For wavelength selection an AODS (20160
8R, Crystal Technology, Inc., USA) and an AOTF (AA.AOTF.ns:TN, AA-Opto-Electronic,
France) are implemented that also clean up the spectrum of the laser. After wavelength selection
a neutral density filter (ndF, OD 0-2, Thorlabs, Germany) is passed and the laser beam is coupled
into a polarization maintaining single mode fiber (PM-Fiber, P1-488PM-FC-2, Thorlabs,
Germany). The polarization of the laser can be controlled by the combination of a linear polarizer
(LPVISE100-A, Thorlabs, Germany), an electro optical modulator (EOM, electro-optical
modulator, L 0202, Qioptiq, Germany) and a lambda quarter waveplate (AQWP05M-600,
Thorlabs, Germany). With these optics a circular polarization can be achieved by driving the EOM
with a high frequency. Afterwards, the laser beam is coupled into the microscope body and focused
on the sample placed on top of an immersion oil objective (UPlanSApo 100x, NA = 1.4,
WD = 0.12 mm, Olympus, Germany). The fluorescence of the sample is collected by the same
objective and separated from the excitation light by a dichroic mirror (DS, zt532/640rpc, Chroma,
8
USA). To filter out scattered laser light, the fluorescence is focused on a 50 µm pinhole (Linos,
Germany) and afterwards directed through an emission filter (RazorEdge® 647, Semrock, USA)
and again focused by a lens on the the APD (Avalanche Photo Diode, SPCM, AQR 14, Perkin
Elmer, USA). Time Correlated Single Photon counting is achieved by an TCSPC system (Hydra
Harp 400, PicoQuant, Germany). Scanning of the samples in x and y is realized by a piezo stage
(P-517.3CL, E-501.00, Physik Instrumente GmbH&Co. KG, Germany). For data processing, a
custom written LabVIEW software (National Instruments, USA) is used. To extract the
fluorescence lifetime from the decays, a mono-exponential fit and a deconvolution from the
instrumental response function using the program FluoFit (PicoQuant, Germany) were used.
5. Imaging
5.1 Wide-Field Imaging Series
To analyze the emission dipole orientation, the orientation of maximum absorption and the
bleaching behavior, a set of different measurements were performed. In a first measurement, the
laser power was set to a power density of 0.22 kW cm-2 and the objective was shifted towards the
sample by approximately 1 µm to take defocused images of the single molecules. This shift in the
objective position leads to a deliberate defocused signal on the camera chip that allows us to study
the angular emission pattern. Circularly polarized light was used in order to attain uniform
excitation of all OA-Cy5 photon emitter structures that are randomly oriented on the glass. Second,
after completion of the defocused imaging, the sample is placed back to focus for single molecule
studies. These measurements are performed while stepwise rotating the linearly polarized
excitation light by spinning the lambda half waveplate for ten degrees nine times every five
9
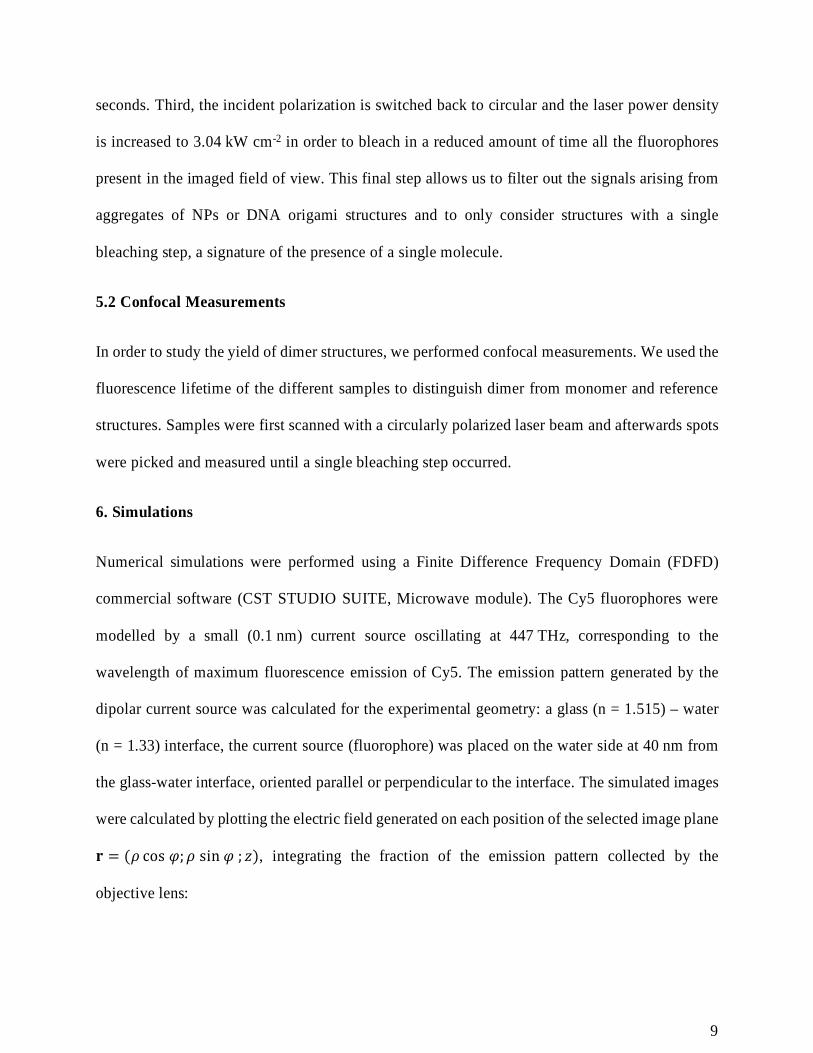
seconds. Third, the incident polarization is switched back to circular and the laser power density
is increased to 3.04 kW cm-2 in order to bleach in a reduced amount of time all the fluorophores
present in the imaged field of view. This final step allows us to filter out the signals arising from
aggregates of NPs or DNA origami structures and to only consider structures with a single
bleaching step, a signature of the presence of a single molecule.
5.2 Confocal Measurements
In order to study the yield of dimer structures, we performed confocal measurements. We used the
fluorescence lifetime of the different samples to distinguish dimer from monomer and reference
structures. Samples were first scanned with a circularly polarized laser beam and afterwards spots
were picked and measured until a single bleaching step occurred.
6. Simulations
Numerical simulations were performed using a Finite Difference Frequency Domain (FDFD)
commercial software (CST STUDIO SUITE, Microwave module). The Cy5 fluorophores were
modelled by a small (0.1 nm) current source oscillating at 447 THz, corresponding to the
wavelength of maximum fluorescence emission of Cy5. The emission pattern generated by the
dipolar current source was calculated for the experimental geometry: a glass (n = 1.515) – water
(n = 1.33) interface, the current source (fluorophore) was placed on the water side at 40 nm from
the glass-water interface, oriented parallel or perpendicular to the interface. The simulated images
were calculated by plotting the electric field generated on each position of the selected image plane
𝐫𝐫 = (𝜌𝜌 cos 𝜑𝜑;𝜌𝜌 sin 𝜑𝜑 ; 𝑧𝑧), integrating the fraction of the emission pattern collected by the
objective lens:
10
𝐸𝐸𝑗𝑗(𝒓𝒓) = 𝐶𝐶 ∫ ∫ √cos 𝜃𝜃 𝐸𝐸0𝑗𝑗(𝜃𝜃,𝜓𝜓)𝜃𝜃𝑚𝑚𝑚𝑚𝑚𝑚𝜃𝜃𝑚𝑚𝑚𝑚𝑚𝑚
𝑒𝑒𝑖𝑖𝑖𝑖(𝜌𝜌 sin 𝜃𝜃 (cos(𝜓𝜓−𝜑𝜑))+𝑧𝑧 cos 𝜃𝜃) sin𝜃𝜃 𝑑𝑑𝜃𝜃 𝑑𝑑𝜓𝜓2𝜋𝜋0
where j stands for x, y, or z (Cartesian components of the field). The solid angle is integrated in
spherical coordinates. The azimuth angle is integrated all around the z-axis, and the focusing angle
range (𝜃𝜃𝑚𝑚𝑖𝑖𝑚𝑚 and 𝜃𝜃𝑚𝑚𝑚𝑚𝑚𝑚 ) depends on the NA of the objective. 𝑘𝑘 = 2𝜋𝜋/𝜆𝜆. 𝐸𝐸0𝑗𝑗(𝜃𝜃,𝜓𝜓) is the 𝑗𝑗
component of the emission pattern field parametrized in the azimuthal and polar angles (𝜃𝜃 ,𝜓𝜓).
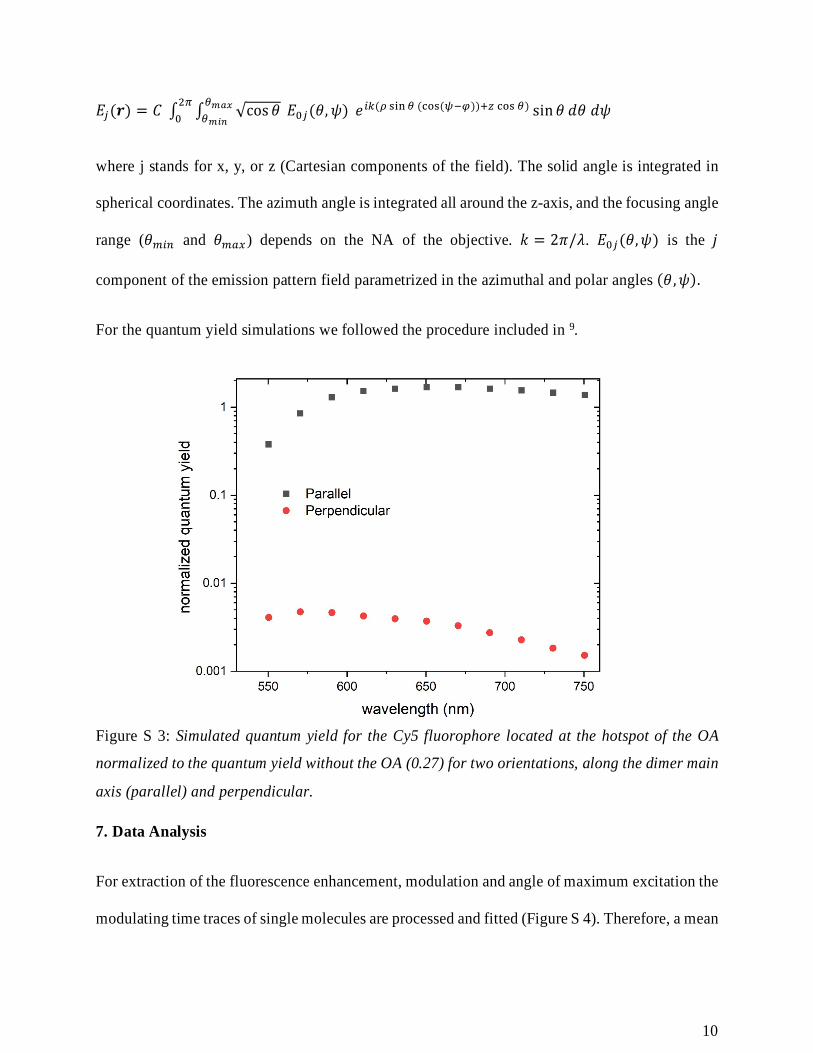
For the quantum yield simulations we followed the procedure included in 9.
Figure S 3: Simulated quantum yield for the Cy5 fluorophore located at the hotspot of the OA
normalized to the quantum yield without the OA (0.27) for two orientations, along the dimer main
axis (parallel) and perpendicular.
7. Data Analysis
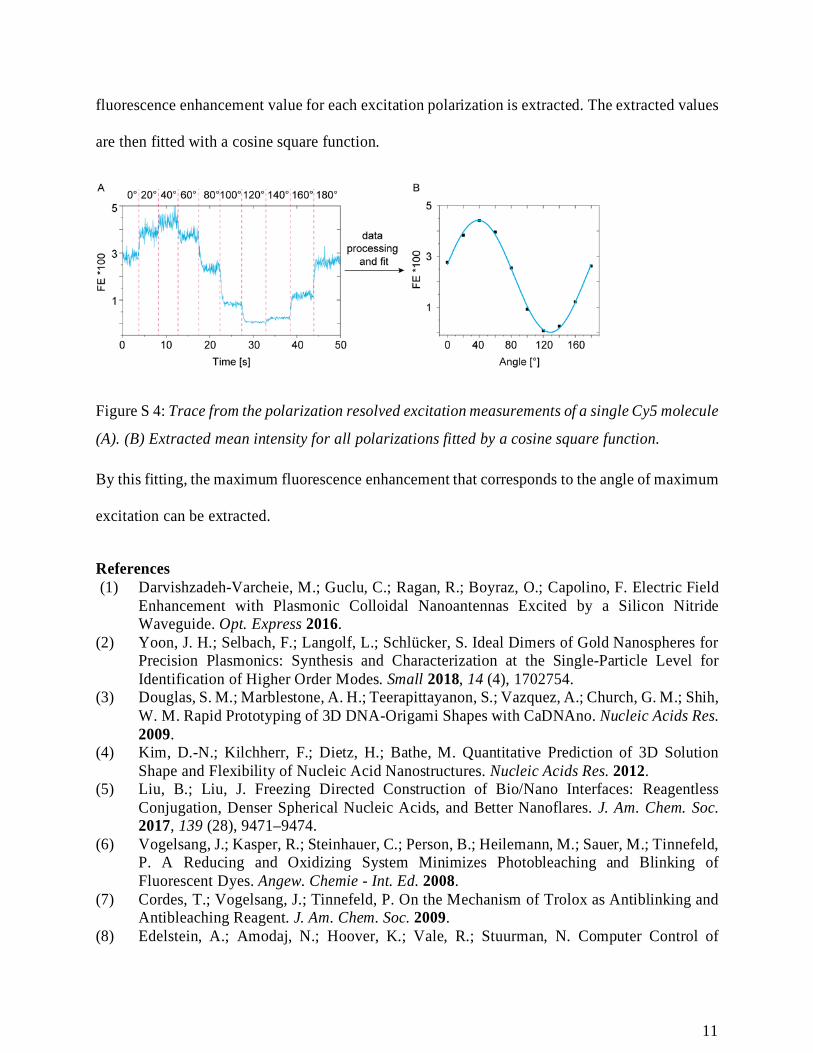
For extraction of the fluorescence enhancement, modulation and angle of maximum excitation the
modulating time traces of single molecules are processed and fitted (Figure S 4). Therefore, a mean
11
fluorescence enhancement value for each excitation polarization is extracted. The extracted values
are then fitted with a cosine square function.
Figure S 4: Trace from the polarization resolved excitation measurements of a single Cy5 molecule
(A). (B) Extracted mean intensity for all polarizations fitted by a cosine square function.
By this fitting, the maximum fluorescence enhancement that corresponds to the angle of maximum
excitation can be extracted.
References (1) Darvishzadeh-Varcheie, M.; Guclu, C.; Ragan, R.; Boyraz, O.; Capolino, F. Electric Field
Enhancement with Plasmonic Colloidal Nanoantennas Excited by a Silicon Nitride Waveguide. Opt. Express 2016.
(2) Yoon, J. H.; Selbach, F.; Langolf, L.; Schlücker, S. Ideal Dimers of Gold Nanospheres for Precision Plasmonics: Synthesis and Characterization at the Single-Particle Level for Identification of Higher Order Modes. Small 2018, 14 (4), 1702754.
(3) Douglas, S. M.; Marblestone, A. H.; Teerapittayanon, S.; Vazquez, A.; Church, G. M.; Shih, W. M. Rapid Prototyping of 3D DNA-Origami Shapes with CaDNAno. Nucleic Acids Res. 2009.
(4) Kim, D.-N.; Kilchherr, F.; Dietz, H.; Bathe, M. Quantitative Prediction of 3D Solution Shape and Flexibility of Nucleic Acid Nanostructures. Nucleic Acids Res. 2012.
(5) Liu, B.; Liu, J. Freezing Directed Construction of Bio/Nano Interfaces: Reagentless Conjugation, Denser Spherical Nucleic Acids, and Better Nanoflares. J. Am. Chem. Soc. 2017, 139 (28), 9471–9474.
(6) Vogelsang, J.; Kasper, R.; Steinhauer, C.; Person, B.; Heilemann, M.; Sauer, M.; Tinnefeld, P. A Reducing and Oxidizing System Minimizes Photobleaching and Blinking of Fluorescent Dyes. Angew. Chemie - Int. Ed. 2008.
(7) Cordes, T.; Vogelsang, J.; Tinnefeld, P. On the Mechanism of Trolox as Antiblinking and Antibleaching Reagent. J. Am. Chem. Soc. 2009.
(8) Edelstein, A.; Amodaj, N.; Hoover, K.; Vale, R.; Stuurman, N. Computer Control of

12
Microscopes Using Manager. Current Protocols in Molecular Biology. 2010. (9) Acuna, G. P.; Möller, F. M.; Holzmeister, P.; Beater, S.; Lalkens, B.; Tinnefeld, P.
Fluorescence Enhancement at Docking Sites of DNA-Directed Self-Assembled Nanoantennas. Science (80-. ). 2012, 338 (6106), 506–510.