Embed Size (px)
Citation preview
Directed Study Report
Name: Yibo Yao
WSU ID: 11252107
Advisor: Dr. Holder
School of Electrical Engineering and Computer Science
Washington State University, Pullman, WA 99164
Collection and Streaming of Graph Datasets
I Abstract
During the last decade, a large amount of data with structural information has
emerged in every aspect of human life. A graph-based representation has been used to
depict the entities and their relationships in those datasets, with vertices representing
entities and edges representing relational links among the entities. In this directed
study, we have collected several graph datasets which have dynamic natures from
various application domains and streamed them into GraphML format representations
according to certain time spans. This task will help us to understand the implicit
relations of entities within each dataset and facilitate our future research on graph-
based data mining.
II Introduction
Graph-structured data is becoming increasingly abundant and important in many
domains. The purpose of graph-based data mining is to discover interesting patterns
or novel knowledge within graph datasets. In the past years, most graph miners have
been focusing on dealing with static graphs which do not change over time. However,
with the large emergence of time series data, the current static graph representations
and miners will not be able to tackle these difficulties for their lack of dynamic
properties.
There are bunch of dynamic graph datasets which show temporal changing of
entities or their relations in our life, such as citation networks, biological networks,
communication networks, social networks, and so on. The relations between entities
in many real-world systems usually occur at a certain time period. To study the
temporal interactions among these real-world network graphs, a collection of typical
graph datasets which show temporal properties in entities or their relations, and a
good representation which can describe the dynamic natures of graphs, are needed to
facilitate the development of mining techniques on dynamic graph datasets. For these
reasons, in our directed study, we want to collect around ten graph datasets and stream
them into time series GraphML representations which will capture the dynamic
aspects of these datasets.
The rest of the report is organized as follows. Section III gives a brief
introduction of GraphML format, which is the graph representation we‟ve used in our
study. Section IV details the dynamic graph datasets we‟ve collected and their
corresponding GraphML representations. Some conclusions are drawn in Section V.
III GraphML
GraphML is an XML-based syntax for defining graphs. A GraphML format file can
describe the structural properties of a graph. It supports various forms of graphs
(directed graphs, undirected graphs, hierarchical graphs, and so on). We can use the
following syntax to define a graph:
A defined graph is denoted by a graph element. The declarations of nodes and edges
are nested inside a graph element. A node is defined with a node element, and an edge
with an edge element. GraphML is flexible for representing all kinds of graphs, and it
can contain directed and undirected edges at the same time. The XML attribute
edgedefault in a graph element declares the default direction of edges. Each node has
a unique node ID which is defined by the XML attribute id in a node element. An
edge is declared by using two endpoints with the XML attributes source and target in
an edge element, while the values of source and target must be IDs of nodes.
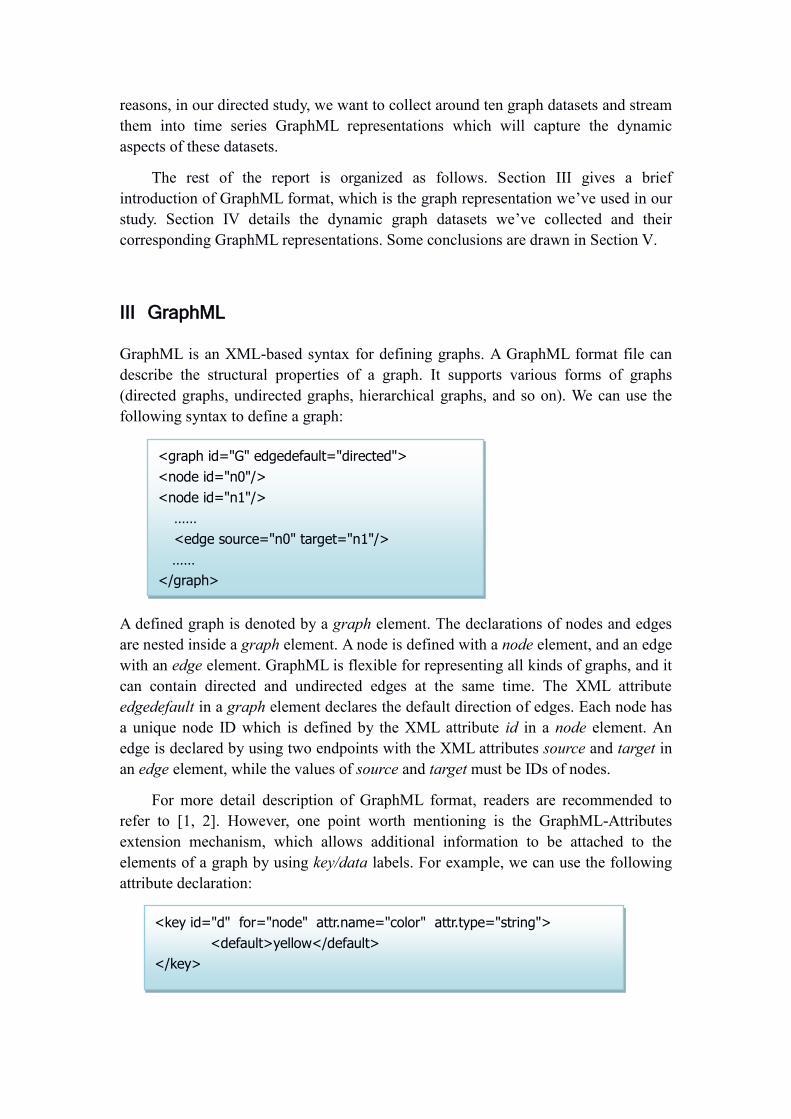
For more detail description of GraphML format, readers are recommended to
refer to [1, 2]. However, one point worth mentioning is the GraphML-Attributes
extension mechanism, which allows additional information to be attached to the
elements of a graph by using key/data labels. For example, we can use the following
attribute declaration:
<graph id="G" edgedefault="directed">
<node id="n0"/>
<node id="n1"/>
……
<edge source="n0" target="n1"/>
……
</graph>
<key id="d" for="node" attr.name="color" attr.type="string">
<default>yellow</default>
</key>
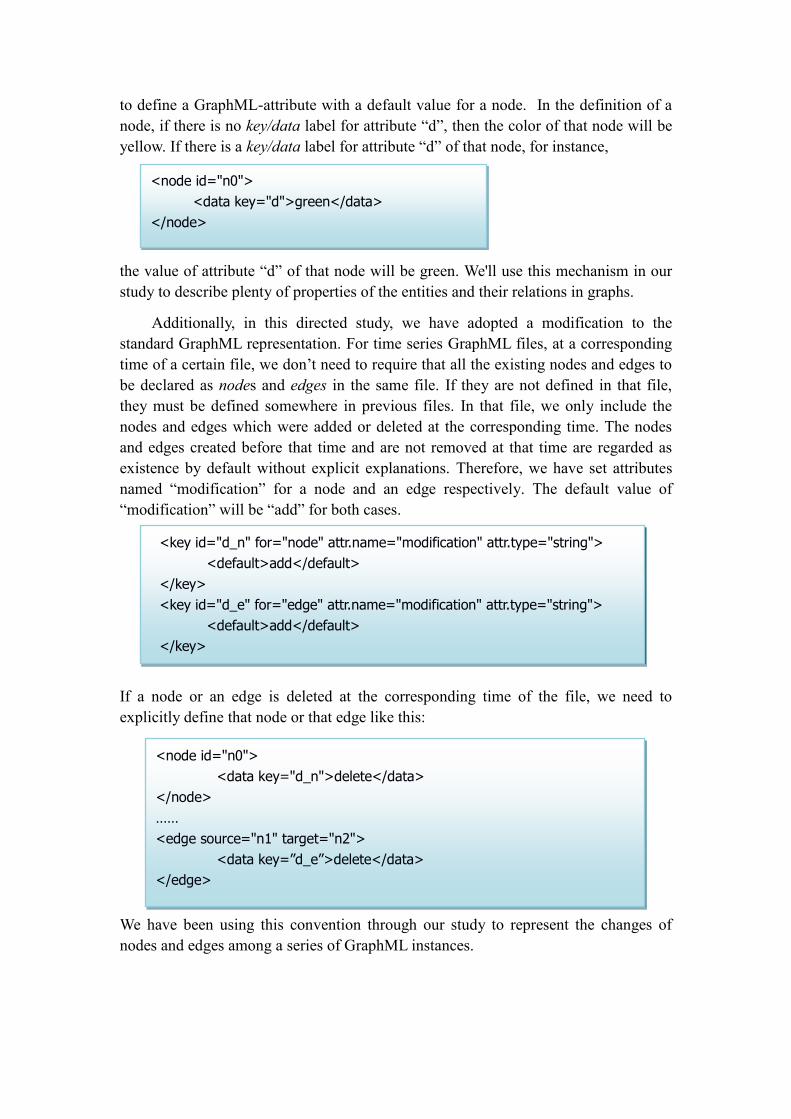
to define a GraphML-attribute with a default value for a node. In the definition of a
node, if there is no key/data label for attribute “d”, then the color of that node will be
yellow. If there is a key/data label for attribute “d” of that node, for instance,
the value of attribute “d” of that node will be green. We'll use this mechanism in our
study to describe plenty of properties of the entities and their relations in graphs.
Additionally, in this directed study, we have adopted a modification to the
standard GraphML representation. For time series GraphML files, at a corresponding
time of a certain file, we don‟t need to require that all the existing nodes and edges to
be declared as nodes and edges in the same file. If they are not defined in that file,
they must be defined somewhere in previous files. In that file, we only include the
nodes and edges which were added or deleted at the corresponding time. The nodes
and edges created before that time and are not removed at that time are regarded as
existence by default without explicit explanations. Therefore, we have set attributes
named “modification” for a node and an edge respectively. The default value of
“modification” will be “add” for both cases.
If a node or an edge is deleted at the corresponding time of the file, we need to
explicitly define that node or that edge like this:
We have been using this convention through our study to represent the changes of
nodes and edges among a series of GraphML instances.
<node id="n0">
<data key="d">green</data>
</node>
<node id="n0">
<data key="d_n">delete</data>
</node>
……
<edge source="n1" target="n2">
<data key=”d_e”>delete</data>
</edge>
<key id="d_n" for="node" attr.name="modification" attr.type="string">
<default>add</default>
</key>
<key id="d_e" for="edge" attr.name="modification" attr.type="string">
<default>add</default>
</key>
IV Datasets Description
We collected 11 graph datasets from various application domains. This section is
devoted to describing each of them in details.
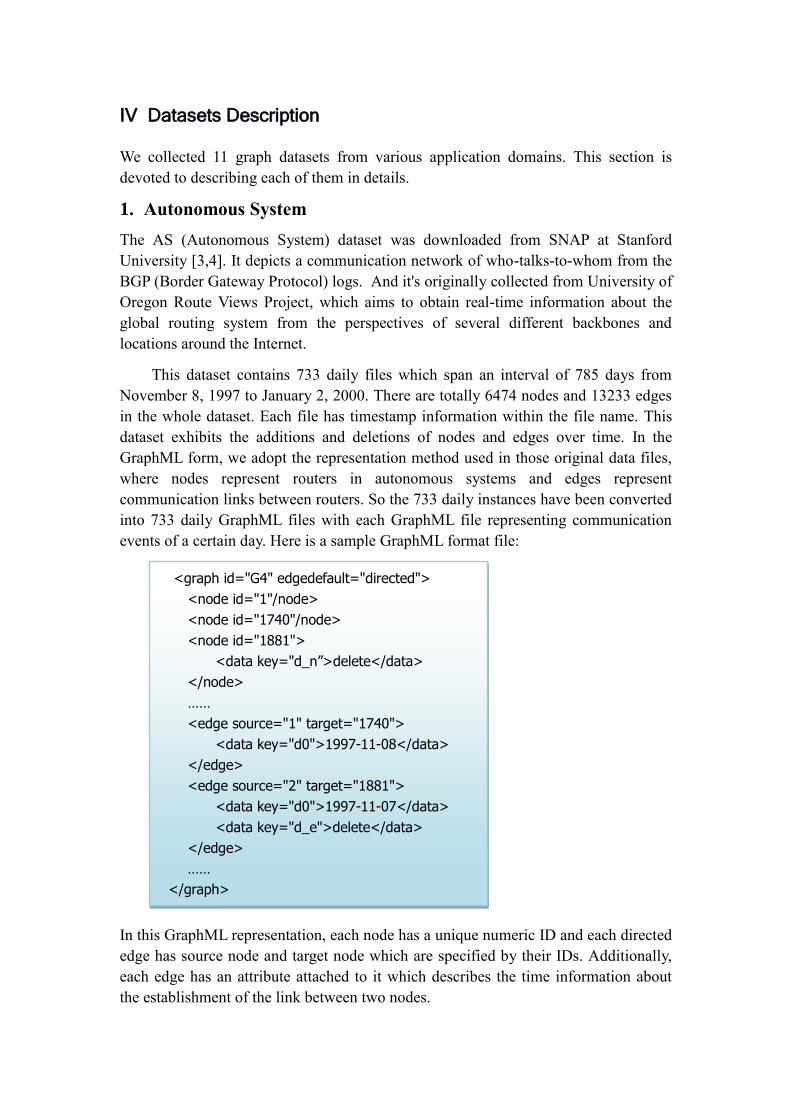
1. Autonomous System
The AS (Autonomous System) dataset was downloaded from SNAP at Stanford
University [3,4]. It depicts a communication network of who-talks-to-whom from the
BGP (Border Gateway Protocol) logs. And it's originally collected from University of
Oregon Route Views Project, which aims to obtain real-time information about the
global routing system from the perspectives of several different backbones and
locations around the Internet.
This dataset contains 733 daily files which span an interval of 785 days from
November 8, 1997 to January 2, 2000. There are totally 6474 nodes and 13233 edges
in the whole dataset. Each file has timestamp information within the file name. This
dataset exhibits the additions and deletions of nodes and edges over time. In the
GraphML form, we adopt the representation method used in those original data files,
where nodes represent routers in autonomous systems and edges represent
communication links between routers. So the 733 daily instances have been converted
into 733 daily GraphML files with each GraphML file representing communication
events of a certain day. Here is a sample GraphML format file:
In this GraphML representation, each node has a unique numeric ID and each directed
edge has source node and target node which are specified by their IDs. Additionally,
each edge has an attribute attached to it which describes the time information about
the establishment of the link between two nodes.
<graph id="G4" edgedefault="directed">
<node id="1"/node>
<node id="1740"/node>
<node id="1881">
<data key="d_n”>delete</data>
</node>
……
<edge source="1" target="1740">
<data key="d0">1997-11-08</data>
</edge>
<edge source="2" target="1881">
<data key="d0">1997-11-07</data>
<data key="d_e">delete</data>
</edge>
……
</graph>
2. Citation Network
For citation-like graphs, we've collected three datasets. Two of them are paper citation
networks downloaded from SNAP at Stanford University [4,5,6,7] and the third one is
patent citation network obtained from NBER [8,9].
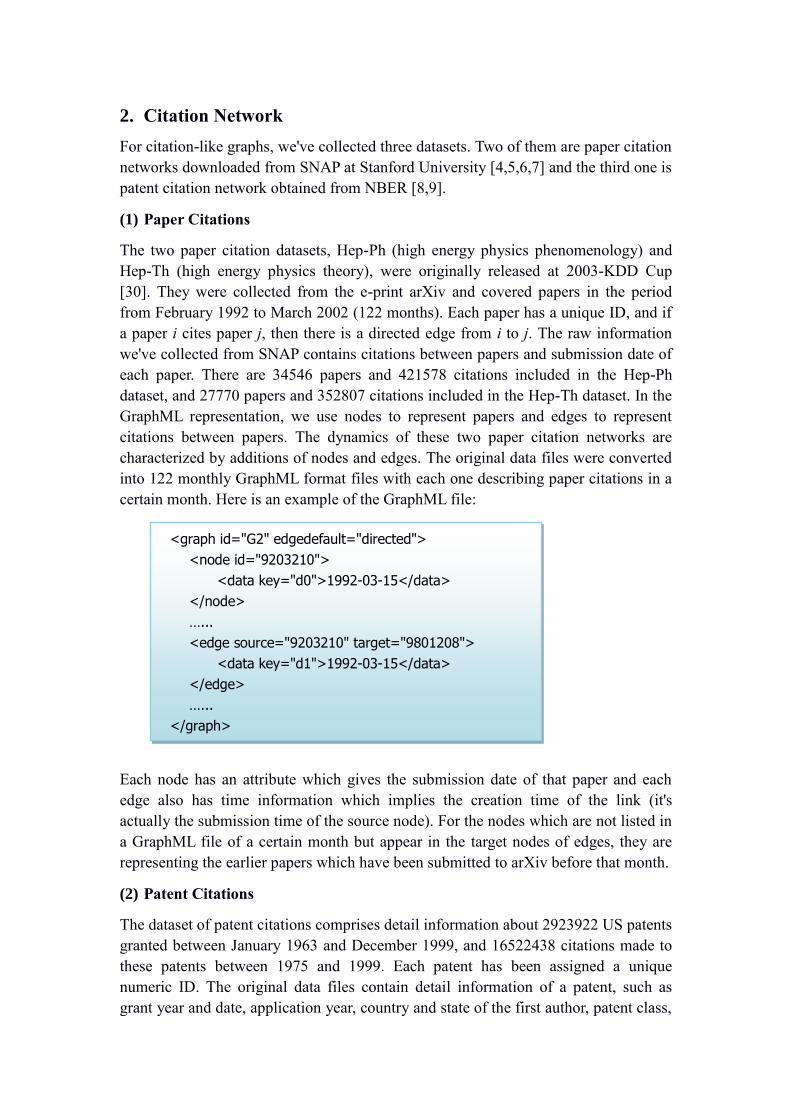
(1) Paper Citations
The two paper citation datasets, Hep-Ph (high energy physics phenomenology) and
Hep-Th (high energy physics theory), were originally released at 2003-KDD Cup
[30]. They were collected from the e-print arXiv and covered papers in the period
from February 1992 to March 2002 (122 months). Each paper has a unique ID, and if
a paper i cites paper j, then there is a directed edge from i to j. The raw information
we've collected from SNAP contains citations between papers and submission date of
each paper. There are 34546 papers and 421578 citations included in the Hep-Ph
dataset, and 27770 papers and 352807 citations included in the Hep-Th dataset. In the
GraphML representation, we use nodes to represent papers and edges to represent
citations between papers. The dynamics of these two paper citation networks are
characterized by additions of nodes and edges. The original data files were converted
into 122 monthly GraphML format files with each one describing paper citations in a
certain month. Here is an example of the GraphML file:
Each node has an attribute which gives the submission date of that paper and each
edge also has time information which implies the creation time of the link (it's
actually the submission time of the source node). For the nodes which are not listed in
a GraphML file of a certain month but appear in the target nodes of edges, they are
representing the earlier papers which have been submitted to arXiv before that month.
(2) Patent Citations
The dataset of patent citations comprises detail information about 2923922 US patents
granted between January 1963 and December 1999, and 16522438 citations made to
these patents between 1975 and 1999. Each patent has been assigned a unique
numeric ID. The original data files contain detail information of a patent, such as
grant year and date, application year, country and state of the first author, patent class,
<graph id="G2" edgedefault="directed">
<node id="9203210">
<data key="d0">1992-03-15</data>
</node>
…...
<edge source="9203210" target="9801208">
<data key="d1">1992-03-15</data>
</edge>
…...
</graph>
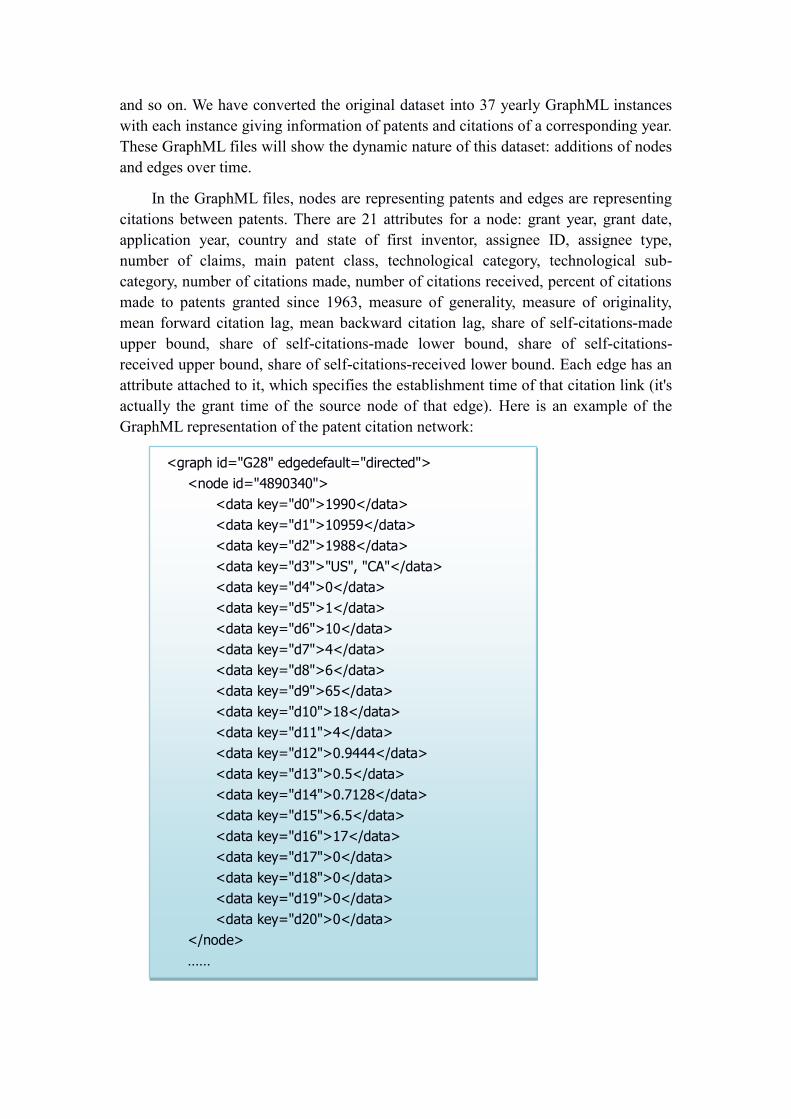
and so on. We have converted the original dataset into 37 yearly GraphML instances
with each instance giving information of patents and citations of a corresponding year.
These GraphML files will show the dynamic nature of this dataset: additions of nodes
and edges over time.
In the GraphML files, nodes are representing patents and edges are representing
citations between patents. There are 21 attributes for a node: grant year, grant date,
application year, country and state of first inventor, assignee ID, assignee type,
number of claims, main patent class, technological category, technological sub-
category, number of citations made, number of citations received, percent of citations
made to patents granted since 1963, measure of generality, measure of originality,
mean forward citation lag, mean backward citation lag, share of self-citations-made
upper bound, share of self-citations-made lower bound, share of self-citations-
received upper bound, share of self-citations-received lower bound. Each edge has an
attribute attached to it, which specifies the establishment time of that citation link (it's
actually the grant time of the source node of that edge). Here is an example of the
GraphML representation of the patent citation network:
<graph id="G28" edgedefault="directed">
<node id="4890340">
<data key="d0">1990</data>
<data key="d1">10959</data>
<data key="d2">1988</data>
<data key="d3">"US", "CA"</data>
<data key="d4">0</data>
<data key="d5">1</data>
<data key="d6">10</data>
<data key="d7">4</data>
<data key="d8">6</data>
<data key="d9">65</data>
<data key="d10">18</data>
<data key="d11">4</data>
<data key="d12">0.9444</data>
<data key="d13">0.5</data>
<data key="d14">0.7128</data>
<data key="d15">6.5</data>
<data key="d16">17</data>
<data key="d17">0</data>
<data key="d18">0</data>
<data key="d19">0</data>
<data key="d20">0</data>
</node>
……
3. Movie Database
There are two independent datasets in the Movie database: MovieLens dataset and
Hetrec dataset. They are both collected from GroupLens Research Project [24].
(1) MovieLens
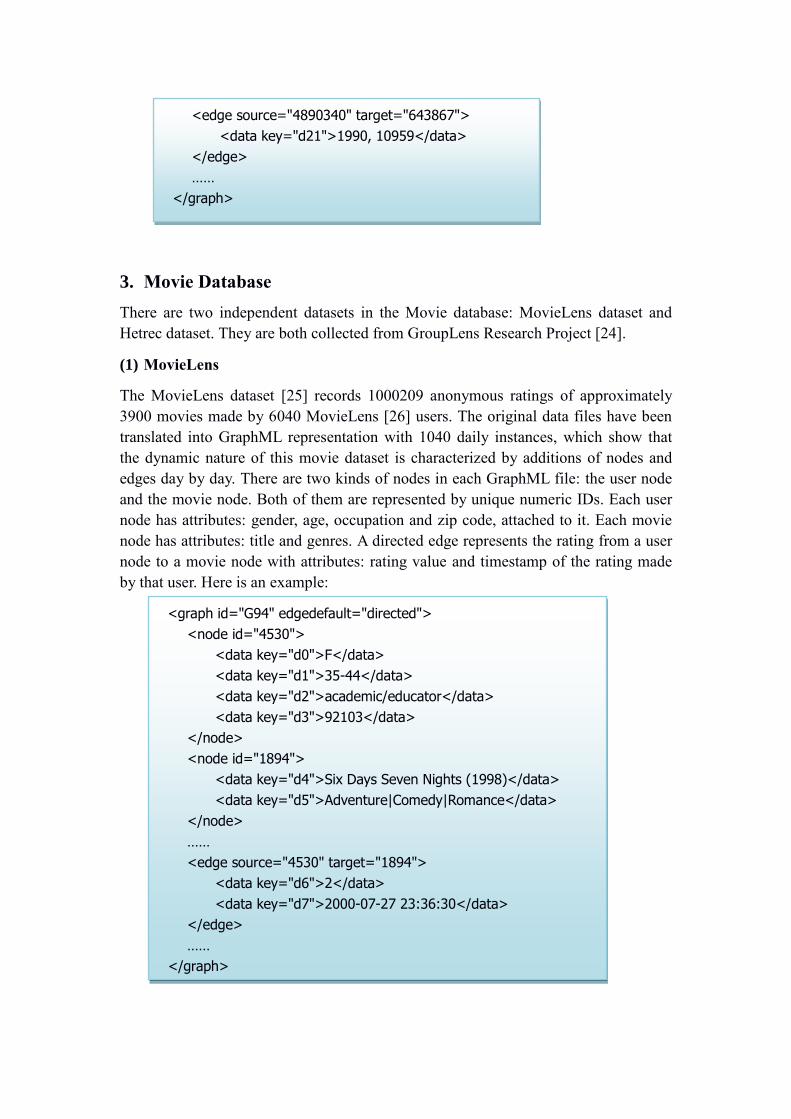
The MovieLens dataset [25] records 1000209 anonymous ratings of approximately
3900 movies made by 6040 MovieLens [26] users. The original data files have been
translated into GraphML representation with 1040 daily instances, which show that
the dynamic nature of this movie dataset is characterized by additions of nodes and
edges day by day. There are two kinds of nodes in each GraphML file: the user node
and the movie node. Both of them are represented by unique numeric IDs. Each user
node has attributes: gender, age, occupation and zip code, attached to it. Each movie
node has attributes: title and genres. A directed edge represents the rating from a user
node to a movie node with attributes: rating value and timestamp of the rating made
by that user. Here is an example:
<graph id="G94" edgedefault="directed">
<node id="4530">
<data key="d0">F</data>
<data key="d1">35-44</data>
<data key="d2">academic/educator</data>
<data key="d3">92103</data>
</node>
<node id="1894">
<data key="d4">Six Days Seven Nights (1998)</data>
<data key="d5">Adventure|Comedy|Romance</data>
</node>
……
<edge source="4530" target="1894">
<data key="d6">2</data>
<data key="d7">2000-07-27 23:36:30</data>
</edge>
……
</graph>
<edge source="4890340" target="643867">
<data key="d21">1990, 10959</data>
</edge>
……
</graph>
(2) Hetrec
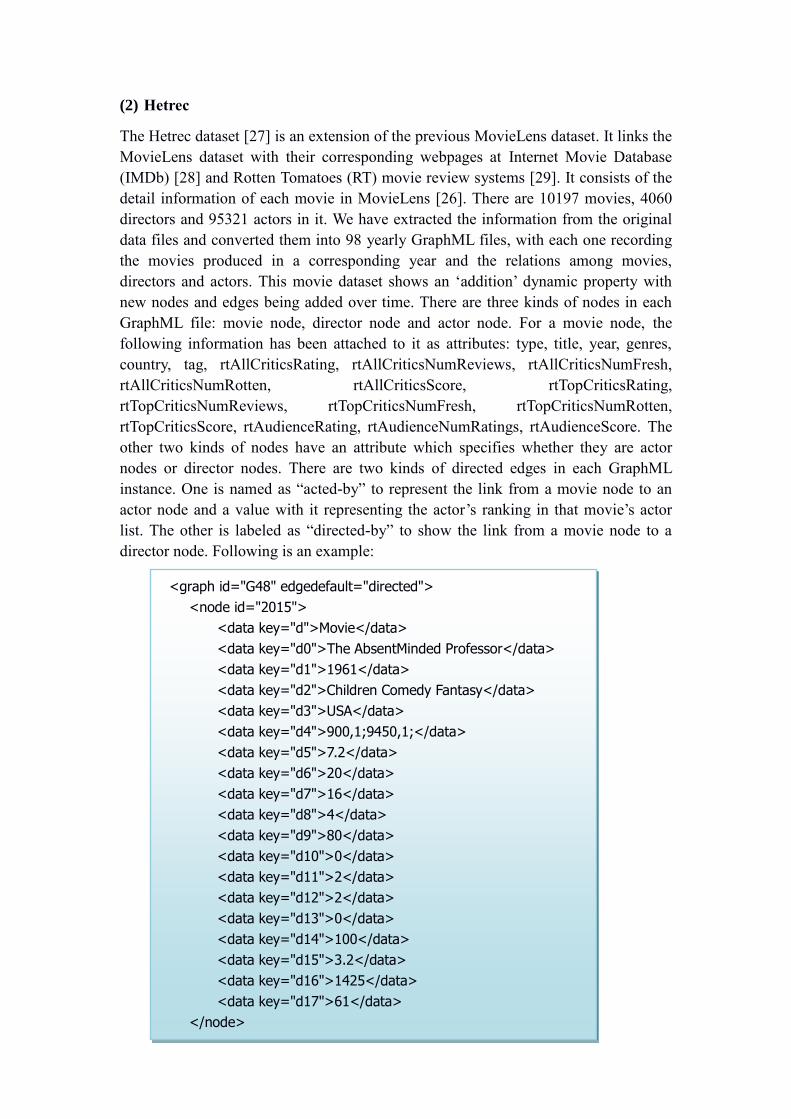
The Hetrec dataset [27] is an extension of the previous MovieLens dataset. It links the
MovieLens dataset with their corresponding webpages at Internet Movie Database
(IMDb) [28] and Rotten Tomatoes (RT) movie review systems [29]. It consists of the
detail information of each movie in MovieLens [26]. There are 10197 movies, 4060
directors and 95321 actors in it. We have extracted the information from the original
data files and converted them into 98 yearly GraphML files, with each one recording
the movies produced in a corresponding year and the relations among movies,
directors and actors. This movie dataset shows an „addition‟ dynamic property with
new nodes and edges being added over time. There are three kinds of nodes in each
GraphML file: movie node, director node and actor node. For a movie node, the
following information has been attached to it as attributes: type, title, year, genres,
country, tag, rtAllCriticsRating, rtAllCriticsNumReviews, rtAllCriticsNumFresh,
rtAllCriticsNumRotten, rtAllCriticsScore, rtTopCriticsRating,
rtTopCriticsNumReviews, rtTopCriticsNumFresh, rtTopCriticsNumRotten,
rtTopCriticsScore, rtAudienceRating, rtAudienceNumRatings, rtAudienceScore. The
other two kinds of nodes have an attribute which specifies whether they are actor
nodes or director nodes. There are two kinds of directed edges in each GraphML
instance. One is named as “acted-by” to represent the link from a movie node to an
actor node and a value with it representing the actor‟s ranking in that movie‟s actor
list. The other is labeled as “directed-by” to show the link from a movie node to a
director node. Following is an example:
<graph id="G48" edgedefault="directed">
<node id="2015">
<data key="d">Movie</data>
<data key="d0">The AbsentMinded Professor</data>
<data key="d1">1961</data>
<data key="d2">Children Comedy Fantasy</data>
<data key="d3">USA</data>
<data key="d4">900,1;9450,1;</data>
<data key="d5">7.2</data>
<data key="d6">20</data>
<data key="d7">16</data>
<data key="d8">4</data>
<data key="d9">80</data>
<data key="d10">0</data>
<data key="d11">2</data>
<data key="d12">2</data>
<data key="d13">0</data>
<data key="d14">100</data>
<data key="d15">3.2</data>
<data key="d16">1425</data>
<data key="d17">61</data>
</node>
4. Social Network Growth
The Social Network Growth data consists of three independent datasets: Flickr-
Growth, Youtube-Growth and Facebook-Growth. They were collected from Online
Social Networks Research [20]. These social network growth datasets are focusing on
the ways in which new user-user links are formed. Therefore, their dynamics are
characterized by additions of both nodes and edges over time. In Flickr-Growth
dataset [21,22], there are 950143 users and over 9.7million links. We converted the
Flickr-Growth dataset into 133 daily GraphML files which span an interval from
November 3, 2006 to May 18, 2007. There are 1138499 users and 4945383 links
covered in the period from December 10, 2006 to January 15, 2007 in the Youtube-
Growth dataset [21,23]. They have been translated into 37 daily GraphML instances.
For the Facebook-Growth dataset [10,11], it includes information about the evolving
link structure on the New Orleans regional network in Facebook. There are 90269
users and a list of 3646662 user-user links with timestamps representing the
establishment time of those links in the dataset. We have converted the original data
files into 869 daily GraphML instances which span an interval from September 5,
2006 to January 21, 2009.
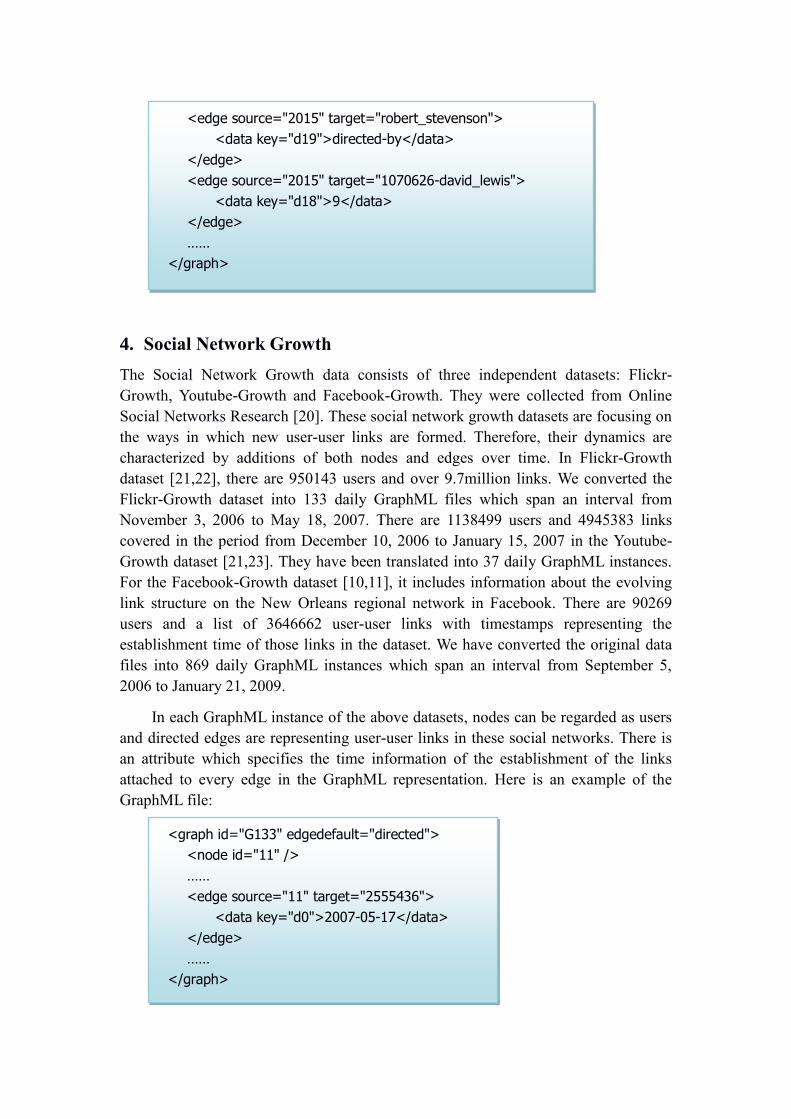
In each GraphML instance of the above datasets, nodes can be regarded as users
and directed edges are representing user-user links in these social networks. There is
an attribute which specifies the time information of the establishment of the links
attached to every edge in the GraphML representation. Here is an example of the
GraphML file:
<graph id="G133" edgedefault="directed">
<node id="11" />
……
<edge source="11" target="2555436">
<data key="d0">2007-05-17</data>
</edge>
……
</graph>
<edge source="2015" target="robert_stevenson">
<data key="d19">directed-by</data>
</edge>
<edge source="2015" target="1070626-david_lewis">
<data key="d18">9</data>
</edge>
……
</graph>
5. Tencent Weibo
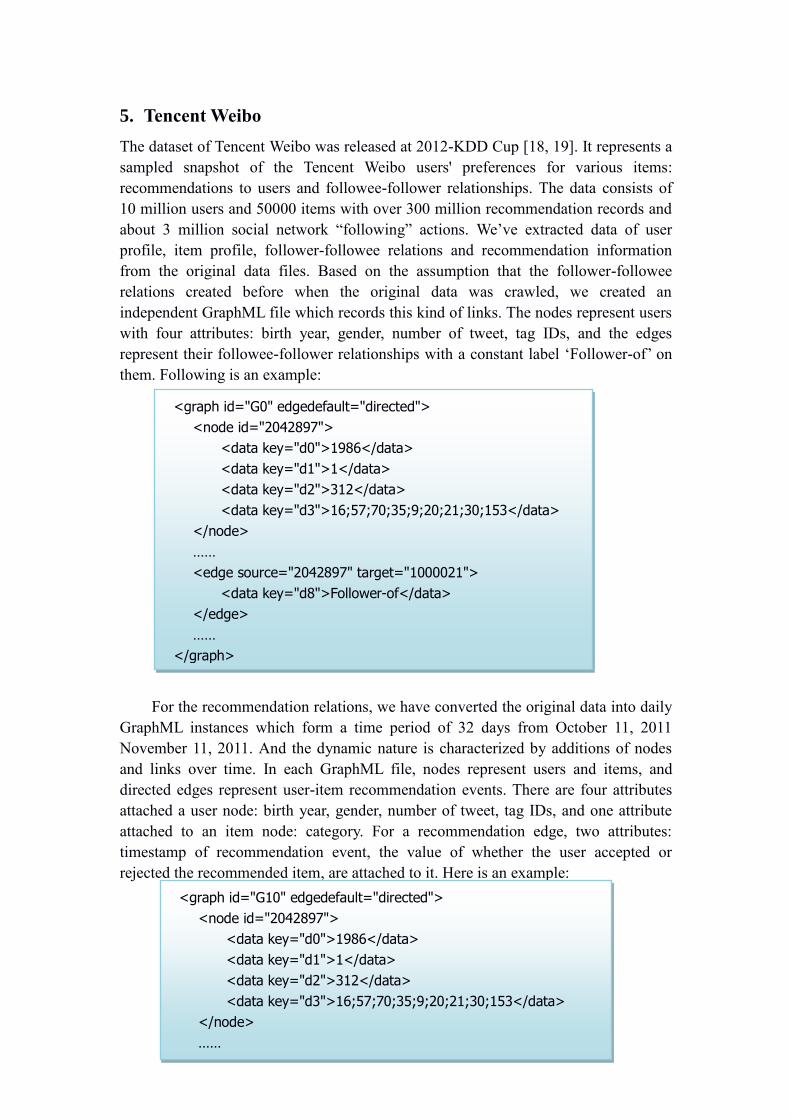
The dataset of Tencent Weibo was released at 2012-KDD Cup [18, 19]. It represents a
sampled snapshot of the Tencent Weibo users' preferences for various items:
recommendations to users and followee-follower relationships. The data consists of
10 million users and 50000 items with over 300 million recommendation records and
about 3 million social network “following” actions. We‟ve extracted data of user
profile, item profile, follower-followee relations and recommendation information
from the original data files. Based on the assumption that the follower-followee
relations created before when the original data was crawled, we created an
independent GraphML file which records this kind of links. The nodes represent users
with four attributes: birth year, gender, number of tweet, tag IDs, and the edges
represent their followee-follower relationships with a constant label „Follower-of‟ on
them. Following is an example:
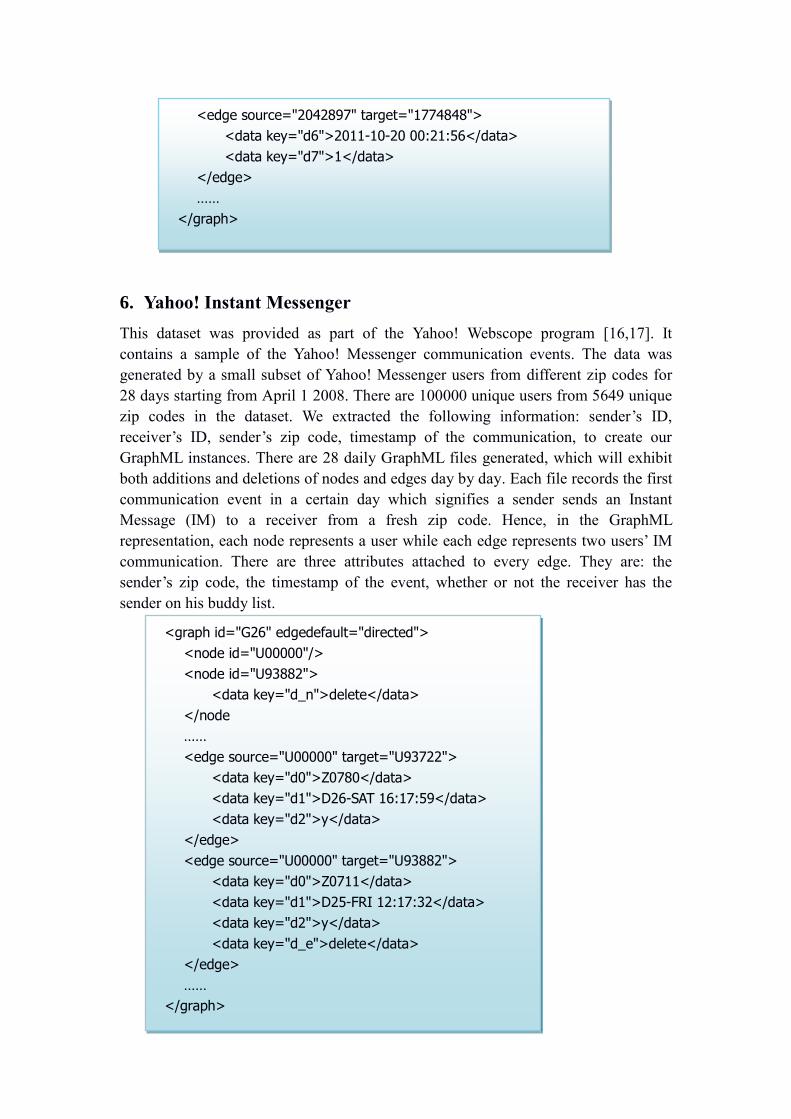
For the recommendation relations, we have converted the original data into daily
GraphML instances which form a time period of 32 days from October 11, 2011
November 11, 2011. And the dynamic nature is characterized by additions of nodes
and links over time. In each GraphML file, nodes represent users and items, and
directed edges represent user-item recommendation events. There are four attributes
attached a user node: birth year, gender, number of tweet, tag IDs, and one attribute
attached to an item node: category. For a recommendation edge, two attributes:
timestamp of recommendation event, the value of whether the user accepted or
rejected the recommended item, are attached to it. Here is an example:
<graph id="G0" edgedefault="directed">
<node id="2042897">
<data key="d0">1986</data>
<data key="d1">1</data>
<data key="d2">312</data>
<data key="d3">16;57;70;35;9;20;21;30;153</data>
</node>
……
<edge source="2042897" target="1000021">
<data key="d8">Follower-of</data>
</edge>
……
</graph>
<graph id="G10" edgedefault="directed">
<node id="2042897">
<data key="d0">1986</data>
<data key="d1">1</data>
<data key="d2">312</data>
<data key="d3">16;57;70;35;9;20;21;30;153</data>
</node>
……
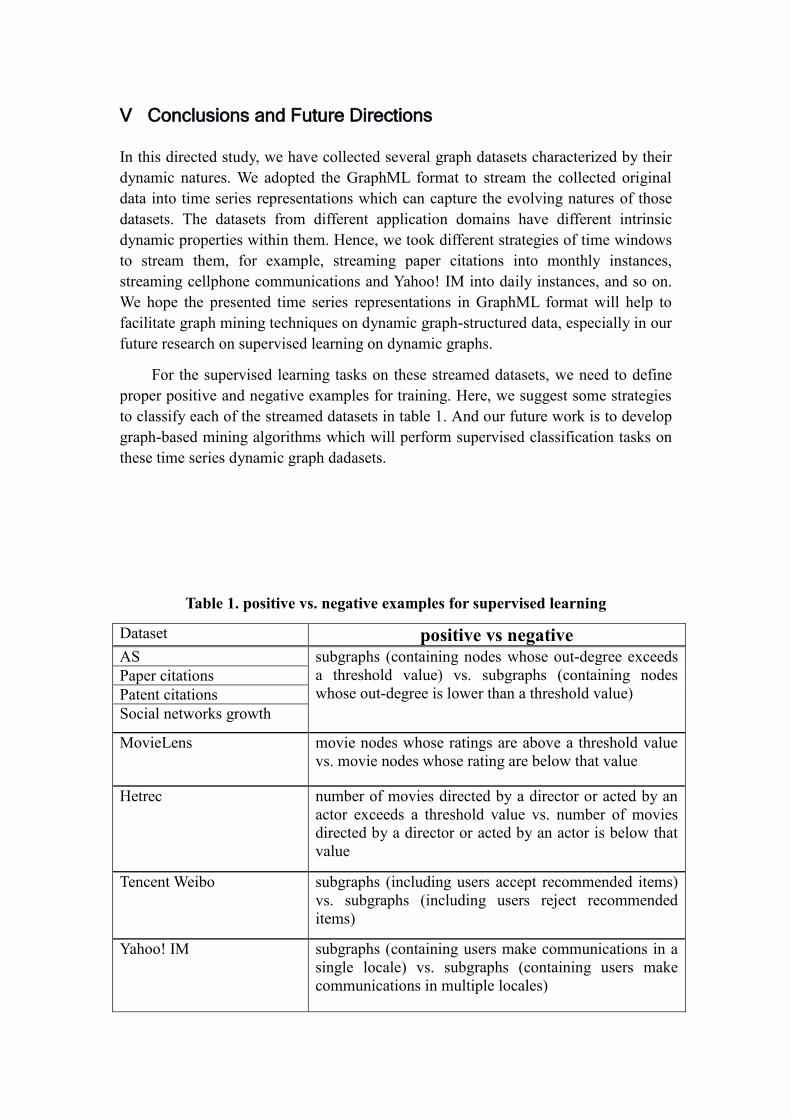
6. Yahoo! Instant Messenger
This dataset was provided as part of the Yahoo! Webscope program [16,17]. It
contains a sample of the Yahoo! Messenger communication events. The data was
generated by a small subset of Yahoo! Messenger users from different zip codes for
28 days starting from April 1 2008. There are 100000 unique users from 5649 unique
zip codes in the dataset. We extracted the following information: sender‟s ID,
receiver‟s ID, sender‟s zip code, timestamp of the communication, to create our
GraphML instances. There are 28 daily GraphML files generated, which will exhibit
both additions and deletions of nodes and edges day by day. Each file records the first
communication event in a certain day which signifies a sender sends an Instant
Message (IM) to a receiver from a fresh zip code. Hence, in the GraphML
representation, each node represents a user while each edge represents two users‟ IM
communication. There are three attributes attached to every edge. They are: the
sender‟s zip code, the timestamp of the event, whether or not the receiver has the
sender on his buddy list.
<edge source="2042897" target="1774848">
<data key="d6">2011-10-20 00:21:56</data>
<data key="d7">1</data>
</edge>
……
</graph>
<graph id="G26" edgedefault="directed">
<node id="U00000"/>
<node id="U93882">
<data key="d_n">delete</data>
</node
……
<edge source="U00000" target="U93722">
<data key="d0">Z0780</data>
<data key="d1">D26-SAT 16:17:59</data>
<data key="d2">y</data>
</edge>
<edge source="U00000" target="U93882">
<data key="d0">Z0711</data>
<data key="d1">D25-FRI 12:17:32</data>
<data key="d2">y</data>
<data key="d_e">delete</data>
</edge>
……
</graph>
V Conclusions and Future Directions
In this directed study, we have collected several graph datasets characterized by their
dynamic natures. We adopted the GraphML format to stream the collected original
data into time series representations which can capture the evolving natures of those
datasets. The datasets from different application domains have different intrinsic
dynamic properties within them. Hence, we took different strategies of time windows
to stream them, for example, streaming paper citations into monthly instances,
streaming cellphone communications and Yahoo! IM into daily instances, and so on.
We hope the presented time series representations in GraphML format will help to
facilitate graph mining techniques on dynamic graph-structured data, especially in our
future research on supervised learning on dynamic graphs.
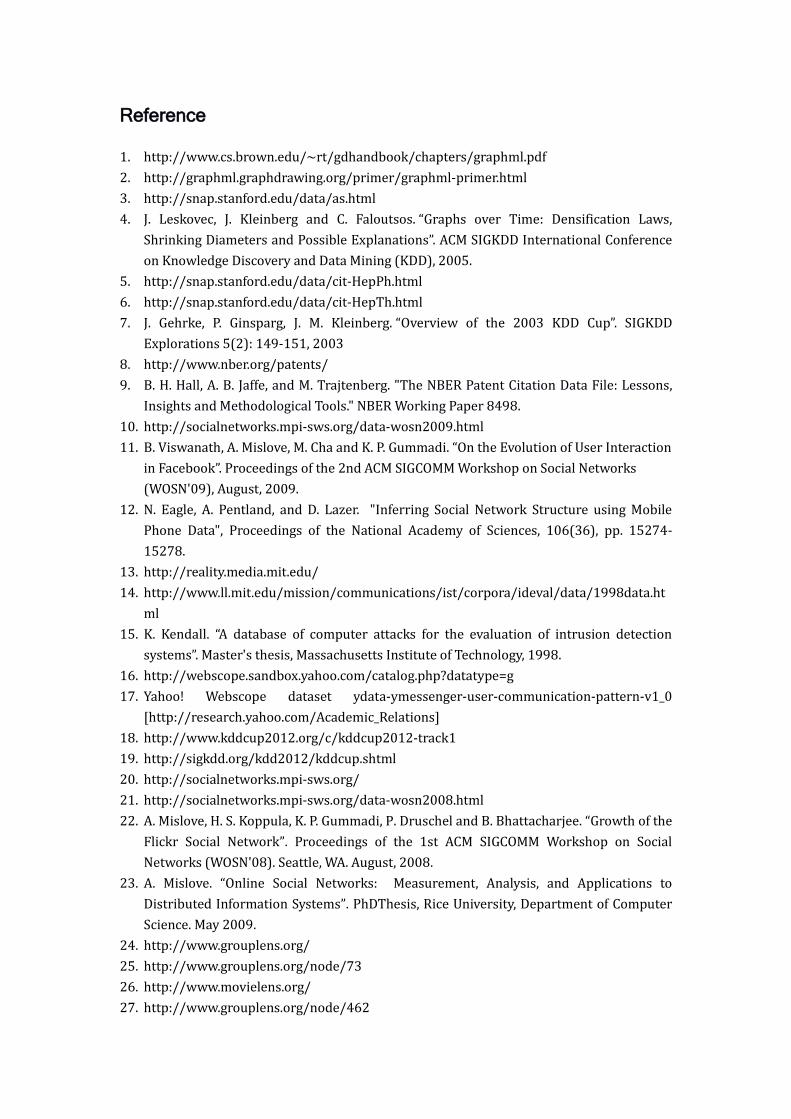
For the supervised learning tasks on these streamed datasets, we need to define
proper positive and negative examples for training. Here, we suggest some strategies
to classify each of the streamed datasets in table 1. And our future work is to develop
graph-based mining algorithms which will perform supervised classification tasks on
these time series dynamic graph dadasets.
Table 1. positive vs. negative examples for supervised learning
Dataset positive vs negative AS subgraphs (containing nodes whose out-degree exceeds
a threshold value) vs. subgraphs (containing nodes
whose out-degree is lower than a threshold value) Paper citations
Patent citations
Social networks growth
MovieLens movie nodes whose ratings are above a threshold value
vs. movie nodes whose rating are below that value
Hetrec number of movies directed by a director or acted by an
actor exceeds a threshold value vs. number of movies
directed by a director or acted by an actor is below that
value
Tencent Weibo subgraphs (including users accept recommended items)
vs. subgraphs (including users reject recommended
items)
Yahoo! IM subgraphs (containing users make communications in a
single locale) vs. subgraphs (containing users make
communications in multiple locales)
Reference
1. http://www.cs.brown.edu/~rt/gdhandbook/chapters/graphml.pdf
2. http://graphml.graphdrawing.org/primer/graphml-primer.html
3. http://snap.stanford.edu/data/as.html
4. J. Leskovec, J. Kleinberg and C. Faloutsos. “Graphs over Time: Densification Laws,
Shrinking Diameters and Possible Explanations”. ACM SIGKDD International Conference
on Knowledge Discovery and Data Mining (KDD), 2005.
5. http://snap.stanford.edu/data/cit-HepPh.html
6. http://snap.stanford.edu/data/cit-HepTh.html
7. J. Gehrke, P. Ginsparg, J. M. Kleinberg. “Overview of the 2003 KDD Cup”. SIGKDD
Explorations 5(2): 149-151, 2003
8. http://www.nber.org/patents/
9. B. H. Hall, A. B. Jaffe, and M. Trajtenberg. "The NBER Patent Citation Data File: Lessons,
Insights and Methodological Tools." NBER Working Paper 8498.
10. http://socialnetworks.mpi-sws.org/data-wosn2009.html
11. B. Viswanath, A. Mislove, M. Cha and K. P. Gummadi. “On the Evolution of User Interaction
in Facebook”. Proceedings of the 2nd ACM SIGCOMM Workshop on Social Networks
(WOSN'09), August, 2009.
12. N. Eagle, A. Pentland, and D. Lazer. "Inferring Social Network Structure using Mobile
Phone Data", Proceedings of the National Academy of Sciences, 106(36), pp. 15274-
15278.
13. http://reality.media.mit.edu/
14. http://www.ll.mit.edu/mission/communications/ist/corpora/ideval/data/1998data.ht
ml
15. K. Kendall. “A database of computer attacks for the evaluation of intrusion detection
systems”. Master's thesis, Massachusetts Institute of Technology, 1998.
16. http://webscope.sandbox.yahoo.com/catalog.php?datatype=g
17. Yahoo! Webscope dataset ydata-ymessenger-user-communication-pattern-v1_0
[http://research.yahoo.com/Academic_Relations]
18. http://www.kddcup2012.org/c/kddcup2012-track1
19. http://sigkdd.org/kdd2012/kddcup.shtml
20. http://socialnetworks.mpi-sws.org/
21. http://socialnetworks.mpi-sws.org/data-wosn2008.html
22. A. Mislove, H. S. Koppula, K. P. Gummadi, P. Druschel and B. Bhattacharjee. “Growth of the
Flickr Social Network”. Proceedings of the 1st ACM SIGCOMM Workshop on Social
Networks (WOSN'08). Seattle, WA. August, 2008.
23. A. Mislove. “Online Social Networks: Measurement, Analysis, and Applications to
Distributed Information Systems”. PhDThesis, Rice University, Department of Computer
Science. May 2009.
24. http://www.grouplens.org/
25. http://www.grouplens.org/node/73
26. http://www.movielens.org/
27. http://www.grouplens.org/node/462

28. http://www.imdb.com
29. http://www.rottentomatoes.com
30. http://www.cs.cornell.edu/projects/kddcup/
Appendix I
Table 2. Statistics of Datasets in the Report
Dataset Nodes; Edges Period Instance Span Dynamics
AS 6474; 13233 Nov 8, 1997 –
Jan 2, 2000 daily
addition,
deletion
HepPh 34546; 421578 Feb 1992 –
Mar 2002 monthly addition
HepTh 27770; 352807 Feb 1992 –
Mar 2002 monthly addition
Patent 2923922; 16522438 Jan 1963 –
Dec 1999 yearly addition
MovieLens 9940; 1000209 Apr 25, 2000 –
Feb 28, 2003 daily addition
Hetrec 109578; N/A 1903 – 2011 yearly addition
Flickr 950143; 9700000 Nov 3, 2006 –
May 18, 2007 daily addition
Youtube 1138499; 4945383 Dec 10, 2006 –
Jan 15, 2007 daily addition
Facebook 90269; 3646662 Sep 5, 2006 –
Jan 21, 2009 daily addition
Tencent 10050000; 3000000000 Oct 11, 2011 –
Nov 11, 2011 daily addition
Yahoo IM 100000; 3179718 Apr 1, 2008 –
Apr 28, 2008 daily
addition,
deletion