Embed Size (px)
Citation preview
Direct Observation of the Surface Segregation of Cu in Pd by Time-ResolvedPositron-Annihilation-Induced Auger Electron Spectroscopy
J. Mayer,1,2,* C. Hugenschmidt,1,2 and K. Schreckenbach1,2
1ZWE FRM II, Lichtenbergstraße 1, 85747 Garching, Germany2Physik Department E21, Technische Universitat Munchen, James Franck Straße, 85748 Garching, Germany†
(Received 13 July 2010; published 11 November 2010)
Density functional theory calculations predict the surface segregation of Cu in the second atomic layer
of Pd which has not been unambiguously confirmed by experiment so far. We report measurements on Pd
surfaces covered with three and six monolayers of Cu using element selective positron-annihilation-
induced Auger electron spectroscopy (PAES) which is sensitive to the topmost atomic layer. Moreover,
time-resolved PAES, which was applied for the first time, enables the investigation of the dynamics of
surface atoms and hence the observation of the segregation process. The time constant for segregation was
experimentally determined to � ¼ 1:38ð0:21Þ h, and the final segregated configuration was found to be
consistent with calculations. Time-dependent PAES is demonstrated to be a novel element selective
technique applicable for the investigation of, e.g., heterogeneous catalysis, corrosion, or surface alloying.
DOI: 10.1103/PhysRevLett.105.207401 PACS numbers: 78.70.Bj, 64.75.Nx, 68.35.Dv, 82.80.Pv
Pure Pd and Pd-based alloys are important materials,e.g., for hydrogen storage, hydrogen purification, and het-erogeneous catalysis. In particular, in Cu-Pd alloys theamount of Cu atoms and their exact position strongly affectthe mechanical stability and the catalytic properties ofPd membranes [1–3]. Density functional theory calcula-tions for Cu-Pd alloys predict the segregation of Cu in thesecond atomic layer of Pd [4,5], but the available experi-mental data for this system are still poor and the experi-ments done so far do not unambiguously confirm thetheory [6–8].
In the presented experiment we investigate the stabilityand dynamics of thin Cu layers on the surface of polycrys-talline Pd. In our approach, we use the extremely surfacesensitive and elemental selective analysis method ofpositron-annihilation-induced Auger electron spectros-copy (PAES) for the direct measurement of the surfacesegregation. In contrast to electron-induced Auger electronspectroscopy (EAES), which was applied as well, PAESintrinsically analyzesthe topmost atomic layer of a samplealmost exclusively [9–11]. In addition to the high surfacesensitivity that arises from the efficient trapping of thepositrons in a delocalized surface state, one benefits fromthe positron affinity Aþ which makes PAES a highlyelemental selective technique [12]. Consequently, if morethan one element is present at the surface, the positrons areattracted to the atoms with a higher relative positron affin-ity and thus annihilate preferably with electrons of therespective element [13].
Until now, the time for a single PAES measure-ment amounted to several days, and hence it was notpossible to investigate dynamic surface processes. Wecope with this challenge by using the high intensityneutron-induced positron source Munich (NEPOMUC)which delivers 9� 108 monoenergetic positrons per sec-
ond [14]. Additionally, the experimental setup was im-proved [15,16] in order to enable time dependent PAESand hence to monitor the dynamic behavior of Cu atoms ona Pd surface for the first time.For the presented PAES experiments a remoderated
20 eV positron beam with an intensity of 4� 107 eþs and
a diameter of 5 mm FWHM at the sample site was used[17]. The pressure in the analysis chamber amounted top < 3� 10�9 mbar, and all experiments were carriedout at room temperature. The pure samples, polycrystallineCu (purity> 99:999%) and polycrystalline Pd (purity>99:95%), with dimensions of 20� 20 mm were annealedand sputtered with an Arþ-ion beam of 1 keV energy. ThePd samples were coated with 2.88 atomic monolayers(ML) of Cu (sample 1) and 5.77 ML of Cu (sample 2),respectively, using an electron beam evaporator with anevaporation rate of 0:02 nm=s and a chamber pressure ofp < 2� 10�8 mbar. The evaporation rate was controlledwith a piezo thickness monitor. In addition to PAES, allsamples have also been characterized with EAES as acomplementary method.With the intense low energy positron beam NEPOMUC
and an improved setup of the PAES spectrometer [15,16],we succeeded to reduce the measurement time for a singlePAES spectrum to seven minutes. This is the shortestPAES spectrum recording time reported so far (compared,e.g., to [18,19]). Figure 1 shows the PAES spectra obtainedfor clean surfaces of Cu and Pd. The energy resolution
amounts to �EE < 5%, and the signal to noise ratio amounts
to at least 11:1. The Cu M2;3VV transition at 60 eV, as
well as the Pd N2;3VV transition at 45 eVand the Pd N1VVtransition at 80 eV, respectively, are clearly observ-able (Auger energy reference spectra are from [20]). Thedifferent absolute intensities of the respective peaks aredue to the different core annihilation probabilities of the
PRL 105, 207401 (2010) P HY S I CA L R EV I EW LE T T E R Sweek ending
12 NOVEMBER 2010
0031-9007=10=105(20)=207401(4) 207401-1 � 2010 The American Physical Society
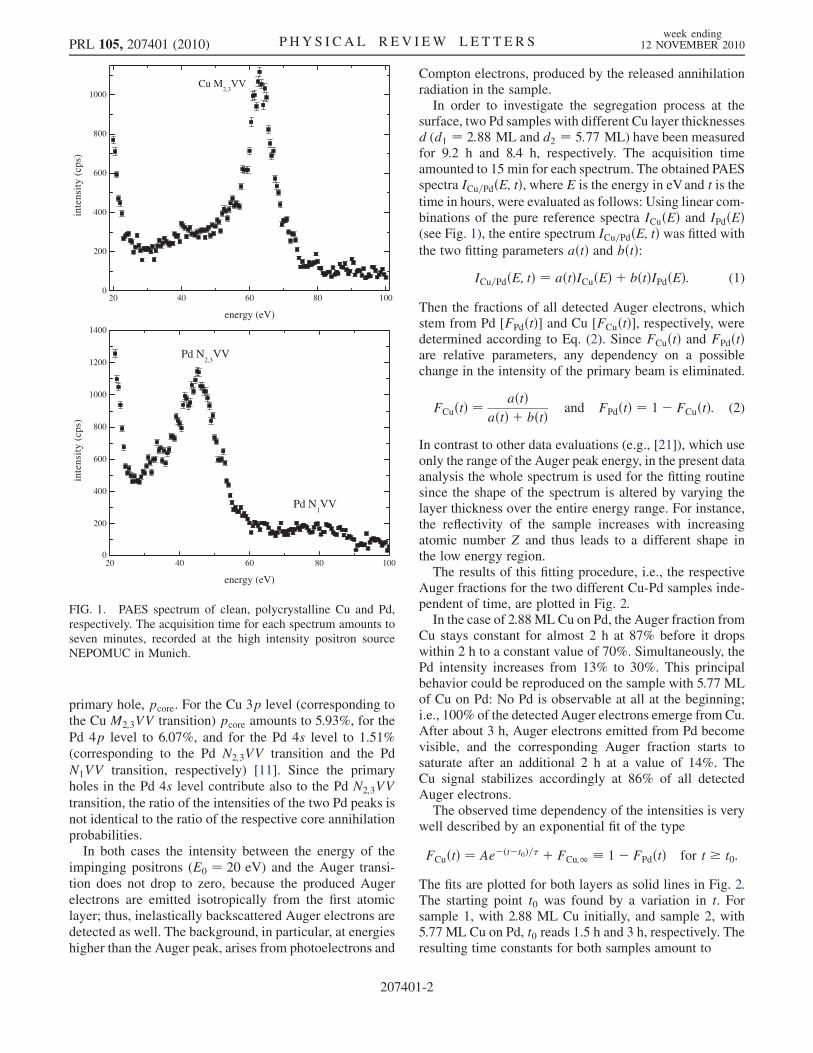
primary hole, pcore. For the Cu 3p level (corresponding tothe Cu M2;3VV transition) pcore amounts to 5.93%, for the
Pd 4p level to 6.07%, and for the Pd 4s level to 1.51%(corresponding to the Pd N2;3VV transition and the Pd
N1VV transition, respectively) [11]. Since the primaryholes in the Pd 4s level contribute also to the Pd N2;3VVtransition, the ratio of the intensities of the two Pd peaks isnot identical to the ratio of the respective core annihilationprobabilities.
In both cases the intensity between the energy of theimpinging positrons (E0 ¼ 20 eV) and the Auger transi-tion does not drop to zero, because the produced Augerelectrons are emitted isotropically from the first atomiclayer; thus, inelastically backscattered Auger electrons aredetected as well. The background, in particular, at energieshigher than the Auger peak, arises from photoelectrons and
Compton electrons, produced by the released annihilationradiation in the sample.In order to investigate the segregation process at the
surface, two Pd samples with different Cu layer thicknessesd (d1 ¼ 2:88 ML and d2 ¼ 5:77 ML) have been measuredfor 9.2 h and 8.4 h, respectively. The acquisition timeamounted to 15 min for each spectrum. The obtained PAESspectra ICu=PdðE; tÞ, where E is the energy in eVand t is thetime in hours, were evaluated as follows: Using linear com-binations of the pure reference spectra ICuðEÞ and IPdðEÞ(see Fig. 1), the entire spectrum ICu=PdðE; tÞ was fitted withthe two fitting parameters aðtÞ and bðtÞ:
ICu=PdðE; tÞ ¼ aðtÞICuðEÞ þ bðtÞIPdðEÞ: (1)
Then the fractions of all detected Auger electrons, whichstem from Pd [FPdðtÞ] and Cu [FCuðtÞ], respectively, weredetermined according to Eq. (2). Since FCuðtÞ and FPdðtÞare relative parameters, any dependency on a possiblechange in the intensity of the primary beam is eliminated.
FCuðtÞ ¼ aðtÞaðtÞ þ bðtÞ and FPdðtÞ ¼ 1� FCuðtÞ: (2)
In contrast to other data evaluations (e.g., [21]), which useonly the range of the Auger peak energy, in the present dataanalysis the whole spectrum is used for the fitting routinesince the shape of the spectrum is altered by varying thelayer thickness over the entire energy range. For instance,the reflectivity of the sample increases with increasingatomic number Z and thus leads to a different shape inthe low energy region.The results of this fitting procedure, i.e., the respective
Auger fractions for the two different Cu-Pd samples inde-pendent of time, are plotted in Fig. 2.In the case of 2.88MLCu on Pd, the Auger fraction from
Cu stays constant for almost 2 h at 87% before it dropswithin 2 h to a constant value of 70%. Simultaneously, thePd intensity increases from 13% to 30%. This principalbehavior could be reproduced on the sample with 5.77 MLof Cu on Pd: No Pd is observable at all at the beginning;i.e., 100% of the detected Auger electrons emerge from Cu.After about 3 h, Auger electrons emitted from Pd becomevisible, and the corresponding Auger fraction starts tosaturate after an additional 2 h at a value of 14%. TheCu signal stabilizes accordingly at 86% of all detectedAuger electrons.The observed time dependency of the intensities is very
well described by an exponential fit of the type
FCuðtÞ ¼ Ae�ðt�t0Þ=� þ FCu;1 � 1� FPdðtÞ for t � t0:
The fits are plotted for both layers as solid lines in Fig. 2.The starting point t0 was found by a variation in t. Forsample 1, with 2.88 ML Cu initially, and sample 2, with5.77 ML Cu on Pd, t0 reads 1.5 h and 3 h, respectively. Theresulting time constants for both samples amount to
20 40 60 80 1000
200
400
600
800
1000
inte
nsit
y (c
ps)
energy (eV)
Cu M2,3
VV
20 40 60 80 1000
200
400
600
800
1000
1200
1400
Pd N1VV
Pd N2,3
VV
inte
nsit
y (c
ps)
energy (eV)
FIG. 1. PAES spectrum of clean, polycrystalline Cu and Pd,respectively. The acquisition time for each spectrum amounts toseven minutes, recorded at the high intensity positron sourceNEPOMUC in Munich.
PRL 105, 207401 (2010) P HY S I CA L R EV I EW LE T T E R Sweek ending
12 NOVEMBER 2010
207401-2
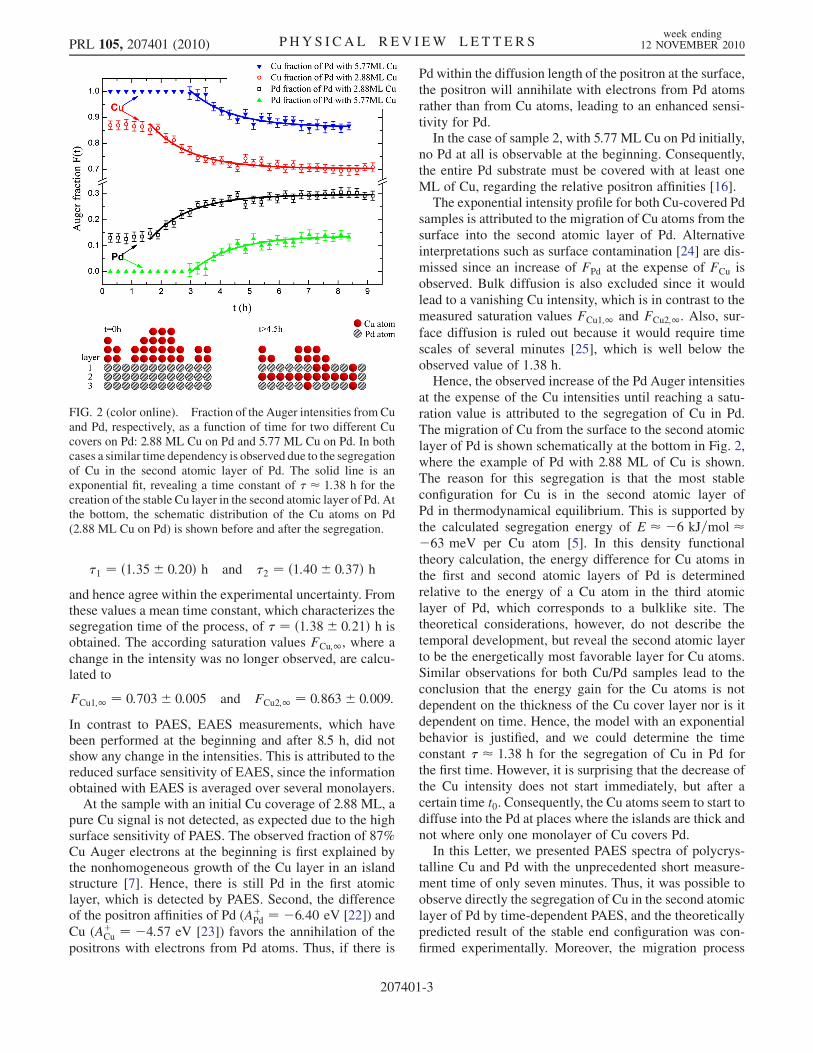
�1 ¼ ð1:35� 0:20Þ h and �2 ¼ ð1:40� 0:37Þ hand hence agree within the experimental uncertainty. Fromthese values a mean time constant, which characterizes thesegregation time of the process, of � ¼ ð1:38� 0:21Þ h isobtained. The according saturation values FCu;1, where a
change in the intensity was no longer observed, are calcu-lated to
FCu1;1 ¼ 0:703� 0:005 and FCu2;1 ¼ 0:863� 0:009:
In contrast to PAES, EAES measurements, which havebeen performed at the beginning and after 8.5 h, did notshow any change in the intensities. This is attributed to thereduced surface sensitivity of EAES, since the informationobtained with EAES is averaged over several monolayers.
At the sample with an initial Cu coverage of 2.88 ML, apure Cu signal is not detected, as expected due to the highsurface sensitivity of PAES. The observed fraction of 87%Cu Auger electrons at the beginning is first explained bythe nonhomogeneous growth of the Cu layer in an islandstructure [7]. Hence, there is still Pd in the first atomiclayer, which is detected by PAES. Second, the differenceof the positron affinities of Pd (Aþ
Pd ¼ �6:40 eV [22]) and
Cu (AþCu ¼ �4:57 eV [23]) favors the annihilation of the
positrons with electrons from Pd atoms. Thus, if there is
Pd within the diffusion length of the positron at the surface,the positron will annihilate with electrons from Pd atomsrather than from Cu atoms, leading to an enhanced sensi-tivity for Pd.In the case of sample 2, with 5.77 ML Cu on Pd initially,
no Pd at all is observable at the beginning. Consequently,the entire Pd substrate must be covered with at least oneML of Cu, regarding the relative positron affinities [16].The exponential intensity profile for both Cu-covered Pd
samples is attributed to the migration of Cu atoms from thesurface into the second atomic layer of Pd. Alternativeinterpretations such as surface contamination [24] are dis-missed since an increase of FPd at the expense of FCu isobserved. Bulk diffusion is also excluded since it wouldlead to a vanishing Cu intensity, which is in contrast to themeasured saturation values FCu1;1 and FCu2;1. Also, sur-face diffusion is ruled out because it would require timescales of several minutes [25], which is well below theobserved value of 1.38 h.Hence, the observed increase of the Pd Auger intensities
at the expense of the Cu intensities until reaching a satu-ration value is attributed to the segregation of Cu in Pd.The migration of Cu from the surface to the second atomiclayer of Pd is shown schematically at the bottom in Fig. 2,where the example of Pd with 2.88 ML of Cu is shown.The reason for this segregation is that the most stableconfiguration for Cu is in the second atomic layer ofPd in thermodynamical equilibrium. This is supported bythe calculated segregation energy of E � �6 kJ=mol ��63 meV per Cu atom [5]. In this density functionaltheory calculation, the energy difference for Cu atoms inthe first and second atomic layers of Pd is determinedrelative to the energy of a Cu atom in the third atomiclayer of Pd, which corresponds to a bulklike site. Thetheoretical considerations, however, do not describe thetemporal development, but reveal the second atomic layerto be the energetically most favorable layer for Cu atoms.Similar observations for both Cu/Pd samples lead to theconclusion that the energy gain for the Cu atoms is notdependent on the thickness of the Cu cover layer nor is itdependent on time. Hence, the model with an exponentialbehavior is justified, and we could determine the timeconstant � � 1:38 h for the segregation of Cu in Pd forthe first time. However, it is surprising that the decrease ofthe Cu intensity does not start immediately, but after acertain time t0. Consequently, the Cu atoms seem to start todiffuse into the Pd at places where the islands are thick andnot where only one monolayer of Cu covers Pd.In this Letter, we presented PAES spectra of polycrys-
talline Cu and Pd with the unprecedented short measure-ment time of only seven minutes. Thus, it was possible toobserve directly the segregation of Cu in the second atomiclayer of Pd by time-dependent PAES, and the theoreticallypredicted result of the stable end configuration was con-firmed experimentally. Moreover, the migration process
FIG. 2 (color online). Fraction of the Auger intensities fromCuand Pd, respectively, as a function of time for two different Cucovers on Pd: 2.88 ML Cu on Pd and 5.77 ML Cu on Pd. In bothcases a similar time dependency is observed due to the segregationof Cu in the second atomic layer of Pd. The solid line is anexponential fit, revealing a time constant of � � 1:38 h for thecreation of the stable Cu layer in the second atomic layer of Pd. Atthe bottom, the schematic distribution of the Cu atoms on Pd(2.88 ML Cu on Pd) is shown before and after the segregation.
PRL 105, 207401 (2010) P HY S I CA L R EV I EW LE T T E R Sweek ending
12 NOVEMBER 2010
207401-3
itself was observed with a characteristic time constant of� ¼ ð1:38� 0:21Þ h. With time-dependent PAES, it is nowpossible to measure elemental selective dynamic processessuch as heterogeneous catalysis, surface alloying, or cor-rosion processes of numerous systems with unprecedentedmeasurement times and extremely high surface sensitivity.
*[email protected]†http://e21.frm2.tum.de/nepomuc.html
[1] P. Kamakoti, B.D. Morreale, M.V. Ciocco, B. H. Howard,R. P. Killmeyer, A. V. Cugini, and D. S. Sholl, Science 307,569 (2005).
[2] O. Y. Vekilova, D. I. Bazhanov, S. I. Simak, and I. A.Abrikosov, Phys. Rev. B 80, 024101 (2009).
[3] S. Uemiyaa, Sep. Purif. Methods 28, 51 (1999).[4] S.M. Foiles, M. I. Baskes, and M. S. Daw, Phys. Rev. B
33, 7983 (1986).[5] O. Lvvik, Surf. Sci. 583, 100 (2005).[6] S. Lambert, B. Heinrichs, A. Brasseur, A. Rulmont, and J.-
P. Pirard, Appl. Catal., A 270, 201 (2004).[7] G. Bozzolo, J. E. Garcs, R. D. Noebe, P. Abel, and H.O.
Mosca, Prog. Surf. Sci. 73, 79 (2003).[8] L. Yang, Philos. Mag. A 80, 1879 (2000).[9] A. Weiss, R. Mayer, M. Jibaly, C. Lei, D. Mehl, and K.G.
Lynn, Phys. Rev. Lett. 61, 2245 (1988).[10] P. Schultz and K. Lynn, Rev. Mod. Phys. 60, 701 (1988).[11] K. O. Jensen and A. Weiss, Phys. Rev. B 41, 3928 (1990).[12] M. Puska and R. Nieminen, Rev. Mod. Phys. 66, 841
(1994).
[13] K. H. Lee, G. Yang, A. R. Koymen, K.O. Jensen, andA.H. Weiss, Phys. Rev. Lett. 72, 1866 (1994).
[14] C. Hugenschmidt, B. Lowe, J. Mayer, C. Piochacz, P.Pikart, R. Repper, M. Stadlbauer, and K. Schreckenbach,Nucl. Instrum. Methods Phys. Res., Sect. A 593, 616(2008).
[15] J. Mayer, K. Schreckenbach, and C. Hugenschmidt, Phys.Status Solidi C 6, 2468 (2009).
[16] J. Mayer, C. Hugenschmidt, and K. Schreckenbach, Surf.Sci. 604, 1772 (2010).
[17] C. Piochacz, G. Kogel, W. Egger, C. Hugenschmidt, J.Mayer, K. Schreckenbach, P. Sperr, M. Stadlbauer, and G.Dollinger, Appl. Surf. Sci. 255, 98 (2008).
[18] R. Suzuki, T. Ohdaira, T. Mikado, H. Ohgaki, M. Chiwaki,and T. Yamazaki, Appl. Surf. Sci. 100–101, 297(1996).
[19] C. Hugenschmidt, J. Mayer, and K. Schreckenbach, Surf.Sci. 601, 2459 (2007).
[20] P.W. Palmberg, G. E. Riach, R. E. Weber, and N. C.MacDonald, Handbook of Auger Electron Spectroscopy(Physical Electronics Ind., Edina, Minnesota,1972).
[21] N. Fazleev, J. Fry, M. Nadesalingam, and A. Weiss, Appl.Surf. Sci. 252, 3327 (2006).
[22] G. Fletcher, J. L. Fry, and P. C. Pattnaik, Phys. Rev. B 27,3987 (1983).
[23] M. Farjam and H.B. Shore, Phys. Rev. B 36, 5089 (1987).[24] J. Mayer, C. Hugenschmidt, and K. Schreckenbach, Appl.
Surf. Sci. 255, 220 (2008).[25] T. Michely and J. Krug, Islands, Mounds, and Atoms:
Patterns and Processes in Crystal Growth Far fromEquilibrium (Springer, New York, 2004).
PRL 105, 207401 (2010) P HY S I CA L R EV I EW LE T T E R Sweek ending
12 NOVEMBER 2010
207401-4