Embed Size (px)
Citation preview

1
Direct observation of repeated infections with endemic 1
coronaviruses 2
3
Marta Galanti, Jeffrey Shaman 4
5
6
Department of Environmental Health Sciences, Mailman School of Public Health, 7
Columbia University, 722 West 168th Street, New York, NY 10032 8
9
10
11
Corresponding author - contact information 12
Dr. Marta Galanti 13
Post-Doctoral Research Scientist, 14
Department of Environmental Health Sciences 15
Mailman School of Public Health 16
722 West 168th St. NY, NY 10032 17
Columbia University 18
20
21
22
2
Abstract 23
24
Background 25
26
While the mechanisms of adaptive immunity to pandemic coronavirus SARS-CoV-2 are still 27
unknown, the immune response to the widespread endemic coronaviruses HKU1, 229E, NL63 28
and OC43 provide a useful reference for understanding repeat infection risk. 29
30
Methods 31
32
Here we used data from proactive sampling carried out in New York City from fall 2016 to 33
spring 2018. We combined weekly nasal swab collection with self-reports of respiratory 34
symptoms from 191 participants to investigate the profile of recurring infections with endemic 35
coronaviruses. 36
37
Findings 38
39
During the study, 12 individuals tested positive multiple times for the same coronavirus. We 40
found no significant difference between the probability of testing positive at least once and the 41
probability of a recurrence for the beta-coronaviruses HKU1 and OC43 at 34 weeks after 42
enrollment/first infection. We also found no significant association between repeat infections and 43
symptom severity but strong association between symptom severity and belonging to the same 44
family. 45
3
46
Interpretation 47
48
This study provides evidence that re-infections with the same endemic coronavirus are not 49
atypical in a time window shorter than 1 year and that the genetic basis of innate immune 50
response may be a greater determinant of infection severity than immune memory acquired after 51
a previous infection. 52
53
Funding 54
55
This work was supported by the Defense Advanced Research Projects Agency contract 56
W911NF-16-2-0035. 57
58
Research in Context 59
60
Evidence before the study 61
62
The endemic coronaviruses OC43, HKU1, 229E and NL63 produce widespread infections in the 63
general population. Serological and experimental studies have shown that a majority of the 64
individuals presents a baseline level of antibodies against these coronaviruses and that 65
subsequent reinfections with the same type are possible. 66
67
Added value of this study 68

4
69
Through direct measurement of natural coronavirus infections in a cohort of children and adults, 70
this study confirms the findings of prior serological and experimental studies, and enables 71
quantification of the likelihood and timing of re-infections. Moreover, the design of the study, 72
coupling weekly testing (irrespective of symptom status) with self-report of daily symptoms 73
from the participants, shows that reinfection events within a year after a previous documented 74
infection are not associated with diminished symptom severity. Finally, the study shows 75
correlation in symptom severity across subsequent infections for the same individuals and for 76
individuals belonging to the same family, suggesting a strong genetic determinant of immune 77
response. 78
79
Implication of all available evidence 80
81
The results of this study, together with previous serological and experimental studies, provide 82
evidence that immunity developed upon infection with endemic coronaviruses is short-lived and 83
re-infection is common within one year. These findings, as well as findings for SARS and 84
MERS, provide context for understanding protective immunity against repeat SARS-CoV-2 85
infections. 86
87
88
89
90
91
5
Background 92
93
The new coronavirus SARS-CoV-2 appears to have emerged in humans in the Hubei province of 94
China during November 2019 [1]. Human to human transmission was confirmed in early 95
January, and since then the virus has rapidly spread to all continents. The outbreak was declared 96
a pandemic by the WHO on March 11th. As of April 10th, it had spread to over 180 countries 97
with 1,521,252 confirmed cases and 92,798 deaths reported [2]. 98
99
Symptoms associated with SARS-CoV-2 vary from none to extremely severe, with elder adults 100
and people with underlying medical conditions more at risk for developing severe and potentially 101
fatal disease [3]. At present, there is no vaccine or approved antiviral treatment for SARS-CoV-102
2, and therapies rely principally on symptom management. Many institutions across the world 103
are working to develop a SARS-CoV-2 vaccine, and clinical trials with some vaccine candidates 104
have already begun [4]. 105
106
As the pandemic progresses, infecting millions of people across the world, a key question is 107
whether individuals upon recovery are prone to repeat infection. A recent animal challenge study 108
showed evidence of (at least) short-term protection against re-infections in rhesus macaques 109
experimentally re-infected 4 weeks after first infection [5]. Typically, infections by different 110
viruses trigger different adaptive immune responses: viruses like measles elicit life-long 111
immunity; whereas others, like influenza, do not. Two main processes appear to be responsible 112
for the short-lived immunity engendered against some pathogens: 1) waning of antibodies and 113
6
memory cells in the host system; and 2) antigenic drift of the pathogen that enables escape from 114
the immunity built against previous strains. 115
116
To contextualize the issue of protective immunity to SARS-CoV-2, we here present findings 117
from a recent proactive sampling project carried out in New York City (NYC) that documented 118
rates of infection and re-infection among individuals shedding seasonal CoV (types: HKU1, 119
229E, NL63 and OC43). The results are discussed and analyzed in the broader context of 120
coronavirus infections. 121
122
123

7
Methods 124
125
Data are derived from sampling performed between October 2016 and April 2018 as part of the 126
Virome project, a proactive sampling of respiratory virus infection rates, associated symptom 127
self-reports and rates of seeking clinical care. We enrolled 214 healthy individuals from multiple 128
locations in the Manhattan borough of New York City. Cohort composition is described in [6] 129
and includes: children attending two daycares, along with their siblings and parents; teenagers 130
and teachers from a high school; adults working at two emergency departments (a pediatric and 131
an adult hospital); and adults working at a university medical center. The cohort was obtained 132
using convenience sampling, and all participants were younger than 65 years. While the study 133
period spanned 19 months from October 2016 to April 2018, some individuals enrolled for a 134
single cold and flu season (October – April) and others for the entire study period. Participants 135
(or their guardians, if minors) provided informed consent after reading a detailed description of 136
the study (CUMC IRB AAAQ4358). 137
138
Nasopharyngeal samples were collected by study coordinators once a week irrespective of 139
participant symptoms. Samples were screened using the GenMark eSensor RVP system for 18 140
different respiratory viruses, including coronavirus 229E, NL63, OC43, and HKU1. Sample 141
collection and extraction followed the same protocol as in [7]. 142
143
In addition, participants completed daily self-reports rating nine respiratory illness-related 144
symptoms (fever, chills, muscle pain, watery eyes, runny nose, sneezing, sore throat, cough, 145
8
chest pain), each of which was recorded on a Likert scale (0=none, 1=mild, 2=moderate, 146
3=severe), see [6] for further survey details. 147
148
For this analysis, only the 191 participants who contributed at least six separate pairs of 149
nasopharyngeal samples in the same season were included. We defined an infection (or viral) 150
episode as a group of consecutive weekly specimens from a given individual that were positive 151
for the same virus (allowing for a one-week gap to account for false negatives and temporary low 152
shedding). We classified all infection episodes as symptomatic or asymptomatic according to 153
individual symptom scores in the days surrounding the date of the first positive swab of an 154
episode. We used multiple definitions as a standard for symptomatic infection does not exist 155
(Table 1). These symptom definitions are described in reference to a -3 to +7-day window 156
around the date of the initial positive swab for each infection episode. The daily symptom score 157
is defined as the sum of the 9 individual symptoms (range: 0-27) on a given day. Total symptom 158
score is the daily symptom score summed over the -3 to +7-day window. 159
160
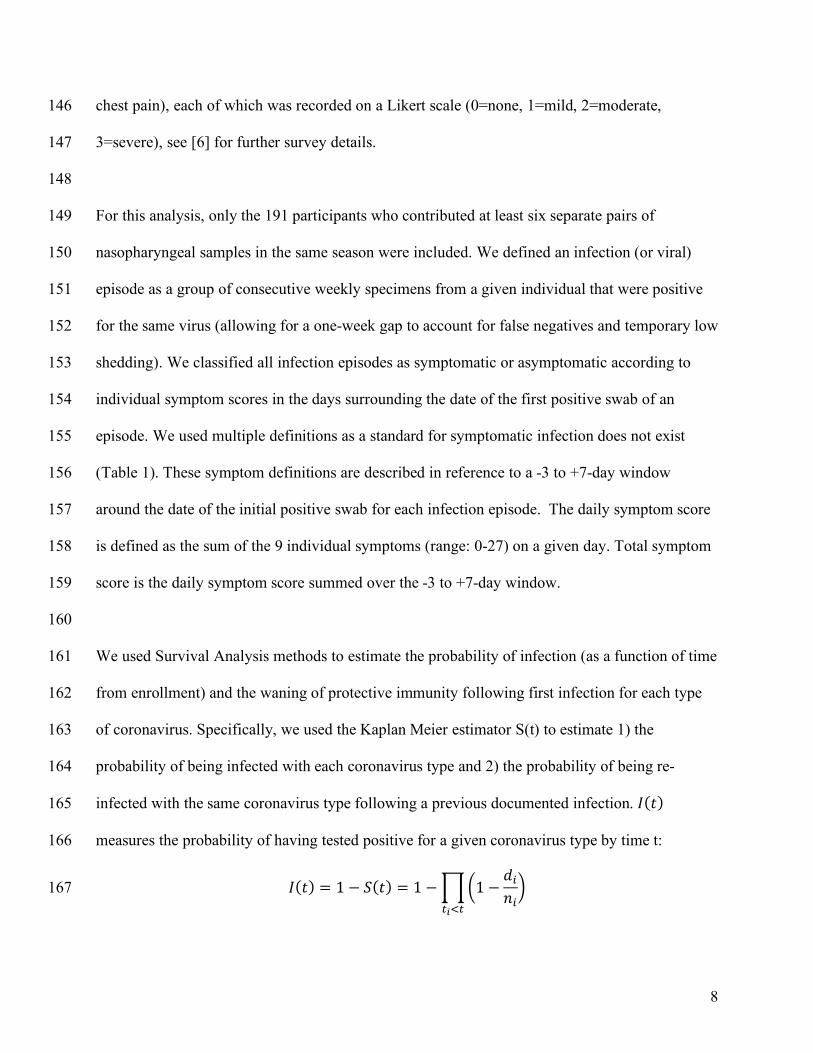
We used Survival Analysis methods to estimate the probability of infection (as a function of time 161
from enrollment) and the waning of protective immunity following first infection for each type 162
of coronavirus. Specifically, we used the Kaplan Meier estimator S(t) to estimate 1) the 163
probability of being infected with each coronavirus type and 2) the probability of being re-164
infected with the same coronavirus type following a previous documented infection. 𝐼(𝑡) 165
measures the probability of having tested positive for a given coronavirus type by time t: 166
𝐼(𝑡) = 1 − 𝑆(𝑡) = 1 −)*1 −𝑑,𝑛,.
/01/
167

9
Time t is measured in weeks from enrollment in the first analysis and from the previous 168
documented infection with a specific coronavirus type in the second analysis; 𝑑, are the 169
participants testing positive i weeks after enrollment (after first infection) and 𝑛, are the 170
participants that are still enrolled i weeks after enrollment (after first infection). The denominator 171
𝑛, corrects for participants withdrawing from the study at different time by right censoring. 172
173
The estimators for the probability of infection and reinfection are compared statistically using the 174
log rank test. We used Fisher’s exact test to analyze the difference between symptoms developed 175
during subsequent infections and ANOVA comparison to test differences in symptom scores 176
reported by different family clusters. We restricted the last analysis to the family clusters within 177
the cohort that presented at least 3 coronavirus infections during the study. 178
179
Results 180
181
Among all participants enrolled, 86 individuals tested positives at least once during the study for 182
any coronavirus infection. 48 individuals tested positive at least once for OC43, 31 tested 183
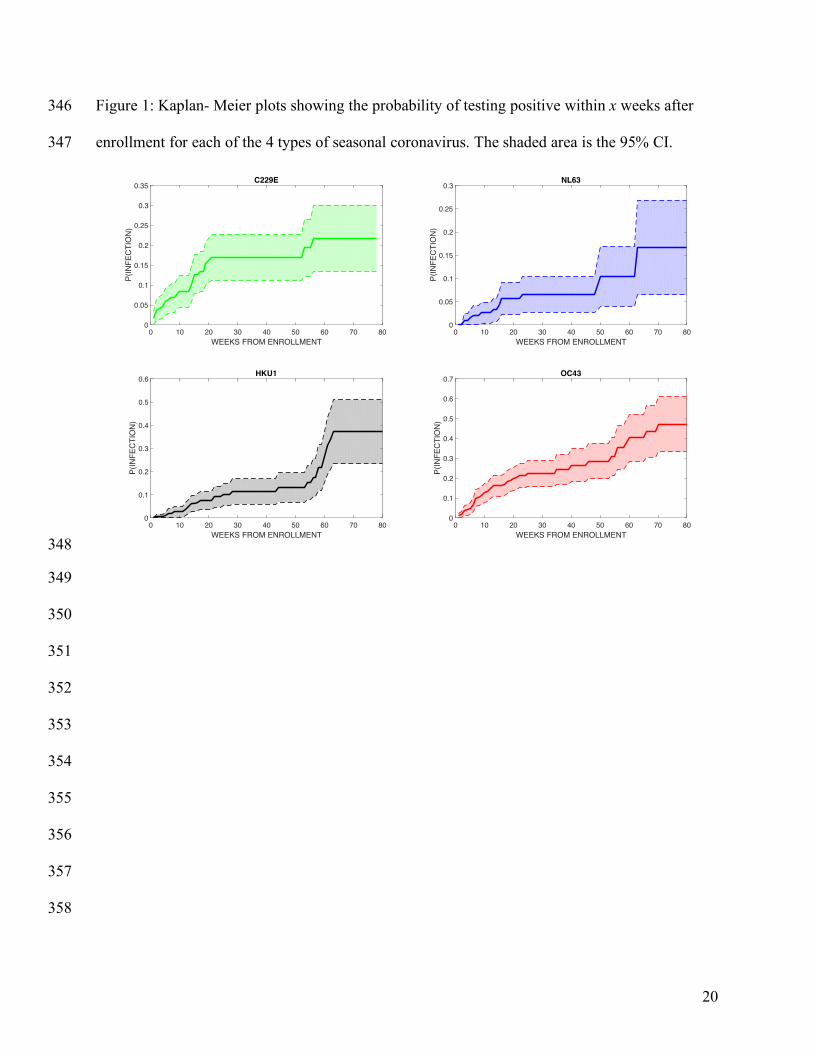
positive for 229E, 15 tested positive for NL63 and 28 tested positive for HKU1. Figure 1 shows 184
a Kaplan-Meier plot estimating the probability of becoming infected with each coronavirus 185
within x weeks following enrollment (see Supplementary Table S1 for the number of individuals 186
infected and censored at each time point). OC43 was the most widely diffused virus: the 187
probability of testing positive following 80 weeks in the study was 0.47. In contrast, NL63 was 188
the least frequently isolated coronavirus type: the probability of testing positive after 80 weeks 189
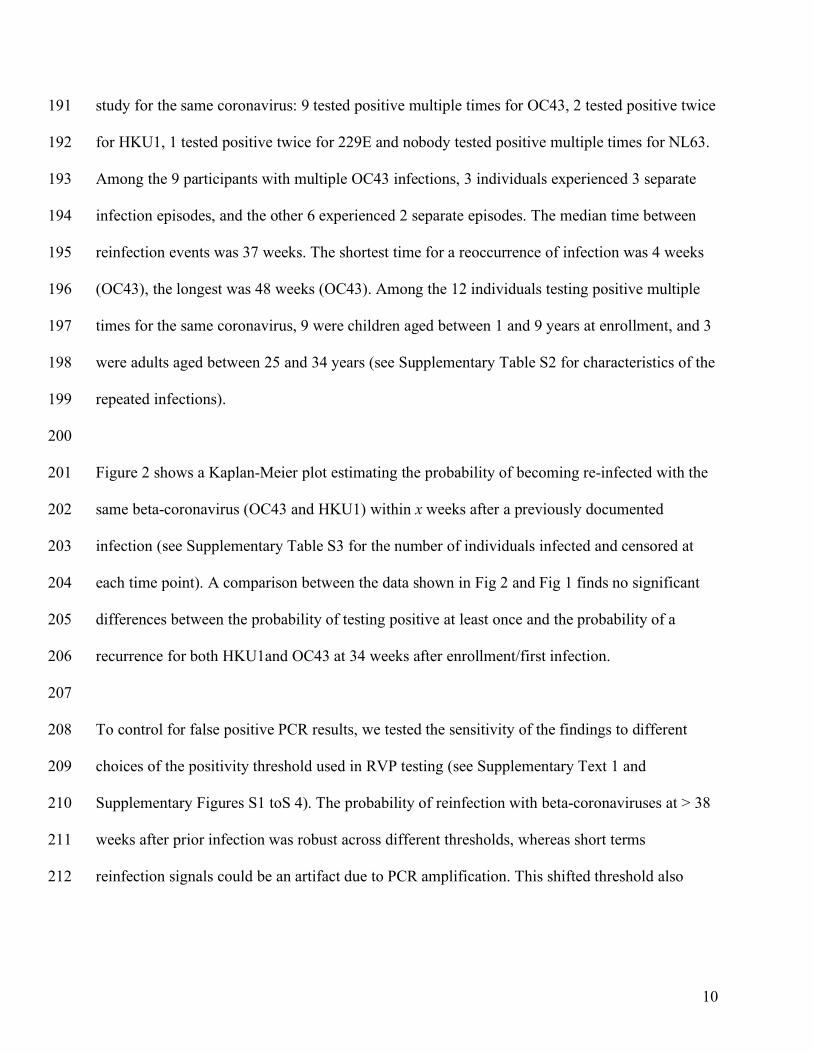
was 0.17. Among the study participants, 12 individuals tested positive multiple times during the 190
10
study for the same coronavirus: 9 tested positive multiple times for OC43, 2 tested positive twice 191
for HKU1, 1 tested positive twice for 229E and nobody tested positive multiple times for NL63. 192
Among the 9 participants with multiple OC43 infections, 3 individuals experienced 3 separate 193
infection episodes, and the other 6 experienced 2 separate episodes. The median time between 194
reinfection events was 37 weeks. The shortest time for a reoccurrence of infection was 4 weeks 195
(OC43), the longest was 48 weeks (OC43). Among the 12 individuals testing positive multiple 196
times for the same coronavirus, 9 were children aged between 1 and 9 years at enrollment, and 3 197
were adults aged between 25 and 34 years (see Supplementary Table S2 for characteristics of the 198
repeated infections). 199
200
Figure 2 shows a Kaplan-Meier plot estimating the probability of becoming re-infected with the 201
same beta-coronavirus (OC43 and HKU1) within x weeks after a previously documented 202
infection (see Supplementary Table S3 for the number of individuals infected and censored at 203
each time point). A comparison between the data shown in Fig 2 and Fig 1 finds no significant 204
differences between the probability of testing positive at least once and the probability of a 205
recurrence for both HKU1and OC43 at 34 weeks after enrollment/first infection. 206
207
To control for false positive PCR results, we tested the sensitivity of the findings to different 208
choices of the positivity threshold used in RVP testing (see Supplementary Text 1 and 209
Supplementary Figures S1 toS 4). The probability of reinfection with beta-coronaviruses at > 38 210
weeks after prior infection was robust across different thresholds, whereas short terms 211
reinfection signals could be an artifact due to PCR amplification. This shifted threshold also 212

11
yields a statistically significant difference between the probability of testing positive at least once 213
and the probability of a recurrence after first infection until week 43 (p = 0.04). 214
215
There was no significant difference in the likelihood of experiencing symptomatic infection 216
between the first and subsequent infection episodes by any of the 5 definitions provided in Table 217
1. In particular, all the individuals who were completely asymptomatic during the first recorded 218
occurrence, did not report any symptoms during subsequent infection(s) with the same 219
coronavirus type. However, there was a significant association between severity of symptoms 220
associated with any coronavirus infection and belonging to the same family cluster (p<.0001, 221
one-way analysis of variance). Figure 3 shows the total symptom score associated with any 222
coronavirus infection for infections grouped by family cluster. 223
224
Discussion 225
226
As the SARS-CoV-2 pandemic spreads to millions of individuals worldwide, it is extremely 227
important to understand the mechanisms of protective immunity elicited by infection. Until 228
direct observations of adaptive immune response to SARS-CoV-2 become available, analyses of 229
protective immunity elicited by other coronaviruses may offer useful insights. 230
Several studies in the last four decades have shown that infections with the 4 endemic 231
coronaviruses 229E, OC43, NL63 and HKU are common in the general population [8] [9]. 232
Infection with these viruses generally produces mild and even asymptomatic infection [10]. 233
Serological studies have shown that more than 90% of the population presents a baseline level of 234
antibodies against these endemic coronaviruses, with first seroconversion occurring at a young 235
12
age [11] [8]. Shortly after infection, baseline antibody titers increase sharply; this response has 236
been demonstrated for both natural and experimentally-induced infections [12] [13] [9]. 237
Antibody titers start increasing roughly one week following infection, reach a peak after about 2 238
weeks [13], and by 4 months to 1 year have returned to baseline levels [13] [9]. A challenge 239
study [13] showed that the likelihood of developing an infection after inoculation correlated with 240
participants’ concentration of antibodies at enrollment. Moreover, a positive correlation has been 241
shown between antibody rise after infection, severity of clinical manifestation and viral shedding 242
[12], with milder cases linked to less substantial post-infection antibody rises. 243
Instances of natural re-infections with the same virus type have been documented previously [9] 244
in which repeated infections with OC43 and 229E were recorded by serological testing. 245
Subsequent infections were separated by at least 8 months, though study participants were tested 246
every 4 months. Participants in a separate challenge study were inoculated with coronavirus 247
229E and then re-challenged with the same virus after one year [13]. In most cases, re-infection 248
occurred, though it presented with decreased symptoms severity and shortened duration of 249
shedding. 250
251
The adaptive immune response to coronavirus is mainly directed towards the most variable part 252
of the virus, a region that is not conserved across types; consequently, cross-reactive protection 253
between different types does not appear to be an important factor [14, 15]. In addition, the effects 254
of antigenic drift on re-infection have not been elucidated [16] and more studies are warranted to 255
understand whether repeat infections are ascribable to rapid virus evolution rather than a decline 256
in antibody titers. 257

13
258
The mild pathogenicity of seasonal coronavirus infection (with immune response often restricted 259
to the upper respiratory trait) is also often regarded as the reason for short-lived immunity. 260
Coronavirus infections, and the adaptive immunity acquired towards them, have also been 261
studied in animals. In a study on porcine respiratory coronavirus (PRCV), which causes 262
subclinical infections in pigs, antibody titers waned approximately one year after experimental 263
infection [17]. In contrast, an experimental study on murine coronavirus (MHV), which produces 264
severe, systemic infections in mice, has shown an interplay between virus-specific antibodies and 265
T cells, that upon survival in the host lead to life-long protection against reinfection [18]. 266
Similarly, a longer immunity profile has been hypothesized for SARS and MERS due to their 267
increased severity and to the systemic response that infection induces [14]. Specific antibodies 268
were detectable for at least 2 years in SARS and MERS survivors [19] [20]. Although 269
longitudinal studies on SARS survivors have not detected specific SARS IGG antibody 270
persistence 5 years after infection, they have found that specific memory T cells persist in the 271
peripheral blood of recovered SARS patients, and at higher levels in patients who experienced 272
severe disease [21]. Whether the presence of these memory T cells would be enough to induce a 273
fast, protective response upon reinfection with SARS has not been assessed. 274
Our study confirms that seasonal coronaviruses are widespread in the general population with 275
infections directly documented for a large fraction of the participants in our study. The methods 276
for our analysis are based on the hypothesis that infection probabilities are comparable among 277
participants enrolled at different times in the study. However, the seasonality of endemic 278
coronaviruses, which are mostly absent during the summer months, and the relative magnitude 279

14
across years of seasonal coronavirus epidemics are limitations. In US the prevalence of OC43 280
during the 2016-17 season was much higher than during the 2017-18 season, whereas the 281
opposite trend was observed for HKU1 [22]. Moreover, our estimates of infection and re-282
infection probabilities must be considered as a lower bound, due to the occurrence of weekly 283
swabs missed by the participants and due to the design of the study itself, which may have 284
missed infections of short duration in between consecutive weekly tests. Nevertheless, this study 285
confirms that re-infections with the same coronavirus type occur in a time window shorter than 1 286
year, and finds no significant association between repeat infections and symptom severity. 287
Instead, it provides evidence of possible genetic determinants of innate immune response, as 288
individuals asymptomatic during first infection did not experience symptoms during subsequent 289
infections, and members of the same families reported similar symptom severity. We recognize 290
that the self-reporting of symptoms is an important limitation in this analysis and that parents 291
reported symptoms for their dependents, which possibly introduced bias. Moreover, the majority 292
of the repeated coronavirus infections were found in children, a cohort more vulnerable to 293
infection because of their immature immune system [23], and 26% of the episodes in the 294
repeated infections were co-infections with other respiratory viruses (see Supplementary Table 295
S2). Another potential limitation of our study is the high sensitivity of PCR tests, that can 296
amplify very small amounts of genetic material, possibly not ascribable to active infections. 297
However, the occurrence of repeated infections separated by at least 38 weeks, was corroborated 298
by repeating the analysis with different positivity thresholds for the RVP. 299
300
More studies analyzing the genetic basis of individual response to coronavirus infections are 301
warranted. Even though the endemic coronaviruses are very rarely associated with severe 302

15
disease, their widespread diffusion together with the fact that OC43 and HKU1 belong to the 303
same beta-coronavirus genus as SARS-CoV2 offer important opportunities for investigation. 304
Author Statement 305
306
Contributors 307
308
MG and JS conceived and designed the study. MG performed the analysis. JS coordinated the 309
survey and sample data collection for the study. MG wrote the first draft of the manuscript. JS 310
reviewed the analysis and provided feedback on drafts and approved the final version for 311
publication. 312
313
314
Financial support 315
This work was supported by the Defense Advanced Research Projects Agency contract 316
W911NF-16-2-0035. The funders had no role in study design, data collection and analysis, 317
decision to publish, or preparation of the manuscript. 318
319
Conflict of interests 320
JS and Columbia University disclose partial ownership of SK Analytics. JS also discloses 321
consulting for BNI. All other authors declare no competing interests. 322
323
16
References 324
325
[1] Andersen KG, Rambaut A, Lipkin WI, Holmes EC, Garry RF, "The proximal origin of
SARS-CoV-2," Nature Medicine, 2020.
[2] WHO, "Situation Report," 2020. [Online]. Available: https://www.who.int/docs/default-
source/coronaviruse/situation-reports/20200401-sitrep-72-covid-
19.pdf?sfvrsn=3dd8971b_2.
[3] CDC, 2020. [Online]. Available: https://www.cdc.gov/coronavirus/2019-ncov/symptoms-
testing/symptoms.html.
[4] NIH, "https://www.nih.gov/news-events/news-releases/nih-clinical-trial-investigational-
vaccine-covid-19-begins," 2020. [Online].
[5] Bao L, Deng W, Gao H et al., "Reinfection could not occur in SARS-CoV-2 infected
rhesus macaques," bioarxiv, preprint, 2020.
[6] Galanti M, Birger R, Ud-Dean M et al, "Longitudinal active sampling for respiratory viral
infections across age groups.," Influenza and Other Respiratory Viruses, vol. 13, no. 3, pp.
226-232, 2019.
[7] Shaman J, Morita H, Birger R et al. "Asymptomatic summertime shedding of respiratory
viruses.," Journal of Infectious Diseases, vol. 217, pp. 1074-1077, 2018.
[8] Zhou W, Wang W, Wang H, Lu R, Tan W, "First infection by all four non-severe acute
respiratory syndrome human coronaviruses takes place during childhood," BMC Infect
Dis., vol. 13, p. 433, 2013.
17
[9] Schmidt OW, Allan ID, Cooney MK, Foy HM, Fox JP., "Rises in titers of antibody to
human coronaviruses OC43 and 229E in Seattle families during 1975-1979," American
Journal of Epidemiology, vol. 123, no. 5, pp. 862-8, 1986.
[10] Galanti M, Birger R, Ud-Dean M et al, "Rates of asymptomatic respiratory virus infection
across age groups," Epidemiology and Infection, vol. 147, p. e176, 2019.
[11] Severance EG, Bossis I, Dickerson FB et al, "Development of a nucleocapsid-based human
coronavirus immunoassay and estimates of individuals exposed to coronavirus in a U.S.
metropolitan population.," Clin Vaccine Immunol., vol. 15, no. 12, pp. 1805-10, 2008.
[12] Kraaijeveld CA, Reed SE, Macnaughton MR, "Enzyme-LinkedImmunosorbent Assay for
Detection of Antibody in Volunteers Experimentally Infected with Human Coronavirus
Strain 229E," J Clin Microbiol., vol. 12, no. 4, pp. 493-7, 1980.
[13] Callow KA, Parry HF, Sergeant M, and Tyrrell DA, "The course or immune response to
experimental coronavirus infection of man," Epidemiol Infect., vol. 105, no. 2, p. 435–446,
1990.
[14] Perlman S, Vijay R, "Middle East respiratory syndrome vaccines," Int J Infect Dis.,47: 23-
8, 2016.
[15] Macnaughton MR, Hasony HJ, Madge MH, Reed SE, "Antibody to virus components in
volunteers experimentally infected with human coronavirus 229E group viruses.," Infect
Immun., vol. 31, no. 3, pp. 845-9, 1981.
[16] Monto AS, Cowling BJ, Peiris JSM, Coronaviruses. In: Kaslow R., Stanberry L., Le Duc J.
(eds) Viral Infections of Humans, Boston, MA: Springer, 2014.
326
18
[17] Wesley R, "Neutralizing antibody decay and lack of contact transmission after inoculation
of 3- and 4-day-old piglets with porcine respiratory coronavirus," J Vet Diagn Invest , vol.
14, p. 525–527 , 2002.
[18] Williamson JS, Stohlman SA., "Effective clearance of mouse hepatitis virus from the
central nervous system requires both CD4+ and CD8+ T cells.," Journal of virology, vol.
64, no. 9, pp. 4589-92, 1990.
[19] Mo H, Zeng G, Ren X et al., "Longitudinal profile of antibodies against SARS-coronavirus
in SARS patients and their clinical significance," Respirology, vol. 11, no. 1, pp. 49-53,
2006.
[20] Payne DC, Ibrahim I, Rha B et al., "Persistence of Antibodies against Middle East
Respiratory Syndrome Coronavirus," Emerg Inf Dis, vol. 22, no. 10, p. 1824–1826, 2016.
[21] Tang F, Quan Y, Xin ZT et al, "Lack of Peripheral Memory B Cell Responses in
Recovered Patients with Severe Acute Respiratory Syndrome: A Six-Year Follow-Up
Study," vol. 186, no. 12, pp. 7264-8, 2011.
[22] CDC, "NERVSS," 2019. [Online]. Available:
https://www.cdc.gov/surveillance/nrevss/coronavirus/index.html
[23] Simon AK, Hollander GA, and McMichael, "Evolution of the immune system in humans
from infancy to old age," Proc Biol Sci. , vol. 282, p. 20143085, 2015 .
327
328
329

19
Table 1. Definitions of symptomatic infections. All symptom definitions are described in 330
reference to a -3/+7 days window around the date of the initial positive swab for an infection 331
episode. Note, Definition 4 is relative to an individual’s long-term average total symptom score. 332
333
Definition 1 At least one day with a daily score >3
Definition 2 Minimum two individual symptoms >0 and at least one symptom >1
Definition 3 Total symptom score >9
Definition 4 Total symptom score greater than twice the weekly average for the infected
individual
Definition 5 Total symptom score >0 (i.e. any reported symptom)
334
335
336
337
338
339
340
341
342
343
344
345
20
Figure 1: Kaplan- Meier plots showing the probability of testing positive within x weeks after 346
enrollment for each of the 4 types of seasonal coronavirus. The shaded area is the 95% CI. 347
348
349
350
351
352
353
354
355
356
357
358
0 10 20 30 40 50 60 70 80WEEKS FROM ENROLLMENT
0
0.1
0.2
0.3
0.4
0.5
0.6
0.7
P(IN
FEC
TIO
N)
OC43
0 10 20 30 40 50 60 70 80WEEKS FROM ENROLLMENT
0
0.1
0.2
0.3
0.4
0.5
0.6
P(IN
FEC
TIO
N)
HKU1
0 10 20 30 40 50 60 70 80WEEKS FROM ENROLLMENT
0
0.05
0.1
0.15
0.2
0.25
0.3
0.35
P(IN
FEC
TIO
N)
C229E
0 10 20 30 40 50 60 70 80WEEKS FROM ENROLLMENT
0
0.05
0.1
0.15
0.2
0.25
0.3
P(IN
FEC
TIO
N)
NL63

21
Figure 2: Probability of becoming re-infected with the same beta-coronavirus type (OC43 in red 359
and HKU1 in black) within x weeks after a first documented infection. Dashed lines show the 360
95% CI. 361
362
363
364
365
366
367
368
369
370
371
372
0 10 20 30 40 50 60 70WEEKS FROM PREVIOUS INFECTION
0
0.1
0.2
0.3
0.4
0.5
0.6
0.7
0.8
P(R
EIN
FEC
TIO
N)
OC43HKU1

22
Figure 3: Total symptom score associated with infections by any coronavirus type. Each point 373
represents an infection event, and each cluster represents a family group. Each family group F1 374
to F9 is composed of a parent and 1 to 4 children. 375
376
377
378
F1 F2 F3 F4 F5 F6 F7 F8 F9FAMILY CLUSTERS
-5
0
5
10
15
20
25
30
35
40
45
SYM
PTO
MS
SCO
RE
OVE
R -3
/+7
DAY
S FR
OM
PO
SITI
VE
23
Supplementary Material 379 380 381 382
Table S1: Table with timepoint Kaplan-Meier data for the probability of at least one infection with OC43, HKU1, 383 229E and NL63. 384 Table S2: Characteristics of repeated infections. 385 Table S3: Table with timepoint Kaplan-Meier data for the probability of re-infection with OC43 and HKU1 386 Text S1: Sensitivity to PCR threshold. 387 Figure S1: Probability of having tested positive within x weeks from enrollment, PCR threshold 50nA 388 Figure S2: Probability of a re-infection with the same beta-coronavirus within x weeks from previous infection, 389 PCR threshold 50nA 390 Figure S3: Probability of having tested positive within x weeks from enrollment, PCR threshold 100nA 391 Figure S4: Probability of a re-infection with the same beta-coronavirus within x weeks from previous infection, 392 PCR threshold 100nA 393 394 395 396 397
24
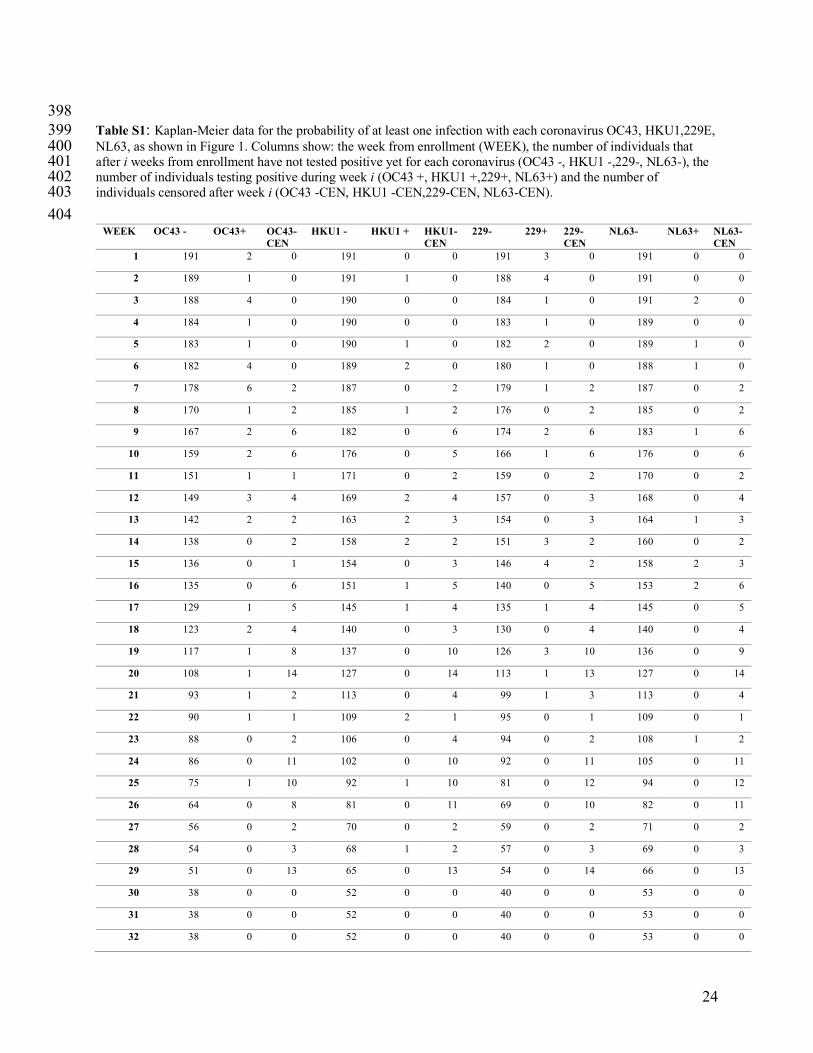
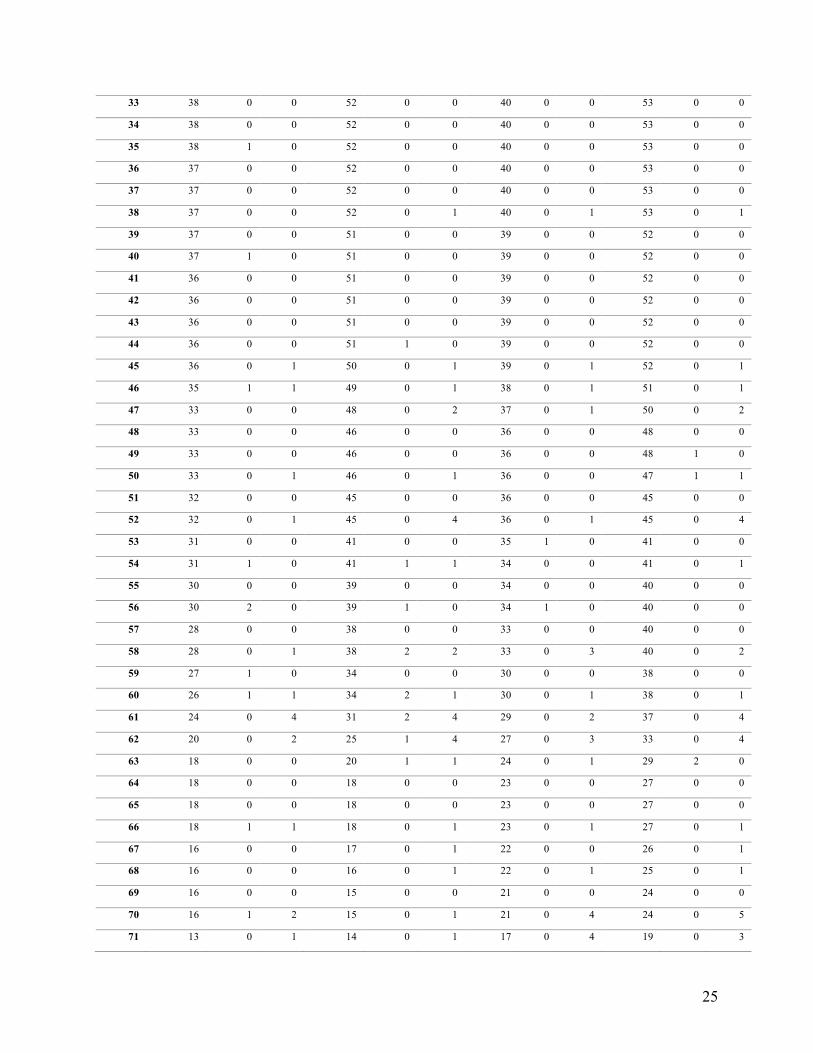
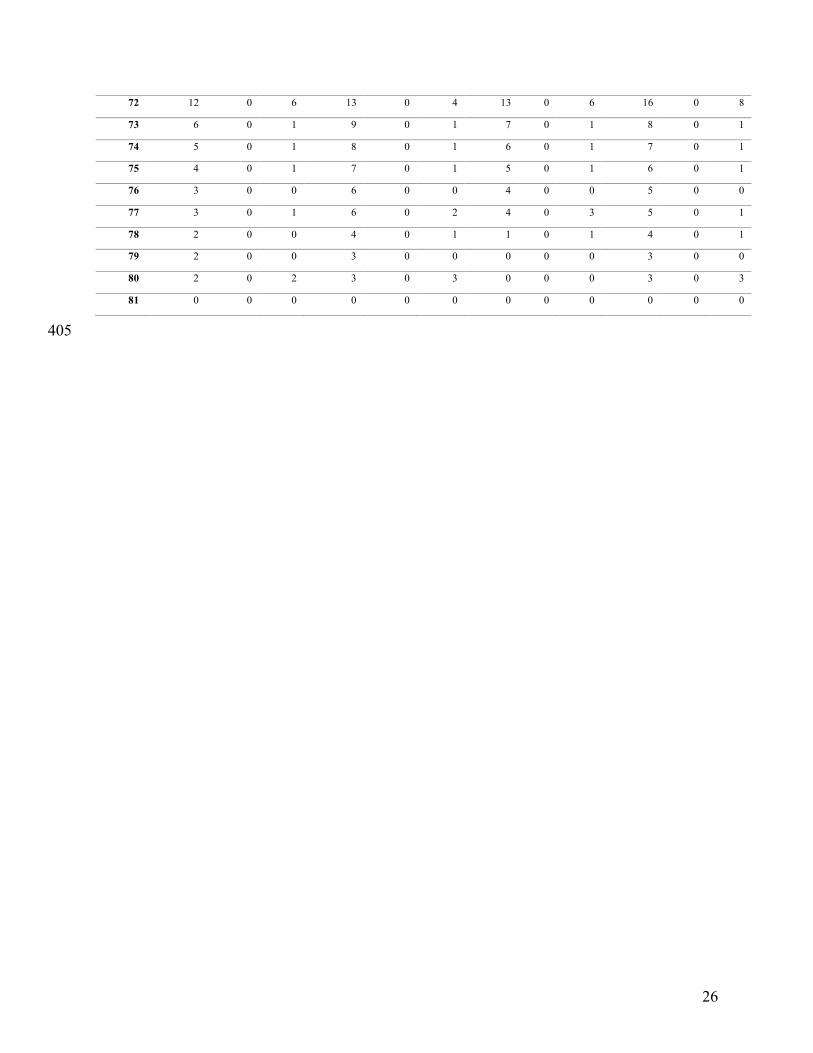
398 Table S1: Kaplan-Meier data for the probability of at least one infection with each coronavirus OC43, HKU1,229E, 399 NL63, as shown in Figure 1. Columns show: the week from enrollment (WEEK), the number of individuals that 400 after i weeks from enrollment have not tested positive yet for each coronavirus (OC43 -, HKU1 -,229-, NL63-), the 401 number of individuals testing positive during week i (OC43 +, HKU1 +,229+, NL63+) and the number of 402 individuals censored after week i (OC43 -CEN, HKU1 -CEN,229-CEN, NL63-CEN). 403 404
WEEK OC43 - OC43+ OC43- CEN
HKU1 - HKU1 + HKU1-CEN
229- 229+ 229-CEN
NL63- NL63+ NL63-CEN
1 191 2 0 191 0 0 191 3 0 191 0 0
2 189 1 0 191 1 0 188 4 0 191 0 0
3 188 4 0 190 0 0 184 1 0 191 2 0
4 184 1 0 190 0 0 183 1 0 189 0 0
5 183 1 0 190 1 0 182 2 0 189 1 0
6 182 4 0 189 2 0 180 1 0 188 1 0
7 178 6 2 187 0 2 179 1 2 187 0 2
8 170 1 2 185 1 2 176 0 2 185 0 2
9 167 2 6 182 0 6 174 2 6 183 1 6
10 159 2 6 176 0 5 166 1 6 176 0 6
11 151 1 1 171 0 2 159 0 2 170 0 2
12 149 3 4 169 2 4 157 0 3 168 0 4
13 142 2 2 163 2 3 154 0 3 164 1 3
14 138 0 2 158 2 2 151 3 2 160 0 2
15 136 0 1 154 0 3 146 4 2 158 2 3
16 135 0 6 151 1 5 140 0 5 153 2 6
17 129 1 5 145 1 4 135 1 4 145 0 5
18 123 2 4 140 0 3 130 0 4 140 0 4
19 117 1 8 137 0 10 126 3 10 136 0 9
20 108 1 14 127 0 14 113 1 13 127 0 14
21 93 1 2 113 0 4 99 1 3 113 0 4
22 90 1 1 109 2 1 95 0 1 109 0 1
23 88 0 2 106 0 4 94 0 2 108 1 2
24 86 0 11 102 0 10 92 0 11 105 0 11
25 75 1 10 92 1 10 81 0 12 94 0 12
26 64 0 8 81 0 11 69 0 10 82 0 11
27 56 0 2 70 0 2 59 0 2 71 0 2
28 54 0 3 68 1 2 57 0 3 69 0 3
29 51 0 13 65 0 13 54 0 14 66 0 13
30 38 0 0 52 0 0 40 0 0 53 0 0
31 38 0 0 52 0 0 40 0 0 53 0 0
32 38 0 0 52 0 0 40 0 0 53 0 0
25
33 38 0 0 52 0 0 40 0 0 53 0 0
34 38 0 0 52 0 0 40 0 0 53 0 0
35 38 1 0 52 0 0 40 0 0 53 0 0
36 37 0 0 52 0 0 40 0 0 53 0 0
37 37 0 0 52 0 0 40 0 0 53 0 0
38 37 0 0 52 0 1 40 0 1 53 0 1
39 37 0 0 51 0 0 39 0 0 52 0 0
40 37 1 0 51 0 0 39 0 0 52 0 0
41 36 0 0 51 0 0 39 0 0 52 0 0
42 36 0 0 51 0 0 39 0 0 52 0 0
43 36 0 0 51 0 0 39 0 0 52 0 0
44 36 0 0 51 1 0 39 0 0 52 0 0
45 36 0 1 50 0 1 39 0 1 52 0 1
46 35 1 1 49 0 1 38 0 1 51 0 1
47 33 0 0 48 0 2 37 0 1 50 0 2
48 33 0 0 46 0 0 36 0 0 48 0 0
49 33 0 0 46 0 0 36 0 0 48 1 0
50 33 0 1 46 0 1 36 0 0 47 1 1
51 32 0 0 45 0 0 36 0 0 45 0 0
52 32 0 1 45 0 4 36 0 1 45 0 4
53 31 0 0 41 0 0 35 1 0 41 0 0
54 31 1 0 41 1 1 34 0 0 41 0 1
55 30 0 0 39 0 0 34 0 0 40 0 0
56 30 2 0 39 1 0 34 1 0 40 0 0
57 28 0 0 38 0 0 33 0 0 40 0 0
58 28 0 1 38 2 2 33 0 3 40 0 2
59 27 1 0 34 0 0 30 0 0 38 0 0
60 26 1 1 34 2 1 30 0 1 38 0 1
61 24 0 4 31 2 4 29 0 2 37 0 4
62 20 0 2 25 1 4 27 0 3 33 0 4
63 18 0 0 20 1 1 24 0 1 29 2 0
64 18 0 0 18 0 0 23 0 0 27 0 0
65 18 0 0 18 0 0 23 0 0 27 0 0
66 18 1 1 18 0 1 23 0 1 27 0 1
67 16 0 0 17 0 1 22 0 0 26 0 1
68 16 0 0 16 0 1 22 0 1 25 0 1
69 16 0 0 15 0 0 21 0 0 24 0 0
70 16 1 2 15 0 1 21 0 4 24 0 5
71 13 0 1 14 0 1 17 0 4 19 0 3
26
72 12 0 6 13 0 4 13 0 6 16 0 8
73 6 0 1 9 0 1 7 0 1 8 0 1
74 5 0 1 8 0 1 6 0 1 7 0 1
75 4 0 1 7 0 1 5 0 1 6 0 1
76 3 0 0 6 0 0 4 0 0 5 0 0
77 3 0 1 6 0 2 4 0 3 5 0 1
78 2 0 0 4 0 1 1 0 1 4 0 1
79 2 0 0 3 0 0 0 0 0 3 0 0
80 2 0 2 3 0 3 0 0 0 3 0 3
81 0 0 0 0 0 0 0 0 0 0 0 0
405
27
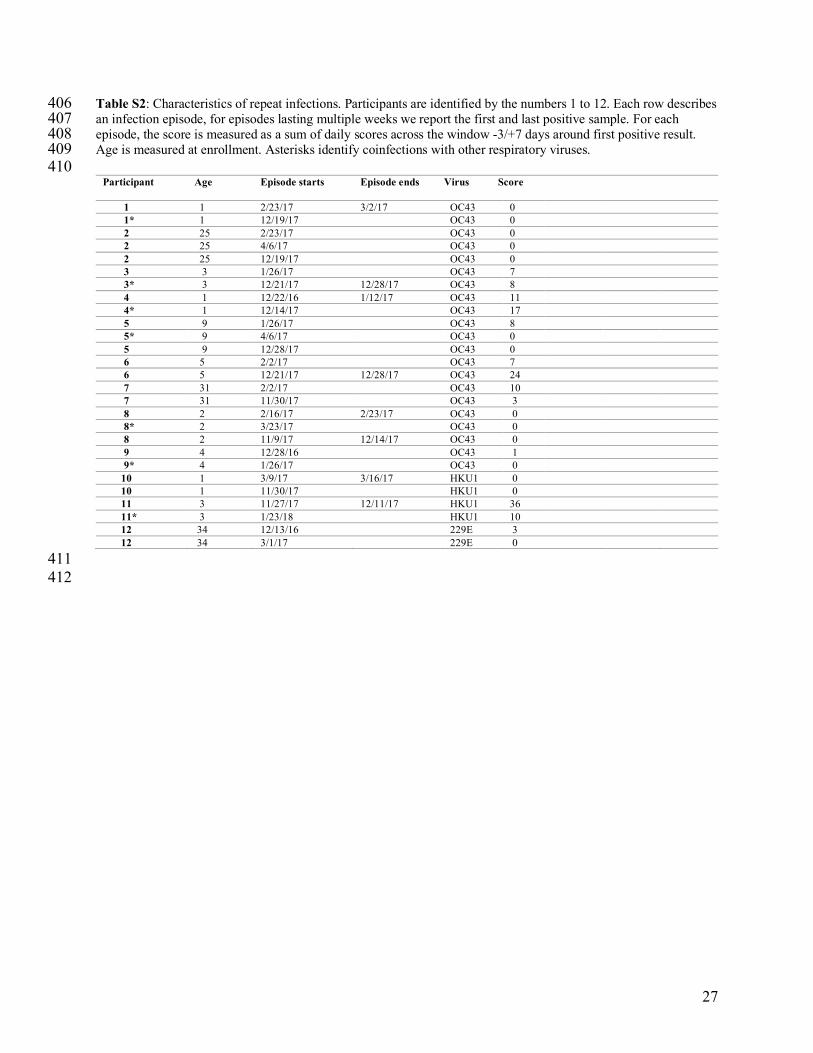
Table S2: Characteristics of repeat infections. Participants are identified by the numbers 1 to 12. Each row describes 406 an infection episode, for episodes lasting multiple weeks we report the first and last positive sample. For each 407 episode, the score is measured as a sum of daily scores across the window -3/+7 days around first positive result. 408 Age is measured at enrollment. Asterisks identify coinfections with other respiratory viruses. 409 410
Participant Age Episode starts
Episode ends Virus Score
1 1 2/23/17 3/2/17 OC43 0 1* 1 12/19/17 OC43 0 2 25 2/23/17 OC43 0 2 25 4/6/17 OC43 0 2 25 12/19/17 OC43 0 3 3 1/26/17 OC43 7 3* 3 12/21/17 12/28/17 OC43 8 4 1 12/22/16 1/12/17 OC43 11 4* 1 12/14/17 OC43 17 5 9 1/26/17 OC43 8 5* 9 4/6/17 OC43 0 5 9 12/28/17 OC43 0 6 5 2/2/17 OC43 7 6 5 12/21/17 12/28/17 OC43 24 7 31 2/2/17 OC43 10 7 31 11/30/17 OC43 3 8 2 2/16/17 2/23/17 OC43 0 8* 2 3/23/17 OC43 0 8 2 11/9/17 12/14/17 OC43 0 9 4 12/28/16 OC43 1 9* 4 1/26/17 OC43 0 10 1 3/9/17 3/16/17 HKU1 0 10 1 11/30/17 HKU1 0 11 3 11/27/17 12/11/17 HKU1 36 11* 3 1/23/18 HKU1 10 12 34 12/13/16 229E 3 12 34 3/1/17 229E 0
411 412

28
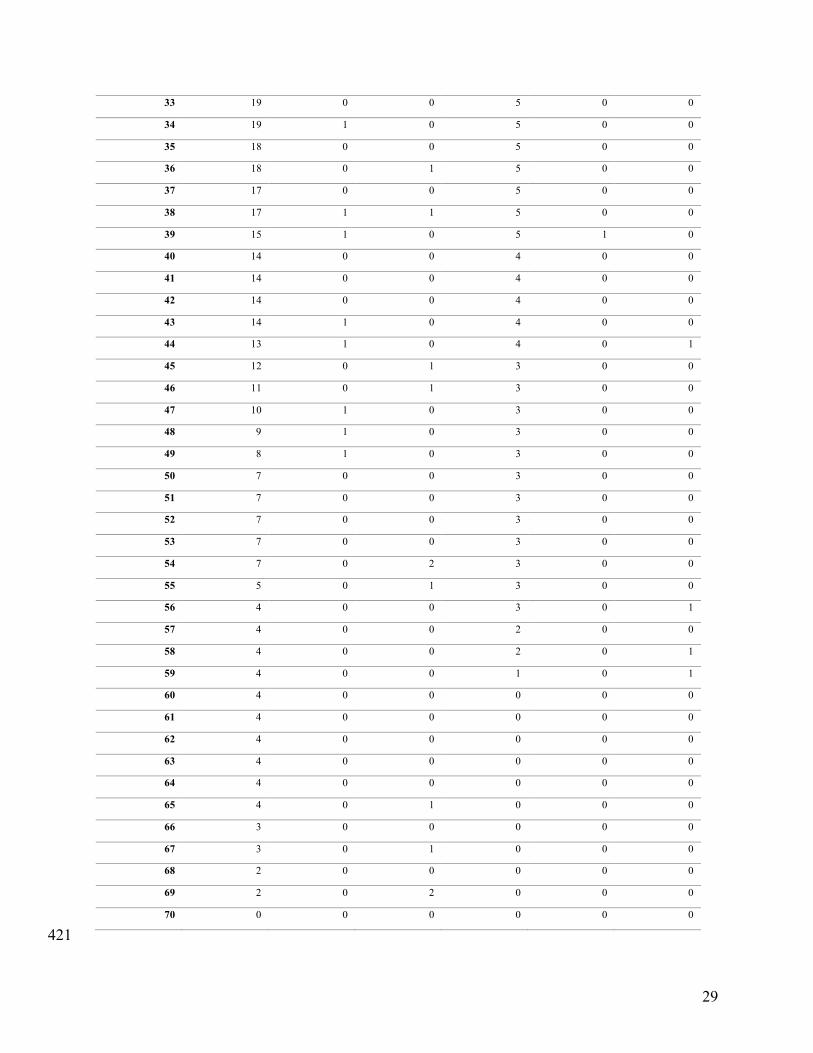
Table S3: Kaplan-Meier data for the probability of re-infection with coronaviruses OC43 and HKU1, as shown in 413 Figure 2. Columns show: the weeks from a previous infection (WEEK), the number of participants that after i weeks 414 from previous infection with OC43 (OC43+) and HKU1 (HKU1+) have not yet being re-infected; the number of 415 participants that after i weeks from previous infection test positive for the same virus (RE-OC43, RE-HKU1) and 416 the number of participants censored after i weeks from previous infection (OC43 -CENSORED, HKU1 -417 CENSORED). Participants testing positive n times during the study are counted n times in this analysis. 418 419 420
WEEK OC43+ RE-OC43 OC43-CENSORED
HKU1+ RE-HKU1 HKU1- CENSORED
1 60 0 2 30 0 2
2 58 0 1 28 0 0
3 57 0 0 28 0 1
4 57 0 2 27 0 1
5 55 2 4 26 0 2
6 49 0 1 24 0 0
7 48 1 5 24 1 0
8 42 0 3 23 0 0
9 39 0 0 23 0 0
10 39 0 1 23 0 0
11 38 1 1 23 0 3
12 36 0 1 20 0 3
13 35 0 0 17 0 1
14 35 0 0 16 0 3
15 35 0 1 13 0 2
16 34 0 2 11 0 1
17 32 0 3 10 0 1
18 29 0 3 9 0 1
19 26 0 2 8 0 1
20 24 0 1 7 0 1
21 23 0 1 6 0 1
22 22 0 0 5 0 0
23 22 0 1 5 0 0
24 21 0 1 5 0 0
25 20 0 0 5 0 0
26 20 0 0 5 0 0
27 20 0 0 5 0 0
28 20 0 0 5 0 0
29 20 0 1 5 0 0
30 19 0 0 5 0 0
31 19 0 0 5 0 0
32 19 0 0 5 0 0
29
33 19 0 0 5 0 0
34 19 1 0 5 0 0
35 18 0 0 5 0 0
36 18 0 1 5 0 0
37 17 0 0 5 0 0
38 17 1 1 5 0 0
39 15 1 0 5 1 0
40 14 0 0 4 0 0
41 14 0 0 4 0 0
42 14 0 0 4 0 0
43 14 1 0 4 0 0
44 13 1 0 4 0 1
45 12 0 1 3 0 0
46 11 0 1 3 0 0
47 10 1 0 3 0 0
48 9 1 0 3 0 0
49 8 1 0 3 0 0
50 7 0 0 3 0 0
51 7 0 0 3 0 0
52 7 0 0 3 0 0
53 7 0 0 3 0 0
54 7 0 2 3 0 0
55 5 0 1 3 0 0
56 4 0 0 3 0 1
57 4 0 0 2 0 0
58 4 0 0 2 0 1
59 4 0 0 1 0 1
60 4 0 0 0 0 0
61 4 0 0 0 0 0
62 4 0 0 0 0 0
63 4 0 0 0 0 0
64 4 0 0 0 0 0
65 4 0 1 0 0 0
66 3 0 0 0 0 0
67 3 0 1 0 0 0
68 2 0 0 0 0 0
69 2 0 2 0 0 0
70 0 0 0 0 0 0
421

30
422 Supplementary Text S1: Sensitivity to PCR threshold. 423
424 In the main text samples positiveforaparticularviruswereidentifiedbyanelectricalsignalintensityof425 ≥2nA/mm2(withtheexceptionofCoronavirusOC43forwhichpositiveresultswereidentifiedbyan426 intensityof≥25nA/mm2,permanufacturerspecifications).Here we test the sensitivity of our finding to 427 different choices of the threshold for PCR positivity for all viruses (25nA/mm2and100nA/mm2). 428 429 Positivity threshold 50nA/mm2 for all infections 430 431 Among all participants enrolled and using a 50nA/mm2threshold, 73 individuals tested positive at least once 432 during the study for any coronavirus infection. 44 individuals tested positive at least once for OC43, 28 tested 433 positive for 229E, 8 tested positive for NL63, and 24 tested positive for HKU1. In addition, 10 individuals tested 434 positive multiple times during the study for the same coronavirus: 8 tested positive twice for OC43, 2 tested positive 435 twice for HKU1 and nobody tested positive multiple times for 229E and NL63. Among the 8 participants that 436 experienced multiple OC43 infections, 1 individual tested positive 3 separate times, and 7 tested positive twice. The 437 median time between reinfection events was 43 weeks. The shortest time for a reoccurrence of infection was 4 438 weeks (OC43), the longest was 48 weeks (OC43). 439 Figure S1and Figure S2 show, respectively, the probability of testing positive within x weeks after enrollment and 440 the probability of a re-infection with the same beta-coronavirus within x week of a previous documented infection. 441 442 443 Positivity threshold 100nA for all infections 444
445 Among all participants enrolled and using a 100nA/mm2threshold, 67 individuals tested positives at least once 446 during the study for any coronavirus infection. 40 individuals tested positive at least once for OC43, 21 tested 447 positive for 229E, 6 tested positive for NL63, and 23 tested positive for UKU1. In addition, 8 individuals tested 448 positive multiple times during the study for the same coronavirus: 7 tested positive twice for OC43, 1 tested positive 449 twice for HKU1 and nobody tested positive multiple times for 229E and NL63. The median time between 450 reinfection events was 44.5 weeks. The shortest time for a second infection was 37 weeks (OC43), the longest was 451 48 weeks (OC43). Figure S3 and Figure S4 show, respectively, the probability of testing positive within x weeks 452 after enrollment and the probability of a re-infection with the same beta-coronavirus within x week of a previous 453 documented infection. 454 455 456 457 458 459 460 461 462 463 464 465 466 467 468 469 470 471 472 473
31
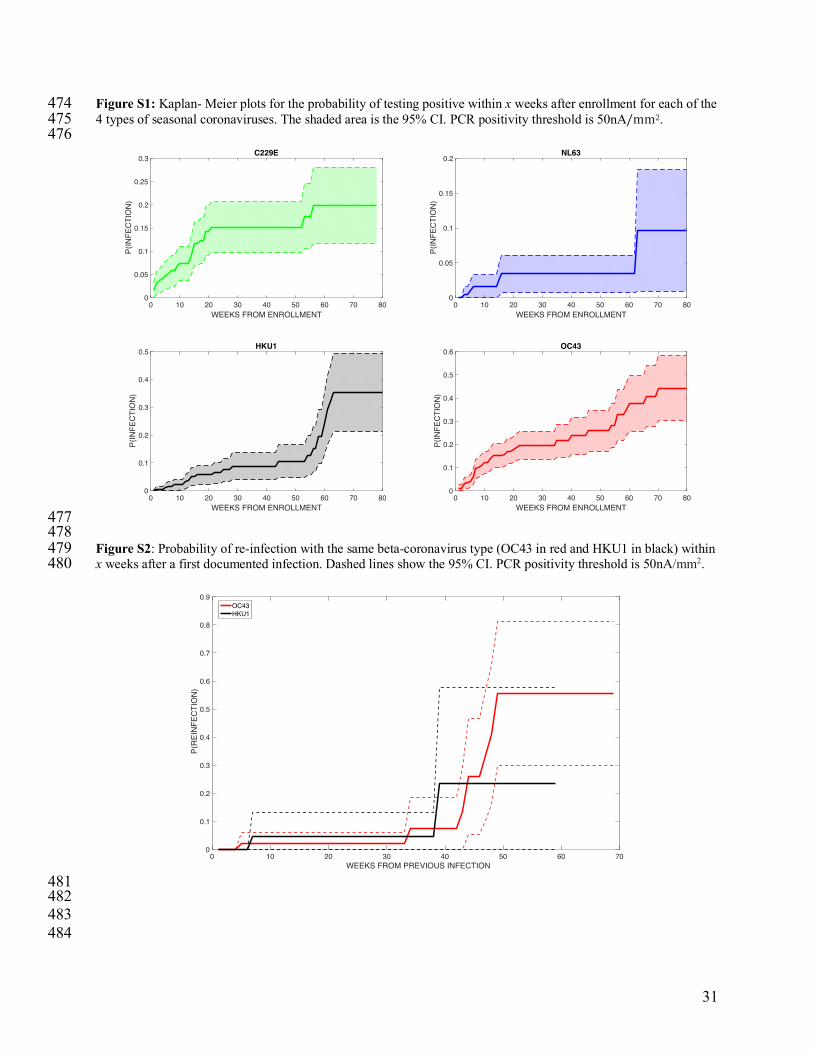
Figure S1: Kaplan- Meier plots for the probability of testing positive within x weeks after enrollment for each of the 474 4 types of seasonal coronaviruses. The shaded area is the 95% CI. PCR positivity threshold is 50nA/mm2. 475 476
477 478 Figure S2: Probability of re-infection with the same beta-coronavirus type (OC43 in red and HKU1 in black) within 479 x weeks after a first documented infection. Dashed lines show the 95% CI. PCR positivity threshold is 50nA/mm2. 480
481 482 483 484
0 10 20 30 40 50 60 70 80WEEKS FROM ENROLLMENT
0
0.1
0.2
0.3
0.4
0.5
0.6
P(IN
FEC
TIO
N)
OC43
0 10 20 30 40 50 60 70 80WEEKS FROM ENROLLMENT
0
0.1
0.2
0.3
0.4
0.5
P(IN
FEC
TIO
N)
HKU1
0 10 20 30 40 50 60 70 80WEEKS FROM ENROLLMENT
0
0.05
0.1
0.15
0.2
0.25
0.3
P(IN
FEC
TIO
N)
C229E
0 10 20 30 40 50 60 70 80WEEKS FROM ENROLLMENT
0
0.05
0.1
0.15
0.2
P(IN
FEC
TIO
N)
NL63
0 10 20 30 40 50 60 70WEEKS FROM PREVIOUS INFECTION
0
0.1
0.2
0.3
0.4
0.5
0.6
0.7
0.8
0.9
P(R
EIN
FEC
TIO
N)
OC43HKU1
32
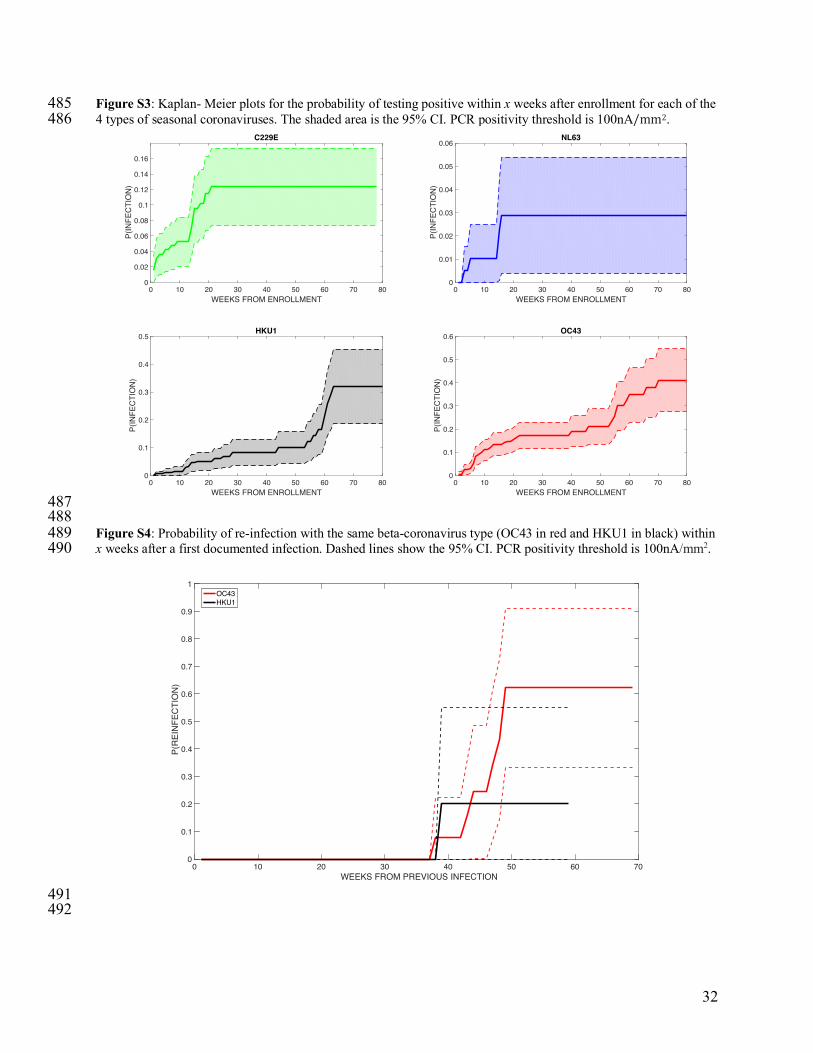
Figure S3: Kaplan- Meier plots for the probability of testing positive within x weeks after enrollment for each of the 485 4 types of seasonal coronaviruses. The shaded area is the 95% CI. PCR positivity threshold is 100nA/mm2. 486
487 488 Figure S4: Probability of re-infection with the same beta-coronavirus type (OC43 in red and HKU1 in black) within 489 x weeks after a first documented infection. Dashed lines show the 95% CI. PCR positivity threshold is 100nA/mm2. 490
491 492
0 10 20 30 40 50 60 70 80WEEKS FROM ENROLLMENT
0
0.1
0.2
0.3
0.4
0.5
0.6
P(IN
FEC
TIO
N)
OC43
0 10 20 30 40 50 60 70 80WEEKS FROM ENROLLMENT
0
0.1
0.2
0.3
0.4
0.5
P(IN
FEC
TIO
N)
HKU1
0 10 20 30 40 50 60 70 80WEEKS FROM ENROLLMENT
0
0.02
0.04
0.06
0.08
0.1
0.12
0.14
0.16
P(IN
FEC
TIO
N)
C229E
0 10 20 30 40 50 60 70 80WEEKS FROM ENROLLMENT
0
0.01
0.02
0.03
0.04
0.05
0.06
P(IN
FEC
TIO
N)
NL63
0 10 20 30 40 50 60 70WEEKS FROM PREVIOUS INFECTION
0
0.1
0.2
0.3
0.4
0.5
0.6
0.7
0.8
0.9
1
P(R
EIN
FEC
TIO
N)
OC43HKU1