Embed Size (px)
Citation preview

NASA / CR--1998-208674
Direct Numerical Simulation of a Coolant Jet
in a Periodic Crossflow
Chirdeep Sharma and Sumanta Acharya
Louisiana State University, Baton Rouge, Louisiana
October 1998

The NASA STI Program Office... in Profile
Since its founding, NASA has been dedicated tothe advancement of aeronautics and spacescience. The NASA Scientific and Technical
Information (ST[) Program Office plays a key partin helping NASA maintain this important role.
The NASA STI Program Office is operated byLangley Research Center, the Lead Center forNASA's scientific and technical information. The
NASA STI Program Office provides access to theNASA STI Database, the largest collection of
aeronautical and space science STI in the world.The Program Office is also NASA's institutional
mechanism for disseminating the results of itsresearch and development activities. These results
are published by NASA in the NASA STI ReportSeries, which includes the following report types:
TECHNICAL PUBLICATION. Reports of
completed research or a major significantphase of research that present the results of
NASA programs and include extensive dataor theoretical analysis. Includes compilationsof significant scientific and technical data and
information deemed to be of continuingreference value. NASA's counterpart of peer-
reviewed formal professional papers buthas less stringent limitations on manuscript
length and extent of graphic presentations.
TECHNICAL MEMORANDUM. Scientific
and technical findings that are preliminary orof specialized interest, e.g., quick release
reports, working papers, and bibliographiesthat contain minimal annotation. Does not
contain extensive analysis.
CONTRACTOR REPORT. Scientific and
technical findings by NASA-sponsored
contractors and grantees.
CONFERENCE PUBLICATION. Collected
papers from scientific and technical
conferences, symposia, seminars, or othermeetings sponsored or cosponsored byNASA.
SPECIAL PUBLICATION. Scientific,technical, or historical information from
NASA programs, projects, and missions,often concerned with subjects having
substantial public interest.
TECHNICAL TRANSLATION. English-language translations of foreign scientificand technical material pertinent to NASA'smission.
Specialized services that complement the STIProgram Office's diverse offerings include
creating custom thesauri, building customizeddata bases, organizing and publishing researchresults.., even providing videos.
For more information about the NASA STI
Program Office, see the following:
• Access the NASA STI Program Home Pageat http://www.sti.nasa.gov
• E-mail your question via the Internet to
• Fax your question to the NASA AccessHelp Desk at (301) 621-0134
• Telephone the NASA Access Help Desk at(301) 621-0390
Write to:
NASA Access Help DeskNASA Center for AeroSpace Information7121 Standard Drive
Hanover, MD 21076
_| T|I

NASA / CRm1998-208674
Direct Numerical Simulation of a Coolant Jetin a Periodic Crossflow
Chirdeep Sharma and Sumanta Acharya
Louisiana State University, Baton Rouge, Louisiana
Prepared under Grant NAG3-1641
National Aeronautics and
Space Administration
Lewis Research Center
\ October 1998
Acknowledgments
This work was supported by an AST grant from the Turbomachinery Fluid-Physics group of NASA Lewis
with Dr. Chi Wang and Dr. Ray Gaugler serving as monitors. This support is gratefully acknowledged.
We also appreciate the help of Professor Joel Tohline of the Physics Department at LSU for
providing us with computer time to run on the MasPar computing system.
NASA Center for Aerospace Information
7121 Standard Drive
Hanover, MD 21076
Price Code: A04
Available from
National Technical Information Service
5285 Port Royal Road
Springfield, VA 22100Price Code: A04

\
Direct Numerical Simulation of a Coolant Jet in a Periodic Crossflow
Chirdeep Sharma I and Sumanta Acharya 2
Mechanical Engineering Department
Louisiana State University
Baton Rouge, LA 70803
Abstract
A Direct Numerical Simulation of a coolant jet injected normally into a periodic crossflow
is presented. The physical situation simulated represents a periodic module in a coolant hole
array with a heated crossflow. A collocated finite difference scheme is used which is fifth-order
accurate spatially and second-order accurate temporally. The scheme is based on a fractional step
approach and requires the solution of a pressure-Poisson equation. The simulations are obtained
for a blo_Ang ratio of 0.25 and a channel Reynolds number of 5600. The simulations reveal the
dynamics of several large scale structures including the Counter-rotating Vortex Pair (CVP), the
horse-shoe vortex, the shear layer vortex, the wall vortex and the wake vortex. The origins and the
interactions of these vortical structures are identified and explored. Also presented are the
turbulence statistics and how they relate to the flow structures.
Introduction
In recent years, Direct Numerical Simulation (DNS) has become a powerful tool in
understanding flow physics and the interaction between various dynamical scales in the flow.
Numerical Simulation of channel flows, due to its geometrical simplicity, has been studied most
commonly in the DNS literature. Orszag et al. (1980) studied transition from laminar to turbulent
z Graduate Student
: Professor and author to whom all correspondence should be addressed

flow using a 3-step time splitting method, Fourier series expansions in the spanwise and
streamwise directions and Chebyshev polynomial expansion in the direction normal to the walls.
Orszag et al. (1983) later used the same algorithm, but with an explicit Adams-Bashforth
integration scheme, to perform a DNS of turbulent channel flow. A DNS for a curved channel
flow was carried out by Moser et al. (1984) at Re: = 180 again using a spectral method. Kim et al.
(1987) used a Fourier Chebyshev pseudospectral method to study fully turbulent channel flow at
the same Reynolds number and presented a large number of turbulence statistics. A finite
difference DNS for a turbulent channel flow was presented by Rai et al. (1989) who showed the
need for higher order accurate upwind schemes to yield accurate simulations.
These initial successes with the DNS method spurred the investigation of slightly more
complex situations. Gavrilakis (1992) and Huser and Biringen (1993) both reported DNS for flow
in a square duct geometry. Lyons et al. (1991) studied fully developed passive heat transfer in a
direct simulation based on spectral method. Kasagi et a1.(1992) and Kim and Moin (1989)
obtained the solution to the energy equation for channel flows using a DNS procedure. Sumitani
and Kasagi (1995) have reported a DNS in a channel flow with uniform suction and injection.
More recently, Pointel et al (1996) have presented a DNS of channel flow with heat transfer
using a collocated fifth-order accurate finite difference procedure. The calculations were done for
a Re_ = 180 on a 128x64x64 grid and were found to be in good agreement with the DNS data of
Kim et al. (1987) and the measurements of Kreplin and Eckelmann (1979).
The present paper aims to extend the work of Pointel et al. (I996) for a more complex
flow situation, and intends to perform a DNS of a periodic cross-flow in a channel with a vertical

slot-injectionof coolant throughthe bottomsurface.Examplesof slot injectioninto a crossflow
includethe film coolingof gasturbinebladesandcombustorwalls, flow control of aircraftand
missilesthroughblov,ing, andeffluentdischargesinto air or water bodies. The applicationof
primar3,interesthereis thefilm coolingof gasturbineblades.
Jets in crossflow, as encounteredin film cooling configurations, representa rather
complexflow situation. Severalinvestigatorshave studied the featuresof the flow field
associatedwith a singlejet in a crossflow. The counterrotatingvortexpair (CVP) is the most
dominantstructureobserved,andpersists far downstreamof the jet injection.The CVP is a
Consequenceof the reorientationof the jet-hole vorticity by the crossflow (Foss (1980),
Andreopoulos(1985),Kelsoet al. (1996)).Shearlayeror ring vorticeshavealsobeenobservedin
thenearfield of thejet. Thesevo_icesaredrivenby the Kelvin-Helmoltzinstability. Horseshoe
vorticesareproducedasaconsequenceof thejet obstructingthecrossflowproducinganadverse
pressuregradientjust upstreamof the jet. These vortices have spanwise vorticity when they
form, and as they travel downstream they are deflected by the crossflow and acquire streamwise
vorticity rotating in a direction opposite to the CVP. Wake vortices which exist between the wall
and the jet have also been observed (Fric and Roshko, 1994).
The majority of the studies aimed at numerically examining the details of the flow
structures have approached the problem by solving the Reynolds Averaged Navier Stokes
(RANS) equations. This time-averaged approach requires the use of turbulence models and makes
predictions of the dynamic nature of vortices unfeasible. RANS calculations have been reported
by Patankar et al. (1977), Sykes et al. (1986), Kim and Benson (1992) and Demuren (1993).
Recently Large Eddy Simulations (LES) that resolve the dynamics of the large scales only and
\

model the small scales have been presented by Jones (1996) and Yuan and Street (1996).
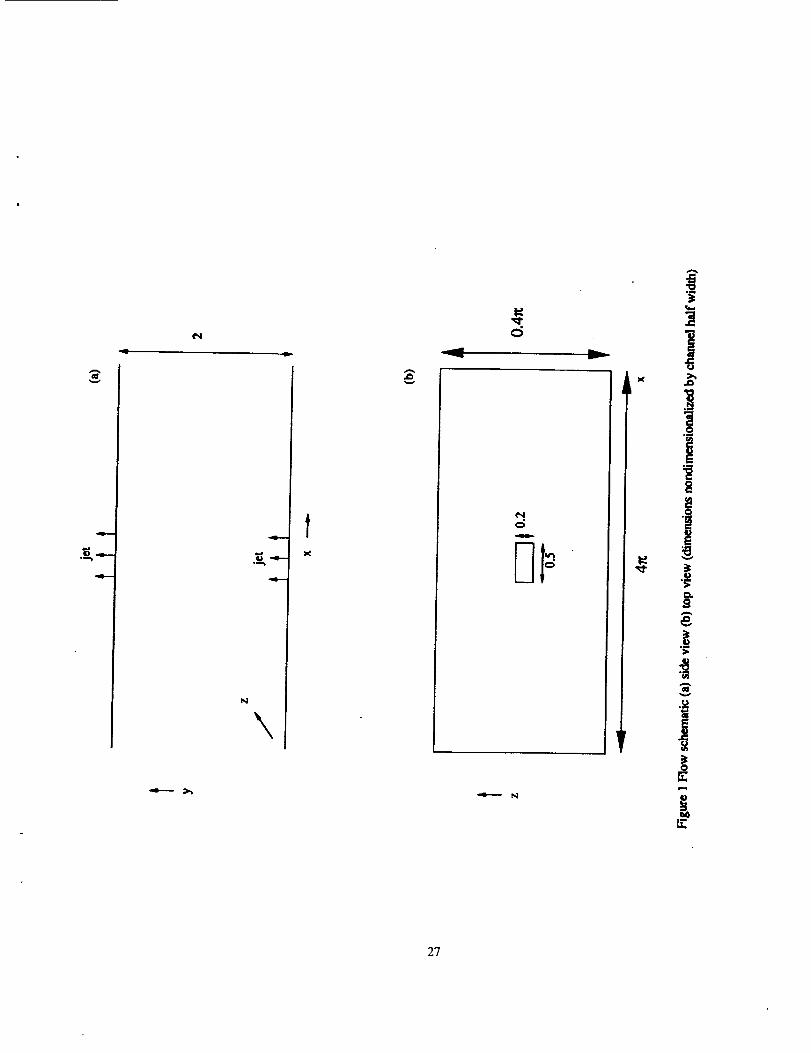
The geometrical configuration of interest considered in this paper is shown in Figure I.
The primary flow (called the crossflow) in the channel is in the x-direction. The coolant jet is
injected vertically upwards from a rectangular slot on the bottom surface. Periodic boundary
conditions are imposed on the crossflow in the x-direction. The periodic flow in the x-direction
makes the computational problem not only simpler to handle but it also allows us to mimic the
effects of upstream film coolant holes. In a film cooling configuration with a series of parallel
holes in the streamwise direction, the downstream coolant hole will see the downwash from the
upstream coolant hole, and this effect is incorporated in the present configuration with the
streamwise periodic boundary condition. Single coolant hole studies with Dirichlet inflow and
outflow conditions can not simulate the upstream hole effects. The correct alternative is to
include all rows of holes in the calculation domain, but performing a DNS calculation for such a
configuration is considerably more difficult than the simpler single-hole situation considered in
this paper. However, for a single hole domain, the imposition of periodic boundaries in the
crossflow direction is inappropriate, unless a suction boundary condition is incorporated, since
with injection alone there is a net addition of mass across the lower surface. Therefore, in order
to impose periodic conditions in the primary flow direction, a slot-suction boundary condition is
imposed on the top wall. The normal suction velocity and temperature at the top wall is made
exactly equal to the normal injection velocity and temperature at the bottom wall so that the
mass, momentum and energy injected in exactly balances that sucked out. The blowing (or
suction) ratio (injection velocity/crossflow velocity) is taken to be sufficently small (0.25) so that
the injection and suction effects are primarily confined to a small distance normal to the surface.
_1I 7-

In the spanwise direction, a row of film coolant holes are assumed to be
Therefore, in the computational domain of this study, consisting of a single hole,
spanwise bounda_" conditions are imposed.
present.
periodic
Numerical Proced ure
Assuming constant density, and using the channel half-width 8 as the length scale, and the
friction velocity u, for the fully-developed channel flow (with no injection or suction) as the
velocity scale, the non-dimensional continuity equation and the Navier Stokes equation for each
velocity component ui (i = 1, 2 and 3 represent the u, v, w velcoity components) can be written as:
V .u'-'0 (1)
aua vp +-J- V2u O)_t Re_
In the above equation, p represents the pressure and Re, represents the Reynolds number based
on the fully-developed channel flow friction velocity. For the temperature, iso-flux, iso-thermal
conditions proposed by Kasagi et al. (1992) have been adopted. According to their investigations,
for iso-flux conditions, the variations in the wall temperature for air flow can be considered to be
negligible. Hence we can assume the wall to be locally isothermal. The isoflux condition implies
that the ensemble averaged wall temperature (over z and t), increases linearly with x-direction.
Hence the bulk mean temperature averaged over z and t also increases linearly in x-direction and
can be obtained from an energy balance. We also assume that the injection and suction jets are at
the same temperature but lower than that of the wall. Hence the overall energy balance is
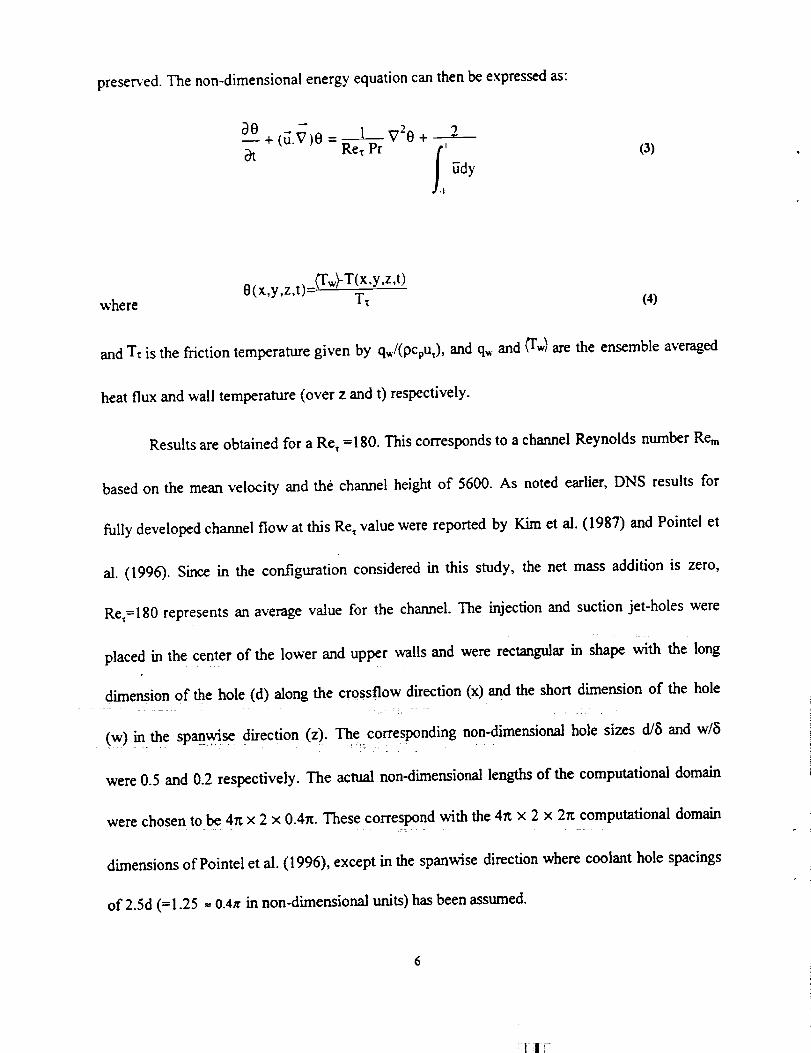
preserved.The non-dimensional energy equation can then be expressed as:
ae--+(_.V)e= 1 V2e+ 9.2& Re_ Pr /"
1,_dy
(3)
O(x,y,z,t)=(I'w)'T(x,Y ,z,t )where T_ (4)
and T_ is the friction temperature given by q,,J(pCpU,), and q,, and (Tw) are the ensemble averaged
heat flux and wall temperature (over z and t) respectively.
Results are obtained for a Re, =180. This corresponds to a channel Reynolds number Rein
based on the mean velocity and the channel height of 5600. As noted earlier, DNS results for
fully developed channel flow at this Re_ value were reported by Kim et al. (1987) and Pointel et
al. (1996). Since in the configuration considered in this study, the net mass addition is zero,
Re,=180 represents an average value for the channel. The injection and suction jet-holes were
placed in the center of the lower and upper walls and were rectangular in shape with the long
dimension of the hole (d) along the crossflow direction (x) and the short dimension of the hole
• (w) in th e spanwise direction (z). _e cgrresponding non-dimensional hole sizes d/_i and w/_i
were 0.5 and 0.2 respectively. The actual non-dimensional lengths of the computational domain
were chosen to be 4n × 2 x 0.4rr. These correspond with the 41t x 2 x 2_ computational domain
dimensions of Pointe! et al. (1996), except in the spanwise direction where coolant hole spacings
of 2.5d (= 1.25 _ 0.4_r in non-dimensional units) has been assumed.
6

As noted earlier, the flow and temperature variables are assumed to be periodic in the x
and z directions. Dirichlet. zero velocity and temperature, boundary conditions were imposed at
the channel walls while a zero-value Neumann condition v,as imposed on the normal pressure
gradient at the wall. At the injection and suction slots, the normal velocity is set equal to 0.25 of
the mean crossflow velocity corresponding to the fully developed channel flow at Re_=180, and
the temperature is set to a value lower than the wall temperature, and is assigned a non-
dimensional value of 0.5.
The Fractional Step approach originally developed by Chorin (1967) was used for
integrating the equations. In the first step, the momentum equation without the pressure gradient
contribution is solved using a second order explicit Adams-Bashforth time-integration for the
convection and streamise and spanwise diffusion terms. For the normal-diffusion term, an
implicit Crank-Nicolson scheme is used. This approach uses an intermediate velocity (denoted
by a - ), and for a typical velocity component, say u, has the following form:
g - u n _3 (C" + D_,) -12-.( C "-t + D _-1) + 2 (D 7 + D ,). (4)At 2
Here C represent the convection terms, Dc represents the streamwise and spanwise diffusion
terms and Di represents the normal diffusive term.
The velocity field is computed in the second step:
At(s)

where the pseudo pressure O is related to the pressure by:
6t _:0
¢_ 2Re 3y: - p (6)
We can apply the divergence operator on equation (5) and use continuity of velocity field to
obtain the pressure Poisson equation:
Once the pseudo pressure is known the velocity field u "÷l can be calculated from equation (5).
The scalar field for temperature is then obtained by integration of the energy equation. We
use a similar approach to the momentum equation to get the fractional step equations from which
we can directly obtain the temperature field.
The spatial discretization was done using the non-conservative formulation of the
convective and diffusive terms on a collocated grid with velocity and pressures at the center of
the control volume. The convective terms were treated by a fifth order upwind biased
approximation as used by Rai et al. (1989). The diffusive terms are treated by a sixth order
accurate seven point central difference stencil. For the boundary terms we used one sided
differences to maintain the accuracy of the scheme. The pressure Poisson equation is discretized=
using the 4-2 consistent formulation as recommended by Najjar et al. (1994). This involves
second order discretization of the divergence operator and fourth order discretization of the
pressure gradient operator. In the continuity equation, which is used for updating the velocity
field at the cell faces, the gradient operator is represented by a fourth order f'mite difference
formulation.
1 | i

The implementationof the numericalprocedure,describedbelow, is doneon a MasPar
MP-2. This is a massivelyparallelcomputerand providesa suitableplatform for computer
intensiveDNS calculations.The MasParis a SIMD machine,which hasa 128× 64 parallel
processors(PE)array.We haveusedagrid of 128x64x64for thecalculation,,which is uniform in
thex andz direction,andnon-uniformin they direction.Each(I, J) nodeis mappedon to a PE.
EachPEhasalocalmemoryof 64Kandprovidesthestoragein thethird(K) dimension.
The time integrationwas first donefor the velocity field till the flow reacheda fully
developedstate.Thenthethermalfield wasallowedto reachthe fully developedstatebeforethe
calculationof meanquantitieswasstarted.Typically 60,000time stepswererequiredto getto
this stage.The calculationof the meanquantitieswas doneover 20,000non-dimensionaltime
steps.This was followed by the calculationfor the turbulentstatisticsandthis wasdoneover
8000 steps. During the statistics calculationwe also calculatedthe instantaneousvonicity
profiles for variousstreamwise,crossstreamandspanwiseplanesat varioustime steps in order
to present the time evolving characteristics for the flow field.
Results and Discussion
In making an assessment of the adequacy of the grid size used in the present study where
the mean Re, is 180, we make comparisons with the grid resolution of reported channel flow
studies at a Re, of 180. Pointel et al. (1996) used a 128x64x64 grid for simulating fully developed
channel flow in a 4_ x 2 x 2n domain at a Re, of 180. Results obtained are shown in Figure 2 and
compared with the DNS predictions of Kim et al. (1987) and the experimental data of Kreplin

andEckelmarm(1979).As canbeseen,thecomparisonis quite good.The same128x64x64grid
wasemployedin the presentproblemwhich hasa smallercomputationaldomainof 4rt x 2 x
0.4_,andthereforehasanimprovedresolution. The resolutionin wall-coordinatesarenotedto
be:z_tx÷= 17.67, Ay _ = 0.018 - 23.76, Az _"= 3.59. In comparison, Kasagi et al. (1992) reported
corresponding grid spacings of 18.4, 0.08-4.9 and 7.4 in a 5rt x 2 x 27t computational domain.
Similar grid spacings of 17.7, 0.05-4.4, and 5.9 were also used by Kim and Moin (1989) and Kim
et al. (1987) in a 4_ x 2 x 2rt computational domain at the same Reynolds number. Moser and
Moin (1984) used 128x65x128 points in a similar computational domain and comparable
Reynolds number, and reported that this resolution was adequate to resolve all the essential
turbulent scales. Lu and Hetsroni (1995), in their direct simulation of channel flow with heat
transfer at a comparable Reynolds number, have used ,fix", Ay _', and Az "_ values of 32, 0.4-20,
and 8. Based on these comparisons, the grid size used in this study should be deemed to be
adequate.
In presenting the results below, the origin of the coordinate system is fixed at the jet-hole
center. The x and y dimensions are scaled with the long dimension of the jet hole (d) oriented in
the direction of the crossflow, while the z dimension is scaled with the spanwise dimension of
the jet hole (w).
Characteristics of the Flowfield
Figures 3(a) and (b) present the u and v velocity contours in the spanwise midplane (z/w
= 0), and correspond to the vector plots shown in figures 5(a) and 5(b). For clarity, several of the
plots are stretched in the vertical or spanwise directions. Figure 3(a) and 5(a) clearly show the
10

almostimmediatebendingofthe jet dueto the strongcrossflow.Thejet penetrationis confined
to a y/5 of about 0.5 or a y/d of about 1 which corresponds to the long-dimension of the jet-hole
(hereinafter referred to as the jet diameter). Figure 5a clearly shows that at the channel mid-plane
(y/d=2), the crossflow velocity is relatively unaffected by the injection or suction slots. This
observation supports the earlier premise that the behavior of the film-coolant injection jet can be
studied independent of the suction jet, and that the observations made should hold for a film
cooling configuration with a series of coolant holes in the crossflow (or primary flow) direction.
A weak horseshoe vortex system is observed in Fig. 3(a) and in the near-wall detail of the
velocity vectors shown in Fig. 5(b). The vortex system extends over one hole diameter upstream
of the jet and appears to consist of two clockwise eddies rotating side by side. However, the
horse-shoe vortex system does not appear to be deflected around the jet as it does at higher
blowing ratios (see Fric and Roshko, 1994; Kelso et al., 1996; Muldoon and Acharya, 1998). No
footprint of the vortex is seen in the x-vorticity contour along a horizontal plane just above the
lower surface (Fig. 3c).
In examining the instantaneous v-velocity contours (Fig. 3b), it can be seen that roughly 5
hole diameters downstream of the injection location (x/d=5), alternate pockets of positive and
negative v-contours are present (note the high level of stretching in the y-direction). These are
analogous to those observed by Kim et al. (1987), and represents ejection and sweep events
associated with a developing boundary layer. In the near vicinity of the injection hole, 1 < x/d <
5, the behavior is different with primarily positive near wall velocities.
The x-vorticity contours shown in Figure 3c indicate the existence of a dominant wall-
I!

vortex structure close to the lower surface with vorticity opposite to the CVP. Thus downstream
of the injection hole, positive vorticity, is seen close to the wall in the right half (viev_ing the flow
from a downstream point) and negative vorticity is noted in the left half. Further away from the
wall, at a higher y/d value, the CVP is encountered and the sign of the vorticity reverses. This can
be seen in the cross-sectional (y-z) plots of x-vorticity presented later. Figure 3c also shows the
generation of negative and positive x-vorticity on the fight and left edges of the jet hole; these
represent the source of vorticity for the CVP. It is however important to note, that the vorticity
for the CVP does not originate from any in-hole boundary layer vorticity (as has often been
reported in the literature), since at the jet exit plane a uniform v-velocity was specified. Rather,
the x-vorticity along the jet-hole edges is generated by the interaction of the injected velocity and
the crossflow.
Figure 4 shows the velocity vectors in different cross-stream planes at x/d=0.5, 2, 5 and
10. At x/d = 0.5 we can see the jet penetration to be more than y/d = 1.8. However beyond a y/d
of 1, the velocity magnitudes in the y-z plane are considerably smaller than the velocities in the x-
y plane, and therefore as seen in Fig. 5a, the flowfield is relatively unaffected by the jet beyond a
y/d of 1. We can see the evolution of the CVP around z/w = ± 0.8 for y/d < 0.2. There is
considerable flow across the spanwise periodic boundaries indicating a significant level of lateral
transport, and interaction between spanwise adjacent coolant jets. Both inflow and outflow are
noted across the periodic boundaries. We also note the absence of any symmetry across the
z/w=0 boundary. In fact by x/d=10, the CVP has lost its bound-vortex structure and no
semblance of symmetry exists across z/w=0. In the near field (x/d<5), each half of the CVP is
12

clearly associated with a weak counterrotating eddy system above it.
Figure 5c shows that there is a significant amount of entrainment of the crossflow into the
wake of the jet. This clearly appears to persist up to about .x/t5 of 9 at which point the wake
appears to meander away from the jet-hole centerline. A close inspection also reveals flow
reversals of the entrained crossflow near the jet-hole centerline. These reversals are most clearly
seen between x/d of 3 and 5 in Fig. 5c, and represent the onset of the wall-vortex system which
will be dearly evident in the x-vorticity contours in a y-z plane presented later.
Figure 6 shows the profiles of the mean velocity and temperature, non-dimensionalized
by the corresponding average friction-velocity u_ (which is the same as the friction velocity for
fully developed turbulent channel flow at the same average Reynolds number Re_=180 of this
study) and the average friction-temperaure T_. The profiles are presented for several x/d locations
and two z/w planes, z/w=0 corresponding to the jet-center plane, and z/w=-l.9 representing a
location between the jet-hole and the spanwise periodic boundary. The near-wall behavior
(y+=y.Re/8 < 12), appears to conform somewhat to the law-of-the-wall behavior with a
maximum deviation of less than 30%. However, in the turbulent region (y+> 12), log-law behavior
is not observed even offthe jet-center plane and upstream of the jet (z/w=-1.9, x/d=-2) due to the
effect of vortical flow structures. At z/w=-1.9, the near-wall behavior appears to be only mildly
altered by the spanwise cross-stream flow downstream of the jet In fact, Fig. 5c indicates that
the spanwise cross-stream flow close to the wall at zA_---1.9 is relatively weak. The maximum
deviation from the x/d=-2 profile appears to occur in the vicinity of x/d=2, beyond which flow
recovery is initiated. The profiles in the jet-center plane (Fig. 6b and 6d) indicate significant
13

distortionof thenear-wallbehaviorby thejet This distortion beginsat the upstreamendof the
jet (._Id=-0.5)with a significantreductionin thewall-gradients.Flow recover)'beginsdownstream
of the jet, but the recoveryin the inner-region(y_<12) is substantiallyfasterthan in the outer-
region(y_'>12), leadingto a changein the signof the slopein thevelocity profile in the buffer
regionandimmediatelyaboveit (7<y_'<35or 0.08<y/d<0.39).Suchchangesin the slopeof the
velocity profile can lead to the developmentof flow instabilitiesand large-scale vortical
structures.This y/d region can be seen to correlate with the region associated with the growth of
large scale structures in the vorticity contours presented later.
Figure 7 shows the time history of spanwise vorticity at z/w = 0. The time-series is
presented at time instances tt, t2,...ts, separated by At=0.02 where At is the non-dimensional time
interval. The figures indicate the predominant negative taz on the windward side which is
indicative of the crossflow bending due to the jet. Patches of positive vorticity can be seen on the
leeward side of the jet. The vortices on the windward and leeward side of the jet are driven by
Kelvin-Helmholtz instabilities, and are generally referred to as shear layer or spanwise-jet-
vortices. These vortices, particularly those from the windward side, appear to be peeled by the
crossflow and convected downstream. In fact the near-wall boundary-layer region downstream of
the jet is dominated by the negative vorticity partly originating from the windward side of the jet,
and partly associated with a developing boundary layer. The dynamical nature of the vortices
should be noted in the time-series presented. Note the vortices on the windward side at time t3
between y/d of 0.5 and 1. At the next time-instance, a necking process is initiated, and
subsequently two vortices form and convect downstream. A third vortex is transported to the
14
1 1 !

near wall regiondownstreamof the jet. Upstream of the jet the horseshoe vortex system
consisting of two eddies can be obse_'ed, but it can be seen to be rather small and localized.
Figure 8 shows the instantaneous x-vorticity at x./d=-0.5 (upstream edge of the injection
hole) and at x/d=0.5 (downstream edge of the injection hole). At x/d=-0.5, the beginings of the
CVP can clearly be seen. This was also observed in Fig. 3c, and implies that the x-vorticity of the
same sign as the CVP is originated on the windward side through the interaction between the jet
and the crossflow. Both at x/d=-0.5 and 0.5, the CVP appears to be straddled by an eddy rotating
in the opposite direction. This is possibly the horse-shoe vortex that lifts up above the CVP at
this low blowing ratio. Reported studies in the literature at higher blov,5_ng ratios indicate that the
horse-shoe vortex is deflected in the spanwise direction by the jet and travels downstream along
the wall parallel to the CVP. In the present case the signature of the horse-shoe vortex in the
spanwise direction is not observed, and we believe that at the low blowing ratio considered here,
since the jet is immediately bent by the crossflow, the horse-shoe vortex instead of being pushed
in the spanwise direction is pushed up in the vertical direction to ride above the CVP.
Figure 9(a) shows the time-series (presented 2At apart) of the x-vorticity at x/d=2. Three
distinct structures can be observed: the CVP, the horse-shoe vortex system, and a wall vortex
below the CVP. The orientation of the wall vortex and the horse-shoe vortex are in the same
direction and opposite to the CVP. The wall vortex is due to the entrainment of the crossflow
into the wake of the jet. The entrained crossflow encounters high pressures along the jet-hole
centerplane which drives the flow along the wall away from the centerplane, thus establishing a
wall-vortex. The horse-shoe vortex is now shifted outwards toward the periodic boundaries, but
15

still remainslifted off thesurface.In examiningthetime-series,onenotesthatthe CVP undergoes
significantdistortionwith time. Thereis alsosignificant spanwisetransportof vorticity across
theperiodicboundariesleadingto fairlyeffectivespanwisemixing.
At x/d=5(Fig.9(b)),anoticeableinteractionbetweenthewall-vortexandtheCVP is seen.
The wall-vortexcanbeseento beentrainedupwards towards the CVP, and in this processis
reorientedintoy-vorticity representingwakevortices(seenin Fig. 10and11).This reorientation
of thewall-vortexsystemintoa wakevortexsystemhasalsobeenreportedby Fric andRoshko
(1994) andKelsoetal. (1996).
Furtherdownstreamat x/d = 10 (not shown), we cannotclearly identify the CVP as
beinganorganizedstructure spanningboth sides of the jet-holevertical midplane.There is
significantvortical activity though,but of a much more complexnature, and indicatesthe
persistenceof thewake.
Figure10showstheinstantaneous_ contourscloseto the lowersurfaceat y/d = 0.002,
whileFig. 11showsthetime historyof o.b.,contoursat y/d = 0.0239respectively.In Figure10,
we note that the wake vortices strongly manifest themselves primarily beyond x/d=5 which is the
approximate location where we noted upward entrainment and reorientation of the wall vortex
system (Figure 9(b)). This observation provides further evidence of the correlation between the
wail-vortex and the wake-vortex system. The wake vortices are in the form of a series of co-
rotating or counter-rotating adajacent eddies that have features quite distinct from those behind a
rigid cylinder. At earlier x/d locations, upstream of x/d=5, the wall vortex had remained fairly
stable and bound to the near wall-region, and no significant presence of a series of adjacent co-
16
_1 1__

andcounter-rotatingwakevorticeswasnoted.Instead,y-vorticity in the nearwake (x/d<5)was
obse_'edin theform of anear-contiguouselongatedchain(seeFigurei0 and I 1) andstemsform
theinteractionof thejet andthedeflectedcrossflowwhich leadsto significantvaluesof theOw'/)z
term (and therefore ab) along the spanwise edges of the jet. This vorticity is entrained into the
near wake (x/d<5), and eventually breaks down further downstream, contributing also to the
strong wake vortex system observed beyond x/d of 5. The time series behavior shown in Fig. 11
also indicates that the wake structure oscillates around the jet-hole center-plane in the near field,
but exhibits significant asymmetry in the far field. At time instances t_, t3 and t5, for example, the
wake vortex system beyond x/d of 6 is skewed considerably towards positive z/w values. This
departure from symmetry was also noted earlier in velocity vector plots of Fig. 5c.
Figure 12 presents the instantaneous pressure contours at y/d=O.0239 at four time-
instances. The adverse pressure gradient upstream of the jet can clearly be seen, and is
responsible for the horse-shoe vortex system. In the jet-hole region, and downstream of it, the
pressure distribution shows a necklace pattern. Note that in the region -0.5<x/d<0.5 there is a
strong pressure gradient in the crossflow directed inwards in the spanwise direction toward the
jet. This inward pressure gradient combined with the adverse pressure gradient the flow
encounters at the jet interface leads to the generation of x-vorticity of the same-sign as the CVP
along the spanwise boundaries of the jet-hole (z/w= -+0.5). This mechanism therefore appears to
be responsible for the initial development of the CVP.
Downstream of the jet-hole, the spanwise pressure gradient is directed inwards towards
the jet centerline. This pressure gradient is responsible for the inward entrainment of the
17

crossflow that is the source of the wall vortex system. Note that downstream of about rdd=5, the
coherence of the pressure contours is somewhat lost leading to the asymmetric wake pattern
reported earlier.
Time-averaged Statistics
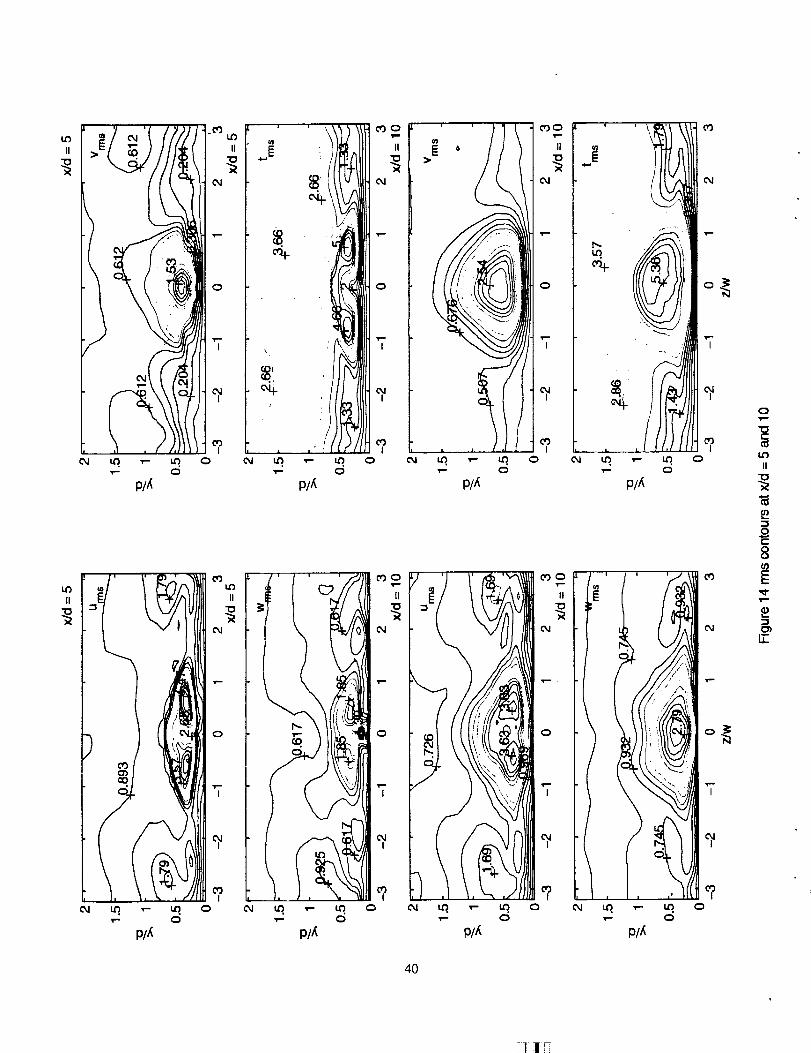
Figure 13 and 14 show the rms contours at x/d=0.5, 2, 5 and 10. At x/d=0.5, Vrms and W_s
are comparable in magnitude with the latter attaining slightly larger values, but u,_nsis nearly twice
the v_.s and _,'m_svalues. The U_s and w_s plots correlate well with each other exhibiting maximas
in regions of high unsteady o_. vorticity, that is in the outer regions of the CVP and the CVP-
horseshoe vortex interface (see Fig. 8) that exhibit a significant level of unsteadiness, and near the
span,_,ise periodic boundaries across which significant vorticity transport occurs (Fig. 8 shows
only one instance in time, and shows high vorticity near the z/w=-3 boundary. At other instances
in time high vorticity is seen at the z/,_=3 boundary as shown in Fig. 9). The v,r.s and t_ms profiles
correlate well with each other, but do not show a strong correlation with the u,_s and w,_s plots.
In fact the peak values are obtained near y/d-l, and appears to correspond to the extent of the
vertical jet penetration. The interface between the jet and the crossflow, is characterized by
Tollnaein-Sclalichting instabilities and high spanwise vorticity o._ (see Fig. 7), and is therefore
associated with high v,_. Since the jet and the crossflow are at different temperatures, their
interface is also associated with high t_s. The aforedescribed correlation between the rms values
and the coherent structures imply that the large scales are largely responsible for the production
of turbulent stresses. At x/d=2, the behavior of the rms profiles is quite similar to that at x/d=0.5,
except that the t,_._ profiles shows high values both in regions of high vn_s (interface between the
18
_11]-

upper edgeof the jet and the crossflow) and high u,_.s(interfacebetweenthe CVP and the
crossflow). Further doxvnstream (_'d=5 and lO) the jet deflection is complete, and the CVP
dominates growing in size and strength. All the tins-profiles now correlate with the high vorticity
regions of the CVP, and as a consequence correlate well with each other. At x/d=lO, we still
observe urms> Vrms> Wrms- although the relative magnitudes are closer to each other than they were
at x/d=0.5. Note that the time-averaged rms-profiles at x/d=10 show reasonable symmetry
around z/v_--O, while the instantaneous profiles shown earlier (Fig. 5c and 8-1 l) displayed
significant asymmetry in the spanwise direction.
The rms profiles in the z/w=O plane are shown in Figure 15. All the peak values occur
downstream of the jet injection (x/d=O), but the upwash effect is clearly evident. High rms values
enter the computational domain from the upstream boundary, and the flow development
downstream of the injection point is constrained by these high rms values. The Urms value peaks
first in the x-direction (near x/d=5) and occurs closest to the wall (y/d=0.25), while the vm_s peaks
around x/d=6.5. These peak locations correspond with the location where the shear layer vortices
saturate in strength (see Fig.7). The other rms values w,_ and _ peak at an x/d in the vicinity of
7. Note that in the vicinity of this x/d (in the range of 5-7), significant reodentation of the wall
vortex system into a wake vortex system occurs, and therefore the wake- and wall-vortex
structures structures apparently play an important role in the w,_ and t,_ values.
Figure 16 and 17 present the Reynolds stress components at x/d=0.5, 2, 5 and 10. As
expected, u'v' is observed to be symmetric about z/w = O, and u'w' and v'w' are observed to be
antisymmetfic about z/w = 0. The high u'v" values are associated with the jet-crossflow interface
19

shown in Fig. 7, where shear layer vortices primarily form. At x/d=10, distinct regions of upper
and lower interfaces are no longer clearly evident and a large patch of high u'v" is noted in the jet-
flow region. High values of u'v' are also associated with the vortical structures transported
across the periodic boundaries. These structures lead to large values of o3u/c3y and therefore u'v'.
The u',_ / and v'w" values are high in regions of large 3tv'o3z and o3v/o3z respectively. These regions
are again associated with the jet-crossflow interfaces and the vortical structures crossing the
periodic boundaries. Note that the clover-leaf shape and the sign of the v'w' contours near the
wall for x/d > 5 indicate the existence of counter-rotating eddies near the wall, i.e., the CVP and
the wall vortex, in the y-z plane. In comparing the magnitudes of the shear stresses, in the near
field (x/d < 2), u'w' > u'v' > v'w' with u'w' being substantially higher presumably due to large
cqu/Oz values near the edges of the jet. Further downstream, u'w" and u'v' become more
comparable in magitude.
Figure 18 presents the Reynolds stresses in the z/w = 0 plane. The peak shear stresses,
in all cases occur downstream of x/d=5. The u'v' contours correlate best with the Vrms contours
(Fig.15) and therefore correlate with the shear layer vortices, and peak at the locations where
these vortices saturate in strength. At x/d=5, for example, the peak u'v' value shown in Fig. 17 is
2.85 and its y/d location correlates with the shear layer vortices, while secondary bimodal peaks
(of the order of 1)occur at y/d=0.25 which correlates with the CVP and the horseshoe vortices.
The v'w' contours appear to be consistent with the nature of the near-wall flow structure in the
y-z plane. Close to the wall, the wall vortex produces negative v'w' values. The wall vortex
2o

systemgainsprominence,asseenearlier, around x/d=5 and therefore large negative v'w' values
are obtained in the vicinity of this x/d value. Further downstream, the wall vortex is entrained as
an upflow into the CVP. and as seen in Fig. 11, wake vortices are noted. The v'w' contours in
this region show a more complex behavior and are positive. The u'w' contours also correlate well
with the crossflow entrainment. They peak where the crossflow is a maximum (around x/d=5),
and decay further downstream.
Figure 19 and 20 present the turbulent heat flux correlations at x/d=0.5, 2, 5 and 10. The
turbulent heat flux correlations appear to correlate reasonably well with the rms values and the
behavior of the large scale vortical structures, thus indicating the important role these structures
play in the turbulent heat transport. In comparing the magnitudes u't" > w't' > v't' in the near
field (x/d<5) indicating that the streamwise velocity fluctuations are most responsible for the heat
transfer from the surface. Further downstream, at x/d=lO, the v't" values become comparable in
magnitude to the u't" values, while the w't' dccrease in magnitude and become less important.
The heat flux distributions at z/d=0 in the x-y plane are shown in Fig. 2 l, and support the above
observations. The maximum w't' occurs near x/d=5 where there is significant spanwise
entrainment of the crossflow. The peak in the u't' and v't' occur downstream of x/d=5 and at a
y/d location of approximately 0.5. These peak values are therefore associated with the spanwise
shear layer vortical structures (Fig.7).
Figure 22 presents the turbulent viscosity factor vT.ijcalculated as:
21

-u;ui
L_×j _×ij (8)
where all terms on the right hand side of the above equation are computed from the DNS results.
The viscosity factors are presented in a x-z plane corresponding to a y/d=0.1085. While all three
viscosity factors Vt.12, VI.13, vt.23were computed, only vt_2 is presented. Note that the
magnitudes of the individual viscosity factors vt.12, vt.13, vt.23 at the same point are
substantially different in magnitude indicating the anisotropy in the flowfield. The vt,12 clearly
corresponds to the wake structure shown in Fig. 11, and indicates that the large-scales clearly
have a role in the values of the turbulent viscosity. The footprint of the horseshoe can also be
seen upstream of the jet hole. The Vtol3, vt,23 values show less coherence with respect to the
large scale structures, and are characterized more by patches of high positive and negative
viscosity factors. The positive and negative values of the viscosity factors are associated with the
fact that both the turbulent shear stress and the mean strain rate can have both positive and
negative values. Clearly, any use of an isotropic turbulent viscosity is going to be unsuccessful in
capturing the true behavior.
Concluding Remarks
A Direct Numerical Simulation of a film coolant jet injected normally into a crossflow has
been presented. The crossflow Reynolds number is 5600 and the blowing ratio is 0.25. Both flow
and heat transfer predictions are presented. The following major observations are made:
1. Jet penetration is limited to 1.8 hole diameters, with the primary crossflow velocity relatively
unaffected beyong 1 hole diameter.
22
_I _ii¸-

2. A weakhorse-shoevortexsystemconsistingof twoclockwiseeddiesis notedwithin one hole
diameterupstreamof thejet. Thishorseshoevortexis deflectedupwardsandridesover the CVP
in thenearfield of thejet.
3. The near-fieldpast jet reattachmentis characterizedby developingboundarylayer behavior
with ejectionandsweepeventscommonlytermedasturbulentbursts.However,theseeventsare
largelycontrolledby thelargescalevorticalstructures.
4. The originsof the CVP is associated with the x-vorticity generated by the interaction of the
injected jet with the crossflow. Therefore hole-boundary-layer vorticity is not essential for the
generation of the CVP.
5. There is a significant amount of crossflow in the near field (x/d<5) of the jet. This crossflow
encounters an adverse gradient along the jet-hole centerline and is responsible for the formation of
the wall vortex system. The wall vortex is fairly stable for x/d up to 5, but beyond that is
entrained into the CVP and is reoriented as a wake vortex system.
6. Along the upper edges of the jet, Tollmein-Schlichting instability leads to the formation of the
shear layer vortices. These vortices are peeled and convected downstream.
7. The V_msand _ contours appear to be most strongly correlated with each other and with the
shear layer vortices in the near field. The u,ms and wrms contours appear to be the larges tat the
interface between the CVP and the horse-shoe vortex and along the periodic boundaries at the
locations associated with significant spanwise crossflow. In general, urns > w_s > v,_s. The
strong correlation of these statistics with the large scale structures point to the importance of the
latter in controlling the surface heat transfer and the near field mixing between the crossflow and
the coolant stream.
23
8. The viscosit3,'factors show considerablyanisotropyand in the horizontal(x-z) plan show
correlationwith thelargescalestructures.Existingstatisticalmodelsbasedon isotropyareclearly
goingto be inadequatein modelingthis complexflow. Currentefforts arefocussedin e,'_v.ining
the budgetsof the turbulencekinetic energyand thedissipationrates,in orderto provide some
guidancetowardturbulencemodeling.
Acknowledgements
This work was supported by an AST grant from the Turbomachinery Fluid-Physics
group of NASA-Lewis with Dr. Chi Wang and Dr. Ray Gaugler serving as monitors. This
support is gratefully acknowledged. We also appreciate the help of Professor Joel Tohline of the
Physics Department at LSU for providing us with computer time to run on the MasPar
computing system.
References
Andreopoulos, J., 1985, On the structure of jets in a crossflow, Journal of Fluid Mechanics, VoI.
157
Chorin, A. J., 1967, A numerical method for solving incompressible viscous flow problems.
Journal of Computational Physics, 2:12-26
Demuren, A. O., 1993, Characterstics of three dimensional jets in crossflow, International
Journal of Engineering Science, No. 6, pp. 899-913
Fric, T. F., and Roshko, A., 1994, Vortical structure in the wake of a transverse jet, Journal of
Fluid Mechanics, Vol. 279, pp. 1-47
Foss, J., 1980, Interaction region phenomenon for the jets in a cross-flow problem, Rep. SFB
80/E/161, Univ. Karlsruhe
Gavrilakis, S., 1992, Numerical simulation of low reynolds numner turbulent flow through a
straight square duct, Journal of Fluid Mechanics, Vol. 244, pp. 101-129
Huser, A., and Biringen, S., 1993, Direct numerical simulation of turbulent flow in a square duct,
Journal ofFhdd :_techanics, Vol. 257, pp. 65-95
Jones, W. P., and Willie, M., 1996, Large eddy simulation of a round jet in crossflow,
Engineering Turbulence Modeling and Experiments 3, Ed. Rodi, W. and Bergeles, G., pp.
199-209
24
_1!]

Kasagi. N., Tomita, Y.. and Kuroda, A., 1992, Direct Numerical Simulation of Passive Scalar
Field in a Turbulent Channel Flow, Transactions of the ASME, Vol. 114, pp. 598-606.
Kelso. R. M.. Lira. T. T.. and Perry, A. E., 1996 An experimental study of jets in crossflow.
Journal of Fluid 3lechanics, Vol. 306, pp. 111 - 144
Kim, S. W., and Benson, T. J., 1992, Calculation of a circular jet in crossflow with a multiple
time scale turbulence model, International Journal of Computational Physics, Vol. 59, pp.
308
Kim, J., Moin P., and Moser, P., 1987, Turbulence statistics in fully developed channel flow at
low reynolds number, Journal of Fluid Mechanics, Vol. 177, pp. )33-166
Kim, J., and Moin, P., 1989, Transport of passive scalars in a turbulent channel flow, in
Turbulent Shear Flows 11/, J. C. Andre et al eds., Springer Verlag, Berlin, pp. 85-96
Kreplin, H., and Eckelman, H., 1979, Behavior of the three fluctuating velocity components in
the wall region of a turbulent channel flow, Phys. of Fluids, Vol. 22, pp. 1233-1239
Lu, D. M., and Hetsroni, G., 1995, Direct numerical simulation of a turbulent open channel flow
with passive heat transfer, Int. J. Heat and Mass Transfer, Vol. 38, pp. 3241-3251
Lyons, S. L., Hanrarty, T. J., and McLaughlin, J. B., 1991, Direct numerical simulation of a
passive heat transfer in a turbulent channel flow, lnt. J. Heat Mass Transfer, Vol. 34, pp.1149-1161
Moser, R. D., and Moin. P., 1984, Direct numerical simulation of curved turbulent channel flow,
NASA TM 859 74
Muldoon, F., and Acharya, S., 1998, Dynamics of large-scale structures for jets in crossflow,
43rd lntl. Gas Turbine Institute Conference, Stockholm, Sweden; also NASA/CR-1998-206606
Najjar, F., M., and Vanka, S. P., 1994, Simulations of unsteady fluid flows on the CM-5.
Symposium on Advances in Computational Methods in Fluid Dynamics, ASME/Fluid
Division Summer Meeting.
Orszag, S. A., and Kells, S. C., 1980, Transition to turbulence in plain Poiseuille and plane
Couette flow, Journal of Fluid Mechanics, Vol. 96, pp. 159-205
Orszag, S. A., and Patera, A. T., 1983, Transition to turbulence in plane Pouiseuille and plane
Couette flow, Journal of Fluid Mechanics, Vol. 128, pp. 347-385
Pointel, G., Acharya, S., and Sharma, C., "Direct Numerical Simulations of Convective Heat
Transfer", 1996 Energy Technology Conference and Exposition, Houston, January 1996.
Patankar, S. V., Basu, D. K., and Alpay, S. A., 1977, Prediction of the three dimensional velocity
field of a deflected turbulent jet, Transactions of the ASME
Rai, M., and Moin, P., 1989, Direct simulations of turbulent flow using finite-difference schemes.
AIAA Paper 89-6039.
25

Simutani, Y., and Kasagi, N., 1995, Direct numerical simulation of turbulent transport v,ith
unitbrm wall injection and suction, AI.4A Journal, Vol. 33, pp. 1220-1228
Sykes. R. I.. Lewellen, W. S., and Parker, S. F., 1986. On the vonicity dynamics of a turbulent jet
in a crossflow, Journal of Fluid Mechanics, Vol. 80. pp. 49-80
Yuan. L. k.. and Street. R. L., 1996. Large eddy simulation of a jet in crossflow. ASME Fluids
Engineering Division, Vol. 242
26
1 li_
"41"--'
"I----
*,Q.--.
°'--t
'4--"-- _
A
c_
•"Q---- N
c_
ii
°__J
_3
0
2?

2O
15
"= 10
21o_" 1oo
3.01. " ' " - -' - , • - -
00o 0 Kreplin&Eckelmann 3
_oF-o°..-........_. o_.. j
0.5
0.0
20 40 60 80y"
Figure 2: Comparison of DNS predictions ofPointe] et a|'_ i996 (--) with the DNS predictions of
Kim et al., 1987 (--'--) and experimental data of Kreplin and Eckelman (o, +, A) Law ofthe
vail shown by (...... ) lines
28

Ac_
pIA
v
17
T
o
'7,
I
M_
0
©
IL
0
0
29

3O
1 Ili

e ' I • t.I
i ¢.o..._
t s. .....
| I l.o.._
| ! Iss,._
| It,, ....
| I IS,,o,_
I l II1,,_
| Islh.__
I t ! 1i,._
I l t I1,,_
lllls._
| I IIIl,_
| I | llolq...
I I ISs_.h.
f I I lll,s_...
| I I | Ill,,,,..
I I | I I1,,,,,.
I IIIII,_...
I IIIII,_..
I IIII11_..
I IIIIIem.
I fIIII_t_..
| I I llllonm_
1 I I 11ll,m,=.
. I ? I ) ]' I I ! I llI,Jt_",_
t I I % % % %\X_',,,',...._
I I _ _ __,,,,..._
I I I _,,,,,,.._
1111,, .......
11111,,..i I I IIiI1,_
lllll,,, ........
II11TT,, ...........
I Illl_,,, ....
iiiiiiiiii;;:;_iiiiiiiiiiiiiii "IIIItllSlel|J_lllllllllllllllllIIIIllOo_tl|ll|llllllllllilllllIIItlltfJ,lll|lllllllllllllllll_IIIIIIlS_0111lll|llllllllllllll!eIIIIIIllltllllll|llllllllllllllIIIIIII1#1111111111111111111111IIIIIIIIIIIIl,lllllllllllllllllIIIllllllllllollillllllllllllll
lele,lllllllllllllllllllllllllt'_tl_,ltllll!!!lllllllltlll#llllt111_111llll|ll|tltllllltlltt11!a,la,alllllll|lllllllllUl#utl_lllOnanllllltlllllllllllllln,,Inllo0allllllllllllllllllll,oo_otllttOllllllllltlllllllllluo,tltIIIOtlllllllllo_ollllllll_alllIllltllllltlll,o_lllllllllllll
Illlllllltllp,,,,_llllllllllUl11111111111,,,.o_._1t1111t11111IIiiiiillll,_o.,,._lllllllltlllIIiiiiiiit_,_oo, ._11111111111
IIItlllllinHo., _i%llllllltlllIIIIIIIIIIInoo.. Ail_llllllllllIIIIIIIIIll,_.o. A%_IIIIIIIIIIIIIIIIIIIi11_o.._ A%lllllllll|llIIIIIIIIill_o.._.ll_llllllllllllllllllil#_si,llilllllllllllIlllllloIll+**,_,llllllllllll|l
Illllloo_,loe_,ttlkltllllllllllIIIIIIIoo#_o_n_,_llllllllllllllllllllll_,#.o_lllllllllllllllIIIIIlia,l._,,,_tlllllllllllllIIIIIIIl,#oHlO_lllllllllllllll
IIIIIIIIIHH#,,_IIIIIIIIIIIIIIIIIIIIIII/IHH_IIIIIIIIIIIIIIIIIIIIIIIIIHI,,_IIIIIIIIlIIIIIlIIIIIIII|HIo,_IIIIolIIIIIIIIIIIIIItl|HI,._IIIIIIIIIIIIIlllllllll|llh._lltllllllllll
IIIIIllllllHo.. _lltllllltllll!111111i111|1,,,:_%111111111111lllllllllll|l,,,,,l|lllllllllllIIIIIIIIItllt,,,,,_llllllllllllIlllllltllIG,,,,,dlllllllllllIlllllltllll_,,o,_(tllllllllllIIIIIl|lll_l_ ..... IIIllllllllll
IIIIlllll%_._l _._11111111111!1111111_..._..._1111111|111
IIIIl|llii_...,_,..,lllllllllllIlllllltil_ ....... HIIIIIIlIII
!!!!!!!_,, ....... .-.!!!!!!!
u
|
iN
Io5
-m
L_
3]

o_._
\\,, _'-\ ._I
_ _ _ _ _ o ,o o
l_fl I
!l, iJli Ii,i I
c_-%o
CC
||||||
!ll :
i_i I
:I
U,,
_t
32
!I li-

0
8I
8O
8.? 8
o8u'3
,,--0
p/,_
00
p//_
Q(3
p/,_
o
0
OQ
p//_
33
•-- m.O
P//_
0
P/,_o
p//_
0 0Q ,,.-
P/_
o
o
O
0
0
O
II
,.
0
II
I..1.

A
I
0
II
..0
II
o_
I
I
34
i!

8m8 o_,- l
v
Q 0 0 O
p/_
+++o 'T
0 O 0 Q
p//_
o o d oP/£
Q I [ I
I
I
I
I
p/_
I
35

o
o
II
o
LL
36

8o
8 8 8 _, 8 8 88qp--
I I
M/-z
0
o
t_/z
0
cO
r-3
c_II
3?

I
M_
R
o
0
-?
38
0
o
!
I
0
M_
0
o_
I
0
I
e-
c_o.o
H
II
0
8
Q.
.o_
I !1i!

o
II
oj
L_
dII
A \
39
t_
II
II
LO
II
I
0
i
tOO
T,
0
I
I
p/_•- 0
P/_
v- 0
40
I
cO
I
I
cOI
p//_
o
M3
II
:3
8
:3O_LT_
111_

I
p/_
0T--
o
LDI
oI
I
o
I
o
'T
p/,_
o
II
9
U..
4!

0
/

I.D
II
"" I' .-'
* o'J 0
II
04
00
CXl
I
43

>
I I
I
\
-\
\
I
0
/
0
tt_
o
I
o
I
o
i
.i _ -'i _.Jc_ '1• :?, ¢_
i i" ;! ._liI'_""ill
i |\'b
m.
\
\\\\ ix\ I
; i
t , i
!i ', /\ _ 0
0
l
TI
pl_
o
II
g
8
co
L_
44

45

LO
II
II
">- _j
-7•,- Q
pl,_
*Ic'3 0I
I II
I-.,¢_
III
-I0
I
coI
0
i
II
II
|
m.
!
m.
p_
i
o+
I
p//_
0
o')
%
o+03
%
I
o
46
O'3 0
II
0
I
I
I0
03 0
II
Ckl
0
"T
¢0I
0
"y
¢*kl
aO
¢kl
, -.__c3_ .....n_..m. ,- m._ Q
C'3
o_
I
o
I
II
x
¢kl
I IF

0q
P/_
o
0
I.o
0
.?
'T
o
I
Ckl
_J
I
\\
1
47

II
,,,.,,=1
4tt
_II L

REPORT DOCUMENTATION PAGE FormApprovedOMB No. 0704-0188
Public repoaing burden for this collection of information is estimated to average 1 hour per response, including the time for reviewing instructions, searching existing data sources,gathering and maintaining the data needed, and completing and reviewing the collection of information S_d comments r,egarding this burden estimateorany otheras .p_t.of thiscollection of information, including suggestions for reducing this burden, to Washington Headquarters ServK::es, Directorate lot Inlormatton uperabo_s ano Heports, 1z1:_ aenersonDavis Highway. Suite 1204, Arlington, VA 22202-4302. and to the Office Of Management and Budget, Paperwork ReduCtion Project (0704-0188), Washington, DC 20503.
1. AGENCY IJSE ONLY (Leave blank) 2. REPORT DATE 3. REPORT TYPE AND DAYE_5 COVERED
October 1998 Final Contractor Report4. TITLE AND SUBTITLE
Direct Numerical Simulation of a Coolant Jet in a Periodic Crossflow
6. AUTHOR(S)
Chirdeep Sharma and Sumanta Acharya
7. PERFORMING ORGANIZATION NAME(S) AND ADDRESS(ES)
Louisiana State UniversityMechanical Engineering DepartmentBaton Rouge, Louisiana 70803
9. SlaONSORING/MONITORING AGENCY NAME(S) AND ADDRESS(ES)
National Aeronautics and Space AdministrationLewis Research Center
Cleveland, Ohio 44135-3191
5. FUNDING NUMBERS
WU-538-12-10--00
NAG3-1641
8. PERFORMING ORGANIZATION
REPORT NUMBER
E- 11402
10. SPONSORING/MONITORING
AGENCY REPORT NUMBER
NASA CR--1998-208674
11. SUPPLEMENTARY NOTES
Prepared for the 1998 International Mechanical Engineering Congress and Exposition sponsored by the American Societyof Mechanical Engineers, Anaheim, California, November 15-20, 1998. Project Manager, Chi Wang, Turbomachinery andPropulsion Systems Division, NASA Lewis Research Center, organization code 5820, (216) 433-5865.
12a. DISTRIBUTION/AVAILABiLITY STATEMENT ;12b. DISTRIBUTION CODE
Unclassified -Unlimited
Subject Categories: 02 and 34 Distribution: Nonstandard
This publication is available from the NASA Center for AeroSpace Information, (301) 621-0390.
13. ABSTRACT (Maximum 200 words)
A Direct Numerical Simulation of a coolant jet injected normally into a periodic crossflow is presented. The physical
situation simulated represents a periodic module in a coolant hole array with a heated crossflow. A collocated finitedifference scheme is used which is fifth-order accurate spatially and second-order accurate temporally. The scheme isbased on a fractional step approach and requires the solution of a pressure-Poisson equation. The simulations are obtained
for a blowing ratio of 0.25 and a channel Reynolds number of 5600. The simulations reveal the dynamics of several largescale structures including the Counter-rotating Vortex Pair (CVP), the horse-shoe vortex, the shear layer vortex, the wallvortex and the wake vortex. The origins and the interactions of these vortical structures are identified and explored. Also
presented are the turbulence statistics and how they relate to the flow structures.
14. SUBJECT TERMS
Gas turbine; Turbulence; Computational fluid dynamics
17. SECURITY CLASSIFICATION 18. SECURITY CLASSIF:iCATIONOFREPORT OFTHISPAGE
Unclassified Unclassified
NSN 7540-01-280-5500
19. SECURITY CLASSIFICATIO_I
OF ABSTRACT
Unclassified
15. NUMBER OF PAGES
5416. PRICE CODE
A0420. LIMITATION OF ABSTRACT
Standard Form 298 (Rev. 2-89)Prescribed by ANSI Std. Z39-18298-102
1 !]


![Affordable ultra-high rotation speed up to 75,000 RPM! · CM-CV-R016-040-4-A (TBV1304) Rotation speed & Coolant flow/Coolant pressure Coolant pressure [bar] Rotation speed Coolant](https://img.pdfslide.us/doc/110x75/5f7d724b4720fb47ad029f32/affordable-ultra-high-rotation-speed-up-to-75000-rpm-cm-cv-r016-040-4-a-tbv1304.jpg)