Embed Size (px)
Citation preview

Direct multiple-point geostatistical simulation of edge properties
for modeling thin irregularly-shaped surfaces
Abstract
Thin irregularly-shaped surfaces such as clay drapes often have a major control on flow and
transport in heterogeneous porous media. Clay drapes are often complex curvilinear 3-
dimensional surfaces and display a very complex spatial distribution. Variogram-based
stochastic approaches are often also not able to describe the spatial distribution of clay drapes
since complex, curvilinear, continuous and interconnected structures cannot be characterized
using only two-point statistics. Multiple-point geostatistics aims to overcome the limitations
of the variogram. The premise of multiple-point geostatistics is to move beyond two-point
correlations between variables and to obtain (cross) correlation moments at three or more
locations at a time using "training images" to characterize the patterns of geological
heterogeneity. Multiple-point geostatistics can reproduce thin irregularly-shaped surfaces such
as clay drapes but is often computationally very intensive. This paper describes and applies a
methodology to simulate thin irregularly-shaped surfaces with a smaller CPU and RAM
demand than the conventional multiple-point statistical methods. The proposed method uses
edge properties for indicating the presence of thin irregularly-shaped surfaces. This method
allows directly simulating edge properties instead of pixel properties to make it possible to
perform multiple-point geostatistical simulations with a larger cell size and thus a smaller
computation time and memory demand.

1. Introduction
Thin irregularly-shaped surfaces, such as clay drapes, can greatly influence subsurface fluid
flow and solute transport in heterogeneous porous media. Clay drapes may act as low-
permeability barriers that compartmentalize fluid flow (Stright et al. 2006; Li 2008;
Huysmans and Dassargues 2009). A realistic representation of the spatial distribution of clay
drapes is therefore essential for reliable flow and transport predictions. Modelling these clay
drapes is challenging because they are curvilinear 3-dimensional surfaces whose spatial
distribution is very complex, as a result of geological processes that formed them. Their
thicknesses may not exceed a few centimetres (Stright et al 2006), which is orders of
magnitude smaller than the size of grid cells or elements commonly used in groundwater flow
models. For common upscaling approaches (Renard and de Marsily 1997; Farmer 2002), the
physical properties of thin clay drapes are assigned to the entire grid cell that contains them,
which destroys their continuity as surfaces and their role as flow barriers.
Because of the complex spatial distribution of these thin irregularly-shaped surfaces and the
lack of knowledge of their physical properties, deterministic models often fail to capture both
their spatial distribution and the uncertainty associated with the distribution. Variogram-based
stochastic approaches are not suited for complex, curvilinear, continuous and interconnected
structures because they are based on two-point statistics (Koltermann and Gorelick 1996;
Fogg et al 1998; Journel and Zhang 2006) and Huysmans and Dassargues (2009) clearly
demonstrate that variogram-based methods are not suited to describe complex clay drapes.
Multiple-point geostatistics aims to overcome limitations of variogram-based approaches by
moving beyond two-point correlations between variables and simultaneously computing
(cross) correlation moments between variables at three or more locations (Guardiano and

Srivastava 1993; Strebelle and Journel 2001; Strebelle 2000; Strebelle 2002; Caers and
Zhang, 2004; Hu and Chugunova 2008).
Because of the limited direct well information from the subsurface, such statistical
information cannot directly be obtained from samples. Instead, "training images" are used to
characterize the patterns of geological heterogeneity. A training image is a conceptual explicit
representation of the expected spatial distribution of hydraulic properties or facies types. The
main idea is to borrow geological patterns from these training images and anchor them to the
subsurface data domain. Several multiple-point simulation algorithms have been developed,
such as snesim (Strebelle 2002), filtersim (Zhang et al 2006; Wu et al 2008), simpat (Arpat
and Caers 2007) and hosim (Mustapha and Dimitrakopoulos 2010).
Multiple-point geostatistics is able to reproduce thin irregularly-shaped surfaces such as clay
drapes. It is, however, computationally intensive because the training image requires that a
small grid cell size be used to capture the thin surfaces. This results in large training images
and a large search template size and thus large CPU times and memory requirements
(Huysmans and Dassargues, 2009). Particularly in three dimensions, building field-scale
simulations is computationally very intensive and improvements are needed (Hu and
Chugunova 2008).
The objective of this paper is to develop a methodology to simulate thin irregularly-shaped
surfaces that reduces CPU times and memory requirements compared to conventional
multiple-point statistical methods. The methodology is based on the idea proposed by Stright
et al (2006) of using edge properties for upscaled flow simulations without losing information
about thin irregularly-shaped flow barriers. The edge of a model cell is a continuous or
categorical value associated with the cell face. This idea was extended to not only use edge
properties in the flow simulation step but also in the multiple-point geostatistical facies
simulation step. This work explores the idea of directly simulating edge properties instead of
pixel properties, which allows using a larger cell size for multiple-point geostatistical
simulations and thus reduces computational time and memory requirement. The theory and
implementation of multiple point geostatistics is first reviewed. The new methodology for
directly simulating edge properties is then explained and it is then demonstrated by applying it
to two realistic examples. The first example is for pollutant transport in a channelized aquifer
and the second example considers the simulation of clay drapes in a real case study of a cross-
bedded aquifer in Belgium.
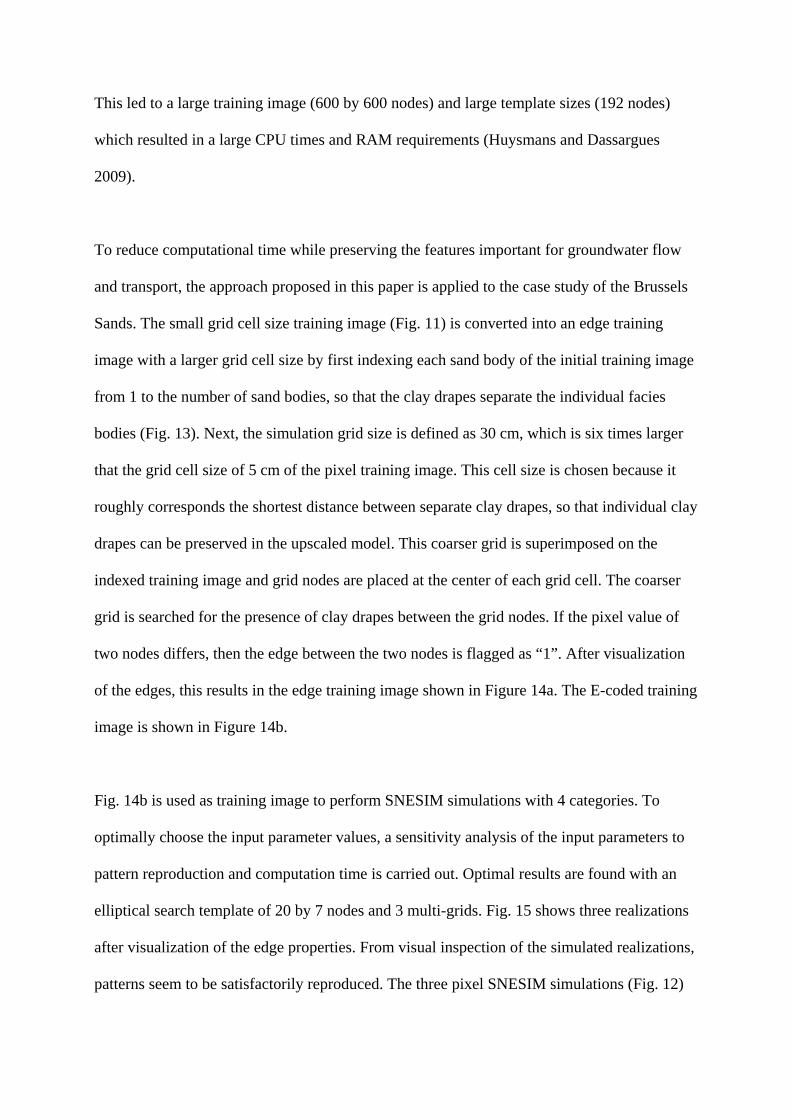
2. Multiple point geostatistics
This section first briefly reviews the mathematical basis behind multiple-point geostatistics
and the single normal equation simulation (SNESIM) algorithm (Strebelle 2002). Consider an
attribute S that can have N possible states {sj, j=1… J}. Attribute S can be a categorical
property, such as a facies, or a continuous value such as porosity or permeability, with its
interval of variability divided into J classes. A data event dn of size n centered at location u is
constituted by (1) the data geometry defined by the n vectors {hα, α=1… n} and (2) the n data
values {s(u+hα), α=1… n}. A data template τn comprises only the data geometry. The
categorical transform of variable S at location u is defined as:
( ) ( )( )
0 if ;
1 if j
j
S sI j
S s⎧ =⎪= ⎨ ≠⎪⎩
uu
u

The multiple-point statistics are probabilities of occurrence of the data events dn={S(uα)=sj,α,
α=1… n}, which is equivalent to the probabilities that the n values s(u1) … s(uj) are jointly in
the respective states sj,1 … sj,n. For any data event dn, that probability is also the expected
value of the product of the n corresponding indicator data:
{ } ( ){ } ( ),1
Prob Prob ; 1... E ,n
n jd S s n I jα α α αα
α=
⎡ ⎤= = = = ⎢ ⎥⎣ ⎦Πu u
Such multiple-point statistics or probabilities cannot be inferred from sparse field data
because they require a densely and regularly sampled training image depicting the expected
patterns of geological heterogeneities. Training images merely reflect a prior geological
concept and do not need to carry any locally accurate information. Training images can be
obtained from observations of outcrops, geological reconstructions and geophysical data that
are processed with Boolean simulation techniques if needed (Strebelle and Journel 2001;
Maharaja 2008).
The single normal equation simulation (SNESIM) algorithm (Strebelle 2002) allows
borrowing multiple-point statistics from the training image to simulate multiple realizations of
facies occurrence. SNESIM is a pixel-based sequential simulation algorithm that obtains
multiple-point statistics from the training image, exports it to the geostatistical numerical
model and anchors it to the actual subsurface hard and soft data. For each location along a
random path, the data event dn consisting of the set of local data values and their spatial
configuration is recorded. The training image is scanned for replicates that match this event to
determine the local conditional probability that the unknown attribute S(u) takes any of the J
possible states given the data event dn, as
( ){ } ( ) ( ){ }( ){ }
,
,
Prob and ; 1...Prob
Prob ; 1...j j
j nj
S s S s nS s d
S s nα α
ε α
α
α
= = == =
= =
u uu
u

The denominator can be inferred by counting the number of replicates of the conditioning
data event found in the training image. The numerator can be obtained by counting the
number of those replicates associated to a central value S(u) equal to sk. A maximum data
search template is defined to limit the geometric extent of those data events. SNESIM requires
reasonable CPU demands by scanning the training image prior to simulation and storing the
conditional probabilities in a dynamic data structure, called the search tree. The theory and
algorithm behind SNESIM are described by Strebelle (2002). Descriptions of standard
SNESIM parameters are given by Liu (2006).
3. Direct multiple-point geostatistical simulation of edge properties
The proposed method is based on the idea proposed by Stright et al (2006) of using edge
properties for simulating fluid flow in porous media containing fine-scale thin flow barriers
that cannot be accurately represented in current pixel-based flow models. To preserve these
fine-scale features at the block scale, Stright et al (2006) introduced the edge of a model cell
as an additional modelling variable. The edge of a cell is a continuous or categorical value
associated with the cell face and is defined in conjunction with the cell centered property
which is often reserved for facies type and/or flow properties. The cell edge and cell-centered
property jointly define an edge model to capture the behaviour of the barriers for flow
simulations through a simple translation into transmissibility multipliers. The option to assign
tansmissibilities already exists in commercial flow simulators. The edge properties can in this
way be inserted in finite element of finite difference flow simulators by building a mesh along
the constructed edges. The edges are not necessarily perpendicular surfaces, but can also be

incorporated in irregular grids. Edge properties can be used in a large variety of simulation
and modelling methods.
In this paper, this idea is extended to not only use edge properties for the flow simulation step
but also for the multiple-point geostatistical facies simulation step. This section explains the
method of directly simulating edge properties instead of pixel properties in the SNESIM
algorithm, which allows performing SNESIM simulations with a larger cell size and thus
requires smaller computation time and memory. The method is illustrated in this section with
a small and simple training image showing a few clay drapes. In the following section, the
method is applied to two more realistic examples: (1) pollutant transport in a channelized
aquifer and (2) a real case study of a cross-bedded aquifer in Belgium.
The method starts from a training image depicting the thin irregularly-shaped surfaces of
interest. The grid scale of this training image should be fine enough such that the thin surfaces
can be represented by pixels. This training image can be obtained from observations of
outcrops, geological reconstructions and geophysical data, if necessary processed with
Boolean simulation techniques (Strebelle and Journel 2001; Maharaja 2008). The training
image should be representative of the geological heterogeneity and must be large enough such
that the essential features can be characterized by statistics defined on a limited point
configuration (Hu and Chugunova 2008). Moreover, training images are bound by the
principles of stationarity and ergodicity (Caers and Zhang 2004). To illustrate the method, a
simple training image of sand bodies separated by a few horizontal and inclined clay drapes is
shown in Fig 1a.

After the training image has been created, each large scale facies body in the image is indexed
individually, from 1 to the number of facies bodies, such that the thin irregularly-shaped
surfaces of interest separate the individual facies bodies. In our example, each sand body is
assigned a number from one to eight (Fig 1b).
After image training, a model grid size for simulation is chosen. This grid should be chosen
such that flow simulations preserve the flow behaviour and connectivity of the relevant
structures of the fine scale training image, without requiring exceedingly long computational
time. This model grid, which is coarser than the resolution of the training image, is
superimposed over the training image and grid nodes are placed at the center of each grid cell
(Fig 1b).
In the next step of the method, the grid is searched in the x, y and z-direction for the presence
of clay drapes between grid nodes of the coarser grid (Stright et al 2006). If the index values
of the two nodes differ, the edge between the two nodes is flagged as “1”, indicating that a
clay drape is present. Otherwise the edge between the two nodes is flagged as “0”, indicating
that no clay drape is present (Fig 1c). After this process, the edge properties can be
represented by two matrices (or three 3D matrices in 3D) with the same size as the coarse
grid: matrix B displaying the edge properties at the bottom of a grid cell (Fig 1d) and matrix R
displaying the edge properties at the right side of a grid cell (Fig 1e). The edge properties at
the top and left side of a cell are not stored since they can be obtained from the edge
properties at the bottom and right side of neighbouring cells.
In the last step of the method, matrices B and R are combined into one matrix E by applying
the coding shown in Table 1 describing the four different possibilities for each cell. This

allows obtaining a single training image displaying all edge properties. If, for example, a cell
displays no flow barrier, this cell is coded “0”. If, for example, a cell displays a flow barrier at
the right and not at the bottom, this cell is coded “1”. The E-coded training image of our
simple example is shown in Figure 1f.
The E-coded training image can be used as input training image to perform SNESIM
simulations with 4 categories, which represent the four possible outcomes for E. This E-coded
training image (Fig 1f) is much coarser than the original training image depicting thin
irregularly-shaped surfaces of interest using pixels (Fig 1a), while still preserving all relevant
information about the presence of the clay drapes. If facies other than the thin clay barriers are
present, a combined upscaled edge and facies training image can be built where the number of
categories is 4 times the number of facies besides the clay drapes.
4. Applications
In this section, the method of direct multiple-point simulation of edge properties is applied to
two realistic examples to illustrate its use and advantages. First, the method is applied for a
flow and transport simulation in a synthetic channelized aquifer. The simulated solute plume
obtained after upscaling using direct multiple-point simulation of edge properties is compared
to the plume simulated with a full fine-scale approach and from a standard upscaling
approach. This comparison allows validating the approach for flow and transport problems. In
a second example, the method is applied to the real case study of the cross-bedded Brussels
Sands aquifer in Belgium. This example illustrates the reduction in computation time for a
problem with a real training image with realistic dimensions and patterns.

4.1 Pollutant transport in a channelized aquifer
To validate the proposed approach for a groundwater flow and transport simulation, an
example of pollutant transport in a synthetic channelized aquifer is considered and results are
compared to a full fine-scale approach and two standard upscaling approaches. It is assumed
that the base of each channel is a clay or shale drape flow barrier that may potentially
compartimentalize flow in the aquifer. Figure 2 shows a 2D horizontal training image for this
geological setting. It consists of 250 x 250 cells of size 0.2 m x 0.2 m. This training image
was obtained after processing a training image from Caers and Zhang (2004). This fine-scale
training image was used as input to SNESIM for simulating pixel-based realizations of the
clay and sand facies. Computational time and pattern reproduction quality of SNESIM
realizations are strongly dependent on the input parameters selection (Liu 2006). A sensitivity
analysis of the input parameters was carried out. The simulation grid consists of 100 x 100
cells of 0.2 m x 0.2 m. Optimal pattern reproduction for this case was found for simulations
using a circular template of 11 by 11 nodes, 6 multi-grids, a re-simulation threshold of 15 and
2 re-simulation iterations. Figure 3 shows the 2D SNESIM realization that is used as input to
the groundwater flow and transport model to calculate plume shapes and extents in a fine-
scale model.
The groundwater flow and transport model (Figure 4) is 20 m by 20 m 2D horizontal model,
discretised into grid cells of 0.2 m by 0.2 m in the fine-scale model. Constant heads are
applied to the east and west boundaries so that the hydraulic head gradient is 1 m/20 m. The
north and south boundaries are impermeable. Hydraulic conductivities of the sand facies and
the clay facies are 10-4 m/s and 10-6 m/s, respectively. The effective porosity of sand and clay
facies is 10%. Three sources of an inert contamination are located at 5 m from the west

boundary with an arbitrarly chosen source concentration of 1000 mg/l. A low longitudinal
dispersivity value of 0.02 m was chosen, based on the small grid cell dimension. Transverse
dispersivity was assumed to be one order of magnitude smaller than longitudinal dispersivity
(Zheng and Bennett 1995). The differential equations describing groundwater flow are solved
by PMWIN (Chiang and Kinzelbach 2001), which is a pre- and post-processor for the
MODFLOW model (McDonald and Harbaugh 1988), a block-centered finite-difference
method based software package. Transport by advection and dispersion is simulated with
MT3DMS (Zheng and Wang 1999).
Figure 4 shows the contaminant plumes calculated with the fine-scale model after 10 days.
Contaminant plume shapes and extent are largely influenced by the clay drapes present in the
model. The clay drapes clearly act as barriers for flow and contaminant transport. These
calculated contaminant plumes of the fine-scale model are compared to the calculated plumes
of three upscaled models: an upscaled model using direction simulation of edge properties and
two upscaled models using standard cell-based upscaling methods.
In the direct edge simulation approach, the small grid cell size training image (Fig. 2) is
converted into an edge training image with a larger grid cell size by first indexing each sand
body of the initial training image from 1 to the number of sand bodies, so that the clay drapes
separate the individual facies bodies (Fig. 5). Next, the simulation grid size is defined as 1 m,
which is five times larger that the grid cell size of 20 cm of the pixel training image. This
upscaled cell size is chosen because it roughly corresponds to half of the shortest distance
between separate clay drapes, which preserves individual clay drapes in the upscaled model.
This coarser grid is superimposed on the indexed training image and grid nodes are placed at
the center of each grid cell. The coarser grid is searched for the presence of clay drapes

between the grid nodes. If the pixel value of two nodes differs, the edge between the two
nodes is flagged as “1”. After visualization of the edges, this results in the edge training image
shown in Figure 6. This edge training image is as training image to perform SNESIM
simulations with 4 categories. Figure 7 shows the SNESIM edge realization that is used as
input to the upscaled groundwater flow and transport model, which has a grid cell size of 20
cm. The edges are inserted in the model using the “horizontal flow barrier package” of
PMWIN, where the barrier thickness and barrier hydraulic conductivity are equal to 20 cm
and 10-6 m/s, respectively. All cells in the model have a uniform hydraulic conductivity of 10-
4 m/s. All other properties and input parameters of the model are identical to those of the fine-
scale flow and transport model.
In the standard upscaling approaches, a SNESIM realization calculated with the same
parameters as the reference realization is upscaled by (1) calculating the geometric mean
hydraulic conductivity of every cell and (2) the effective hydraulic conductivities in the x- and
y- direction for flow calculated by FLOWSIM (Deutsch 1987). Figure 8 shows the SNESIM
realization and the upscaled hydraulic conductivity fields that are inserted in an upscaled flow
and transport model. The second upscaled model was run with the Visual Modflow pre- and
post-processor from Schlumberger Water Services instead of PMWIN (Chiang and
Kinzelbach 2001), because Visual Modflow allows defining separate anisotropic hydraulic
conductivities in the x- and y-direction cell-per-cell.
Figure 9 and 10 show the resulting contaminant plumes simulated with the three upscaled
models. Figure 9 shows the results for an upscaled model using direction simulation of edge
properties. Figure 10 shows the results for the upscaled models using standard upscaling
methods. These results should be compared to figure 4. Figure 9 shows that the contaminant

plumes calculated with the edge approach display characteristics similar to those of the
plumes calculated with the full fine-scale model. Contaminant plume shapes and extent are
largely influenced by the clay drapes present in the model. Figure 10 shows that in the other
upscaled models that assign the clay drapes to the entire grid cell, the clay drapes do not act as
flow barrier. As a result, the contaminant plumes in these models are barely influenced by the
clay drapes. This shows that this the direct edge simulation method allows much better
preservation of all relevant information about the presence of thin irregularly-shaped surfaces
compared to cell-based upscaling methods.
4.2 Application on the cross-bedded Brussels Sands aquifer (Belgium)
To illustrate savings in computational time for a simulation based on a real training image
with realistic dimensions and patterns, the proposed method is applied to the cross-bedded
Brussels Sands aquifer in Belgium. The Brussels Sands formation is an early Middle-Eocene
shallow marine sand aquifer in Central Belgium. The aquifer displays complex geological
heterogeneity and anisotropy that complicates pumping test interpretation, groundwater
modelling and prediction of pollutant transport (Huysmans et al 2008). In order to investigate
the effect of small-scale sedimentary heterogeneity on groundwater flow and transport in this
aquifer, a training image was constructed based on photographs, field sketches and
measurements of the small scale sedimentary structures (Fig. 11). At this scale, the features
most important for groundwater flow and transport are relatively thin clay-rich horizontal and
inclined clay drapes that may act as flow barriers. These structures were simulated using
SNESIM from SGems (Remy 2004). The 2D SNESIM simulations (Fig. 12) had large CPU
times and RAM requirements because of the small grid cell size of 5 cm, which is needed to
capture the thin clay drapes, compared to the larger scale of groundwater flow and transport.
This led to a large training image (600 by 600 nodes) and large template sizes (192 nodes)
which resulted in a large CPU times and RAM requirements (Huysmans and Dassargues
2009).
To reduce computational time while preserving the features important for groundwater flow
and transport, the approach proposed in this paper is applied to the case study of the Brussels
Sands. The small grid cell size training image (Fig. 11) is converted into an edge training
image with a larger grid cell size by first indexing each sand body of the initial training image
from 1 to the number of sand bodies, so that the clay drapes separate the individual facies
bodies (Fig. 13). Next, the simulation grid size is defined as 30 cm, which is six times larger
that the grid cell size of 5 cm of the pixel training image. This cell size is chosen because it
roughly corresponds the shortest distance between separate clay drapes, so that individual clay
drapes can be preserved in the upscaled model. This coarser grid is superimposed on the
indexed training image and grid nodes are placed at the center of each grid cell. The coarser
grid is searched for the presence of clay drapes between the grid nodes. If the pixel value of
two nodes differs, then the edge between the two nodes is flagged as “1”. After visualization
of the edges, this results in the edge training image shown in Figure 14a. The E-coded training
image is shown in Figure 14b.
Fig. 14b is used as training image to perform SNESIM simulations with 4 categories. To
optimally choose the input parameter values, a sensitivity analysis of the input parameters to
pattern reproduction and computation time is carried out. Optimal results are found with an
elliptical search template of 20 by 7 nodes and 3 multi-grids. Fig. 15 shows three realizations
after visualization of the edge properties. From visual inspection of the simulated realizations,
patterns seem to be satisfactorily reproduced. The three pixel SNESIM simulations (Fig. 12)

contain 5 to 8 continuous horizontal clay drapes, 6 to 10 discontinuous horizontal clay drapes
and 19 to 26 inclined clay drapes. The three edge SNESIM simulations (Fig. 15) contain 6 to
11 continuous horizontal clay drapes, 8 to 10 discontinuous horizontal clay drapes and 19 to
26 inclined clay drapes. Both techniques simulate equal numbers of horizontal and inclined
clay drapes, while the direct simulation of edge properties is significantly faster.
Computational time for three direct edge realizations is smaller than 10 s while it is about 600
s. for the three realizations shown in Fig.. The direct SNESIM simulation of edge properties is
therefore 60 times faster than ordinary SNESIM simulation of facies, which represents
significant savings in CPU time.
Discussion and conclusion
This paper describes and applies a method for direct multiple-point geostatistical simulation
of edge properties for modeling thin irregularly-shaped surfaces such as clay drapes. Instead
of pixel values, edge properties indicating the presence of irregularly-shaped surfaces are
simulated using SNESIM. This allows very significant computation time reductions while
preserving all relevant information about the presence of thin irregularly-shaped surfaces,
much better than conventional cell-based upscaling methods. The simulated edge model can
be used as input to flow simulations through a simple translation into transmissibility
multipliers. The option to set transmissibilities already exists in commercial flow simulators.
The edge properties can in this way be inserted in finite element of finite difference flow
simulators by building a mesh along the constructed edges. The edges are not necessarily
perpendicular surfaces, but can also be incorporated in irregular grids.

This method is particularly valuable for three-dimensional applications of multiple-point
geostatistics, which remain one of the most important challenges for multiple-point
geostatistics (Huysmans and Dassargues 2009). Building reservoir or aquifer-scale
simulations in three dimensions with multiple facies is still computationally intensive and
requires further improvement (Hu and Chugunova 2008). This method allows building
reservoir or aquifer models with significantly reduced computational time for the case where
thin irregularly-shaped surfaces are an important feature for flow and transport.
Acknowledgements
The authors wish to acknowledge the Fund for Scientific Research – Flanders for providing a
Postdoctoral Fellowship to the first author.
References
Arpat B, Caers J (2007) Stochastic simulation with patterns. Math Geosci 39:177–203
Caers J, Zhang T (2004) Multiple-point geostatistics: a quantitative vehicle for integrating
geologic analogs into multiple reservoir models. In: Integration of outcrop and modern analog
data in reservoir models, AAPG memoir 80: 383-394
Chiang W, Kinzelbach W (2001) 3D-Groundwater Modeling with PMWIN. Springer-Verlag Berlin
Heidelberg New York, ISBN 3-540-67744-5
Deutsch CV (1987) FLOWSIM.
Farmer CL (2002) Upscaling: a review. Int J Num Meth Fluids 40(1-2), 63-78
Fogg GE, Noyes CD, Carle SF (1998) Geologically based model of heterogeneous hydraulic
conductivity in an alluvial setting. Hydrogeol J 6(1): 131-143
Guardiano F, Srivastava M (1993) Multivariate geostatistics: Beyond bivariate moments. In
Geostatistics-Troia, ed. A. Soares, 133-144. Dordrecht, The Netherlands: Kluwer Academic
Hu LY, Chugunova T (2008) Multiple-point geostatistics for modeling subsurface
heterogeneity: A comprehensive review. Water Resour Res 44, W11413,
doi:10.1029/2008WR006993
Huysmans M and Dassargues A, 2009, Application of multiple-point geostatistics on
modeling groundwater flow and transport in a cross-bedded aquifer, Hydrogeol J 17(8), 1901-
1911
Huysmans M, Peeters L, Moermans G and Dassargues A (2008), Relating small-scale
sedimentary structures and permeability in a cross-bedded aquifer. J Hydrol 361, 41-51
Journel A, Zhang T (2006) The Necessity of a Multiple-Point Prior Model. Math Geol 38(5):
591-610

Koltermann CE, Gorelick S (1996) Heterogeneity in sedimentary deposits: a review of
structure imitating, process-imitation, and descriptive approaches. Water Resour Res 32 (9):
2617–2658
Li H., 2008, Hierarchic modeling and history matching of multi-scale flow barriers in
channalized reservoirs, Stanford PhD thesis
Liu Y (2006) Using the Snesim program for multiple-point statistical simulation. Comput
Geosci 32(10): 1544-1563
McDonald MG, Harbaugh AW (1988) A modular three-dimensional finite-difference ground-
water flow model. Technical report USGS, Reston, VA
Maharaja A (2008) TiGenerator: Object-based training image generator. Comput Geosci 34
(12): 1753-1761
Mustapha H, Dimitrakopoulos R (2010) High-order Stochastic Simulation of Complex
Spatially Distributed Natural Phenomena. Math Geosci 42: 457–485
Remy N (2004) Geostatistical Earth Modeling Software: User’s Manual. Stanford University
Strebelle S (2000) Sequential simulation drawing structures from training images. Doctoral
dissertation, Stanford University, USA
Renard Ph, de Marsily G (1997) Calculating equivalent permeability: a review. Adv Water
Resour 20 (5-6): 253-278

Strebelle S, Journel A (2001) Reservoir Modeling Using Multiple-Point Statistics: SPE 71324
presented at the 2001 SPE Annual Technical Conference and Exhibition, New Orleans,
September 30-October 3
Strebelle S (2002) Conditional simulation of complex geological structures using multiple-
point statistics. Math Geol 34: 1–22
Stright L , Caers J and Li H (2006) Coupled geological modeling and history
matching of fine-scale curvilinear flow barriers, 19th SCRF annual meeting, Stanford
Center for Reservoir Forecasting, Stanford, May, 2006.
Wu J, Boucher A, Zhang T (2008) SGeMS code for pattern simulation of continuous and
categorical variables: FILTERSIM. Comput Geosci 34:1863–1876
Zhang T, Switzer P, Journel AG (2006) Filter-based classification of training image patterns
for spatial simulation. Math Geol 38:63–80
Zheng C, Bennett GD (1995) Applied Contaminant Transport Modeling, Theory and Practice.
John Wiley & Sons, New York.
Zheng C, Wang PP (1999) MT3DMS, a modular three-dimensional multi-species transport
model for simulation of advection, dispersion and chemical reactions of contaminants in
groundwater systems. Documentation and user’s guide. US Army Engineer Research and
Development Center Contract Report SERDP-99-1, Vicksburg, MS


Tables Table 1 Definition of E-coding
B R E 0 0 0 0 1 1 1 0 2 1 1 3
Figure captions
Figure 1 Methodology for translating the initial training image to an coarser E-coded training
image: (a) initial training image; (b) indexed training image and coarser grid; (c) visualization
of edges; (d) B-matrix; (e) R-matrix; (f) E-matrix
Figure 2 Horizontal 2D training image of 50 m x 50 m (white = sand facies, black = clay
facies)
Figure 3 Reference SNESIM facies realization (white = sand facies, black = clay facies)
Figure 4 Calculated contaminant concentrations for t = 10 days for the realization of Figure 3.
Figure 5 Indexed training image of the channelized aquifer
Figure 6 (left) E-coded edge training image (blue = 0, cyan = 1, yellow = 2, red = 3)
and (right) edge training image
Figure 7 (left) SNESIM edge property realization after visualization of the edge properties
and (right) E-coded SNESIM edge property realization

Figure 8 (left) Upscaled hydraulic conductivity values by geometric mean approach, (middle)
effective horizontal conductivity in x-direction using FLOWSIM (Deutsch, 1987) and (right)
effective horizontal conductivity in y-direction using FLOWSIM (Deutsch, 1987)
Figure 9 Calculated contaminant concentrations for t = 10 days for the direct edge property
realization of Figure 7.
Figure 10 Calculated contaminant concentrations for t = 10 days for the upscaled realizations
of Figure 8.
Figure 11 Vertical 2D training image of 30 m x 30 m in N40°E direction (white = sand
facies, black = clay-rich facies) (adapted from Huysmans and Dassargues, 2009)
Figure 12 Example SNESIM facies realizations (white = sand facies, black = clay-rich facies)
(adapted from Huysmans and Dassargues, 2009)
Figure 13 Indexed training image
Figure 14 (a) Edge training image and (b) E-coded edge training image (blue = 0, cyan = 1,
yellow = 2, red = 3)
Figure 15 (up) Example SNESIM edge property realizations after visualization of the edge
properties and (below) E-coded SNESIM edge property realizations (blue = 0, cyan = 1,
yellow = 2, red = 3)