Embed Size (px)
Citation preview

8
9
9
10
10
1
1
1
1
1
26 July 2013
Direct Investment Positions for 2012 Country and Industry Detail By Kevin B. Barefoot and Marilyn Ibarra-Caton
BOTH OUTBOUND and inbound U.S. foreign direct investment continued to grow in 2012. The
U.S. direct investment position abroad valued at historical cost grew 9 percent to $4,453.3 billion after average annual growth of 11 percent in 2001–2011 (table A and chart 1). The foreign direct investment position in the United States valued at historical cost grew 6 percent, to $2,650.8 billion, the same as its average annual rate of growth in 2001–2011.
This article presents details on the U.S. direct investment positions valued at historical cost by country and industry. These statistics measure U.S. direct investors’
Table A. Direct Investment Positions on a Historical-Cost Basis, 1982–2012
Yearend
Billions of dollars Percent change from preceding year
Outward position 1
Inward position 2
Outward position 1
Inward position 2
1982 .................................................................. 207.8 124.7 ................... ................... 1983 .................................................................. 212.2 137.1 2.1 9.9 1984 .................................................................. 218.1 164.6 2.8 20.1 1985 .................................................................. 238.4 184.6 9.3 12.2 1986 .................................................................. 270.5 220.4 13.5 19.4 1987 .................................................................. 326.3 263.4 20.6 19.5 1988 .................................................................. 347.2 314.8 6.4 19.5 1989 .................................................................. 381.8 368.9 10.0 17.2 1990 .................................................................. 430.5 394.9 12.8 7.0 1991 .................................................................. 467.8 419.1 8.7 6.1 1992 .................................................................. 502.1 423.1 7.3 1.0 1993 .................................................................. 564.3 467.4 12.4 10.5 1994 .................................................................. 612.9 480.7 (3) (3) 1995 .................................................................. 699.0 535.6 14.1 11.4 1996 .................................................................. 795.2 598.0 13.8 11.7 1997 .................................................................. 871.3 681.8 9.6 14.0 1998 .................................................................. 1,000.7 778.4 14.8 14.2 1999 .................................................................. 1,216.0 955.7 21.5 22.8 2000 .................................................................. 1,316.2 1,256.9 8.2 31.5 2001 .................................................................. 1,460.4 1,344.0 10.9 6.9 2002 .................................................................. 1,616.5 1,327.2 10.7 –1.3 2003 .................................................................. 1,769.6 1,395.2 9.5 5.1 2004 .................................................................. 2,160.8 1,520.3 22.1 9.0 2005 .................................................................. 2,241.7 1,634.1 3.7 7.5 2006 .................................................................. 2,477.3 1,840.5 10.5 12.6 2007 .................................................................. 2,994.0 1,993.2 (4) (4) 2008 .................................................................. 3,232.5 2,046.7 8.0 2.7 2009 .................................................................. 3,565.0 r 2,069.4 10.3 1.1 2010 .................................................................. 3,741.9 r 2,280.0 r 5.0 10.2 2011 .................................................................. 4,084.7 r 2,502.6 r 9.2 9.8 2012 .................................................................. 4,453.3 p 2,650.8 p 9.0 5.9
p Preliminary. The historical-cost positions by country and industry that are presented in this article are preliminary; however, earlier estimates of the aggregate positions for 2012 were published in the April SUR VEY OF
CURRENT BUSINESS. r Revised 1. U.S. direct investment position abroad. 2. Foreign direct investment position in the United States. 3. The direct investment positions reflect a discontinuity between 1993 and 1994 because of the reclassifica
tion of intercompany debt between parent companies and affiliates that are nondepository financial intermediaries from direct investment to other investment accounts.
4. The direct investment positions reflect a discontinuity between 2006 and 2007 because of the reclassification of permanent debt between affiliated depository institutions from direct investment to other investment accounts.
equity in, and net outstanding loans to, their foreign affiliates—the U.S. direct investment position abroad—and foreign direct investors’ equity in, and net outstanding loans to, their U.S. affiliates—the foreign direct investment position in the United States. The positions are presented on a historical-cost basis because that is the only basis for which detailed statistics by country and industry are available, unlike the international investment position accounts that are presented on a current-cost and market-value bases. (See the box “Alternative Measures of the Direct Investment Positions.”) On a historical-cost basis, positions generally reflect prices at the time of the investment rather than the prices of the current period. This valuation is derived principally from the accounting records of affiliates, which are maintained according to U.S. Generally Accepted Accounting Principles (U.S. GAAP).1
The year-to-year changes in the positions are composed of the financial flows—equity and debt investment—and valuation adjustments. The measure of
1. For a discussion of the U.S. GAAP, see the box “Accounting Standards and the Direct Investment Positions” in Kevin B. Barefoot and Marilyn Ibarra-Caton, “Direct Investment Positions for 2010: Country and Industry Detail,” SURVEY OF CURRENT BUSINESS 91 (July 2011): 127.
Chart 1. Direct Investment Positions at Historical Cost, 1982–2012
Billions of dollars
Outward direct investment position
Inward direct investment position
4,500
4,000
3,500
3,000
2,500
2,000
1,500
1,000
500
0 1982 84 86 88 90 92 94 96 98 2000 02 04 06 08 10 12
NOTE . There are discontinuities between 1993 and 1994 and between 2006 and 2007. See footnotes 3 and 4 in table A.
U.S. Bureau of Economic Analysis
27 July 2013 SURVEY OF CURRENT BUSINESS
direct investment financial flows presented in this article differs from the measure of direct investment financial flows used in the international transactions accounts because the reinvested earnings component of financial flows included here excludes a current-cost adjustment. “Financial flows” is used throughout the article for “financial flows without current-cost adjustment” and “reinvested earnings” for “reinvested earnings without current-cost adjustment.” In addition, “outward direct investment” and “outward” are shorthand for “U.S. direct investment abroad,” and “inward direct investment” and “inward” are shorthand for “foreign direct investment in the United States.”
This article presents the details on the direct investment positions by type of financial flow. It also presents details for outward investment cross-classified by country of the foreign affiliate and by primary industry of the affiliate and for inward investment cross-classified by country of foreign parent and by primary industry of the U.S. affiliate. The outward direct investment position and related financial flow statistics are classified by country of the foreign affiliate with which the U.S. parent has direct transactions and positions, and the inward direct investment position and related financial flow statistics are classified by country of the foreign parent or of other members of the foreign parent group that have direct transactions and positions with the U.S. affiliate. Revisions to previously released statistics are also discussed.
U.S. Direct Investment Abroad The U.S. direct investment position abroad valued at historical cost—the book value of U.S. direct investors’ equity in, and net outstanding loans to, their foreign affiliates—was $4,453.3 billion at the end of 2012. It grew 9 percent, or $368.6 billion. The steady pace of growth—the position also grew 9 percent in 2011—reflected higher intercompany debt investment, increased reinvested earnings, and a shift in valuation adjustments from negative to positive. These changes were partly offset by a drop in equity investment.
Five host countries—the Netherlands, the United Kingdom, Luxembourg, Canada, and Bermuda—accounted for more than half of the total position at the end of 2012 (table 1.2 and charts 2 and 3). For the fourth consecutive year, the position in the Netherlands was the largest—at $645.1 billion, or 14 percent of the total. More than three-fourths of the position in the Netherlands was accounted for by holding companies that likely invested the funds in other countries. (See the section “Indirect Ownership” on page 31.) The position in the United Kingdom was $597.8 billion, or 13 percent of the total. In Luxembourg, the position was $383.6 billion, or 9 percent of the total, in Canada, it was $351.5 billion, or 8 percent of the total, and in Bermuda, it was $304.5 billion, or 7 percent of the total. Holding companies account for most of the positions in Luxembourg and Bermuda, where increases were largest for holding companies owned by
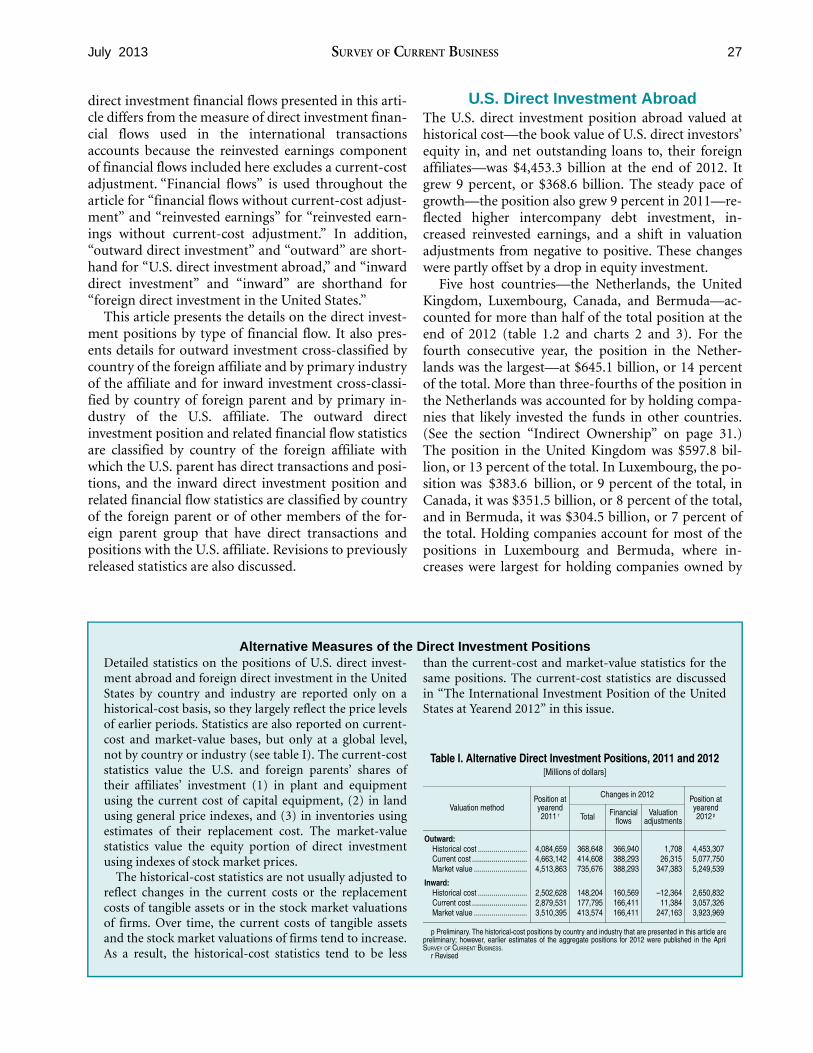
Alternative Measures of the Direct Investment Positions Detailed statistics on the positions of U.S. direct invest- than the current-cost and market-value statistics for the ment abroad and foreign direct investment in the United same positions. The current-cost statistics are discussed States by country and industry are reported only on a in “The International Investment Position of the United historical-cost basis, so they largely reflect the price levels States at Yearend 2012” in this issue. of earlier periods. Statistics are also reported on current-cost and market-value bases, but only at a global level, not by country or industry (see table I). The current-cost Table I. Alternative Direct Investment Positions, 2011 and 2012 statistics value the U.S. and foreign parents’ shares of [Millions of dollars]
their affiliates’ investment (1) in plant and equipment using the current cost of capital equipment, (2) in land using general price indexes, and (3) in inventories using estimates of their replacement cost. The market-value statistics value the equity portion of direct investment using indexes of stock market prices.
The historical-cost statistics are not usually adjusted to reflect changes in the current costs or the replacement costs of tangible assets or in the stock market valuations of firms. Over time, the current costs of tangible assets and the stock market valuations of firms tend to increase. As a result, the historical-cost statistics tend to be less
Valuation method Position at yearend 2011 r
Changes in 2012 Position at yearend 2012 pTotal Financial
flows Valuation
adjustments
Outward: Historical cost ......................... Current cost ............................ Market value ...........................
Inward: Historical cost ......................... Current cost ............................ Market value ...........................
4,084,659 4,663,142 4,513,863
2,502,628 2,879,531 3,510,395
368,648 414,608 735,676
148,204 177,795 413,574
366,940 388,293 388,293
160,569 166,411 166,411
1,708 26,315
347,383
–12,364 11,384
247,163
4,453,307 5,077,750 5,249,539
2,650,832 3,057,326 3,923,969
p Preliminary. The historical-cost positions by country and industry that are presented in this article are preliminary; however, earlier estimates of the aggregate positions for 2012 were published in the April SUR VEY OF CURRENT BUSINESS.
r Revised

28 Direct Investment Positions for 2012 July 2013
U.S. parents in manufacturing, especially petroleum-related, machinery, and communications equipment manufacturing.
Changes by component The $368.6 billion increase in the outward direct investment position resulted from financial outflows of $366.9 billion and valuation adjustments of $1.7 billion (table B and chart 4).
Financial flows
Financial outflows for U.S. direct investment abroad were $366.9 billion in 2012, down from $386.7 billion
Chart 2. Outward Direct Investment Position by Country of Foreign Affiliate at Yearend 2012
Other (18.6%)
Brazil (1.8%) France (1.9%)
Mexico (2.3%) Germany (2.7%)
Switzerland(2.9%) Australia (3.0%)
Japan (3.0%)
Singapore (3.1%)
Ireland (4.6%)
United Kingdom Islands, Caribbean (4.9%)
Bermuda (6.8%)
U.S. Bureau of Economic Analysis
Netherlands (14.5%)
United Kingdom (13.4%)
Luxembourg (8.6%)
Canada (7.9%)
in 2011. Financial flows in 2012 consisted of reinvested earnings of $311.3 billion, net equity investment of $34.6 billion, and net intercompany debt investment outflows of $21.0 billion.
Equity investment. U.S. parent net equity investment in their foreign affiliates was $34.6 billion in 2012, down from $64.7 billion in 2011. Positive net equity investment in 2012 resulted from equity increases of $94.3 billion, which were partly offset by equity decreases of $59.7 billion. Equity increases, which increase the outward position, were down 18 percent from those in 2011. The decrease in 2012 coincided with a 16 percent decrease in global merger and acquisition activity.2 Equity investments were the lowest since 2009 when the global financial crisis curtailed the level of worldwide merger and acquisition activity. The decline in 2012 reflected a slowdown in the acquisition or establishment of new foreign affiliates as well as in capital contributions to existing foreign affiliates. In 2012, equity decreases, which reduce the outward position, were up 19 percent from those in 2011, reflecting an increase in liquidations or sales of affiliates as well as in repatriations of capital from foreign affiliates to their U.S. parents.
By industry, equity increases for the acquisition or establishment of affiliates were largest in holding companies and in “other industries,” which together accounted for 62 percent of these increases. In holding companies, equity increases were largest in Europe, particularly the United Kingdom and Luxembourg,
2. See the Thompson Reuters report “Mergers and Acquisitions Review: Financial Advisor Full Year 2012” at www.osler.com/uploadedFiles/ 4Q2012_MA_Legal_Advisory_Review.pdf.
Chart 3. U.S. Direct Investment Position Abroad at Historical Cost at Yearend 2012
More than $100 billion $10 billion to $100 billion $1 billion to $10 billion –$1 billion to $1 billion Suppressed to avoid the disclosure of data of individual companies Not applicable
U.S. Bureau of Economic Analysis

29 July 2013 SURVEY OF CURRENT BUSINESS
and in Other Western Hemisphere, primarily the United Kingdom Islands in the Caribbean and Bermuda. These investments reflected acquisitions by holding companies owned by U.S. parents in manufacturing, especially beverages and machinery manufacturing. Within “other industries,” the equity increases were concentrated in retail trade in the United Kingdom.
Equity decreases were largest in Asia and Pacific, particularly Hong Kong and China, and in Europe, particularly the United Kingdom, the Netherlands, and Luxembourg. By industry, equity decreases were largest in holding companies, finance (except banks) and insurance, and information.3 These divestments reflected liquidations or sales of affiliates by holding companies owned by U.S. parents in finance (except banks) and insurance and in petroleum-related manufacturing.
3. In this article, “banks” refers to “depository institutions,” which is the industry title used in the table.
Table B. Change in the Outward Direct Investment Position on a Historical-Cost Basis by Component
[Billions of dollars]
2011 2012
Total................................................................................................................ Financial flows without current-cost adjustment.........................................
Equity ..................................................................................................... Increases ........................................................................................... Decreases ..........................................................................................
Intercompany debt ................................................................................. Reinvested earnings without current-cost adjustment ...........................
Valuation adjustments ................................................................................ Capital gains and losses ........................................................................ Currency translation ............................................................................... Other ......................................................................................................
342.7 386.7
64.7 115.0
50.3 17.8
304.2 –44.0
8.2 –17.3 –34.8
368.6 366.9
34.6 94.3 59.7 21.0
311.3 1.7
14.6 10.9
–23.7
Chart 4. Change in the Outward Direct Investment Position by Component, 2003–2012
Billions of dollars
Total
2003 04 05 06 07 08 09 10 11 12
600
500
400
300
200
100
0
–100
–200
Valuation adjustments Intercompany debt Reinvested earnings without current-cost adjustment Equity
U.S. Bureau of Economic Analysis
Reinvested earnings. Reinvested earnings—the difference between the U.S. parent share in foreign affiliate current-period earnings and the affiliate distributions to the parent—increased 2 percent in 2012. Reinvested earnings added $311.3 billion to the outward position, accounting for over four-fifths of the financial flows and of the increase in the outward position.
Reinvested earnings were positive in all major industries. Holding company affiliates accounted for nearly half of the total reinvested earnings in 2012. By region, reinvested earnings were largest in Europe, accounting for 50 percent of the worldwide total. Reinvested earnings were particularly large in the Netherlands, Ireland, and Luxembourg.
Reinvested earnings grew despite a decline in foreign affiliate earnings as U.S. parents reinvested a larger share of earnings in their affiliates. Foreign affiliate earnings decreased 2 percent to $441.0 billion in 2012 from $449.4 billion after increasing 9 percent in 2011. The decrease marked the first decrease in earnings since 2009, when earnings fell 13 percent. The decrease in 2012 reflected both the 3.8 percent average appreciation of the U.S. dollar against the currencies of major host countries and the deteriorating economic conditions in some major host countries, including Canada, the euro area countries, Brazil, and the United Kingdom.4 The reinvestment ratio—the share of cur-rent-year earnings that were reinvested—rose to 71 percent in 2012 from 68 percent in 2011.
By industry, foreign affiliate earnings were down in mining, manufacturing, holding companies, and wholesale trade. By area, the decrease was largest in four countries: Brazil, particularly transportation equipment manufacturing; Canada, particularly mining and holding companies; China, particularly banks; and Spain, particularly holding companies whose U.S. parents were mainly in petroleum-related manufacturing.
Intercompany debt investment. In 2012, U.S. parent borrowing and lending transactions with their foreign affiliates increased their net intercompany debt position in these affiliates by $21.0 billion, compared with $17.8 billion in 2011. Net debt investment in 2012 resulted from an $18.4 billion increase in foreign affiliate intercompany debt obligations to their U.S. parents combined with a shift to a $2.7 billion outflow of U.S. parent intercompany debt obligations to their foreign affiliates. By region, transactions with affiliates in Asia and Pacific, mainly Australia and
4. See Principal Global Indicators on the Web site of the International Monetary Fund at www.principalglobalindicators.org.

30 Direct Investment Positions for 2012 July 2013
Hong Kong, accounted for more than three-fourths of the total outflows in 2012. By industry, the increase in the debt position was widespread and the largest increases were in holding companies and in professional, scientific and technical services.
Valuation adjustments
Valuation adjustments totaled $1.7 billion in 2012, compared with –$44.0 billion in 2011. Valuation adjustments in 2012 consisted of capital gains and losses of $14.6 billion, currency-translation adjustments of $10.9 billion, and “other” valuation adjustments of –$23.7 billion. The positive capital gains and losses largely reflected unrealized gains related to the revaluation of financial assets held by Japanese insurance affiliates and British banks. The small positive currency-translation adjustments were the net result of the dollar’s weakening against currencies such as the euro while strengthening against the Japanese yen and the Brazilian real. “Other” valuation adjustments arose from a variety of sources, including differences between the current sale or purchase price of affiliates and their book values.
Changes by area and by country In 2012, the outward direct investment position increased in each of the major geographic areas (table C). U.S. parent investment in their European affiliates had the largest dollar increase, accounting for 62 percent of the increase in the total outward direct investment position. The next largest increase was in Latin America and Other Western Hemisphere, which accounted for 17 percent of the total increase.
Europe. The outward direct investment position increased $229.7 billion in 2012. The largest component of the increase was reinvested earnings, which accounted for 68 percent of the increase. By industry, the
Data Availability Detailed statistics on the outward direct investment position and related financial and income flows for 1982–2012 and statistics on the inward direct investment position and related financial and income flows for 1980–2012 are available on BEA’s Web site at www.bea.gov.
For 2009–2012, the statistics published in this article are currently available on BEA’s Web site. More detailed statistics on positions, financial transactions, and related income flows for both outward and inward investment will be available by the end of July on BEA’s Web site and will be published in the September 2013 SURVEY OF CURRENT BUSINESS.
largest dollar increase in the position was in holding companies, including those of U.S. computers and electronic products manufacturers.
By country, the largest dollar increases were attributable to the United Kingdom, the Netherlands, and Luxembourg, which together accounted for over four-fifths of the increase in the area. In the United Kingdom, holding companies and finance (except banks) and insurance together accounted for nearly three-fourths of the increase. In holding companies, the increase reflected reinvested earnings and valuation adjustments, and the increase was largest for holding companies owned by U.S. petroleum-related manufacturers. In finance (except banks) and insurance, the increase was mainly due to valuation adjustments. In the Netherlands and in Luxembourg, the increases were concentrated in holding companies and partly reflected companies’ reorganizations of their foreign affiliates. The transfer of ownership of some foreign affiliates to the Netherlands and to Luxembourg resulted in decreases in the positions for Curacao and Spain.5 Although the transfer of ownership of affiliates increases the position for the countries to which ownership was transferred, the overall outward position is
5. Since 2011, Curacao has been included in “other” under Other Western Hemisphere in table 1.1 and 1.2. Prior to 2011, it was included in the Netherlands Antilles.
Table C. Change in the Outward Direct Investment Position on a Historical-Cost Basis by Country of Foreign Affiliate, 2012
Change
Billions of dollars Percent
All countries ............................................................................... 368.6 9
Canada .................................................................................. 19.8 6
Europe ................................................................................... 229.7 10 Of which:
United Kingdom ............................................................. 81.8 16 Netherlands ................................................................... 71.4 12 Luxembourg ................................................................... 33.0 9 Switzerland .................................................................... 16.6 15 Ireland............................................................................ 14.3 8 Germany ........................................................................ 10.1 9 Norway ........................................................................... 5.5 17 Spain ............................................................................. –17.2 –35
Latin America and Other Western Hemisphere ..................... 61.9 8 Of which:
Bermuda ........................................................................ 24.1 9 United Kingdom Islands, Caribbean .............................. 19.6 10 Mexico ........................................................................... 10.2 11 Brazil .............................................................................. 5.6 8 Chile............................................................................... 4.9 14
Africa...................................................................................... 4.2 7 Of which:
Nigeria ........................................................................... 2.8 54 Egypt ............................................................................. 2.2 15
Middle East ............................................................................ 8.0 23
Asia and Pacific ..................................................................... 45.1 7 Of which:
Singapore ...................................................................... 20.0 17 Japan ............................................................................. 7.9 6 Hong Kong ..................................................................... 7.8 19 Korea, Republic of ......................................................... 5.0 16 India ............................................................................... 3.8 15 Australia ......................................................................... –4.4 –3 China ............................................................................. –3.9 –7

31
July 2013 SURVEY OF CURRENT BUSINESS
unaffected because these increases are offset by decreases in the position of the countries from which ownership was transferred.
Latin America and Other Western Hemisphere. The U.S. investment position rose $61.9 billion, with Bermuda and the United Kingdom Islands in the Caribbean together accounting for nearly three-fourths of the increase. The position in Bermuda increased $24.1 billion, and the increase was concentrated in holding companies and was mainly due to reinvested earnings. The position in the United Kingdom Islands in the Caribbean increased $19.6 billion, and the increase was largely attributable to an increase in the position of holding companies and to a lesser extent, to an increase in wholesale trade and finance (except banks) and insurance. The increase in all three industries reflected reinvested earnings.
The next largest dollar increases were in Mexico, Brazil, and Chile. In Mexico, the increase was widespread across industries. The largest increases were in manufacturing, particularly transportation equipment, and in finance (except banks) and insurance. In Brazil, the increase was concentrated in finance (except banks) and insurance and in holding companies. Nearly half of the increase in Chile was attributable to mining, which reflected reinvested earnings.
Asia and Pacific. The U.S. investment position increased $45.1 billion in 2012. The largest increases were in Singapore and to a lesser extent, in Japan and Hong Kong. In Singapore, over half of the increase was in holding companies, reflecting capital gains and losses and reinvested earnings. In Japan, the increase was concentrated in finance (except banks) and insurance, where much of the increase was attributable to valuation adjustments, particularly capital gains and losses. In Hong Kong, the increases in wholesale trade and in finance (except banks) and insurance were most significant. In both industries, the increases were attributable to intercompany debt investment.
In contrast, the U.S. investment positions in Australia and China decreased. In Australia, the decrease was attributable to finance (except banks) and insurance, and “other industries.” In China, the decrease was concentrated in the information industry, reflecting equity decreases due to divestments.
Canada. In 2012, the U.S. investment position increased $19.8 billion, mainly in holding companies. An increase in manufacturing, mainly in transportation equipment manufacturing, also contributed.
Middle East. The U.S. investment position increased $8.0 billion. The increase, though relatively small in dollar terms, represented the largest percentage increase (23 percent) of the major regions. Qatar, the United Arab Emirates, and Saudi Arabia had the
largest dollar increases. By industry, the increase was concentrated in mining and manufacturing, particularly petroleum-related manufacturing.
Africa. The U.S. investment position increased $4.2 billion. Nigeria and Egypt had the largest increases. In Nigeria, the increase was mainly in holding companies. In Egypt, the increase was mainly in mining.
Indirect ownership For the past three decades, the share of direct investment abroad owned indirectly—that is, by U.S. parent companies that own foreign affiliates that in turn own other foreign affiliates—has increased. Affiliates in any industry can own other foreign affiliates, but much of this investment is funneled through holding company affiliates. A holding company’s primary activity is holding the securities or financial assets of other companies. In 2012, foreign affiliates classified as holding companies accounted for 44 percent of the outward direct investment position, while in 1982, holding company affiliates accounted for 9 percent of the outward position (chart 5).
One result of the rising use of holding companies is that outward investment statistics on positions and related flows show industry and country patterns that imperfectly reflect where the goods and services by foreign affiliates are actually produced and sold.6 Statistics on the outward position and related flows are allocated to the industries and countries of the affiliates with which the U.S. parent companies have direct transactions and positions, but these industries and countries
6. For more information about the effects of holding companies on the outward investment series, see the “Technical Note” in Maria Borga and Raymond J. Mataloni Jr., “Direct Investment Positions for 2000: Country and Industry Detail,” SURVEY 81 (July 2001): 23–25.
Chart 5. Holding Companies’ Share of the Outward Direct Investment Position, 1982–2012
Percent 45
40
35
30
25
20
15
10
5
0
U.S. Bureau of Economic Analysis
1982 84 86 88 90 92 94 96 98 2000 02 04 06 08 10 12

32 Direct Investment Positions for 2012 July 2013
may differ from the industries and countries of the affiliates whose operations the parents ultimately own or control. 7
Data from BEA’s surveys of the operations of U.S. parent companies and their foreign affiliates suggest the degree to which indirect ownership structures may affect the country and industry distributions of the outward position data. The statistics on the operations of these affiliates are classified in the country where the affiliate’s physical assets are located or where the primary activity is carried out, and they are classified in the industry that reflects the affiliate’s primary activity. Thus, these statistics more closely reflect the countries and industries in which the goods and services are produced by the foreign affiliates than the statistics classified by the country and industry of the affiliate with which the parent company has a direct position or transaction.
Indirect ownership of affiliates, especially through holding companies, appears to be the most important factor for the differences in the patterns of investment by country or by industry between the position statistics and the operations statistics. According to the operations statistics, in 2010, three-fourths of foreign affiliate equity investment in other foreign affiliates was by holding companies, but holdings by affiliates in finance (except banks) and insurance and in manufacturing were also sizable. In addition, the operations statistics, unlike the position statistics, are not adjusted for percentage of U.S. ownership or for duplication in some measures of affiliate operations—such as assets and earnings—when affiliates hold equity or debt positions in one another. A comparison of the statistics on the outward investment position with the statistics on the assets and the net property, plant, and equipment (PP&E) of foreign affiliates for 2010 (the latest year for which detailed operations statistics are available) illustrates the differences in distribution between the position statistics and the operations statistics. For example, in 2010, manufacturing’s share of the outward position, 14 percent, was similar to its share of the assets, 11 percent, but these shares were much less than its 35 percent share of the PP&E of foreign affiliates. Examining the statistics by country, the Netherlands’ share of the outward position was 14 percent, compared with its 9 percent share of assets and its 2 percent share of PP&E, based on data from majority-owned foreign affiliates.
7. This convention follows international statistical guidelines in the Balance of Payments and International Investment Position Manual, 6th ed. (Washington, DC: International Monetary Fund, 2009).
Foreign Direct Investment in the United States
The foreign direct investment position in the United States valued at historical cost was $2,650.8 billion at the end of 2012. It grew 6 percent, or $148.2 billion, decelerating from a growth of 10 percent in 2011 but in line with the average annual growth of 6 percent between 2001 and 2011. The slower growth in 2012 reflected smaller increases in net intercompany debt and net equity investment. In contrast, reinvested earnings continued to grow at a record pace and contributed the most to the change in the inward position.
The United Kingdom remained the largest investing country with a position of $486.8 billion, or 18 percent of the total (table 2.2 and chart 6). Japan was the second largest with a position of $308.3 billion, or 12 percent of the total. The Netherlands was the third largest with a position of $274.9 billion, or 10 percent, and Canada was the fourth largest with a position of $225.3 billion, or 9 percent. The next largest investing countries were France with a position of $209.1 billion, Switzerland with a position of $204.0 billion, Luxembourg with a position of $202.3 billion, and Germany with a position of $199.0 billion, and each accounted for 8 percent of the total. For an alternative classification of the inward position by country, see the section “Indirect Ownership” on page 36.
Changes by component The $148.2 billion increase in the inward direct investment position resulted primarily from financial
Chart 6. Inward Direct Investment Position by Country of Each Member of the Foreign Parent Group at Yearend 2012
United Kingdom Other (20.4%) (18.4%)
Germany (7.5%) Japan (11.6%)
Luxembourg (7.6%)
Netherlands (10.4%)
Switzerland (7.7%) Canada (8.5%)
France (7.9%)
U.S. Bureau of Economic Analysis

33
July 2013 SURVEY OF CURRENT BUSINESS
inflows of $160.6 billion. Valuation adjustments were –$12.4 billion (table D and chart 7).
Table D. Change in the Inward Direct Investment Position on a Historical-Cost Basis by Component
[Billions of dollars]
2011 2012
Total.................................................................................................................... Financial flows without current-cost adjustment.............................................
Equity ......................................................................................................... Increases ............................................................................................... Decreases ..............................................................................................
Intercompany debt ..................................................................................... Reinvested earnings without current-cost adjustment ...............................
Valuation adjustments .................................................................................... Capital gains and losses ............................................................................ Currency translation ................................................................................... Other ..........................................................................................................
222.6 223.8
98.5 147.5 –49.0 50.9 74.4 –1.2 11.8
0.6 –13.6
148.2 160.6 59.6 87.3
–27.6 1.0
99.9 –12.4 –5.5
0.6 –7.5
Chart 7. Change in the Inward Direct Investment Position by Component, 2003–2012
Billions of dollars
Total
U.S. Bureau of Economic Analysis
400
300
200
100
0
–100
–200
–300
Valuation adjustments Intercompany debt Reinvested earnings without current-cost adjustment
Equity
2003 04 05 06 07 08 09 10 11 12
Financial flows
Direct investment financial inflows were $160.6 billion in 2012, down from $223.8 billion in 2011. Financial flows in 2012 consisted of $99.9 billion in reinvested earnings, $59.6 billion in net equity investment, and $1.0 billion in net intercompany debt investment inflows.
Equity investment. In 2012, net equity investment of foreign parents in their U.S. affiliates was $59.6 billion, its lowest level since 1997, when it was $59.5 billion. In 2011, net equity investment was $98.5 billion. Historically, net equity investment has been the largest component of the position increase. However, due to the 2012 slowdown in net equity investment and the strong growth in reinvested earnings, net equity investment was the second-largest component of the position increase. The increase in net equity investment in 2012 resulted from equity increases of $87.3 billion that were partly offset by equity decreases of $27.6 billion.
By region, Europe accounted for $37.8 billion or 63 percent of net equity investment in 2012. Within Europe, net equity investment was concentrated in a few countries, including the Netherlands, Germany, the United Kingdom, France, Belgium, and Switzerland. These six countries accounted for 92 percent of the total increase from Europe. Asia and Pacific accounted for $17.4 billion or 29 percent of net equity investment. Within Asia and Pacific, Japan, Korea, and China accounted for more than 90 percent of the region’s 2012 net equity investment.
By industry, net equity investments were largest in manufacturing and “other industries,” which together accounted for 81 percent of the total. Within manufacturing, the largest increase was in electrical equipment, appliances, and components manufacturing, which accounted for 60 percent of the increase in
Acknowledgments Overall supervision of the direct investment statistics was gramming for data estimation and tabulation was provided by Barbara K. Hubbard, Chief of the Direct provided by Marie Colosimo and Kevin R. Smith. Transactions and Positions Branch. The statistics on the foreign direct investment position
The statistics on the U.S. direct investment position in the United States are based largely on data from BEA’s abroad are based largely on data from BEA’s quarterly quarterly survey of transactions between U.S. affiliates of survey of transactions between U.S. parent companies foreign companies and their foreign parents. The survey and their foreign affiliates. The survey was conducted was conducted under the supervision of Peter J. Fox, who under the supervision of Jessica M. Hanson, who was was assisted by Susan M. LaPorte, Robert L. Rosholt, and assisted by Iris Branscome, Marie K. Laddomada, Sherry Helen P. Yiu. Computer programming for data estima-Lee, Louis C. Luu, Leila C. Morrison, Elizabeth A. Oca- tion and tabulation was provided by Karen E. Poffel and lan, James Y. Shin, and Dwayne Torney. Computer pro- Paula D. Brown.

34 Direct Investment Positions for 2012 July 2013
manufacturing and primarily reflected acquisitions. The increase in “other industries,” notably holding companies and mining, reflected a combination of capital contributions and acquisitions.
The slowdown in net equity investment in 2012 continued the 2011 slowdown in net equity investment, and it primarily reflected a decline in equity increases, which decreased 41 percent after decreasing 27 percent in 2011. The 2012 slowdown was spread across all major regions and was led by Europe, with a decline of $20.1 billion in equity increases. By country, the decline in equity increases for European parents was led by Luxembourg and the United Kingdom and partly reflected a decline in capital contributions. In contrast, equity increases for the Netherlands grew in 2012, primarily reflecting an increase in acquisitions. By industry, the largest declines in equity increases were in “other industries,” mainly mining and holding companies, followed by banks and manufacturing.
Equity decreases, which reduce the inward position, declined 44 percent from those in 2011. Equity decreases reflected a combination of liquidations of U.S. affiliates by European parents and returns of capital to European parents. By country, the Netherlands accounted for almost half of total equity decreases.
Reinvested earnings. Reinvested earnings—the difference between the foreign parent’s share in their U.S. affiliates’ current-period earnings and the affiliates’ distributions to their parent—added $99.9 billion to the inward direct investment position in 2012. Reinvested earnings continued to exhibit strong growth, and for the first time since the series began in 1950, they were the leading contributor to the change in the inward position. Reinvested earnings were largest for affiliates with European parents, accounting for $68.0 billion or about 68 percent of total reinvested earnings in 2012. Affiliates with parents in Asia and Pacific accounted for $19.5 billion, or 19 percent of the total. By country, reinvested earnings were largest for affiliates with parents in the United Kingdom, Japan, the Netherlands, France, and Germany.
By industry, reinvested earnings were largest for affiliates in manufacturing, accounting for 41 percent of the total. Within manufacturing, reinvested earnings were largest in chemicals manufacturing and petroleum-related manufacturing. The next largest earnings were for affiliates in “other industries,” primarily holding companies, accounting for 22 percent of the total.
Reinvested earnings increased $25.5 billion, or 34 percent, in 2012. The increase reflected both increased earnings and a higher reinvestment ratio—the ratio of reinvested earnings to total earnings; the ratio increased to 69 percent in 2012 from 55 percent in 2011. While earnings increased, distributions to foreign par
ents decreased almost 30 percent in 2012. In 2012, U.S. affiliate earnings rose 6 percent, to $144.2 billion, after rising 12 percent in 2011. The 2012 rise coincided with a 10 percent increase in U.S. corporate profits for domestic industries.8
By industry, the largest increase in reinvested earnings was in finance (except banks) and insurance, followed by wholesale trade; “other industries,” especially holding companies and mining; and manufacturing, mostly in chemicals manufacturing. By region, two-thirds of the increase was by parents in Europe.
Intercompany debt investment. Foreign parent groups’ borrowing and lending transactions with their U.S. affiliates increased the direct investment position by $1.0 billion in 2012 after increasing it $50.9 billion in 2011. Net debt investment in 2012 resulted from a $41.1 billion increase in intercompany debt obligations of U.S. affiliates to their foreign parent groups combined with a shift to $40.0 billion in outflows of intercompany debt claims of U.S. affiliates on members of their foreign parent group.
By industry, net intercompany debt inflows for 2012 were the largest in manufacturing, primarily chemicals manufacturing, and in professional, scientific, and technical services. These increases were offset by outflows in finance (except banks) and insurance and in petroleum-related manufacturing. By major region, most of the net intercompany debt inflows originated from Canada, which accounted for $4.6 billion in inflows in 2012. In contrast, Asia and Pacific accounted for the most net intercompany debt outflows with outflows of $5.1 billion, led by Australia with outflows of $5.2 billion.
Valuation adjustments
Valuation adjustments decreased the inward position $12.4 billion in 2012 after decreasing it $1.2 billion in 2011. Valuation adjustments consist of “other” valuation adjustments, capital gains and losses, and currency-translation adjustments. “Other” valuation adjustments decreased the position $7.5 billion in 2012 after decreasing the 2011 position $13.6 billion. “Other” valuation adjustments are due to a variety of sources, including differences between the current sale or purchase price of U.S. affiliates and their book values. Capital gains and losses decreased the position $5.5 billion in 2012 after increasing the 2011 position $11.8 billion. Currency-translation adjustments were $0.6 billion in 2012, almost unchanged from the amount in 2011. Currency-translation adjustments are
8. The measure of U.S. corporate profits is before tax and includes inventory valuation and capital consumption adjustments, unlike the measure of affiliate earnings (see line 2 of table 6.16D of the national income and product accounts).

35 July 2013 SURVEY OF CURRENT BUSINESS
smaller for inward investment than for outward investment because many U.S. affiliates maintain their accounting records in U.S. dollars.
Changes by area and by country Foreign direct investors from Europe accounted for 73 percent of the total increase in the inward direct investment position (table E). The next largest increase in the position was from Asia and Pacific, accounting for 12 percent of the total increase.
Table E. Change in the Inward Direct Investment Position on a Historical-Cost Basis by Country of Each Member of the Foreign Parent Group, 2012
Change
Billions of dollars Percent
All countries ............................................................................................. 148.2 6
Canada................................................................................................ 14.5 7
Europe ................................................................................................. 108.1 6 Of which:
Netherlands................................................................................. 49.2 22 United Kingdom........................................................................... 25.1 5 France ......................................................................................... 19.5 10 Luxembourg ................................................................................ 9.5 5 Belgium ....................................................................................... 8.4 10 Sweden ....................................................................................... 3.0 8 Italy.............................................................................................. 2.0 9 Switzerland.................................................................................. 1.7 1 Ireland ......................................................................................... 1.5 6 Spain ........................................................................................... 1.2 3 Germany ..................................................................................... –16.2 –8
Latin America and Other Western Hemisphere................................... 6.5 7 Of which:
United Kingdom Islands, Caribbean............................................ 7.6 15 Brazil ........................................................................................... –1.5 –30
Africa ................................................................................................... 1.1 25
Middle East.......................................................................................... –0.2 –1
Asia and Pacific ................................................................................... 18.2 4 Of which:
Japan........................................................................................... 17.2 6 Korea ........................................................................................... 5.2 27 Singapore .................................................................................... 2.0 8 China ........................................................................................... 1.4 38 Hong Kong .................................................................................. 1.4 28 Australia ...................................................................................... –9.8 –19
Europe. The inward direct investment position increased $108.1 billion in 2012. The largest component of the 2012 increase was reinvested earnings, followed by net equity investment. By country, the Netherlands, the United Kingdom, and France accounted for the largest dollar increases and for almost 90 percent of the overall increase in the European position. By industry, the largest increases in the European position were in manufacturing, primarily chemicals manufacturing, followed by electrical equipment, appliances, and components manufacturing; “other industries,” especially holding companies and mining; and professional, scientific, and technical services.
By country, the Netherlands had the largest increase in the inward direct investment position, $49.2 billion, primarily reflecting reinvested earnings and net equity
investment due to acquisitions of U.S. affiliates. By industry, 54 percent of the increase from the Netherlands was in manufacturing and was split among chemicals manufacturing; electrical equipment, appliances, and components manufacturing; and “other” manufacturing. Finance (except banks) and insurance accounted for 41 percent of the increase. The inward position for the United Kingdom increased $25.1 billion and was primarily accounted for by reinvested earnings. By industry, the increase was led by “other industries,” particularly holding companies and mining. The inward position for France increased $19.5 billion, primarily reflecting increases in chemicals manufacturing.
In contrast, the inward position for Germany decreased $16.2 billion and was primarily accounted for by net intercompany debt outflows. By industry, the decrease was primarily in finance (except banks) and insurance.
Asia and Pacific. The inward direct investment position increased $18.2 billion in 2012 and was largely attributable to parents in Japan and Korea. The position for Japan increased $17.2 billion, reflecting increases in reinvested earnings and net equity investment primarily due to acquisitions. By industry, the position increase was largest in manufacturing and wholesale trade. The position for Korea increased $5.2 billion, mainly reflecting increases in wholesale trade and in “other industries,” particularly mining. In contrast, the position for Australia decreased $9.8 billion and was concentrated in “other industries,” particularly holding companies.
Latin America and Other Western Hemisphere. The inward direct investment position increased $6.5 billion, primarily reflecting an increase in reinvested earnings. The position of parents in the United Kingdom Islands in the Caribbean increased $7.6 billion and was concentrated in computer and electronic products manufacturing and wholesale trade.
Canada. The inward direct investment position increased $14.5 billion, reflecting an increase in reinvested earnings. The majority of the increase was in “other industries,” particularly mining and holding companies; manufacturing, primarily chemicals manufacturing and petroleum-related manufacturing; and finance (except banks) and insurance.
The Middle East and Africa. The inward direct investment position for the Middle East decreased $0.2 billion, mainly reflecting a decrease in reinvested earnings. The inward direct investment position for Africa increased $1.1 billion, primarily reflecting an increase in net intercompany debt.

36 Direct Investment Positions for 2012 July 2013
Indirect ownership Foreign multinational companies (MNCs) may own their U.S. affiliates indirectly through ownership chains that extend across multiple foreign countries. The inward direct investment position statistics that are presented in this article are classified by the country of the foreign parent (or of the member of the foreign parent group with a positive or negative net debt investment in the U.S. affiliate).9 The position is classified by the first country outside the United States with a direct claim on the U.S. affiliate. In addition to the data collected by country of foreign parent, BEA collects data on the country of the ultimate beneficial owner (UBO) of the U.S. affiliate. The UBO ultimately owns or controls the U.S. affiliate (see the box “Key Terms”). BEA also presents the inward position classified by country of UBO for major regions and selected countries.10
For most affiliates, the country of the UBO is also the country of the foreign parent. Of the U.S. affiliates required to report in the 2007 Benchmark Survey of Foreign Direct Investment in the United States, the country of the UBO and that of its foreign parent were the same for 81 percent of the affiliates. Together, these affiliates accounted for more than four-fifths of the total assets, sales, and employment of all affiliates. However, for some countries, especially financial centers through which MNCs may channel their investments, the position classified by country of UBO can differ significantly from those classified by country of foreign parent (see table F).
For some foreign parent countries—most notably, Luxembourg, Switzerland, and the Netherlands—the positions classified by country of foreign parent were much higher than those classified by country of UBO. For other UBO countries—most notably, Ireland, Bermuda, and several countries in the Middle East—positions classified by country of UBO were much higher than those classified by country of foreign parent.
Ireland and Bermuda are examples of countries that use tax and regulatory policies to attract the corporate headquarters of multinational firms.11 For these countries, the higher position by country of UBO represents
9. This convention follows guidelines in the Balance of Payments and International Investment Position Manual, 6th ed. (Washington, DC: International Monetary Fund, 2009).
10. BEA regularly publishes detailed tabulations that compare statistics classified by country of foreign parent and country of UBO for both the direct investment position and direct investment income in table 16 in the September SURVEY; for example, see table 16 on page 102 in the September 2012 SURVEY. This September, preliminary statistics for 2012 and revised statistics for 2010 and 2011 will be published. Table 16 will also be available in late July on BEA’s Web site.
11. For a summary of research on the effects of taxation on multinational firms, see Mihir A. Desai, Fritz C. Foley, and James R. Hines, “Taxation and Multinational Activity: New Evidence, New Interpretations,” SURVEY 86 (February 2006): 16–22.
Table F. Historical-Cost Foreign Direct Investment Position, by Country of Foreign-Parent-Group-Member and the UBO, 2012 1
[Billions of dollars]
By country of each member of the foreign parent group
By country of UBO
All countries ............................................................................... 2,650.8 2,650.8
Canada .................................................................................. 225.3 261.1
Europe ................................................................................... Of which:
1,876.2 1,706.7
France ............................................................................ 209.1 221.7 Germany ........................................................................ 199.0 272.3 Ireland ............................................................................ 24.9 127.7 Luxembourg ................................................................... 202.3 21.0 Netherlands ................................................................... 274.9 130.1 Switzerland .................................................................... 204.0 126.0 United Kingdom ............................................................. 486.8 564.7
Latin America and Other Western Hemisphere ..................... Of which:
95.6 85.9
Bermuda ........................................................................ 2.3 14.2 Mexico ........................................................................... 14.9 29.2 United Kingdom Islands, Caribbean 2 ........................... 58.6 –0.3
Africa...................................................................................... 5.3 4.8
Middle East ............................................................................ 20.6 64.0
Asia and Pacific ..................................................................... Of which:
427.7 448.4
Japan ............................................................................. 308.3 309.4 China ............................................................................. 5.2 10.5 Hong Kong ..................................................................... 6.3 9.0
1 The ultimate beneficial owner (UBO) is that person, proceeding up a U.S. affiliate’s ownership chain, beginning with and including the foreign parent, that is not owned more than 50 percent by another person. The country of UBO is often the same as that of the foreign parent, but it may be a different foreign country or the United States.
2. A negative direct investment position may result when affiliates’ financial claims on direct investors exceed direct investors’ claims on their affiliates. Typically, a negative position will result from debt transactions in which affiliates act as net lenders to their foreign parents.
investments by MNCs that are organized with entities in Ireland and Bermuda at the top tier of the corporate group, including U.S. corporations that reorganize their ownership structure. In such reorganizations, sometimes referred to as “corporate inversions,” the U.S. corporation forms a new corporation in a foreign country and simultaneously inverts its ownership structure so that the U.S. corporation is now a U.S. affiliate of the foreign corporation.
For countries in the Middle East, positions by country of UBO are higher than those classified by country of foreign parent because investments from the Middle East are often routed through affiliates in other countries. Possible reasons for Middle Eastern UBOs to hold their U.S. investments indirectly through intermediate subsidiaries in other countries include tax and regulatory policies and privacy protection.12
Revisions The statistics on direct investment positions by country and by industry for 2012 presented in this article are preliminary. Revised statistics on the outward position and related financial flows for 2009–2011 and on the inward positions and related financial flows for 2010–2011 incorporate new survey data collected
12. For more information, see Robert Lipsey, “Foreign Direct Investment in the United States: Changes Over Three Decades,” in Foreign Direct Investment, ed. Kenneth A. Froot (Chicago: University of Chicago Press, 1993): 113–172.
37 July 2013 SURVEY OF CURRENT BUSINESS
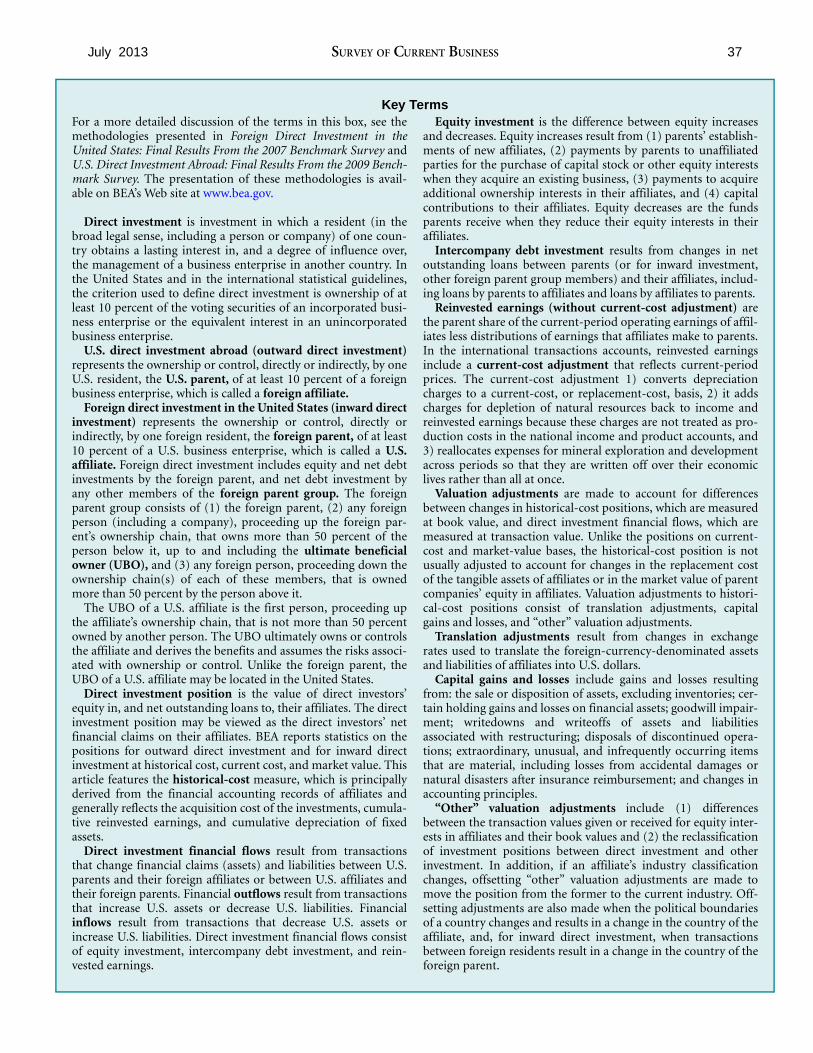
Key Terms For a more detailed discussion of the terms in this box, see the methodologies presented in Foreign Direct Investment in the United States: Final Results From the 2007 Benchmark Survey and U.S. Direct Investment Abroad: Final Results From the 2009 Benchmark Survey. The presentation of these methodologies is available on BEA’s Web site at www.bea.gov.
Direct investment is investment in which a resident (in the broad legal sense, including a person or company) of one country obtains a lasting interest in, and a degree of influence over, the management of a business enterprise in another country. In the United States and in the international statistical guidelines, the criterion used to define direct investment is ownership of at least 10 percent of the voting securities of an incorporated business enterprise or the equivalent interest in an unincorporated business enterprise.
U.S. direct investment abroad (outward direct investment) represents the ownership or control, directly or indirectly, by one U.S. resident, the U.S. parent, of at least 10 percent of a foreign business enterprise, which is called a foreign affiliate.
Foreign direct investment in the United States (inward direct investment) represents the ownership or control, directly or indirectly, by one foreign resident, the foreign parent, of at least 10 percent of a U.S. business enterprise, which is called a U.S. affiliate. Foreign direct investment includes equity and net debt investments by the foreign parent, and net debt investment by any other members of the foreign parent group. The foreign parent group consists of (1) the foreign parent, (2) any foreign person (including a company), proceeding up the foreign parent’s ownership chain, that owns more than 50 percent of the person below it, up to and including the ultimate beneficial owner (UBO), and (3) any foreign person, proceeding down the ownership chain(s) of each of these members, that is owned more than 50 percent by the person above it.
The UBO of a U.S. affiliate is the first person, proceeding up the affiliate’s ownership chain, that is not more than 50 percent owned by another person. The UBO ultimately owns or controls the affiliate and derives the benefits and assumes the risks associated with ownership or control. Unlike the foreign parent, the UBO of a U.S. affiliate may be located in the United States.
Direct investment position is the value of direct investors’ equity in, and net outstanding loans to, their affiliates. The direct investment position may be viewed as the direct investors’ net financial claims on their affiliates. BEA reports statistics on the positions for outward direct investment and for inward direct investment at historical cost, current cost, and market value. This article features the historical-cost measure, which is principally derived from the financial accounting records of affiliates and generally reflects the acquisition cost of the investments, cumulative reinvested earnings, and cumulative depreciation of fixed assets.
Direct investment financial flows result from transactions that change financial claims (assets) and liabilities between U.S. parents and their foreign affiliates or between U.S. affiliates and their foreign parents. Financial outflows result from transactions that increase U.S. assets or decrease U.S. liabilities. Financial inflows result from transactions that decrease U.S. assets or increase U.S. liabilities. Direct investment financial flows consist of equity investment, intercompany debt investment, and reinvested earnings.
Equity investment is the difference between equity increases and decreases. Equity increases result from (1) parents’ establishments of new affiliates, (2) payments by parents to unaffiliated parties for the purchase of capital stock or other equity interests when they acquire an existing business, (3) payments to acquire additional ownership interests in their affiliates, and (4) capital contributions to their affiliates. Equity decreases are the funds parents receive when they reduce their equity interests in their affiliates.
Intercompany debt investment results from changes in net outstanding loans between parents (or for inward investment, other foreign parent group members) and their affiliates, including loans by parents to affiliates and loans by affiliates to parents.
Reinvested earnings (without current-cost adjustment) are the parent share of the current-period operating earnings of affiliates less distributions of earnings that affiliates make to parents. In the international transactions accounts, reinvested earnings include a current-cost adjustment that reflects current-period prices. The current-cost adjustment 1) converts depreciation charges to a current-cost, or replacement-cost, basis, 2) it adds charges for depletion of natural resources back to income and reinvested earnings because these charges are not treated as production costs in the national income and product accounts, and 3) reallocates expenses for mineral exploration and development across periods so that they are written off over their economic lives rather than all at once.
Valuation adjustments are made to account for differences between changes in historical-cost positions, which are measured at book value, and direct investment financial flows, which are measured at transaction value. Unlike the positions on current-cost and market-value bases, the historical-cost position is not usually adjusted to account for changes in the replacement cost of the tangible assets of affiliates or in the market value of parent companies’ equity in affiliates. Valuation adjustments to historical-cost positions consist of translation adjustments, capital gains and losses, and “other” valuation adjustments.
Translation adjustments result from changes in exchange rates used to translate the foreign-currency-denominated assets and liabilities of affiliates into U.S. dollars.
Capital gains and losses include gains and losses resulting from: the sale or disposition of assets, excluding inventories; certain holding gains and losses on financial assets; goodwill impairment; writedowns and writeoffs of assets and liabilities associated with restructuring; disposals of discontinued operations; extraordinary, unusual, and infrequently occurring items that are material, including losses from accidental damages or natural disasters after insurance reimbursement; and changes in accounting principles.
“Other” valuation adjustments include (1) differences between the transaction values given or received for equity interests in affiliates and their book values and (2) the reclassification of investment positions between direct investment and other investment. In addition, if an affiliate’s industry classification changes, offsetting “other” valuation adjustments are made to move the position from the former to the current industry. Offsetting adjustments are also made when the political boundaries of a country changes and results in a change in the country of the affiliate, and, for inward direct investment, when transactions between foreign residents result in a change in the country of the foreign parent.

38 Direct Investment Positions for 2012 July 2013
(1) on BEA’s quarterly surveys of transactions between parents and their affiliates and (2) on BEA’s annual and benchmark surveys of the financial and operating data of multinational companies.
The historical-cost outward direct investment position for 2009 was revised up $46.4 billion to $3,565.0 billion. The upward revision was attributable to a $20.9 billion upward revision to financial outflows and a $25.4 billion upward revision to valuation adjustments. The outward position for 2010 was revised down $49.0 billion to $3,741.9 billion. The downward revision was the result of a $46.4 billion upward revision to the 2009 position, a $26.6 billion downward revision to 2010 financial outflows, and a $68.8 billion downward revision to the 2010 valuation adjustments. The outward position for 2011 was revised down $70.9 billion to $4,084.7 billion. The downward revision was
the result of a $49.0 billion downward revision to the 2010 position, a $9.9 billion downward revision to the 2011 financial outflows, and a $12.0 billion downward revision to the 2011 valuation adjustments.
The historical-cost inward direct investment position for 2010 was revised up $15.7 billion to $2,280.0 billion. The upward revision resulted from an upward revision of $0.1 billion to financial inflows and an upward revision of $15.5 billion in valuation adjustments from negative to positive. The inward position for 2011 was revised down $45.2 billion to $2,502.6 billion. The downward revision was the result of a $15.7 billion upward revision to the 2010 position, a $3.2 billion downward revision to financial inflows, and a $57.7 billion downward revision in valuation adjustments from positive to negative.
Tables 1.1 through 2.2 follow.

July 2013 SURVEY OF CURRENT BUSINESS 39
Table 1.1. U.S. Direct Investment Position Abroad on a Historical-Cost Basis, 2011 [Millions of dollars]
All industries Mining
Manufacturing
Wholesale trade
Information
Depository institutions
Finance (except
depository institutions)
and insurance
Professional, scientific,
and technical services
Holding companies (nonbank)
Other industries Total Food Chemi
cals
Primary and
fabricated metals
Machinery
Computers and
electronic products
Electrical equipment, appliances,
and components
Transportation
equipment
Other manu
facturing
All countries ............. 4,084,659 200,883 569,763 53,986 124,615 21,282 45,329 84,980 19,234 58,133 162,205 184,547 136,136 113,716 737,576 83,769 1,777,198 281,071 Canada .................................. 331,666 31,322 70,989 7,427 12,533 4,954 5,291 6,380 2,001 6,834 25,568 19,276 6,175 5,726 54,755 7,620 97,204 38,600 Europe 1 ................................. 2,247,345 33,793 268,425 25,749 72,108 9,518 23,709 28,590 12,681 23,602 72,468 80,292 84,322 71,295 336,607 47,653 1,168,216 156,741
Austria ................................ 13,763 8 3,551 13 351 (D) 207 1,479 368 662 (D) 781 –9 1,320 310 83 7,090 629 Belgium .............................. 50,941 75 26,472 2,626 13,467 133 711 1,371 1 16 8,146 6,012 706 783 11,574 877 1,434 3,009 Czech Republic .................. 5,804 0 2,879 (D) 199 173 282 84 5 768 (D) 227 106 (D) (D) 117 –1 146 Denmark ............................. 15,019 165 3,637 (D) 71 (D) 490 (D) 18 3 1,174 1,354 (D) (D) 516 6 5,733 (D) Finland................................ 2,184 0 962 (D) 48 3 425 142 5 78 (D) 408 87 0 4 477 56 190 France ................................ 79,621 132 20,907 1,115 2,277 2,467 2,134 1,478 29 1,128 10,279 6,063 2,036 5,084 6,940 3,582 15,345 19,532
Germany............................. 111,088 317 27,593 1,144 4,423 2,300 4,531 3,843 398 4,428 6,525 8,396 7,001 1,363 18,825 4,361 34,471 8,760 Greece................................ 1,189 0 1,083 52 (D) 0 10 2 0 0 (D) 48 –30 –2 (D) 15 (D) –3 Hungary.............................. 5,651 (D) 803 (D) 92 –1 –54 113 –11 490 (D) 580 361 (D) 73 43 (D) 565 Ireland ................................ 189,449 (D) 24,974 378 17,347 130 192 2,305 –35 110 4,549 –1,537 20,194 (D) 4,324 9,006 96,016 (D) Italy ..................................... 25,981 168 7,747 666 1,144 357 1,292 1,406 8 651 2,225 2,311 3,050 2,350 3,026 429 691 6,209 Luxembourg........................ 350,619 (D) 9,289 0 (D) (D) 1,608 (D) –9 174 (D) –305 5,781 (D) 46,804 291 274,112 5,379 Netherlands ........................ 573,721 2,140 44,586 2,103 9,940 969 2,451 4,113 9,816 125 15,069 16,694 7,398 (D) 39,911 6,810 436,231 (D)
Norway ............................... 33,283 5,751 4,154 (D) (D) (D) (D) 152 (D) (D) 21 497 (D) (D) 507 217 (D) 1,663 Poland ................................ 13,446 (D) 4,222 1,628 653 375 98 191 –3 813 467 2,123 226 (D) 1,546 278 127 (D) Portugal .............................. 2,477 (*) 576 1 165 (*) 35 106 (*) 131 137 450 42 0 341 75 331 662 Russia ................................ 11,658 1,388 5,694 4,386 159 43 250 81 20 76 680 901 193 2,124 241 292 –3 828 Spain .................................. 48,581 63 14,521 1,870 6,402 54 136 2,088 243 2,647 1,081 2,576 862 1,581 5,088 389 20,205 3,297 Sweden .............................. 24,827 0 4,250 1,227 215 73 237 859 216 229 1,194 1,648 1,164 (D) 12,202 721 1,720 (D) Switzerland ......................... 113,715 (D) 17,838 191 7,762 68 (D) 1,543 361 (D) (D) 14,561 6,267 (D) 13,635 1,445 39,587 (D) Turkey ................................. 4,851 4 1,565 (D) 449 1 134 19 (D) (D) 379 1,322 81 (D) 396 25 (D) 120 United Kingdom .................. 515,991 9,428 39,298 6,195 5,691 2,239 3,625 5,638 1,019 9,579 5,312 13,547 25,439 19,944 167,073 17,849 180,930 42,482 Other .................................. 53,488 9,553 1,826 466 (D) –30 47 (D) 68 442 340 1,635 (D) 1,331 (D) 265 33,904 1,988
Latin America and Other Western Hemisphere ........ 807,362 56,740 85,444 7,212 17,228 2,271 4,946 3,687 1,769 16,822 31,511 34,910 12,842 5,442 206,401 3,525 365,083 36,974 South America .................... 152,671 39,085 46,673 3,299 11,887 (D) 3,214 1,688 (D) 9,583 16,268 7,576 8,279 6,969 21,501 2,583 15,237 4,769
Argentina ........................ 13,498 1,839 3,371 191 1,465 19 146 –24 1 606 967 951 1,203 (D) 1,785 53 (D) 528 Brazil .............................. 73,836 (D) 29,666 1,795 6,058 547 2,844 1,233 89 6,886 10,214 3,504 5,408 (D) 12,541 1,172 9,253 (D) Chile ............................... 34,966 (D) 3,638 60 (D) 1 30 127 0 (D) (D) 824 556 (D) 4,788 497 (D) (D) Colombia ........................ 6,475 2,265 1,780 241 (D) (D) 15 26 (D) (D) (D) 486 –75 611 777 228 189 214 Ecuador .......................... 793 226 239 36 53 (*) (*) 2 0 (D) (D) 158 4 (D) 56 3 6 (D) Peru ................................ 8,993 5,452 933 (D) 466 (*) 16 31 1 0 (D) 495 438 (D) 154 (D) 1,059 126 Venezuela....................... 11,871 414 6,464 922 2,209 15 130 276 (*) 1,622 1,288 844 (D) (D) 1,338 (D) 1,081 (D) Other .............................. 2,239 561 583 (D) (D) (D) 33 15 2 9 (D) 314 (D) 182 60 (D) 17 (D)
Central America.................. 102,991 6,434 34,226 3,786 5,289 919 1,705 212 1,446 7,237 13,632 2,609 2,037 1,854 16,083 58 29,252 10,437 Costa Rica...................... 1,857 0 1,066 22 190 8 0 296 173 0 376 –140 43 (D) 398 115 768 (D) Honduras ........................ 821 0 438 27 8 0 0 (*) 0 (*) 402 62 3 (D) (D) (*) 10 38 Mexico ............................ 90,795 6,369 31,355 3,577 4,825 911 1,702 –261 1,265 7,237 12,099 2,418 1,970 1,080 13,033 –109 25,742 8,937 Panama .......................... 5,362 48 291 79 171 0 1 4 2 0 34 131 2 (D) (D) 37 2,700 (D) Other .............................. 4,155 18 1,076 81 94 0 2 173 5 0 721 138 18 532 (D) 16 32 (D)
Other Western Hemisphere 551,700 11,221 4,545 127 52 (D) 27 1,787 (D) 2 1,611 24,725 2,526 –3,381 168,818 884 320,594 21,768 Barbados ........................ 11,874 27 41 41 (*) 0 0 0 0 0 0 4,990 24 0 2,194 5 2,014 2,579 Bermuda......................... 280,461 224 1,800 0 –5 0 7 (D) (D) 2 0 1,622 1,207 190 62,325 193 197,417 15,484 Dominican Republic ....... 1,467 0 886 39 19 51 (*) –40 0 0 815 39 94 (D) (*) 11 0 (D) United Kingdom Islands,
Caribbean................... 200,219 5,295 296 (D) 0 0 0 (D) 0 0 (D) (D) 770 –2,134 88,888 517 87,392 (D) Other .............................. 57,679 5,675 1,522 (D) 38 (D) 19 0 0 0 (D) (D) 431 (D) 15,410 159 33,772 (D)
Africa ..................................... 57,230 32,907 3,864 426 809 180 599 96 20 639 1,095 1,288 197 2,483 7,982 831 6,168 1,511 Egypt .................................. 14,950 (D) (D) (D) 67 0 112 –78 15 17 (D) (D) (D) (D) (D) (D) (D) (D) Nigeria ................................ 5,307 3,880 136 19 17 0 97 12 (*) 0 –8 (D) (D) (D) (D) 1 672 42 South Africa........................ 5,830 271 2,280 (D) 618 120 347 110 2 528 (D) 874 148 (D) 169 671 (D) (D) Other .................................. 31,143 (D) (D) (D) 108 60 43 52 3 94 (D) (D) 45 1,062 7,571 (D) 5,132 (D)
Middle East ........................... 34,881 8,441 12,125 202 1,346 144 288 4,855 5 112 5,174 2,302 694 441 645 1,312 7,920 1,002 Israel................................... 9,271 –2 6,942 191 965 0 (D) 4,901 1 (D) 867 376 (D) (D) 154 648 (D) 349 Saudi Arabia ....................... 8,250 613 275 2 117 (D) (D) 14 (*) (D) (D) (D) 4 7 –7 52 6,798 (D) United Arab Emirates ......... 5,864 1,586 (D) 0 253 (D) (D) –61 4 0 (D) (D) (D) (D) 191 266 2 494 Other .................................. 11,496 6,244 (D) 9 11 (D) 10 1 0 0 (D) 2 3 (D) 306 347 (D) (D)
Asia and Pacific .................... 606,174 37,681 128,917 12,969 20,590 4,216 10,496 41,372 2,758 10,125 26,389 46,479 31,906 28,328 131,187 22,828 132,606 46,243 Australia.............................. 137,261 22,102 15,468 3,902 3,375 458 1,577 1,086 232 890 3,949 6,549 13,967 –249 32,224 6,289 28,513 12,398 China .................................. 55,304 2,587 28,543 4,768 6,210 2,004 2,458 5,060 183 3,796 4,064 4,630 3,259 2,605 2,988 1,399 4,231 5,062 Hong Kong.......................... 39,998 1 4,414 264 495 168 45 2,903 80 –52 511 9,665 1,419 1,569 1,259 1,901 16,695 3,075 India.................................... 24,622 (D) 3,903 102 584 98 1,037 602 387 555 539 1,144 3,513 (D) 3,842 7,124 (D) 191 Indonesia............................ 11,972 7,323 834 177 531 2 39 2 (D) –115 (D) 285 38 (D) 594 –31 1,917 (D) Japan.................................. 126,030 4 19,604 677 1,942 365 1,831 4,365 (D) 1,562 (D) 8,524 5,318 (D) 68,897 2,620 6,514 (D) Korea, Republic of .............. 30,160 (D) 11,187 (D) 1,037 304 408 2,492 (D) 1,099 (D) 1,820 476 (D) 5,986 777 645 (D) Malaysia ............................. 12,386 3,256 6,104 (D) 596 46 784 3,352 7 211 (D) 553 92 420 512 653 (D) (D) New Zealand ...................... 7,930 (D) 1,686 (D) 121 7 82 80 53 49 (D) 451 263 (D) 1,830 347 1,377 (D) Philippines .......................... 4,766 34 1,966 (D) 787 (*) 23 845 –8 16 (D) 344 80 (D) 106 400 697 (D) Singapore ........................... 118,571 907 21,721 347 1,407 421 1,564 15,166 186 1,402 1,228 8,736 3,229 319 10,629 650 68,239 4,141 Taiwan ................................ 15,720 1 6,222 (D) 1,656 85 129 3,589 (D) (D) 453 2,847 168 (D) 1,803 235 23 (D) Thailand.............................. 14,537 161 6,926 511 1,779 (D) 512 1,837 (D) 525 (D) 765 45 2,012 402 452 (D) (D) Other .................................. 6,917 (D) 339 (D) 71 (D) 9 –7 1 (D) 45 167 38 467 116 12 –10 (D)
Addenda: European Union (27) 2 ....... 2,036,631 17,453 239,074 20,769 63,551 9,552 18,447 26,792 12,137 22,457 65,369 62,595 75,751 63,759 319,881 45,472 1,077,078 135,569 OPEC 3............................... 53,114 17,801 12,002 979 2,651 160 559 244 4 1,762 5,643 3,176 729 (D) 2,828 1,094 12,462 (D)
* A nonzero value between –$500,000 and $500,000. Finland, France, Germany, Greece, Hungary, Ireland, Italy, Latvia, Lithuania, Luxembourg, Malta, the Netherlands, Poland, D Suppressed to avoid disclosure of data of individual companies. Portugal, Romania, Slovakia, Slovenia, Spain, Sweden, and the United Kingdom. 1. In 2011, the euro area includes Austria, Belgium, Cyprus, Estonia, Finland, France, Germany, Greece, Ireland, Italy, 3. OPEC is the Organization of Petroleum Exporting Countries. In 2011, its members were Algeria, Angola, Ecuador,
Luxembourg, Malta, the Netherlands, Portugal, Slovakia, Slovenia and Spain. For 2011, the U.S. direct investment position Iran, Iraq, Kuwait, Libya, Nigeria, Qatar, Saudi Arabia, the United Arab Emirates, and Venezuela. in the euro area was $1,453,832 million. NOTE. Estimates for 2011 are revised.
2. The European Union (27) comprises Austria, Belgium, Bulgaria, Cyprus, the Czech Republic, Denmark, Estonia,

40 Direct Investment Positions for 2012 July 2013
Table 1.2. U.S. Direct Investment Position Abroad on a Historical-Cost Basis, 2012 [Millions of dollars]
All industries Mining
Manufacturing
Wholesale trade
Information
Depository institutions
Finance (except
depository institutions)
and insurance
Professional, scientific,
and technical services
Holding companies (nonbank)
Other industries Total Food Chemi
cals
Primary and
fabricated metals
Machinery
Computers and
electronic products
Electrical equipment, appliances,
and components
Transportation
equipment
Other manu
facturing
All countries.............. 4,453,307 222,401 637,059 58,140 132,576 23,154 51,688 102,084 21,591 65,900 181,925 205,054 146,618 119,688 775,551 94,139 1,948,959 303,838 Canada................................... 351,460 29,060 75,387 8,118 12,564 5,751 5,931 6,617 2,217 9,412 24,777 21,471 8,042 6,411 54,965 8,397 108,968 38,761 Europe 1.................................. 2,477,040 33,870 311,425 26,897 77,015 10,078 28,089 41,958 15,083 25,921 86,384 83,712 98,139 73,290 360,316 53,505 1,288,755 174,028
Austria ................................ 15,591 8 3,670 16 371 (D) 186 1,445 375 708 (D) 623 42 1,316 (D) 118 (D) (D) Belgium .............................. 53,769 99 27,541 2,776 14,236 151 795 1,453 3 221 7,906 6,011 983 779 12,675 1,118 1,492 3,072 Czech Republic .................. 6,389 0 3,159 (D) 215 196 (D) 69 5 996 305 175 143 (D) (D) 132 –1 146 Denmark ............................. 15,092 281 3,701 (D) 89 (D) 489 1,484 20 3 1,439 1,433 1,310 (D) 229 –208 5,883 (D) Finland ................................ 2,013 0 1,017 (D) 77 3 463 122 6 (D) 220 282 78 0 4 419 40 173 France................................. 82,596 135 25,210 965 2,557 2,764 2,301 2,251 52 1,585 12,735 6,261 2,297 1,483 7,546 3,687 15,328 20,650
Germany............................. 121,184 388 35,105 1,578 4,861 2,354 5,005 8,375 1,141 4,623 7,168 11,970 6,961 1,340 19,474 5,087 30,479 10,381 Greece................................ 969 0 1,020 14 (D) 0 10 4 0 0 (D) 68 –75 (D) –37 14 –1 (D) Hungary .............................. 6,014 (D) 918 62 94 –1 –84 136 –8 578 141 627 478 (D) 98 22 (D) 610 Ireland ................................ 203,779 38 27,430 396 17,446 141 300 4,031 27 137 4,952 –909 24,815 (D) –3,029 9,212 102,452 (D) Italy ..................................... 26,754 202 8,044 (D) 1,270 353 1,469 1,472 –32 770 (D) 2,361 3,377 2,463 3,048 430 697 6,132 Luxembourg........................ 383,603 3,917 10,207 0 (D) –4 1,869 –51 –84 (D) (D) (D) 6,650 (D) 47,084 398 302,147 (D) Netherlands ........................ 645,098 2,394 50,372 2,215 11,006 881 2,466 6,630 10,375 217 16,583 16,957 7,959 (D) 38,384 7,448 499,186 (D)
Norway ............................... 38,803 7,890 5,254 (D) (D) (D) (D) 35 (D) (D) (D) 526 (D) (D) 555 90 (D) 1,700 Poland ................................ 14,178 6 4,305 1,611 711 85 105 224 –44 1,183 429 2,138 214 (D) 1,777 321 –15 (D) Portugal .............................. 2,383 (*) 530 1 100 –3 (D) 109 –1 156 (D) 445 82 0 382 78 337 529 Russia ................................ 14,066 1,752 5,794 4,345 214 37 402 99 20 –219 896 786 528 2,618 327 301 (D) (D) Spain .................................. 31,377 116 13,473 1,643 5,133 –14 150 2,254 352 2,525 1,430 2,644 1,027 1,434 5,319 298 4,485 2,581 Sweden............................... 24,532 0 3,706 1,274 –79 37 305 892 211 233 833 1,692 1,256 (D) 12,810 721 1,079 (D) Switzerland ......................... 130,315 203 23,020 (D) 9,510 54 1,695 2,454 1,327 (D) (D) 14,258 7,494 2,939 14,019 2,258 46,390 19,734 Turkey ................................. 6,028 (D) 1,733 (D) 593 1 177 59 124 283 (D) 1,697 125 (D) 429 75 914 (D) United Kingdom .................. 597,813 6,870 54,018 7,157 7,151 2,622 4,721 8,186 1,061 10,545 12,574 14,929 30,052 21,747 194,871 21,198 209,308 44,820 Other .................................. 54,695 (D) 2,199 492 (D) 190 200 223 (D) 470 285 (D) (D) 1,377 (D) 289 37,541 2,107
Latin America and Other Western Hemisphere ........ 869,268 65,899 93,564 8,483 18,836 2,406 4,810 3,718 1,840 19,494 33,977 43,046 13,340 5,884 215,000 4,253 386,031 42,251 South America .................... 171,268 43,544 50,374 4,054 13,021 631 2,893 1,677 47 10,334 17,717 9,095 8,660 7,341 25,442 3,080 18,600 5,132
Argentina ........................ 14,396 1,011 3,968 350 1,661 23 214 –100 2 634 1,185 1,050 1,339 (D) 1,879 3 (D) 490 Brazil .............................. 79,394 6,477 29,586 2,019 6,235 550 2,460 1,213 26 6,754 10,328 4,158 5,595 (D) 14,658 1,271 11,316 (D) Chile ............................... 39,870 (D) 4,582 59 (D) 1 30 190 0 (D) (D) 1,584 271 (D) 5,680 526 (D) (D) Colombia ........................ 8,434 (D) 2,060 322 623 35 16 28 16 (D) (D) 504 –69 (D) 1,116 241 490 (D) Ecuador .......................... 851 280 241 44 62 (*) (*) 2 0 (D) (D) 131 5 (D) 58 4 6 (D) Peru ................................ 10,918 7,136 1,072 81 (D) –1 16 31 1 0 (D) 319 480 (D) (D) (D) 1,173 188 Venezuela ....................... 15,034 478 8,234 1,159 2,651 29 123 298 (*) 2,347 1,627 927 (D) (D) 1,775 882 (D) 594 Other .............................. 2,369 499 630 18 (D) –6 34 15 2 2 (D) 423 (D) 196 (D) (D) 17 (D)
Central America.................. 112,729 8,264 38,402 4,265 5,764 (D) 1,840 –26 (D) 9,156 14,873 3,166 1,914 2,072 18,800 231 28,269 11,610 Costa Rica ...................... 1,681 0 1,089 22 (D) 8 0 (D) 203 0 (D) –156 47 (D) (D) 128 601 –472 Honduras ........................ 881 0 509 (D) (D) 0 0 (D) 0 (*) (D) 26 3 (D) (D) (*) 10 50 Mexico ............................ 101,030 8,191 35,630 4,041 5,370 (D) 1,836 –403 (D) 9,156 13,318 3,287 1,843 1,204 15,637 46 25,006 10,187 Panama .......................... 5,113 56 249 (D) (D) 0 1 (D) (D) 0 34 –45 3 (D) (D) 42 2,619 (D) Other .............................. 4,024 18 925 87 91 0 3 (D) (D) 0 (D) 55 18 609 (D) 16 33 (D)
Other Western Hemisphere 585,271 14,091 4,788 164 52 (D) 77 2,067 (D) 4 1,386 30,784 2,767 –3,530 170,759 942 339,162 25,509 Barbados ........................ 13,082 29 44 44 (*) 0 0 0 0 0 0 5,446 22 0 3,182 5 1,415 2,940 Bermuda ......................... 304,524 237 2,158 0 –2 0 (D) (D) (D) 4 0 3,310 1,316 194 61,001 248 217,659 18,402 Dominican Republic........ 1,655 0 1,059 63 24 (D) (*) (D) 0 0 (D) 54 76 (D) (*) 1 0 (D) United Kingdom Islands,
Caribbean ................... 219,851 6,034 241 (D) 0 0 0 (D) 0 (*) (D) 20,816 873 –2,253 92,403 563 98,470 2,704 Other .............................. 46,159 7,792 1,286 (D) 30 (D) (D) 0 0 0 (D) 1,158 481 (D) 14,172 125 21,618 (D)
Africa ..................................... 61,381 35,035 3,963 406 903 189 732 4 18 587 1,124 1,434 195 2,479 6,695 777 9,047 1,756 Egypt .................................. 17,134 16,286 249 (D) 77 0 (D) –178 14 33 (D) –38 2 (D) 104 (D) 136 79 Nigeria ................................ 8,152 3,702 173 19 22 0 130 12 (*) 0 –9 (D) 2 (D) 138 1 (D) –26 South Africa ........................ 5,502 79 2,305 126 698 124 (D) 114 2 451 (D) 926 146 (D) 179 562 265 (D) Other .................................. 30,593 14,968 1,236 (D) 107 65 52 56 3 102 (D) (D) 45 1,128 6,274 (D) (D) (D)
Middle East............................ 42,853 13,203 15,217 225 1,908 166 766 4,876 5 122 7,150 2,111 1,171 295 720 1,209 7,521 1,404 Israel ................................... 10,208 –1 7,918 213 1,178 0 (D) 4,906 1 (D) 1,171 293 (D) (D) 140 450 33 (D) Saudi Arabia ....................... 9,692 810 934 3 (D) (D) (D) –1 (*) (D) (D) (D) 4 2 –3 41 7,355 (D) United Arab Emirates ......... 7,826 (D) (D) 0 381 (D) 301 –30 4 0 (D) (D) (D) (D) 280 369 13 (D) Other .................................. 15,127 (D) (D) 9 (D) (D) 5 1 0 0 (D) –1 4 (D) 303 350 121 4
Asia and Pacific .................... 651,305 45,334 137,503 14,011 21,349 4,565 11,360 44,911 2,429 10,364 28,514 53,281 25,732 31,329 137,855 25,997 148,636 45,639 Australia.............................. 132,825 26,615 15,740 4,242 3,599 478 1,373 1,303 278 843 3,625 6,252 13,682 –101 17,681 7,348 39,161 6,446 China .................................. 51,363 2,682 31,536 5,220 6,492 2,134 3,328 5,487 176 3,551 5,148 4,889 –4,279 3,329 3,229 1,386 2,360 6,232 Hong Kong.......................... 47,767 1 4,504 (D) 583 192 136 2,912 85 –65 (D) 13,927 1,221 1,918 5,292 2,314 15,706 2,884 India.................................... 28,385 552 4,361 108 1,118 101 991 495 461 494 593 1,150 4,016 (D) 4,169 8,323 687 (D) Indonesia ............................ 13,480 8,562 843 183 562 2 13 2 (D) (D) 174 409 61 (D) 741 –63 1,959 (D) Japan .................................. 133,967 4 18,776 684 2,348 360 1,657 4,165 923 1,580 7,058 9,688 5,947 4,234 78,663 2,978 3,647 10,028 Korea, Republic of .............. 35,125 12 13,146 (D) 1,237 (D) 295 2,706 (D) 1,398 (D) 1,975 199 (D) 8,053 660 672 (D) Malaysia ............................. 15,001 4,412 7,042 (D) 703 53 813 4,268 7 245 (D) 461 126 452 827 677 (D) (D) New Zealand ...................... 9,466 93 1,762 (D) 137 7 75 92 57 53 (D) 485 281 (D) 2,894 348 (D) (D) Philippines .......................... 4,591 33 1,347 (D) 324 (*) 29 727 13 17 (D) 348 144 (D) 122 423 900 (D) Singapore ........................... 138,603 1,189 23,216 357 408 495 2,025 16,540 220 1,602 1,569 9,617 4,082 316 13,667 838 79,179 6,498 Taiwan ................................ 16,482 1 6,137 (D) 1,860 98 136 3,297 96 (D) 455 3,097 169 (D) 1,977 244 –95 (D) Thailand.............................. 16,882 140 8,915 626 1,889 209 482 3,047 32 628 2,002 777 40 2,294 385 493 (D) (D) Other .................................. 7,367 1,039 178 (D) 90 (D) 9 –130 1 (D) –27 206 40 475 157 27 –10 5,255
Addenda: European Union (27) 2 ....... 2,239,580 15,948 275,154 21,893 66,507 9,951 20,934 39,308 13,561 25,210 77,791 68,725 87,966 64,803 342,752 50,552 1,184,160 149,518 OPEC 3............................... 63,369 20,963 15,930 1,225 3,459 189 637 281 4 2,474 7,659 3,137 1,153 (D) 2,337 1,604 14,675 (D)
* A nonzero value between –$500,000 and $500,000. Finland, France, Germany, Greece, Hungary, Ireland, Italy, Latvia, Lithuania, Luxembourg, Malta, the Netherlands, Poland, D Suppressed to avoid disclosure of data of individual companies. Portugal, Romania, Slovakia, Slovenia, Spain, Sweden, and the United Kingdom. 1. In 2012, the euro area includes Austria, Belgium, Cyprus, Estonia, Finland, France, Germany, Greece, Ireland, Italy, 3. OPEC is the Organization of Petroleum Exporting Countries. In 2012, its members were Algeria, Angola, Ecuador,
Luxembourg, Malta, the Netherlands, Portugal, Slovakia, Slovenia and Spain. For 2012, the U.S. direct investment position Iran, Iraq, Kuwait, Libya, Nigeria, Qatar, Saudi Arabia, the United Arab Emirates, and Venezuela. in the euro area was $1,573,352 million. NOTE. Estimates by country and industry for 2012 are preliminary.
2. The European Union (27) comprises Austria, Belgium, Bulgaria, Cyprus, the Czech Republic, Denmark, Estonia,

41 July 2013 SURVEY OF CURRENT BUSINESS
Table 2.1. Foreign Direct Investment Position in the United States on a Historical-Cost Basis, 2011 [Millions of dollars]
All industries
Manufacturing
Wholesale trade
Retail trade
Information
Depository institutions
Finance (except
depository institutions)
and insurance
Real estate and
rental and
leasing
Professional, scientific,
and technical services
Other industries Total Food Chemicals
Primary and
fabricated metals
Machinery
Computers and
electronic products
Electrical equipment, appliances,
and components
Transportation
equipment
Other manu
facturing
All countries ............ 2,502,628 831,149 32,229 193,243 47,402 81,373 60,623 23,752 102,198 290,329 274,402 46,712 123,540 193,668 354,673 47,797 90,325 540,361
Canada ................................. 210,792 35,471 1,540 7,137 684 395 1,459 –378 11,548 13,087 5,647 (D) 1,147 35,496 60,938 2,289 (D) 62,696
Europe 1 ............................... 1,768,150 668,323 24,625 165,588 39,222 71,699 38,817 22,459 51,249 254,664 132,654 34,576 110,695 109,759 270,997 23,411 60,962 356,772 Austria ............................... 4,753 2,228 (D) 108 474 336 –2 (D) (D) 1,128 387 (D) –1 (D) 1 47 (D) 58 Belgium ............................. 80,299 48,641 (D) 10,225 4,349 (D) 86 64 (D) (D) 14,439 7,248 (D) (D) (D) –3 –24 7,123 Denmark ............................ 8,826 1,839 175 1,343 90 1,471 (D) (*) (*) (D) 4,753 1 8 0 1 17 57 2,150 Finland............................... 5,908 2,161 (D) (D) (D) 1,292 (D) (D) (D) (D) 2,032 (*) 1 (D) 0 (*) (D) (D) France ............................... 189,629 63,355 1,737 22,317 (D) 2,130 5,034 (D) 5,767 15,131 20,275 (D) 13,339 12,907 (D) 481 6,443 42,433
Germany............................ 215,250 72,781 201 18,639 8,868 16,104 1,155 1,067 18,816 7,930 16,874 3,842 41,050 14,315 42,897 8,205 2,581 12,705 Ireland ............................... 23,410 10,238 (D) 2,976 (D) –57 (D) (*) 1 (D) 879 –15 (D) 158 4,224 31 (D) 2,257 Italy .................................... 21,272 5,571 347 605 277 (D) (D) 219 –413 1,335 1,352 3,172 (D) (D) (D) 168 (D) (D) Luxembourg....................... 192,860 69,458 1,588 6,397 1,563 24,645 901 (D) (D) 34,132 5,045 (D) 16,649 0 45,652 1,826 (D) 51,352 Netherlands ....................... 225,703 91,485 –2,860 18,516 434 14,418 10,518 (D) (D) 47,798 19,187 2,383 4,508 (D) 37,747 3,096 31,353 (D) Norway .............................. 16,088 1,670 0 (D) (D) (D) (D) (D) (D) (D) 5,663 0 (D) (D) (D) 119 (D) (D)
Spain ................................. 46,177 6,481 (D) 2,504 (D) 602 12 4 269 709 64 (D) 52 27,824 2,937 283 (D) 8,378 Sweden ............................. 39,388 28,556 (D) (D) 613 3,990 14 (D) 2,855 698 4,645 (D) 492 (D) 138 907 (D) 1,391 Switzerland ........................ 202,220 100,654 16,139 16,813 1,652 2,142 (D) (D) (D) 46,234 9,564 6,508 (D) (D) 42,867 870 250 41,879 United Kingdom ................. 461,701 141,398 2,109 44,015 7,837 2,854 4,109 834 19,576 60,064 26,361 3,357 20,440 (D) 63,571 4,765 (D) (D) Other ................................. 34,664 21,808 2,620 (D) 8,290 (D) 51 (D) (D) 4,359 1,136 (D) (D) 413 27 2,599 (D) 4,556
Latin America and Other Western Hemisphere ....... 89,135 (D) 2,882 (D) 1,077 (D) (D) (D) –686 6,332 6,248 (D) 1,015 4,425 –14,166 11,824 (D) 52,680 South and Central America 25,494 (D) (D) (D) 711 (D) (D) (D) –718 5,142 5,926 (D) –131 3,805 489 1,213 (D) 6,586
Brazil ............................. 5,095 –152 21 –131 54 –92 (D) –4 (D) 17 4,108 (*) –48 736 (D) (D) –70 140 Mexico ........................... 13,051 3,520 (D) (D) 671 –91 (D) –19 –628 (D) 1,395 239 –94 1,102 147 509 24 6,209 Panama ......................... 1,135 166 0 (D) 25 –1 (*) –2 1 (D) –30 9 (D) (D) (D) 509 (D) 389 Venezuela...................... 4,038 (D) –5 –23 –3 –7 (D) (D) (D) (D) 21 (*) (D) 900 3 (D) (D) 18 Other ............................. 2,176 (D) 6 –81 –37 (D) (D) (D) (D) (D) 433 (D) 14 (D) (D) (D) –29 –171
Other Western Hemisphere 63,640 –148 (D) 78 366 –13 (D) (D) 32 1,189 321 2,060 1,146 620 –14,655 10,611 17,592 46,094 Bahamas ....................... 2,228 16 (D) 6 (D) 0 (*) 0 1 (*) –58 (D) (D) (D) –4 (D) 4 1,753 Bermuda........................ 4,670 –2,828 2 (D) (D) –155 (D) 0 0 (D) –1,349 –1 89 0 –19,488 (D) (D) (D) Curacao ......................... 4,159 475 1 4 0 (*) 1 0 1 468 49 (D) (*) (D) 33 2,436 (D) (D) United Kingdom Islands,
Caribbean.................. 51,012 1,977 (D) 174 (D) 141 551 (D) 30 611 1,009 2,100 1,053 (D) 4,492 7,583 (D) (D) Other ............................. 1,571 213 –3 (D) –1 0 5 0 0 (D) 670 (D) (D) (D) 312 346 –91 –10
Africa .................................... 4,285 (D) –2 –13 (D) –93 –2 (D) (D) (D) 685 (*) –8 (D) (D) (D) (D) (D) South Africa....................... 943 (D) –2 –7 (*) (D) (*) (D) (D) (D) 638 (*) (D) 0 –9 (*) –5 (D) Other ................................. 3,342 (D) (*) –6 (D) (D) –1 (D) –2 (D) 47 0 (D) (D) (D) (D) (D) (D)
Middle East .......................... 20,753 (D) 92 (D) (D) (D) (D) (D) (D) (D) 6,985 (D) 787 (D) (D) (D) (D) (D) Israel.................................. 10,090 (D) 92 (D) (D) (*) (D) –2 (D) 11 359 (D) 852 1,601 (D) 403 (D) 551 Kuwait ................................ (D) 4 0 0 0 0 (*) 1 3 0 (D) 0 (*) (D) (D) (D) 0 –4 Lebanon ............................ (D) (*) 0 0 0 0 –1 0 0 1 (*) 0 0 0 0 –7 (*) (D) Saudi Arabia ...................... (D) –71 0 (D) (D) –1 –5 –7 (*) (D) (D) (D) (D) (D) 0 21 (*) –22 United Arab Emirates ........ 1,452 (D) 0 (D) (*) 4 –9 (D) (D) (D) (D) (*) (D) (D) –1 –39 3 (D) Other ................................. 2,079 (D) 0 0 0 (D) (D) 0 1 –4 59 2 (D) (D) (D) (D) (*) (D)
Asia and Pacific ................... 409,512 114,433 3,093 15,387 6,438 9,683 22,033 1,759 40,026 16,015 122,183 5,071 9,904 42,499 36,651 8,474 8,984 61,311 Australia............................. 52,522 4,721 (D) –103 1,549 –77 –7 (D) (D) 2,907 633 (D) (D) 2,681 3,819 1,937 427 37,974 China ................................. 3,729 –340 –16 –233 –1 23 –15 33 26 –157 804 –3 90 784 42 5 22 2,325 Hong Kong......................... 4,915 2,147 –1 (D) –4 70 (D) (D) (D) –11 1,809 (*) (*) 584 –11 188 –43 241 India................................... 4,833 729 (D) 202 16 (*) 61 (D) 34 (D) (D) (D) (D) 775 4 (*) 2,435 436 Japan................................. 291,053 84,871 1,975 13,732 4,339 9,283 5,585 1,511 37,654 10,792 99,953 4,777 9,631 35,153 28,709 5,945 5,811 16,204 Korea, Republic of ............. 19,252 3,037 508 126 573 (D) (D) (D) 579 823 13,969 2 6 509 173 (D) 14 (D) Malaysia ............................ 872 83 –1 (D) (D) (D) (D) 1 4 7 120 0 (*) –2 (*) (D) (D) 595 New Zealand ..................... 1,688 1,206 11 47 (D) (D) –4 –4 1,099 (D) 377 0 (D) 0 4 (D) (D) (D) Singapore .......................... 24,207 16,088 (D) –67 62 –20 (D) 111 (D) (D) 1,926 (D) 33 333 (D) (D) 350 1,380 Taiwan ............................... 4,981 1,918 0 (D) –2 36 321 (D) 27 (D) 1,290 57 (D) 1,425 (D) 25 –36 (D) Other ................................. 1,460 –27 (D) (D) (D) (D) (D) –1 103 –5 (D) –2 (*) 256 (D) 25 1 319
Addenda: European Union (27) 2 ...... 1,540,276 560,132 8,454 147,673 30,591 69,588 25,539 18,207 51,039 209,041 116,538 28,068 100,332 118,746 228,024 22,259 59,828 306,349 OPEC 3.............................. 14,764 (D) –5 –16 –42 –4 8 –40 (D) (D) (D) (D) 8 1,099 (D) (D) 14 2,842
* A nonzero value between –$500,000 and $500,000. D Suppressed to avoid disclosure of data of individual companies. 1. In 2011, the euro area includes Austria, Belgium, Cyprus, Estonia, Finland, France, Germany, Greece, Ireland, Italy,
Luxembourg, Malta, the Netherlands, Por tugal, Slovakia, Slovenia, and Spain. For 2011, the euro area direct investment position in the United States was $1,008,137 million.
2. The European Union (27) comprises Austria, Belgium, Bulgaria, Cyprus, the Czech Republic, Denmark, Estonia,
Finland, France, Germany, Greece, Hungary, Ireland, Italy, Latvia, Lithuania, Luxembourg, Malta, the Netherlands, Poland, Portugal, Romania, Slovakia, Slovenia, Spain, Sweden, and the United Kingdom.
3. OPEC is the Organization of Petroleum Exporting Countries. In 2011, Its members were Algeria, Angola, Ecuador, Iran, Iraq, Kuwait, Libya, Nigeria, Qatar, Saudi Arabia, the United Arab Emirates, and Venezuela.
NOTE. Estimates for 2011 are revised.

42 Direct Investment Positions for 2012 July 2013
Table 2.2. Foreign Direct Investment Position in the United States on a Historical-Cost Basis, 2012 [Millions of dollars]
All industries
Manufacturing
Wholesale trade
Retail trade
Information
Depository institutions
Finance (except
depository institutions)
and insurance
Real estate and
rental and
leasing
Professional, scientific,
and technical services
Other industries Total Food Chemicals
Primary and
fabricated metals
Machinery
Computers and
electronic products
Electrical equipment, appliances,
and components
Transportation
equipment
Other manu
facturing
All countries............. 2,650,832 898,942 32,283 235,452 47,005 86,171 61,163 38,629 108,710 289,527 292,440 51,724 123,806 198,092 365,843 50,493 106,673 562,819
Canada.................................. 225,331 39,912 (D) (D) 1,617 –60 (D) –281 11,970 14,175 5,279 (D) 1,411 (D) 64,396 2,199 (D) 67,607
Europe 1................................ 1,876,240 717,627 24,092 204,679 36,873 74,321 33,771 36,795 56,412 250,682 142,283 38,791 113,537 108,751 279,766 25,506 75,900 374,078 Austria ............................... 5,206 2,435 (D) 102 496 482 –5 1 (D) 1,184 390 (D) 8 (D) 2 41 (D) 53 Belgium ............................. 88,697 55,278 (D) 14,245 (D) 2,739 81 (D) (D) (D) 16,964 7,125 –1 (D) (D) (D) –28 7,676 Denmark ............................ 8,807 1,049 (D) 1,235 101 1,089 (D) 3 3 (D) 4,960 (D) 8 0 2 19 (D) 2,713 Finland............................... 7,162 2,177 (D) (D) (D) 1,526 13 (D) (D) 483 3,153 (*) (*) (D) (*) (*) (D) (D) France................................ 209,121 75,775 1,539 31,600 (D) 2,386 4,229 (D) 6,591 17,195 21,408 4,958 12,526 17,265 30,093 471 6,352 40,274
Germany............................ 199,006 67,429 251 15,808 7,411 13,484 1,106 1,348 19,747 8,276 16,628 (D) 40,901 14,013 26,126 8,968 (D) 11,718 Ireland ............................... 24,917 10,702 1,205 3,943 (D) –183 (D) 7 1 (D) 775 –16 –10 86 3,407 29 (D) (D) Italy .................................... 23,260 7,176 364 742 296 (D) (D) 218 297 1,652 1,354 3,469 170 (D) (D) 169 (D) (D) Luxembourg....................... 202,338 73,686 1,001 12,812 1,703 24,783 (D) (D) 442 31,742 (D) 2,773 14,147 0 45,512 2,187 (D) 50,742 Netherlands ....................... 274,904 118,268 (D) 27,644 484 (D) 5,409 (D) 4,071 56,559 19,514 2,608 6,923 (D) 58,144 2,774 (D) (D) Norway .............................. 16,432 1,277 0 (D) (D) (D) 50 (D) (D) (D) 6,199 0 55 (D) (D) 114 (D) (D)
Spain ................................. 47,352 6,247 (D) 2,796 (D) (D) 17 –3 241 257 15 (D) 39 28,579 3,042 285 (D) 8,851 Sweden.............................. 42,387 28,996 (D) 20,086 603 3,997 9 (D) 3,025 379 6,569 (D) 472 (D) 155 (D) (D) 1,788 Switzerland ........................ 203,954 106,576 14,837 16,992 1,244 2,529 (D) (D) 221 51,062 10,611 6,496 (D) (D) 42,495 1,556 487 38,122 United Kingdom ................. 486,833 137,553 2,419 56,173 7,262 3,527 4,227 862 20,049 43,034 26,117 3,268 22,900 (D) 67,799 4,997 (D) (D) Other ................................. 35,863 23,002 2,235 386 8,081 –87 68 (D) (D) 4,480 (D) (D) (D) 474 30 2,695 47 2,680
Latin America and Other Western Hemisphere ....... 95,642 12,290 3,089 245 1,289 –154 1,626 91 –594 6,698 3,609 (D) 869 5,117 –16,767 13,101 (D) 56,721 South and Central America 25,773 8,201 (D) 203 (D) –205 –131 –48 –626 5,435 3,356 (D) –123 4,085 721 1,172 (D) 8,188
Brazil ............................. 3,590 –238 184 –198 (D) –60 –40 –14 (D) –14 2,446 –1 –42 877 (D) (D) –58 –39 Mexico ........................... 14,883 4,096 (D) 469 713 –70 –98 1 –423 (D) 609 (D) –86 1,093 (D) 491 17 8,275 Panama ......................... 1,003 –27 3 (D) 24 –1 (*) –4 (D) (D) –28 9 –9 (D) (D) 517 (D) 422 Venezuela ...................... 4,638 (D) –2 (D) –3 (*) (D) –4 (D) (D) 27 (*) –1 (D) 3 12 (D) –11 Other ............................. 1,659 (D) –17 –174 31 –74 (D) –26 (D) 964 304 (D) 16 1,092 –1 (D) –34 –459
Other Western Hemisphere 69,869 4,089 (D) 42 (D) 51 1,757 138 32 1,263 253 2,413 992 1,032 –17,487 11,929 18,117 48,533 Bahamas ....................... 2,876 17 (D) 6 (D) 0 (*) 0 (*) (*) –40 0 (D) (D) –3 (D) 4 2,438 Bermuda ........................ 2,324 –2,775 2 (D) (D) (D) (D) 0 0 (D) –4,134 –1 85 0 –21,124 (D) (D) (D) Curacao ......................... 4,904 437 1 (D) 0 (*) 1 0 1 (D) –36 (D) (*) (D) (D) 2,896 (D) (D) United Kingdom Islands,
Caribbean .................. 58,584 6,192 (D) 168 (D) (D) (D) 138 31 638 3,838 2,405 (D) 528 3,324 8,501 (D) (D) Other ............................. 1,180 217 –7 (D) (*) 0 8 0 0 (D) 624 (D) (D) (D) (D) 346 –94 –32
Africa .................................... 5,338 (D) –4 –14 (D) (D) –2 (D) 7 (D) 615 (*) –10 (D) (D) 137 20 3,873 South Africa ....................... 1,465 (D) –3 –9 (*) (D) (*) (D) 7 –6 (D) (*) 3 0 –10 (*) –5 (D) Other ................................. 3,873 (D) –1 –5 (D) (D) –1 (D) 0 (D) (D) 0 –14 (D) (D) 137 25 (D)
Middle East........................... 20,603 (D) (D) (D) (D) (D) (D) (D) 74 (D) 7,182 (D) 731 (D) (D) 1,593 (D) 2,971 Israel .................................. 9,821 (D) (D) (D) (D) (D) (D) (D) (D) (D) 254 (D) 803 1,732 (D) 375 (D) 252 Kuwait ................................ (D) 4 0 0 0 0 (*) 1 3 (*) (D) 0 (*) (D) (D) (D) 0 –15 Lebanon ............................ (D) 1 0 0 0 0 0 0 0 1 (*) 0 0 0 0 –7 (*) (D) Saudi Arabia ...................... (D) –69 0 (D) (D) –1 –5 –6 0 (D) (D) (D) (D) (D) 0 21 (*) –38 United Arab Emirates ........ 1,340 (D) 0 (D) (*) –1 –1 (D) (D) (D) (D) (*) (D) (D) –1 (D) 4 793 Other ................................. (D) (D) 0 0 0 (*) (D) 0 0 –5 (D) 2 (D) (D) (D) (D) (*) (D)
Asia and Pacific ................... 427,679 123,401 3,030 16,384 7,247 12,255 23,831 2,074 40,841 17,738 133,471 5,384 7,268 45,553 37,402 7,956 9,677 57,568 Australia............................. 42,685 3,839 (D) (D) 2,156 –157 (D) (D) –36 2,047 696 (D) 105 3,038 3,633 862 (D) 29,787 China ................................. 5,154 –34 –21 –180 44 65 –28 71 176 –162 509 (D) 90 1,001 (D) 6 17 (D) Hong Kong......................... 6,283 2,328 –1 (D) 3 (D) (D) –2 (D) –18 2,075 5 (D) 659 –10 187 (D) 307 India................................... 5,158 813 36 254 14 (D) 116 (D) 32 344 (D) (*) (*) 1,013 (*) (*) 2,338 (D) Japan ................................. 308,253 93,398 2,055 14,914 4,547 11,259 7,314 1,662 38,121 13,525 105,933 5,071 6,197 36,900 29,499 6,427 6,467 18,362 Korea, Republic of ............. 24,467 3,895 465 (D) 530 (D) 19 –8 767 828 16,797 2 6 616 175 149 37 2,791 Malaysia ............................ 662 103 5 –4 –10 4 106 –3 4 1 92 0 (*) 4 (*) (D) (D) 372 New Zealand ..................... 1,663 1,096 (D) (D) (D) 1 –4 –4 (D) –2 456 0 1 0 2 (D) –2 (D) Singapore .......................... 26,244 15,839 (D) –92 31 –18 (D) 252 533 (D) 3,936 (*) 39 356 (D) (D) (D) 1,436 Taiwan ............................... 5,454 2,010 (*) (D) –1 37 306 2 21 (D) 1,407 (D) (D) 1,614 (D) 25 (D) (D) Other ................................. 1,658 114 1 –11 (D) (D) 25 76 150 –8 (D) –3 1 351 (D) 24 –3 191
Addenda: European Union (27) 2 ...... 1,647,567 604,985 9,224 187,635 29,035 71,840 19,980 30,806 56,134 200,331 124,687 32,296 103,210 119,623 237,162 23,673 74,505 327,426 OPEC 3.............................. 15,487 (D) –2 –5 –47 –1 17 –19 (D) (D) (D) (D) 4 1,111 (D) 1,175 –14 2,823
* A nonzero value between –$500,000 and $500,000. D Suppressed to avoid disclosure of data of individual companies. 1. In 2012, the euro area includes Austria, Belgium, Cyprus, Estonia, Finland, France, Germany, Greece, Ireland, Italy,
Luxembourg, Malta, the Netherlands, Por tugal, Slovakia, Slovenia, and Spain. For 2012, the euro area direct investment position in the United States was $1,084,435 million.
2. The European Union (27) comprises Austria, Belgium, Bulgaria, Cyprus, the Czech Republic, Denmark, Estonia,
Finland, France, Germany, Greece, Hungary, Ireland, Italy, Latvia, Lithuania, Luxembourg, Malta, the Netherlands, Poland, Portugal, Romania, Slovakia, Slovenia, Spain, Sweden, and the United Kingdom.
3. OPEC is the Organization of Petroleum Exporting Countries. In 2012, Its members were Algeria, Angola, Ecuador, Iran, Iraq, Kuwait, Libya, Nigeria, Qatar, Saudi Arabia, the United Arab Emirates, and Venezuela.
NOTE. Estimates by country and industry for 2012 are preliminary.