Embed Size (px)
Citation preview
1
Journal of Al Azhar University Engineering Sector
Vol. 12, No. 45, October, 2017, 1329-1340
DIRECT INJECTION DIESEL ENGINE COMBUSTION MODELING
M. M. Abdelaal,1 M. M. Al-Ashmawy,
2 and Basem A. Rabee
3
1 Professor, Mech. Eng. Department, Faculty of engineering, Al-Azhar University 2 Lecturer, Mech. Eng. Department, Faculty of engineering, Al-Azhar University
3 Assist professor, Mech. Eng. Department, Faculty of engineering, Al-Azhar University
ABSTRACT It has been realized that, simulation is an effective, less costly tool to investigate the influence of many parameters on any phenomenon. Studying the effects of every single variable is not easy by experimental work. The main objective of the present study is to develop a mathematical model to simulate the flow and thermo-chemical characteristics of the process taking place inside the combustion chamber of a direct injection (DI) diesel engine. A two dimension CFD model was established for a non-premixed combustion process in a direct injection diesel engine. An experimental work was conducted on a 4-stroke single cylinder, DI, diesel engine, to validate the developed model. The predicted results for the engine cylinder pressure, temperature, and heat release rate are compared with those measured experimentally. Good agreement was attained revealing that CFD modeling can be used to predict direct injection diesel engine performance parameters with reasonable accuracy. 1. INTRODUCTION Internal combustion engines were invented in the nineteenth century. since this invention, it had a deep influence on human life. Furthermore, several different types and sizes of internal combustion engines are used such as electricity generators, submarine engine, and a wide variety of aircraft, off-road equipment and locomotives [1, 2]. The high fuel price, and the environmental impact of ICE emissions, are considered the main issues of interest, nowadays, of the research works concerning engine development. However, improving engine performance, and reducing engine emissions require comprehensive understanding of the combustion process. Nevertheless, mathematical modeling of the combustion process is considered one of the main pillars to achieve these targets. The computational power and capacity of modern computers, together with, the development of computational fluid dynamics techniques facilitate the mathematical models make it easy to predict, in details, the effect of key parameters, with less cost, and in shorter time if compared with employing experimental techniques [3][4]. Automotive industry employs, mathematical modeling to improve engine fuel consumption and to reduce the emission of air pollutants [5]. Literature survey indicates that, many research works are dealing with numerical studies together with experimental investigations [6][7]. Jayashankara et al. [10] carried out a computational fluid dynamic investigation to study the effect of fuel injection timing and intake pressure on the performance of a direct injection diesel engine.
DIRECT INJECTION DIESEL ENGINE COMBUSTION MODELING
Gosman et al. [11] studied combustion flow in a motored engine, numerically and experimentally, without firing through a cylinder head port. Predicted and measured results were in a good agreement. Gosman and Harvey [12] analyzed fuel-air mixing and combustion in direct injection diesel engine numerically. They found that the model produces accurate predictions of the combustion process. many types of models for engine combustion process, multidimensional computational fluid dynamics models is gaining a momentum due to its capability to predict the gas flow patterns, fuel spray parameters etc. [13].The validation of the mathematical model developed in the present study is attained by comparing the predicted results with those measured experimentally of a 4- stroke, single cylinder, DI diesel engine. The paper is organized as follows, the used experimental facilities and measuring techniques are present. The mathematical formulation of the combustion process in DI diesel engine is then outlined. The predicted results are presented compared with the experimental observations. Discuss of the results together with concluding remarks are given at the end. 2. EXPERIMENTAL FACILITIES 2.1 Engine The present study has been conducted on a Petter PH1W single cylinder, naturally aspirated, four–stroke, water cooled, direct injection (DI) diesel engine; complete with heavy flywheel. The engine specifications are given in Table 1.
2.2 Instrumentation and Measuring Techniques Engine performance, in–cylinder pressure/crank angle (CA), and exhaust emission concentrations have all been recorded and analyzed. Diesel fuel flow rate is measured via basic flow rate measurement principles. The fuel flow rate is determined by knowing the time required to consume certain volume of the fuel providing that the fuel density is known. The pressure inside the engine cylinder is measured using a “piezoelectric pressure sensor The output signal of the sensor is transferred to a dual–mode charge amplifier The output voltage signal of the amplifier is then transferred to a four–channel oscilloscope storage. The major exhaust gas components measured in the present study are nitric oxide (NO), carbon monoxide (CO), carbon dioxide (CO2), and O2. Different techniques have been employed in measuring these components, depending on the nature, the characteristics, and the properties of each individual component. Accordingly, different types of instruments are used. An ADC multi–gas analyzer (MGA) was used to measure the concentrations of certain exhaust gas components; typically, NO, CO, CO2, and O2. The first three gases have been measured based on the infrared absorptivity principle; using infrared gas analyzer (IRGA), whereas the last one has been
Table 1- Petter Engine specifications
Model Petter PH1W diesel engine
Bore 87.3 mm
Stroke 110 mm
Compression ratio 16.5:1
Nozzle diameter 0.25 mm
Spray angle 120
Valve timing Opening Closing
Intake 4.5 BTDC 35.5 ABDC
Exhaust 35.5 BBDC 4.5 ATDC
DIRECT INJECTION DIESEL ENGINE COMBUSTION MODELING
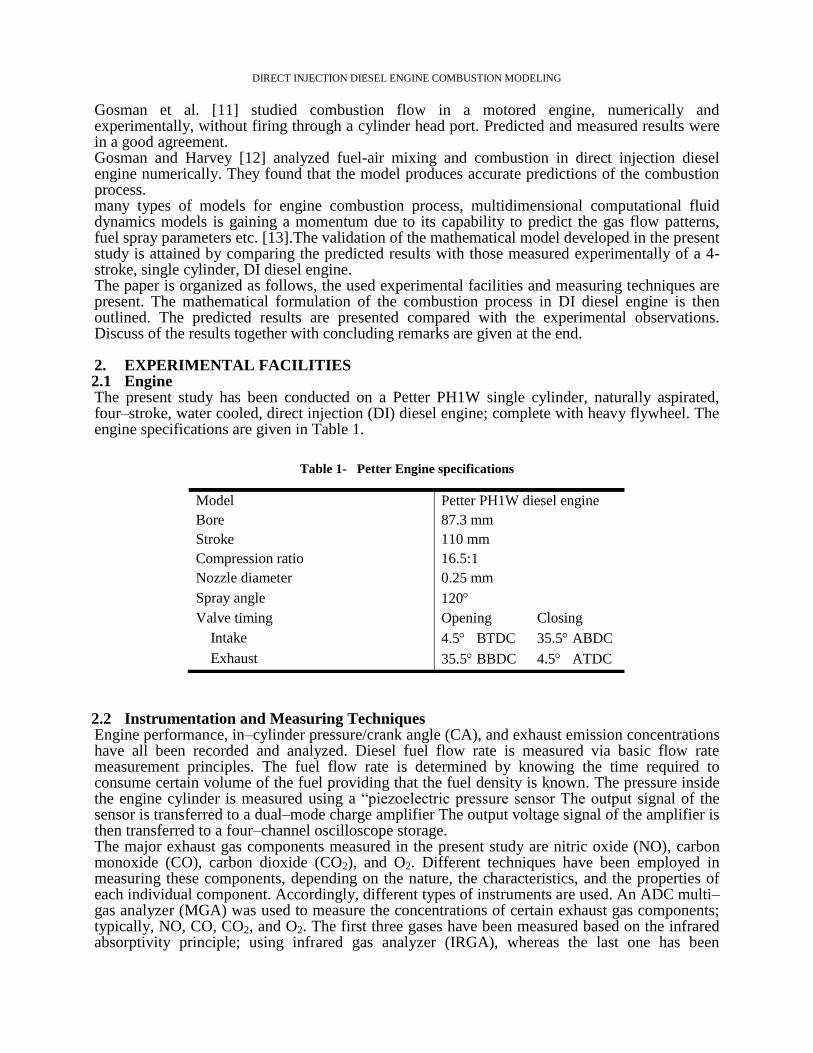
measured based on the paramagnetic characteristics of oxygen; using paramagnetic oxygen analyzer (PMA). Figure 1 illustrates a schematic diagram for the test rig bench and its instrumentation.
Figure 1- Schematic Diagram for Petter Engine Test Rig Bench
3. DIESEL ENGINE SIMULATION The main goal of this section is creating a simulation of one of the most complex internal combustion engine which is four strokes diesel engines. Engines performance and exhaust emissions are governed by unsteady fluid dynamic process [6]. The strokes of the engine starting and ending crank angles are lister in table 2.
Table 2- Strokes Starting and Stopping Crank Angle Degree
Stroke Starting, Stopping,
Intake 0 180
Compression 180 360
Power 360 540
Exhaust 540 720
Simulation is carried out over three stages: a pre-processor, a solver and a post-processor. 3.1 Pre-Processor setting The first stage represents pre-processor in which engine geometry creation is carried out, and combustion chamber construction is provided, A detailed mesh for the combustion chamber is created in order to solve the governing equations. The combustion chamber geometry is divided to two shapes for fulfilling the requirement of the dynamic mesh transient analysis. These two
DIRECT INJECTION DIESEL ENGINE COMBUSTION MODELING
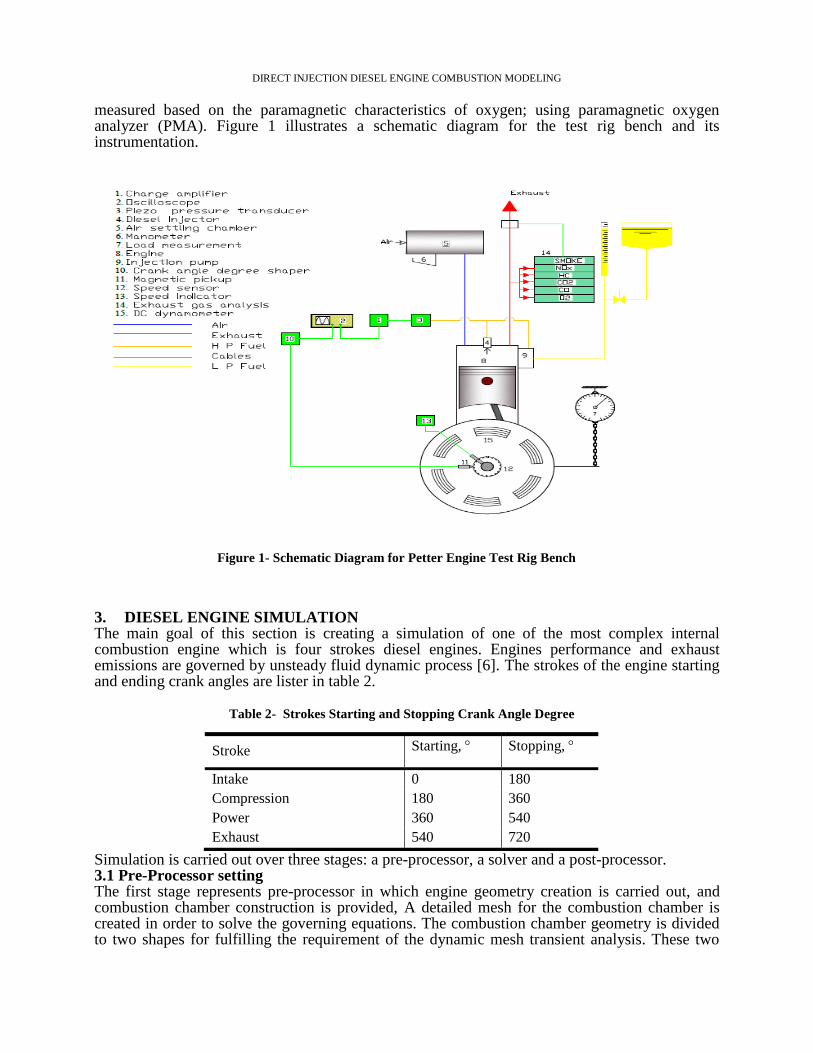
shapes are cylindrical shape on the top of the piston representing the first zone and a hemispherical shape as a bowel representing the second zone. In addition, the fuel injector is located at the middle of the combustion chamber. There is symmetrical shapes in the present case. The modeling is preferred to be developed in 2D analysis as shown in figure 2.
Table 3 presents some of mesh statistics and quality index. The table illustrates that minimum orthogonal quality is 0.61837 and maximum aspect ratio is 2.5404 and these for 2dimensional model. which indicates to this model has an appropriate meshing quality for the simulation.
Table 3- Mesh Statistics and Quality Index
Interior faces 106634
Nodes 311896
Cells 279443
Minimum Orthogonal Quality 0.61837
Maximum Aspect Ratio 2.5404
Boundary conditions specify the flow and thermal variables on the boundaries of the physical model. It is specify them important to appropriately during simulations. The boundary condition at the start of running case are measured from the experimental study work. In-cylinder parameters such as crank shaft speed, starting crank angle and crank angle step size which can be determined accurately are listed in table 4.
Table 4- In-Cylinder Parameters
Crank Shaft Speed 1500 rpm
Starting Crank Angle 215.5
Stopping Crank Angle 504.5
Crank Angle Step Size (deg) 0.1 CA
Crank Radius 55 mm
Connecting Rod Length 192.5 mm
Figure 2- 2D combustion chamber modeling Geometry
DIRECT INJECTION DIESEL ENGINE COMBUSTION MODELING
3.2 Solver Several models should be used as a solver step in the present case. In the following, the governing equations will be briefly recapitulated. Governing equations are mass, momentum and Turbulent equations in addition to combustion model. The continuity equation is given by
The principle of conservation of momentum, which equates the rate of change of momentum to the forces applied, (Navier - Stokes equation) gives:
The standard (κ-ε) was selected as a turbulence model according to recommendations of researchers. the equations of κ-ε model for turbulent kinetic energy could be expressed:
And
The bulk reaction is assumed to be:
The air flow was selected to match the dynamic mesh properties. Species model is selected to be one of the activated models to enable combustion process and select combustion model matching with diesel engine. Non- Premixed combustion type is selected with enabling of compressibility effect. Discrete phase model is selected to allow the activation of injection inside the cylinder. Single injection group of two fuel injection streams is enabled to simulate diesel fuel injection process. Injection parameters such as injector (X,Y) position, injection flow rate and injection start and stop crank angle degree are given from the experiments. For example, the injection start and stop crank angle degree are determined by needle lift crank angle diagram. The formation of thermal NO is determined by a set of highly temperature-dependent chemical reactions known as the extended Zeldovich mechanisms. The principal reactions governing the formation of thermal NO from molecular nitrogen are as follows:
The equilibrium reactions are:
3.3 Post-Processor setting post–processor consists of the necessary tools to visualizes the form of the output. The setting of this stage contains the required output forms. simulation are needed in order to obtain an insight into the complex phenomena in-cylinder processes. In the present case, pressure and temperature are visualized as a property variation through time step. The variation of this properties through time step are printed instantly to console and also can produce a file able to read on excel sheet format. Pressure and temperature together with CO2, CO and NO are presented as a contour plots for the whole section at any time step angle. These plots are one of the advantages of simulation. In addition to velocity is presented as vector plots at any required time step angle. The results of all these setting will be shown and discussed in the following section.
DIRECT INJECTION DIESEL ENGINE COMBUSTION MODELING
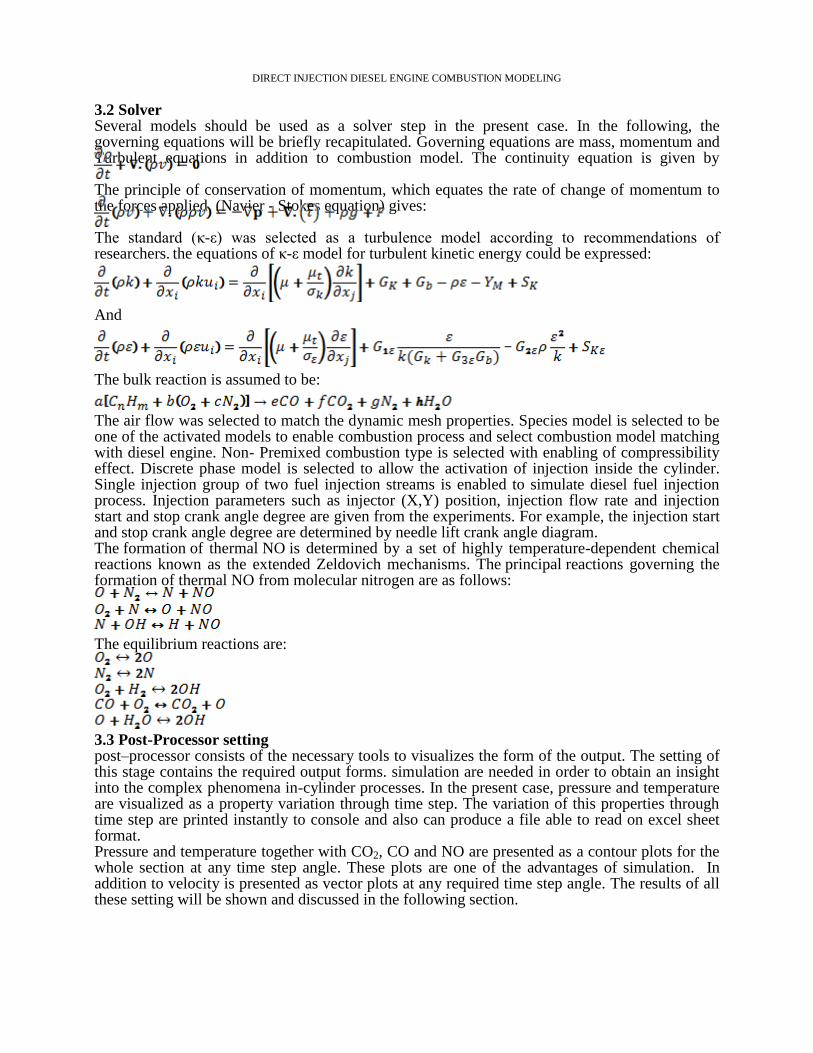
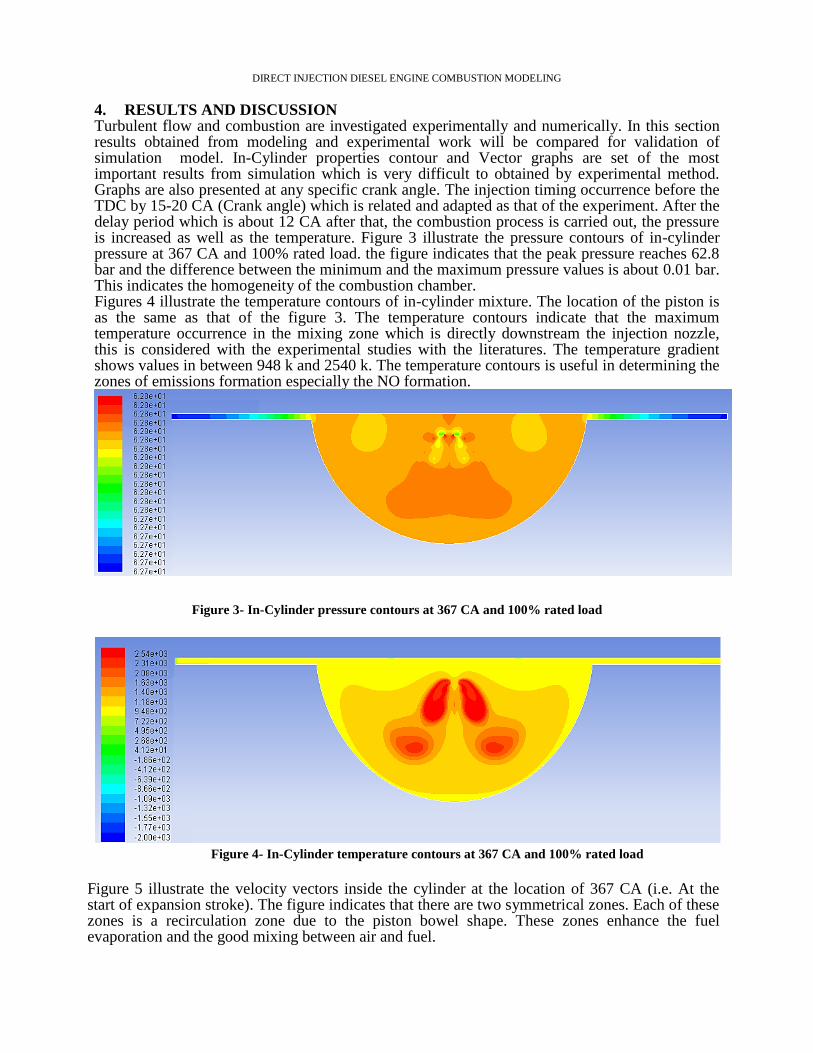
4. RESULTS AND DISCUSSION Turbulent flow and combustion are investigated experimentally and numerically. In this section results obtained from modeling and experimental work will be compared for validation of simulation model. In-Cylinder properties contour and Vector graphs are set of the most important results from simulation which is very difficult to obtained by experimental method. Graphs are also presented at any specific crank angle. The injection timing occurrence before the TDC by 15-20 CA (Crank angle) which is related and adapted as that of the experiment. After the delay period which is about 12 CA after that, the combustion process is carried out, the pressure is increased as well as the temperature. Figure 3 illustrate the pressure contours of in-cylinder pressure at 367 CA and 100% rated load. the figure indicates that the peak pressure reaches 62.8 bar and the difference between the minimum and the maximum pressure values is about 0.01 bar. This indicates the homogeneity of the combustion chamber. Figures 4 illustrate the temperature contours of in-cylinder mixture. The location of the piston is as the same as that of the figure 3. The temperature contours indicate that the maximum temperature occurrence in the mixing zone which is directly downstream the injection nozzle, this is considered with the experimental studies with the literatures. The temperature gradient shows values in between 948 k and 2540 k. The temperature contours is useful in determining the zones of emissions formation especially the NO formation.
Figure 3- In-Cylinder pressure contours at 367 CA and 100% rated load
Figure 4- In-Cylinder temperature contours at 367 CA and 100% rated load
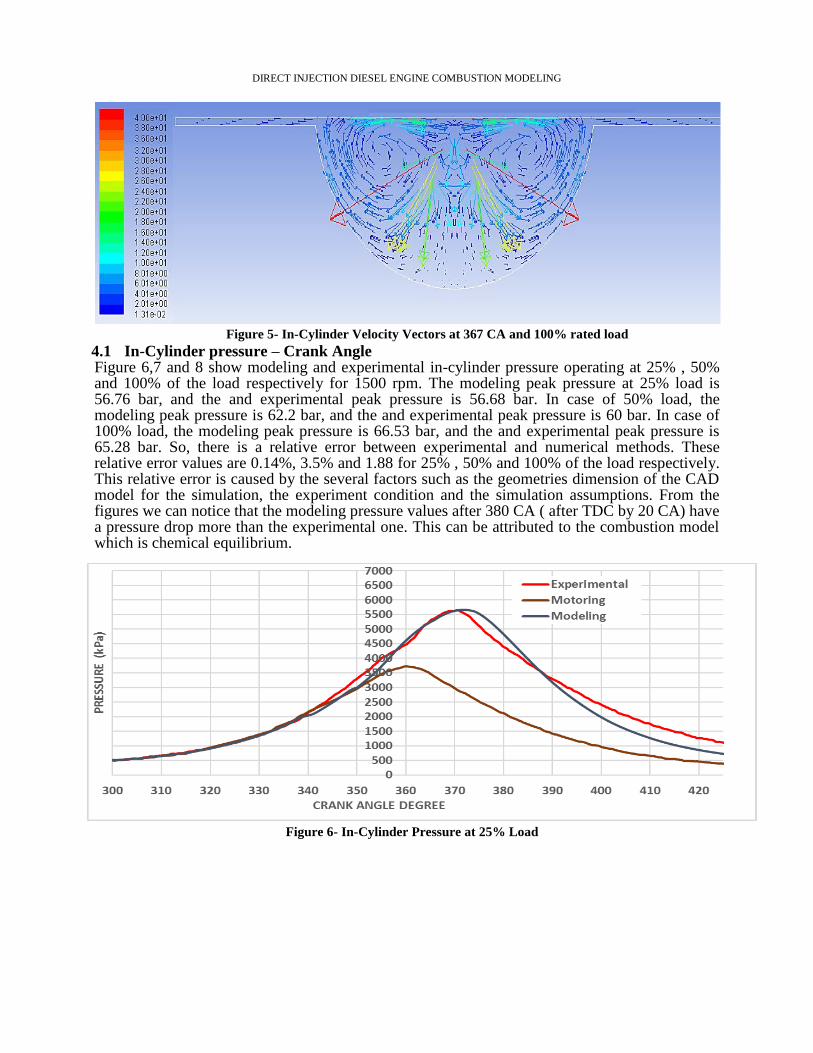
Figure 5 illustrate the velocity vectors inside the cylinder at the location of 367 CA (i.e. At the start of expansion stroke). The figure indicates that there are two symmetrical zones. Each of these zones is a recirculation zone due to the piston bowel shape. These zones enhance the fuel evaporation and the good mixing between air and fuel.
DIRECT INJECTION DIESEL ENGINE COMBUSTION MODELING
Figure 5- In-Cylinder Velocity Vectors at 367 CA and 100% rated load
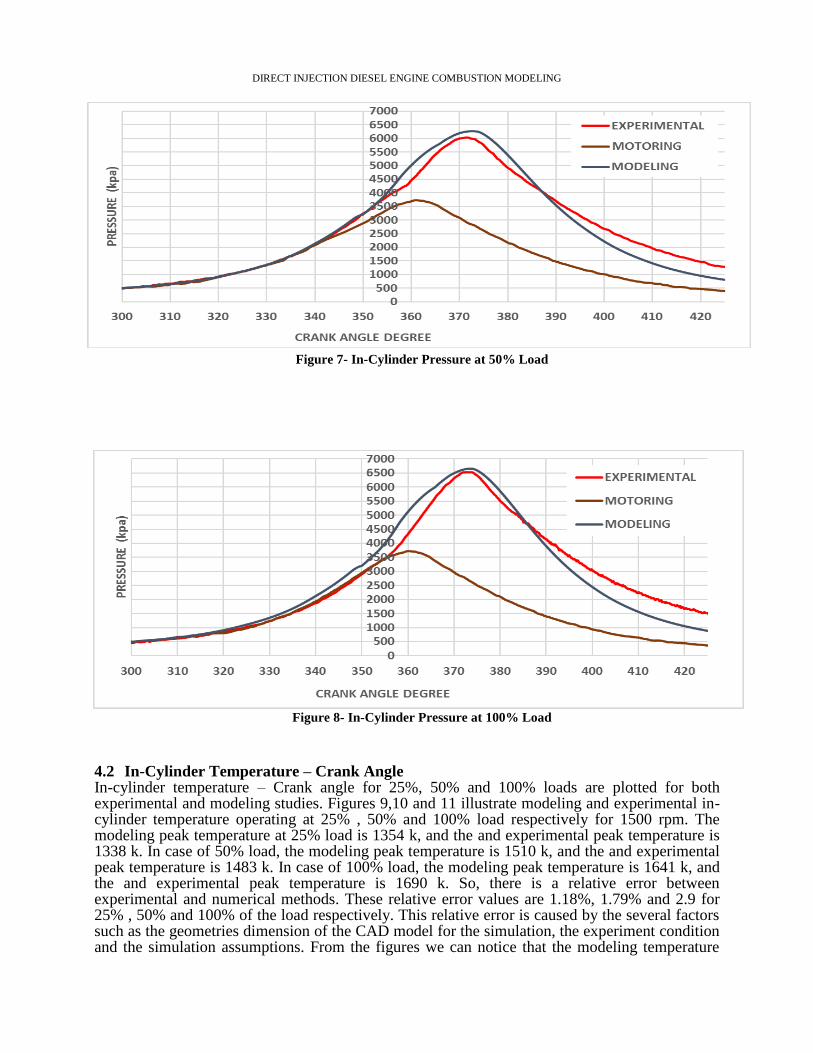
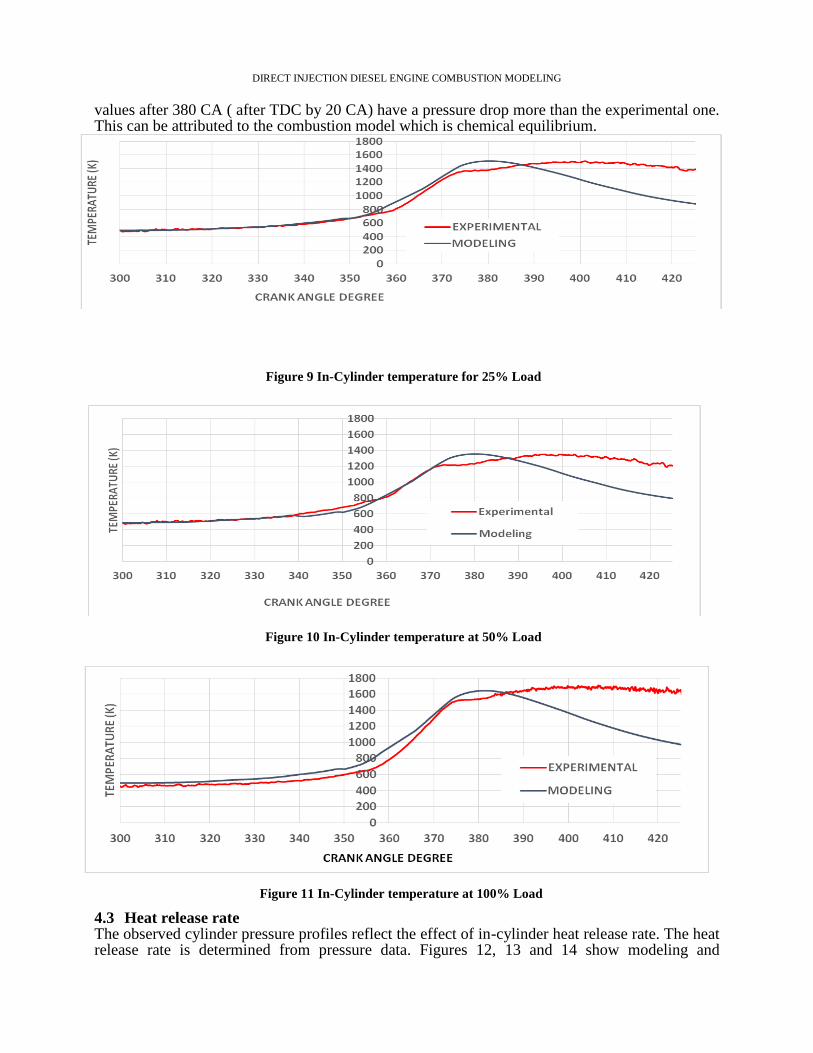
4.1 In-Cylinder pressure – Crank Angle Figure 6,7 and 8 show modeling and experimental in-cylinder pressure operating at 25% , 50% and 100% of the load respectively for 1500 rpm. The modeling peak pressure at 25% load is 56.76 bar, and the and experimental peak pressure is 56.68 bar. In case of 50% load, the modeling peak pressure is 62.2 bar, and the and experimental peak pressure is 60 bar. In case of 100% load, the modeling peak pressure is 66.53 bar, and the and experimental peak pressure is 65.28 bar. So, there is a relative error between experimental and numerical methods. These relative error values are 0.14%, 3.5% and 1.88 for 25% , 50% and 100% of the load respectively. This relative error is caused by the several factors such as the geometries dimension of the CAD model for the simulation, the experiment condition and the simulation assumptions. From the figures we can notice that the modeling pressure values after 380 CA ( after TDC by 20 CA) have a pressure drop more than the experimental one. This can be attributed to the combustion model which is chemical equilibrium.
Figure 6- In-Cylinder Pressure at 25% Load
DIRECT INJECTION DIESEL ENGINE COMBUSTION MODELING
Figure 7- In-Cylinder Pressure at 50% Load
Figure 8- In-Cylinder Pressure at 100% Load
4.2 In-Cylinder Temperature – Crank Angle In-cylinder temperature – Crank angle for 25%, 50% and 100% loads are plotted for both experimental and modeling studies. Figures 9,10 and 11 illustrate modeling and experimental in-cylinder temperature operating at 25% , 50% and 100% load respectively for 1500 rpm. The modeling peak temperature at 25% load is 1354 k, and the and experimental peak temperature is 1338 k. In case of 50% load, the modeling peak temperature is 1510 k, and the and experimental peak temperature is 1483 k. In case of 100% load, the modeling peak temperature is 1641 k, and the and experimental peak temperature is 1690 k. So, there is a relative error between experimental and numerical methods. These relative error values are 1.18%, 1.79% and 2.9 for 25% , 50% and 100% of the load respectively. This relative error is caused by the several factors such as the geometries dimension of the CAD model for the simulation, the experiment condition and the simulation assumptions. From the figures we can notice that the modeling temperature
DIRECT INJECTION DIESEL ENGINE COMBUSTION MODELING
values after 380 CA ( after TDC by 20 CA) have a pressure drop more than the experimental one. This can be attributed to the combustion model which is chemical equilibrium.
Figure 9 In-Cylinder temperature for 25% Load
Figure 10 In-Cylinder temperature at 50% Load
Figure 11 In-Cylinder temperature at 100% Load
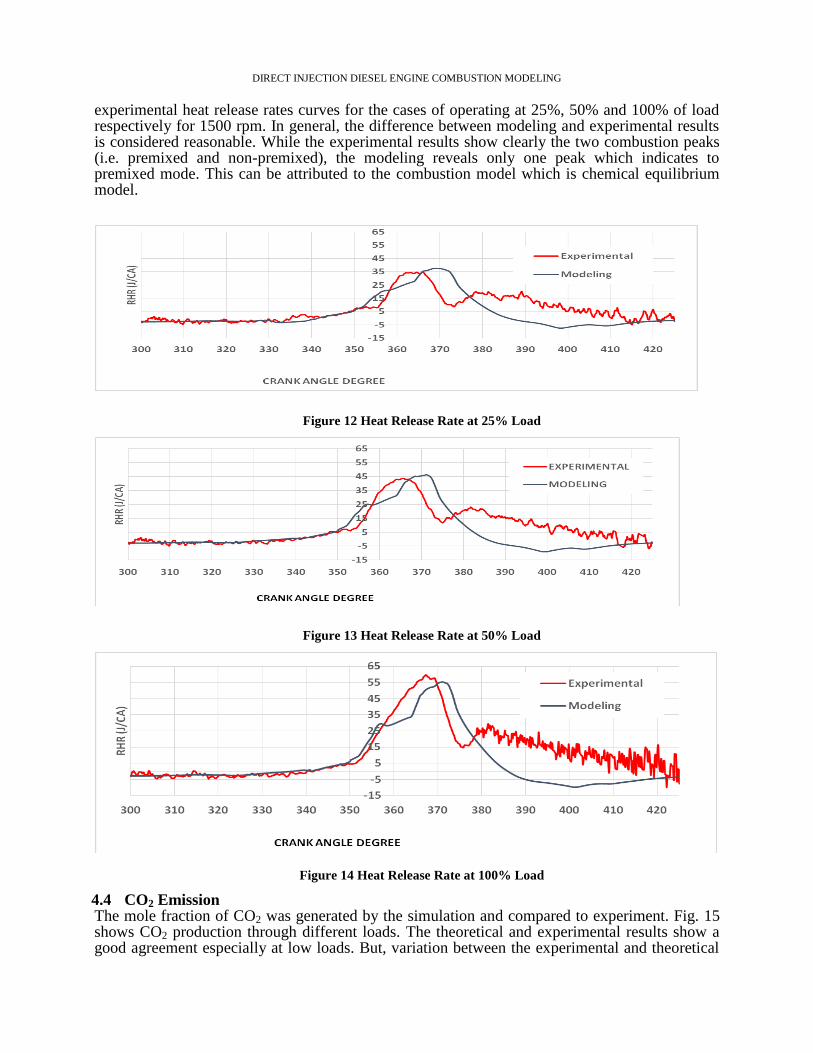
4.3 Heat release rate The observed cylinder pressure profiles reflect the effect of in-cylinder heat release rate. The heat release rate is determined from pressure data. Figures 12, 13 and 14 show modeling and
DIRECT INJECTION DIESEL ENGINE COMBUSTION MODELING
experimental heat release rates curves for the cases of operating at 25%, 50% and 100% of load respectively for 1500 rpm. In general, the difference between modeling and experimental results is considered reasonable. While the experimental results show clearly the two combustion peaks (i.e. premixed and non-premixed), the modeling reveals only one peak which indicates to premixed mode. This can be attributed to the combustion model which is chemical equilibrium model.
Figure 12 Heat Release Rate at 25% Load
Figure 13 Heat Release Rate at 50% Load
Figure 14 Heat Release Rate at 100% Load
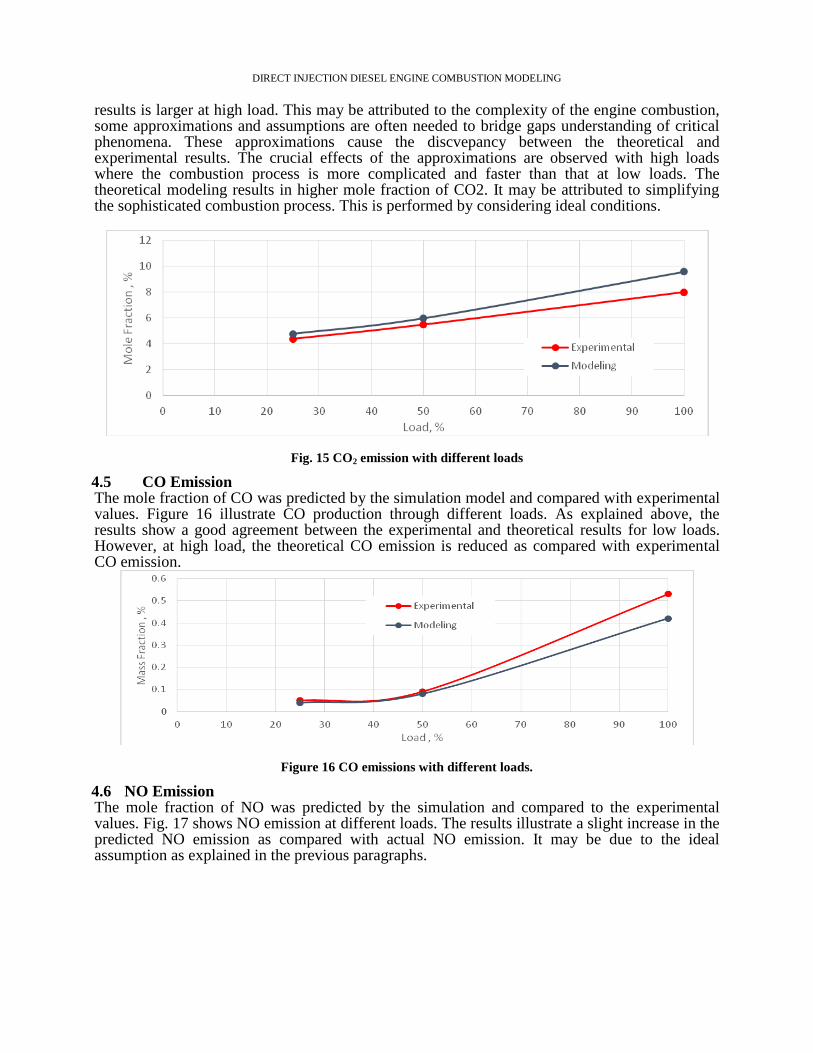
4.4 CO2 Emission The mole fraction of CO2 was generated by the simulation and compared to experiment. Fig. 15 shows CO2 production through different loads. The theoretical and experimental results show a good agreement especially at low loads. But, variation between the experimental and theoretical
DIRECT INJECTION DIESEL ENGINE COMBUSTION MODELING
results is larger at high load. This may be attributed to the complexity of the engine combustion, some approximations and assumptions are often needed to bridge gaps understanding of critical phenomena. These approximations cause the discvepancy between the theoretical and experimental results. The crucial effects of the approximations are observed with high loads where the combustion process is more complicated and faster than that at low loads. The theoretical modeling results in higher mole fraction of CO2. It may be attributed to simplifying the sophisticated combustion process. This is performed by considering ideal conditions.
Fig. 15 CO2 emission with different loads
4.5 CO Emission The mole fraction of CO was predicted by the simulation model and compared with experimental values. Figure 16 illustrate CO production through different loads. As explained above, the results show a good agreement between the experimental and theoretical results for low loads. However, at high load, the theoretical CO emission is reduced as compared with experimental CO emission.
Figure 16 CO emissions with different loads.
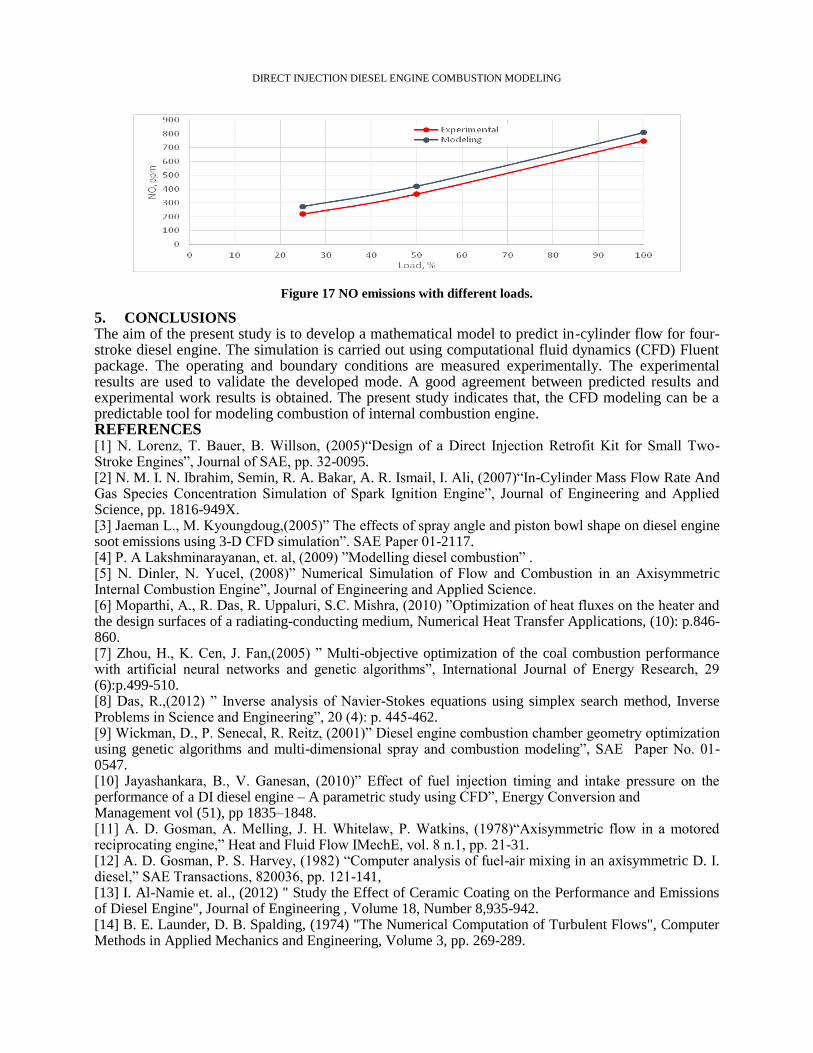
4.6 NO Emission The mole fraction of NO was predicted by the simulation and compared to the experimental values. Fig. 17 shows NO emission at different loads. The results illustrate a slight increase in the predicted NO emission as compared with actual NO emission. It may be due to the ideal assumption as explained in the previous paragraphs.
DIRECT INJECTION DIESEL ENGINE COMBUSTION MODELING
5. CONCLUSIONS The aim of the present study is to develop a mathematical model to predict in-cylinder flow for four-stroke diesel engine. The simulation is carried out using computational fluid dynamics (CFD) Fluent package. The operating and boundary conditions are measured experimentally. The experimental results are used to validate the developed mode. A good agreement between predicted results and experimental work results is obtained. The present study indicates that, the CFD modeling can be a predictable tool for modeling combustion of internal combustion engine. REFERENCES [1] N. Lorenz, T. Bauer, B. Willson, (2005)“Design of a Direct Injection Retrofit Kit for Small Two-Stroke Engines”, Journal of SAE, pp. 32-0095. [2] N. M. I. N. Ibrahim, Semin, R. A. Bakar, A. R. Ismail, I. Ali, (2007)“In-Cylinder Mass Flow Rate And Gas Species Concentration Simulation of Spark Ignition Engine”, Journal of Engineering and Applied Science, pp. 1816-949X. [3] Jaeman L., M. Kyoungdoug,(2005)” The effects of spray angle and piston bowl shape on diesel engine soot emissions using 3-D CFD simulation”. SAE Paper 01-2117. [4] P. A Lakshminarayanan, et. al, (2009) ”Modelling diesel combustion” . [5] N. Dinler, N. Yucel, (2008)” Numerical Simulation of Flow and Combustion in an Axisymmetric Internal Combustion Engine”, Journal of Engineering and Applied Science. [6] Moparthi, A., R. Das, R. Uppaluri, S.C. Mishra, (2010) ”Optimization of heat fluxes on the heater and the design surfaces of a radiating-conducting medium, Numerical Heat Transfer Applications, (10): p.846-860. [7] Zhou, H., K. Cen, J. Fan,(2005) ” Multi-objective optimization of the coal combustion performance with artificial neural networks and genetic algorithms”, International Journal of Energy Research, 29 (6):p.499-510. [8] Das, R.,(2012) ” Inverse analysis of Navier-Stokes equations using simplex search method, Inverse Problems in Science and Engineering”, 20 (4): p. 445-462. [9] Wickman, D., P. Senecal, R. Reitz, (2001)” Diesel engine combustion chamber geometry optimization using genetic algorithms and multi-dimensional spray and combustion modeling”, SAE Paper No. 01-0547. [10] Jayashankara, B., V. Ganesan, (2010)” Effect of fuel injection timing and intake pressure on the performance of a DI diesel engine – A parametric study using CFD”, Energy Conversion and Management vol (51), pp 1835–1848. [11] A. D. Gosman, A. Melling, J. H. Whitelaw, P. Watkins, (1978)“Axisymmetric flow in a motored reciprocating engine,” Heat and Fluid Flow IMechE, vol. 8 n.1, pp. 21-31. [12] A. D. Gosman, P. S. Harvey, (1982) “Computer analysis of fuel-air mixing in an axisymmetric D. I. diesel,” SAE Transactions, 820036, pp. 121-141, [13] I. Al-Namie et. al., (2012) " Study the Effect of Ceramic Coating on the Performance and Emissions of Diesel Engine", Journal of Engineering , Volume 18, Number 8,935-942. [14] B. E. Launder, D. B. Spalding, (1974) "The Numerical Computation of Turbulent Flows", Computer Methods in Applied Mechanics and Engineering, Volume 3, pp. 269-289.
Figure 17 NO emissions with different loads.


![INTEGRATED NUMERICAL SIMULATION OF INJECTION MOLDING … · injection molding filling simulation [8]. Numerical experiments confirm the reliability and efficiency of the solver. Integrated](https://img.pdfslide.us/doc/110x75/5d0d0f7388c993ed388b4830/integrated-numerical-simulation-of-injection-molding-injection-molding-filling.jpg)