Embed Size (px)
Citation preview
1
Direct Energy Conversion by Proton-Conducting Ceramic Fuel Cell Supplied
with CH4 and H2O at 600 – 800oC
Department of Applied Quantum Physics and Nuclear EngineeringKyushu University
S. Fukada, S. Suemori, K. Onoda
HTTR-WS, JAERI-Oarai, Oct. 7, 2005

2
HTTR-WS, JAERI-Oarai, Oct. 7, 2005

3
Hydrogen production
• Thermo-chemical reaction of water• Electrolysis of water• Hydrogen production from natural gas or oil1. Partial oxidation reaction
2CH4 + O2 = 2CO + 4H22. Steam reforming reaction
CH4 + H2O = CO + 3H23. Direct decomposition
CH4 = C + 2H2
HTTR-WS, JAERI-Oarai, Oct. 7, 2005
4
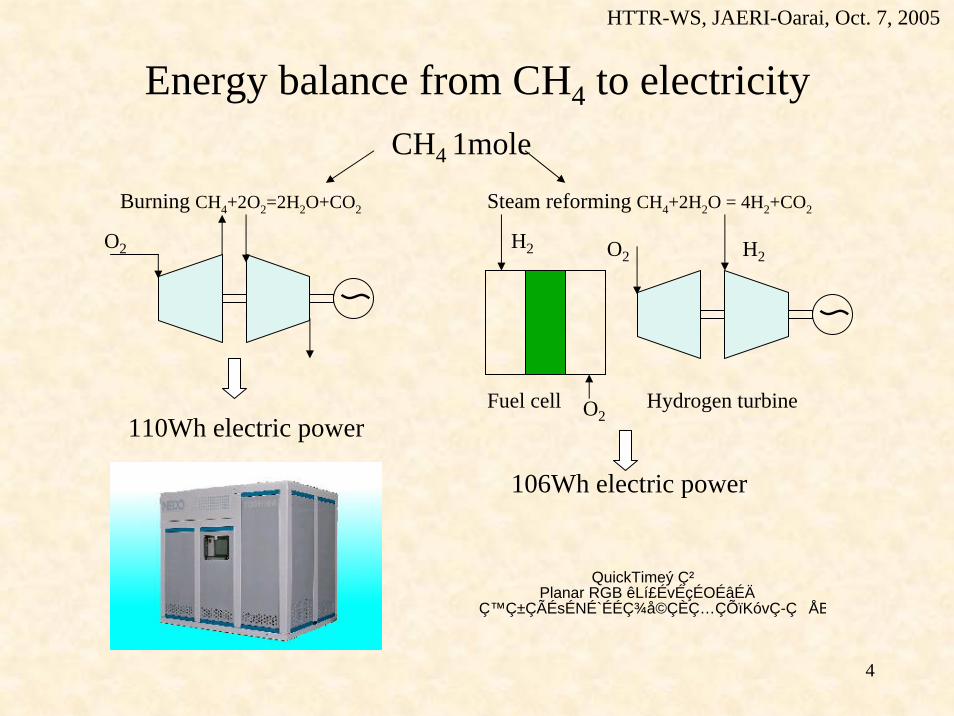
Energy balance from CH4 to electricityCH4 1mole
Burning CH4+2O2=2H2O+CO2
O2
〜
110Wh electric power
Steam reforming CH4+2H2O = 4H2+CO2
H2
O2
O2 H2
〜
Hydrogen turbineFuel cell
106Wh electric power
QuickTimeý DzPlanar RGB êLí£ÉvÉçÉOÉâÉÄ
ǙDZÇÃÉsÉNÉ`ÉÉǾå©ÇÈÇ…ÇÕïKóvÇ-Ç�ÅB
HTTR-WS, JAERI-Oarai, Oct. 7, 2005

5
Advantages of ceramic fuel cell operated at high temperature
• Direct energy conversion supplied with CH4 and H2O.• Endothermic heat can be converted to electricity directly.• It can work even when CH4 is supplied.• The temperature condition is almost the same with HTGR.• The use of Ni can decrease the cost of electrodes.
Ni electrode
CH4
CO2 H2O
electron
proton
CO
hydrogen
SrCe0.95Yb0.05O3-x
To external circuit
(1)
(2) (3)Ni wire
(4)Deposited Carbon
Fig. 2 Mass and charge transfer on proton-conducting ceramics cell
HTTR-WS, JAERI-Oarai, Oct. 7, 2005

6
The purpose of the present study
H2 production using HTGR heat and high-temperature H2 usage system
HTGR800 - 900℃
H2 production
Heat exchanger Heat exchanger
Heat inputHeat pump systemHeat pump system
HH22 StorageStorage
H2
600℃
H2 Supply Alloy
Heat outputH2 purification
ceramic FC
A
Thermochemical water dissociation
Steam reforming or partial oxidation
Alloy
• Feasibility of ceramic fuel cell is studied to investigate direct energy transformation at operation conditions of HTTR.
• Comparison of overall proton conductivity of ceramic fuel cell• Whether carbon deposition can affect the fuel cell performance
or not.
HTTR-WS, JAERI-Oarai, Oct. 7, 2005

7
Ceramic fuel cell without CH4 reformer
CH4+H2O|Ni|SrCe0.95Yb0.05O3-a|NiO|O2+H2O
Cathode
Anode
Glass GasketGlass Gasket
SrCe 0.95 Yb0.05 O3-aSrCe 0.95Yb 0.05O3-a
Ni electrodeNi electrode
O2+Ar INO2+Ar IN
CH 4 +H 2O INCH 4 +H2O IN
Gas OUTGas OUT
Gas OUTGas OUT
Ni wireNi wire
HTTR-WS, JAERI-Oarai, Oct. 7, 2005

8
Ni/SiO2 catalyst• Fine Ni particles disperse• SiO2 support material
Fig. 1 SEM photo of Ni/SiO2 catalyst before use
NiO 67.70%SiO2 24.30%CuO 2.85%Al2O3 2.04%Cr2O3 1.91%Fe2O3 0.425Co2O3 0.36%K2O 0.31%MnO 0.10%
X-ray fluorescence analysis
HTTR-WS, JAERI-Oarai, Oct. 7, 2005

9
I-V curves for SrCe0.95Yb0.05O3-a ceramic
Cell potential, E, can be expressed by a linear curve of E=E0-Id/σΑ.EMF, E0, was correlated by the Nernst equation.
HTTR-WS, JAERI-Oarai, Oct. 7, 2005

10
EMF of ceramic fuel cell supplied with CH4
• Nernst equation
E0 =−ΔGH2O
2F−
RgT2F
lnpH2O,cathode
pH2,anodepO2,cathode0.5
⎛
⎝ ⎜ ⎜
⎞
⎠⎟⎟
H2 + (1/2)O2 = H2O + ΔGH2O
EMF versus H2O vapor pressure at anode
HTTR-WS, JAERI-Oarai, Oct. 7, 2005
11
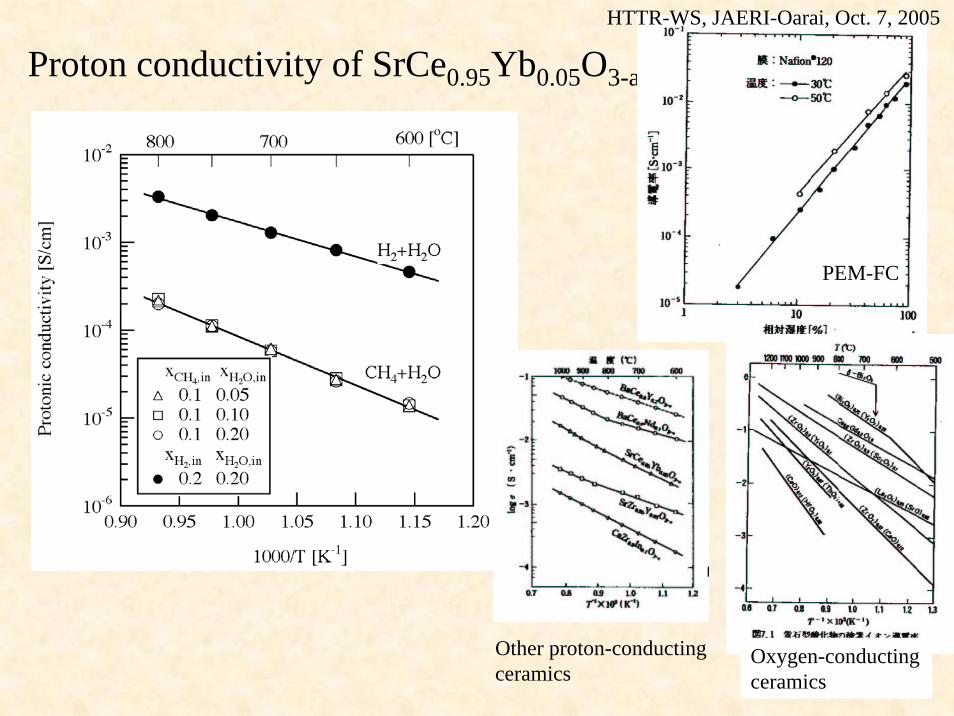
Proton conductivity of SrCe0.95Yb0.05O3-a
PEM-FC
Other proton-conducting ceramics
Oxygen-conducting ceramics
HTTR-WS, JAERI-Oarai, Oct. 7, 2005

12
SEM photo and deposition of carbon in porous Ni electrode
Carbon deposition profile
(A) (B) (C)0
5
10
15
20
25
(C) Electrode-Electrolyte interface(B) Electrode internal(A) Electrode surface
Position
Car
bon
amou
nt [A
tm%
]
Depsited Carbon
Direct decomposition might occurred at the interface between electrode and electrolyte.
CH4 + H2O = CO + 3H2
CH4 = C + 2H2.
HTTR-WS, JAERI-Oarai, Oct. 7, 2005
13
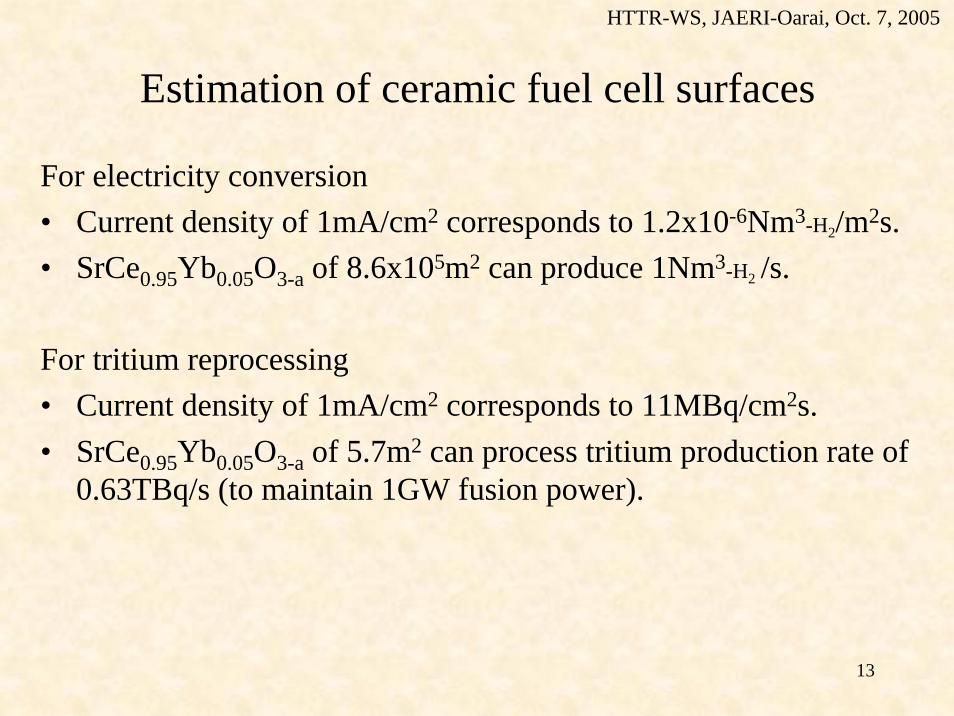
Estimation of ceramic fuel cell surfaces
For electricity conversion• Current density of 1mA/cm2 corresponds to 1.2x10⁻⁶Nm3-H2/m2s.• SrCe0.95Yb0.05O3-a of 8.6x10⁵m2 can produce 1Nm3-H2 /s.
For tritium reprocessing• Current density of 1mA/cm2 corresponds to 11MBq/cm2s.• SrCe0.95Yb0.05O3-a of 5.7m2 can process tritium production rate of
0.63TBq/s (to maintain 1GW fusion power).
HTTR-WS, JAERI-Oarai, Oct. 7, 2005
14
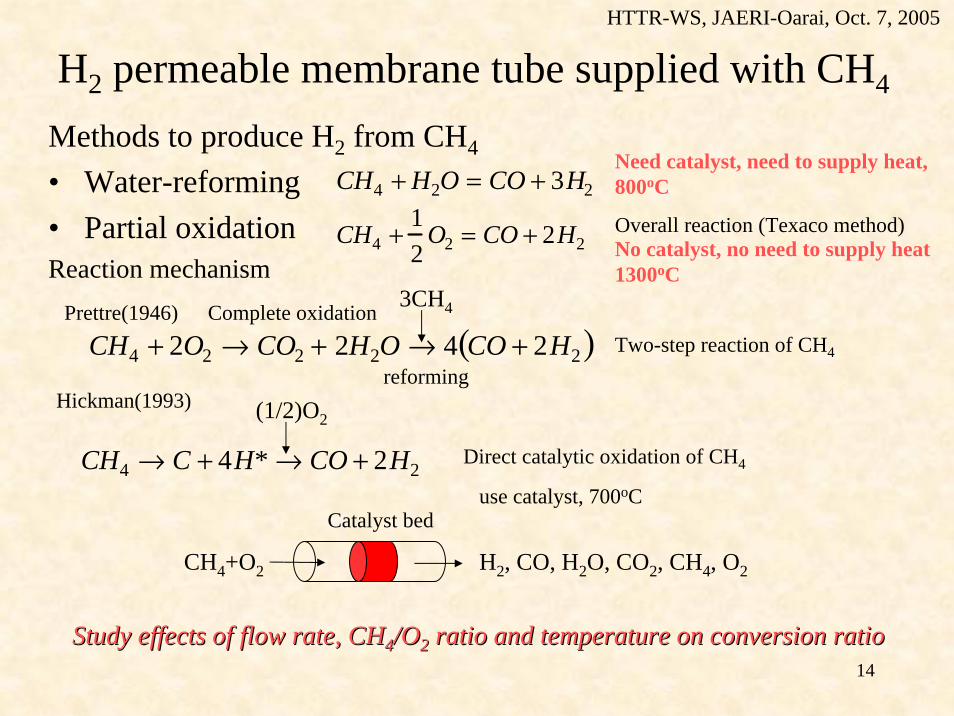
H2 permeable membrane tube supplied with CH4
Methods to produce H2 from CH4
• Water-reforming• Partial oxidationReaction mechanism
CH4 +12
O2 = CO + 2H2
CH4 + 2O2 → CO2 + 2H2O → 4 CO + 2H2( )3CH4Prettre(1946)
CH4 → C + 4H* → CO + 2H2
(1/2)O2
Complete oxidation
reformingHickman(1993)
Direct catalytic oxidation of CH4
Overall reaction (Texaco method)No catalyst, no need to supply heat 1300oC
use catalyst, 700oC
Two-step reaction of CH4
CH4+O2 H2, CO, H2O, CO2, CH4, O2
Catalyst bed
CH4 + H2O = CO + 3H2Need catalyst, need to supply heat, 800oC
Study effects of flow rate, CHStudy effects of flow rate, CH44/O/O22 ratio and temperature on conversion ratioratio and temperature on conversion ratio
HTTR-WS, JAERI-Oarai, Oct. 7, 2005

15
Permeable-membrane reactor
Experimental apparatus for CH4-O2 or CH4 decomposition
・ CH4 gas cylinder・ O2 gas cylinder・ H2 gas cylinder・ Ar gas cylinder・ mass flow controller・ pressure gauge・ thermocouple・ electric furnace・ molecular sieve 3A・ gas chromatograph・ flow meter・ needle valve・ Ni tube・Ni catalyst
・・
・
・
VENT
・・・
・
・
VENT
VENT
・
・・
・
・
・・
・
CH4+O2
Ar
HTTR-WS, JAERI-Oarai, Oct. 7, 2005

16
ΔG values of CH4 oxidation
Material balance of C, H, O
CH4 +12
O2 = CO + 2H2
CH 4 + 2O2 = CO2 + 2 H2 OCH4 + H2O = CO + 3H2
CH4 + CO2 = 2CO + 2H2
CO + H2O = CO2 + H2
CO +12
O2 = CO2
H2 +12
O2 = H2O
up CH4in = v pCO
out + pCO 2out + pCH4
out( )4 upCH 4
in = v 2 pH 2out + 2 pH 2O
out + 4 pCH4out( )
2upO2in = v 2 pCO2
out + pCOout +2 pO2
out + pH 2Oout( )
pCH4
in + pO2
in = pin
pCH4
out + pO2
out + pH 2
out + pH2Oout + pCO2
out + pCOout = pout
p out = pin + ΔP
CH4+O2H2, CO, H2O,
CO2, CH4, O2
Catalyst bed
、
η =vx
H2
out
2uxCH 4
in
conversion ratioFig. 3
(1)
(2)
u v
(3)(4)
(5)
(6)
(7)
H2 mole in product2CH4 mole in feed
=
HTTR-WS, JAERI-Oarai, Oct. 7, 2005

17
Hydrogen permeability through Ni and comparison with Pd
HTTR-WS, JAERI-Oarai, Oct. 7, 2005

18
Effects of temperature and contact time on outlet concentration
• CH4-to-H2 conversion was almost independent of contact time• T < 900K : CH4 → H2O and CO2
• T > 900K : CH4 → H2 and CO
0.7
0.6
0.5
0.4
0.3
0.2
0.1
0.0
x iout (i
=H2,
CO
2, C
O, C
H4,
O2,
H2O
)
12001000800600400
Temperature [K]
exp. cal.H2 CO CH4 O2 CO2 H2O
H2
CO
CH4
H2O
CO2
O2
xCH4
in=0.67, xO2
in=0.33, W=0.6sec-1
Fig. 4 Fig. 5
Inlet conditionInlet condition
Inlet conditionInlet condition
Conversion is very fast
HTTR-WS, JAERI-Oarai, Oct. 7, 2005

19
Fig. 8 CH4-to-H2 conversion ratio and CO selectivity as a function of total inlet pressure
Fig. 7 Fraction of permeated amount to H2 amount produced in Ni tube
Dependence of H2 permeation rate and CO selectivity on H2 pressure
HTTR-WS, JAERI-Oarai, Oct. 7, 2005
20
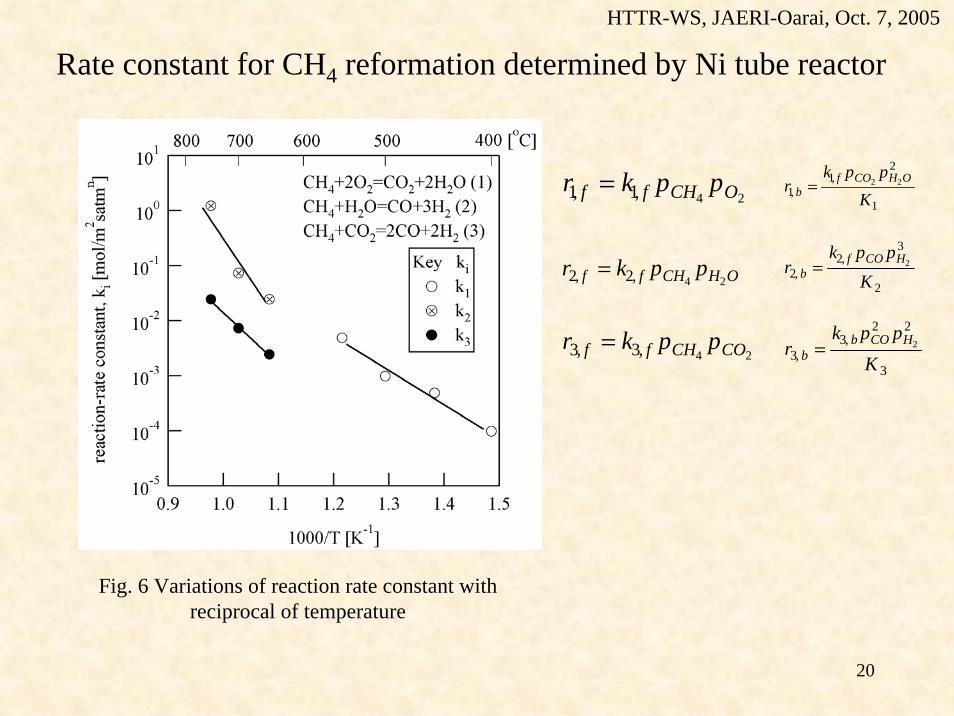
Fig. 6 Variations of reaction rate constant with reciprocal of temperature
r1, f = k1, f pCH4pO2
r2, f = k2, f pCH4pH2O
r3, f = k3, f pCH4pCO2
r1, b =k1, f pCO2
pH2O2
K1
r2, b =k2, f pCO pH2
3
K 2
r3, b =k3, b pCO
2 pH2
2
K 3
Rate constant for CH4 reformation determined by Ni tube reactorHTTR-WS, JAERI-Oarai, Oct. 7, 2005
21
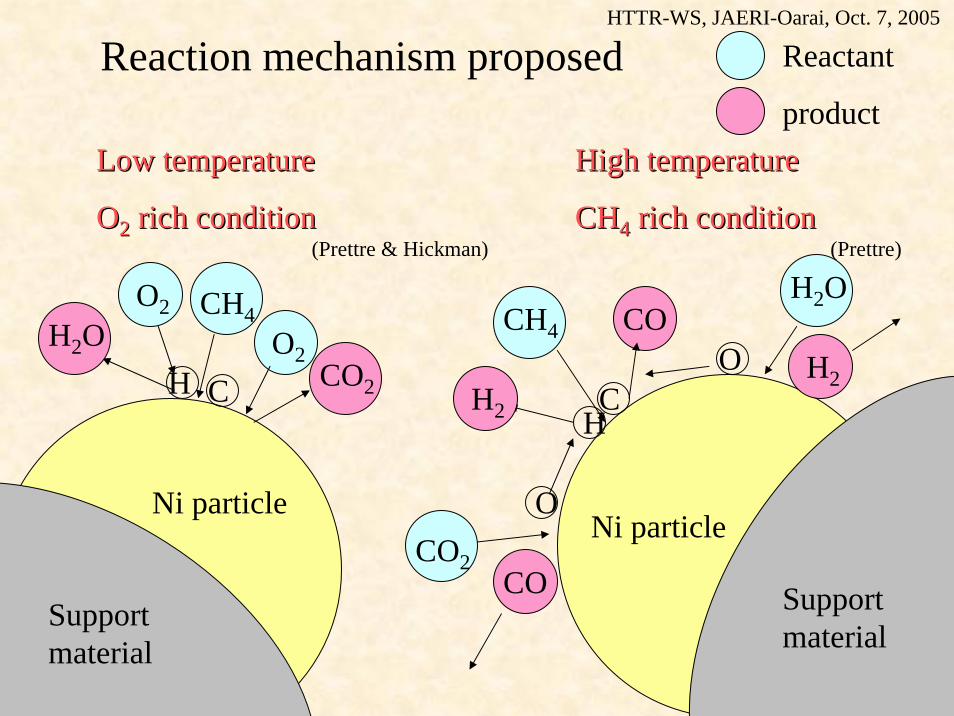
Reaction mechanism proposed
CO2CO
O
H2O
Ni particle
Support material
H2O
CH4
CH2
CO
H
Ni particle
CH4
Support material
C
High temperatureHigh temperature
CHCH44 rich conditionrich condition
Low temperatureLow temperature
OO22 rich conditionrich condition
CO2
O2
O2H2O
H
Reactant
product
HTTR-WS, JAERI-Oarai, Oct. 7, 2005
(Prettre & Hickman) (Prettre)

22
conclusions
• SrCe0.95Yb0.05O3-a ceramic could work as a fuel cell even without any external CH4 converter.
• Only the steam-reforming reaction occurred on the surface of Ni electrode under proper CH4/H2O concentration ratio.
• Some CH4 decomposed to H2 at the interface of Ni electrode and ceramic, because of high proton conductivity and comparatively low CH4-to-H2 conversion.
• The rate-determining step was CH4 reformation reaction on anode electrode.
• The proton conductivity was independent of H2O vapor pressure.
HTTR-WS, JAERI-Oarai, Oct. 7, 2005

23
Integrated hydrogen usage at higher temperature proposed here
• To utilize H2 with less heat loss while maintaining high temperature flow from HTGR• Each subsystems (production, purification of H2, heat pump and FC) to raise H2 usage were
experimented from a view of chemical engineering field.
Figure 1. H2 production using HTGR heat and high-temperature H2 usage system
HTGR800 - 900℃TH
TL
H2 production
Heat exchanger Heat exchanger
Heat input
Thermochemical water dissociation
Steam reforming or partial oxidation
Proposed hereProposed here
TM
Heat pump systemHeat pump systemHH22 StorageStorage
H2
H2, CO, CO2 600℃
H2 Supply
Alloy
Alloy
Heat output
H2 purification
Oxide FC
A
HTTR-WS, JAERI-Oarai, Oct. 7, 2005

24
Heat pump cycle operating at higher temperature proposed here
• Heat pump of LaNi5, TiMn1.5 or their derivative alloys were operated at room temperature
• ZrV2 has one of the largest ΔH among all alloys. • H2 equilibrium pressure of Zr(V1-xFex)2 depends on x.• Two types Zr(V1-xFex)2 alloys are selected.• PCT curves were presented in JAC, 375 (2004) 305JAC, 375 (2004) 305
1/TM1/TH 1/TL
H2
H2
Log
P
Ma→ MaHX MbHX→ Mb
heat supply
heat supply
heat extract
heat extract
昇温ヒートポンプサイクル作動図
MaHX→ Ma
Mb→ MbHX
10-10
10-8
10-6
10-4
10-2
100
102
p H2 [a
tom
]
1.00.80.60.40.20.0
x [Zr(V1-XFeX)2]
-250
-200
-150
-100
-50
0
Enth
aly
chan
ge [k
J/m
ol]
pH2
ΔH
HTGR
H2 production plantH2
600oC(power generation)
900℃900oC(He gas coolant)
Chemical heat pump
TM
TL
H2TM
600oC
250oC〜
TH
②
①
③
④MbH2=Mb+H2
Fig. 7 Heat pump cycle diagram
Ma+H2=MaH2
Fig. 6 Heat pump cycle and High-Temperature Gas-cooled nuclear Reactor
Fig. 8 Relation between pH2 and x in Zr(V1-XFeX)
HTTR-WS, JAERI-Oarai, Oct. 7, 2005
25
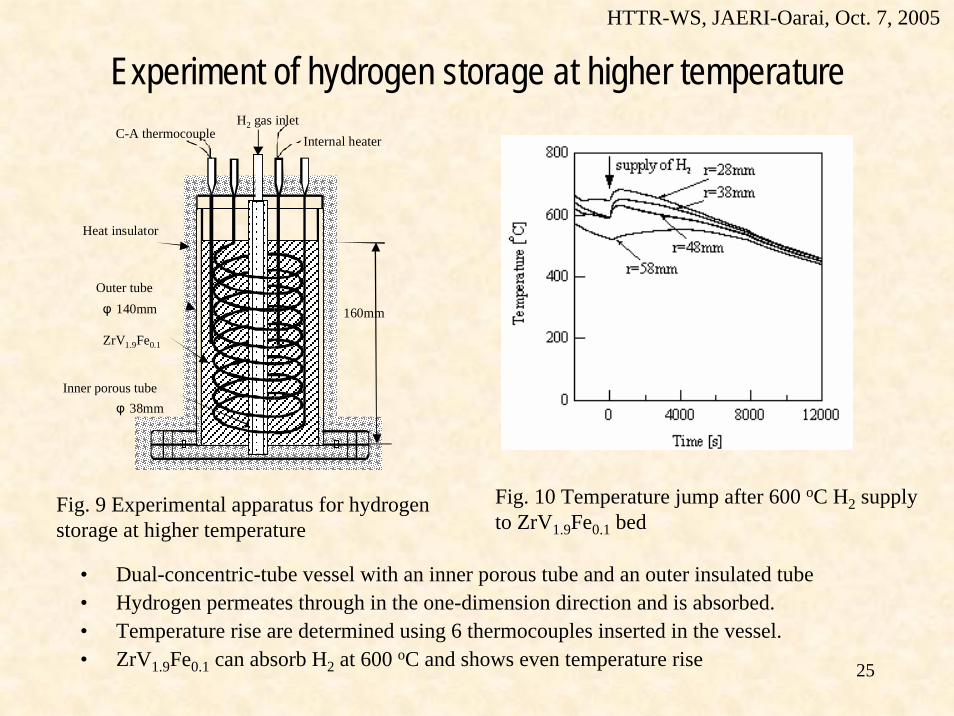
Experiment of hydrogen storage at higher temperature
• Dual-concentric-tube vessel with an inner porous tube and an outer insulated tube• Hydrogen permeates through in the one-dimension direction and is absorbed.• Temperature rise are determined using 6 thermocouples inserted in the vessel.• ZrV1.9Fe0.1 can absorb H2 at 600 oC and shows even temperature rise
C-A thermocouple
φ 38mm
ZrV1.9Fe0.1
Internal heaterH2 gas inlet
160mm
Heat insulator
Inner porous tube
Outer tubeφ 140mm
Fig. 9 Experimental apparatus for hydrogen storage at higher temperature
Fig. 10 Temperature jump after 600 oC H2 supply to ZrV1.9Fe0.1 bed
HTTR-WS, JAERI-Oarai, Oct. 7, 2005
26
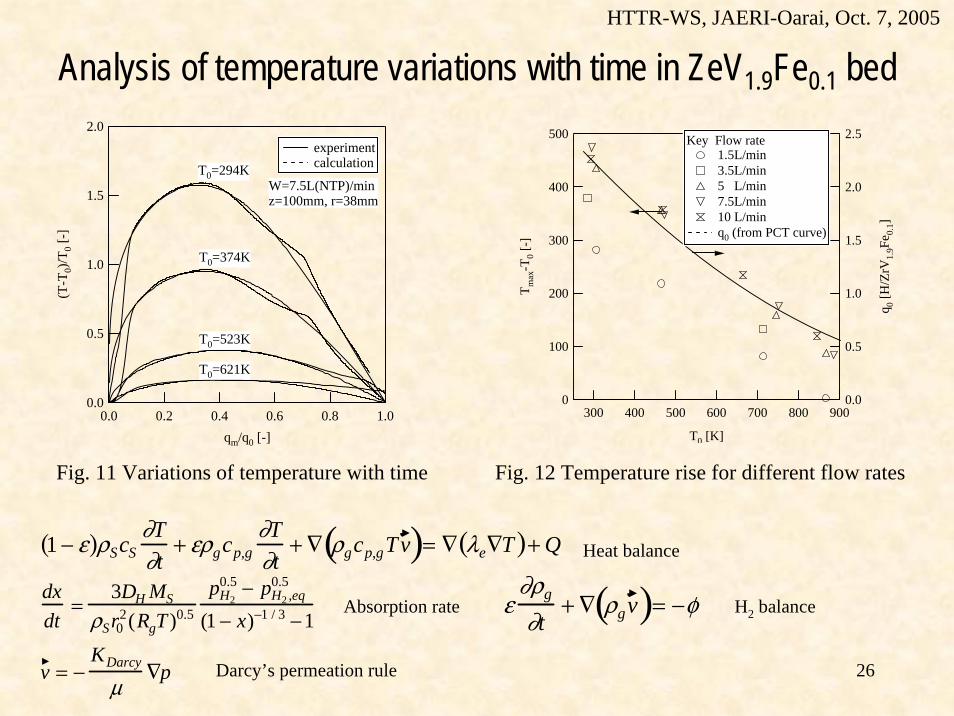
Analysis of temperature variations with time in ZeV1.9Fe0.1 bed2.0
1.5
1.0
0.5
0.0
(T-T
0)/T
0 [-]
1.00.80.60.40.20.0qm/q0 [-]
experiment calculationT0=294K
T0=374K
T0=523K
T0=621K
W=7.5L(NTP)/minz=100mm, r=38mm
500
400
300
200
100
0
T max
-T0 [
-]
900800700600500400300
T0 [K]
2.5
2.0
1.5
1.0
0.5
0.0
q 0 [H
/ZrV
1.9F
e 0.1]
Key Flow rate 1.5L/min 3.5L/min 5 L/min 7.5L/min 10 L/min q0 (from PCT curve)
Fig. 11 Variations of temperature with time Fig. 12 Temperature rise for different flow rates
1 − ε( )ρScS∂T∂t
+ ερgcp,g∂T∂t
+ ∇ ρgcp,gTv( )= ∇ λe∇T( )+ Q
dxdt
=3DH MS
ρSr02(RgT )0.5
pH2
0.5 − pH2 ,eq0.5
(1 − x)−1 / 3 −1
v = −KDarcy
μ∇p
ε∂ρg
∂t+ ∇ ρgv( )= −φ
Heat balance
Absorption rate H2 balance
Darcy’s permeation rule
HTTR-WS, JAERI-Oarai, Oct. 7, 2005
27
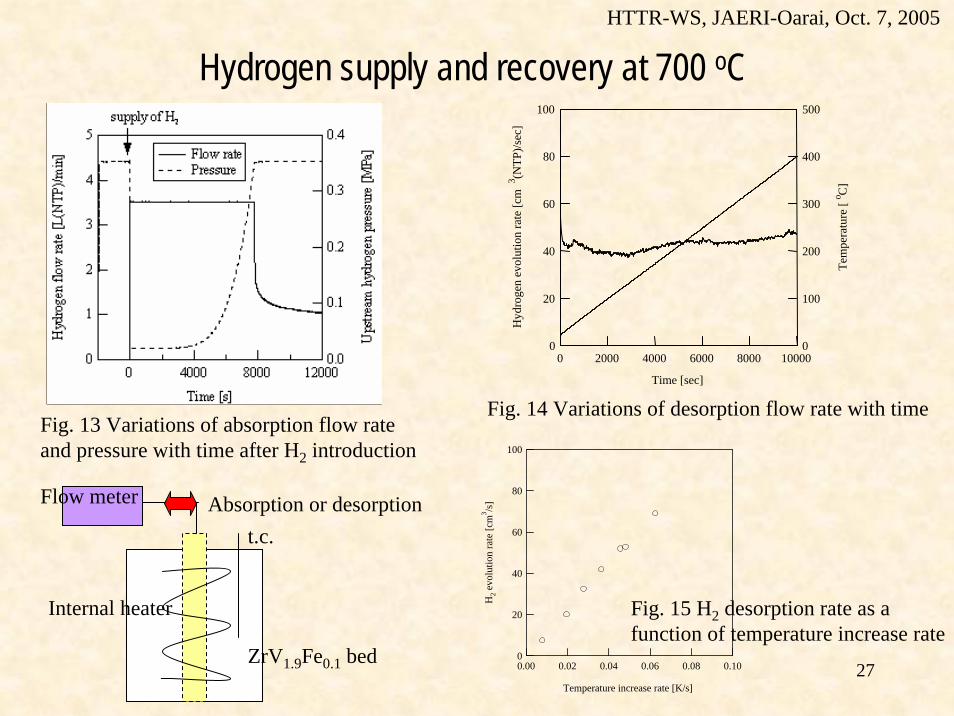
Hydrogen supply and recovery at 700 oC
Fig. 13 Variations of absorption flow rate and pressure with time after H2 introduction
Fig. 14 Variations of desorption flow rate with time
100
80
60
40
20
0
H2 e
volu
tion
rate
[cm
3 /s]
0.100.080.060.040.020.00
Temperature increase rate [K/s]
Fig. 15 H2 desorption rate as a function of temperature increase rate
Flow meter Absorption or desorption
ZrV1.9Fe0.1 bed
t.c.
Internal heater
HTTR-WS, JAERI-Oarai, Oct. 7, 2005
100
80
60
40
20
0
Hyd
roge
n ev
olut
ion
rate
[cm
3 (NTP
)/sec
]
1000080006000400020000
Time [sec]
500
400
300
200
100
0
Tem
pera
ture
[o C
]