Embed Size (px)
Citation preview
nature | methods
Direct detection of DNA methylation during single-molecule, real-time sequencing
Benjamin A Flusberg, Dale Webster, Jessa Lee, Kevin Travers, Eric Olivares, Tyson A Clark,
Jonas Korlach & Stephen W Turner
Supplementary figures and text:
Supplementary Figure 1
Pulse width ratios for mC and hmC
Supplementary Figure 2
Restriction digest of dam+ and WGA fosmid samples
Supplementary Figure 3
IPD histograms at fosmid GATC positions
Supplementary Figure 4
Fosmid IPD ratios grouped by GC-content
Supplementary Figure 5
Sequence context dependence of IPDs in fosmid
samples
Supplementary Figure 6
IPD ratios at an mC cluster
Supplementary Table 1 Principal component analysis weightings
Supplementary Note 1 Sequences of synthetic DNA templates
Note: Supplementary Data is available on the Nature Methods website.
Nature Methods: doi:10.1038/nmeth.1459
0 10 20 30 40 50 60 70 80 90
0.7
0.8
0.9
1.0
1.1
1.2
1.3
1.4
0 10 20 30 40 50 60 70 80 90
0.7
0.8
0.9
1.0
1.1
1.2
1.3
1.4
Template Position
Puls
e w
idth
ratio
5-hydroxymethylcytosine
Template Position
Puls
e w
idth
ratio
5-methylcytosine
a
b
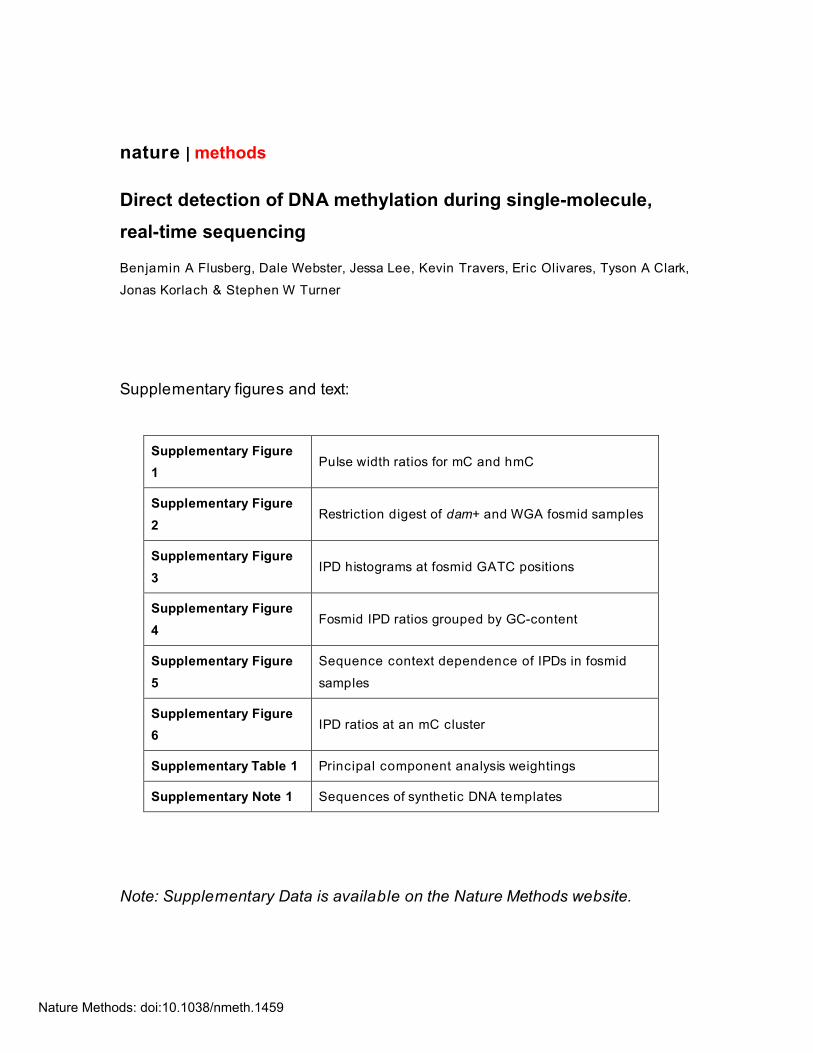
Supplementary Figure 1: Pulse width ratios for mC and hmC
Supplementary Figure 1: Pulse width ratios for (a) mC (b) hmC. Both panels show the ratio of
the average PW in the methylated template to the average PW in the control template, plotted
versus DNA template position. In the region shown, the two templates are identical except at the
two positions marked by triangles. These positions of differential methylation are (a) 55 and 74
(mC), and (b) 51 and 74 (hmC).
Nature Methods: doi:10.1038/nmeth.1459
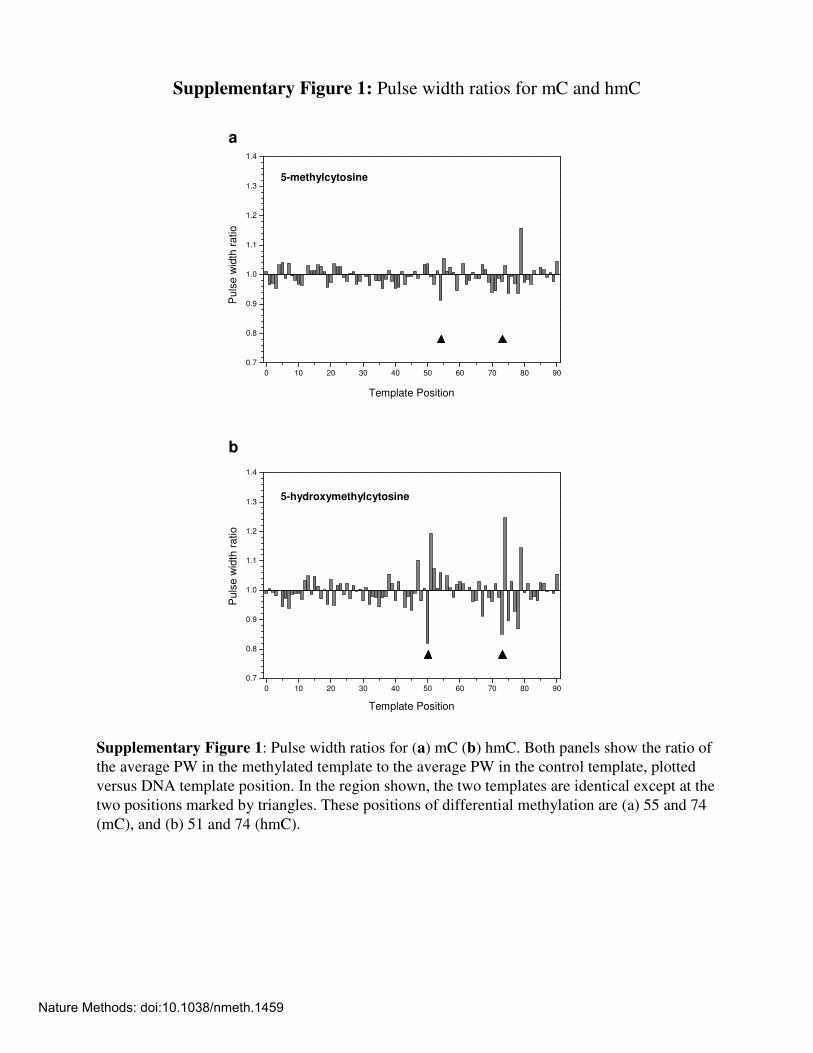
Supplementary Figure 2: Restriction digest of dam+ and WGA fosmid samples
Supplementary Figure 2: GATC adenosine methylation of unamplified and WGA-
amplified fosmid samples. To estimate bulk levels of adenosine methylation, DNA
samples were digested with a series of restriction enzymes: DpnI (cleaves only
methylated GATC), MboI (cleaves only unmethylated GATC), and Sau3AI (insensitive
to methylation state). Digested DNAs were separated on 1.2% TAE agarose gel alongside
appropriate size markers (1kb Plus Ladder, Invitrogen, Carlsbad, CA) and uncut DNA.
The unamplified fosmid shows virtually complete cleavage by DpnI and almost no
cleavage by MboI, supporting the assertion that a very high fraction of GATC sites are
methylated in this sample. Conversely, the WGA-amplified fosmid DNA does not show
appreciable cleavage by DpnI, while MboI produces the same banding pattern as the
Sau3AI control.
Nature Methods: doi:10.1038/nmeth.1459
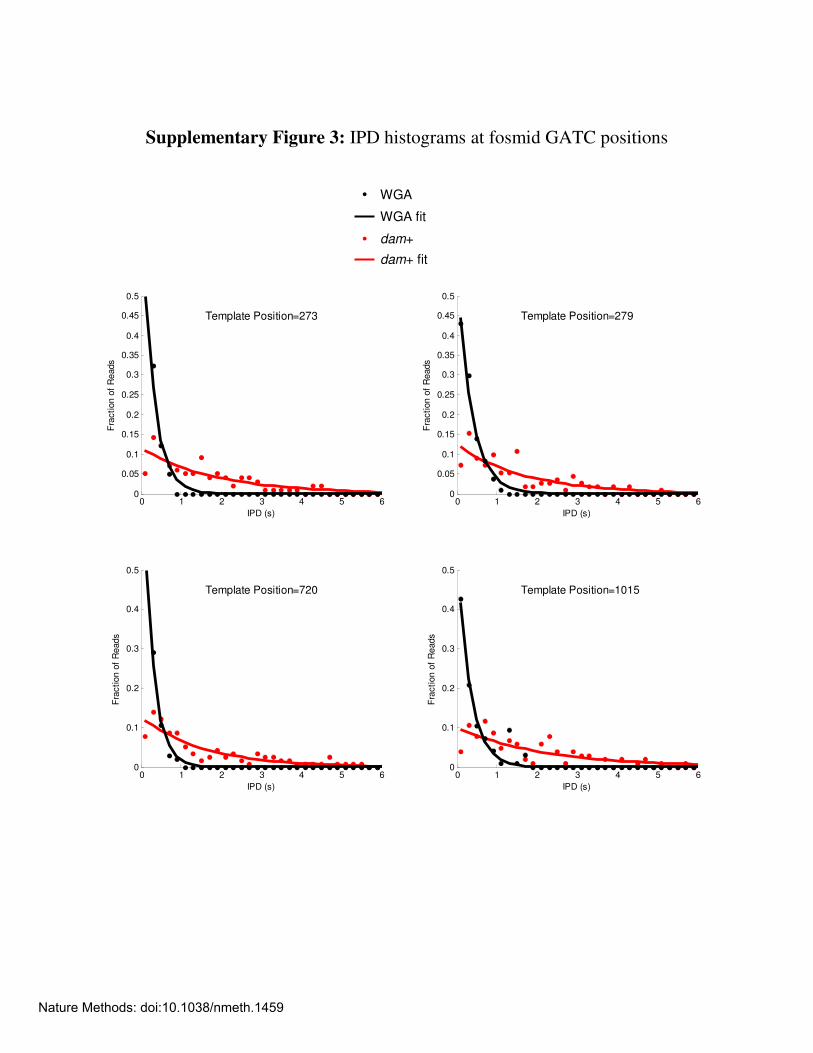
Supplementary Figure 3: IPD histograms at fosmid GATC positions
0 1 2 3 4 5 60
0.05
0.1
0.15
0.2
0.25
0.3
0.35
0.4
0.45
0.5
IPD (s)
Fra
ction o
f R
eads
Template Position=273
0 1 2 3 4 5 60
0.05
0.1
0.15
0.2
0.25
0.3
0.35
0.4
0.45
0.5
IPD (s)
Fra
ction o
f R
eads
Template Position=279
0 1 2 3 4 5 60
0.1
0.2
0.3
0.4
0.5
IPD (s)
Fra
ction o
f R
eads
Template Position=720
0 1 2 3 4 5 60
0.1
0.2
0.3
0.4
0.5
IPD (s)
Fra
ction o
f R
eads
Template Position=1015
WGA
WGA fit
dam+
dam+ fit
Nature Methods: doi:10.1038/nmeth.1459
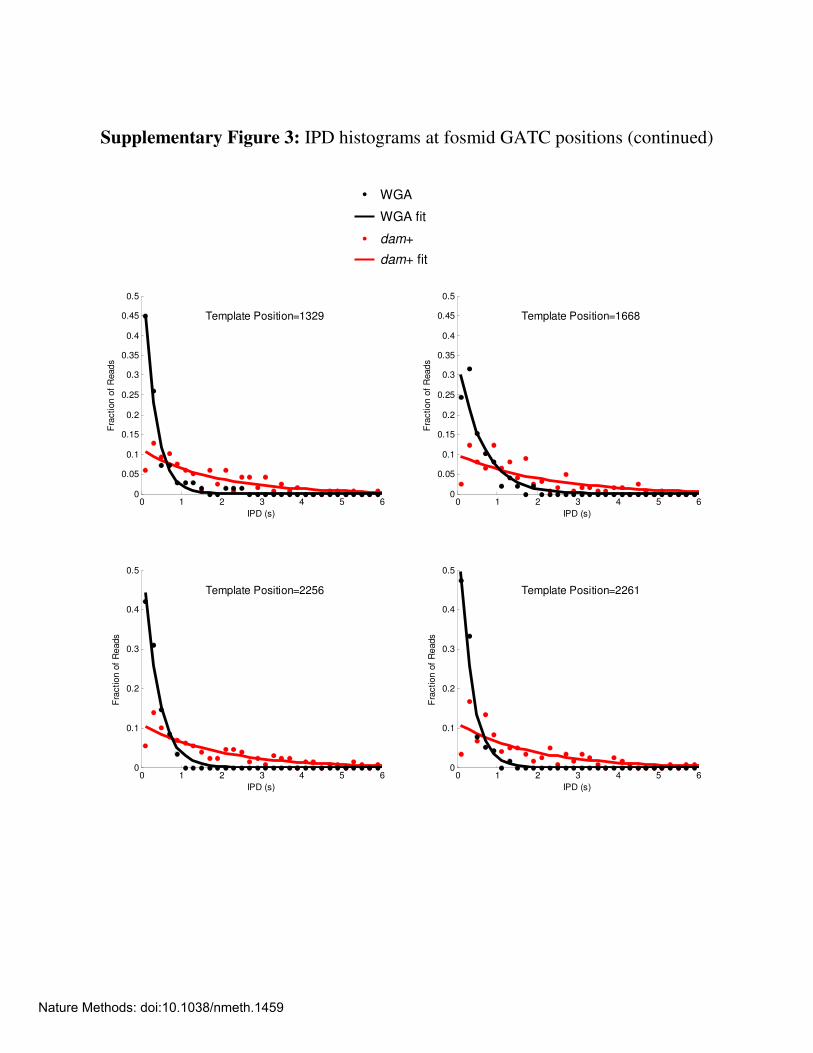
Supplementary Figure 3: IPD histograms at fosmid GATC positions (continued)
0 1 2 3 4 5 60
0.05
0.1
0.15
0.2
0.25
0.3
0.35
0.4
0.45
0.5
IPD (s)
Fra
ction o
f R
eads
Template Position=1329
0 1 2 3 4 5 60
0.05
0.1
0.15
0.2
0.25
0.3
0.35
0.4
0.45
0.5
IPD (s)
Fra
ction o
f R
eads
Template Position=1668
0 1 2 3 4 5 60
0.1
0.2
0.3
0.4
0.5
IPD (s)
Fra
ction o
f R
eads
Template Position=2256
0 1 2 3 4 5 60
0.1
0.2
0.3
0.4
0.5
IPD (s)
Fra
ction o
f R
eads
Template Position=2261
WGA
WGA fit
dam+
dam+ fit
Nature Methods: doi:10.1038/nmeth.1459
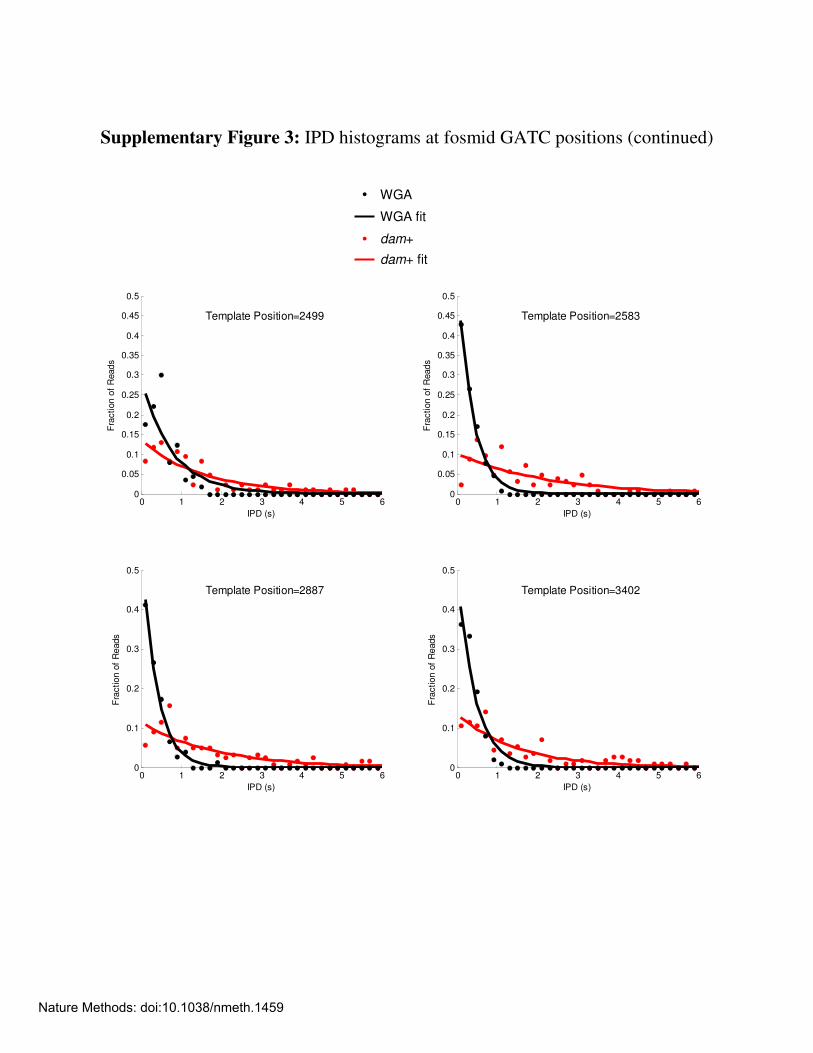
Supplementary Figure 3: IPD histograms at fosmid GATC positions (continued)
0 1 2 3 4 5 60
0.05
0.1
0.15
0.2
0.25
0.3
0.35
0.4
0.45
0.5
IPD (s)
Fra
ction o
f R
eads
Template Position=2499
0 1 2 3 4 5 60
0.05
0.1
0.15
0.2
0.25
0.3
0.35
0.4
0.45
0.5
IPD (s)
Fra
ction o
f R
eads
Template Position=2583
0 1 2 3 4 5 60
0.1
0.2
0.3
0.4
0.5
IPD (s)
Fra
ction o
f R
eads
Template Position=2887
0 1 2 3 4 5 60
0.1
0.2
0.3
0.4
0.5
IPD (s)
Fra
ction o
f R
eads
Template Position=3402
WGA
WGA fit
dam+
dam+ fit
Nature Methods: doi:10.1038/nmeth.1459
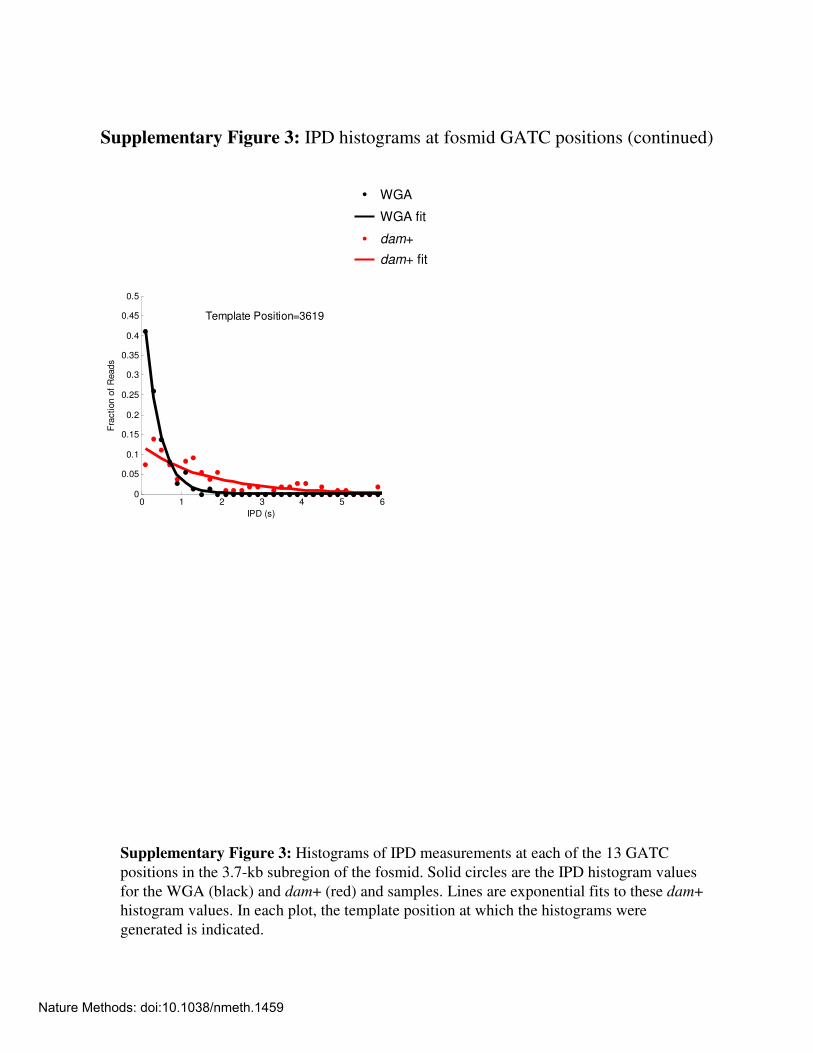
Supplementary Figure 3: Histograms of IPD measurements at each of the 13 GATC
positions in the 3.7-kb subregion of the fosmid. Solid circles are the IPD histogram values
for the WGA (black) and dam+ (red) and samples. Lines are exponential fits to these dam+
histogram values. In each plot, the template position at which the histograms were
generated is indicated.
Supplementary Figure 3: IPD histograms at fosmid GATC positions (continued)
0 1 2 3 4 5 60
0.05
0.1
0.15
0.2
0.25
0.3
0.35
0.4
0.45
0.5
IPD (s)
Fra
ction o
f R
eads
Template Position=3619
WGA
WGA fit
dam+
dam+ fit
Nature Methods: doi:10.1038/nmeth.1459
Low GC Medium GC High GC
IPD
Ratio
0
1
2
3
4
5
6
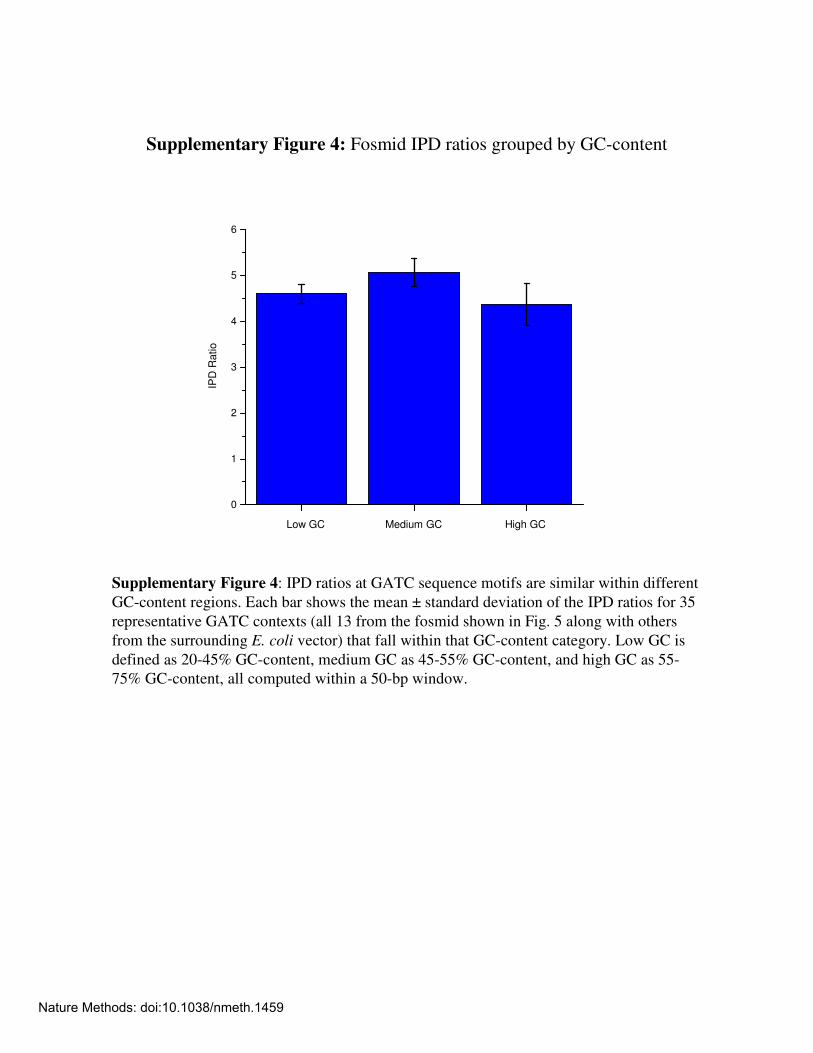
Supplementary Figure 4: Fosmid IPD ratios grouped by GC-content
Supplementary Figure 4: IPD ratios at GATC sequence motifs are similar within different
GC-content regions. Each bar shows the mean ± standard deviation of the IPD ratios for 35
representative GATC contexts (all 13 from the fosmid shown in Fig. 5 along with others
from the surrounding E. coli vector) that fall within that GC-content category. Low GC is
defined as 20-45% GC-content, medium GC as 45-55% GC-content, and high GC as 55-
75% GC-content, all computed within a 50-bp window.
Nature Methods: doi:10.1038/nmeth.1459
AA
AC
AG
AT
CA
CC
CG
CT
GA
GC
GG
GT
TA
TC
TG
TT
AA AC AG AT CA CC CG CT GA GC GG GT TA TC TG TT AA AC AG AT CA CC CG CT GA GC GG GT TA TC TG TT
Downstream Context
Upstr
eam
Conte
xt
dam+ WGA
Mean IPD (s)
0.0
0.5
1.0
1.5
2.0
a
b
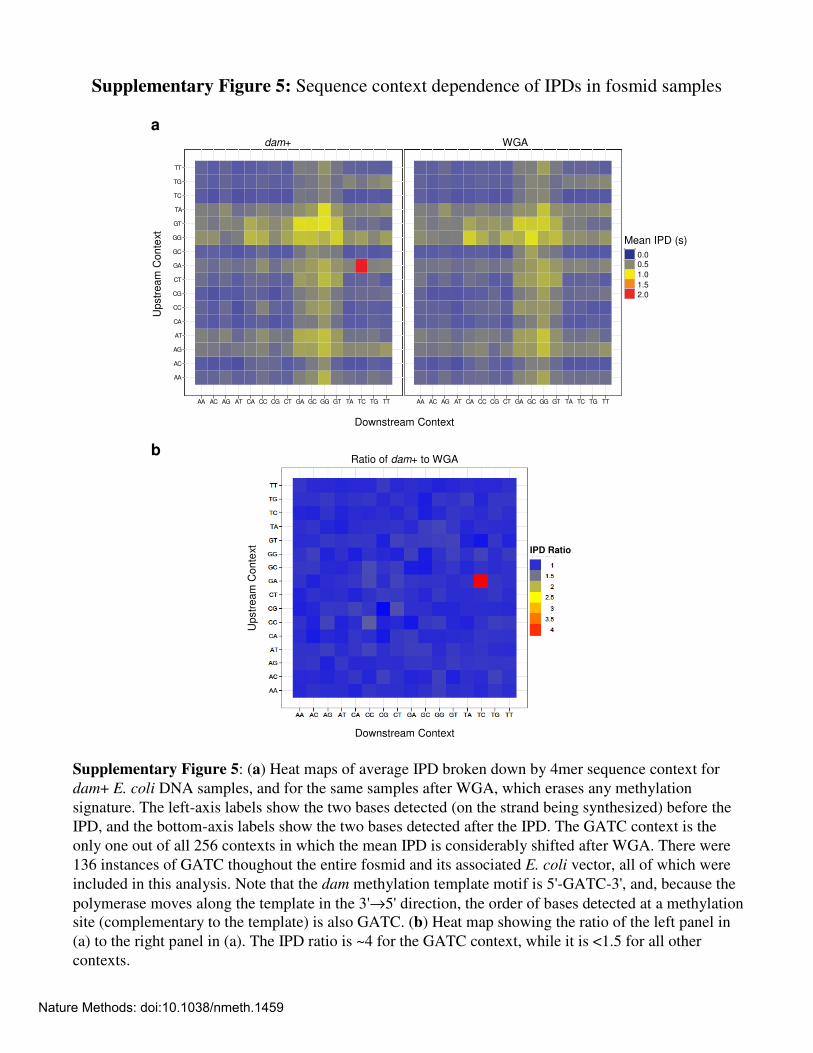
Supplementary Figure 5: Sequence context dependence of IPDs in fosmid samples
IPD Ratio
Upstr
eam
Conte
xt
Downstream Context
Ratio of dam+ to WGA
Supplementary Figure 5: (a) Heat maps of average IPD broken down by 4mer sequence context for
dam+ E. coli DNA samples, and for the same samples after WGA, which erases any methylation
signature. The left-axis labels show the two bases detected (on the strand being synthesized) before the
IPD, and the bottom-axis labels show the two bases detected after the IPD. The GATC context is the
only one out of all 256 contexts in which the mean IPD is considerably shifted after WGA. There were
136 instances of GATC thoughout the entire fosmid and its associated E. coli vector, all of which were
included in this analysis. Note that the dam methylation template motif is 5'-GATC-3', and, because the
polymerase moves along the template in the 3'→5' direction, the order of bases detected at a methylation
site (complementary to the template) is also GATC. (b) Heat map showing the ratio of the left panel in
(a) to the right panel in (a). The IPD ratio is ~4 for the GATC context, while it is <1.5 for all other
contexts.
Nature Methods: doi:10.1038/nmeth.1459
0 10 20 30 40 50 60 70 80 90
0.5
1.0
1.5
2.0
2.5
3.0
3.5
Template Position
IPD
Ratio
5-methylcytosine
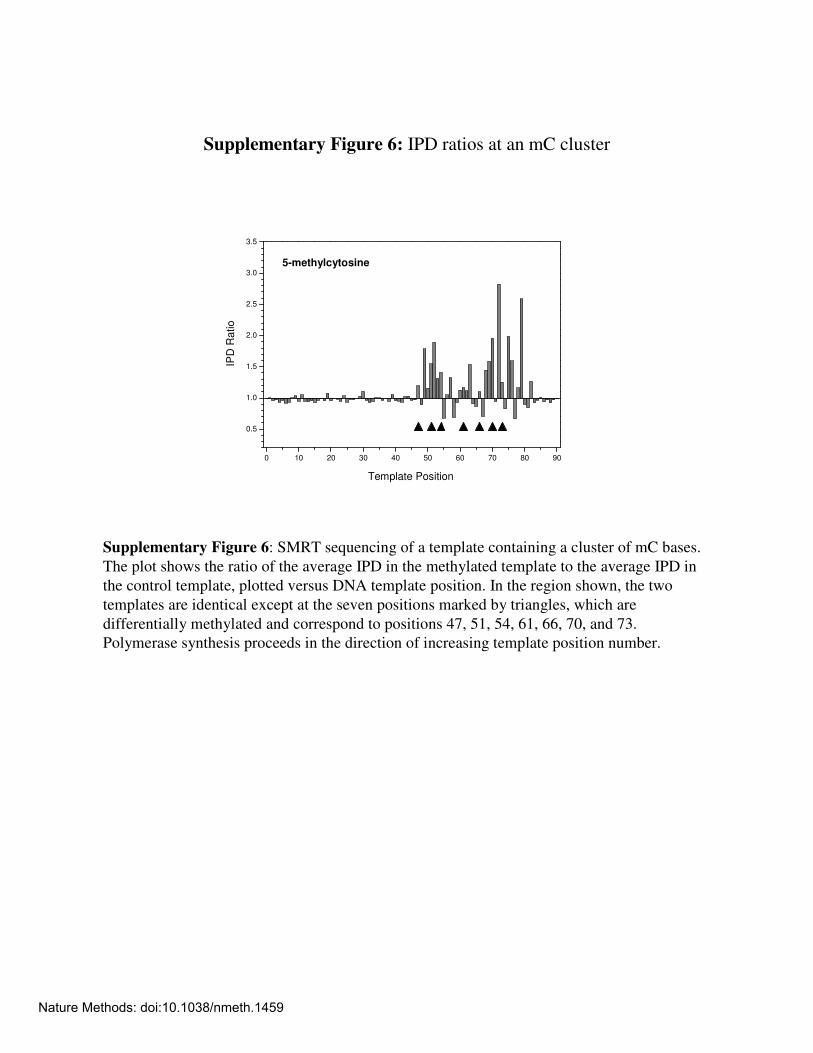
Supplementary Figure 6: IPD ratios at an mC cluster
Supplementary Figure 6: SMRT sequencing of a template containing a cluster of mC bases.
The plot shows the ratio of the average IPD in the methylated template to the average IPD in
the control template, plotted versus DNA template position. In the region shown, the two
templates are identical except at the seven positions marked by triangles, which are
differentially methylated and correspond to positions 47, 51, 54, 61, 66, 70, and 73.
Polymerase synthesis proceeds in the direction of increasing template position number.
Nature Methods: doi:10.1038/nmeth.1459
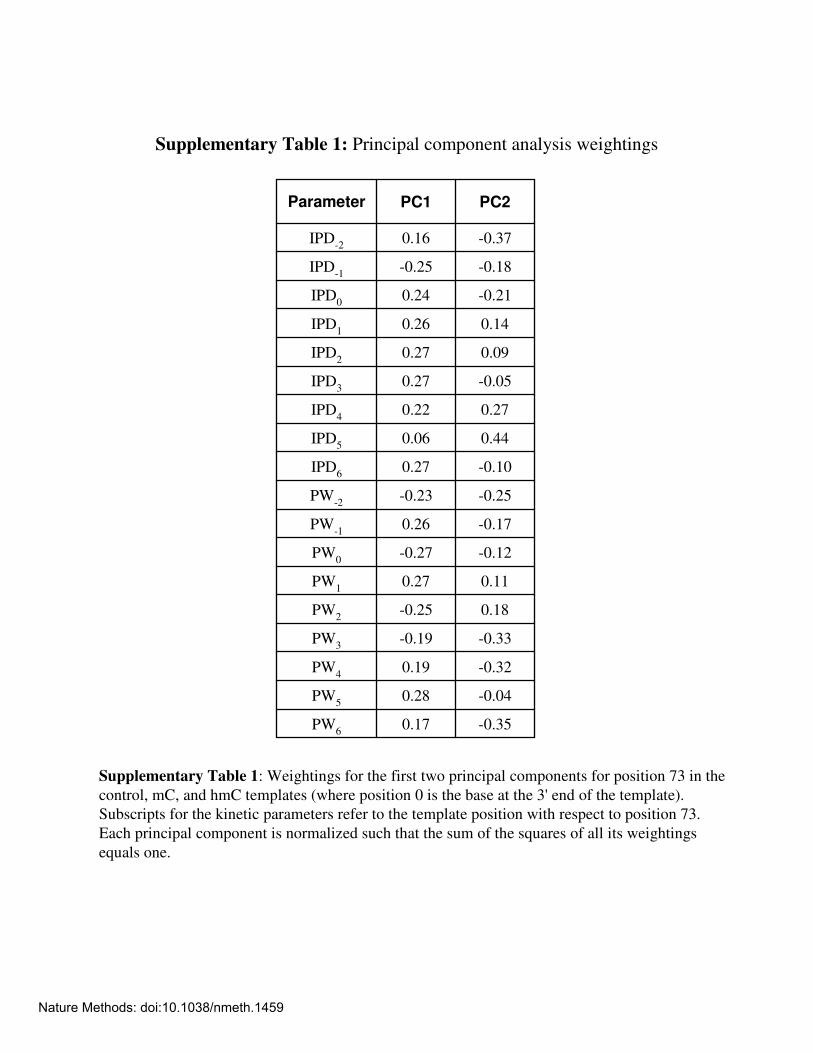
Supplementary Table 1: Principal component analysis weightings
Supplementary Table 1: Weightings for the first two principal components for position 73 in the
control, mC, and hmC templates (where position 0 is the base at the 3' end of the template).
Subscripts for the kinetic parameters refer to the template position with respect to position 73.
Each principal component is normalized such that the sum of the squares of all its weightings
equals one.
-0.350.17PW6
-0.040.28PW5
-0.320.19PW4
-0.33-0.19PW3
0.18-0.25PW2
0.110.27PW1
-0.12-0.27PW0
-0.170.26PW-1
-0.25-0.23PW-2
-0.100.27IPD6
0.440.06IPD5
0.270.22IPD4
-0.050.27IPD3
0.090.27IPD2
0.140.26IPD1
-0.210.24IPD0
-0.18-0.25IPD-1
-0.370.16IPD-2
PC2PC1Parameter
Nature Methods: doi:10.1038/nmeth.1459
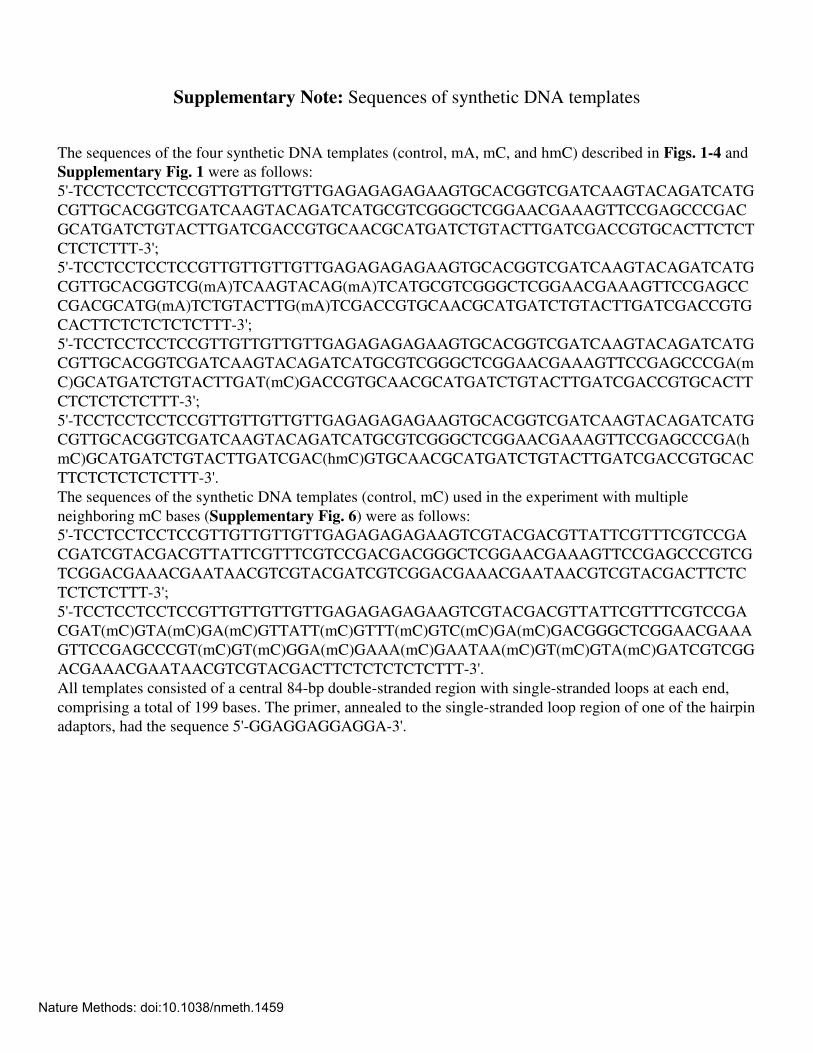
Supplementary Note: Sequences of synthetic DNA templates
The sequences of the four synthetic DNA templates (control, mA, mC, and hmC) described in Figs. 1-4 and
Supplementary Fig. 1 were as follows:
5'-TCCTCCTCCTCCGTTGTTGTTGTTGAGAGAGAGAAGTGCACGGTCGATCAAGTACAGATCATG
CGTTGCACGGTCGATCAAGTACAGATCATGCGTCGGGCTCGGAACGAAAGTTCCGAGCCCGAC
GCATGATCTGTACTTGATCGACCGTGCAACGCATGATCTGTACTTGATCGACCGTGCACTTCTCT
CTCTCTTT-3';
5'-TCCTCCTCCTCCGTTGTTGTTGTTGAGAGAGAGAAGTGCACGGTCGATCAAGTACAGATCATG
CGTTGCACGGTCG(mA)TCAAGTACAG(mA)TCATGCGTCGGGCTCGGAACGAAAGTTCCGAGCC
CGACGCATG(mA)TCTGTACTTG(mA)TCGACCGTGCAACGCATGATCTGTACTTGATCGACCGTG
CACTTCTCTCTCTCTTT-3';
5'-TCCTCCTCCTCCGTTGTTGTTGTTGAGAGAGAGAAGTGCACGGTCGATCAAGTACAGATCATG
CGTTGCACGGTCGATCAAGTACAGATCATGCGTCGGGCTCGGAACGAAAGTTCCGAGCCCGA(m
C)GCATGATCTGTACTTGAT(mC)GACCGTGCAACGCATGATCTGTACTTGATCGACCGTGCACTT
CTCTCTCTCTTT-3';
5'-TCCTCCTCCTCCGTTGTTGTTGTTGAGAGAGAGAAGTGCACGGTCGATCAAGTACAGATCATG
CGTTGCACGGTCGATCAAGTACAGATCATGCGTCGGGCTCGGAACGAAAGTTCCGAGCCCGA(h
mC)GCATGATCTGTACTTGATCGAC(hmC)GTGCAACGCATGATCTGTACTTGATCGACCGTGCAC
TTCTCTCTCTCTTT-3'.
The sequences of the synthetic DNA templates (control, mC) used in the experiment with multiple
neighboring mC bases (Supplementary Fig. 6) were as follows:
5'-TCCTCCTCCTCCGTTGTTGTTGTTGAGAGAGAGAAGTCGTACGACGTTATTCGTTTCGTCCGA
CGATCGTACGACGTTATTCGTTTCGTCCGACGACGGGCTCGGAACGAAAGTTCCGAGCCCGTCG
TCGGACGAAACGAATAACGTCGTACGATCGTCGGACGAAACGAATAACGTCGTACGACTTCTC
TCTCTCTTT-3';
5'-TCCTCCTCCTCCGTTGTTGTTGTTGAGAGAGAGAAGTCGTACGACGTTATTCGTTTCGTCCGA
CGAT(mC)GTA(mC)GA(mC)GTTATT(mC)GTTT(mC)GTC(mC)GA(mC)GACGGGCTCGGAACGAAA
GTTCCGAGCCCGT(mC)GT(mC)GGA(mC)GAAA(mC)GAATAA(mC)GT(mC)GTA(mC)GATCGTCGG
ACGAAACGAATAACGTCGTACGACTTCTCTCTCTCTTT-3'.
All templates consisted of a central 84-bp double-stranded region with single-stranded loops at each end,
comprising a total of 199 bases. The primer, annealed to the single-stranded loop region of one of the hairpin
adaptors, had the sequence 5'-GGAGGAGGAGGA-3'.
Nature Methods: doi:10.1038/nmeth.1459