Embed Size (px)
Citation preview

Nutrition Assistance Program Report Series The Office of Policy Support
Special Nutrition Programs Report No. CN-13-DC
Direct Certification in the National
School Lunch Program:
State Implementation Progress,
School Year 2012–2013
Report to Congress
November 2013

USDA is an Equal Opportunity Provider.

November 2013
Special Nutrition Programs
Report Number: CN-13-DC
Direct Certification in the National School Lunch Program:
State Implementation Progress, School Year 2012–2013
Report to Congress
Authors:
Quinn Moore
Kevin Conway
Brandon Kyler
Andrew Gothro
Submitted by: Submitted to:
Mathematica Policy Research Office of Policy Support
P.O. Box 2393 USDA Food and Nutrition Service
Princeton, NJ 08543-2393 3101 Park Center Dr., Room 1014
Telephone: (609) 799-3535 Alexandria, VA 22302-1500
Facsimile: (609) 799-0005
Project Director: Project Officer: Kevin Conway Dennis Ranalli
This study was conducted under GSA Contract AG AG-3198-B-10-0013, task order AG-3198-K-13-0013 with the
Food and Nutrition Service.
This report is available on the Food and Nutrition Service website: http://www.fns.usda.gov/research-and-analysis
Suggested Citation:
U.S. Department of Agriculture, Food and Nutrition Service, Office of Policy Support, Direct Certification in the
National Lunch Program: State Implementation Progress, School Year 2012–2013 by Quinn Moore, Kevin
Conway, Brandon Kyler, and Andrew Gothro. Project Officer Dennis Ranalli. Report CN-13-DC. Alexandria, VA:
November 2013.

Mathematica Policy Research
iv
ABSTRACT
This report responds to the legislative requirement of the Food, Conservation, and Energy Act of 2008 (P.L.110-246) to assess the effectiveness of State and local efforts to directly certify children for free school meals under the National School Lunch Program (NSLP). Direct certification is a process conducted by the States and by local educational agencies (LEAs) to certify certain children for free school meals without the need for household applications. The Child Nutrition and WIC Reauthorization Act of 2004 required all LEAs to establish, by school year (SY) 2008–2009, a system of direct certification of children from households that receive Supplemental Nutrition Assistance Program (SNAP) benefits. The mandate was phased in over three years. The largest LEAs were required to establish direct certification systems by SY 2006–2007; all were required to directly certify SNAP participants by SY 2008–2009. The Healthy, Hunger-Free Kids Act of 2010 (HHFKA) requires that States meet certain direct certification performance targets. For SY 2012–2013, States that fail to achieve a direct certification rate of at least 90 percent are required to develop and implement continuous improvement plans (CIPs). The performance target increases to 95 percent for SY 2013–2014 and beyond.
Ninety-one percent of LEAs that participate in the NSLP directly certified some SNAP participants in SY 2012–2013. These LEAs enroll 99 percent of all students in schools that participate in the NSLP. This is an increase from SY 2004–2005, when 56 percent of LEAs, enrolling 77 percent of all students in NSLP schools, directly certified some SNAP-participant students.
The number of school-age SNAP participants directly certified for free school meals was 12.3 million for SY 2012–2013, an increase of 6 percent from SY 2011–2012. Analysis in this report estimates that 89 percent of children in SNAP households were directly certified for free school meals, which is 3 percentage points higher than last year’s rate of 86 percent. Twenty-four States achieved the HHFKA-mandated performance target of 90 percent, and 16 States achieved direct certification rates of at least 95 percent. Only one State had a direct certification rate lower than 60 percent.

Mathematica Policy Research
v
CONTENTS
ABSTRACT ....................................................................................................................................................... iv
GLOSSARY OF ACRONYMS AND ABBREVIATIONS ..................................................................... ix
EXECUTIVE SUMMARY....................................................................................................................... ES-1
DIRECT CERTIFICATION IN THE NATIONAL SCHOOL LUNCH PROGRAM: STATE IMPLEMENTATION PROGRESS, SCHOOL YEAR 2012–2013 ..................... 1
I INTRODUCTION ........................................................................................................................ 1
A. Eligibility Determination Through Application ................................................................. 1
B. Eligibility Determination Through Direct Certification ................................................... 2
C. Purpose of This Report ......................................................................................................... 2
II HISTORY OF DIRECT CERTIFICATION ........................................................................... 3
III CURRENT STATUS OF DIRECT CERTIFICATION SYSTEMS .................................... 4
A. Characteristics of LEAs That Did Not Directly Certify Any SNAP Children .................................................................................................................................... 9
IV DIRECT CERTIFICATION PERFORMANCE .................................................................... 9
V DIRECT CERTIFICATION BEST PRACTICES ................................................................ 21
A. Description of State Practices ............................................................................................. 21
B. Recent and Planned Innovations for Improving Direct Certification .......................... 32
C. Best Practices in Implementation of Direct Certification Systems ............................... 33
D. Challenges in Meeting Future Performance Rate Targets .............................................. 35
VI CONCLUSION ............................................................................................................................ 37
VII REFERENCES ............................................................................................................................ 38

Mathematica Policy Research
vi
APPENDIX A: ADDITIONAL TABLES AND FIGURES
APPENDIX B: VERIFICATION SUMMARY REPORT
APPENDIX C: ESTIMATION OF COMPONENT STATISTICS
APPENDIX D: DATA LIMITATIONS
APPENDIX E: DATA UPDATES FOR SCHOOL YEAR 2011–2012
TABLES
1 Number and Percent of LEAs That Directly Certified SNAP Participants, SY 2010–2011 Through SY 2012–2013 ........................................................................................... 6
2 SNAP Participation, Direct Certifications, and SNAP-Participant Students in Non–Base Year Provision 2 or Provision 3 Schools, SY 2012–2013 (thousands) ..................................................................................................................................... 11
3 Categorically Eligible Students: Number Directly Certified and Number Approved by Application, SY 2012–2013 (thousands) ........................................................... 19
4 Characteristics of the Direct Certification Matching Process for Public LEAs in Selected States, SY 2012–2013 ............................................................................................... 23
5 Primary Matching Criteria for States That Use Central Matching Systems ......................... 26
6 Characteristics of Data Provided to Districts in Kentucky, a State with a Local Matching System ........................................................................................................................... 28
7 Approach to Children with Potential Matches and to Children Not Matched in the Primary Process ................................................................................................................. 30
8 Direct Certification Methods for Nonpublic Schools ............................................................. 31
9 Recent and Planned Innovations for Improving Direct Certification .................................. 32
10 Suggestions for Improving Direct Certification Rates ............................................................ 33
11 Challenges Identified by States in Meeting Direct Certification Rate Targets ..................... 35
A.1 Number and Percent of LEAs That Directly Certified SNAP Participants, SY 2004–2005 Through SY 2012–2013 ........................................................................................ A.2
A.2 Number and Percentage of LEAs That Directly Certified SNAP Participants Excluding Provision 2 and Provision 3 LEAs, SY 2004–2005 Through SY 2012–2013 .................................................................................................................................... A.5

Mathematica Policy Research
vii
A.3 Percent of SNAP Children Directly Certified for Free School Meals and Percent of All Categorically Eligible Children Certified for Free School Meals, SY 2011–2012 and SY 2012–2013 ........................................................................................... A.8
A.4 Enrollment of NSLP-Participating LEAs, SY 2012–2013 (millions of students) ....................................................................................................................................... A.9
A.5 States by FNS Administrative Region.................................................................................... A.10
FIGURES
1 Percent of LEAs That Directly Certified SNAP Participants and Percent of Students in LEAs That Directly Certified SNAP Participants, SY 2004–2005 Through SY 2012–2013 ................................................................................................................. 5
2 Percent of LEAs That Directly Certified SNAP Participants and Percent of Students in LEAs That Directly Certified SNAP Participants by Enrollment Category, SY 2012–2013 ................................................................................................................ 8
3 Percent of LEAs and Percent of Students by Enrollment Category, in SY 2012–2013 ........................................................................................................................................ 8
4 Percent of School-Age SNAP-Participant Children Directly Certified for Free School Meals, SY 2012–2013 ...................................................................................................... 12
5 Number of States Meeting Direct Certification Performance Targets Set by the Healthy, Hunger-Free Kids Act, SY 2012–2013. .............................................................. 13
6 Number of States Meeting Direct Certification Performance Targets Set by the Healthy, Hunger-Free Kids Act, by Region, SY 2012–2013. .......................................... 14
7 Percent of SNAP-Participant Children Directly Certified for Free School Meals, by State ............................................................................................................................... 15
8 Percent of SNAP-Participant Children Directly Certified for Free School Meals Nationally, SY 2007–2008 to SY 2012–2013 ............................................................... 16
9 Percentage Point Change in the Share of SNAP-Participant Children Directly Certified for Free School Meals, SY 2011–2012 to SY 2012–2013 ...................................... 17
10 Percent of Categorically Eligible Children Certified for Free School Meals, SY 2012–2013 ...................................................................................................................................... 20
A.1 Percent of LEAs That Directly Certified SNAP Participants and Percent of Students in LEAs That Directly Certified SNAP Participants by Enrollment Category Size: Provision 2 and Provision 3 LEAs Excluded from Direct Certification Counts, SY 2012–2013 ...................................................................................... A.11
A.2 Percent of SNAP-Participant Children Directly Certified for Free School Meals, SY 2007–2008 ............................................................................................................... A.12

Mathematica Policy Research
viii
A.3 Percent of SNAP-Participant Children Directly Certified for Free School Meals, SY 2008–2009 ............................................................................................................... A.13
A.4 Percent of SNAP-Participant Children Directly Certified for Free School Meals, SY 2009–2010 ............................................................................................................... A.14
A.5 Percent of SNAP-Participant Children Directly Certified for Free School Meals, SY 2010–2011 ............................................................................................................... A.15
A.6 Percent of SNAP-Participant Children Directly Certified for Free School Meals, SY 2011–2012 ............................................................................................................... A.16
A.7 Percent of SNAP-Participant Children Directly Certified for Free School Meals, SY 2012–2013 ............................................................................................................... A.17
A.8 Percent of Categorically Eligible Children Certified for Free School Meals, SY 2007–2008 .................................................................................................................................. A.18
A.9 Percent of Categorically Eligible Children Certified for Free School Meals, SY 2008–2009 .................................................................................................................................. A.19
A.10 Percent of Categorically Eligible Children Certified for Free School Meals, SY 2009–2010 .................................................................................................................................. A.20
A.11 Percent of Categorically Eligible Children Certified for Free School Meals, SY 2010–2011 .................................................................................................................................. A.21
A.12 Percent of Categorically Eligible Children Certified for Free School Meals, SY 2011–2012 .................................................................................................................................. A.22
A.13 Percent of Categorically Eligible Children Certified for Free School Meals, SY 2012–2013 .................................................................................................................................. A.23
A.14 Percent of School-age SNAP-Participant Children Directly Certified for Free School Meals by Region, SY 2012–2013 ............................................................................... A.24
Amended Figure 4
Revised Percentage of School-Age SNAP-Participant Children Directly Certified for Free School Meals, SY 2011–2012 .................................................................... E.4

Mathematica Policy Research
ix
GLOSSARY OF ACRONYMS AND ABBREVIATIONS
ACS American Community Survey (U.S. Census Bureau) ART Administrative reviews and training BBCE Broad-based categorical eligibility CE Categorical eligibility CEO Community eligibility option CEPI Center for Educational Performance and Information CIP Continuous improvement plan CN Child nutrition DHS Department of Human Services DOB Date of birth EMBA Electronic Meal Benefit Application FCEA Food, Conservation, and Energy Act of 2008 FDPIR Food Distribution Program on Indian Reservations FNS Food and Nutrition Service FY Fiscal year HHFKA Healthy, Hunger-Free Kids Act of 2010 IT Information technology KDE Kentucky Department of Education KIDS Knowledge, Information and Data Services LEA Local educational agency MDE Michigan Department of Education MOE Maintenance of effort NSLA Richard B. Russell National School Lunch Act NSLP National School Lunch Program OSSE Office of the State Superintendent of Education PL Public Law POS Point-of-Sale QC Quality control data for SNAP RIDE Rhode Island Department of Education SBP School Breakfast Program SIPP Survey of Income and Program Participation SFA School food authority SLED State Longitudinal Educational Database SNAP Supplemental Nutrition Assistance Program SSIS Statewide student information system SSN Social Security number STARS State Automated Reporting System SY School year TANF Temporary Assistance for Needy Families USDA U.S. Department of Agriculture USOE Utah State Office of Education UTREx Utah eTranscript and Record Exchange VSR Verification summary report (FNS Form 742) WIC Special Supplemental Nutrition Program for Women, Infants, and Children
Mathematica Policy Research
ES-1
EXECUTIVE SUMMARY
A. Background
This report responds to a legislative requirement of the Food, Conservation, and Energy Act of 2008 (Public Law [P.L.] 110-246) to assess the effectiveness of State and local efforts to directly certify children for free school meals under the National School Lunch Program (NSLP). The 2008 Farm Bill requires annual Reports to Congress. This is the sixth report in the series, covering school year (SY) 2012–2013. The Food and Nutrition Service (FNS) will use results from this report in determining performance awards and identifying those States that must develop and implement direct certification improvement plans (CIPs), as required by Section 101 of the Healthy, Hunger-Free Kids Act (HHFKA) of 2010 (P.L. 111-296).
The NSLP reimburses local educational agencies (LEAs) for the cost of providing nutritious meals to children in public and private schools and residential child care institutions. Average daily participation across NSLP schools and institutions totaled approximately 32 million children in fiscal year (FY) 2012.
Participating schools and institutions receive cash reimbursements and foods donated by the U.S. Department of Agriculture (USDA) for each meal served. In exchange for Federal assistance, schools must serve meals that meet USDA nutrition and food safety standards. In addition, participating schools must serve meals at no cost or at reduced price to income-eligible children.
B. Eligibility for Program Benefits
Children from households with incomes at or below 130 percent of the Federal poverty level are eligible for free school meals. Children from households with incomes no greater than 185 percent of the Federal poverty level are eligible for reduced-price meals. All NSLP meals are subsidized by USDA, including those served to children with household incomes above 185 percent of the Federal poverty level. The subsidies provided for free and reduced-price meals are substantially larger than the subsidies provided for full-price meals.
Children from households that receive benefits under certain other Federal assistance programs are deemed categorically eligible for free meals under the NSLP. Participation in the Supplemental Nutrition Assistance Program (SNAP), Temporary Assistance for Needy Families (TANF), or the Food Distribution Program on Indian Reservations (FDPIR) confers categorical eligibility for free meals. Effective with the start of SY 2009–2010, if one child in a household participating in one of these assistance programs is directly certified (see below) or is determined categorically eligible for free school meals by application, then all children in that household are categorically eligible for free meals.
In addition, certain children who are migrants, runaways, or homeless, who are in foster care, or who are enrolled in Head Start or Even Start are categorically eligible for free school meals. However, their eligibility does not extend to other children in their household.
C. Direct Certification
Student eligibility for free meals is determined by application or by direct certification. The Child Nutrition and WIC Reauthorization Act of 2004 required all States to establish a system of
Mathematica Policy Research
ES-2
direct certification of school-age SNAP participants by SY 2008–2009. The requirement applies only to children participating in SNAP; however, States and LEAs may also directly certify children from TANF and FDPIR households.
Although direct certification systems vary by State and LEA, all such systems substantially reduce the need for household applications. Many States and LEAs certify eligible children through computer matching of SNAP, TANF, and FDPIR records against student enrollment lists. Those systems require no action by the children’s parents or guardians. In the past, States and LEAs could opt to send letters to SNAP, TANF, and FDPIR households with school-age children instead of conducting data matching. The letters served as proof of categorical eligibility for free meals, and were forwarded by the households to their children’s schools. Effective with SY 2012–2013, it is no longer allowable for States to use the SNAP letter method as a means of direct certification, although they are required to continue to accept them, in lieu of applications, as documentation of categorical eligibility.
HHFKA requires that States meet certain direct certification performance targets. For SY 2012–2013, States that fail to achieve a direct certification rate of at least 90 percent are required to develop and implement CIPs. The performance target increases to 95 percent for SY 2013–2014 and beyond.
D. State Performance Measures
This report presents information on the outcomes of direct certification for SY 2012–2013. Mathematica Policy Research estimated the number of school-age SNAP participants and the number of children directly certified for free school meals in each State. The ratio of these figures is a measure of the success of State and local systems to directly certify SNAP-participant children.
Mathematica also estimated the number of SNAP, TANF, and FDPIR participants certified for free school meals, either by direct certification or by application. This measure provides a more comprehensive assessment of State efforts to ensure that all categorically eligible children are properly certified for free school meals.
E. Key Findings
States and LEAs directly certified 12.3 million children at the start of SY 2012–2013, an increase of 6 percent from one year earlier. The increase in directly certified students (about 740,000) outpaced the increase in school-age SNAP participants (about 221,000) during this same time period. Therefore, most of the growth in direct certification can be attributed to the improved effectiveness of direct certification systems rather than an increase in SNAP participation. The estimated percentage of SNAP-participant children certified for free school meals without application increased from 86 percent in SY 2011–2012 to 89 percent in SY 2012–2013. The overall certification rate of categorically eligible children, by direct certification or by application, increased from 92 percent in SY 2011–2012 to 95 percent in SY 2012–2013.
The number of LEAs directly certifying SNAP-participant children continues to increase. In SY 2004–2005, prior to the Congressional mandate for direct certification, 56 percent of LEAs directly certified SNAP-participant children on a discretionary basis. By SY 2012–2013, 91 percent of LEAs directly certified some SNAP children; those LEAs enrolled 99 percent of students in NSLP-participating schools.

Mathematica Policy Research
ES-3
F. State Best Practices
States and LEAs continue to find success with different direct certification models, and they are making investments in their direct certification systems that promise improved performance in the coming years.
Six states with successful or improved direct certification systems were interviewed for this report. Four of these States have revised their direct certification matching systems with the help of grant money made available by USDA. Recent direct certification changes that States link to performance improvements include increasing match frequency, enhancing matching algorithms to include probabilistic matching, and including additional program data sources—such as foster care data—in matching processes. Many of these changes were made with an eye toward meeting the performance benchmarks set forth in HHFKA (90 percent for SY 2012–2013 and 95 percent in future years). In discussions surrounding challenges to meeting these benchmarks in future years, States frequently cited the inability of direct certification improvement measures to account for children who receive SNAP benefits but who are not enrolled in schools and thus not eligible for direct certification. These students include home-schooled children, school dropouts, and some homeless and migrant children. Another commonly cited challenge was incorporating nonpublic schools more efficiently into the direct certification process.
G. Conclusion
States and LEAs have made significant progress in complying with the 2004 Reauthorization Act. An estimated 91 percent of LEAs, enrolling 99 percent of all children in NSLP-participating schools, directly certified SNAP participants in SY 2012–2013. An estimated 89 percent of children from SNAP-participant households were certified without application for free school meals in SY 2012–2013, 3 percentage points higher than last year’s direct certification rate of 86 percent. Twenty-four States achieved direct certification rates of at least 90 percent, the direct certification target set by HHFKA for SY 2012–2013. Only one had a direct certification rate lower than 60 percent. States and LEAs certified 95 percent of all categorically eligible students for free school meals, either by direct certification or by application in SY 2012–2013, 3 percentage points higher than the rate achieved in SY 2011–2012.
Mathematica Policy Research
1
DIRECT CERTIFICATION IN THE NATIONAL SCHOOL LUNCH PROGRAM: STATE IMPLEMENTATION PROGRESS, SCHOOL YEAR 2012–2013
I. INTRODUCTION
The National School Lunch Program (NSLP) reimburses local educational agencies (LEAs) for the cost of providing nutritious low-cost or free meals to children in public and private schools and residential child care institutions. Participating schools and institutions receive cash reimbursements and foods donated by the U.S. Department of Agriculture (USDA) for each meal served. About 100,000 schools and institutions participate in the program. Average daily student participation totaled approximately 32 million in fiscal year (FY) 2012.1
In exchange for Federal assistance, participating schools and institutions serve meals that satisfy Federal nutrition and food safety standards. In addition, they must offer school meals at no cost, or at reduced price, to income-eligible children. Children from households with incomes at or below 130 percent of the Federal poverty level ($29,965 for a family of four during school year (SY) 2012–2013)2 are eligible for free meals. Those from households with incomes between 130 and 185 percent of the Federal poverty level ($42,643 for a family of four during SY 2012–2013) are eligible for reduced-price meals. Students are determined eligible for free meals through application or direct certification (described next); reduced-price eligibility is determined by application alone.
A. Eligibility Determination Through Application
All LEAs accept applications from households to establish the eligibility of the children that reside in them for free or reduced-price school meals. Most applicants submit self-declared income and household size information, which is compared with the income thresholds for free and reduced-price benefits. Other applicants provide case numbers that demonstrate household participation in one of several other means-tested Federal assistance programs. Children in households that receive benefits under the Supplemental Nutrition Assistance Program (SNAP), Temporary Assistance for Needy Families (TANF), or Food Distribution Program on Indian Reservations (FDPIR) are categorically eligible for free school meals. Categorical eligibility through these assistance programs, whether determined by application or by direct certification (described next), extends to all children in the same household.3 Foster children; certain children enrolled in Federally funded Head Start or Even Start programs; and certain homeless, runaway, and migrant children are also categorically eligible for free school meals. Their eligibility is on an individual basis and does not extend to other children in the household.
1 See http://www.fns.usda.gov/pd/annual.htm.
2 The income eligibility thresholds given here apply to households from the 48 contiguous States, the District of Columbia, Guam, and the other U.S. territories. The income thresholds are higher in Alaska and Hawaii. A table of income eligibility thresholds can be found at http://www.gpo.gov/fdsys/pkg/FR-2012-03-23/pdf/2012-7036.pdf.
3 See Food and Nutrition Service (FNS) school meals policy numbers 38-2009 and 25-2010 at http://www.fns.usda.gov/cnd/governance/policy2006-2011.htm.

Mathematica Policy Research
2
B. Eligibility Determination Through Direct Certification
Direct certification confirms a child’s categorical eligibility for free school meals without the need for a household application. Direct certification typically involves matching SNAP, TANF, and FDPIR records against student enrollment lists, at either the State or the LEA level.4 Parents or guardians of children identified through these matching systems are notified of their children’s eligibility for free school meals.5 They need not take action for their children to be certified.6
The Child Nutrition and WIC Reauthorization Act of 2004 requires that each State education agency enter into an agreement with the State agency responsible for determining SNAP eligibility. The agreement must establish procedures to directly certify children from SNAP households for free school meals.7 States may also directly certify children from TANF and FDPIR households; foster children; participants in Federally funded Head Start or Even Start programs; and certain homeless, runaway, and migrant children, but are not required to do so.
C. Purpose of This Report
This report responds to Section 4301 of the Food, Conservation, and Energy Act of 2008 (FCEA),8 which calls for an assessment of the “effectiveness of each State in enrolling school-age children in households receiving . . . [SNAP] benefits” for free school meals.9 Specifically, the law requires the following:
1. State-level estimates of the number of school-age children that received SNAP benefits at any time in July, August, or September (just before or at the start of the current school year)
2. Estimates of the number of SNAP-participant children who were directly certified for free school meals as of October 1
3. Estimates of the number of SNAP-participant students who were not candidates for direct certification because they attended special provision schools operating in years in which applications are not collected10
4 Federal law requires direct certification of SNAP-participant children. However, most State direct certification
systems also extend to children in TANF households.
5 Households must be given the opportunity to decline free school meal benefits.
6 In the past, States and LEAs could opt to send letters to SNAP, TANF, and FDPIR households with school-age children. The letters served as proof of categorical eligibility for free meals and were forwarded by the households to their children’s schools. By SY 2012–2013, States were required to phase out the use of the letter method, and it could no longer be used to directly certify children receiving SNAP benefits.
7 The Child Nutrition and WIC Reauthorization Act’s direct certification provision was phased in over a three-year period beginning with SY 2006–2007.
8 Also known as the 2008 Farm Bill.
9 This report includes analysis of the contiguous United States, Alaska, Hawaii, and Guam.
10 See http://www.fns.usda.gov/CND/Governance/prov-1-2-3/Prov1_2_3_FactSheet.htm for information on Provision 2 and 3 schools.

Mathematica Policy Research
3
The Food and Nutrition Service (FNS) will use these estimates in determining performance awards and identifying those States that must develop and implement direct certification continuous improvement plans (CIPs), as required by Section 101 of the Healthy, Hunger-Free Kids Act of 2010 (HHFKA) (Public Law [P.L.] 111-296). Specifically, for SY 2012–2013, States that fail to achieve a direct certification rate of at least 90 percent are required to develop and implement CIPs. In addition to presenting direct certification performance measures, Section 4301 of the FCEA also calls for a discussion of best practices in States with successful direct certification systems.
II. HISTORY OF DIRECT CERTIFICATION
In the mid-1980s, program managers and policymakers recognized a duplication of effort in certifying school children for free meals under the NSLP and the School Breakfast Program (SBP),11 and certifying families for what are now the SNAP and TANF programs (formerly the Food Stamp Program and Aid to Families with Dependent Children, respectively). All these programs have similar income-eligibility limits, and many school children participated in more than one. Further, the application processes for SNAP and TANF were, and remain, more detailed and rigorous than the certification process for free meals under the NSLP. Use of eligibility determinations for SNAP and TANF could improve the accuracy of certifications for NSLP.
Legislation taking a first step to link these programs was enacted in 1986. The Richard B. Russell National School Lunch Act (NSLA) was amended to make children who are members of a household receiving assistance under SNAP and TANF automatically eligible for free school meals. This action paved the way for more simplified application and certification procedures for these children. Initially, families could put their case number from these programs on the application in lieu of providing income information.12 Then, in 1989, P. L. 101-147 (Child Nutrition and WIC Reauthorization Act of 1989) allowed school food authorities (SFAs) to certify children, without further application, by directly communicating with the appropriate State or local agency to obtain documentation that the children were members of a household receiving either SNAP or TANF benefits. This first statutory authorization of direct certification was made optional for SFAs.
The 2004 Reauthorization Act amended the NSLA to mandate direct certification with SNAP for all LEAs. (Before 2004, the NSLA referred only to SFAs when describing local administration of the NSLP. With the 2004 Reauthorization Act, the NSLA recognized LEAs, rather than SFAs, as the entities responsible for NSLP application and certification processes.) The 2004 act retained discretionary authority for TANF direct certification. Mandatory direct certification with SNAP was phased in over three years, beginning in SY 2006–2007. All LEAs, including private schools, were required to have direct certification systems in place for SY 2008–2009.
Because State agencies administering the NSLP and SBP recognized that direct certification would increase participation, ease the burden on families and LEAs, and result in more accurate targeting of free school meal benefits, many States chose to phase in the use of direct certification in
11 Children certified for free or reduced-price meals under the NSLP are eligible for free or reduced-price
breakfasts under the SBP. The two programs share a single application process. Throughout this report, certification for free or reduced-price benefits under the NSLP should be understood to mean certification for the SBP as well.
12 The option to provide a case number on the application has been retained to enable children who were not directly certified to be more easily processed by the LEAs.
Mathematica Policy Research
4
advance of the mandate. State education agencies worked in partnership with the agencies in their States that administered SNAP and TANF. At the outset, various methods were used, refined, and expanded. By the time direct certification with SNAP became mandatory, many State agencies had systems in place and were familiar with the process.
In the years since the statutory mandate, additional implementation requirements have been introduced with the intention of increasing the reach and effectiveness of direct certification. In August 2009, FNS issued guidance requiring that free meal eligibility apply to all children in a family if at least one child is certified for free meals based on receipt of SNAP, TANF, or FDPIR benefits, beginning in SY 2009–2010. HHFKA required that State agencies no longer use the letter method as a means of direct certification with SNAP. This act also includes a provision that expands direct certification to include Medicaid in some districts via a demonstration project. In addition, starting in SY 2011–2012, FNS required that direct certification matching with SNAP records occurs at least three times per school year.
Even though all LEAs are now subject to the statutory direct certification mandate, there continues to be a need for household applications. Because children from households with incomes between 130 and 185 percent of the Federal poverty level are not eligible for SNAP, direct certification cannot be used to certify children eligible for reduced-price school meals. In addition, some households with incomes at or below 130 percent of the Federal poverty level do not participate in SNAP. Children from those households remain income-eligible for free school meals, but will not be identified through direct certification.
III. CURRENT STATUS OF DIRECT CERTIFICATION SYSTEMS
The Child Nutrition and WIC Reauthorization Act of 2004 required that all LEAs begin directly certifying children from SNAP-participant families by SY 2008–2009. The direct certification mandate was phased in over three years. LEAs with total enrollments of 25,000 or more students were required to establish direct certification systems no later than SY 2006–2007. LEAs with enrollments of 10,000 or more followed in SY 2007–2008. Phase-in was complete in SY 2008–2009, when all LEAs were subject to the statutory mandate.

Mathematica Policy Research
5
Figure 1 and Table 1 illustrate the increases over time in both the percent of LEAs that directly certified SNAP participants and the percent of students enrolled in those LEAs.13 For SY 2012–2013, 91 percent of LEAs directly certified some SNAP participants,14 and those LEAs enrolled 99 percent of all students in NSLP-participating schools.
Figure 1. Percent of LEAs That Directly Certified SNAP Participants and Percent of Students in LEAs That Directly Certified SNAP Participants, SY 2004–2005 Through SY 2012–2013
13 The numbers in Figure 1 and Table 1 are estimates based on figures provided by LEAs on their annual NSLP verification
summary reports (VSRs). An LEA is identified as a direct certification district if the reported number of students not subject to verification exceeds the number that are categorically eligible for free meals but approved by application, or the number not subject to verification is at least 5 percent of all students reported certified for free meals. This methodology, previously used by Cole and Logan (2007), could misclassify a small number of LEAs. Also, as noted in the next footnote, some LEAs in which all students attend non–base year Provision 2 or Provision 3 schools may not be included in Figure 1 and Table 1, because some States do not consistently report data for LEAs that are not required to conduct verification activities.
14 This percentage, and the corresponding Table 1 figures for all other school years, also includes LEAs in which students
attend Provision 2, Provision 3, or Community Eligibility Option schools that are not operating in a base year. Both Figure 1 and Table 1 attempt to measure the LEAs’ progress in implementing direct certification systems. However, LEAs in which all students attend special provision schools operating in non–base years may not directly certify any students, because students in special provision schools are not subject to either direct certification or certification by application in non–base years. All children, including all SNAP participants, are eligible for free meals in special provision schools, which is consistent with the policy goal of direct certification. See Appendix A, Table A.2, for an alternate version of Table 1 with Provision 2 and Provision 3 LEAs excluded from both the total count of LEAs and the count of LEAs that directly certified some SNAP children.
56% 60%
63% 67%
78%
83% 85%
89% 91%
77% 81%
86% 89%
95% 97% 97% 98% 99%
0
10
20
30
40
50
60
70
80
90
100
2004-2005 2005-2006 2006-2007 2007-2008 2008-2009 2009-2010 2010-2011 2011-2012 2012-2013
Pe
rce
nt
School Year
Percent of LEAs that directly certified some SNAP participants
Percent of students enrolled in LEAs that directly certified some SNAP participants

Mathematica Policy Research
6
Table 1. Number and Percent of LEAs That Directly Certified SNAP Participants, SY 2010–2011 Through SY 2012–2013
Direct Certification or Provision 2/3 LEAs
Direct Certification or Provision 2/3 LEAs
Direct Certification or Provision 2/3 LEAs
Number of LEAs Number Percent
Number of LEAs Number Percent
Number of LEAs Number Percent
U.S. Total 18,574 15,778 84.9 18,643 16,545 88.7 18,362 16,684 90.9 AK 51 49 96.1 50 49 98.0 69 48 69.6 AL 151 141 93.4 156 145 92.9 159 152 95.6 AR 290 279 96.2 289 279 96.5 284 268 94.4 AZ 430 365 84.9 456 404 88.6 464 407 87.7 CA 1,078 806 74.8 1,094 872 79.7 1,094 1,024 93.6 CO 207 191 92.3 214 204 95.3 209 201 96.2 CT 186 176 94.6 185 183 98.9 188 186 98.9 DC 57 57 100.0 61 60 98.4 63 63 100.0 DE 34 32 94.1 42 35 83.3 44 40 90.9 FL 190 133 70.0 223 178 79.8 226 185 81.9 GA 229 207 90.4 229 219 95.6 222 212 95.5 GU NA NA NA 3 1 33.3 2 1 50.0 HI 36 26 72.2 35 25 71.4 35 35 100.0 IA 494 435 88.1 477 428 89.7 474 419 88.4 ID 144 137 95.1 148 141 95.3 149 149 100.0 IL 1,119 968 86.5 1,126 1,039 92.3 1,051 984 93.6 IN 501 424 84.6 496 429 86.5 504 447 88.7 KS 399 340 85.2 400 362 90.5 398 378 95.0 KY 189 178 94.2 189 178 94.2 188 186 98.9 LA 114 102 89.5 113 106 93.8 114 107 93.9 MA 421 311 73.9 422 355 84.1 363 324 89.3 MD 49 43 87.8 55 47 85.5 55 38 69.1 ME 192 174 90.6 187 170 90.9 189 182 96.3 MI 853 736 86.3 845 762 90.2 847 784 92.6 MN 706 471 66.7 697 472 67.7 694 458 66.0 MO 761 684 89.9 755 704 93.2 762 711 93.3 MS 176 160 90.9 175 159 90.9 172 159 92.4 MT 240 209 87.1 240 212 88.3 239 206 86.2 NC 165 154 93.3 162 152 93.8 161 152 94.4 ND 204 181 88.7 203 179 88.2 202 174 86.1 NE 379 317 83.6 374 320 85.6 370 337 91.1 NH 91 82 90.1 100 88 88.0 98 82 83.7 NJ 694 665 95.8 697 683 98.0 699 680 97.3 NM 187 134 71.7 202 147 72.8 205 143 69.8 NV 20 16 80.0 20 15 75.0 25 17 68.0 NY 1,106 985 89.1 1,101 1,001 90.9 1,093 942 86.2 OH 1,192 869 72.9 1,214 1,043 85.9 1,219 1,146 94.0 OK 577 496 86.0 573 545 95.1 572 548 95.8 OR 250 203 81.2 244 205 84.0 239 204 85.4 PA 853 733 85.9 853 768 90.0 853 790 92.6 RI 56 53 94.6 54 49 90.7 53 53 100.0 SC 100 85 85.0 106 84 79.2 94 84 89.4 SD 213 197 92.5 210 194 92.4 208 189 90.9 TN 175 161 92.0 183 174 95.1 182 174 95.6 TX 1,260 1,138 90.3 1,259 1,148 91.2 1,247 1,154 92.5 UT 81 75 92.6 85 81 95.3 94 94 100.0 VA 154 145 94.2 155 146 94.2 151 145 96.0 VT 238 208 87.4 218 203 93.1 88 82 93.2 WA 330 295 89.4 326 296 90.8 319 300 94.0 WI 822 650 79.1 812 698 86.0 799 728 91.1 WV 72 56 77.8 72 57 79.2 71 58 81.7 WY 58 46 79.3 58 51 87.9 62 54 87.1
Note: Figures for school years before SY 2012–2013 may differ from previous reports due to changes in data submitted by States. NA = not available.

Mathematica Policy Research
7
About two-thirds of the LEAs that did not directly certify SNAP participants in SY 2012–2013 are private, and four-fifths are single-school LEAs. These schools may be less likely to enroll eligible children or may face greater barriers to implementing direct certification. The information-sharing relationship between private school LEAs and the States’ education agencies often differs from the relationship between public LEAs and the States. For this reason, private LEAs are sometimes excluded from State-level direct certification matching systems. Although small, single-school, and private LEAs might face special challenges in setting up direct certification systems, all are subject to the statutory mandate.
The 2004 Reauthorization Act’s phased implementation of mandatory direct certification recognized that the fixed costs of establishing such a system would pose the greatest challenge to small LEAs. Although SY 2012–2013 is the fifth year that the smallest LEAs were subject to the statutory mandate, these LEAs continue to lag larger LEAs in adopting direct certification, and it remains useful to track the progress of that group separately.
Figure 2 shows estimates by LEA enrollment category of the percent of LEAs that directly certified SNAP participants and the percent of students enrolled in LEAs that directly certified SNAP participants in SY 2012–2013.15 Use of direct certification is nearly universal for larger LEAs; 99 percent of LEAs with enrollments of 5,000 or more students and 98 percent of those with enrollments of 1,000 to 4,999 directly certified some SNAP participants in SY 2012–2013.16 Although LEAs with enrollments of at least 1,000 make up about 40 percent of all LEAs, they enroll about 92 percent of students nationwide (Figure 3).
Direct certification is somewhat less prevalent among smaller LEAs; about 95 percent of LEAs with 500 to 999 students directly certified SNAP participants in SY 2012–2013, whereas the figure was 83 percent for LEAs with fewer than 500 students. Some of the LEAs might not have SNAP-participant children among their enrollments, though it is also possible that technical or administrative challenges are among the reasons that these LEAs did not directly certify any SNAP-participant children. The direct certification numbers for these two groups of small LEAs are a 1- and 4-percentage-point improvement over the previous year. Therefore, the gap between the largest LEAs and those with fewer students is narrowing.
About 60 percent of all LEAs—approximately 11,000—enroll fewer than 1,000 students (Figure 3). In spite of their great number, these LEAs account for only 8 percent of all enrolled students. Of the 3.9 million students enrolled in these LEAs, the vast majority (3.7 million, or 96 percent) are enrolled in LEAs that directly certified at least some SNAP-eligible children.
15 LEAs made up entirely of Provision 2 and Provision 3 schools are included in the count of LEAs that directly certified
SNAP participants. States were reminded in SY 2012–2013 to be sure that all LEAs report, even those that are not required to conduct verification activities (see Policy Memorandum SP 17-2013 dated December 14, 2012, at http://www.fns.usda.gov/cnd/governance/Policy-Memos/2013/SP17-2013os.pdf). Nevertheless, some States submitted FNS-742 data sets for SY 2012–2013 that did not include all these LEAs. See Appendix A, Figure A.1 for the same chart with Provision 2 and Provision 3 LEAs excluded from both the total count of LEAs and the count of LEAs that directly certified SNAP participants.
16 It is possible that some of the remaining large districts operate direct certification systems but certify no SNAP participants.
It is also possible, given the limitations of the VSR data, that some of these LEAs are misclassified.

Mathematica Policy Research
8
Figure 2. Percent of LEAs That Directly Certified SNAP Participants and Percent of Students in LEAs That Directly Certified SNAP Participants by Enrollment Category, SY 2012–2013
Note: The percentages in this figure are rounded. For example, 99.7 percent of LEAs with 10,000 or more students directly certified some SNAP participants in SY 2012-2013, which is rounded to 100 percent.
Figure 3. Percent of LEAs and Percent of Students by Enrollment Category, in SY 2012–2013

Mathematica Policy Research
9
A. Characteristics of LEAs That Did Not Directly Certify Any SNAP Children
Overall, 1,678 LEAs, about 9 percent of the total, did not directly certify SNAP-participant children in SY 2012–2013 (a decrease from about 2,100 LEAs in SY 2011–2012). Although the NSLA does not exempt small or single-school districts from the direct certification requirement, both groups are overrepresented among LEAs with no directly certified students. Because they tend to be small, the 9 percent of LEAs that did not directly certify any SNAP children enroll only 1.4 percent of students in NSLP-participating schools.
Some additional details on LEAs that did not directly certify SNAP-participant students include the following:
About 85 percent enrolled fewer than 500 students; only 40 percent of LEAs that did directly certify SNAP participants enrolled fewer than 500 students.
About 81 percent are single-school LEAs; only 34 percent of LEAs that did directly certify SNAP participants are single-school LEAs.
An estimated 66 percent are private LEAs; only 14 percent of LEAs that did directly certify SNAP participants are private.
About 9 percent certified no students at all for free meals, either by direct certification or by application. FNS has no reason to believe that this small group of about 146 LEAs is not in full compliance with the direct certification requirement; these LEAs might enroll very few or no children from SNAP-participant households.
About one-quarter certified some but no more than 5 percent of their enrolled students for free meals; only 3 percent of LEAs that did directly certify SNAP participants reported having such a low concentration of low-income students. These LEAs have an unusually low concentration of students certified for free meals, and some might also be in compliance with the direct certification requirement, though their systems failed to identify any SNAP participants.
IV. DIRECT CERTIFICATION PERFORMANCE
For each State, Mathematica estimates a direct certification performance measure based on three component statistics:17
1. The number of school-age children in the State’s SNAP-participant households
2. The number of SNAP participants directly certified by the State’s LEAs for free school meals18
3. The number of SNAP participants in the State’s non–base year Provision 2 or Provision 3 schools
17 The derivation of each of these statistics is described in Appendix C.
18 This is proxied by the number of students that LEAs report on the FNS-742 as eligible for free meals but not subject to verification. That number includes, but is not limited to, directly certified SNAP participants.

Mathematica Policy Research
10
Table 2 provides the estimated values of these statistics for each State.19
This report’s primary measure of State direct certification effectiveness is computed as follows:
Percent of SNAP participants directly
certified for free school meals
=
Students directly certified for free school meals
School-age children in SNAP households
- SNAP children in non–base year Provision 2/3 schools
Figure 4 ranks the States according to this performance measure.20 Because each of the
component statistics is estimated with some error, the exact percentage values associated with the States should be viewed with caution.21 Estimation error can result both from reporting error and from limitations in the available methodology for estimating the direct certification rate. For example, if some districts provide inaccurate counts of students who are not subject to verification, State estimates of students directly certified for free school meals will be inaccurate as well. Estimates of SNAP children in non–base year special provision schools will be inaccurate if some districts provide inaccurate information in their VSR or do not submit VSR information because all students attend non–base year special provision schools.
One methodological limitation is related to the measure’s treatment of TANF recipients and other non-SNAP participant children directly certified at the option of States or LEAs.22 TANF participation, in particular, is commonly but not universally used by States and LEAs as a second criterion in their direct certification systems. Because FNS does not know how many States, or what fraction of LEAs within States, directly certify TANF participants or these other categories of children, an adjustment for these children has not been made to the denominator of the equation presented at the top of this section. Without such an adjustment, however, Figure 4 percentages are overstated for some States. Figure 10 presents a more comprehensive measure of the States’ success at certifying all categorically eligible children for free school meals. That measure includes the certification of students based on their status as SNAP, TANF, or FDPIR participants.23 Other limitations of the data and methodology are discussed in Appendices C and D.
Because of the potential for estimation error, this report focuses on the States’ relative positions in the chart. States near the top of the chart are among the most successful at directly certifying SNAP-participant children for free school meals; relatively few SNAP households in those States are burdened with paper applications. Children from SNAP-participant households in those States are also among the least likely to be misclassified as ineligible for free school meals.
19 For ease of exposition, the report refers to the units included in this analysis as “States” although it includes the District of
Columbia and Guam.
20 See Appendix Figures A.2 through A.7 for U.S. maps providing a geographic view of these State estimates for SY 2007–2008
through SY 2012–2013.
21 Estimation error is most obvious when State figures, computed from the component statistics in Table 2, exceed 100 percent.
For purposes of display, we cap the percentages in Figure 4 at 100 percent. The paragraphs that follow discuss some of the sources of this error, and other reasons that may contribute to performance measures above 100 percent.
22 These include children from FDPIR households, foster children, participants in Federally funded Head Start or Even Start
programs, and certain homeless, runaway, and migrant children.
23 In States participating in the Medicaid demonstration, the measure may also include the certification of students based on
their status as Medicaid participants.

Mathematica Policy Research
11
Table 2. SNAP Participation, Direct Certifications, and SNAP-Participant Students in Non–Base Year Provision 2 or Provision 3 Schools, SY 2012–2013 (thousands)
U.S. Total 14,960.8 12,296.1 1,187.5 Alabama 303.5 255.9 3.1 Alaska 28.0 29.6 8.0 Arizona 391.2 256.4 39.4 Arkansas 158.3 117.8 13.0 California 1,645.9 1,008.9 327.1 Colorado 178.0 128.2 1.2 Connecticut 105.4 85.8 17.9 Delaware 51.5 47.3 2.1 District of Columbia 35.0 34.5 1.4 Florida 1,002.2 913.9 17.0 Georgia 613.9 538.0 42.0 Guam 18.4 13.9 0.0 Hawaii 53.3 46.5 0.6 Idaho 78.1 61.9 1.1 Illinois 643.4 548.9 0.0 Indiana 295.1 239.7 11.1 Iowa 124.0 113.4 3.5 Kansas 93.9 98.7 0.0 Kentucky 229.0 263.1 3.6 Louisiana 338.1 253.4 0.0 Maine 66.1 49.6 0.2 Maryland 223.9 202.8 0.2 Massachusetts 242.8 191.6 15.7 Michigan 494.4 495.4 0.0 Minnesota 169.9 145.6 2.6 Mississippi 228.5 165.5 14.6 Missouri 302.9 241.3 0.0 Montana 35.6 19.4 6.0 Nebraska 56.1 63.6 0.0 Nevada 123.6 104.5 6.5 New Hampshire 35.2 20.5 0.0 New Jersey 256.3 227.2 0.3 New Mexico 149.0 59.8 72.1 New York 839.4 819.3 185.9 North Carolina 544.0 442.7 0.0 North Dakota 15.2 13.4 4.8 Ohio 534.9 481.2 6.5 Oklahoma 199.6 170.5 8.7 Oregon 225.0 151.5 4.3 Pennsylvania 450.9 333.2 15.8 Rhode Island 45.1 40.5 0.0 South Carolina 273.2 235.0 0.0 South Dakota 32.6 23.1 6.1 Tennessee 400.1 379.2 1.3 Texas 1,570.2 1,213.0 325.7 Utah 94.3 86.0 2.7 Vermont 23.1 20.7 1.4 Virginia 249.5 242.4 0.0 Washington 323.5 246.2 11.9 West Virginia 97.8 107.2 0.0 Wisconsin 260.4 237.3 1.3 Wyoming 11.8 11.3 0.5
Note: The SNAP participant count for Pennsylvania has been reduced by an estimate of SNAP-participant children who attend Philadelphia schools operating under a “Universal Feeding” pilot program. For all States, the SNAP participant figures depend on estimation of a “turnover rate” to convert monthly SNAP caseload into counts of unique individuals who received benefits for part or all of the July-to-September period of interest to this report. The SNAP participant counts are sensitive to small changes in the turnover rate. Error in estimation of the turnover rate complicates comparison of SNAP participant estimates and State direct certification effectiveness across years. See Appendix C for more detail.

Mathematica Policy Research
12
Figure 4. Percent of School-Age SNAP-Participant Children Directly Certified for Free School Meals, SY 2012–2013
Note: The percentages in this figure are equal to the ratio of directly certified students, and other students eligible for free meals whose applications are not
subject to verification, to all SNAP-participant school-age children. For a tabular presentation of these data, see Table A.3. Dark green shading indicates estimates that were capped at 100 percent. Light green shading indicates estimates of at least 90 percent and less than 100 percent. Yellow shading indicates estimates of at least 85 percent and less than 90 percent. Red shading indicates estimates less than 85 percent. See Appendices C and D for a discussion of data sources and data limitations.

Mathematica Policy Research
13
The States that fall near the bottom of the chart directly certify relatively few SNAP-participant children. However, by this measure alone, it is not possible to conclude that SNAP-participant children in these States are at particular risk of being denied free meal benefits. LEAs in these States could operate effective school meal application systems. What can be concluded is that SNAP households and LEA or school administrators in these States are burdened with more administrative paperwork than their counterparts in other States.
Errors in measurement and State reporting minimize the significance of small differences in the percentage point scores of States that fall near one another in Figure 4, but the wide gap between States near the bottom of the chart and those near the top makes clear that some States’ direct certification systems are simply less effective than other States’ systems. Among States and LEAs that rely on computer matching for direct certification, variation in direct certification effectiveness might be explained in part by differences in matching algorithms, use of probabilistic matching, the nature and quality of data used as input into the matching process, procedures for handling nonmatches, access to a supplemental student-level look-up system, or other system characteristics.24
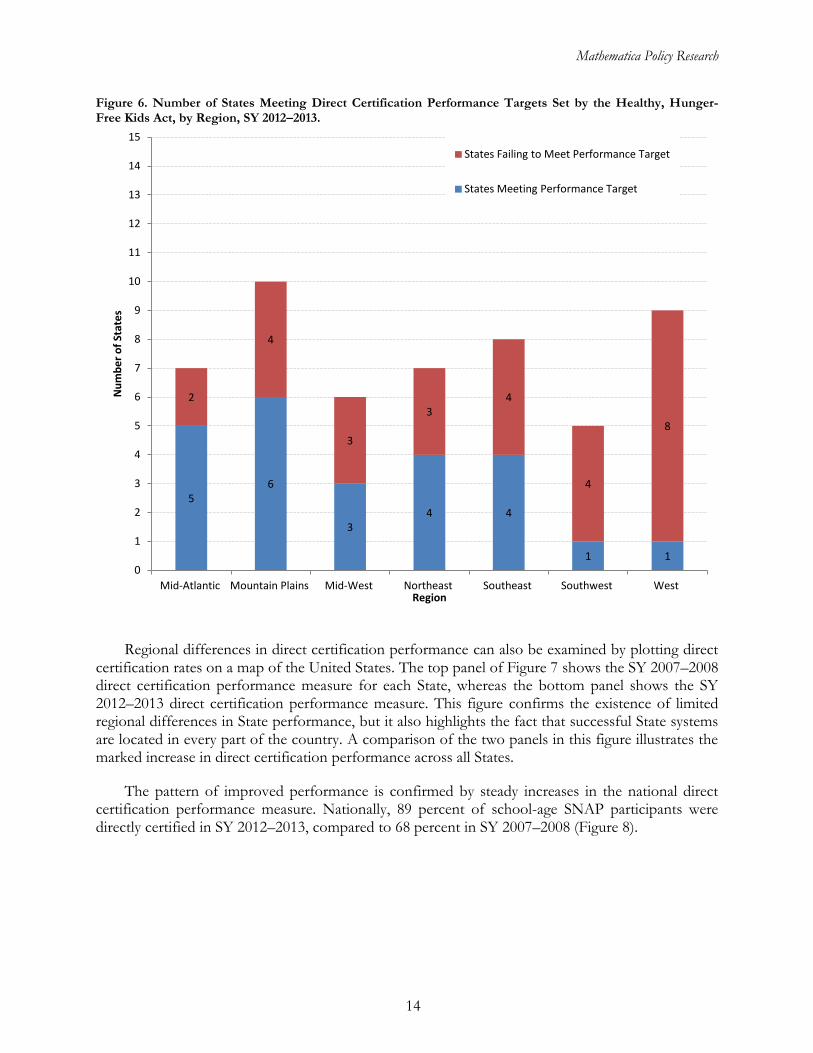
Figure 5 shows the number of States that met or exceeded the direct certification performance target established by HHFKA—90 percent for SY 2012–2013. Nationally, 24 States were at or above this benchmark. Regionally, there are differences in direct certification effectiveness (Figure 6). The seven regions shown in Figure 6 are those defined for FNS administrative purposes.25 At least one State in each region was able to reach the direct certification performance target in SY 2012–2013. The Mid-Atlantic and Mountain Plains regions have the most States at or above the target—five and six States, respectively.26
Figure 5. Number of States Meeting Direct Certification Performance Targets Set by the Healthy, Hunger-Free Kids Act, SY 2012–2013.
24 See Section V for a discussion of State and LEA direct certification practices.
25 See Table A.5 for a listing of States by FNS administrative region.
26 Figure A.14, in Appendix A, shows the overall effectiveness of the States, by region, to directly certify school-age SNAP
children for free school meals. Direct certification performance in the Northeast was higher than in other parts of the country.
24 28
States Meeting Performance Target
States Failing to Meet Performance Target
Mathematica Policy Research
14
Figure 6. Number of States Meeting Direct Certification Performance Targets Set by the Healthy, Hunger-Free Kids Act, by Region, SY 2012–2013.
Regional differences in direct certification performance can also be examined by plotting direct certification rates on a map of the United States. The top panel of Figure 7 shows the SY 2007–2008 direct certification performance measure for each State, whereas the bottom panel shows the SY 2012–2013 direct certification performance measure. This figure confirms the existence of limited regional differences in State performance, but it also highlights the fact that successful State systems are located in every part of the country. A comparison of the two panels in this figure illustrates the marked increase in direct certification performance across all States.
The pattern of improved performance is confirmed by steady increases in the national direct certification performance measure. Nationally, 89 percent of school-age SNAP participants were directly certified in SY 2012–2013, compared to 68 percent in SY 2007–2008 (Figure 8).
5 6
3 4 4
1 1
2
4
3
3 4
4
8
0
1
2
3
4
5
6
7
8
9
10
11
12
13
14
15
Mid-Atlantic Mountain Plains Mid-West Northeast Southeast Southwest West
Nu
mb
er
of
Stat
es
Region
States Failing to Meet Performance Target
States Meeting Performance Target

Mathematica Policy Research
15
Figure 7. Percent of SNAP-Participant Children Directly Certified for Free School Meals, by State
SY 2007–2008
SY 2012–2013
Percent Directly Certified
0 - 49 (5)
50 - 59 (8)
60 - 69 (15)
70 - 79 (12)
80 - 89 (6)
90 + (5)
Percent Directly Certified
0 - 49 (0)
50 - 59 (1)
60 - 69 (2)
70 - 79 (10)
80 - 89 (15)
90 + (24)

Mathematica Policy Research
16
Figure 8. Percent of SNAP-Participant Children Directly Certified for Free School Meals Nationally, SY 2007–2008 to SY 2012–2013
Figure 9 compares SY 2012–2013 State-level measures of direct certification effectiveness (from Figure 4) with the same measures computed with SY 2011–2012 data. Most States showed improved performance, although 16 States had a decline in performance of 2 percentage points or more. States near the top of Figure 9 achieved the largest percentage point growth in the share of SNAP-participant children who were directly certified for free school meals.27
Like the numeric values in Figure 4, it is useful to view the values in Figure 9 as relative measures between States rather than absolute measures of improved direct certification performance across years.28
A more comprehensive measure of the States’ success in certifying all categorically eligible children for free school meals is developed next. This measure does not attempt to assess the effectiveness of the States’ direct certification systems. Instead, it measures the States’ success at certifying children, directly or by application, based on their participation in or association with any of the programs or institutions that confer categorical eligibility for free school meals.
27 Some of the percentages in Figure 9, particularly those near the top and bottom of the chart, are due, at least in part, to
factors unrelated to the States’ direct certification performance. These factors include corrections to prior year VSR reporting, possible errors in current year reporting, and the technical characteristics of the performance estimate itself.
28 See Appendix C for a discussion of the uncertainty surrounding this report’s estimates of SNAP-participant counts at the start of the school year.
68% 71% 72%
77%
86% 89%
0
10
20
30
40
50
60
70
80
90
100
2007-2008 2008-2009 2009-2010 2010-2011 2011-2012 2012-2013
Pe
rce
nt
School Year

Mathematica Policy Research
17
Figure 9. Percentage Point Change in the Share of SNAP-Participant Children Directly Certified for Free School Meals, SY 2011–2012 to SY 2012–2013
Note: For a tabular presentation of these data, see Table A.3. Some year-to-year changes in the share of SNAP-participant children directly
certified for free school meals, particularly the extreme changes at the top and bottom of this figure, can be attributed to factors other than direct certification performance, such as State reporting error and methodological limitations of the performance measure. See footnote 27 for specific examples of these issues. The percentages in Figure 9 are based on the performance measures computed from the component figures in Table 2, not the figures in Figure 4 that are capped at 100 percent for several States.

Mathematica Policy Research
18
The measure starts with the number of students whose eligibility for free school meals is not subject to verification. This is the same proxy measure of directly certified SNAP participants used earlier. Added to this are the students whose approval for free school meals is based on the household’s submission of a SNAP, TANF, or FDPIR case number on an NSLP application. The sum of these two numbers, the numerator in the equation on the following page, is the total number of students that are certified by LEAs based on categorical eligibility for free school meals.29
This count of children identified as categorically eligible for free meals is divided by an estimate of the combined SNAP, TANF, and FDPIR populations. The SNAP population estimate used here is the same one used in the performance measure developed earlier. The number of children in households that receive TANF but not SNAP benefits is estimated from data found in the U.S. Census Bureau’s American Community Survey (ACS).30 The number of children who receive FDPIR benefits is estimated from FNS program and survey data.31
Details of this computation are summarized in the following equation. The two statistics in the numerator and the sum of the values in the denominator are given for each State in Table 3. Figure 10 displays the same data graphically.
Percent of SNAP, TANF, and
FDPIR participants
certified (directly or by application)
for free school meals
=
SNAP, TANF and FDPIR applicants identified as categorically
eligible on applications for free meals
(Table 3, column 3)
+ Directly certified students
(Table 3, column 2)
School-age children in
SNAP households
-
SNAP children in
non–base year Provision 2/3
schools
+
School-age children in TANF households that
do not participate in SNAP
+
School-age children in
FDPIR households
The 34 States at the top of Figure 10 certified at least 90 percent of students who were
categorically eligible for free meals based on their participation in SNAP, TANF, or FDPIR. This number is up from 26 States last year. States at the bottom of Figure 10 are the least successful at identifying and certifying these children.32
29 Some children might not be identified as categorically eligible even if they are current recipients of SNAP, TANF, or FDPIR
benefits. These students might be missed by the States’ direct certification systems. Others might fail to submit SNAP, TANF, or FDPIR case numbers on paper applications for free meals. Some of these children are nevertheless certified for free meals based on income information submitted by application. Others are misclassified as ineligible for free meals.
30 See Appendix D for a discussion of data limitations. ACS data are not available for Guam. Therefore, Guam is not included
in the analysis of the more comprehensive categorical eligibility certification measure. No adjustment is made for TANF (or FDPIR) participants who are not SNAP participants and who attend non–base year special provision schools.
31 The FDPIR population survey is discussed in Usher et al. (1990). See Appendix D for a discussion of data limitations. Note
that FDPIR households may not simultaneously participate in SNAP. No adjustment is made for FDPIR (or TANF) participants who attend non–base year special provision schools.
32 See Appendix Figures A.8 through A.13 for U.S. maps providing a geographic view of these State estimates.

Mathematica Policy Research
19
Table 3. Categorically Eligible Students: Number Directly Certified and Number Approved by Application, SY 2012–2013 (thousands)
U.S. Total 14,669.8 12,282.2 1,694.4 Alabama 308.6 255.9 20.2 Alaska 26.1 29.6 1.0 Arizona 377.0 256.4 64.2 Arkansas 153.1 117.8 21.3 California 1,578.5 1,008.9 294.1 Colorado 194.0 128.2 25.2 Connecticut 94.5 85.8 15.0 Delaware 52.7 47.3 1.8 District of Columbia 35.2 34.5 1.2 Florida 1,025.4 913.9 92.0 Georgia 592.3 538.0 46.0 Hawaii 58.9 46.5 1.9 Idaho 82.7 61.9 3.0 Illinois 682.8 548.9 73.0 Indiana 297.8 239.7 40.0 Iowa 128.0 113.4 11.4 Kansas 99.8 98.7 5.1 Kentucky 233.0 263.1 18.3 Louisiana 345.2 253.4 46.2 Maine 69.1 49.6 6.5 Maryland 237.3 202.8 18.4 Massachusetts 243.7 191.6 17.7 Michigan 515.5 495.4 60.1 Minnesota 183.0 145.6 27.2 Mississippi 220.1 165.5 26.0 Missouri 315.2 241.3 46.4 Montana 32.4 19.4 6.0 Nebraska 59.8 63.6 3.9 Nevada 128.3 104.5 12.3 New Hampshire 38.7 20.5 6.5 New Jersey 283.9 227.2 36.7 New Mexico 81.9 59.8 16.5 New York 697.1 819.3 59.2 North Carolina 564.5 442.7 46.3 North Dakota 12.1 13.4 1.8 Ohio 552.4 481.2 72.9 Oklahoma 209.0 170.5 38.2 Oregon 228.5 151.5 17.6 Pennsylvania 464.8 333.2 42.1 Rhode Island 46.4 40.5 3.3 South Carolina 281.0 235.0 30.6 South Dakota 30.5 23.1 3.6 Tennessee 409.7 379.2 16.7 Texas 1,295.6 1,213.0 197.3 Utah 98.7 86.0 12.6 Vermont 23.0 20.7 3.7 Virginia 263.6 242.4 23.9 Washington 330.6 246.2 30.8 West Virginia 101.5 107.2 1.3 Wisconsin 273.7 237.3 26.1 Wyoming 12.6 11.3 1.3

Mathematica Policy Research
20
Figure 10. Percent of Categorically Eligible Children Certified for Free School Meals, SY 2012–2013
Note: The percentages in this figure are equal to the ratio of categorically eligible students certified for free meals by application, directly certified
students, and other students eligible for free meals whose applications are not subject to verification, to all SNAP-, TANF-, and FDPIR-participant school-age children. For a tabular presentation of these data, see Table A.3. Bars shaded dark blue represent estimates capped at 100 percent. See Appendices C and D for a discussion of data sources and data limitations.
Mathematica Policy Research
21
V. DIRECT CERTIFICATION BEST PRACTICES
The Food, Conservation, and Energy Act of 2008 (P.L. 110-234) requires a discussion of best practices with States that have successful direct certification programs. To fulfill this requirement, FNS contracted with Mathematica Policy Research to conduct interviews with child nutrition (CN) administrators and direct certification experts and to host a roundtable discussion among FNS, Mathematica, and CN officials from several States with successful direct certification programs.
Several criteria were used in the selection of the States for the best practices portion of the study. States were selected to participate primarily on the basis of direct certification performance during SY 2012–2013, or positive change in the percentage of eligible children directly certified compared with the previous school year. In addition, selection reflected the diverse perspectives of States in different parts of the country with different types of matching systems, and included States that had not been highlighted in previous years’ reports.
Six States were interviewed for this review: Alaska, the District of Columbia, Kentucky, Michigan, Rhode Island, and Utah. These six States fulfill the desired mix of criteria for selection, and none of them were featured in previous direct certification best practices reports. Five of these States use a central matching system; Kentucky uses a local matching system. Representatives from all six, plus Kansas and New York, participated in the roundtable discussion. In addition, two experts with knowledge of the direct certification information technology (IT) and processes offered their perspectives on best practices, methods, and the role of technology. One expert owns a consulting firm that provides a wide variety of IT products, including CN data management software systems, and that recently completed the first of two phases of implementation of a direct certification system with Utah. The other expert is a technology consultant for the Rhode Island Department of Education (RIDE).
The rest of this chapter includes a description of State practices (Section A); recent and planned strategies for improving direct certification (Section B); best practices and suggested improvements in implementing direct certification systems (Section C); and challenges States face in meeting direct certification rate targets required by HHFKA (Section D).
A. Description of State Practices
The primary goal of direct certification is to identify children in households participating in the SNAP and certify them as eligible for free school meals without application. States can also use information about children enrolled in qualifying programs, such as TANF, foster care, Medicaid, and FDPIR.33 In SY 2012-2013, five States were authorized to incorporate Medicaid data into direct
33 TANF information can be used for direct certification of children for free school meals only in states with TANF income
eligibility criteria comparable to or more restrictive than those in effect on June 1, 1995 (P.L. 104-193), when the Personal Responsibility and Work Opportunity Reconciliation Act of 1996 replaced Aid to Families with Dependent Children with TANF. All States interviewed use both SNAP and TANF program data for direct certification.

Mathematica Policy Research
22
certification as part of a pilot demonstration. Methods for direct certification have evolved over time. Currently, there are two main methods34 for conducting direct certification:
1. Central matching system. A State agency uses computer matching to link SNAP records with student enrollment records and distributes match results to LEAs. In some States LEAs initiate the match or access match results from the central matching system
2. Local matching system. A State agency distributes SNAP data to LEAs and LEAs match these data with their student enrollment lists.
Within these two primary matching methods, actual processes and procedures for direct certification vary considerably, even among States with the same general method of matching. Our review of State systems is similar to the reviews conducted in previous years, focusing on five key questions about direct certification:
1. Which administrative entity is responsible for matching SNAP/TANF records with student records (that is, is it a central matching or a local-level process)?
2. How is a match made? What identifiers and matching rules are used to form the match?
3. Is any attempt made to directly certify initially unmatched or partially matched SNAP/TANF children?
4. When and how often are records matched?
5. What direct certification methods are available to nonpublic schools?
This year, we also asked States about (1) the effectiveness of performance targets and awards and/or CIPs as incentives for improving direct certification efforts; and (2) thoughts about revisions to the FNS-742 (SFA Verification Collection Report), the new FNS-834 (Direct Certification Data Element Report), and revisions to the direct certification performance rate formula.
Table 4 summarizes State approaches for directly certifying students enrolled in public LEAs.
34 Another approach to direct certification is the letter method, whereby a State agency or LEA sends letters to SNAP-
participant households, which then take the letter to their schools in lieu of a school meal benefit application. HHFKA required States to phase out the letter method by SY 2012–2013. No State currently uses the letter method as its primary means of direct certification.

D
RA
FT
23
Table 4. Characteristics of the Direct Certification Matching Process for Public LEAs in Selected States, SY 2012–2013
State Type of Matching
System How Does Direct Certification Work? Approach for Unmatched
Students? Frequency of Direct
Certification
Alaska Central Department of Education staff match SNAP, TANF, and Foster Care data against statewide school enrollment data monthly. They transmit matched and unmatched lists to districts via encrypted e-mail. Each district receives lists only for its geographic area. Program participation data are updated monthly; statewide school enrollment data are updated annually.
Districts are required to identify enrolled students on the unmatched list each month.
Monthly
District of Columbia
Central Office of the State Superintendent of Education (OSSE) staff match school enrollment data against SNAP, TANF, Foster Care, and homeless data daily through the State Longitudinal Educational Database (SLED). School districts retrieve the matched lists through their local SLED interfaces. School enrollment data are updated in real time; OSSE staff receive updated SNAP and TANF data monthly.
None. Daily
Kentucky Local Each month, the Cabinet for Health and Family Services provides two data files to the Department of Education (KDE). One file contains SNAP, TANF, and Medicaid program enrollment data; the other contains Foster Care data. KDE staff add county information and student identification numbers to the files to filter the results. Districts match the program data with their local enrollment files, mainly through their point-of-sale or student enrollment systems.
District discretion. Monthly
Michigan Central The Department of Human Services (DHS) provides SNAP, TANF, and Foster Care data to the Department of Education for direct certification matching on a biweekly and monthly basis. The Michigan Center for Educational Performance and Information (CEPI) matches these program data with school enrollment data that are updated three times a year. The Department of Education posts the matched list on a secure website where districts can access it.
District staff can look up individual students, but they do not receive lists of unmatched program participants.
Biweekly, August–September
Monthly, October–May
Rhode Island Central Districts upload their enrollment files to the statewide student information system (SSIS). Department of Education (RIDE) staff combine them into a statewide enrollment list and transfer it to DHS. DHS staff match the enrollment list with their SNAP and TANF program data and return a list of matched students to RIDE. Staff at RIDE break the list into district-specific lists and post them on a secure website for districts to download.
None. Monthly
Utah Central The Utah State Office of Education (USOE) completes the direct certification match of SNAP, TANF, and Foster Care program data in three different ways: (1) districts can access a matched list USOE generates nightly that compares program data with enrollment data from the state’s SSIS; (2) districts can initiate a match between program data and enrollment data maintained on USOE’s central UTREx database; or (3) districts can upload a current student enrollment list for USOE staff to match against program enrollment data.
District staff can look up individual students, but they do not receive lists of unmatched program participants.
Daily

Mathematica Policy Research
24
Central or Local Matching
Five States in this review use central matching systems for direct certification: Alaska, the District of Columbia, Michigan, Rhode Island, and Utah. Kentucky uses a local matching system. The key distinctions between central and local matching are as follows:
Central matching system. With central matching, a State agency (usually the CN agency) is responsible for a system that, using a common identifier, matches a list of children attending schools participating in the NSLP with a list of children in SNAP households. This system can be set up in a variety of ways, for example:
- A State agency matches State enrollment information with a State list of children in SNAP households. A list of students directly certified on the basis of this match is forwarded to districts, which then notify the households.
- A State agency conducts an initial match and sends a list of matched students to districts, which then verify the matches, obtain further information on students who are potential matches, or conduct other types of secondary matching.
Districts upload enrollment information into a State-maintained computer or web-based system and then initiate a match against a list of children in SNAP households. Students are directly certified on the basis of this match.
Local matching system. With local matching, LEAs have primary responsibility for matching, using at least one common identifier, a list of children enrolled in their schools with a list of children in SNAP households. Some States using local matching provide districts with a list limited to children in SNAP households in the district’s geographic area; others provide a full Statewide list. Districts can use manual methods or their own computer systems to conduct matching.
The five States that use central matching have sophisticated matching systems with processes that have evolved to meet performance benchmarks. Several of these States have also recently increased the number of program data sources and match frequency in an effort to directly certify as many eligible students as possible. Kentucky, the local matching State, has also been making steady improvements to their processes by increasing data security and the frequency of the match process.
Alaska has been using the same central matching system since 2005. The system conducts an automated matching process monthly and delivers the results to districts via an encrypted email. The District of Columbia’s central matching system is built on the State Longitudinal Education Database (SLED), which performs matches of nightly updated enrollment data from SNAP, TANF, and foster care. Districts download their own results and can look up individual students through the SLED portal. Michigan has made incremental improvements to their central matching system since its inception in 2006. Key features include an individual student lookup tool added in SY 2012–2013, secure access to matched lists for districts to download, and increased frequency of matching. In SY 2012–12013, Rhode Island made two significant improvements to their central matching system by increasing the match frequency from quarterly to monthly while also enhancing their algorithm by introducing probabilistic matching and phonetic matching. Utah uses a hybrid approach to its central matching system, giving districts the choice of three methods for conducting matching: (1) Districts can access a matched list State Office of Education staff produce nightly using district SIS data. (2) Districts can initiate a match in the State system using student enrollment data in the Utah eTranscript and Record Exchange (UTREx) system. (3) Districts can initiate a

Mathematica Policy Research
25
match in the State system by uploading a current student enrollment file. All three options match enrollment data against the most current program participation data in the State system. Smaller districts generally use the first option. Larger districts generally use options two or three, though the option requires them to keep their enrollment data in UTREx current.
Kentucky has made improvements to their local-level matching process over the past couple of years. They have increased their data security by moving to a secure website from which districts download the SNAP/TANF/Medicaid file and foster care file to match against locally. Districts use their own processes to match the program data with their enrollment lists. In an effort to improve their direct certification rate, Kentucky switched to providing the program data to districts on a monthly basis in July 2011.
Overview of the Matching Process in Six States
All six States in this review used electronic matching algorithms in SY 2012–2013. In Kentucky, where the districts do the matching, all but one public district and some small private schools use some form of computer matching, through either their point-of-sale (POS) or their student enrollment systems. There is some commonality among the interviewed States in the frequency with which they receive, from their respective social services agencies, the program data to use in the matching process. Although most of the states receive these data monthly, Utah receives updates to program data weekly, and in certain months Michigan receives an updated file biweekly. All six States used students’ names (first and last) and dates of birth in the direct certification matching process. Only two of the six States reported using Social Security numbers (SSNs), when available. In the rest of this section we describe, separately for central and local approaches, the matching process, identifiers, and program data used to form direct certification matches.
a. Matching Process for States Using Central Matching Systems
All five central matching States used a program data file with information on both SNAP and TANF receipt. In addition, all but one of the central matching States has incorporated Foster Care data into their matching process. There are some differences among the central matching States in the agency administering the program and the agency that actually performs the matching. In Rhode Island, RIDE provides enrollment information to the Department of Human Services (DHS), which performs the matching. The Michigan Department of Education (MDE) administers the NSLP program, but the actual matching of the program data to the enrollment data is done by the Michigan Center for Educational Performance Information (CEPI), which is under the State Budget Office. Three States use their statewide student information system (SSIS) as their matching tool, but there are some differences in the structure of their systems and the options for matching. Although all these States rely on a centrally developed system for conducting the primary direct certification matching, local districts play a large role in finalizing matches and conducting secondary matches or initiating the matches in the central matching system.
There was much commonality in the program data that States receive and incorporate into the matching process. All but one of the States use foster care data in their matching process in addition to SNAP and TANF data. In both Alaska and the District of Columbia, the Department of Human and Social Services and the Department of Human Services Income Maintenance Administration, respectively, send SNAP/TANF program data files that are uploaded into their matching systems each month. In addition, both States receive a separate file of foster care children monthly from separate agencies. Michigan receives their SNAP/TANF/foster care data in a single file biweekly in August and September and monthly otherwise. Utah automatically receives SNAP/TANF data at

Mathematica Policy Research
26
least once a week, with foster care data coming less frequently. Since DHS in Rhode Island performs the matching for direct certification, no program data files are sent to RIDE; instead, RIDE compiles district student files into the monthly RI Student Match file and sends the file to DHS.
The matching criteria used in the five central matching States (Table 2) had some common threads, but there was variation in (1) the elements used in the matches, (2) the use of probabilistic matching, and (3) the treatment of potential matches. All States distinguish between definite matches (which are directly certified automatically) and potential matches (which can be directly certified based on further investigation); however, States use different processes to resolve potential matches. For example, Utah provides districts with lists of partially matched students so that they can compare them with their local enrollment records. By contrast, the District of Columbia allows districts to look up individual students in the State system, but does not provide them with a list of potential matches. In addition, all States require exact matches on the primary identifiers to determine a definite match, but specific elements and methods used to determine a definite match vary across States. Table 5 presents the specific data elements required to determine exact matches in the central matching States.
Table 5. Primary Matching Criteria for States That Use Central Matching Systems
Alaska District of Columbia Michigan Rhode Island Utah
First Name ● ○ ○ ○ ●
Last Name ● ○ ○ ○ ● Middle Initial ○ Date of Birth ● ○ ○ ○ ● Social Security Number ○ Gender ○ ○ ○ Race/Ethnicity ○ ○ Address ○ Zip Code/Location Code ○ ○ ○ Parents’ Names Eligibility System Personal ID Number
○
○
Eligibility System Family ID Number
○
○
Notes: ○ Exact match can be used in identifying a definite match; inexact match can be used to identify a potential match. ● An exact match is required for the given field.
No symbol indicates that the criterion is not used or not available.
Alaska. Every month, Alaska receives a SNAP-and-TANF file that contains case numbers, first name, last name, date of birth (DOB), SSN, location code, and program enrollment. (The last field was added to the file in SY 2012–2013 to distinguish between SNAP and TANF.) Another addition in SY 2012–2013 was incorporation of foster care children data into the matching process. The direct certification system imports the program data each month and performs an automated match against school-aged (ages 6–19) public and charter school students. Students who match exactly on first name, last name, and DOB are considered exact matches. The system also checks whether the students have an Alaska Student ID Number to identify the districts of each matched and unmatched student. Before sending the list to the districts via encrypted email, the Education Department sorts the statewide list by district, breaking out the matched list and the list of potential matches for districts to review to see whether they are enrolled.
The District of Columbia. The Office of State Superintendent of Education (OSSE) has developed and maintained a comprehensive data warehouse, SLED, which performs the data-matching process for direct certification. Each month, OSSE receives a file that contains SNAP,

Mathematica Policy Research
27
TANF and General Assistance for Children program participant data for children aged 3 to 22. OSSE also receives a file with foster care program data from the Child and Family Services Agency. Once received, the program data are matched against public and charter school enrollment data that are updated nightly in the SLED system. The data are matched daily using a three-tiered algorithm that scores matches based on four data elements: SSN, DOB, first name, and last name. If SSN matches exactly, it is considered an exact match; if DOB and first and/or last name match but SSN does not, it is considered a high match; if only one of the non-SSN data elements matches, it is considered a low match and may require a manual review. LEAs log into the SLED web-based portal to view and download match results.
Michigan. Since 2006, Michigan has added security features, increased the frequency of matching, and added an individual student lookup feature to their direct certification process. In Michigan, multiple agencies come together to perform direct certification: (1) the MDE administers the program and oversees direct certification; (2) the DHS allows MDE direct access to their SNAP, TANF, and foster care data, which are distinguished with program indicators; and (3) CEPI, under the State Budget office, houses the Michigan Student Data System, which maintains the enrollment data that districts upload directly, assigns a unique student ID code, and performs the direct certification data-matching process. In August and September, MDE accesses updated program data biweekly; from October through July, the data are available monthly. MDE uses probabilistic matching with first name, last name, DOB, and gender as the primary criteria. Scores above 95 percent are considered matches; scores below are not. Zip code can be incorporated into the algorithm to enable partial matches to meet the 95 percent threshold. Once the matching process is complete, MDE conducts spot checks to make sure the report is correct and informs the public and private school districts the matched list results are ready for download.
Rhode Island. In SY 2012–2013, with the help of two grants, Rhode Island made significant changes to their direct certification process, enabling monthly matches using an enhanced algorithm. Districts upload their enrollment files continuously to RIDE’s SSIS, which are then sent monthly to DHS for matching. The DHS INRHODES system performs the matches using a probabilistic algorithm that incorporates Metaphone fuzzy logic. The results are sent back to RIDE and then posted on a secure website for LEAs to download.
Utah. In SY 2012–2013, Utah moved to a complete central matching system (having previously been a local matching State). The Office of Education (USOE) receives SNAP and TANF data from the Department of Workforce Services. Matches must be exact on first name, last name, and DOB. USOE offers three ways for districts either to access or to initiate the direct certification match:
1. Districts can access the lists that match the enrollment data from their SIS and the SNAP/TANF/foster care data; generally, the smaller districts use this option.
2. Districts can match SNAP/TANF/foster care data against real-time enrollment data housed in the UTREx system.
3. Districts can also perform the match with their own enrollment lists uploaded into the system. Districts download an electronic file of matched and unmatched students once the matching is complete. District staff must manually verify possible matches, but they can do this through the system’s individual lookup feature, which allows them to upload additional information and use Soundex technology to confirm matches.

Mathematica Policy Research
28
b. Matching Process for State Using Local Matching System
Kentucky offers flexibility to districts in the direct certification matching process. Every month, the Kentucky Department of Education (KDE) receives a file of SNAP, TANF, and Medicaid data and a separate file of foster care children from the Cabinet for Health and Family Services. Those files are processed through KDE’s IT Capital Knowledge, Information and Data Services (KIDS) system, where KIDS adds county information, unique identifiers, first and last name, and DOB. They post both sets of files on the secure website based on county. Districts match against these files generally through their POS systems.35 The flexibility is in the elements that can be matched: districts can match on any of the five data elements they are provided (though matching on SSN or student identification number is considered best). Districts are afforded this flexibility because there are multiple POS systems in the state and the data elements they include may vary.
Table 6. Characteristics of Data Provided to Districts in Kentucky, a State with a Local Matching System
Key Characteristics File allows computerized matching
Includes information for children receiving SNAP and TANF benefits
Incorporated foster care data in spring 2012
Utilize Medicaid data as part of demonstration project
Data Elements Provided Social Security number
First name
Last name
Date of birth
Student Identification Number
Frequency of Match
Each State performs its first direct certification match before the school year begins. As shown in Table 4, all the States have recently increased the frequency of matching to at least monthly, with two of the States offering daily matches and one other State performing biweekly matches at the beginning of the school year.
A direct certification match before the beginning of a new school year directly certifies only children who are enrolled in SNAP or TANF at that time. By obtaining updates of newly enrolled SNAP or TANF recipients, States can identify and directly certify students who become eligible at other points during the school year, making direct certification a more dynamic process.
The States included in this review were similar in that they received program data from their various partner agencies at multiple points throughout the year. Alaska, Kentucky, and the District of Columbia receive updated program data each month. Direct certification matching processes in Alaska and Kentucky are designed to coincide with the receipt of the updated program data and thus occur monthly; the District of Columbia performs their matching algorithms daily. Rhode Island sends their enrollment data monthly to their partner agencies for matching. Michigan directly accesses SNAP, TANF, and foster care data from DHS biweekly or monthly and sends an amended file to CEPI for matching based on those timing intervals of the program data. Utah receives SNAP
35 Only one public district in Kentucky does not have a POS and does a manual match. Some smaller private schools also
conduct manual matching.

Mathematica Policy Research
29
and TANF data at least weekly but receives foster care data less frequently. Utah’s system performs a match daily but has options available for districts to match at times of their choosing.
All States interviewed had their own SSIS, which for most States was housed and maintained in the State education agency. The frequency at which the enrollment data were updated had some variation across the States. The District of Columbia, Rhode Island, and Utah each have student enrollment information that can be updated daily through their SSIS. In DC, the SLED system receives automatic feeds of public school enrollment information from the State Automated Reporting System (STARS) and charter school student information from the ProActive system. Rhode Island’s districts upload their enrollment files each month to be sent to DHS for matching. Utah moved to daily enrollment updates through UTREx system in the fall of 2012. Prior to that, enrollment information was updated only once a year. Alaska updates its enrollment data once a year, during the fall. Michigan collects enrollment data three times a year, though districts can submit interim data at any time. For the initial direct certification matching, MDE uses the previous year’s data plus a roster of expected enrollment of the upcoming school year. After the fall data collection, the matches are based on districts’ actual enrollment. In Kentucky, the enrollment data are made available to the KIDS system through the batch upload process. Districts match the amended file they receive from MDE to their own enrollment records.
Methods to Directly Certify Unmatched SNAP/TANF Children
Among States interviewed for this review, approaches to identifying and resolving the status of children enrolled in SNAP or TANF who are not matched to student enrollment records through the initial match procedure vary (Table 7). The District of Columbia, Michigan, and Rhode Island do not send lists of unmatched or partially matched students to the districts for further review, though both DC and Michigan allow districts to use their lookup features to view (but not directly certify) individual students. Rhode Island is working with DHS on getting a list of unmatched children for SY 2013–2014. Kentucky does not have a formal process or guidance within its local matching system for districts to certify unmatched children. In two States, the districts review unmatched records, though States generally do not provide much formal guidance or requirements for these secondary match methods. Utah has an individual lookup feature that enables districts to investigate children who matched on some—but not all—data elements. In Alaska, the State performs a manual review of partial and unmatched children before sending the unmatched list to the districts. Districts are required to review the list to see whether any unmatched children are enrolled and, if they are, send the names and student ID numbers back so they can be identified in future months.
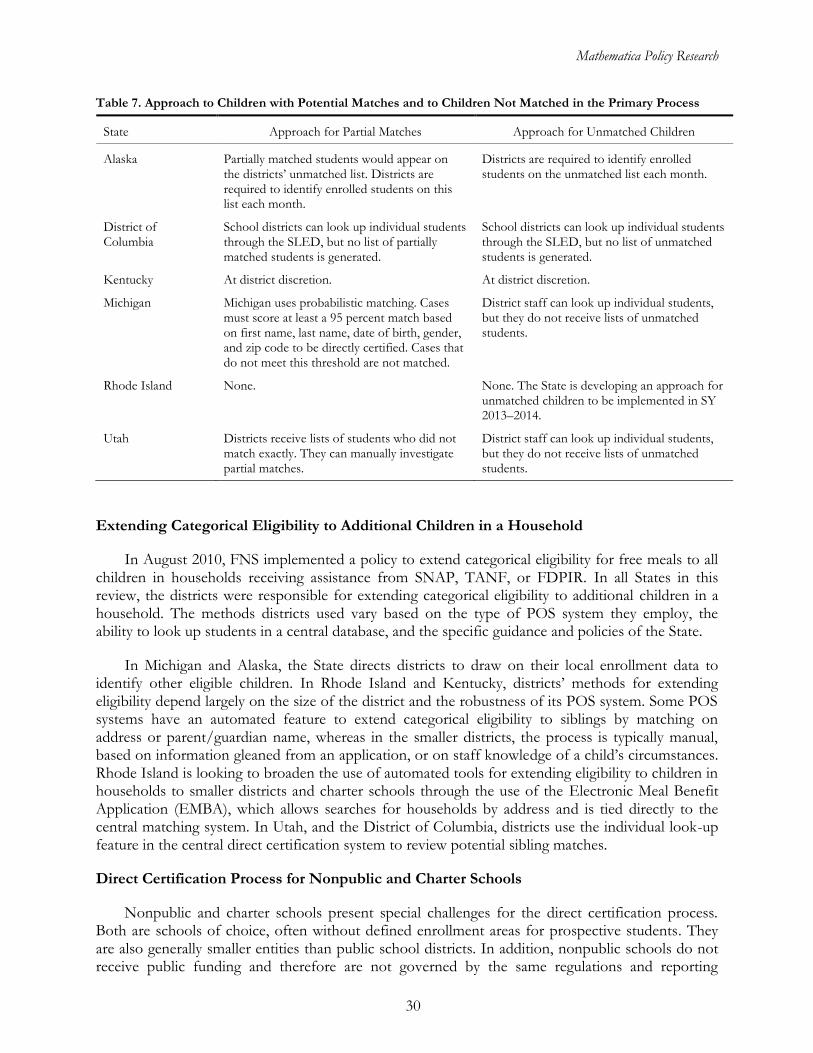
Mathematica Policy Research
30
Table 7. Approach to Children with Potential Matches and to Children Not Matched in the Primary Process
State Approach for Partial Matches Approach for Unmatched Children
Alaska Partially matched students would appear on the districts’ unmatched list. Districts are required to identify enrolled students on this list each month.
Districts are required to identify enrolled students on the unmatched list each month.
District of Columbia
School districts can look up individual students through the SLED, but no list of partially matched students is generated.
School districts can look up individual students through the SLED, but no list of unmatched students is generated.
Kentucky At district discretion. At district discretion.
Michigan Michigan uses probabilistic matching. Cases must score at least a 95 percent match based on first name, last name, date of birth, gender, and zip code to be directly certified. Cases that do not meet this threshold are not matched.
District staff can look up individual students, but they do not receive lists of unmatched students.
Rhode Island None. None. The State is developing an approach for unmatched children to be implemented in SY 2013–2014.
Utah Districts receive lists of students who did not match exactly. They can manually investigate partial matches.
District staff can look up individual students, but they do not receive lists of unmatched students.
Extending Categorical Eligibility to Additional Children in a Household
In August 2010, FNS implemented a policy to extend categorical eligibility for free meals to all children in households receiving assistance from SNAP, TANF, or FDPIR. In all States in this review, the districts were responsible for extending categorical eligibility to additional children in a household. The methods districts used vary based on the type of POS system they employ, the ability to look up students in a central database, and the specific guidance and policies of the State.
In Michigan and Alaska, the State directs districts to draw on their local enrollment data to identify other eligible children. In Rhode Island and Kentucky, districts’ methods for extending eligibility depend largely on the size of the district and the robustness of its POS system. Some POS systems have an automated feature to extend categorical eligibility to siblings by matching on address or parent/guardian name, whereas in the smaller districts, the process is typically manual, based on information gleaned from an application, or on staff knowledge of a child’s circumstances. Rhode Island is looking to broaden the use of automated tools for extending eligibility to children in households to smaller districts and charter schools through the use of the Electronic Meal Benefit Application (EMBA), which allows searches for households by address and is tied directly to the central matching system. In Utah, and the District of Columbia, districts use the individual look-up feature in the central direct certification system to review potential sibling matches.
Direct Certification Process for Nonpublic and Charter Schools
Nonpublic and charter schools present special challenges for the direct certification process. Both are schools of choice, often without defined enrollment areas for prospective students. They are also generally smaller entities than public school districts. In addition, nonpublic schools do not receive public funding and therefore are not governed by the same regulations and reporting

Mathematica Policy Research
31
requirements present in public schools. Charter schools may either establish themselves as independent reporting agencies or affiliate with an LEA, which acts as an authorizing agency for reporting purposes.
For States in this review, the process for directly certifying students in participating charter schools was typically the same as the process for public school students (Table 8). In Alaska, Rhode Island, and Utah, charter school students are included in the direct certification match in the same way as public school students in those States. In Michigan, nonpublic school students can be directly certified using the same process as public school students, though schools must upload enrollment information separately. MDE has provided training to nonpublic schools to assist them with this requirement. The process for certifying private school students in the District of Columbia is a time-intensive one that involves a separate upload of enrollment data three times a year by private schools, followed by OSSE performing a manual matching process. In the local matching State of Kentucky, participating nonpublic schools are provided the same two county-specific files of SNAP/TANF/Medicaid and foster care data as public districts.
Table 8. Direct Certification Methods for Nonpublic Schools
State Direct Certification Process for Nonpublic Schools
Alaska Private schools are not included in the State’s direct certification system. In the past, participating private schools received matched and unmatched lists from the nearest public school system. All charter schools are public schools and use the same direct certification procedures as other public schools.
District of Columbia
Nonpublic schools are not included in the SLED portal that public schools use. Private schools use a manual matching process three times per year.
Kentucky All nonpublic schools participate using the same processes as public districts. There are no charter schools in Kentucky.
Michigan Nonpublic schools are exempt from the three annual student enrollment data updates the State requires of public schools. Therefore, private and charter schools that participate in direct certification must upload student data specifically for the matching process. Once they do, the process is the same that public schools follow.
Rhode Island Nonpublic, private schools did not participate in direct certification in SY 2012–2013. All charter schools are public and participate in direct certification.
Utah Private schools commonly rely on nearby public schools to identify directly certified students on their behalf. They have the option of uploading their local enrollment lists to the State UTREx database for matching. In SY 2012–2013, only one private school did so. Many charter schools access USOE’s matched list through the SSIS for direct certification.
In Utah most private schools have their direct certification procedures completed by nearby public schools. Only one private school participates directly by uploading its enrollment list to the State system. Only half of Utah’s 80 charter schools participate in the NSLP; students in the schools that do not participate cannot be matched.
None of Alaska’s private schools are included in the State’s direct certification system, though there are very few of them in the State. All charter schools in Alaska are publicly run and are fully integrated into the State’s direct certification system.
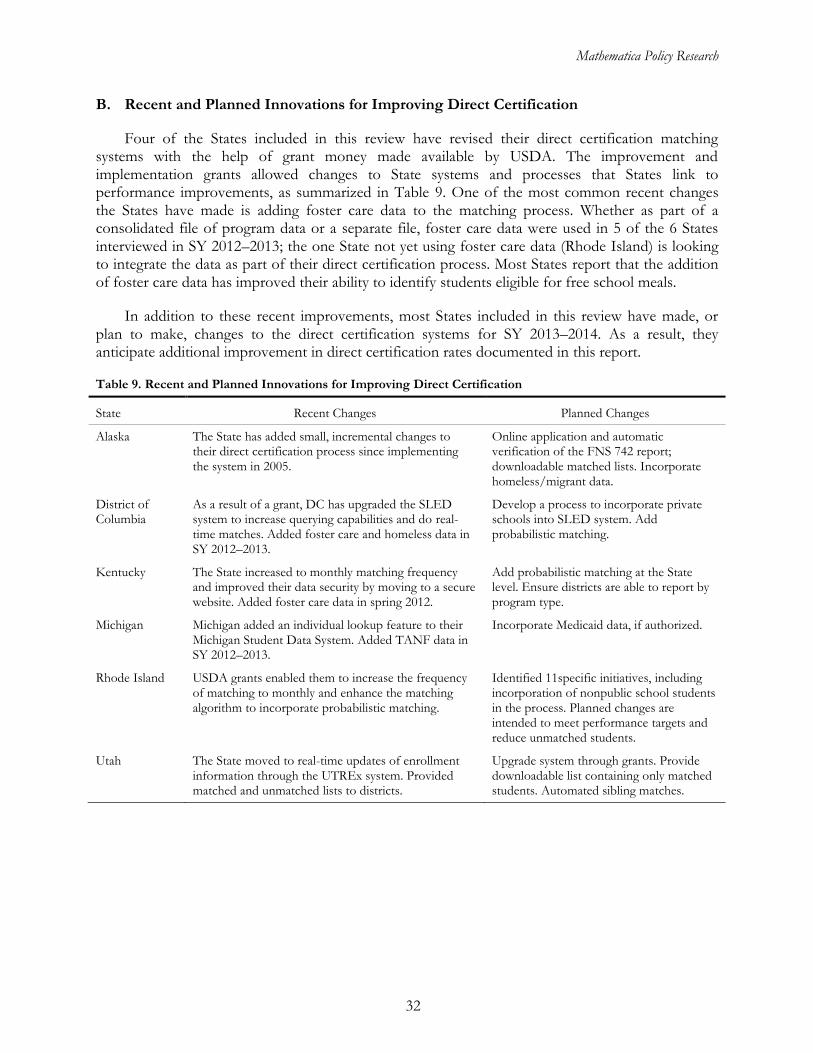
Mathematica Policy Research
32
B. Recent and Planned Innovations for Improving Direct Certification
Four of the States included in this review have revised their direct certification matching systems with the help of grant money made available by USDA. The improvement and implementation grants allowed changes to State systems and processes that States link to performance improvements, as summarized in Table 9. One of the most common recent changes the States have made is adding foster care data to the matching process. Whether as part of a consolidated file of program data or a separate file, foster care data were used in 5 of the 6 States interviewed in SY 2012–2013; the one State not yet using foster care data (Rhode Island) is looking to integrate the data as part of their direct certification process. Most States report that the addition of foster care data has improved their ability to identify students eligible for free school meals.
In addition to these recent improvements, most States included in this review have made, or plan to make, changes to the direct certification systems for SY 2013–2014. As a result, they anticipate additional improvement in direct certification rates documented in this report.
Table 9. Recent and Planned Innovations for Improving Direct Certification
State Recent Changes Planned Changes
Alaska The State has added small, incremental changes to their direct certification process since implementing the system in 2005.
Online application and automatic verification of the FNS 742 report; downloadable matched lists. Incorporate homeless/migrant data.
District of Columbia
As a result of a grant, DC has upgraded the SLED system to increase querying capabilities and do real-time matches. Added foster care and homeless data in SY 2012–2013.
Develop a process to incorporate private schools into SLED system. Add probabilistic matching.
Kentucky The State increased to monthly matching frequency and improved their data security by moving to a secure website. Added foster care data in spring 2012.
Add probabilistic matching at the State level. Ensure districts are able to report by program type.
Michigan Michigan added an individual lookup feature to their Michigan Student Data System. Added TANF data in SY 2012–2013.
Incorporate Medicaid data, if authorized.
Rhode Island USDA grants enabled them to increase the frequency of matching to monthly and enhance the matching algorithm to incorporate probabilistic matching.
Identified 11specific initiatives, including incorporation of nonpublic school students in the process. Planned changes are intended to meet performance targets and reduce unmatched students.
Utah The State moved to real-time updates of enrollment information through the UTREx system. Provided matched and unmatched lists to districts.
Upgrade system through grants. Provide downloadable list containing only matched students. Automated sibling matches.

Mathematica Policy Research
33
C. Best Practices in Implementation of Direct Certification Systems
Advice for Low-Performing States in Meeting Performance Targets
HHFKA requires that States develop CIPs if they do not meet the direct certification performance rate benchmarks. The CIPs must include a step-by-step plan for implementing changes that will improve direct certification rates. In the best practice interviews, States were asked what suggestions they would offer to a low-performing State in developing a CIP. Experts in direct certification were also consulted on this topic. State suggestions, which are summarized in Table 10, can be categorized into three main points of emphasis: (1) utilize direct certification grants to develop/update the central matching system; (2) foster strong relationships with data partners; and (3) match frequently using timely, accurate data.
Table 10. Suggestions for Improving Direct Certification Rates
State Suggestions for Improving Direct Certification Rates
Alaska Conduct matching as frequently as possible.
Remove as many barriers as possible in the process to certify students promptly.
District of Columbia
Use a web-based system with sophisticated algorithms and query capability.
Match using real-time data.
Foster good relationships with program data partners.
Kentucky Use a central matching process.
Have secure website for monthly downloads of data.
Attach a unique centralized student ID to program data.
Michigan Use a central matching process.
Apply for direct certification grants.
Focus on interagency collaboration.
Provide good training and outreach to districts.
Rhode Island Use CIP to identify to major shortcomings in your process.
Have complete, up-to-date, and accurate enrollment data.
Have an automated electronic process to receive data and disseminate results.
Utah Develop a seamless process for parents/guardians of eligible students.
Have multiple direct certification matching options for districts.
The use of direct certification grants in developing and upgrading current systems is seen as integral to improving the efficiency and performance of State direct certification systems. All States interviewed have used direct certification improvement, implementation, and/or Administrative Reviews and Training (ART) method grants to improve their systems. Having a strong, central matching system was the most common recommendation from States. Even Kentucky, the lone local matching State, suggested the use of a central matching process.
One expert who worked with Utah in the implementation of their matching system cited the importance of having both program and enrollment data updated frequently for timely, accurate matching. The District of Columbia also stressed the importance of real-time data and attributed the daily updates to improved performance. To get more frequent data for matching, States emphasized

Mathematica Policy Research
34
strengthening relationships program data partners. Fostering strong partnerships is especially important to States that have processes involving multiple agencies. Michigan, which relies on three agencies to support direct certification, emphasized the need for good interagency cooperation in making their system work.
A few of the States discussed system ease of use to improve performance and facilitate the efficient exchange of data among data partners and the districts. Both Alaska and Utah indicate the goal for any system is that children receive the benefits for which they are eligible with minimal to no burden for parents and guardians. Seamless identification of eligible students is also beneficial for the schools as it limits the students who are eligible but not certified from accumulating debt that schools are unlikely to recover. One expert discussed the importance of designing a clean, easy-to-use interface to get better matches and encourage districts to use the system.
Performance Targets, Awards, and CIPs as Incentives and Tools for Improvement
Most of the States in this review have made changes to their direct certification systems with an eye toward meeting the performance benchmarks set forth in the HHFKA. When asked how effective those performance targets, and the resultant awards, were as incentives for further improvements to their direct certification system, States indicated that the main motivation in their direct certification process was to directly certify as many eligible students as possible. Most States also reported that the performance targets and awards were an effective means of promoting improvements in their system, provided that they are coupled with sufficient resources for States to make changes to their systems. Both Michigan and the District of Columbia reported the performance targets are extremely effective way to focus improvements and that having the grant money available helps make the changes possible. Alaska mentioned that the performance targets and rewards are especially helpful in getting the attention of low-performing States and in increasing the priority of direct certification efforts. Rhode Island indicates that having targets to work toward was beneficial, but that changes in State law that ties funding to the school meal benefit profile of districts was a greater incentive for districts to maximize the matching and other certification processes.
In December 2012, FNS issued a CIP Development Guide to assist States in designing and implementing a CIP that would help them achieve the desired performance improvements. The first step in the guide is for the State agency to perform a self-assessment using a tool that lists components and features of strong direct certification systems. In the interviews, the States were asked whether they were familiar with the tool and whether they had used it to plan changes to their direct certification system. All the States interviewed had looked at the tool, and the general reaction was very positive. Most States indicated that the tool was helpful in examining their current processes and thinking through potential changes. Some of the States noted that they used the recommendations in the tool to make tweaks in their current system and processes and plan for future changes. Kentucky consulted the tool to identify improvements for the future including incorporating an individual student lookup feature, probabilistic matching, and strategies on reducing false-positive matches. Utah and Kansas used to the tool to generate ideas on improvements to include in their direct certification grant applications, including strategies on matching siblings and working with private schools. Rhode Island developed their CIP incorporating input from the tool; the agency said the tool helped them examine and prioritize next steps, and a number of their new initiatives were identified through its use.

Mathematica Policy Research
35
D. Challenges in Meeting Future Performance Rate Targets
HHFKA mandated that States meet certain direct certification performance targets. For SY 2012–2013, the direct certification performance target rate was 90 percent. Going forward, the target rate is 95 percent in SY 2013–2014 and beyond. This means that in SY 2012–2013, 90 percent of children enrolled in SNAP must be directly certified for free school meals (90 percent of program records must be matched to student enrollment records). As a part of this review, States were asked about the challenges they have experienced, or believe they might experience, in meeting these performance rate targets. As displayed in Table 11, every State other than Alaska identified at least one challenge they are working to overcome in meeting the performance targets.
Table 11. Challenges Identified by States in Meeting Direct Certification Rate Targets
Alaska District of Columbia Kentucky Michigan
Rhode Island Utah
Lack of access to unmatched list
Lack of timely enrollment data for incoming kindergarteners
Difficulty distinguishing SNAP and TANF receipt
Difficulty identifying other children in eligible households
Nonpublic schools not incorporated into direct certification system
Large school-aged SNAP population outside public school system
Enrollment data updated infrequently
Data quality concerns
Insufficient staff skills and training
Difficulty tracking intrastate transfers
Technology limitations
Mathematica Policy Research
36
As the table indicates, there were a wide variety of challenges that States faced in meeting the targets. One of the most frequently cited is related to children who receive SNAP benefits but who are not enrolled in schools that participate in the NSLP. Examples of these populations include home-schooled children, school dropouts, homeless children, and migrant children. Most interviewed States discussed these challenges. Challenges are also seen in students in nonpublic schools not participating in the NSLP or in nonpublic schools that do participate but are not fully incorporated into the automated direct certification process. As mentioned previously, the District of Columbia has a process for nonpublic schools, but it is separate from the public school process and is highly manual and time intensive. This presents challenges for DC, because a large portion of the enrollment at these nonpublic schools is made up of low-income students potentially eligible for free school meals. Michigan noted that the private schools that do participate in direct certification are sometimes not as diligent in providing the enrollment information for matching as public schools because they are not required to submit data to the State. Rhode Island has performed a gap analysis on their unmatched population and found a large number of students from private schools that were eligible for free school meals but are not being identified because private schools are not required to provide individual student data. To overcome these specific challenges, these three States are all working on improvements to their systems in the coming school year.
Challenges in Meeting New Data Collection Requirements
Starting in SY 2013–2014, FNS will require that States collect data for the revised FNS-742 (SFA Verification Collection Report) and the new FNS-834 (Direct Certification Data Element Report) as inputs into a revised computation of the direct certification rates. The major new data element requirements are identifying (1) the number of students directly certified through SNAP; (2) the unduplicated number of children aged 5-17 in SNAP households in July, August, and September; and (3) the number of SNAP children in special-provision schools operating in non-base years.
States were asked to provide their thoughts about the changes and describe their ability to provide the data. On balance, the States did not have many concerns about their ability to identify students directly certified through SNAP. Most of the States have already built that functionality into their system. One State noted that the new FNS-742 was more complicated than the previous version and that if a State did not have a good system to produce the report, they might struggle to fill out the form accurately. A few States said that they were not concerned with meeting the requirements but were concerned that the data request is overly focused on reporting SNAP children. In States where the districts fill out the FNS-742 form, there is some concern that POS systems may need some reprogramming to delineate the matched students correctly according to program type and stressed the need to incorporate new outreach and training to the districts that provide the FNS-742 data on the reporting requirements.
There was a little more concern with identifying the number of SNAP children in special-provision schools not operating in a base year, as required by the new FNS-834 form. This was especially true for those States using the Community Eligibility Option (CEO). The States understand the virtues of collecting good data but are concerned with the effect these new reporting requirements might have on the Provision 2 or 3 schools that become CEO schools. The District of Columbia has already incorporated the changes for their Provision 2 and CEO schools by including the direct certification numbers in their SLED system. CEO schools can look at their percentage rates and the eligibility status date to determine base and non-base years.
Mathematica Policy Research
37
VI. CONCLUSION
The number of students with access to free school meals continues to grow with the expanded use of direct certification and the improved performance of direct certification systems. As of SY 2012–2013, 99 percent of students nationwide are enrolled in a district that conducts direct certification. States and LEAs directly certified an estimated 89 percent of school-age children from SNAP-participant households in SY 2012–2013, up from an estimated 86 percent for the previous year and 68 percent in SY 2007–2008. Twenty-four States achieved direct certification rates of at least 90 percent, the direct certification target set by HHFKA for SY 2012–2013. Only one State had a direct certification rate lower than 60 percent. With both direct certification and paper applications, States and LEAs certified 95 percent of all categorically eligible SNAP, TANF, and FDPIR children for free school meals in SY 2012–2013; this is up from the 92 percent for the previous year.
States and LEAs continue to find success with different direct certification models. States and LEAs are making investments in their direct certification systems that promise improved performance in the coming years. Among the six states with successful or improved direct certification systems interviewed for this report, recent direct certification changes that States link to performance improvements include increasing match frequency, enhancing matching algorithms to include probabilistic matching, and including additional program data sources—such as foster care data—in matching processes. Many of these changes were made with an eye toward meeting the performance benchmarks set forth in HHFKA (90 percent for SY 2012–2013 and 95 percent in future years). In discussions surrounding challenges to meeting these benchmarks in future years, States frequently cited the inability of direct certification improvement measures to account for children who receive SNAP benefits but who are not enrolled in schools and thus not eligible for direct certification. These students include home-schooled children, school dropouts, and some homeless and migrant children. Another commonly cited challenge was incorporating nonpublic schools more efficiently into the direct certification process. Changes that States and LEAs make to their direct certification systems as they continue to seek new ways to address these challenges likely will affect direct certification rates in coming years.

Mathematica Policy Research
38
VII. REFERENCES
Bartlett, Susan, and Nancy Burstein. “Food Stamp Program Access Study: Eligible Nonparticipants.” Washington, DC: Abt Associates, Inc., 2004. Available at [http://www.ers.usda.gov/publications/efan03013/efan03013-2/efan03013-2.pdf].
Cole, Nancy, and Christopher Logan. “Data Matching in the National School Lunch Program: 2005 Volume 1: Final Report.” Cambridge, MA: Abt Associates, Inc., for the U.S. Department of Agriculture, Food and Nutrition Service, 2007. Available at [http://www.fns .usda.gov/ora/menu/Published/CNP/FILES/DataMatching-V1.pdf].
Eslami, Esa, Josh Leftin, and Mark Strayer. “Supplemental Nutrition Assistance Program Participation Rates: Fiscal Year 2010.” Washington, DC: Mathematica Policy Research for the U.S. Department of Agriculture, Food and Nutrition Service, 2012. Available at [http://www. fns.usda.gov/ora/MENU/Published/snap/FILES/Participation/Trends2010.pdf].
Eslami, Esa. “Supplemental Nutrition Assistance Program Participation Rates: Fiscal Years 2010 and 2011.” Final report submitted to the U.S. Department of Agriculture, Food and Nutrition Service. Washington, DC: Mathematica Policy Research, forthcoming 2013.
Mabli, James, Stephen Tordella, Laura Castner, Thomas Godfrey, and Priscilla Foran. “Dynamics of Food Stamp Program Participation in the Mid-2000s.” Washington, DC: Mathematica Policy Research for the U.S. Department of Agriculture, Food and Nutrition Service, 2011. Available at [http://www.fns.usda.gov/ora/MENU/Published/snap/FILES/Participation/Dynamics Mid2000.pdf].
Trippe, Carole, and Bruce Schechter. “Assets of Low-Income Households by SNAP Eligibility and Participation in 2010.” Washington, DC: Mathematica Policy Research for the U.S. Department of Agriculture, Food and Nutrition Service, 2010.
Trippe, Carole, and Jessica Gillooly. “Noncash Categorical Eligibility for SNAP: State Policies and the Number and Characteristics of SNAP Households Categorically Eligible Through Those Policies: Final Memo.” Washington, DC: Mathematica Policy Research for the U.S. Department of Agriculture, Food and Nutrition Service, 2010. Available at [http://mathematica-mpr.com/publications/PDFs/nutrition/non-cash_snap.pdf].
U.S. Census Bureau. “American Community Survey, Puerto Rico Community Survey, 2011 Subject Definitions.” Washington, DC: U.S. Census Bureau, 2011. Available at [http://www .census.gov/acs/www/Downloads/data_documentation/SubjectDefinitions/2011_ACSSubjectDefinitions.pdf].
U.S. Department of Agriculture, Food and Nutrition Service. “FNS Handbook 310: Supplemental Nutrition Assistance Program Quality Control Review Handbook.” Washington, DC: USDA, FNS, 2012. Available at [http://www.fns.usda.gov/snap/qc/pdfs/FNS_310_Handbook.pdf].
U.S. Department of Education, National Center for Education Statistics, Institute of Education Services. “Issue Brief: 1.5 Million Homeschooled Students in the United States in 2007.” Washington, DC: U.S. Department of Education, NCES, IES, 2008. Available at [http://nces.ed.gov/pubs2009/2009030.pdf].

Mathematica Policy Research
39
Usher, Charles L., David S. Shanklin, and Judith B. Wildfire. “Evaluation of the Food Distribution Program on Indian Reservations.” Washington, DC: U.S. Department of Agriculture, Food and Nutrition Service, 1990. Executive Summary and Chapter 1 available at [http://www.fns.usda.gov/ora/menu/Published/CNP/FILES/FDPIREval-1.pdf]; Chapter 2 available at [http://www.fns.usda.gov/ora/menu/Published/CNP/FILES/FDPIREval-2.pdf]; Chapter 3 available at [http://www.fns.usda.gov/ora/menu/Published/CNP/FILES /FDPIREval-3.pdf]; Chapter 4 available at [http://www.fns.usda.gov/ora/menu/Published /CNP/FILES/FDPIREval-4.pdf].

Mathematica Policy Research
APPENDIX A
ADDITIONAL TABLES AND FIGURES

Mathematica Policy Research
A.2
Table A.1. Number and Percent of LEAs That Directly Certified SNAP Participants, SY 2004–2005 Through SY 2012–2013
–
Direct Certification or Provision 2/3
LEAs
Direct Certification or Provision 2/3
LEAs
Direct Certification or Provision 2/3
LEAs
Number of
LEAs Number Percent Number of LEAs Number Percent
Number of LEAs Number Percent
U.S. Total 16,612 9,239 55.6 17,397 10,467 60.2 17,748 11,113 62.6 AK 54 43 79.6 35 34 97.1 47 43 91.5 AL 163 62 38.0 148 87 58.8 145 93 64.1
AR 251 247 98.4 258 12 4.6 281 256 91.1
AZ 302 251 83.1 333 243 73.0 334 256 76.6 CA 1,004 399 39.7 1,033 469 45.4 1,024 518 50.6 CO 178 44 24.7 168 68 40.5 205 78 38.0 CT 185 146 78.9 187 148 79.1 193 161 83.4 DC 47 1 2.1 51 4 7.8 52 2 3.8 DE 27 22 81.5 34 28 82.4 32 28 87.5 FL 145 74 51.0 96 62 64.6 145 88 60.7 GA 171 155 90.6 175 158 90.3 183 166 90.7 HI NA NA NA 32 18 56.2 38 20 52.6 IA 496 339 68.4 508 372 73.2 507 383 75.5 ID 125 97 77.6 266 218 82.0 133 106 79.7 IL 1,036 749 72.3 1,113 835 75.0 1,075 839 78.0 IN 407 73 17.9 468 106 22.6 478 143 29.9 KS 403 314 77.9 404 333 82.4 403 335 83.1 KY 197 128 65.0 192 145 75.5 189 154 81.5 LA 98 57 58.2 36 34 94.4 107 92 86.0 MA NA NA NA 357 216 60.5 370 232 62.7 MD 47 29 61.7 47 29 61.7 46 31 67.4 ME 245 199 81.2 228 194 85.1 233 201 86.3 MI 741 331 44.7 698 349 50.0 803 449 55.9 MN 610 392 64.3 620 387 62.4 630 413 65.6 MO 762 453 59.4 711 476 67.0 749 490 65.4 MS 183 93 50.8 72 47 65.3 184 134 72.8 MT 236 130 55.1 233 159 68.2 234 177 75.6 NC NA NA NA 172 117 68.0 178 133 74.7 ND 160 126 78.8 216 170 78.7 193 142 73.6 NE 407 241 59.2 433 313 72.3 381 290 76.1 NH 82 57 69.5 88 65 73.9 89 60 67.4 NJ 661 159 24.0 661 185 28.0 663 206 31.1 NM 142 98 69.0 150 118 78.7 167 119 71.3 NV 40 35 87.5 39 34 87.2 19 15 79.0 NY 1,096 797 72.7 1,054 889 84.4 1,042 857 82.2 OH 1,093 178 16.3 1,196 302 25.2 1,129 223 19.8 OK 533 248 46.5 613 322 52.5 573 333 58.1 OR 205 166 81.0 227 178 78.4 232 185 79.7 PA 724 368 50.8 776 458 59.0 826 501 60.6 RI NA NA NA 55 47 85.4 55 50 90.9 SC 86 85 98.8 85 83 97.6 88 84 95.4 SD 223 119 53.4 227 127 56.0 221 127 57.5 TN 169 132 78.1 175 154 88.0 171 144 84.2 TX 1,202 741 61.6 1,026 797 77.7 1,189 839 70.6 UT 51 45 88.2 53 50 94.3 49 45 91.8 VA 160 136 85.0 141 138 97.9 152 139 91.4 VT 204 186 91.2 217 200 92.2 215 201 93.5 WA 292 215 73.6 345 260 75.4 330 260 78.8 WI 842 177 21.0 823 138 16.8 840 180 21.4 WV 73 54 74.0 68 54 79.4 73 55 75.3 WY 54 48 88.9 54 37 68.5 53 37 69.8

Mathematica Policy Research
A.3
Direct Certification or Provision 2/3
LEAs
Direct Certification or Provision 2/3
LEAs
Direct Certification or Provision 2/3
LEAs
Number of
LEAs Number Percent Number of LEAs Number Percent
Number of LEAs Number Percent
U.S. Total 18,141 12,097 66.7 18,253 14,301 78.3
18,461 15,258 82.6
AK 50 46 92.0 48 47 97.9 49 48 98.0 AL 147 110 74.8 150 134 89.3 151 137 90.7
AR 286 252 88.1 295 280 94.9 300 265 88.3
AZ 372 307 82.5 388 327 84.3 428 357 83.4 CA 1,028 555 54.0 1,029 676 65.7 1,057 839 79.4 CO 175 81 46.3 205 181 88.3 218 202 92.7 CT 192 161 83.8 191 169 88.5 188 174 92.6 DC 58 2 3.4 61 2 3.3 62 61 98.4 DE 29 27 93.1 35 30 85.7 34 31 91.2 FL 159 98 61.6 164 107 65.2 170 122 71.8 GA 216 187 86.6 215 190 88.4 221 199 90.0 HI 36 22 61.1 40 26 65.0 37 26 70.3 IA 499 393 78.8 494 424 85.8 495 421 85.0 ID 121 106 87.6 139 121 87.0 142 103 72.5 IL 1,115 904 81.1 1,114 928 83.3 1,123 880 78.4 IN 482 184 38.2 487 341 70.0 498 405 81.3 KS 403 327 81.1 407 348 85.5 405 345 85.2 KY 193 171 88.6 190 170 89.5 197 176 89.3 LA 112 95 84.8 117 105 89.7 109 95 87.2 MA 357 245 68.6 423 305 72.1 431 303 70.3 MD 48 40 83.3 47 39 83.0 49 42 85.7 ME 246 223 90.6 235 213 90.6 194 177 91.2 MI 836 570 68.2 846 693 81.9 855 717 83.9 MN 650 433 66.6 663 448 67.6 662 457 69.0 MO 756 510 67.5 744 615 82.7 765 678 88.6 MS 179 144 80.4 179 151 84.4 177 157 88.7 MT 244 188 77.0 241 182 75.5 239 190 79.5 NC 170 141 82.9 169 144 85.2 165 151 91.5 ND 223 170 76.2 217 158 72.8 202 171 84.6 NE 381 297 78.0 382 285 74.6 383 304 79.4 NH 92 65 70.6 95 64 67.4 94 75 79.8 NJ 660 247 37.4 662 551 83.2 677 619 91.4 NM 189 135 71.4 171 166 97.1 176 132 75.0 NV 20 16 80.0 19 16 84.2 18 17 94.4 NY 1,083 951 87.8 1,072 935 87.2 1,113 989 88.9 OH 1,166 258 22.1 1,172 745 63.6 1,188 816 68.7 OK 568 373 65.7 565 429 75.9 566 458 80.9 OR 235 183 77.9 237 188 79.3 245 196 80.0 PA 837 523 62.5 855 623 72.9 851 730 85.8 RI 53 50 94.3 32 31 96.9 55 53 96.4 SC 87 84 96.6 96 85 88.5 93 85 91.4 SD 222 128 57.7 215 145 67.4 216 196 90.7 TN 168 142 84.5 167 153 91.6 165 149 90.3 TX 1,264 989 78.2 1,264 1,110 87.8 1,263 1,119 88.6 UT 55 51 92.7 64 56 87.5 75 72 96.0 VA 151 139 92.0 150 138 92.0 153 141 92.2 VT 219 194 88.6 214 189 88.3 225 205 91.1 WA 325 266 81.8 314 272 86.6 329 286 86.9 WI 853 218 25.6 847 474 56.0 822 584 71.0 WV 75 55 73.3 74 55 74.3 73 55 75.3 WY 56 41 73.2 53 37 69.8 58 48 82.8

Mathematica Policy Research
A.4
Direct Certification or Provision 2/3
LEAs
Direct Certification or Provision 2/3
LEAs
Direct Certification or Provision 2/3
LEAs
Number of LEAs Number Percent
Number of LEAs Number Percent
Number of LEAs Number Percent
U.S. Total 18,574 15,778 84.9 18,643 16,545 88.7
18,362 16,684 90.9
AK 51 49 96.1 50 49 98.0 69 48 69.6 AL 151 141 93.4 156 145 92.9 159 152 95.6
AR 290 279 96.2 289 279 96.5 284 268 94.4
AZ 430 365 84.9 456 404 88.6 464 407 87.7 CA 1,078 806 74.8 1,094 872 79.7 1,094 1,024 93.6 CO 207 191 92.3 214 204 95.3 209 201 96.2 CT 186 176 94.6 185 183 98.9 188 186 98.9 DC 57 57 100.0 61 60 98.4 63 63 100.0 DE 34 32 94.1 42 35 83.3 44 40 90.9 FL 190 133 70.0 223 178 79.8 226 185 81.9 GA 229 207 90.4 229 219 95.6 222 212 95.5 GU NA NA NA 3 1 33.3 2 1 50.0 HI 36 26 72.2 35 25 71.4 35 35 100.0 IA 494 435 88.1 477 428 89.7 474 419 88.4 ID 144 137 95.1 148 141 95.3 149 149 100.0 IL 1,119 968 86.5 1,126 1,039 92.3 1,051 984 93.6 IN 501 424 84.6 496 429 86.5 504 447 88.7 KS 399 340 85.2 400 362 90.5 398 378 95.0 KY 189 178 94.2 189 178 94.2 188 186 98.9 LA 114 102 89.5 113 106 93.8 114 107 93.9 MA 421 311 73.9 422 355 84.1 363 324 89.3 MD 49 43 87.8 55 47 85.5 55 38 69.1 ME 192 174 90.6 187 170 90.9 189 182 96.3 MI 853 736 86.3 845 762 90.2 847 784 92.6 MN 706 471 66.7 697 472 67.7 694 458 66.0 MO 761 684 89.9 755 704 93.2 762 711 93.3 MS 176 160 90.9 175 159 90.9 172 159 92.4 MT 240 209 87.1 240 212 88.3 239 206 86.2 NC 165 154 93.3 162 152 93.8 161 152 94.4 ND 204 181 88.7 203 179 88.2 202 174 86.1 NE 379 317 83.6 374 320 85.6 370 337 91.1 NH 91 82 90.1 100 88 88.0 98 82 83.7 NJ 694 665 95.8 697 683 98.0 699 680 97.3 NM 187 134 71.7 202 147 72.8 205 143 69.8 NV 20 16 80.0 20 15 75.0 25 17 68.0 NY 1,106 985 89.1 1,101 1,001 90.9 1,093 942 86.2 OH 1,192 869 72.9 1,214 1,043 85.9 1,219 1,146 94.0 OK 577 496 86.0 573 545 95.1 572 548 95.8 OR 250 203 81.2 244 205 84.0 239 204 85.4 PA 853 733 85.9 853 768 90.0 853 790 92.6 RI 56 53 94.6 54 49 90.7 53 53 100.0 SC 100 85 85.0 106 84 79.2 94 84 89.4 SD 213 197 92.5 210 194 92.4 208 189 90.9 TN 175 161 92.0 183 174 95.1 182 174 95.6 TX 1,260 1,138 90.3 1,259 1,148 91.2 1,247 1,154 92.5 UT 81 75 92.6 85 81 95.3 94 94 100.0 VA 154 145 94.2 155 146 94.2 151 145 96.0 VT 238 208 87.4 218 203 93.1 88 82 93.2 WA 330 295 89.4 326 296 90.8 319 300 94.0 WI 822 650 79.1 812 698 86.0 799 728 91.1 WV 72 56 77.8 72 57 79.2 71 58 81.7 WY 58 46 79.3 58 51 87.9 62 54 87.1
Note: Figures for school years prior to SY 2012–2013 may differ from previous reports due to changes in data submitted by States. Data for Hawaii, North Carolina, Massachusetts, Rhode Island, and one of two State agencies in both Oklahoma and Arkansas are omitted from the school year 2004–2005 totals; these agencies either did not submit school verification data or submitted unusable data.

Mathematica Policy Research
A.5
Table A.2. Number and Percentage of LEAs That Directly Certified SNAP Participants Excluding Provision 2 and Provision 3 LEAs, SY 2004–2005 Through SY 2012–2013
Direct Certification
LEAs
Direct Certification
LEAs
Direct Certification
LEAs
Number of Non-
provision 2/3 LEAs Number Percent
Number of Non-provision 2/3 LEAs Number Percent
Number of Non-provision 2/3 LEAs Number Percent
U.S. Total 16,389 9,016 55.0 17,048 10,118 59.4
17,382 10,747 61.8
AK 44 33 75.0 35 34 97.1 44 40 90.9 AL 163 62 38.0 148 87 58.8 145 93 64.1 AR 242 238 98.4 247 1 0.4 270 245 90.7 AZ 302 251 83.1 333 243 73.0 334 256 76.7 CA 991 386 39.0 1,005 441 43.9 976 470 48.2 CO 173 39 22.5 168 68 40.5 205 78 38.1 CT 185 146 78.9 187 148 79.1 193 161 83.4 DC 47 1 2.1 51 4 7.8 52 2 3.9 DE 27 22 81.5 34 28 82.4 32 28 87.5 FL 145 74 51.0 96 62 64.6 145 88 60.7 GA 170 154 90.6 174 157 90.2 181 164 90.6 HI NA NA NA 32 18 56.3 38 20 52.6 IA 495 338 68.3 507 371 73.2 506 382 75.5 ID 125 97 77.6 266 218 82.0 133 106 79.7 IL 1,035 748 72.3 1,112 834 75.0 1,074 838 78.0 IN 407 73 17.9 467 105 22.5 478 143 29.9 KS 403 314 77.9 404 333 82.4 403 335 83.1 KY 194 125 64.4 188 141 75.0 183 148 80.9 LA 97 56 57.7 36 34 94.4 107 92 86.0 MA NA NA NA 357 216 60.5 370 232 62.7 MD 47 29 61.7 47 29 61.7 45 30 66.7 ME 239 193 80.8 228 194 85.1 233 201 86.3 MI 741 331 44.7 698 349 50.0 803 449 55.9 MN 610 392 64.3 620 387 62.4 630 413 65.6 MO 759 450 59.3 711 476 67.0 749 490 65.4 MS 163 73 44.8 60 35 58.3 168 118 70.2 MT 236 130 55.1 233 159 68.2 234 177 75.6 NC NA NA NA 172 117 68.0 178 133 74.7 ND 160 126 78.8 199 153 76.9 193 142 73.6 NE 405 239 59.0 433 313 72.3 381 290 76.1 NH 82 57 69.5 88 65 73.9 89 60 67.4 NJ 653 151 23.1 654 178 27.2 656 199 30.3 NM 93 49 52.7 88 56 63.6 104 56 53.9 NV 39 34 87.2 39 34 87.2 19 15 79.0 NY 1,090 791 72.6 945 780 82.5 937 752 80.3 OH 1,090 175 16.1 1,189 295 24.8 1,125 219 19.5 OK 499 214 42.9 579 288 49.7 539 299 55.5 OR 203 164 80.8 217 168 77.4 222 175 78.8 PA 723 367 50.8 773 455 58.9 823 498 60.5 RI NA NA NA 55 47 85.5 55 50 90.9 SC 86 85 98.8 85 83 97.7 88 84 95.5 SD 194 90 46.4 188 88 46.8 187 93 49.7 TN 169 132 78.1 175 154 88.0 171 144 84.2 TX 1,198 737 61.5 1,026 797 77.7 1,189 839 70.6 UT 50 44 88.0 51 48 94.1 49 45 91.8 VA 160 136 85.0 141 138 97.9 151 138 91.4 VT 204 186 91.2 217 200 92.2 215 201 93.5 WA 291 214 73.5 345 260 75.4 322 252 78.3 WI 833 168 20.2 823 138 16.8 832 172 20.7 WV 73 54 74.0 68 54 79.4 73 55 75.3 WY 54 48 88.9 54 37 68.5 53 37 69.8
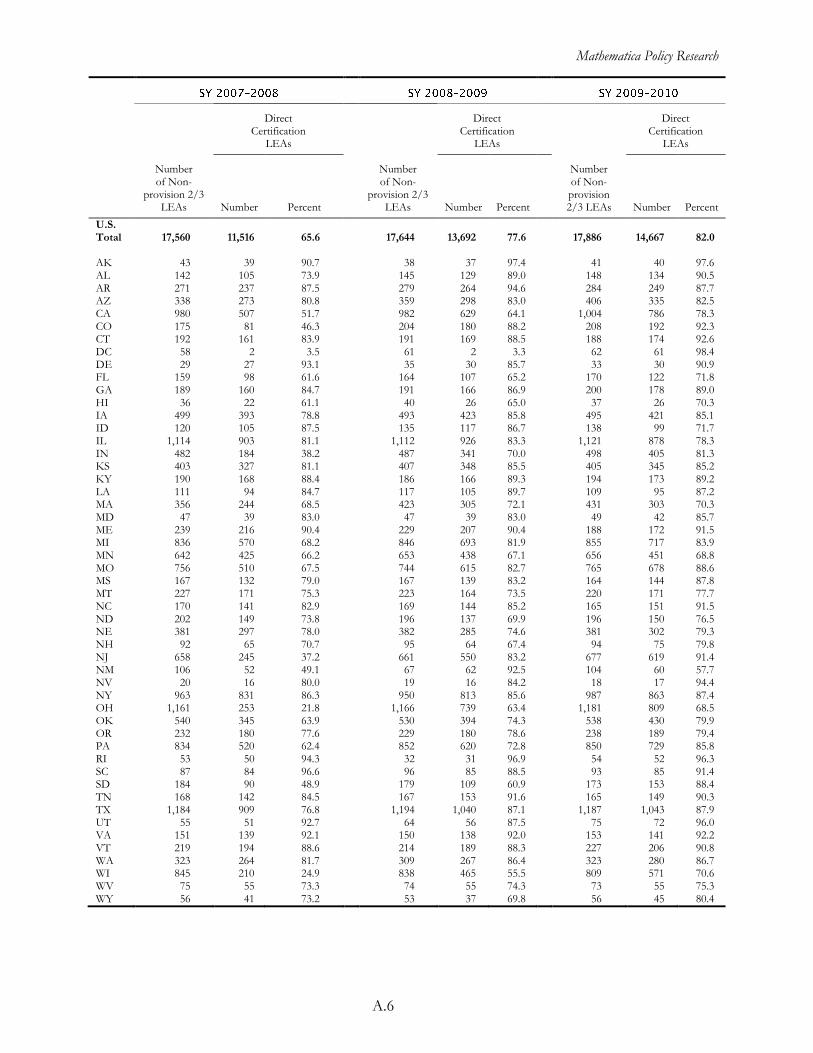
Mathematica Policy Research
A.6
Direct Certification
LEAs
Direct Certification
LEAs
Direct Certification
LEAs
Number of Non-
provision 2/3 LEAs Number Percent
Number of Non-
provision 2/3 LEAs Number Percent
Number of Non-provision 2/3 LEAs Number Percent
U.S. Total 17,560 11,516 65.6 17,644 13,692 77.6
17,886 14,667 82.0
AK 43 39 90.7 38 37 97.4 41 40 97.6 AL 142 105 73.9 145 129 89.0 148 134 90.5 AR 271 237 87.5 279 264 94.6 284 249 87.7 AZ 338 273 80.8 359 298 83.0 406 335 82.5 CA 980 507 51.7 982 629 64.1 1,004 786 78.3 CO 175 81 46.3 204 180 88.2 208 192 92.3 CT 192 161 83.9 191 169 88.5 188 174 92.6 DC 58 2 3.5 61 2 3.3 62 61 98.4 DE 29 27 93.1 35 30 85.7 33 30 90.9 FL 159 98 61.6 164 107 65.2 170 122 71.8 GA 189 160 84.7 191 166 86.9 200 178 89.0 HI 36 22 61.1 40 26 65.0 37 26 70.3 IA 499 393 78.8 493 423 85.8 495 421 85.1 ID 120 105 87.5 135 117 86.7 138 99 71.7 IL 1,114 903 81.1 1,112 926 83.3 1,121 878 78.3 IN 482 184 38.2 487 341 70.0 498 405 81.3 KS 403 327 81.1 407 348 85.5 405 345 85.2 KY 190 168 88.4 186 166 89.3 194 173 89.2 LA 111 94 84.7 117 105 89.7 109 95 87.2 MA 356 244 68.5 423 305 72.1 431 303 70.3 MD 47 39 83.0 47 39 83.0 49 42 85.7 ME 239 216 90.4 229 207 90.4 188 172 91.5 MI 836 570 68.2 846 693 81.9 855 717 83.9 MN 642 425 66.2 653 438 67.1 656 451 68.8 MO 756 510 67.5 744 615 82.7 765 678 88.6 MS 167 132 79.0 167 139 83.2 164 144 87.8 MT 227 171 75.3 223 164 73.5 220 171 77.7 NC 170 141 82.9 169 144 85.2 165 151 91.5 ND 202 149 73.8 196 137 69.9 196 150 76.5 NE 381 297 78.0 382 285 74.6 381 302 79.3 NH 92 65 70.7 95 64 67.4 94 75 79.8 NJ 658 245 37.2 661 550 83.2 677 619 91.4 NM 106 52 49.1 67 62 92.5 104 60 57.7 NV 20 16 80.0 19 16 84.2 18 17 94.4 NY 963 831 86.3 950 813 85.6 987 863 87.4 OH 1,161 253 21.8 1,166 739 63.4 1,181 809 68.5 OK 540 345 63.9 530 394 74.3 538 430 79.9 OR 232 180 77.6 229 180 78.6 238 189 79.4 PA 834 520 62.4 852 620 72.8 850 729 85.8 RI 53 50 94.3 32 31 96.9 54 52 96.3 SC 87 84 96.6 96 85 88.5 93 85 91.4 SD 184 90 48.9 179 109 60.9 173 153 88.4 TN 168 142 84.5 167 153 91.6 165 149 90.3 TX 1,184 909 76.8 1,194 1,040 87.1 1,187 1,043 87.9 UT 55 51 92.7 64 56 87.5 75 72 96.0 VA 151 139 92.1 150 138 92.0 153 141 92.2 VT 219 194 88.6 214 189 88.3 227 206 90.8 WA 323 264 81.7 309 267 86.4 323 280 86.7 WI 845 210 24.9 838 465 55.5 809 571 70.6 WV 75 55 73.3 74 55 74.3 73 55 75.3 WY 56 41 73.2 53 37 69.8 56 45 80.4
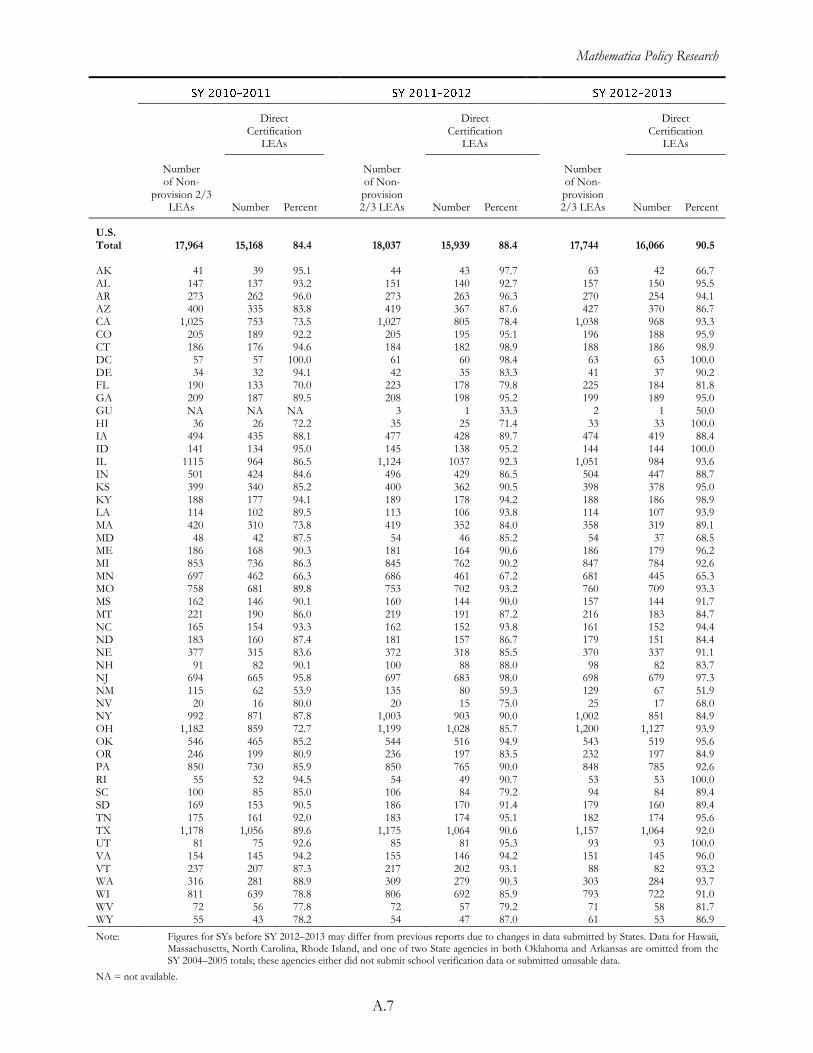
Mathematica Policy Research
A.7
Direct Certification
LEAs
Direct Certification
LEAs
Direct Certification
LEAs
Number of Non-
provision 2/3 LEAs Number Percent
Number of Non-provision 2/3 LEAs Number Percent
Number of Non-provision 2/3 LEAs Number Percent
U.S. Total 17,964 15,168 84.4
18,037 15,939 88.4
17,744 16,066 90.5 AK 41 39 95.1 44 43 97.7 63 42 66.7 AL 147 137 93.2 151 140 92.7 157 150 95.5 AR 273 262 96.0 273 263 96.3 270 254 94.1 AZ 400 335 83.8 419 367 87.6 427 370 86.7 CA 1,025 753 73.5 1,027 805 78.4 1,038 968 93.3 CO 205 189 92.2 205 195 95.1 196 188 95.9 CT 186 176 94.6 184 182 98.9 188 186 98.9 DC 57 57 100.0 61 60 98.4 63 63 100.0 DE 34 32 94.1 42 35 83.3 41 37 90.2 FL 190 133 70.0 223 178 79.8 225 184 81.8 GA 209 187 89.5 208 198 95.2 199 189 95.0 GU NA NA NA 3 1 33.3 2 1 50.0 HI 36 26 72.2 35 25 71.4 33 33 100.0 IA 494 435 88.1 477 428 89.7 474 419 88.4 ID 141 134 95.0 145 138 95.2 144 144 100.0 IL 1115 964 86.5 1,124 1037 92.3 1,051 984 93.6 IN 501 424 84.6 496 429 86.5 504 447 88.7 KS 399 340 85.2 400 362 90.5 398 378 95.0 KY 188 177 94.1 189 178 94.2 188 186 98.9 LA 114 102 89.5 113 106 93.8 114 107 93.9 MA 420 310 73.8 419 352 84.0 358 319 89.1 MD 48 42 87.5 54 46 85.2 54 37 68.5 ME 186 168 90.3 181 164 90.6 186 179 96.2 MI 853 736 86.3 845 762 90.2 847 784 92.6 MN 697 462 66.3 686 461 67.2 681 445 65.3 MO 758 681 89.8 753 702 93.2 760 709 93.3 MS 162 146 90.1 160 144 90.0 157 144 91.7 MT 221 190 86.0 219 191 87.2 216 183 84.7 NC 165 154 93.3 162 152 93.8 161 152 94.4 ND 183 160 87.4 181 157 86.7 179 151 84.4 NE 377 315 83.6 372 318 85.5 370 337 91.1 NH 91 82 90.1 100 88 88.0 98 82 83.7 NJ 694 665 95.8 697 683 98.0 698 679 97.3 NM 115 62 53.9 135 80 59.3 129 67 51.9 NV 20 16 80.0 20 15 75.0 25 17 68.0 NY 992 871 87.8 1,003 903 90.0 1,002 851 84.9 OH 1,182 859 72.7 1,199 1,028 85.7 1,200 1,127 93.9 OK 546 465 85.2 544 516 94.9 543 519 95.6 OR 246 199 80.9 236 197 83.5 232 197 84.9 PA 850 730 85.9 850 765 90.0 848 785 92.6 RI 55 52 94.5 54 49 90.7 53 53 100.0 SC 100 85 85.0 106 84 79.2 94 84 89.4 SD 169 153 90.5 186 170 91.4 179 160 89.4 TN 175 161 92.0 183 174 95.1 182 174 95.6 TX 1,178 1,056 89.6 1,175 1,064 90.6 1,157 1,064 92.0 UT 81 75 92.6 85 81 95.3 93 93 100.0 VA 154 145 94.2 155 146 94.2 151 145 96.0 VT 237 207 87.3 217 202 93.1 88 82 93.2 WA 316 281 88.9 309 279 90.3 303 284 93.7 WI 811 639 78.8 806 692 85.9 793 722 91.0 WV 72 56 77.8 72 57 79.2 71 58 81.7 WY 55 43 78.2 54 47 87.0 61 53 86.9
Note: Figures for SYs before SY 2012–2013 may differ from previous reports due to changes in data submitted by States. Data for Hawaii, Massachusetts, North Carolina, Rhode Island, and one of two State agencies in both Oklahoma and Arkansas are omitted from the SY 2004–2005 totals; these agencies either did not submit school verification data or submitted unusable data.
NA = not available.

Mathematica Policy Research
A.8
Table A.3. Percent of SNAP Children Directly Certified for Free School Meals and Percent of All Categorically Eligible Children Certified for Free School Meals, SY 2011–2012 and SY 2012–2013
U.S. Total 89 3 95 Alabama 85 -8 89 Alaska 100 21 100 Arizona 73 2 85 Arkansas 81 1 91 California 76 -3 83 Colorado 72 5 79 Connecticut 98 3 100 Delaware 96 -4 93 District of Columbia 100 20 100 Florida 93 -4 98 Georgia 94 7 99 Guam 76 -7 NA Hawaii 88 5 82 Idaho 80 -7 79 Illinois 85 -2 91 Indiana 84 11 94 Iowa 94 8 97 Kansas 100 13 100 Kentucky 100 24 100 Louisiana 75 -11 87 Maine 75 -7 81 Maryland 91 1 93 Massachusetts 84 6 86 Michigan 100 17 100 Minnesota 87 1 94 Mississippi 77 0 87 Missouri 80 8 91 Montana 66 4 79 Nebraska 100 7 100 Nevada 89 0 91 New Hampshire 58 -9 70 New Jersey 89 12 93 New Mexico 78 5 93 New York 100 8 100 North Carolina 81 -7 87 North Dakota 100 18 100 Ohio 91 10 100 Oklahoma 89 -7 100 Oregon 69 -10 74 Pennsylvania 77 11 81 Rhode Island 90 15 94 South Carolina 86 7 95 South Dakota 87 36 88 Tennessee 95 0 97 Texas 97 8 100 Utah 94 11 100 Vermont 95 -3 100 Virginia 97 21 100 Washington 79 -3 84 West Virginia 100 9 100 Wisconsin 92 6 96 Wyoming 100 -18 100
Note: For a graphical presentation of these data, please see Figures 4, 8, and 9. The figures in the first and third columns are capped at 100 percent. The percentage point changes in the middle column are equal to the difference in non-capped direct certification rates from SY 2011–2012 to 2012–2013.
NA = not available.
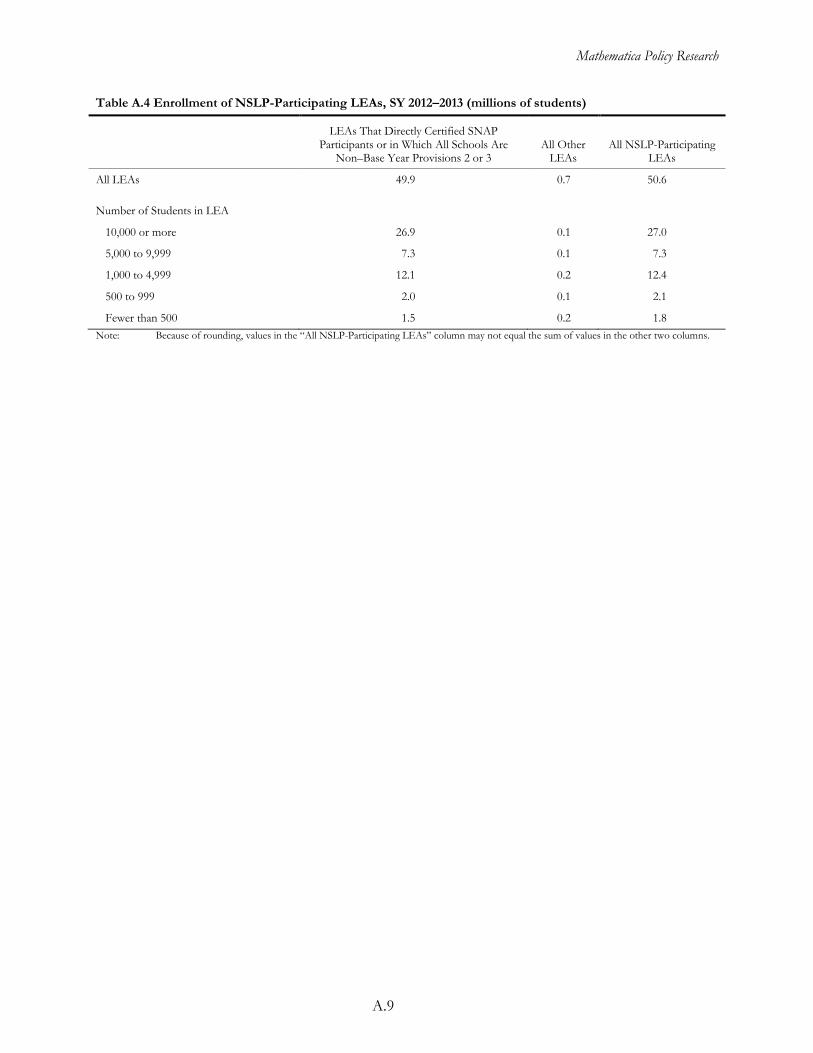
Mathematica Policy Research
A.9
Table A.4 Enrollment of NSLP-Participating LEAs, SY 2012–2013 (millions of students)
LEAs That Directly Certified SNAP
Participants or in Which All Schools Are Non–Base Year Provisions 2 or 3
All Other LEAs
All NSLP-Participating LEAs
All LEAs 49.9 0.7 50.6
Number of Students in LEA
10,000 or more 26.9 0.1 27.0
5,000 to 9,999 7.3 0.1 7.3
1,000 to 4,999 12.1 0.2 12.4
500 to 999 2.0 0.1 2.1
Fewer than 500 1.5 0.2 1.8
Note: Because of rounding, values in the “All NSLP-Participating LEAs” column may not equal the sum of values in the other two columns.
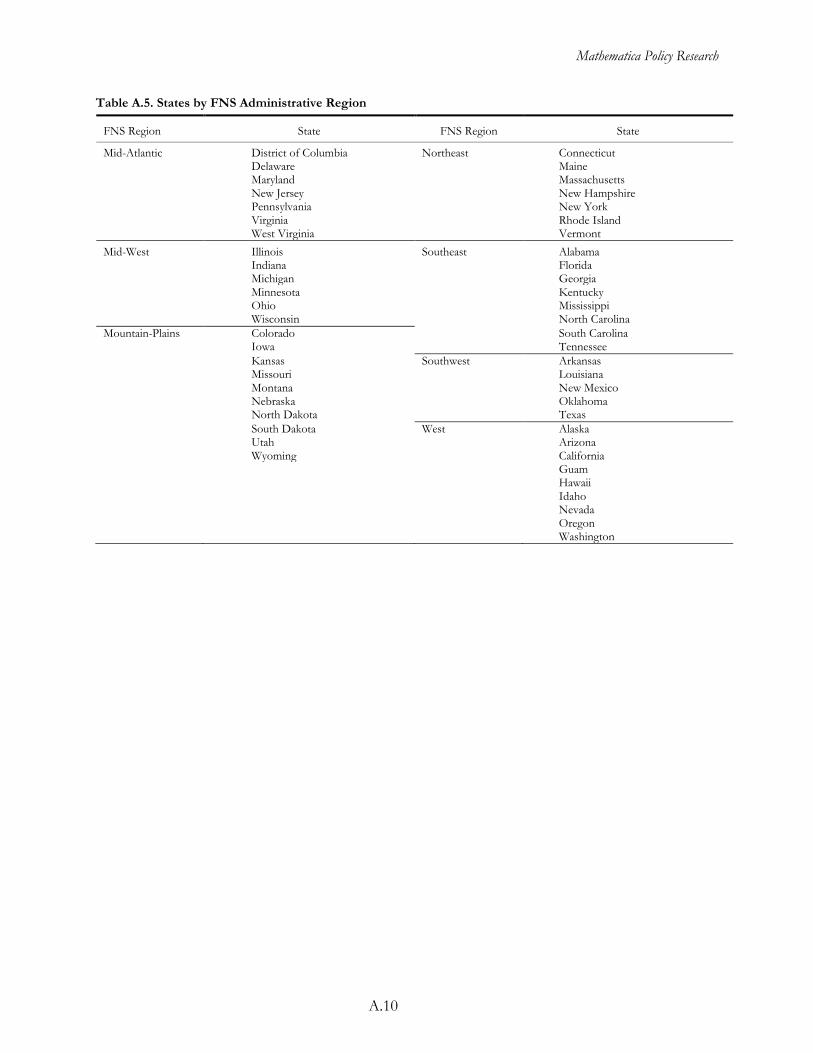
Mathematica Policy Research
A.10
Table A.5. States by FNS Administrative Region
FNS Region State FNS Region State
Mid-Atlantic District of Columbia Northeast Connecticut Delaware Maine Maryland Massachusetts New Jersey New Hampshire Pennsylvania New York Virginia Rhode Island West Virginia Vermont
Mid-West Illinois Southeast Alabama Indiana Florida Michigan Georgia Minnesota Kentucky Ohio Mississippi Wisconsin North Carolina
Mountain-Plains Colorado South Carolina Iowa Tennessee
Kansas Southwest Arkansas Missouri Louisiana Montana New Mexico Nebraska Oklahoma North Dakota Texas
South Dakota West Alaska Utah Arizona Wyoming California Guam Hawaii Idaho Nevada Oregon Washington

Mathematica Policy Research
A.11
Figure A.1 Percent of LEAs That Directly Certified SNAP Participants and Percent of Students in LEAs That Directly Certified SNAP Participants by Enrollment Category Size: Provision 2 and Provision 3 LEAs Excluded from Direct Certification Counts, SY 2012–2013
Note: The percentages in this figure are rounded. For example, 99.7 percent of LEAs with 10,000 or more students directly certified some SNAP participants in SY 2012-2013, which is rounded to 100 percent.
82%
95% 98% 99% 99%
86%
95% 98% 99% 100%
0
10
20
30
40
50
60
70
80
90
100
Fewer than 500 students
500 to 999 students 1,000 to 4,999 students
5,000 to 9,999 students
10,000 or more students
Pe
rce
nt
Enrollment Category
Percent of LEAs that directly certified some SNAP participants
Percent of students enrolled in LEAs that directly certified some SNAP participants
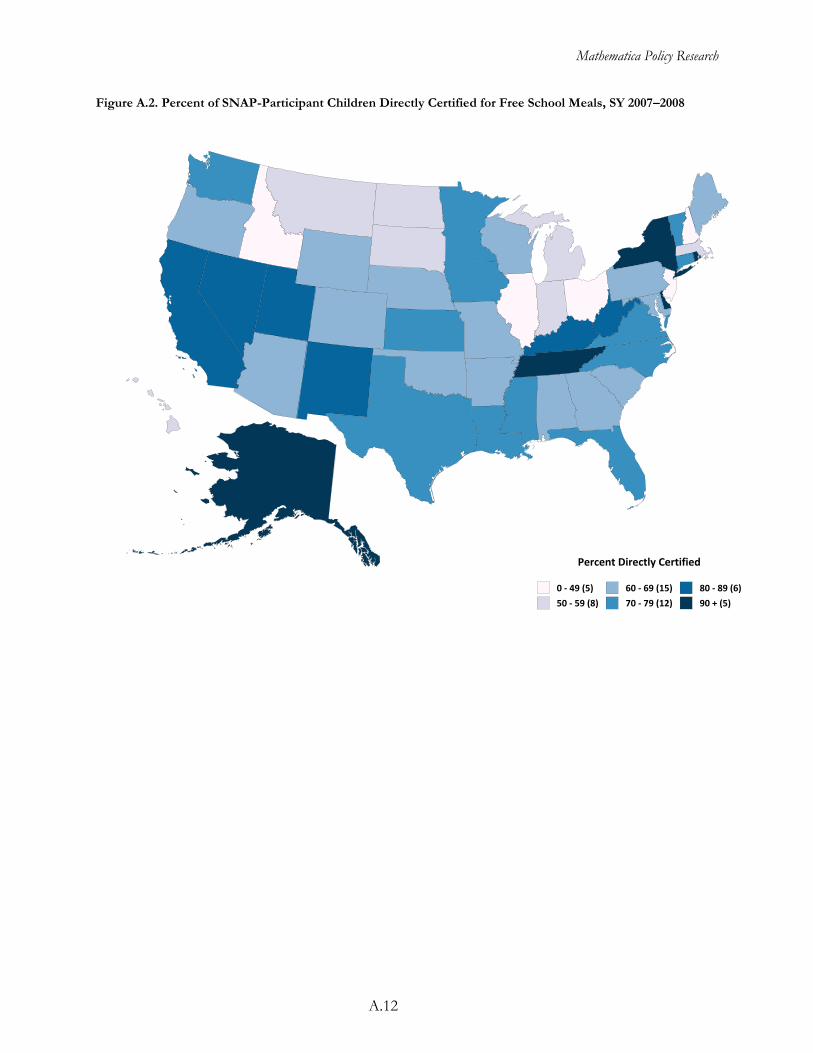
Mathematica Policy Research
A.12
Figure A.2. Percent of SNAP-Participant Children Directly Certified for Free School Meals, SY 2007–2008
Percent Directly Certified
0 - 49 (5)
50 - 59 (8)
60 - 69 (15)
70 - 79 (12)
80 - 89 (6)
90 + (5)

Mathematica Policy Research
A.13
Figure A.3. Percent of SNAP-Participant Children Directly Certified for Free School Meals, SY 2008–2009
Percent Directly Certified
0 - 49 (3)
50 - 59 (6)
60 - 69 (15)
70 - 79 (15)
80 - 89 (8)
90 + (4)

Mathematica Policy Research
A.14
Figure A.4. Percent of SNAP-Participant Children Directly Certified for Free School Meals, SY 2009–2010
Percent Directly Certified
0 - 49 (3)
50 - 59 (5)
60 - 69 (12)
70 - 79 (19)
80 - 89 (8)
90 + (4)
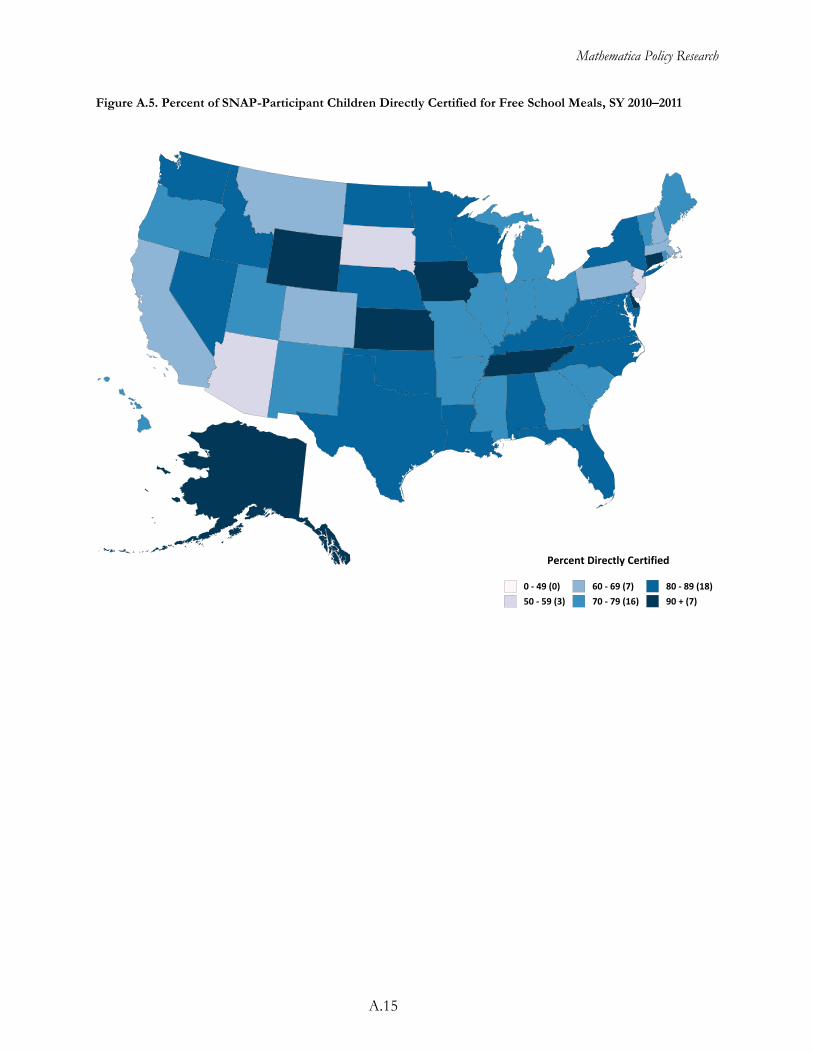
Mathematica Policy Research
A.15
Figure A.5. Percent of SNAP-Participant Children Directly Certified for Free School Meals, SY 2010–2011
Percent Directly Certified
0 - 49 (0)
50 - 59 (3)
60 - 69 (7)
70 - 79 (16)
80 - 89 (18)
90 + (7)

Mathematica Policy Research
A.16
Figure A.6. Percent of SNAP-Participant Children Directly Certified for Free School Meals, SY 2011–2012
Percent Directly Certified
0 - 49 (0)
50 - 59 (1)
60 - 69 (4)
70 - 79 (12)
80 - 89 (18)
90 + (17)
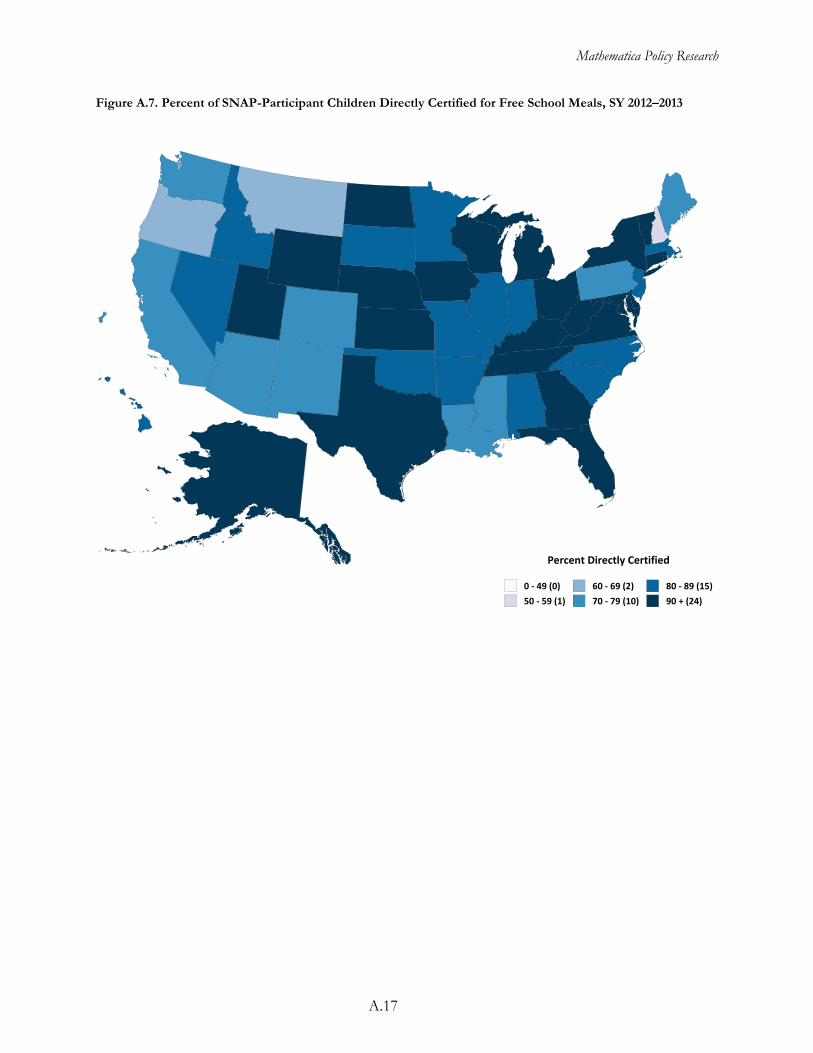
Mathematica Policy Research
A.17
Figure A.7. Percent of SNAP-Participant Children Directly Certified for Free School Meals, SY 2012–2013
Percent Directly Certified
0 - 49 (0)
50 - 59 (1)
60 - 69 (2)
70 - 79 (10)
80 - 89 (15)
90 + (24)

Mathematica Policy Research
A.18
Figure A.8. Percent of Categorically Eligible Children Certified for Free School Meals, SY 2007–2008
Percent of Categorically Eligibile Certified
0 - 49 (0)
50 - 59 (0)
60 - 69 (10)
70 - 79 (11)
80 - 89 (15)
90 + (15)

Mathematica Policy Research
A.19
Figure A.9. Percent of Categorically Eligible Children Certified for Free School Meals, SY 2008–2009
Percent of Categorically Eligibile Certified
0 - 49 (0)
50 - 59 (0)
60 - 69 (5)
70 - 79 (12)
80 - 89 (19)
90 + (15)

Mathematica Policy Research
A.20
Figure A.10. Percent of Categorically Eligible Children Certified for Free School Meals, SY 2009–2010
Percent of Categorically Eligibile Certified
0 - 49 (0)
50 - 59 (0)
60 - 69 (6)
70 - 79 (15)
80 - 89 (20)
90 + (10)
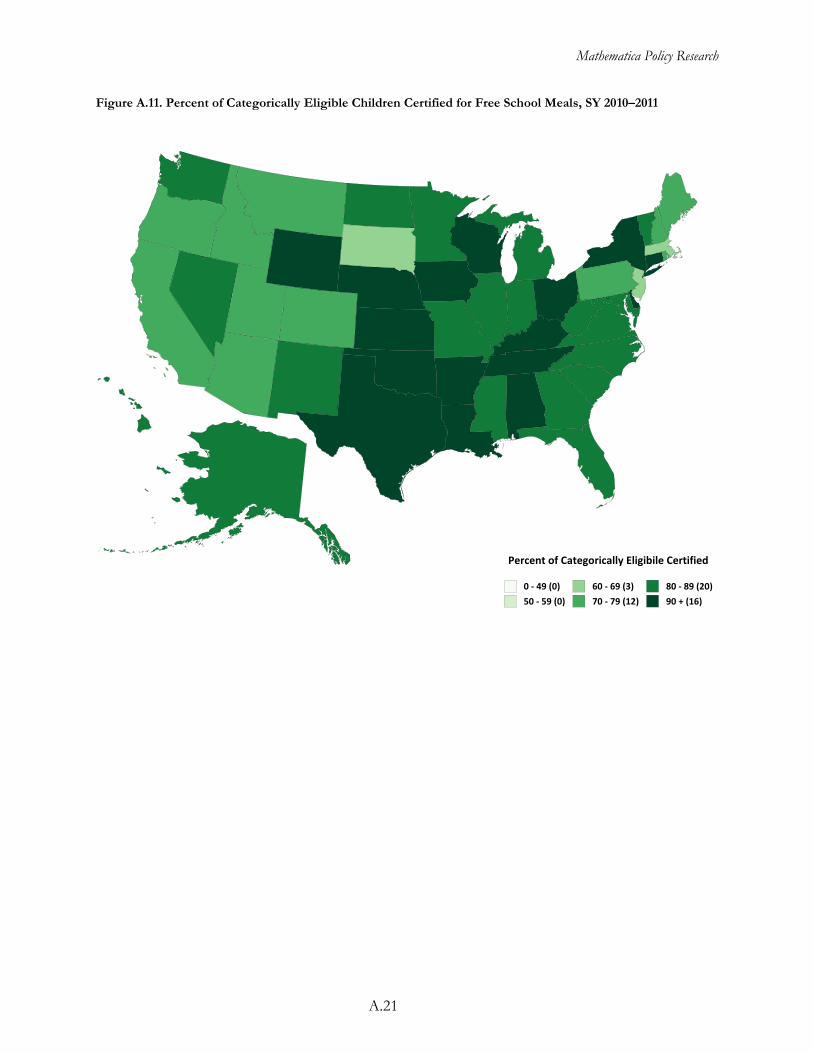
Mathematica Policy Research
A.21
Figure A.11. Percent of Categorically Eligible Children Certified for Free School Meals, SY 2010–2011
Percent of Categorically Eligibile Certified
0 - 49 (0)
50 - 59 (0)
60 - 69 (3)
70 - 79 (12)
80 - 89 (20)
90 + (16)

Mathematica Policy Research
A.22
Figure A.12. Percent of Categorically Eligible Children Certified for Free School Meals, SY 2011–2012
Percent of Categorically Eligibile Certified
0 - 49 (0)
50 - 59 (0)
60 - 69 (1)
70 - 79 (7)
80 - 89 (17)
90 + (26)

Mathematica Policy Research
A.23
Figure A.13. Percent of Categorically Eligible Children Certified for Free School Meals, SY 2012–2013
Percent of Categorically Eligibile Certified
0 - 49 (0)
50 - 59 (0)
60 - 69 (0)
70 - 79 (5)
80 - 89 (12)
90 + (34)
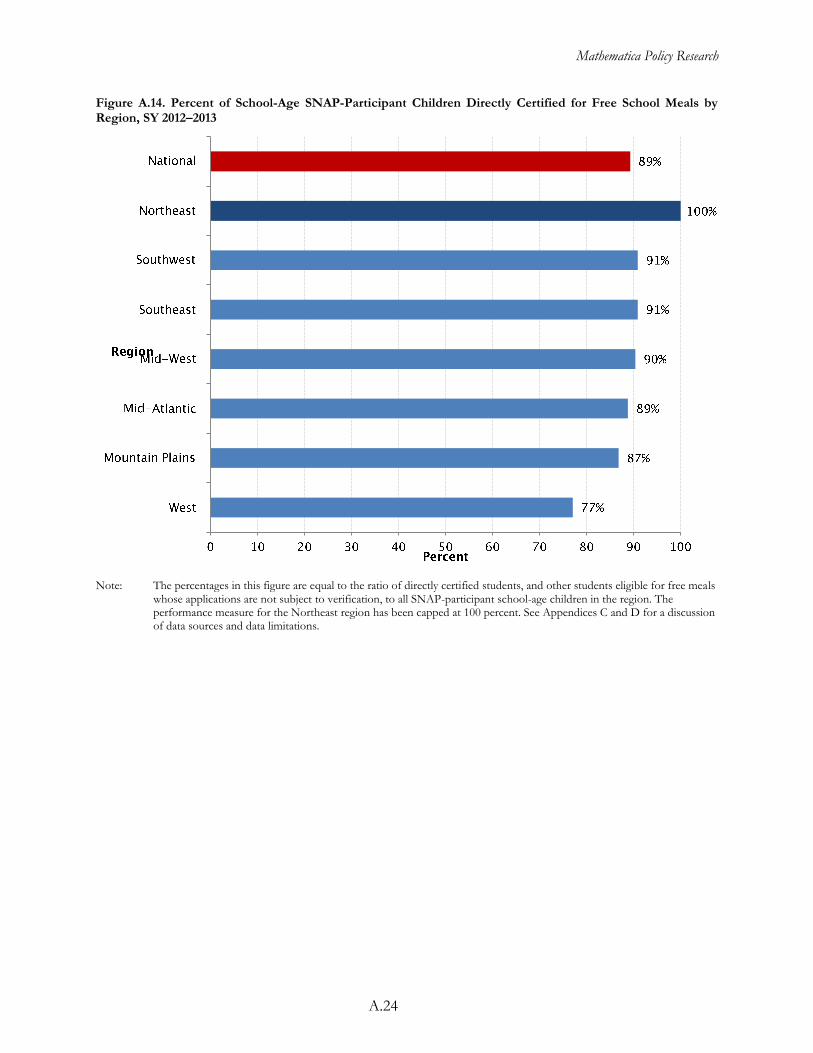
Mathematica Policy Research
A.24
Figure A.14. Percent of School-Age SNAP-Participant Children Directly Certified for Free School Meals by Region, SY 2012–2013
Note: The percentages in this figure are equal to the ratio of directly certified students, and other students eligible for free meals
whose applications are not subject to verification, to all SNAP-participant school-age children in the region. The performance measure for the Northeast region has been capped at 100 percent. See Appendices C and D for a discussion of data sources and data limitations.
APPENDIX B
VERIFICATION SUMMARY REPORT

Mathematica Policy Research
B.2
This form, and the accompanying instructions for completion, is available for download at
http://www.fns.usda.gov/cnd/Governance/Forms/.

APPENDIX C
ESTIMATION OF COMPONENT STATISTICS

Mathematica Policy Research
C.2
The direct certification performance measures presented here are based on State-level estimates of (1) the number of school-age children that received SNAP benefits at any time in July, August, or September of 2012; (2) the number of SNAP-participant children that were directly certified for free school meals as of October 1, 2012; and (3) the number of SNAP-participant students that were not candidates for direct certification because they attended Provision 2 or Provision 3 schools that were not operating in a base year in SY 2012–2013. The methods and sources used for these estimates are described next.36
A. Estimate of School-Age Population in SNAP-Participant Households
The report uses two primary sources to estimate the number of school-age SNAP participants at the State level. The first is SNAP data reported to the FNS by State SNAP agencies each month. SNAP data include State agency counts of the number of individual participants in households that are issued SNAP benefits. The figures used in this report are the final participant counts for July through September 2012. Although these are the best available monthly estimates of SNAP participation, the data do not separate school-age children from other members of the SNAP household.
The school-age SNAP subpopulations are estimated from the SNAP quality control (QC) data set, which is based on statistically representative samples drawn by the States from participating SNAP households (U.S. Department of Agriculture 2012). The number of school-age children in SNAP households can be estimated for each State from the QC data. However, given the size of the State samples, monthly estimates of participation by State and age group are not sufficiently reliable and State estimates of the average monthly school-age population for the entire fiscal year are used instead.
With these two inputs, FNS is able to estimate the number of school-age SNAP participants by State for the target months of July through September. From official SNAP data, FNS computes average monthly participation from July through September as a percentage of average monthly participation for the entire fiscal year. This is multiplied by QC estimates of average monthly school-age SNAP participation for the year. The result is a set of State estimates of average school-age SNAP participation for the months of July through September 2012.
A final adjustment is needed to convert this average monthly figure into an estimate of school-age children who received SNAP benefits at any time in those three months. Across any period, the total number of individuals served by the SNAP program is higher than the average monthly caseload over the same period. The participant turnover rate is defined as the total number of SNAP participants over a given period divided by the period’s average monthly caseload. FNS estimates that the turnover rate across an entire year is about 1.4 (Mabli et al. 2011). That is, if the average monthly caseload for the year is 100, the unduplicated number of individuals who participated for any part of the year is 140.
The turnover rate applied here is a national estimate. The estimate is based on the Survey of Income and Program Participation (SIPP), a U.S. Census Bureau data set that contains information on a representative panel of households over time. The longitudinal nature of the data set allows for
36 See Appendix D for a discussion of data limitations.

Mathematica Policy Research
C.3
estimation of the SNAP turnover rate over the July-through-September period of concern to this report. However, SIPP data are not designed for State-level analysis. Use of a national turnover rate introduces some uncertainty into the estimates of SNAP participation developed here.
In the first two reports in this series, we used single-year point estimates of the turnover rate for July through September based on the most current SIPP data available. That approach generated estimates that varied significantly from year to year. Given the error inherent in a turnover rate estimated over such a short (three-month) period, we were concerned that much of the variation observed over time could be largely random. Beginning with the Report to Congress for SY 2009–2010, we compensated for the uncertainty in single-year point estimates by applying a three-year moving average of estimated turnover rates to the SNAP participant counts for each of the years examined in the report.37 We continue to use the three-year moving average for this year’s report. The three-year moving average of the estimated turnover rate is 1.082.
Unduplicated count of school-age SNAP-
participant population, July–September 2012
=
Average monthly SNAP participation, FNS program data, July–
September 2012 x
Average monthly school-age SNAP-
participant population, QC estimate, FY 2012
x
Estimated SNAP-
participant turnover rate,
July–September 2012
Average monthly SNAP participation, FNS
program data, FY 2012
FY = fiscal year.
B. Estimate of SNAP Participants Directly Certified for Free School Meals
This report uses data collected by FNS from the States and LEAs to estimate the number of children in SNAP-participant households that are directly certified for free school meals. These data are generated and reported by LEAs as part of the annual process of verifying student eligibility for free and reduced-price school meal benefits. Although these data were not designed specifically to support the requirements of this report, they remain the most current and best available State estimates of directly certified SNAP participants.
All household applications approved for free and reduced-price benefits are subject to annual verification by local LEAs. LEAs are required to draw a sample from approved applications and review applicant documentation. LEAs report the results of the verification process to FNS through their State education agencies. These VSRs include the number of applications and students initially certified for free or reduced-price benefits and the corresponding number of applications and students whose status was confirmed or changed as a result of the verification review.38
The VSRs are intended primarily to document the results of the verification process. For this reason, most of the information contained in the reports concerns the verification outcomes of
37 As described in the Report to Congress for SY 2009–2010, when the move to a three-year rolling average was applied to SY
2007–2008, the national direct certification rate was revised downward from 69 to 68 percent. For SY 2008–2009, the national rate was unchanged at 71 percent.
38 The annual NSLP eligibility verification and reporting process is described in 7 CFR 245.6a. The verification summary report,
FNS form 742, is reprinted as Appendix B.

Mathematica Policy Research
C.4
applications initially approved for free or reduced-price meals. However, the reports also contain counts of students whose eligibility for free or reduced-price meals was not determined by application and whose certifications are therefore not subject to verification. These counts include, but are not limited to, directly certified SNAP participants. This report uses LEA counts of students certified for free school meals, but not subject to verification, as a proxy for directly certified SNAP participants.39
C. Estimate of SNAP Participants in Provision 2 and Provision 3 Schools
The population of SNAP-participant children who are candidates for direct certification does not include children who attend Provision 2 or Provision 3 schools that are not operating in a base year. These schools directly certify (and accept applications from) SNAP-participant children only in base years when they establish the percentage of meals served free, at reduced-price, and at the paid rate for NSLP reimbursement. In non–base years, the schools are reimbursed at these previously determined percentages; individual children are not subject to certification or recertification in non–base years.40
To remove these children from the estimated population of SNAP participants, FNS used data reported by LEAs on their SY 2012–2013 VSRs. LEAs for which all schools use Provisions 2 or 3 and are not operating in a base year are required to submit VSRs, although compliance with that requirement is imperfect. These LEAs, and LEAs with both Provision 2 or Provision 3 and non-provision schools, report the number of students eligible for free (and reduced-price) meals in their Provision 2 and Provision 3 schools that are not operating in base years. The information provided by the LEAs does not distinguish SNAP-participant children from other income-eligible or categorically eligible children in Provision 2 or Provision 3 schools.
Children in Provision 2 or Provision 3 schools who were determined eligible for free meals in the schools’ base years must have met the income or categorical requirements of the NSLP in those years. Virtually all of those children were also income-eligible for SNAP benefits. However, not all households that are income-eligible for SNAP benefits are SNAP participants. Some fraction of income-eligible households do not meet SNAP’s asset test. An additional fraction of income- and asset-eligible households do not participate in SNAP for other reasons.41
FNS applied two factors to the count of children from non–base year Provision 2 or Provision 3 schools who were determined income-eligible for free meals in the schools’ most recent base years:
1. An estimate of the percentage of the population that is income-eligible for SNAP benefits but not asset-eligible
39 Some limitations of this measure are discussed in Appendix D.
40 Provision 2 and Provision 3 schools operating in non–base years serve all meals at no charge, although they are reimbursed
by USDA at rates consistent with their free, reduced-price, and paid claiming percentages. Provision 2 and Provision 3 are offered to schools as administrative cost-saving options. In exchange for a much-reduced meal counting and claiming burden and no certification costs in non–base years, Provision 2 and Provision 3 schools absorb any difference between their Federal reimbursement and the cost of meals served.
41 Reasons for nonparticipation in SNAP by fully eligible households include real or perceived access barriers and personal
preference. For additional discussion of reasons for SNAP nonparticipation, see Bartlett and Burstein (2004).
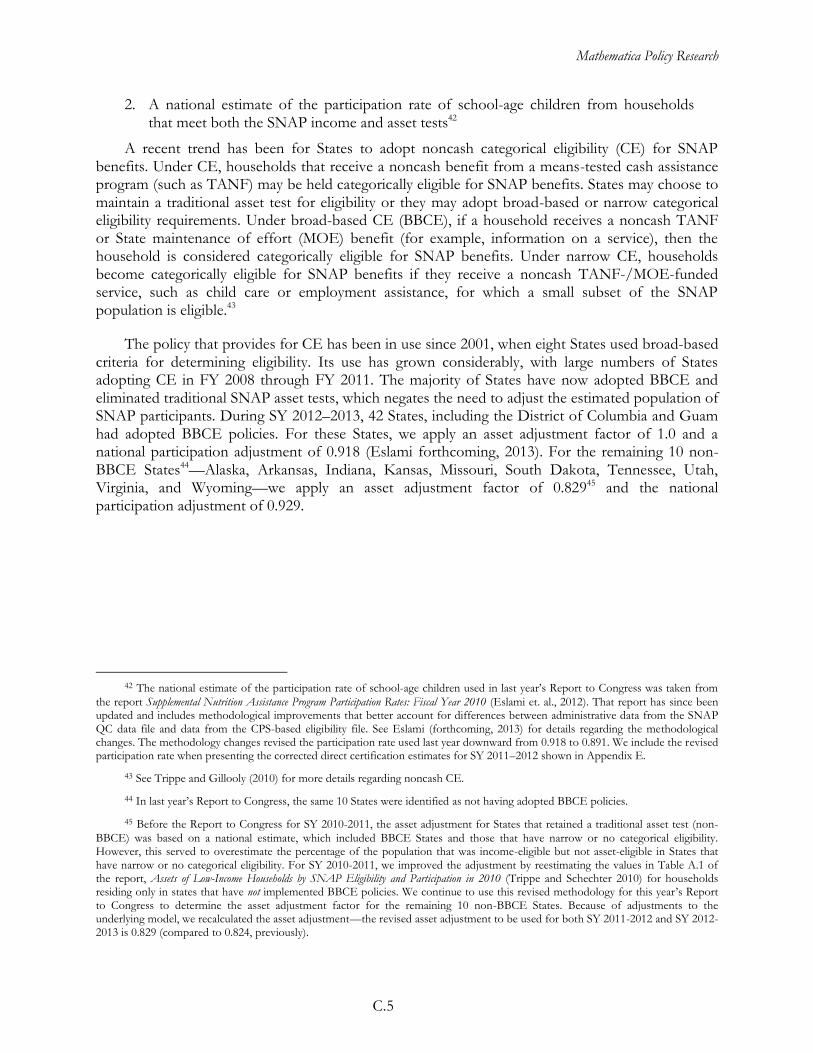
Mathematica Policy Research
C.5
2. A national estimate of the participation rate of school-age children from households that meet both the SNAP income and asset tests42
A recent trend has been for States to adopt noncash categorical eligibility (CE) for SNAP benefits. Under CE, households that receive a noncash benefit from a means-tested cash assistance program (such as TANF) may be held categorically eligible for SNAP benefits. States may choose to maintain a traditional asset test for eligibility or they may adopt broad-based or narrow categorical eligibility requirements. Under broad-based CE (BBCE), if a household receives a noncash TANF or State maintenance of effort (MOE) benefit (for example, information on a service), then the household is considered categorically eligible for SNAP benefits. Under narrow CE, households become categorically eligible for SNAP benefits if they receive a noncash TANF-/MOE-funded service, such as child care or employment assistance, for which a small subset of the SNAP population is eligible.43
The policy that provides for CE has been in use since 2001, when eight States used broad-based criteria for determining eligibility. Its use has grown considerably, with large numbers of States adopting CE in FY 2008 through FY 2011. The majority of States have now adopted BBCE and eliminated traditional SNAP asset tests, which negates the need to adjust the estimated population of SNAP participants. During SY 2012–2013, 42 States, including the District of Columbia and Guam had adopted BBCE policies. For these States, we apply an asset adjustment factor of 1.0 and a national participation adjustment of 0.918 (Eslami forthcoming, 2013). For the remaining 10 non-BBCE States44—Alaska, Arkansas, Indiana, Kansas, Missouri, South Dakota, Tennessee, Utah, Virginia, and Wyoming—we apply an asset adjustment factor of 0.82945 and the national participation adjustment of 0.929.
42 The national estimate of the participation rate of school-age children used in last year’s Report to Congress was taken from
the report Supplemental Nutrition Assistance Program Participation Rates: Fiscal Year 2010 (Eslami et. al., 2012). That report has since been updated and includes methodological improvements that better account for differences between administrative data from the SNAP QC data file and data from the CPS-based eligibility file. See Eslami (forthcoming, 2013) for details regarding the methodological changes. The methodology changes revised the participation rate used last year downward from 0.918 to 0.891. We include the revised participation rate when presenting the corrected direct certification estimates for SY 2011–2012 shown in Appendix E.
43 See Trippe and Gillooly (2010) for more details regarding noncash CE.
44 In last year’s Report to Congress, the same 10 States were identified as not having adopted BBCE policies.
45 Before the Report to Congress for SY 2010-2011, the asset adjustment for States that retained a traditional asset test (non-
BBCE) was based on a national estimate, which included BBCE States and those that have narrow or no categorical eligibility. However, this served to overestimate the percentage of the population that was income-eligible but not asset-eligible in States that have narrow or no categorical eligibility. For SY 2010-2011, we improved the adjustment by reestimating the values in Table A.1 of the report, Assets of Low-Income Households by SNAP Eligibility and Participation in 2010 (Trippe and Schechter 2010) for households residing only in states that have not implemented BBCE policies. We continue to use this revised methodology for this year’s Report to Congress to determine the asset adjustment factor for the remaining 10 non-BBCE States. Because of adjustments to the underlying model, we recalculated the asset adjustment—the revised asset adjustment to be used for both SY 2011-2012 and SY 2012-2013 is 0.829 (compared to 0.824, previously).
APPENDIX D
DATA LIMITATIONS

Mathematica Policy Research
D.2
A. Local Educational Agency Verification Summary Reports
Each school year, LEAs that participate in the NSLP are required to review a sample of applications that were approved for free or reduced-price benefits. LEAs record the results of this review on VSRs that they submit through State education agencies to the FNS. The VSRs are the source for two key data elements used in this report.
1. Students Certified for Free Meals and Not Subject to Verification
This data element is used as a proxy for directly certified children from households that participate in the SNAP. In many States, however, students eligible for free meals whose status is not subject to verification also include directly certified TANF or FDPIR participants; children who are categorically eligible based on their status as a migrant or homeless child, or their enrollment in Federally funded Head Start or Even Start; and children in certain residential child care institutions.
A 2005 survey found that 15 of the 18 States that conducted State-level direct certification matches included both SNAP and TANF databases in their matching systems. In 18 of the 22 States that employed a local matching system, or district-level matching, at that time, the States provided both SNAP and TANF databases to the LEAs for use in the matching process.46 Since SY 2004–2005, the percentage of LEAs that directly certify children from SNAP-participant households has increased from 55.6 to 90.9 percent in SY 2012–2013.47 To the extent that those LEAs adopted already-established central- or local-matching system procedures for their new direct certification systems, it is likely that they too are certifying both TANF and SNAP participants.
For these reasons, the number of students eligible for free meals not subject to verification is an imperfect proxy for directly certified SNAP participants. Specifically the proxy will overstate the number of directly certified SNAP participants because it includes students who were not SNAP participants but who were directly certified on the basis of TANF participation. Although this population of TANF participants is likely to be small, this overstatement is not constant across States or LEAs. The proxy count tends to be smallest for States and LEAs that include only SNAP-participant databases in their direct certification systems, even though those States and LEAs might be in full compliance with the statutory direct certification mandate. As a result, the estimates of direct certification performance developed in this report could exaggerate the differences between the States.
Separately, State counts of children in SNAP households include home-schooled students,48 students in schools that do not participate in the NSLP, and school-age dropouts. These school-age SNAP participants are categorically eligible for free school meals, however, the NSLP cannot reach these students and they are not counted in the VSR data. Therefore, the existence of home-schooled students, students in schools that do not participate in the NSLP, and school dropouts will reduce the direct certification performance measure. Moreover, the number of these students varies across States.
46 LEAs in the remaining States relied solely on the letter method of direct certification. See Cole and Logan (2007), pp. ix,
34–36.
47 See Table 1.
48 An estimated 1.5 million students were home-schooled in 2007 (U.S. Department of Education 2008).

Mathematica Policy Research
D.3
Finally, Section 4301 of the 2008 Farm Bill specifies that State measures of direct certification effectiveness shall use estimates of the number of SNAP-participant children directly certified as of October 1. Our estimates of directly certified children are taken from the VSR, which contains data through the last reporting day of October.
2. Students Eligible for Free Meals, Based on Claiming Percentages Reported by Provision 2 and Provision 3 Schools That Are Not Operating in a Base Year
The performance measure includes this data element to reduce the number of SNAP-participant children that are candidates for direct certification. The problem with this variable, for purposes of this report, is that children in Provision 2 and Provision 3 schools receive free meals based on their income or SNAP-participant status in some previous year. If the number of SNAP-participant children has changed significantly in a particular State since a school’s most recent base year, then an estimate of SNAP participants who attend Provision 2 or Provision 3 schools based on this data element will be inaccurate.
B. SNAP Quality Control System Data Set
This data set contains the data necessary to estimate the school-age participant share of each States’ SNAP population. The QC data element used here is the number of children between the ages of 5 and 17. A more appropriate variable would be one that identifies children by their educational status rather than their ages. In States or districts with widespread or mandatory pre-kindergarten programs or all-day kindergarten, this QC variable will understate the SNAP population eligible for free school meals. In States with kindergarten age cutoffs that do not require many 5-year old children to be in school, this variable will overstate the relevant population. Similarly, this variable will overstate the relevant population in States with high drop-out rates.
C. American Community Survey
This report’s alternate measure of the States’ success at certifying categorically eligible children for free school meals relies in part on a factor developed with ACS data from the U.S. Census Bureau. The ACS offers estimates of households that receive SNAP benefits and households that receive both SNAP benefits and public assistance, which ACS documentation defines as “general assistance and Temporary Assistance to Needy Families.”49 For this report, we use the ACS count of households that receive public assistance as a proxy for households that receive TANF benefits. This proxy will overstate the TANF population by an unknown amount that varies according to the size of the States’ general assistance programs.
A second problem with the ACS data is the tendency of households to underreport receipt of SNAP benefits in particular, and other public assistance benefits generally. In this report, FNS uses ACS estimates of households that receive either public assistance or SNAP benefits and households that receive SNAP benefits. These two data elements are used here to estimate the ratio of TANF-only households to all SNAP households. Underreporting of either benefit, especially differences in underreporting, reduces the reliability of the ratio constructed from the two ACS variables.
49 See U.S. Census Bureau 2011, p. 80.

Mathematica Policy Research
D.4
Finally, ACS data are not available for Guam, which is included in the Report to Congress this year for the first time. Therefore, Guam is not included in the analysis of the more comprehensive categorical eligibility certification measure.
D. Survey of FDPIR Participants
The estimated count of school-age FDPIR participants used to develop the performance measure presented in Figure 7 is based in part on a survey conducted for a 1990 study (Usher et al. 1990). The study found that 37 percent of FDPIR participants were younger than 18. FNS multiplied this figure by a factor of 13/18 (the expected number of children ages 5 to 17 among those ages 0 to 17) and applied it to the average monthly FDPIR caseload,50 by State, for fiscal year 2008. The primary weakness of this estimate is clear: the share of children in households that currently receive FDPIR benefits likely has changed, significantly in some States, since 1990.
E. Survey of Income and Program Participation
Another methodological limitation is related to the use of a national parameter in generating State-level estimates for the number of school-age SNAP participants. Although monthly State-level estimates of the number of school-age SNAP participants are available, these estimates do not indicate how many of these children received SNAP in previous months and how many are new cases. The performance measure uses an estimate of the SNAP turnover rate to calculate the number of unduplicated school-age SNAP children. However, the turnover rate estimate is based on data from the SIPP, which is not intended for State-level analysis. Therefore, State-specific estimates of the SNAP turnover rate are not available. The State direct certification performance measure must use the national estimate for SNAP turnover rate in its estimate of the number of unduplicated school-age SNAP children. This procedure will overstate the number of SNAP participants in States with lower than average SNAP turnover rates and will understate the number of SNAP participants in States with higher than average SNAP turnover rates.
50 FNS FDPIR program data.

APPENDIX E
DATA UPDATES FOR SCHOOL YEAR 2011–2012
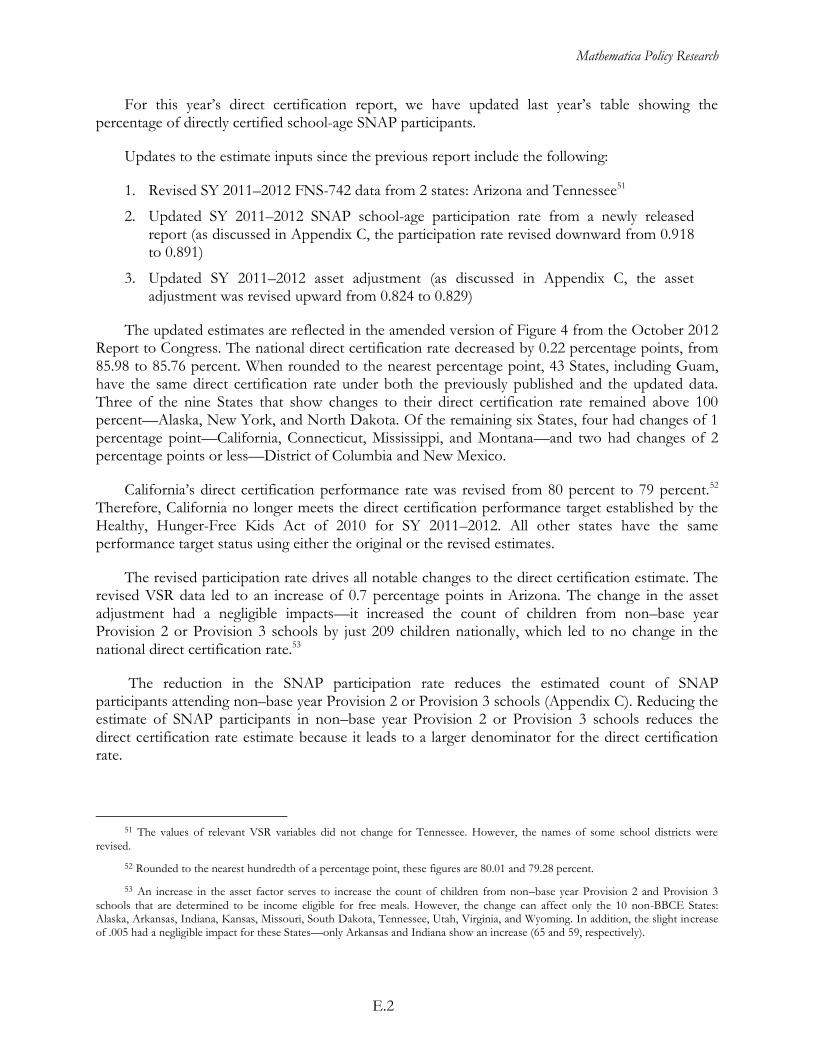
Mathematica Policy Research
E.2
For this year’s direct certification report, we have updated last year’s table showing the percentage of directly certified school-age SNAP participants.
Updates to the estimate inputs since the previous report include the following:
1. Revised SY 2011–2012 FNS-742 data from 2 states: Arizona and Tennessee51
2. Updated SY 2011–2012 SNAP school-age participation rate from a newly released report (as discussed in Appendix C, the participation rate revised downward from 0.918 to 0.891)
3. Updated SY 2011–2012 asset adjustment (as discussed in Appendix C, the asset adjustment was revised upward from 0.824 to 0.829)
The updated estimates are reflected in the amended version of Figure 4 from the October 2012 Report to Congress. The national direct certification rate decreased by 0.22 percentage points, from 85.98 to 85.76 percent. When rounded to the nearest percentage point, 43 States, including Guam, have the same direct certification rate under both the previously published and the updated data. Three of the nine States that show changes to their direct certification rate remained above 100 percent—Alaska, New York, and North Dakota. Of the remaining six States, four had changes of 1 percentage point—California, Connecticut, Mississippi, and Montana—and two had changes of 2 percentage points or less—District of Columbia and New Mexico.
California’s direct certification performance rate was revised from 80 percent to 79 percent.52 Therefore, California no longer meets the direct certification performance target established by the Healthy, Hunger-Free Kids Act of 2010 for SY 2011–2012. All other states have the same performance target status using either the original or the revised estimates.
The revised participation rate drives all notable changes to the direct certification estimate. The revised VSR data led to an increase of 0.7 percentage points in Arizona. The change in the asset adjustment had a negligible impacts—it increased the count of children from non–base year Provision 2 or Provision 3 schools by just 209 children nationally, which led to no change in the national direct certification rate.53
The reduction in the SNAP participation rate reduces the estimated count of SNAP participants attending non–base year Provision 2 or Provision 3 schools (Appendix C). Reducing the estimate of SNAP participants in non–base year Provision 2 or Provision 3 schools reduces the direct certification rate estimate because it leads to a larger denominator for the direct certification rate.
51 The values of relevant VSR variables did not change for Tennessee. However, the names of some school districts were
revised.
52 Rounded to the nearest hundredth of a percentage point, these figures are 80.01 and 79.28 percent.
53 An increase in the asset factor serves to increase the count of children from non–base year Provision 2 and Provision 3
schools that are determined to be income eligible for free meals. However, the change can affect only the 10 non-BBCE States: Alaska, Arkansas, Indiana, Kansas, Missouri, South Dakota, Tennessee, Utah, Virginia, and Wyoming. In addition, the slight increase of .005 had a negligible impact for these States—only Arkansas and Indiana show an increase (65 and 59, respectively).
Mathematica Policy Research
E.3
States that have the largest number of reported SNAP participants in non–base year Provision 2 and Provision 3 schools showed the largest drop in that category as a result of the change in participation rate. Nationally, the participation rate change (alone) lowered the number of SNAP participants in Provision 2 or Provision schools by 38.3 thousand, with three states accounting for 70 percent of that reduction (reductions in California, Texas and New York were 10.7, 9.4, and 6.8 thousand, respectively).
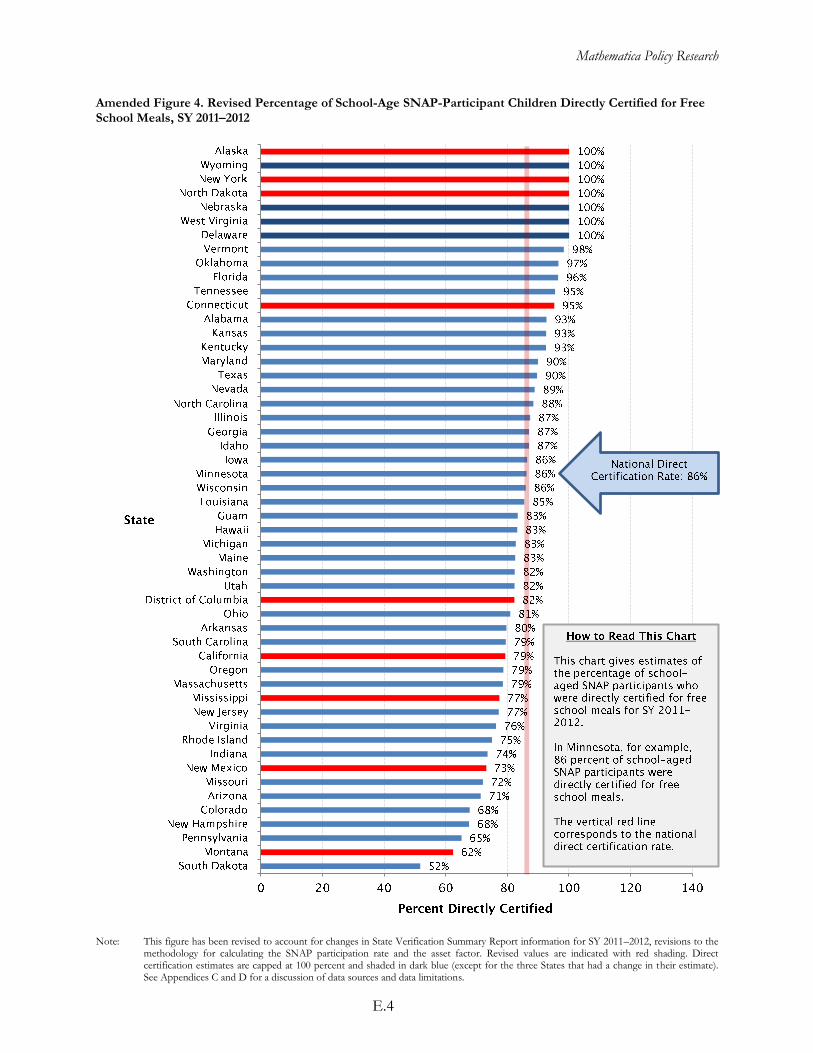
Mathematica Policy Research
E.4
Amended Figure 4. Revised Percentage of School-Age SNAP-Participant Children Directly Certified for Free School Meals, SY 2011–2012
Note: This figure has been revised to account for changes in State Verification Summary Report information for SY 2011–2012, revisions to the methodology for calculating the SNAP participation rate and the asset factor. Revised values are indicated with red shading. Direct certification estimates are capped at 100 percent and shaded in dark blue (except for the three States that had a change in their estimate). See Appendices C and D for a discussion of data sources and data limitations.

www.mathematica-mpr.com
■ ■ ■ ■ ■