Embed Size (px)
Citation preview
ISSN 0003-2654
AnalystInterdisciplinary detection science
www.rsc.org/analyst Volume 135 | Number 4 | April 2010 | Pages 645–808
CRITICAL REVIEWR. Graham Cooks et al.Desorption electrospray ionization and other ambient ionization methods: current progress and preview
PAPERAkos Vertes et al.Direct analysis of lipids and small metabolites in mouse brain tissue by AP IR-MALDI and reactive LAESI mass spectrometry
HOT ARTICLEZheng Ouyang et al.Direct analysis of melamine in complex matrices using a handheld mass spectrometer
Themed Issue on Ambient Mass Spectrometry
Publ
ishe
d on
20
Janu
ary
2010
. Dow
nloa
ded
by H
einr
ich
Hei
ne U
nive
rsity
of
Due
ssel
dorf
on
12/1
1/20
13 1
2:10
:45.
View Article Online / Journal Homepage / Table of Contents for this issue
PAPER www.rsc.org/analyst | Analyst
Publ
ishe
d on
20
Janu
ary
2010
. Dow
nloa
ded
by H
einr
ich
Hei
ne U
nive
rsity
of
Due
ssel
dorf
on
12/1
1/20
13 1
2:10
:45.
View Article Online
Direct analysis of lipids and small metabolites in mouse brain tissueby AP IR-MALDI and reactive LAESI mass spectrometry†‡
Bindesh Shrestha,a Peter Nemes,a Javad Nazarian,b Yetrib Hathout,b Eric P. Hoffmanb and Akos Vertes*a
Received 2nd November 2009, Accepted 7th January 2010
First published as an Advance Article on the web 20th January 2010
DOI: 10.1039/b922854c
Ambient analysis of metabolites and lipids from unprocessed animal tissue by mass spectrometry
remains a challenge. The utility of the two novel ambient ionization techniques – atmospheric pressure
infrared matrix-assisted laser desorption ionization (AP IR-MALDI) and laser ablation electrospray
ionization (LAESI) – is demonstrated for the direct mass spectrometric analysis of lipids and other
metabolites from mouse brain. Major brain lipids including cholesterol, various phospholipid species
(glycerophosphocholines, sphingomyelin and phosphatidylethanolamines) along with numerous
metabolites, for example g-aminobutyric acid (GABA), creatine and choline, were identified in
a typical mass spectrum. In a new ionization modality of LAESI, termed reactive LAESI, in-plume
reactions with a solute of choice (lithium sulfate) enhanced structure-specific fragmentation of lipid
ions for improved molecular assignment in collision-activated dissociation experiments. In-plume
processes in reactive LAESI provide additional structural information without contaminating the
biological sample with the reactant.
Introduction
Lipidomics is broadly defined as the analysis of lipids and lipid-
associated species. Apart from their structural role, lipids also act
as signaling molecules or precursors to such molecules in the
nervous system. As such, many neurological disorders such as
schizophrenia and Alzheimer’s disease are linked to abnormal
lipid metabolism.1–4 The mammalian brain is not only rich in
lipid content but also contains a structurally diverse lipid pop-
ulation.1 More than half of the dry weight of a normal human
brain is composed of lipids, predominantly glycer-
ophospholipids.5,6 These species play vital roles such as the
generation of second messengers, apoptosis, regulation of
transporters and membrane-bound enzymes, and the mainte-
nance of neuronal wellbeing.7
Imbalances in brain metabolites are responsible for many
neurological diseases and neurocognitive conditions.8,9 Since
many small metabolites are directly or indirectly involved with
lipid metabolism, their detection helps to gain a better under-
standing of lipid function. Currently the in vivo analysis of
metabolites is achieved by microdialysis sampling10 or by non-
invasive measurements with nuclear magnetic resonance
aDepartment of Chemistry, W. M. Keck Institute for ProteomicsTechnology and Applications, George Washington University,Washington, DC 20052, USA. E-mail: [email protected]; Fax: +1-202-994-5873; Tel: +1-202-994-2717bResearch Center for Genetic Medicine, Children’s National MedicalCenter, Washington, DC 20010, USA
† This paper is part of an Analyst themed issue on Ambient MassSpectrometry, with guest editors Xinrong Zhang and Zheng Ouyang.
‡ Electronic supplementary information (ESI) available: tandem MSspectra of PC(18:1/18:1) lipid standard ions produced by LAESI andreactive LAESI. Tentative peak assignments of some ions in the APIR-MALDI and LAESI mass spectra of normal mouse brain tissue.See DOI: 10.1039/b922854c
This journal is ª The Royal Society of Chemistry 2010
(NMR)11,12 or positron emission tomography (PET)13 that
exhibit low sensitivity. Improved detection limits for brain
neurotransmitters and metabolites can be achieved using mass
spectrometric techniques, such as LC/MS,14 CE-ESI-MS/MS15
and LC/ESI MS/MS,16 which require extensive sample prepara-
tion and long analysis time. Recently, the utility of atmospheric
pressure photoionization and atmospheric pressure chemical
ionization was demonstrated for neurotransmitters.17
Several techniques are available for the analysis of lipids in vivo
and in vitro. Nuclear magnetic resonance (NMR) based on 31P
nuclei for phospholipids and protons for all other lipids has
demonstrated excellent capabilities for the in vivo analysis of
lipids.18 Chromatographic techniques, such as thin layer chro-
matography (TLC),19,20 high performance liquid chromato-
graphy (HPLC) and gas chromatography (GC), are often used
for the analysis of extracted lipid samples.21 Mass spectrometry
(MS) is another powerful approach for the investigation of
lipids,22 for example, in combination with traditional ionization
techniques such as secondary ion mass spectrometry (SIMS)23
and fast atom bombardment (FAB).24 Two soft ionization
techniques, electrospray ionization (ESI)25–27 and matrix-assisted
laser desorption ionization (MALDI),28–30 have been utilized to
analyze lipids from processed biological samples. The direct
analysis of lipids from brain tissue using vacuum or intermediate
pressure MALDI requires the application of an external matrix
and the transfer of the sample into the low-pressure environ-
ment.31–36 Sample processing as well as the post-mortem cellular
disintegration of autopsied biological samples require special
care to maintain the molecular integrity of samples.37,38 Clearly,
technical developments are needed in the way sampling and
molecular analysis is performed to mitigate such effects.
Novel MS-based approaches employing ambient ion sources
present unique advantages for the investigation of biological
samples, including brain sections. As these methods probe the
Analyst, 2010, 135, 751–758 | 751
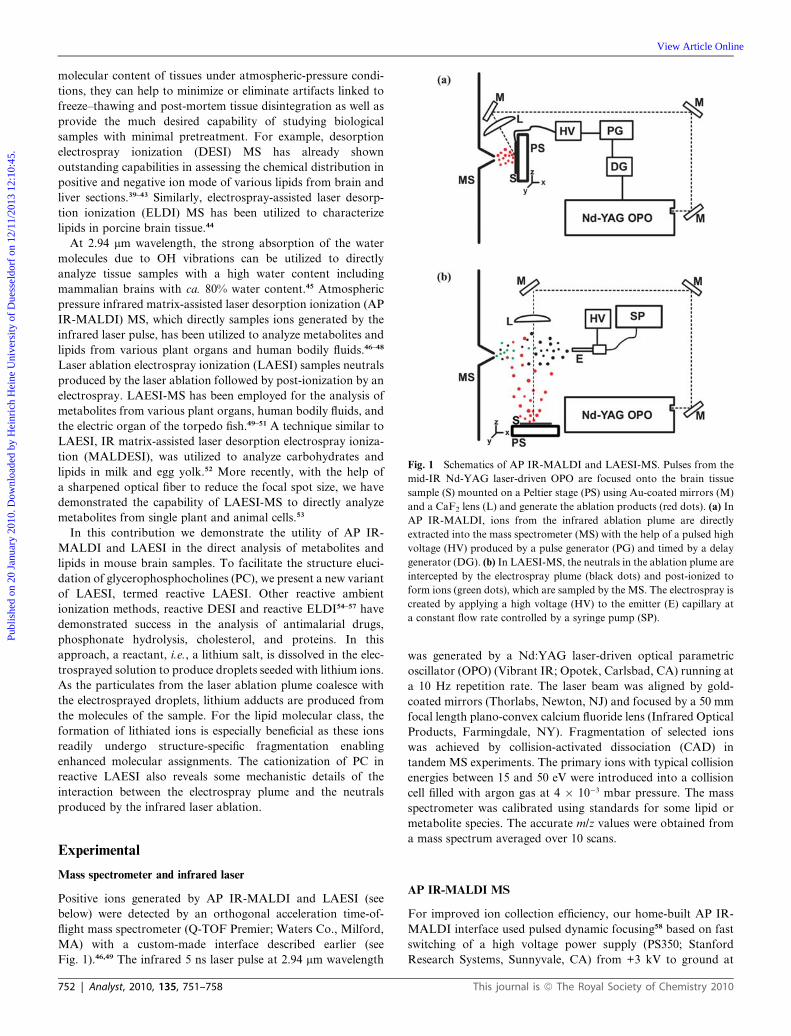
Fig. 1 Schematics of AP IR-MALDI and LAESI-MS. Pulses from the
mid-IR Nd-YAG laser-driven OPO are focused onto the brain tissue
sample (S) mounted on a Peltier stage (PS) using Au-coated mirrors (M)
and a CaF2 lens (L) and generate the ablation products (red dots). (a) In
AP IR-MALDI, ions from the infrared ablation plume are directly
extracted into the mass spectrometer (MS) with the help of a pulsed high
voltage (HV) produced by a pulse generator (PG) and timed by a delay
generator (DG). (b) In LAESI-MS, the neutrals in the ablation plume are
intercepted by the electrospray plume (black dots) and post-ionized to
form ions (green dots), which are sampled by the MS. The electrospray is
created by applying a high voltage (HV) to the emitter (E) capillary at
a constant flow rate controlled by a syringe pump (SP).
Publ
ishe
d on
20
Janu
ary
2010
. Dow
nloa
ded
by H
einr
ich
Hei
ne U
nive
rsity
of
Due
ssel
dorf
on
12/1
1/20
13 1
2:10
:45.
View Article Online
molecular content of tissues under atmospheric-pressure condi-
tions, they can help to minimize or eliminate artifacts linked to
freeze–thawing and post-mortem tissue disintegration as well as
provide the much desired capability of studying biological
samples with minimal pretreatment. For example, desorption
electrospray ionization (DESI) MS has already shown
outstanding capabilities in assessing the chemical distribution in
positive and negative ion mode of various lipids from brain and
liver sections.39–43 Similarly, electrospray-assisted laser desorp-
tion ionization (ELDI) MS has been utilized to characterize
lipids in porcine brain tissue.44
At 2.94 mm wavelength, the strong absorption of the water
molecules due to OH vibrations can be utilized to directly
analyze tissue samples with a high water content including
mammalian brains with ca. 80% water content.45 Atmospheric
pressure infrared matrix-assisted laser desorption ionization (AP
IR-MALDI) MS, which directly samples ions generated by the
infrared laser pulse, has been utilized to analyze metabolites and
lipids from various plant organs and human bodily fluids.46–48
Laser ablation electrospray ionization (LAESI) samples neutrals
produced by the laser ablation followed by post-ionization by an
electrospray. LAESI-MS has been employed for the analysis of
metabolites from various plant organs, human bodily fluids, and
the electric organ of the torpedo fish.49–51 A technique similar to
LAESI, IR matrix-assisted laser desorption electrospray ioniza-
tion (MALDESI), was utilized to analyze carbohydrates and
lipids in milk and egg yolk.52 More recently, with the help of
a sharpened optical fiber to reduce the focal spot size, we have
demonstrated the capability of LAESI-MS to directly analyze
metabolites from single plant and animal cells.53
In this contribution we demonstrate the utility of AP IR-
MALDI and LAESI in the direct analysis of metabolites and
lipids in mouse brain samples. To facilitate the structure eluci-
dation of glycerophosphocholines (PC), we present a new variant
of LAESI, termed reactive LAESI. Other reactive ambient
ionization methods, reactive DESI and reactive ELDI54–57 have
demonstrated success in the analysis of antimalarial drugs,
phosphonate hydrolysis, cholesterol, and proteins. In this
approach, a reactant, i.e., a lithium salt, is dissolved in the elec-
trosprayed solution to produce droplets seeded with lithium ions.
As the particulates from the laser ablation plume coalesce with
the electrosprayed droplets, lithium adducts are produced from
the molecules of the sample. For the lipid molecular class, the
formation of lithiated ions is especially beneficial as these ions
readily undergo structure-specific fragmentation enabling
enhanced molecular assignments. The cationization of PC in
reactive LAESI also reveals some mechanistic details of the
interaction between the electrospray plume and the neutrals
produced by the infrared laser ablation.
Experimental
Mass spectrometer and infrared laser
Positive ions generated by AP IR-MALDI and LAESI (see
below) were detected by an orthogonal acceleration time-of-
flight mass spectrometer (Q-TOF Premier; Waters Co., Milford,
MA) with a custom-made interface described earlier (see
Fig. 1).46,49 The infrared 5 ns laser pulse at 2.94 mm wavelength
752 | Analyst, 2010, 135, 751–758
was generated by a Nd:YAG laser-driven optical parametric
oscillator (OPO) (Vibrant IR; Opotek, Carlsbad, CA) running at
a 10 Hz repetition rate. The laser beam was aligned by gold-
coated mirrors (Thorlabs, Newton, NJ) and focused by a 50 mm
focal length plano-convex calcium fluoride lens (Infrared Optical
Products, Farmingdale, NY). Fragmentation of selected ions
was achieved by collision-activated dissociation (CAD) in
tandem MS experiments. The primary ions with typical collision
energies between 15 and 50 eV were introduced into a collision
cell filled with argon gas at 4 � 10�3 mbar pressure. The mass
spectrometer was calibrated using standards for some lipid or
metabolite species. The accurate m/z values were obtained from
a mass spectrum averaged over 10 scans.
AP IR-MALDI MS
For improved ion collection efficiency, our home-built AP IR-
MALDI interface used pulsed dynamic focusing58 based on fast
switching of a high voltage power supply (PS350; Stanford
Research Systems, Sunnyvale, CA) from +3 kV to ground at
This journal is ª The Royal Society of Chemistry 2010
Publ
ishe
d on
20
Janu
ary
2010
. Dow
nloa
ded
by H
einr
ich
Hei
ne U
nive
rsity
of
Due
ssel
dorf
on
12/1
1/20
13 1
2:10
:45.
View Article Online
a particular delay time triggered by a digital delay generator
(DG535; Stanford Research Systems).
The target plate was kept at a distance of 2 mm from the mass
spectrometer orifice to maximize ion collection efficiency, while
allowing access by the focused laser beam under a 45� angle.
Although reducing this distance would increase the ion yield,
further approaching the orifice with the sample at high voltage
could induce an electrical breakdown. The laser fluence in the AP
IR-MALDI experiments was 0.7 � 0.1 J/cm2.
LAESI-MS
The LAESI ion source has been described earlier.49 Briefly, it is
based on an electrospray setup with the emitter biased by
a regulated high voltage power supply (PS350; Stanford
Research Systems, Sunnyvale, CA). A methanol–water (1:1)
mixture containing 0.1% (v/v) trifluoroacetic acid was pumped
through a blunt tip emitter (130 mm i.d., 260 mm, o.d., model
90531; Hamilton Co., Reno, NV) by a syringe pump (Harvard
22; Harvard Apparatus, Holliston, MA) at a 2–5 ml/min flow rate
and stable electrospray was maintained at 3000 V potential. The
emitter was lined up with the orifice of the mass spectrometer and
was located at a distance of 10–12 mm from it. The distance
between the target and the emitter axis was varied between 10
and 15 mm. The laser beam, with 90� incidence angle, was
focused on the target ca. 5 mm downstream from the emitter tip
and delivered a fluence of 0.8 � 0.1 J/cm2.
Chemicals
Lipid standard samples were obtained from Avanti Polar Lipids
Inc., Alabaster, AL. All other chemicals were purchased from
Fisher Scientific (Boston, MA) and used without further purifi-
cation. Lipid standards of various concentrations were prepared
in 50% (v/v) MeOH solution by adding lipid stock solutions
prepared in CHCl3.
Mouse brain tissue
Mouse brain samples were obtained from a healthy C57Bl/10
mouse strain from the Jackson Laboratory (Bar Harbor, ME).
The mice were euthanized by cervical dislocation at average ages
of 12–14 months. All animal procedures and experiments
complied fully with the principles set forth in the ‘Guide for
the Care and Use of Laboratory Animals’ prepared by the
Committee on Care and Use of Laboratory Animals of the
Institute of Laboratory Resources, National Research Council,
and were approved by the Children’s National Medical Center’s
Institutional Animal Use and Care Committee. Their brain was
immediately snap-frozen using isopentane cooled in liquid
nitrogen and stored at �80 �C until the analysis. The brain was
kept frozen on top of a block of dry ice covered with sheets of
aluminium foil and sectioned while observing through a magni-
fying viewer. The samples were prepared by manually excising
400 mm thick transverse sections through the middle of the
cerebrum with a sharp surgical scalpel. Brain sections were
directly used for mass spectrometric analysis without any
pretreatment.
This journal is ª The Royal Society of Chemistry 2010
Peltier cooling stage
Brain tissue kept at room temperature can undergo rapid
biochemical changes and dehydration. To avoid such changes,
the sections were kept just below the freezing temperature of the
tissue at ca. �5 �C during the analysis by using a Peltier cooling
stage.59 The Peltier cooling stage was based on a ceramic ther-
moelectric module (Ferrotec Corp., Bedford, NH) attached by
heat sink compound (GC Electronics, Rockford, IL) and glue
(Henkel Loctite, Cleveland, OH) to a metal heat sink (Aavid
Thermalloy, Concord, NH) and a DC fan (Comair Rotron, San
Diego, CA). The thermoelectric module and the fan were pow-
ered by DC supplies (R.S.R. Electronics, Avenel, NJ).
Protocol for molecular assignments
Due to the large number of chemical species present in the bio-
logical tissue, the assignment of the detected ions required special
attention. The tentative assignments of metabolites and lipids
were obtained by a combination of accurate monoisotopic mass
measurements, isotope distribution analysis, the use of metab-
olomic and lipid databases and, in some cases, CAD tandem MS.
The theoretical monoisotopic masses were calculated using the
NIST Isotope Calculator package (ISOFORM, Version 1.02).
Metabolomic and lipid databases were searched for species
within a �15 mDa accuracy window of our mass spectrometric
results. In particular, the detected molecules with low m/z were
matched against known brain metabolites listed in the METLIN
Metabolite Database60 maintained by the Scripps Center for
Mass Spectrometry (http://metlin.scripps.edu; last accessed on
October 1, 2009) and in the Human Metabolome Database61
maintained by Genome Alberta and Genome Canada (http://
www.hmdb.ca; last accessed on October 1, 2009). The lipid
databases included the LIPID Metabolites and Pathways
Strategy resource maintained by the LIPID MAPS Consortium62
(http://www.lipidmaps.org; last accessed on October 1, 2009),
and the LipidBank63 maintained by the Japanese Conference on
the Biochemistry of Lipids (http://www.lipidbank.jp; last
accessed on October 1, 2009). The results were reported
following the comprehensive classification and nomenclature of
lipids proposed by Fahy et al.64 Even with extensive information,
careful assignment of the metabolites and lipids is necessary due
to the large number of possible structural isomers. An unam-
biguous identification of an ion needs comprehensive studies
depending on multiple methods, such as separation techniques,
ultrahigh resolution MS, NMR, FTIR, etc.
Results and discussion
AP IR-MALDI vs. LAESI-MS of a lipid standard
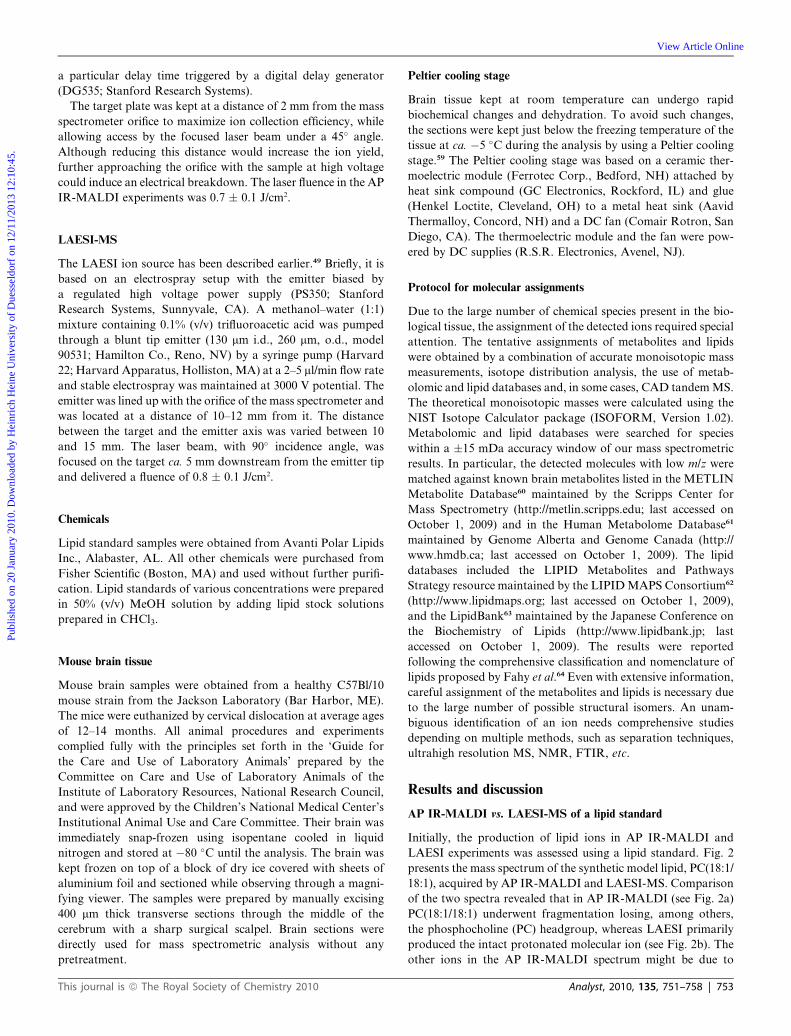
Initially, the production of lipid ions in AP IR-MALDI and
LAESI experiments was assessed using a lipid standard. Fig. 2
presents the mass spectrum of the synthetic model lipid, PC(18:1/
18:1), acquired by AP IR-MALDI and LAESI-MS. Comparison
of the two spectra revealed that in AP IR-MALDI (see Fig. 2a)
PC(18:1/18:1) underwent fragmentation losing, among others,
the phosphocholine (PC) headgroup, whereas LAESI primarily
produced the intact protonated molecular ion (see Fig. 2b). The
other ions in the AP IR-MALDI spectrum might be due to
Analyst, 2010, 135, 751–758 | 753
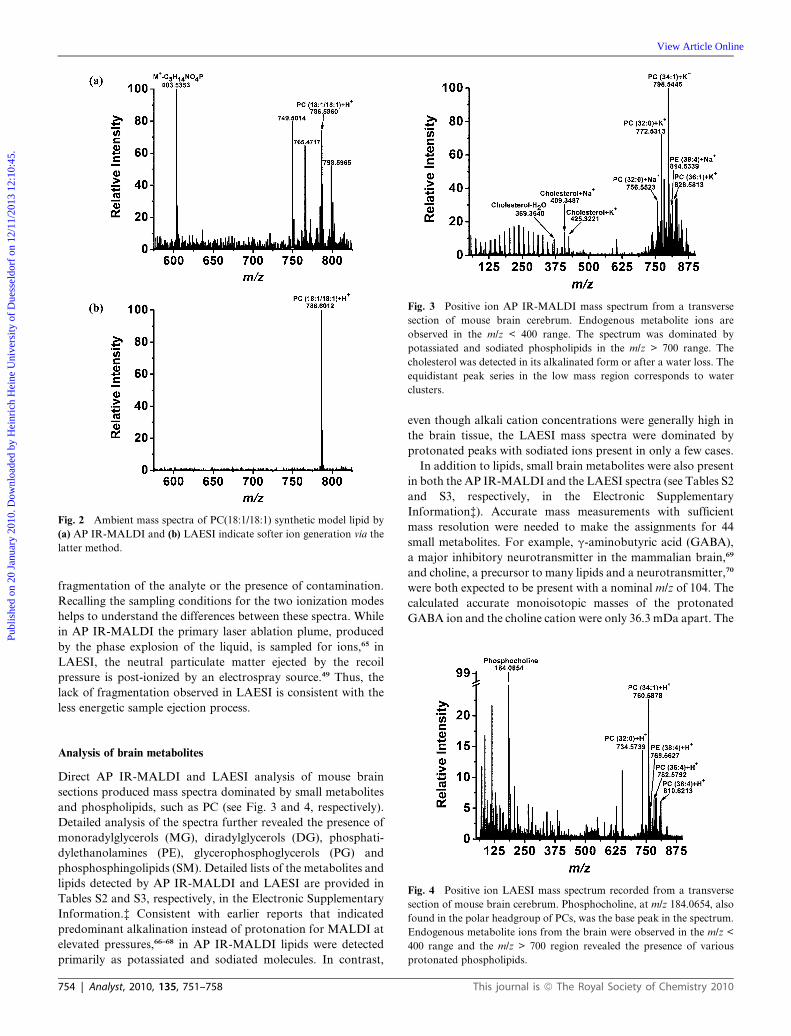
Fig. 2 Ambient mass spectra of PC(18:1/18:1) synthetic model lipid by
(a) AP IR-MALDI and (b) LAESI indicate softer ion generation via the
latter method.
Fig. 3 Positive ion AP IR-MALDI mass spectrum from a transverse
section of mouse brain cerebrum. Endogenous metabolite ions are
observed in the m/z < 400 range. The spectrum was dominated by
potassiated and sodiated phospholipids in the m/z > 700 range. The
cholesterol was detected in its alkalinated form or after a water loss. The
equidistant peak series in the low mass region corresponds to water
clusters.
Publ
ishe
d on
20
Janu
ary
2010
. Dow
nloa
ded
by H
einr
ich
Hei
ne U
nive
rsity
of
Due
ssel
dorf
on
12/1
1/20
13 1
2:10
:45.
View Article Online
fragmentation of the analyte or the presence of contamination.
Recalling the sampling conditions for the two ionization modes
helps to understand the differences between these spectra. While
in AP IR-MALDI the primary laser ablation plume, produced
by the phase explosion of the liquid, is sampled for ions,65 in
LAESI, the neutral particulate matter ejected by the recoil
pressure is post-ionized by an electrospray source.49 Thus, the
lack of fragmentation observed in LAESI is consistent with the
less energetic sample ejection process.
Fig. 4 Positive ion LAESI mass spectrum recorded from a transverse
section of mouse brain cerebrum. Phosphocholine, at m/z 184.0654, also
found in the polar headgroup of PCs, was the base peak in the spectrum.
Endogenous metabolite ions from the brain were observed in the m/z <
400 range and the m/z > 700 region revealed the presence of various
protonated phospholipids.
Analysis of brain metabolites
Direct AP IR-MALDI and LAESI analysis of mouse brain
sections produced mass spectra dominated by small metabolites
and phospholipids, such as PC (see Fig. 3 and 4, respectively).
Detailed analysis of the spectra further revealed the presence of
monoradylglycerols (MG), diradylglycerols (DG), phosphati-
dylethanolamines (PE), glycerophosphoglycerols (PG) and
phosphosphingolipids (SM). Detailed lists of the metabolites and
lipids detected by AP IR-MALDI and LAESI are provided in
Tables S2 and S3, respectively, in the Electronic Supplementary
Information.‡ Consistent with earlier reports that indicated
predominant alkalination instead of protonation for MALDI at
elevated pressures,66–68 in AP IR-MALDI lipids were detected
primarily as potassiated and sodiated molecules. In contrast,
754 | Analyst, 2010, 135, 751–758
even though alkali cation concentrations were generally high in
the brain tissue, the LAESI mass spectra were dominated by
protonated peaks with sodiated ions present in only a few cases.
In addition to lipids, small brain metabolites were also present
in both the AP IR-MALDI and the LAESI spectra (see Tables S2
and S3, respectively, in the Electronic Supplementary
Information‡). Accurate mass measurements with sufficient
mass resolution were needed to make the assignments for 44
small metabolites. For example, g-aminobutyric acid (GABA),
a major inhibitory neurotransmitter in the mammalian brain,69
and choline, a precursor to many lipids and a neurotransmitter,70
were both expected to be present with a nominal m/z of 104. The
calculated accurate monoisotopic masses of the protonated
GABA ion and the choline cation were only 36.3 mDa apart. The
This journal is ª The Royal Society of Chemistry 2010

Publ
ishe
d on
20
Janu
ary
2010
. Dow
nloa
ded
by H
einr
ich
Hei
ne U
nive
rsity
of
Due
ssel
dorf
on
12/1
1/20
13 1
2:10
:45.
View Article Online
corresponding peaks were close to baseline resolved by both AP
IR-MALDI and LAESI. Mass accuracies for the ions identified
in the mass spectra were uniformly below 15 mDa in the m/z <
900 mass range. Inspecting Tables S2 and S3 reveals that the two
methods presented above offer complementary information for
metabolite analysis directly from the brain tissue. Of the 143
overall assignments (79 for AP IR-MALDI and 93 for LAESI-
MS), 29 are present in both spectra corresponding to a ca. 20%
overlap. To account for the differences, we need to take into
consideration that the samples are inhomogeneous and there are
numerous unassigned peaks.
Cholesterol
The detection of cholesterol, one of the most abundant steroid
lipids, by mass spectrometry is hindered by its inefficient ioni-
zation. In addition to being critical for the regulation of cell
membrane properties in mammalian cells, cholesterol also acts as
a precursor to other metabolites such as steroid hormones, bile
acids and vitamin D.71,72 Cholesterol was readily detected by AP
IR-MALDI at m/z 369.3540, 409.3487 and 425.3221 as [M �H2O + H]+, [M + Na]+ and [M + K]+, respectively (see Fig. 3). In
wet samples the alkaline adduct ions were more abundant.
Interestingly, cholesterol spectra were also produced from dried
samples with the [M � H2O + H]+ ion becoming more prom-
inent. The ionization of cholesterol with AP IR-MALDI in the
absence of water could be explained by the absorption of the O–
H bond in the cholesterol molecule at 2.94 mm laser wavelength
as shown in the condensed phase FTIR spectrum (see, for
example, http://webbook.nist.gov/).
In the positive ion mode, relatively non-polar molecules, such
as cholesterol, are poorly ionized by electrospray ionization.
Thus usually derivatization, for example, to cholesterol-3-
sulfate, is carried out to facilitate their detection.73 In the LAESI
spectrum of the mouse brain sample, the cholesterol ion could be
detected only as a minor [M � H2O + H]+ peak after scanning
a wider sample surface. However, the analysis of a wetted
synthetic cholesterol sample by LAESI readily produced a peak
at m/z 369.3482 indicating the presence of the [M � H2O + H]+
ion. The ionization of synthetic cholesterol showed that LAESI
was capable of ionizing a compound that absorbed the mid-IR
laser light, even though it could not be ionized directly by ESI.
Further studies on the effect of laser wavelength, electrospray
solution composition, negative ion modality, and ion source
geometry are needed to assess the ability of LAESI to ionize such
non-polar analytes.
Glycerophosphocholines (PC)
Ion production from PC is efficient due to the presence of the
positively charged quaternary amine moiety in these molecules.
The brain tissue mass spectra from both AP IR-MALDI and
LAESI are dominated by PC ions. The analysis of a standard
phospholipid mixture by conventional MALDI showed the
suppression of other lipids by PC.74 Most of the ions in the 700–
900 m/z range represent PC species with a variety of fatty acid
moieties. Four PCs in brain tissue samples, PC(32:0), PC(34:1),
PC(36:1), and PC(38:4), with some of the related diradylglycerol
This journal is ª The Royal Society of Chemistry 2010
(DG) ions appeared as major peaks in both the AP IR-MALDI
and the LAESI mass spectra.
The DG structures can be independent species in the tissue,
fragment ions, and/or natural degradation products of PC.
Fragmentation of PC molecules has been reported under vacuum
UV-MALDI conditions.29 In AP IR-MALDI, based on the
accurate mass measurement alone, the m/z 723.5016 ion can be
viewed as a sodiated glycerophosphate PA(36:2) molecule,
[C39H73O8P + Na+] or a sodiated fragment of PC(34:1) formed
by the loss of trimethylamine (–N(CH3)3, Dm 59.0735),
[C39H73O8P + Na+], as both of these species have the same
elemental composition. Similarly in LAESI, the m/z 577.5279 ion
can be derived as a protonated fragment of PC(34:1) due to the
loss of the polar phosphocholine (C5H14NO4P, Dm 183.0660)
headgroup, [C37H68O4 + H+], or it can be rationalized as
a protonated DG structure, such as DG(34:1) with the same
elemental composition after water loss. Ion production from the
model lipid PC(18:1/18:1) with LAESI did not show any evidence
of phosphocholine loss, whereas AP IR-MALDI produced
a protonated fragment with the loss of phosphocholine,
[C39H70O4 + H+], resulting in an ion that was indistinguishable
from the protonated DG(36:2) species after water loss. In Tables
S2 and S3‡ we only listed the assignment for the detected ions
that required the least amount of rearrangement, supported by
the analysis of standards, and/or positive match in the related
database. Due to the limited mass accuracy, in some cases even
the elemental compositions could not be unambiguously dis-
cerned. For example, in the AP IR-MALDI spectra, m/z
810.6011 could be explained as a sodiated PC(36:1) and/or as
a protonated PC(38:4) because the exact masses of these ions
were only 2.3 mDa apart. Coupling AP IR-MALDI and LAESI
with ultrahigh resolution MS should enable unambiguous iden-
tification in such cases.
Other lipids
Lipids from two other major categories, PE and SM, were
detected by both AP IR-MALDI and LAESI. Protonated and
alkalinated PE(38:4) and PE(40:6) structures were observed in
AP IR-MALDI with no fragmentation (see Table S2 in the
Electronic Supplementary Information‡). In LAESI, PE were
detected as protonated molecules (see Table S3 in the Electronic
Supplementary Information‡). Similar to the case of the PC
assignments, these measured m/z values were consistent with
potential fragmentation of other lipids. For example, in ESI, the
loss of the phosphoethanolamine headgroup was used as a diag-
nostic tool for the detection of the PE.75,76 Based on the accurate
mass alone the produced ion could also be explained via a water
loss from a DG. Other lipid assignments included a few instances
of MG, glycerophosphates (PA), glycerophosphoglycerols (PG),
SM and ceramide (Cer), implicated in the hydrolysis of SM. The
ability to detect diverse lipids through AP IR-MALDI and
LAESI-MS directly from the tissue can be used to uncover brain
lipid profiles.
The mass spectra for standard samples were reproducible for
both techniques. While most of the major peaks remained
unchanged, for biological samples, due to their heterogeneity, the
minor peaks showed some variance.
Analyst, 2010, 135, 751–758 | 755
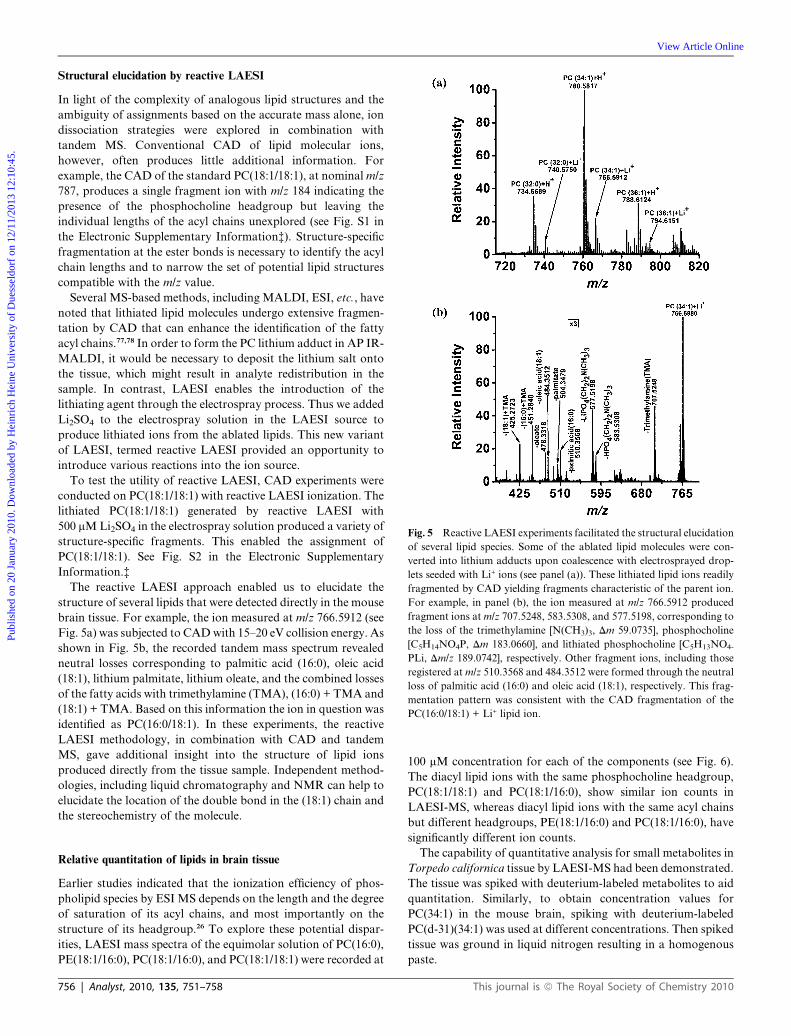
Fig. 5 Reactive LAESI experiments facilitated the structural elucidation
of several lipid species. Some of the ablated lipid molecules were con-
verted into lithium adducts upon coalescence with electrosprayed drop-
lets seeded with Li+ ions (see panel (a)). These lithiated lipid ions readily
fragmented by CAD yielding fragments characteristic of the parent ion.
For example, in panel (b), the ion measured at m/z 766.5912 produced
fragment ions at m/z 707.5248, 583.5308, and 577.5198, corresponding to
the loss of the trimethylamine [N(CH3)3, Dm 59.0735], phosphocholine
[C5H14NO4P, Dm 183.0660], and lithiated phosphocholine [C5H13NO4-
PLi, Dm/z 189.0742], respectively. Other fragment ions, including those
registered at m/z 510.3568 and 484.3512 were formed through the neutral
loss of palmitic acid (16:0) and oleic acid (18:1), respectively. This frag-
mentation pattern was consistent with the CAD fragmentation of the
PC(16:0/18:1) + Li+ lipid ion.
Publ
ishe
d on
20
Janu
ary
2010
. Dow
nloa
ded
by H
einr
ich
Hei
ne U
nive
rsity
of
Due
ssel
dorf
on
12/1
1/20
13 1
2:10
:45.
View Article Online
Structural elucidation by reactive LAESI
In light of the complexity of analogous lipid structures and the
ambiguity of assignments based on the accurate mass alone, ion
dissociation strategies were explored in combination with
tandem MS. Conventional CAD of lipid molecular ions,
however, often produces little additional information. For
example, the CAD of the standard PC(18:1/18:1), at nominal m/z
787, produces a single fragment ion with m/z 184 indicating the
presence of the phosphocholine headgroup but leaving the
individual lengths of the acyl chains unexplored (see Fig. S1 in
the Electronic Supplementary Information‡). Structure-specific
fragmentation at the ester bonds is necessary to identify the acyl
chain lengths and to narrow the set of potential lipid structures
compatible with the m/z value.
Several MS-based methods, including MALDI, ESI, etc., have
noted that lithiated lipid molecules undergo extensive fragmen-
tation by CAD that can enhance the identification of the fatty
acyl chains.77,78 In order to form the PC lithium adduct in AP IR-
MALDI, it would be necessary to deposit the lithium salt onto
the tissue, which might result in analyte redistribution in the
sample. In contrast, LAESI enables the introduction of the
lithiating agent through the electrospray process. Thus we added
Li2SO4 to the electrospray solution in the LAESI source to
produce lithiated ions from the ablated lipids. This new variant
of LAESI, termed reactive LAESI provided an opportunity to
introduce various reactions into the ion source.
To test the utility of reactive LAESI, CAD experiments were
conducted on PC(18:1/18:1) with reactive LAESI ionization. The
lithiated PC(18:1/18:1) generated by reactive LAESI with
500 mM Li2SO4 in the electrospray solution produced a variety of
structure-specific fragments. This enabled the assignment of
PC(18:1/18:1). See Fig. S2 in the Electronic Supplementary
Information.‡
The reactive LAESI approach enabled us to elucidate the
structure of several lipids that were detected directly in the mouse
brain tissue. For example, the ion measured at m/z 766.5912 (see
Fig. 5a) was subjected to CAD with 15–20 eV collision energy. As
shown in Fig. 5b, the recorded tandem mass spectrum revealed
neutral losses corresponding to palmitic acid (16:0), oleic acid
(18:1), lithium palmitate, lithium oleate, and the combined losses
of the fatty acids with trimethylamine (TMA), (16:0) + TMA and
(18:1) + TMA. Based on this information the ion in question was
identified as PC(16:0/18:1). In these experiments, the reactive
LAESI methodology, in combination with CAD and tandem
MS, gave additional insight into the structure of lipid ions
produced directly from the tissue sample. Independent method-
ologies, including liquid chromatography and NMR can help to
elucidate the location of the double bond in the (18:1) chain and
the stereochemistry of the molecule.
Relative quantitation of lipids in brain tissue
Earlier studies indicated that the ionization efficiency of phos-
pholipid species by ESI MS depends on the length and the degree
of saturation of its acyl chains, and most importantly on the
structure of its headgroup.26 To explore these potential dispar-
ities, LAESI mass spectra of the equimolar solution of PC(16:0),
PE(18:1/16:0), PC(18:1/16:0), and PC(18:1/18:1) were recorded at
756 | Analyst, 2010, 135, 751–758
100 mM concentration for each of the components (see Fig. 6).
The diacyl lipid ions with the same phosphocholine headgroup,
PC(18:1/18:1) and PC(18:1/16:0), show similar ion counts in
LAESI-MS, whereas diacyl lipid ions with the same acyl chains
but different headgroups, PE(18:1/16:0) and PC(18:1/16:0), have
significantly different ion counts.
The capability of quantitative analysis for small metabolites in
Torpedo californica tissue by LAESI-MS had been demonstrated.
The tissue was spiked with deuterium-labeled metabolites to aid
quantitation. Similarly, to obtain concentration values for
PC(34:1) in the mouse brain, spiking with deuterium-labeled
PC(d-31)(34:1) was used at different concentrations. Then spiked
tissue was ground in liquid nitrogen resulting in a homogenous
paste.
This journal is ª The Royal Society of Chemistry 2010
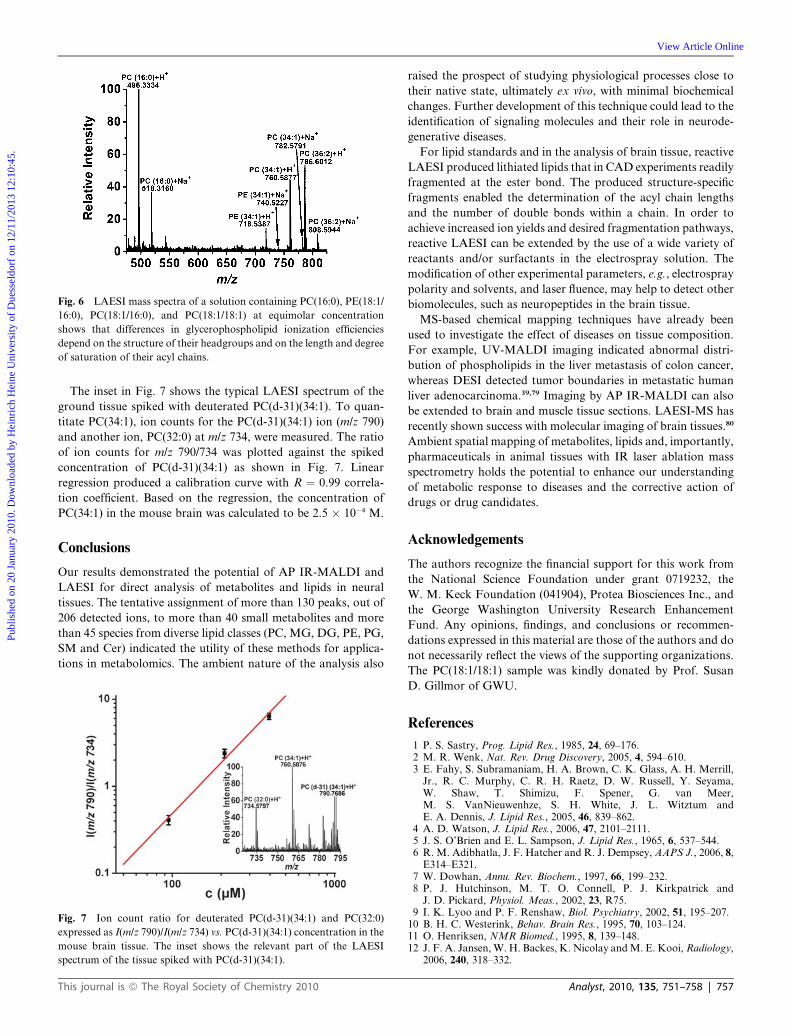
Fig. 6 LAESI mass spectra of a solution containing PC(16:0), PE(18:1/
16:0), PC(18:1/16:0), and PC(18:1/18:1) at equimolar concentration
shows that differences in glycerophospholipid ionization efficiencies
depend on the structure of their headgroups and on the length and degree
of saturation of their acyl chains.
Publ
ishe
d on
20
Janu
ary
2010
. Dow
nloa
ded
by H
einr
ich
Hei
ne U
nive
rsity
of
Due
ssel
dorf
on
12/1
1/20
13 1
2:10
:45.
View Article Online
The inset in Fig. 7 shows the typical LAESI spectrum of the
ground tissue spiked with deuterated PC(d-31)(34:1). To quan-
titate PC(34:1), ion counts for the PC(d-31)(34:1) ion (m/z 790)
and another ion, PC(32:0) at m/z 734, were measured. The ratio
of ion counts for m/z 790/734 was plotted against the spiked
concentration of PC(d-31)(34:1) as shown in Fig. 7. Linear
regression produced a calibration curve with R ¼ 0.99 correla-
tion coefficient. Based on the regression, the concentration of
PC(34:1) in the mouse brain was calculated to be 2.5 � 10�4 M.
Conclusions
Our results demonstrated the potential of AP IR-MALDI and
LAESI for direct analysis of metabolites and lipids in neural
tissues. The tentative assignment of more than 130 peaks, out of
206 detected ions, to more than 40 small metabolites and more
than 45 species from diverse lipid classes (PC, MG, DG, PE, PG,
SM and Cer) indicated the utility of these methods for applica-
tions in metabolomics. The ambient nature of the analysis also
Fig. 7 Ion count ratio for deuterated PC(d-31)(34:1) and PC(32:0)
expressed as I(m/z 790)/I(m/z 734) vs. PC(d-31)(34:1) concentration in the
mouse brain tissue. The inset shows the relevant part of the LAESI
spectrum of the tissue spiked with PC(d-31)(34:1).
This journal is ª The Royal Society of Chemistry 2010
raised the prospect of studying physiological processes close to
their native state, ultimately ex vivo, with minimal biochemical
changes. Further development of this technique could lead to the
identification of signaling molecules and their role in neurode-
generative diseases.
For lipid standards and in the analysis of brain tissue, reactive
LAESI produced lithiated lipids that in CAD experiments readily
fragmented at the ester bond. The produced structure-specific
fragments enabled the determination of the acyl chain lengths
and the number of double bonds within a chain. In order to
achieve increased ion yields and desired fragmentation pathways,
reactive LAESI can be extended by the use of a wide variety of
reactants and/or surfactants in the electrospray solution. The
modification of other experimental parameters, e.g., electrospray
polarity and solvents, and laser fluence, may help to detect other
biomolecules, such as neuropeptides in the brain tissue.
MS-based chemical mapping techniques have already been
used to investigate the effect of diseases on tissue composition.
For example, UV-MALDI imaging indicated abnormal distri-
bution of phospholipids in the liver metastasis of colon cancer,
whereas DESI detected tumor boundaries in metastatic human
liver adenocarcinoma.39,79 Imaging by AP IR-MALDI can also
be extended to brain and muscle tissue sections. LAESI-MS has
recently shown success with molecular imaging of brain tissues.80
Ambient spatial mapping of metabolites, lipids and, importantly,
pharmaceuticals in animal tissues with IR laser ablation mass
spectrometry holds the potential to enhance our understanding
of metabolic response to diseases and the corrective action of
drugs or drug candidates.
Acknowledgements
The authors recognize the financial support for this work from
the National Science Foundation under grant 0719232, the
W. M. Keck Foundation (041904), Protea Biosciences Inc., and
the George Washington University Research Enhancement
Fund. Any opinions, findings, and conclusions or recommen-
dations expressed in this material are those of the authors and do
not necessarily reflect the views of the supporting organizations.
The PC(18:1/18:1) sample was kindly donated by Prof. Susan
D. Gillmor of GWU.
References
1 P. S. Sastry, Prog. Lipid Res., 1985, 24, 69–176.2 M. R. Wenk, Nat. Rev. Drug Discovery, 2005, 4, 594–610.3 E. Fahy, S. Subramaniam, H. A. Brown, C. K. Glass, A. H. Merrill,
Jr., R. C. Murphy, C. R. H. Raetz, D. W. Russell, Y. Seyama,W. Shaw, T. Shimizu, F. Spener, G. van Meer,M. S. VanNieuwenhze, S. H. White, J. L. Witztum andE. A. Dennis, J. Lipid Res., 2005, 46, 839–862.
4 A. D. Watson, J. Lipid Res., 2006, 47, 2101–2111.5 J. S. O’Brien and E. L. Sampson, J. Lipid Res., 1965, 6, 537–544.6 R. M. Adibhatla, J. F. Hatcher and R. J. Dempsey, AAPS J., 2006, 8,
E314–E321.7 W. Dowhan, Annu. Rev. Biochem., 1997, 66, 199–232.8 P. J. Hutchinson, M. T. O. Connell, P. J. Kirkpatrick and
J. D. Pickard, Physiol. Meas., 2002, 23, R75.9 I. K. Lyoo and P. F. Renshaw, Biol. Psychiatry, 2002, 51, 195–207.
10 B. H. C. Westerink, Behav. Brain Res., 1995, 70, 103–124.11 O. Henriksen, NMR Biomed., 1995, 8, 139–148.12 J. F. A. Jansen, W. H. Backes, K. Nicolay and M. E. Kooi, Radiology,
2006, 240, 318–332.
Analyst, 2010, 135, 751–758 | 757
Publ
ishe
d on
20
Janu
ary
2010
. Dow
nloa
ded
by H
einr
ich
Hei
ne U
nive
rsity
of
Due
ssel
dorf
on
12/1
1/20
13 1
2:10
:45.
View Article Online
13 M. E. Phelps and J. C. Mazziotta, Science, 1985, 228, 799–809.14 S. Bourcier, J. F. Benoist, F. Clerc, O. Rigal, M. Taghi and
Y. Hoppilliard, Rapid Commun. Mass Spectrom., 2006, 20, 1405–1421.
15 E. M. J€averfalk-Hoyes, U. Bondesson, D. Westerlund andP. E. Andr�en, Electrophoresis, 1999, 20, 1527–1532.
16 E. Tareke, J. F. Bowyer and D. R. Doerge, Rapid Commun. MassSpectrom., 2007, 21, 3898–3904.
17 T. J. Kauppila, T. Nikkola, R. A. Ketola and R. Kostiainen, J. MassSpectrom., 2006, 41, 781–789.
18 M. Kriat, J. Vion-Dury, S. Confort-Gouny, R. Favre, P. Viout,M. Sciaky, H. Sari and P. J. Cozzone, J. Lipid Res., 1993, 34, 1009–1019.
19 I. R. Kupke and S. Zeugner, J. Chromatogr., B: Biomed. Sci. Appl.,1978, 146, 261–271.
20 J. C. Touchstone, J. Chromatogr., B: Biomed. Sci. Appl., 1995, 671,169–195.
21 B. L. Peterson and B. S. Cummings, Biomed. Chromatogr., 2006, 20,227–243.
22 R. C. Murphy, J. Fiedler and J. Hevko, Chem. Rev., 2001, 101, 479–526.23 P. Sjovall, J. Lausmaa and B. Johansson, Anal. Chem., 2004, 76,
4271–4278.24 N. Jensen, K. Tomer and M. Gross, Lipids, 1986, 21, 580–588.25 X. Han and R. W. Gross, Proc. Natl. Acad. Sci. U. S. A., 1994, 91,
10635–10639.26 M. Pulfer and R. C. Murphy, Mass Spectrom. Rev., 2003, 22, 332–
364.27 X. Han and R. W. Gross, Mass Spectrom. Rev., 2005, 24, 367–412.28 D. J. Harvey, J. Mass Spectrom., 1995, 30, 1333–1346.29 J. A. Marto, F. M. White, S. Seldomridge and A. G. Marshall, Anal.
Chem., 1995, 67, 3979–3984.30 J. Schiller, R. Su, J. Arnhold, B. Fuchs, J. Leig, M. Muller,
M. Petkovic, H. Spalteholz, O. Zschornig and K. Arnold, Prog.Lipid Res., 2004, 43, 449–488.
31 Y. Ishida, O. Nakanishi, S. Hirao, S. Tsuge, J. Urabe, T. Sekino,M. Nakanishi, T. Kimoto and H. Ohtani, Anal. Chem., 2003, 75,4514–4518.
32 M. Rujoi, R. Estrada and M. C. Yappert, Anal. Chem., 2004, 76,1657–1663.
33 S. N. Jackson, H. Y. J. Wang and A. S. Woods, Anal. Chem., 2005, 77,4523–4527.
34 T. J. Garrett and R. A. Yost, Anal. Chem., 2006, 78, 2465–2469.35 S. Cha and E. S. Yeung, Anal. Chem., 2007, 79, 2373–2385.36 K. Dreisewerd, R. Lemaire, G. Pohlentz, M. Salzet, M. Wisztorski,
S. Berkenkamp and I. Fournier, Anal. Chem., 2007, 79, 2463–2471.37 T. L. Perry, S. Hansen and S. S. Gandham, J. Neurochem., 1981, 36,
406–412.38 S. Banaschak, R. Rzanny, J. R. Reichenbach, W. A. Kaiser and
A. Klein, Int. J. Legal Med., 2005, 119, 77–79.39 J. M. Wiseman, S. M. Puolitaival, Z. Tak�ats, R. G. Cooks and
R. M. Caprioli, Angew. Chem., Int. Ed., 2005, 44, 7094–7097.40 J. M. Wiseman, D. R. Ifa, Q. Song and R. G. Cooks, Angew. Chem.,
Int. Ed., 2006, 45, 7188–7192.41 N. E. Manicke, J. M. Wiseman, D. R. Ifa and R. G. Cooks, J. Am.
Soc. Mass Spectrom., 2008, 19, 531–543.42 Z. Takats, V. Kobliha, K. Sevcik, P. Novak, G. Kruppa, K. Lemr and
V. Havlicek, J. Mass Spectrom., 2008, 43, 196–203.43 A. L. Dill, D. R. Ifa, N. E. Manicke, Z. Ouyang and R. G. Cooks, J.
Chromatogr., B: Anal. Technol. Biomed. Life Sci., 2009, 877, 2883–2889.
44 M.-Z. Huang, H.-J. Hsu, C. I. Wu, S.-Y. Lin, Y.-L. Ma, T.-L. Chengand J. Shiea, Rapid Commun. Mass Spectrom., 2007, 21, 1767–1775.
45 L. L. Uzman and K. R. Marilynn, J. Neurochem., 1958, 3, 170–184.46 Y. Li, B. Shrestha and A. Vertes, Anal. Chem., 2007, 79, 523–532.47 Y. Li, B. Shrestha and A. Vertes, Anal. Chem., 2008, 80, 407–420.48 B. Shrestha, Y. Li and A. Vertes, Metabolomics, 2008, 4, 297–311.49 P. Nemes and A. Vertes, Anal. Chem., 2007, 79, 8098–8106.50 P. Nemes, A. A. Barton, Y. Li and A. Vertes, Anal. Chem., 2008, 80,
4575–4582.51 P. Sripadi, J. Nazarian, Y. Hathout, E. P. Hoffman and A. Vertes,
Metabolomics, 2009, 5, 263–276.
758 | Analyst, 2010, 135, 751–758
52 J. S. Sampson, K. K. Murray and D. C. Muddiman, J. Am. Soc. MassSpectrom., 2009, 20, 667–673.
53 B. Shrestha and A. Vertes, Anal. Chem., 2009, 81, 8265–8271.54 L. Nyadong, M. D. Green, V. R. DeJesus, P. N. Newton and
F. M. Fernandez, Anal. Chem., 2007, 79, 2150–2157.55 Y. Song and R. G. Cooks, J. Mass Spectrom., 2007, 42, 1086–1092.56 I. X. Peng, R. R. Ogorzalek Loo, J. Shiea and J. A. Loo, Anal. Chem.,
2008, 80, 6995–7003.57 C. Wu, D. R. Ifa, N. E. Manicke and R. G. Cooks, Anal. Chem., 2009,
81, 7618–7624.58 P. V. Tan, V. V. Laiko and V. M. Doroshenko, Anal. Chem., 2004, 76,
2462–2469.59 C. E. Von Seggern, B. D. Gardner and R. J. Cotter, Anal. Chem.,
2004, 76, 5887–5893.60 C. A. Smith, G. O’Maille, E. J. Want, C. Qin, S. A. Trauger,
T. R. Brandon, D. E. Custodio, R. Abagyan and G. Siuzdak, Ther.Drug Monit., 2005, 27, 747.
61 D. S. Wishart, D. Tzur, C. Knox, R. Eisner, A. C. Guo, N. Young,D. Cheng, K. Jewell, D. Arndt, S. Sawhney, C. Fung, L. Nikolai,M. Lewis, M. A. Coutouly, I. Forsythe, P. Tang, S. Shrivastava,K. Jeroncic, P. Stothard, G. Amegbey, D. Block, D. D. Hau,J. Wagner, J. Miniaci, M. Clements, M. Gebremedhin, N. Guo,Y. Zhang, G. E. Duggan, G. D. MacInnis, A. M. Weljie,R. Dowlatabadi, F. Bamforth, D. Clive, R. Greiner, L. Li,T. Marrie, B. D. Sykes, H. J. Vogel and L. Querengesser, NucleicAcids Res., 2007, 35, D521–D526.
62 D. Cotter, A. Maer, C. Guda, B. Saunders and S. Subramaniam,Nucleic Acids Res., 2006, 34, D507–D510.
63 K. Watanebe, E. Yasugi and M. Oshima, Trends Glycosci.Glycotechnol., 2000, 12, 175–184.
64 E. Fahy, S. Subramaniam, R. C. Murphy, M. Nishijima,C. R. H. Raetz, T. Shimizu, F. Spener, G. van Meer,M. J. O. Wakelam and E. A. Dennis, J. Lipid Res., 2009, 50, S9–14.
65 A. Vertes, P. Nemes, B. Shrestha, A. Barton, Z. Chen and Y. Li, Appl.Phys. A: Mater. Sci. Proc., 2008.
66 P. B. O’Connor and C. E. Costello, Rapid Commun. Mass Spectrom.,2001, 15, 1862–1868.
67 T. J. Garrett, M. C. Prieto-Conaway, V. Kovtoun, H. Bui,N. Izgarian, G. Stafford and R. A. Yost, Int. J. Mass Spectrom.,2007, 260, 166–176.
68 A. Rohlfing, J. Muthing, G. Pohlentz, U. Distler, J. Peter-Katalinic,S. Berkenkamp and K. Dreisewerd, Anal. Chem., 2007, 79, 5793–5808.
69 M. Watanabe, K. Maemura, K. Kanbara, T. Tamayama andH. Hayasaki, Int. Rev. Cytol., 2002, 213, 1–47.
70 S. H. Zeisel, J. Am. College Nutrit., 1992, 11, 473–481.71 K. Simons and E. Ikonen, Science, 2000, 290, 1721–1726.72 J. G. McDonald, B. M. Thompson, E. C. McCrum, D. W. Russell and
H. A. Brown, Methods in Enzymology, Lipidomics and BioactiveLipids: Mass-Spectrometry-based Lipid Analysis, Academic Press,2007, vol. 432, pp. 145–170.
73 R. Sandhoff, B. Brugger, D. Jeckel, W. D. Lehmann andF. T. Wieland, J. Lipid Res., 1999, 40, 126–132.
74 M. Petkovic, J. Schiller, M. Muller, S. Benard, S. Reichl, K. Arnoldand J. Arnhold, Anal. Biochem., 2001, 289, 202–216.
75 K. A. Zemski Berry and R. C. Murphy, J. Am. Soc. Mass Spectrom.,2004, 15, 1499–1508.
76 D. Schwudke, J. Oegema, L. Burton, E. Entchev, J. T. Hannich,C. S. Ejsing, T. Kurzchalia and A. Shevchenko, Anal. Chem., 2006,78, 585–595.
77 F.-F. Hsu, A. Bohrer and J. Turk, J. Am. Soc. Mass Spectrom., 1998,9, 516–526.
78 S. N. Jackson, H.-Y. J. Wang and A. S. Woods, J. Am. Soc. MassSpectrom., 2005, 16, 2052–2056.
79 S. Shimma, Y. Sugiura, T. Hayasaka, Y. Hoshikawa, T. Noda andM. Setou, J. Chromatogr., B: Anal. Technol. Biomed. Life Sci.,2007, 855, 98–103.
80 P. Nemes, A. Svatos and A. Vertes, 57th American Society for MassSpectrometry conference on Mass Spectrometry, Philadelphia, PA,USA, 2009.
This journal is ª The Royal Society of Chemistry 2010


![PRACTICE OF POLYMER MALDI 11maldi.ch.pw.edu.pl/pomiary/Artykuly/liang-li/ocr/021-040_unity-reader.pdf · 2.2 PRACTICE OF POLYMER MALDI 11 MALDI sources [10]; these have also become](https://img.pdfslide.us/doc/110x75/5e20a425f916e801c369e9f7/practice-of-polymer-maldi-22-practice-of-polymer-maldi-11-maldi-sources-10-these.jpg)


![Polymer Analysis by MALDI-TOF MS - · PDF file[ application note ] GPC MALDI polymer analysis Although MALDI MS has been used widely to provide molecular weight and structural and](https://img.pdfslide.us/doc/110x75/5a6fa6dc7f8b9a93538b49a5/polymer-analysis-by-maldi-tof-ms-waterswwwwaterscomwebassetscmslibrarydocs720002100enpdfpdf.jpg)