Embed Size (px)
Citation preview

Dire Straits in the Nation’s Teen Labor Market: The Outlook for the Summer 2010 Teen Job
Market and the Case for A Comprehensive Youth Jobs Creation Strategy
Prepared by: Andrew Sum
Ishwar Khatiwada With
Sheila Palma Center for Labor Market Studies
Northeastern University Boston, Massachusetts
Prepared for:
C.S. Mott Foundation Flint, Michigan
April 2010

Table of Contents
Introduction......................................................................................................................................1
Trends in the Employment Rates of Teens from 2000 Through 2010 I ..........................................2
The Changing Labor Market Fortunes of Key Demographic and Socioeconomic Groups of Teens .................................................................................................4
The Underutilized Labor Pool Among The Nation’s Teens and Its Personal Economic and Social Costs..........................................................................................................8
The Summer Employment Experiences of the Nation’s Teens 2000-2009 and the Predicted Job Outlook for the Summer of 2010 ..................................................................13
The Job Creation Impacts of a Modest Summer Jobs Program for the Nation’s Teens..........................................................................................................................................17
Where Do We Go From Here? ......................................................................................................20

”The crippling nature of the joblessness that has moved through the society like a devastating virus has gotten neither the attention nor the response that it deserves.”
Bob Herbert, New York Times, April 13, 2010
Introduction During the past decade (2000-2009), the nation’s labor markets have performed quite
poorly on nearly all measures: employment growth, unemployment, underemployment, and real
wage gains of full-time workers. The nation’s teens (16-19) and young adults (20-29), especially
those without four year college degrees, have fared the worst. Over the decade, the employment
rates of teens and young adults reached new post-World War II lows while the employment rates
of the nation’s older workers (55 and older) increased.1 The labor market problems of teens and
young adults (20-24 years old) have not received much attention from the nation’s and most
states’ economic policymakers over the past 9 years. The only major new initiative for youth was
a small scale and very short-term job creation program for low income youth (14-22) in the
summer of 2009 financed under the American Recovery and Reinvestment Act.2
This research paper is focused on the deteriorating labor market plight of the nation’s
teens over the past decade in the U.S., especially since the inception of the Great Recession of
2007-2009. Labor markets are only now (March 2010) beginning to emerge from the recession.3
Our paper will begin by reviewing trends in the employment rates of the nation’s teens (16-19)
from 2000 through the first quarter of 2010 when their employment rate hit a new post-World
War II low. The changes in the employment rates of teens from the end of 2007 through the
February-March period of 2010 will be compared to those of adults in other age groups to
illustrate the impacts of the Great Recession on the labor market situation of teens and young
adults (20-24). The declines in the employment rates of teens in key gender, race-ethnic, and
family income groups will be described and analyzed. The extremely depressed state of the labor
market for Black male teens and those from low income families will be identified. 1 For evidence on these dramatic age twists in employment rates by age group, See: (i) Andrew Sum, Ishwar Khatiwada, and Sheila Palma, “The Age Twist in Employment Rates, 2000-2004,” Challenge, No. 4, July-August 2005, pp. 51-68; (ii) Andrew Sum, Ishwar Khatiwada, and Joseph McLaughlin, In With the Old and Out with the Young: The Dramatic Age Twists in Employment Rates of Working Age Adults in the U.S., 2000-2009, Center for Labor Market Studies, Northeastern University, Boston, March 2009. 2 Given the short duration of the summer jobs programs (6-7 weeks) and its comparatively small number of enrollments (320,000) not all of which went to 16-19 year olds, we estimate that the net impact of the program on the year-round employment rate of teen was less than .2 percentage points. 3 While the National Bureau of Economic Recession has earlier identified December 2007 as the peak of the previous business cycle, it still has not yet identified the ending month of the recession. See: “The Recession: When Did It End?,” The Economist, April 17, 2010, pp. 30,32.
1

The labor market problems of the nation’s teens at the end of calendar year 2009 will
then be examined, including open unemployment, hidden unemployment, and underemployment;
i.e., working part-time but desiring full-time work. The pool of underutilized labor and the
underutilization rate will be estimated and its consequences assessed.
The final section of the paper will provide an overview of the summer job market for
teens over the 2000-2009 period, a projection of the summer 2010 employment rate for teens in
the absence of any new job creation effort, and the magnitude of the additional number of jobs
for teens that are needed to restore the summer teen employment rate to its value in 2000. The
public policy implications of these findings will be reviewed.
Trends in the Employment Rates of Teens from 2000 Through 2010 I
The teen job market in most parts of the U.S. has essentially collapsed since 2000. During
2000, at the end of the labor market boom of the 1990s, the teen employment rate (the
employment/population ratio) reached 45.2%.4 During the recession of 2001 and the largely
jobless recovery of 2002-2003, the teen E/P rate declined considerably, falling to 36.8% in 2003
(Chart 1).5 During the national jobs recovery from the early fall of 2003 through the end of 2007,
teens gained very few net new jobs. Their employment rate peaked in 2006 at 36.9%, only .1
percentage points higher than in 2003. Teen job prospects began to decline ahead of the national
recession, with their employment rate falling to 34.8% in 2007. By 2009, their employment rate
had dropped to 28.4%, a new post-World War II low and would fall further to 26.2% (seasonally
adjusted) in January-March 2010. The teen employment rate in the first three months of 2010
was barely more than one-half of its value in 2000, the mark of a true depression in the nation’s
teen labor market.
4 The E/P ratio represents the percent of the teen civilian non-institutional population (P) that is employed in paid work, including self-employment. Members of the armed forces and inmates of institutions, such as juvenile detention, prisons, and jails, are excluded from the population counts. 5 For earlier reviews of the impacts of the 2001 recession and the jobless recovery of 2002-2003 on the teen and young adult labor market, See: (i) Andrew Sum, Nathan Pond, and Sheila Palma, The Impacts of the 2001 National Recession and the Ensuing Jobless Recovery on the Employment of the Nation’s Teens and Young Adults, Prepared for the National League of Cities, Washington, D.C., 2002; (ii) Andrew Sum, Ishwar Khatiwada, with Susan Perron, Still Young, Restless, and Jobless: The Growing Employment Malaise Among U.S. Teens and Young Adults, Center for Labor Market Studies, Northeastern University, Boston, January 2004.
2

Chart 1: Trends in the Employment/Population Ratios of U.S. Teens, 2000-2010
(Selected Years, Annual Averages, Except 2010)
45.242.3
36.8 36.934.8
28.426.2
0
5
10
15
20
25
30
35
40
45
50
2000 2001 2003 2006 2007 2009 2010(Jan./March)
Year
Perc
ent
The Great Recession of 2008-2009 has markedly reduced employment opportunities for
all working age adults (16+), but the magnitude of these declines have varied widely across
major age groups, with teens (16-19) and young adults being the most adversely affected. The
employment rate for all U.S. working-age adults (16+) declined by 4.2 percentage points from
62.8% in November-December 2007 to 58.6% in February-March of 2010 (Table 1). In contrast,
the teen employment rate fell by 8 percentage points to 26.4% in February-March 2010. The
decline in the teen employment rate was twice as high as that for all working-age adults over this
time period. Young adults (20-24) also experienced a very sharp decline (-7.8 percentage points)
in their employment rate, with young adult males also facing record post-WWII lows in their
employment rates. The percentage point sizes of these declines in employment rates fell steadily
with the age of the adults, falling to -4 percentage points for those 45-54 years of age and to
under 2 percentage points for those 55-64 while the E/P ratio for those 65+ increased very
modestly by .2 percentage points.
3

Table 1: Trends in the E/P Ratios of Key Age Subgroups of U.S. Workers from
November-December 2007 to February-March 2010 (Seasonally Adjusted in %)
Age Group
(A)
November – December 2007
(B)
February – March 2010
(C)
Percentage Point Change
All 16+ 62.8 58.6 -4.2 16 – 19 34.4 26.4 -8.0 20 – 24 67.8 60.0 -7.8 25 – 34 79.0 74.0 -5.0 35 – 44 80.8 76.2 -4.6 45 – 54 79.3 75.2 -4.1 55 – 64 62.3 60.5 -1.8 65+ 15.9 16.1 +.2
Source: U.S. Bureau of Labor Statistics, “Monthly CPS Labor Statistics,” web site. The Changing Labor Market Fortunes of Key Demographic and Socioeconomic Groups of Teens
Overall, the teen population has fared very poorly in the labor market over the past
decade. To identify the fate of key demographic and socioeconomic groups of teens, we
examined changes in employment rates over the past decade (2000-2010 I) for gender, race-
ethnic, and combined gender-race groups of teens. Findings in Table 2 clearly reveal that each
gender and major race-ethnic group experienced extraordinarily large drops in their employment
rates over the past decade. Every gender and race-ethnic group encountered double-digit
percentage point declines in their employment rates over this time period, with the relative size
of these declines in employment rates being higher for men than for women (-45% versus -39%)
and for Black (-48%) than for either Hispanics (-42%) or Whites (-41%).
4

Table 2: Trends in the Employment/Population Ratios of U.S. Teens in Gender and Selected Race-Ethnic Groups from 2000 to 2010 I
Group
(A)
2000
(B)
2010 I
(C)
Percentage Point Change
(D)
Percent Change
All 45.2 26.2 -19.0 -42% Men 45.4 25.1 -20.4 -45% Women 44.7 27.4 -17.3 -39% Black 29.8 15.4 -14.4 -48% Hispanic(1) 38.6 22.2 -16.4 -45% White 49.1 29.1 -20.0 -41%
Note: The employment data for Hispanic teens in 2010 I were seasonally adjusted at the same rate as all teens.
The past few decades have seen a major shift in gender disparities in teen employment
rates. By 2000, due to a more rapidly rising teen employment rate for teen women, there was
near gender equality in teen employment rates (45.5% for men and 44.7% for women). By 2001,
teen women surpassed teen males in their employment rate for the first time (42.5% vs. 42.2%),
and they have achieved higher employment rates every year since. In the first quarter of 2010,
the teen employment rate for teenaged girls was 2.3 percentage points higher than that of boys
(27.4% vs. 25.1%). Among both Black and White teens, women were more likely to be
employed than male teens in the first quarter of 2010. Only 1 of every 7 Black male teens held
any type of job in the January-March period of 2010, less than half their rate of employment in
the first quarter of 2000. Among low income Black males, fewer than 1-10 were working in the
first quarter of this year. The employment rate of Black male teens in the first quarter of 2010
was less than half as high as that of White females. The widespread joblessness in inner city
Black neighborhoods among teens and young adults is contributing to the growing violence
among teens and teen gangs in our cities. The recent murderous sprees in Chicago, Washington,
D.C., and New Haven, Connecticut are prime examples of this growing inner city violence.6
6 See: (i) Chicago Breaking News, “A Bloody 12 Hours in Chicago; 7 Dead, 18 Wounded,” April 16, 2010; (ii) Peter Applebone, “In the Shadow of Yale, A World A Million Miles Away,” The New York Times, April 15, 2010.
5

Chart 2: 2010 I Employment/Population Ratios of Teens in Gender and Selected
Gender/Race-Ethnic Groups, Seasonally Adjusted in %
25.1
27.4
14.516.3
27.6
30.6
0
5
10
15
20
25
30
35
Males Females Black Men Black Women White Men White Women
Group of Teens
Perc
ent
Teen employment patterns also are strongly linked to their family living arrangements
and the incomes of their families. Those teens living in married couple families where both
mother and father are employed are the most likely to work while those living in single parent
families where the head did not work are typically the least likely to work. Parents serve as both
role models for their children and often as brokers into their paid employment positions.
The ability of the nation’s teens to secure any type of employment in 2009 also was
strongly associated with their family’s income level. The more affluent the teen’s family as
measured by its annual income, the greater the likelihood that he/she was employed until family
incomes over $100,000 were reached (Chart 3). Among those teens living in the lowest income
families (under $20,000), only 22 of every 100 were employed during an average month in 2009.
The employment rate of teens increased to 26% for those residing in families with incomes
between $20,000 and $40,000, to 30% for those with annual incomes between $40,000 and
$60,000, and to a high of 36.4% for those with family incomes between $75,000 and $100,000
6

(Chart 3).7 Very similar relationships between teen E/P rates and family incomes prevailed in
most states as well during that year.
Chart 3:
2009 Employment Rates of U.S. Teens by Family Income (Annual Averages in %)
22.3
25.9
30.0
33.4
36.4
32.7
20
22
24
26
28
30
32
34
36
38
<20 20-40 40-60 60-75 75-100 100+
Family Income (in $1,000)
Perc
ent
Low income youth fare much better in the labor market when the national economy is
strong or when they live in a state with above average teen employment rates. For example, in
the national, full employment labor market environment of 2000, nearly 38 of every 100
teenagers with family incomes under $20,000 worked on average during the year. By 2009, in a
very slack labor market, only 22 of every low income teens were employed, a relative decline of
about 42% in their employment rate over this nine year period.
In 2009, the employment rates of low income teens varied widely across individual states
and were strongly correlated with the overall incidence of teen employment. Their employment
rates ranged from lows of 10-13 percent in Arizona, Indiana and New Jersey to highs of 48-49%
in Nebraska and Utah. Those low income youth living in states with the six highest employment
rates for teens in 2009 were characterized by an average employment rate of 40% (Table 3). 7 A similar finding for 2008 revealed that E/P rates of teens rose steadily with family income until those with incomes over $125,000 were reached
7

Among those low income youth residing in the six states with the lowest teen employment rates
in 2009, including California, New Jersey, and New York, the employment rate of low income
teens averaged only 16.5%, barely 40% as high as the employment rate of low income teens in
the states with the most favorable labor market conditions for teens.
Table 3:
The 2009 E/P Ratios of Low Income Teens in the Six States with the Highest and Lowest Employment Rates for All Teens (16-19 Years Old) in 2009
Top Six States
E/P Ratio for Low
Income Youth
Bottom Six States
E/P Ratio for Low
Income Youth
Wyoming 41.3 New Jersey 10.3 Wisconsin 28.3 New York 13.3 North Dakota 42.8 Georgia 20.9 Iowa 41.5 California 19.7 South Dakota 40.0 Mississippi 16.2 Nebraska 47.6 District of Columbia 18.7
Average Top Six States 40.2 Average Bottom Six States 16.5 Source: 2009 Monthly CPS surveys, public use files, tabulations by authors.
The absence of work for low income teens has been found by past research to be
associated with greater difficulties in transitioning to the labor market upon high school
graduation, higher school dropout rates among Black and Hispanic males, higher teen pregnancy
rates, and increased involvement with the criminal justice system.8
The Underutilized Labor Pool Among The Nation’s Teens and Its Personal Economic and Social Costs
The steep declines in employment among the nation’s teens over the past decade might
have been expected to increase most teen labor market problems, including unemployment, both
open and hidden, and underemployment. Yet, some media reports since 2002 have argued that
the decline in teen employment, especially during the summer months, was primarily attributable
to a lack of interest in employment among teens. Some stories referred to jobless teens as “mall 8 See: (i) Andrew Sum, Neeta Fogg, and Garth Mangum, Confronting the Youth Demographic Challenge: The Labor Market Problems of At-Risk Youth, Sar Levitan Center for Social Policy, Johns Hopkins University, Baltimore, 2000, (ii) Marta Tienda and Avner Ahituv, “Ethnic Differences in School Departure: Does Youth Employment Promote or Undermine Educational Attainment?”, in Of Heart and Mind, (Editors: Garth Mangum and Stephen Mangum), W.E. Upjohn Institute for Employment Research, Kalamazoo, 1996, pp. 93-110.
8

rats” interested in shopping and hanging out at the mall while others, including a Washington
Post reporter, reported teens to be “working on nothing but their tans”.
While some teens clearly have no serious interest in working, our analyses of available
data on unemployed and underemployed teens and those who wanted jobs but gave up looking
for work revealed a very large number of teens who were unutilized or underutilized but desired
work.9 During the summer of 2009 (June-August), we estimated nearly 3.3 million teens who
were members of the underutilized labor pool.
Estimates of the pool of underutilized teen labor in the fourth quarter of 2009 are
displayed in Chart 4 and Table 4. During the quarter, there were 5.9 million teens who were
members of the official civilian labor force of whom 1.505 million or 25.5% were unemployed.
The open unemployment rate of the nation’s teens during this time period was more than three
times as high as that of the nation’s adults (25 and older), while the Black teen unemployment
rate hovered in the 45 to 50 percent range.10
9 See: Andrew Sum, Ishwar Khatiwada, Joseph McLaughlin, and Allison Beard, “Historically Low Teen Employment,” Challenge, January-February 2010, pp. 87-108 10 The seasonally adjusted unemployment rate for adults 25 and older in the fourth quarter of 2009 was equal to 8.5% versus 27.2% for teens.
9

Chart 4: Estimating the Pool of Underutilized Teen Labor (16-19 Years Old) in
the U.S. in the Fourth Quarter of 2009
Employed
4.405 million
Unemployed 1.505 million
Out of Labor Force
11.078 million
Part-Time for Economic Reasons
412,000
Wants Job Now
892,000
Underutilized Labor Pool 2,809,000
Civilian Noninstitutional
Population 16-19 Years Old
The labor market problems of the nation’s teens go well beyond the official
unemployment statistics, which themselves have been found to be downward biased estimates of
the true unemployment situation among teens given proxy respondents in the monthly CPS
household survey.11 Those teens who were not actively participating in the labor force at the
time of the CPS survey were asked whether they wanted a job now. Of the 11.078 million teens
11 In the CPS survey, the mothers of the teens or other adult members in the household often provide the information on the labor force behavior of the teens living in the household. Previous research over the past few decades, including that conducted under the national Youth Opportunity Grant demonstration (YOG) has shown that direct interviews with the youth themselves yield higher estimates of unemployment as well as slightly higher estimates of employment. See: Richard B. Freeman and James Medoff, “Why Does the Rate of Youth Labor Force Activity Differ Across Surveys?,” in the Youth Labor Market Problem: Its Nature, Causes, and Consequences, University of Chicago Press and National Bureau of Economic Research, 1982.
10

not active in the labor force in the fourth quarter of 2009, nearly 900,000 wanted a job at the time
of the survey (Table 5). This group will be referred to as the labor force reserve or the “hidden
unemployed.” Of all age groups, teens are characterized by the highest incidence of these hidden
unemployment problems.
Table 4:
The Underutilized Labor Pool and the Underutilization Rate Among Teens in the U.S., 2009 IV (Not Seasonally Adjusted)
Variable Value
Civilian Labor Force 5.910 million Unemployed 1.505 million Unemployment Rate 25.5% Employed Part-Time for Economic Reasons .412 million Labor Force Reserve (hidden unemployed) .892 million Adjusted Civilian Labor Force 6.802 million Underutilized Labor Force 2.809 million Underutilization Rate 41.3%
The third group of underutilized teens are the so-called underemployed; i.e., those
persons who are working part-time but desire full time jobs. Of the 4.405 million employed teens
in the fourth quarter, 412,000 reported themselves as being underemployed. The underemployed
typically work 18 to 20 fewer hours per week than their full-time employed counterparts and
earn lower hourly wages. They are also less likely to receive key employee benefits and to be
trained by their employers, and they receive a significantly lower return on their work experience
in the form of higher wages on future jobs.12
The combined number of underutilized teens in the fourth quarter of 2009 was 2.809
million (Table 5). Adding the members of the labor force reserve to the official civilian labor
force yields an adjusted labor force for teens of 6.802 million. The value of the teen
underutilization rate is obtained by dividing the number of underutilized teens (2.809 million) by
the adjusted civilian labor force (6.802 million). The underutilization rate for teens was, thus,
equal to 41.3% in the fourth quarter of 2009. This underutilization rate was nearly two and one
12 For a more detailed overview of the nature of underemployment problems in the U.S., See: Andrew Sum, Ishwar Khatiwada, et. al., The Underemployed in U.S. Labor Markets: Their Size, Demographic, Socioeconomic, and Occupational Characteristics and Their Employment and Earnings, Center for Labor Market Studies, Northeastern University, 2010.
11

half times as high as the underutilization rate for the nation’s adult workers (20+) over the same
time period.
Given substantial variations in teen employment rates across states in recent years, it
should come as no surprise to discover that underutilization problems of teens also vary quite
widely across states. In the fourth quarter of 2009, there were nine states that had
underutilization rates under 30%. At the same time, however, there were nine states that had
estimated underutilization rates of 50% or higher including two states (South Carolina and
Mississippi) with rates between 56 and 57 percent and the District of Columbia with a teen
underutilization rate of just under 70%. The “quiet riots” referred to by then Senator Obama in
his 2007 address at Hampton University have been taking place in a number of cities and D.C. in
recent months.13
Table 5:
States With Estimated Teen Labor Underutilization Rates Over 50% in 2009 IV
State
Labor Underutilization
Rate (in %)
Hawaii 50.7 Oregon 52.4 Washington 52.9 California 53.2 Arizona 54.0 Nevada 54.3 South Carolina 56.0 Mississippi 56.6 District of Columbia 69.6
While teen underutilization rates have always been higher than those of older workers,
the incidence of these labor market problems have increased substantially over the decade
particularly since the labor market recession of 2008-2009 (Chart 5). In the fourth quarter of
2007, the teen underutilization rate was 23%. It had risen to close to 35% by the fourth quarter of
2008 and above 41% in the final quarter of 2009.
13 See: Senator Barack Obama, “Presentation at Hampton University,” June 2007.
12
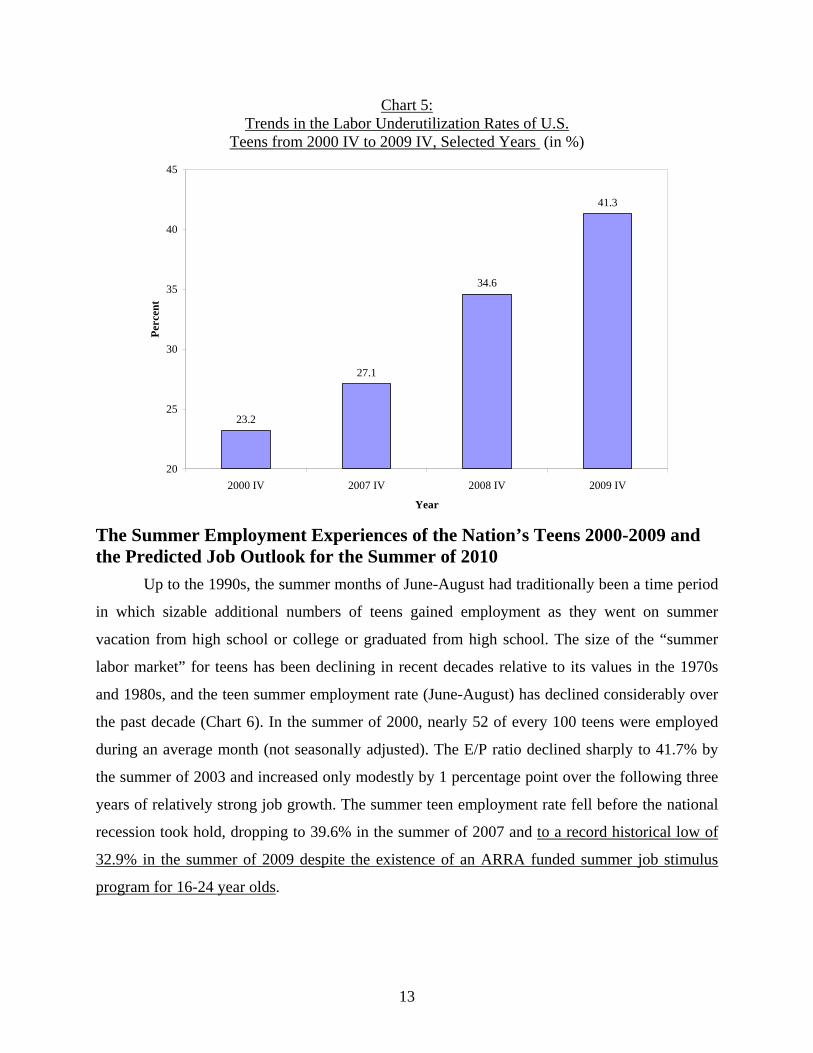
Chart 5: Trends in the Labor Underutilization Rates of U.S.
Teens from 2000 IV to 2009 IV, Selected Years (in %)
23.2
27.1
34.6
41.3
20
25
30
35
40
45
2000 IV 2007 IV 2008 IV 2009 IV
Year
Perc
ent
The Summer Employment Experiences of the Nation’s Teens 2000-2009 and the Predicted Job Outlook for the Summer of 2010
Up to the 1990s, the summer months of June-August had traditionally been a time period
in which sizable additional numbers of teens gained employment as they went on summer
vacation from high school or college or graduated from high school. The size of the “summer
labor market” for teens has been declining in recent decades relative to its values in the 1970s
and 1980s, and the teen summer employment rate (June-August) has declined considerably over
the past decade (Chart 6). In the summer of 2000, nearly 52 of every 100 teens were employed
during an average month (not seasonally adjusted). The E/P ratio declined sharply to 41.7% by
the summer of 2003 and increased only modestly by 1 percentage point over the following three
years of relatively strong job growth. The summer teen employment rate fell before the national
recession took hold, dropping to 39.6% in the summer of 2007 and to a record historical low of
32.9% in the summer of 2009 despite the existence of an ARRA funded summer job stimulus
program for 16-24 year olds.
13

Chart 6: Trends in the Summer Employment Rates of U.S. Teens from 2000 to 2009
(Not Seasonally Adjusted in %)
51.7
48.0
41.7 41.6 42.639.6
32.9
0
10
20
30
40
50
60
2000 2001 2003 2004 2006 2007 2009
Year
Perc
ent
The loss in summer job opportunities for the nation’s teens over the past 9 years has been
extraordinarily large (Table 6). The summer 2009 E/P ratio for teens (16-19) was nearly 19 full
percentage points below its value in 2000. If the summer 2000 teen employment rate had been
maintained in 2009, than the average monthly number of employed teens in the June-August
period would have been 8,811,000 rather than the much smaller 5,614,000 who were actually
employed. This represents a summer employment gap of nearly 3.2 million teens this past
summer.
Table 6:
Comparisons of the Actual Number of Employed Teens (16-19 Years Old) in the Summer of 2009 with the Number that Would
Have Been Employed if the Summer 2000 E/P Rate for Teens Had Prevailed
Variable Value
Actual Teen employment in Summer 2009 5,614,000 Hypothetical Summer 2009 Employment Rate 51.7% Population of Teens in Summer 2009 17,042,600 Hypothetical Summer Employment in 2009 8,811,000 Increase in Summer Teen Employment 3,197,000
14

Teen summer employment rates in the U.S. clearly have diminished to a considerable
degree over the past decade. While teen summer employment rates have declined in all states,
there were very large differences in summer teen employment rates across states in the summer
of 2009. The ten states with the highest teen employment rates (June-August 2009) had
employment rates ranging from 48% in New Hampshire to 62% in South Dakota, with an
average of just under 54%. In the ten bottom ranked states, the E/P ratios ranged from 18% in
D.C. to just under 30% in South Carolina, with an average of just under 25%. Thus, in the
summer of 2009, teens in the highest ten states were more than twice as likely to work as those in
the bottom ten ranked states (54% vs. 25%).
Table 7:
Ten States with the Highest and Lowest Teen Employment Rates in the Summer of 2009
Top Ten Bottom Ten
State E/P State E/P
South Dakota 62.5 South Carolina 29.7 North Dakota 59.0 West Virginia 29.6 Nebraska 56.9 New Jersey 27.4 Iowa 56.3 New York 27.1 Wyoming 54.9 Mississippi 25.1 Maine 51.9 Louisiana 24.2 Wisconsin 51.3 California 23.2 Minnesota 49.8 Nevada 22.7 Kansas 48.6 Georgia 22.3 New Hampshire 48.1 District of Columbia 18.8
Average 53.9 Average 24.9
How are the nation’s teens likely to fare this summer in the job market? Given the very
steep drops in their employment rates over the decade and the extreme weakness of the teen
employment situation during the first three months of this year, the summer job outlook does not
appear to be very bright in the absence of a massive new summer jobs intervention.
Several years ago, the Center for Labor Market Studies developed a simple regression
model based on national time series employment data back to 1969 for projecting the summer
employment rate for the nation’s teens. The summer projected employment rate was based on
15

their observed employment behavior during the first four months of each calendar year.14 For the
years from 2004 to 2006, the predicted summer employment rates for teens were very close to
their actual rates with no gap whatsoever between the actual and predicted rates of teen
employment in the summer of 2005 and only a .6 percentage point gap for 2006. In the three
most recent summers (2007 to 2009), the model generated predictions that were somewhat too
optimistic, yielding projections of teen summer employment rates that exceeded the estimated
actual rates of summer teen employment by 1.7 to 3.6 percentage points. The continued
deteriorations in overall employment in the late spring of 2008 and 2009 was a likely key factor
underlying our too optimistic employment projections for those two years. The 2009 projection
was too high despite the existence of a small scale job creation program for 14-24 year olds that
supposedly put 320,000 youth to work at some point during the summer
Table 8:
Comparisons of the Predicted and Actual Teen Summer Employment Rates from 2005 to 2009 and the Predicted Teen Summer Employment Rate for 2010
(June-August Averages, in %, Seasonally Adjusted)
Summer of Year
(A)
Predicted Rate
(B)
Actual Rate
(C)
Gap (Actual – Predicted)
2005 36.7% 36.7% 0 2006 37.6% 37.0% -.6 percentage points 2007 36.5% 34.5% -2.0 percentage points 2008 34.2% 32.5% -1.7 percentage points 2009 31.1% 28.5 -2.6 percentage points 2010 27.4%
Note: The fitted regression model for predicting the seasonally adjusted teen summer employment rate was the following:
EMPi,, t = 43.8 + .93 (EMPj, t – 43.8)
Where EMP i, t = Predicted seasonally adjusted summer teen employment rate in year t. EMP j, t = Estimated teen employment rate in the first four months of year t.
14 For a review of the features of this summer teen employment rate forecasting model and the findings of its forecasts in recent years, See: Andrew Sum, Ishwar Khatiwada, and Joseph McLaughlin, The Collapse in the Nation’s Teen Labor Market and the Case for A National Youth Jobs Creation Program, Prepared for the U.S. Congress, House of Representatives, Committee on Education and Labor, Washington, D.C., April 2008.
16

During the first three months of this year (2010), teen employment rates fell substantially
below (nearly 4 percentage points lower) those of the preceding calendar year (Table 9). This
finding by itself would be expected to yield a new, historically low employment rate for the
nation’s teens this summer (2010). Our forecasting model yields a projected seasonally adjusted
employment rate of only 27.4% for teen employment this summer (Table 8). This projected rate
of teen employment would represent a new post-World War II low, 17.6 percentage points below
its rate in the summer of 2000 and nearly 21 percentage points below its cyclical peak in the
summer of 1989. The teen summer job outlook for 2010 is thus extremely pessimistic. Funding
of a new larger, national teen jobs creation program for the summer of 2010 could offset a small
portion of this deep jobs deficit.
Table 9:
Comparisons of the Teen Employment Rate from January – March 2009 to January – March 2010
( Seasonally Adjusted in %)
Month
(A)
2009
(B)
2010
(C)
Percentage Point Difference
January 30.4 25.9 -4.5 February 30.3 26.3 -4.0 March 29.7 26.5 -3.2
3 Month Average 30.1 26.2 -3.9
The Job Creation Impacts of a Modest Summer Jobs Program for the Nation’s Teens
The deep deterioration in youth labor market conditions over the past nine years has led
to a variety of proposals to create both summer and year-round job opportunities for teens. No
actions were taken by the federal government to do so until 2009 when the U.S. Congress
allocated $1.2 billion of American Recovery and Reinvestment Act monies to the Workforce
Investment Act system to put low income 14-24 year olds to work in the summer of 2009 and in
the following year.15 Approximately 313,000 teens and young adults from ages 14-24 were put
15 For a review of the likely job creation impacts of last summer’s teen job creation program under the ARRA legislation,
17

to work for a part of last summer. The U.S. Congress has been debating a number of proposals to
provide monies for a summer jobs program, with a recent U.S. House proposal that would
provide up to $600 million to create jobs this summer.16 In this section, we will provide a
simulation of the number of summer jobs for teens and young adults that could be created with a
$600 million allocation.
Our estimation procedure starts with the assumption that the U.S. Congress will
ultimately authorize sufficient monies to create 320,000 summer jobs for 14-24 year old WIA
eligible youth.
Table 10: Estimating the Potential Impacts a New WIA Youth Jobs Creation Program that Created 320,000 Summer Jobs for 14-24 Year Olds During the Summer of 2010
Variable
Assumed Value
Total gross youth jobs created (all ages) 320,000
* % of summer jobs that go to 16-19 year olds .70
* net teen jobs created per summer teen job slot .90
* Average number of paid weeks during the summer 6.5 weeks
Net summer jobs created for 16-19 year olds by WIA programs 201,600
Impact on the summer teen employment over the June-August 2010 period
201,600 * 5 = 100,800
Impact on teen employment rate in summer 100,800 17,000,000
= .6%
Impact on teen employment rate during all of 2010 = .6% * ¼ = .15% = ~.1
percentage point
Not all of these potential 320,000 summer jobs will be provided to 16-19 year olds. Very
young teens (14-15) and young adults (20-24) are eligible for participation in WIA job creation
programs. We have assumed, perhaps optimistically, that 70% of the participants in WIA
See: Andrew Sum and Joseph McLaughlin with Ishwar Khatiwada and Sheila Palma, The Depression in the Nation’s Teen Labor Market… 16 In her March 3, 2010 presentation on the Youth Summer Jobs Amendment, Senator Murray (Dem: Washington) proposed a $1.5 billion summer jobs program that she claimed would help 500,000 youth to work this summer.
18

summer jobs programs will be 16-19 years old.17 The labor force behavior of youth ages 14-15 is
not collected as part of the monthly CPS household survey; thus, their involvement in the
summer jobs program will not have any positive effect on measured national employment. Not
all of the jobs created for youth under the summer jobs program will represent a net gain in
employment of teens. Some of the youth obtaining a WIA-funded summer job would have been
able to find unsubsidized employment on their own in the absence of the summer jobs program.
As a result, not all of the jobs directly created by the WIA summer jobs program will be net new
jobs. Past national research on the net employment impacts of youth job creation programs,
including previous summer jobs programs for economically disadvantaged teens, indicates that
each 100 jobs created a net impact of between 67 to 75 jobs for all teens.18 Given the much
greater slack in youth labor markets this year in comparison to much of the decade of the late
1970s when these net impact estimates were derived, we have assumed a higher net job creation
impact for this year’s youth summer jobs programs. A net job creation ratio of 90 per 100
summer jobs was assumed. Finally, the impact of the summer youth jobs program on overall job
opportunities for teens during the summer months and the year as a whole will be dependent on
the number of weeks that these jobs are held. We estimate that the average summer job will last
only 6 to 7 weeks while the “summer” consists of the 13 week period from June 1 to August 31.
The overall gross summer jobs impact will, thus, be only one half of the gross jobs impacts.19
The net additional number of summer jobs for 16-19 year olds this summer can be
computed by multiplying the initial 320,000 jobs figure by .90 * .70, yielding a net summer jobs
figure of 201,600. This number of net new jobs would be available for only one-half of the
summer, thereby creating 100,800 summer long jobs.
If we compare these 100,800 net new jobs for the nation’s 16-19 year olds to the size of
the nation’s 17 million teens in the civilian noninstitutional population, then we find that the 17 Data provided by two New England states revealed that up to 35% of the summer program participants were 14-15 or older than 20. 18 For a review of the net job creation effects of past youth job creation programs and their economic and social benefits, See: (i) Timothy Bartik, “Why We Need to Subsidize Jobs,” Challenge: The Magazine of Economic Affairs, May-June 2002, pp. 100-111; (ii) Andrew Sum, Garth Mangum, and Robert Taggart, “The Case for A Young Adult Jobs Creation Program,” Indicators: The Journal of Social Health, Winter 2002-03, pp. 50-84. 19 The national CPS household survey collects information on the labor force status of respondents during the calendar week containing the 12th day of the month. Since the vast majority of summer job holders should be employed during the July and August periods containing the 12th day of the month, the relevant adjustment factor could be as high as .65 but the true effect would be closer to .50.
19

summer jobs program would raise the summer (June-August) 2010 employment rate by about
.6%. For the year as a whole, the teen E/P rate would rise by .15% or only .1 to .2 percentage
points after rounding. The actual gap in teen employment rates between 2000 and 2010 will
likely be in the 21-22 percentage point range. Thus, a summer program creating 320,000 job
slots will erase only a small fraction (1 in 200) of the existing jobs deficit.
Where Do We Go From Here?
The achievement of a national goal of restoring aggregate teen employment opportunities
back to their 2000 levels will require massive increases in teen jobs from every key job sector:
the private for profit sector, the nonprofit sector, and the public sector. Youth also have been
confined to a smaller number of industrial sectors and occupational areas. The experience of the
past decade has clearly shown that macroeconomic growth by itself cannot be relied upon to
markedly improve teen employment prospects. Major new national, state, and local employment
initiatives will be needed, including substantially expanded youth internships in the private for
profit sector, cooperative education slots in high schools and community colleges, school-to-
work transition programs, private sector wage subsidies, and increased publicly funded job
creation programs that would go well beyond the proposed $600 million in ARRA stimulus
monies for teen summer jobs. In addition, a far more substantial number of year-round teen jobs
will be needed to bolster the future employability and earnings of teens. Summer interventions
by themselves have no long run impact on future employability. They must be integrated with
year round employment efforts. The dramatic, historic collapse in teen labor markets needs to be
openly and systematically addressed by the U.S. Congress, the Obama Administration, the
nation’s governors, its local elected officials, WIA workforce development agencies, and
educational agencies across the entire nation. The economic future of these young adults and our
nation is at stake.
20


![Book - Dire Straits - Dire Straits [Pvc 74p]](https://img.pdfslide.us/doc/110x75/563db8e4550346aa9a97f371/book-dire-straits-dire-straits-pvc-74p.jpg)