Embed Size (px)
Citation preview

Dimiter Gantchev,Deputy Director, Culture an Creative Industries Sector, WIPO
An Intellectual property Based Approach to Surveying the Economic Contribution of the Creative Sector: A Perspective from the World Intellectual Property Organization
Medellin, Colombia 6 March 2013

Overview
Conceptual frameworkCopyright, creativity and developmentEconomic fundamentals of copyright
The empirical evidenceUnderlying premisesDirect relationships and industry analysis
Challenges
D. Gantchev

Creative Industries on the Policy Agenda
Growing interest by policy makers, industry, civil societyCreativity as a resource and growth factorPolicy demand to
quantify the intangible economyidentify the role of creativity in knowledge societylink creativity to development objectives
Creative industries as a positive agenda
D. Gantchev

Intellectual Property and Creativity
IP is one of the tools to promote creativity IP is a new conceptual framework which allows to:
transform creative outputs into economic goodsmonitor the supply and demandobtain evidence on impact
IP is perceived today as an indicator of development
Mr. D. Gantchev-WIPO

A Copyright Approach To Creative Industries
Creativity is the subject matter of copyright protection, but poses definitional problems as suchCopyright is a well defined concept
a set of rights given to authors to control the use of their worksa financial mechanism to reward creators a basis for the operation of huge industries
Mr. D. Gantchev-WIPO

Economic Fundamentals Of Copyright
Economic characteristicsEconomic consequencesConditions for economic efficiencyEconomic function
An enabler A market frameworkA measurement tool
Social Functionbalance and access
Cultural functionContribute to cultural diversity and supply of content
Mr. D. Gantchev - WIPO 6.

Source:Daryl Mann, Beijing,Sept 2010

Source: Daryl Man, Beijing, Sept.2010

Working on the Evidence - Major Features of the WIPO Model
Methodology applied consistently since 2003 in over 40 countries with the support of interested partnersCopyright - drivenPolicy - orientedProvides measures of sizeInternationally comparableBased on official dataProduction-based

Typical Uses
Generalraise awarenessproject copyright as a growth factorproject a positive image of the country
Specificquantify the measurable characteristics of industries based on copyrightevaluate and compare size, performance and competitiveness monitor trends and provide policy options, program development and practical measuresassess the impact of policy or economic measures – FTAs, accessions, legislative amendments

Creation
Formatting
Production
Production of equipment
Distribution
Distribution materials
Marketing and promotion
Consumption and use of the work
Production of equipment for the consumption
Identifying the Creative industries
Mr. D. Gantchev - WIPO 11.

Measurement Indicators
Indicators of sizeValue addedEmploymentForeign trade
Dynamic indicators ProductivityMultipliers Contribution to real GDP growth
Constant search for new ones
Mr. D. Gantchev-WIPO

0%
1%
2%
3%
4%
5%
6%
7%
8%
9%
10%
11%
% Share of GDP
% Share of Employment
Measuring the Size of Copyright Industries

0.00%
2.00%
4.00%
6.00%
8.00%
10.00%
12.00%
GDP contribution

0.00%
2.00%
4.00%
6.00%
8.00%
10.00%
12.00%
Employment contribution

0.00%
2.00%
4.00%
6.00%
8.00%
10.00%
12.00%
0.00% 2.00% 4.00% 6.00% 8.00% 10.00% 12.00%
High Share of GDP,Low Share of Empl.
High Share of GDP,High Share of Empl.
Low Share of GDP,Low Share of Empl.
Low Share of GDP,High Share of Empl.
Q4 Q1
Q3 Q2
% Empl
% GDP
Country Positioning based on %GDP and % Employment

0 50 100 150 200
MEXICOPHILIPPINES
BRUNEIBHUTAN
COLOMBIAPERU
NETHERLANDSDOMINICASLOVENIAMALAYSIATANZANIA
AUSTRALIARUSSIA
JORDANLATVIA
CROATIABULGARIA
FINLANDTRINIDAD AND TOBAGO
CANADACHINA
SINGAPORESOUTH AFRICA
HUNGARYLEBANON
LITHUANIAST VINCENT
PAKISTANGRENADAROMANIA
USAUKRAINE
THAILANDKOREA
JAMAICAKENYA
ST LUCIAPANAMA
ST KITTS/NEVIS
Labor Productivity High
Labor Productivity Low
Labo
r Pro
ducti
vity
Med
ium
Creative Industries Labor Productivity Index

R2 = 0.31
Relationships to Economic Indicators GDP per Capita
Source: The World Bank Development Indicators

Relationships to Economic Indicators International Property Rights Index
R2 = 0.39
Source: WIPO and Property Rights Alliance

Relationships to Economic Indicators Index of Economic Freedom
R2 = 0.31
Source: The Heritage Foundation
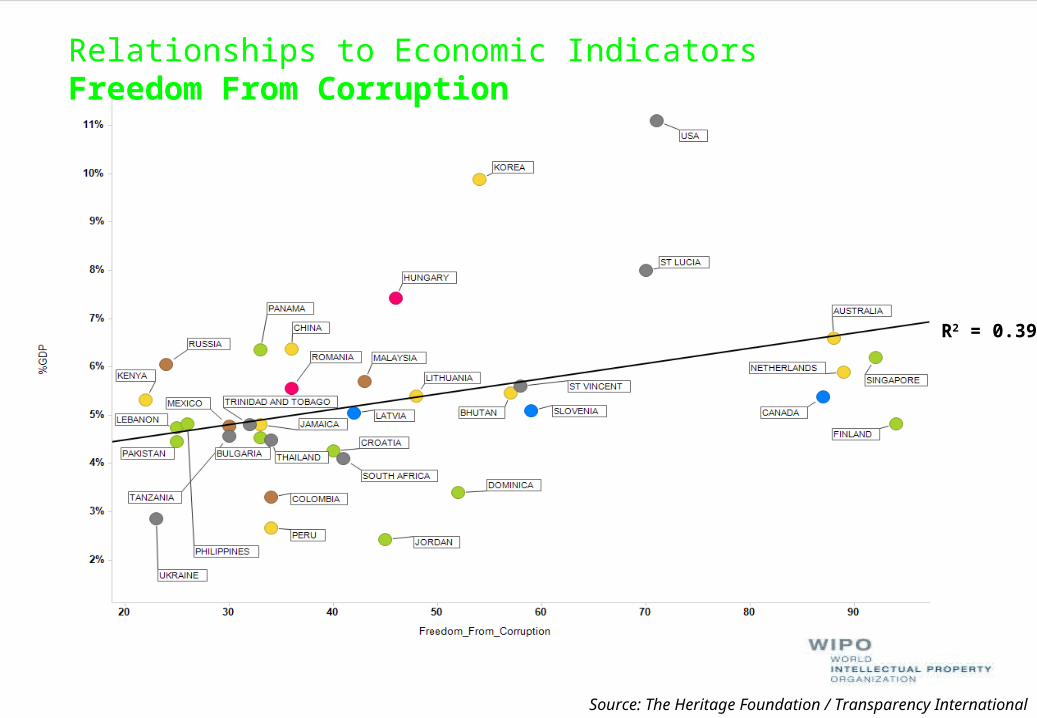
Source: The Heritage Foundation / Transparency International
Relationships to Economic Indicators Freedom From Corruption
R2 = 0.39

Relationships to Economic Indicators Global Competitiveness Index GCI (2012)
R2 = 0.23
Source: The World Economic Forum (WEF)
R2 = 0.44

23
Relationships to Economic Indicators Global Innovation Index (2012)
R2=0.49
Source: INSEAD eLab

Summary of correlations
Source: WIPO

Creative Industries' Share of Employment
52.4%
16.6%
14.6%
16.2%
Creative Industries' Share of GDP
54.4%
18.2%
10.3%
17.2%
54%
17%
15%
14%
Core Interdependent Partial Non-dedecated
Contribution of copyright industries to GDP and to Employment

0%
20%
40%
60%
80%
100%
Press and Literature
Music, Theatrical Productions, Operas
Motion picture and video
Radio and Television
Photography
Software and Databases
Visual and Graphic Arts
Advertising Agencies and Services
Copyright Collecting Societies
GDP in the Core Copyright Industries
1.00%9.25%2.37%
22.42%
2.40%
14.75%4.22% 5.42%
38.61%

Employment in the Core Copyright Industries
0%
20%
40%
60%
80%
100%
Press and Literature
Music, Theatrical Productions, Operas
Motion picture and video
Radio and Television
Photography
Software and Databases
Visual and Graphic Arts
Advertising Agencies and Services
Copyright Collecting Societies
43.42%
8.84%5.77%7.04%
2.33%
19.71%
4.85%7.23% 1.56%

28
Creative Diversity
0%
10%
20%
30%
40%
50%
60%
70%
80%
90%
100%
0%
20%
40%
60%
80%
100%
Press and Literature
Music, Theatrical Productions, Operas
Motion picture and video
Radio and Television
Photography
Software and Databases
Visual and Graphic Arts
Advertising Agencies and Services
Copyright Collecting Societies

29
Copyright Industries Compared with Other Key Industries in Selected Countries
5.3%
4.7%
2.9%
4.8%
5.5%
4.1%
5.5%
6.4%
5.1%
0% 10% 20% 30% 40% 50% 60% 70% 80% 90% 100%
Kenya
Croatia
Ukraine
Jamaica
Bulgaria
South Africa
Bhutan
China
Slovenia COPYRIGHT
Agriculture
Education
Health & Social Work
Fishing
Manifacturing
Construction
Electrical & Water
Finance, Real Estate &Business ServicesMining and Quarrying
Transport & Communication
Hotels & Restaurants
Wholesale & Retail Sales
Financial Services
Other

Creative Industries in the Development Context
6.32%
5.14%5.04%
6.62%
5.28% 5.29%
0.00%
1.00%
2.00%
3.00%
4.00%
5.00%
6.00%
7.00%
Developed Transition Developing
Employment Avg. 5.49%
GDP Average 5.26%

Core and Non-Core Creative Industries Contribution in the Development Context
Core Creative Industries Non-Core Creative Industries
2.17% 2.19%
2.54%2.40%
2.02%
2.88%
0.00%
0.50%
1.00%
1.50%
2.00%
2.50%
3.00%
3.50%
Developed Transition Developing
4.15%
2.93%
2.51%
4.25%
3.26%
2.40%
0.00%
0.50%
1.00%
1.50%
2.00%
2.50%
3.00%
3.50%
4.00%
4.50%
Developed Transition Developing

Findings
An overall significant contributionDrivers – publishing, R/TV, software, music, advertizing, filmImpressive dynamicsWell interconnected with other industries Higher capital and labour productivityOutput and employment multipliers
Mr. D. Gantchev-WIPO

Problem areas
Getting informationAnalyzing informationTaking further action I/O tablesExport statisticsRoyaltiesInvolving the industries in the analysisCrosschecking informationParallel studies (EU, UK,UNCTAD…)

Creative Industries in the recessionThe US IP industries – engines of growth
27,7% of US jobs, 34,8% of GDP in 2010growing faster then the rest of the economy 1,6% to 1% (copyright 2,4%, patents 2,3%, trademarks 1,1%)wages were 42% higher than other industries
WIPO statistics points to increased use of the IP system in 2011patent filings - 7,8% growth trademark applications - 13,3% growthInternation registration of designs – 16 % increase global copyright Industries – 5,26% of GDP and 5,49% of employment PCT
CISAC – 1% growth in total worldwide collections (7,6 bln Euro) - royalty collections outpace GDP growth
Source: Intellectual Property and the US Economy, Industries in Focus, March 2012, US Department of Commerce and WIPO statistics, CISAC – On the lookout for growth, 2013.

Copyright Challenges to Creative IndustriesPolicy
Copyright - a national and global policy issueEmpowerment of the prosumer
Economic use and abuse – a state of shockpiracy - threatens the model and requires new strategies
TechnologyConvergence blurs boundaries between sectors and markets
Mr. D. Gantchev

Final Words
The creative industries are expanding and copyright is an important enabling factorTheir performance is enhanced when stimulated by governments, the legal system and the businesses environment. Producing economic evidence on the creative industries facilitates policy making and raising public awareness
Mr. D. Gantchev-WIPO