Embed Size (px)
Citation preview

NBER WORKING PAPER SERIES
DIMENSIONS OF HEALTH IN THE ELDERLY POPULATION
David M. CutlerMary Beth Landrum
Working Paper 17148http://www.nber.org/papers/w17148
NATIONAL BUREAU OF ECONOMIC RESEARCH1050 Massachusetts Avenue
Cambridge, MA 02138June 2011
We are grateful to Marcelo Coca, Yunfan Gong, and Kaushik Ghosh for research assistance and theNational Institutes on Aging for research support through grant POI AG005842. The views expressedherein are those of the authors and do not necessarily reflect the views of the National Bureau of EconomicResearch.
NBER working papers are circulated for discussion and comment purposes. They have not been peer-reviewed or been subject to the review by the NBER Board of Directors that accompanies officialNBER publications.
© 2011 by David M. Cutler and Mary Beth Landrum. All rights reserved. Short sections of text, notto exceed two paragraphs, may be quoted without explicit permission provided that full credit, including© notice, is given to the source.
Dimensions of Health in the Elderly PopulationDavid M. Cutler and Mary Beth LandrumNBER Working Paper No. 17148June 2011JEL No. I1,I12
ABSTRACT
In this paper, we characterize the multi-faceted health of the elderly and understand how health alongmultiple dimensions has changed over time. Our data are from the Medicare Current Beneficiary Survey,1991-2007. We show that 19 measures of health can be combined into three broad categories: a firstdimension representing severe physical and social incapacity such as difficulty dressing or bathing;a second dimension representing less severe difficulty such as walking long distances or lifting heavyobjects; and a third dimension representing vision and hearing impairment. These dimensions havechanged at different rates over time. The first and third have declined rapidly over time, while thesecond has not. The improvement in health is not due to differential mortality of the sick or a newgeneration of more healthy people entering old age. Rather, the aging process itself is associated withless rapid deterioration in health. We speculate about the factors that may lead to this.
David M. CutlerDepartment of EconomicsHarvard University1875 Cambridge StreetCambridge, MA 02138and [email protected]
Mary Beth LandrumHarvard Medical SchoolDepartment of Health Care Policy180 Longwood AvenueBoston, MA [email protected]

1
Understanding changes in the health of the elderly is a central policy issue. A healthier
elderly population is able to work to later ages, spends less on medical care each year, and
requires less informal care from family and friends. Efforts to promote population health are
therefore central to many health reform proposals (Pardes et al., 1999).
By many metrics, the health of the elderly has improved over time. For example, the
share of elderly people with basic physical impairments such as difficulty walking around the
home or bathing has declined markedly over the past two decades. By other metrics, however,
the health of the elderly is worsening. Problems with more advanced functional measures such
as stooping and walking moderate distances have increased over time, and obesity among the
elderly has soared along with weight in the non-elderly population.
Researchers have attempted to combine indicators of the health of the elderly into a
single summary measure, but these summaries are generally ad hoc and lacking in nuance. The
most common single measure of disability is whether the person has any impairments in
Activities of Daily Living (ADLs, such as bathing or dressing) or Instrumental Activities of
Daily Living (IADLs, such as doing light housework or managing money). In the Medicare
Current Beneficiary Survey, which we analyze in this paper, the share of the elderly population
that is disabled by this definition has declined from 53 percent in 1991 to 42 percent in 2007
(figure 1). This summary measure exhibits somewhat different trends in different surveys and
for different measures of health (Schoeni et al., 2001; Manton and Gu, 2001), however, and
ignores measures of functional impairment (e.g., can the person walk a reasonable distance),
cognitive problems such as memory loss, and sensory impairments such as difficulty seeing and
hearing.

2
Note: Disability is measured as the share of people reporting at least one impairment in Activities of Daily Living and Instrumental Activities of Daily Living. Data are from the Medicare Current Beneficiary Survey Access to Care sample. Tabulations use sample weights and are adjusted to the age/sex composition of the elderly population in 2000.
At the same time, there is a history of more theoretically grounded measures of disability
– as with the Grade of Membership (GOM) model proposed by Ken Manton and colleagues
(Lamb, 1996; Manton et al., 1998; Woodbury et al., 1978; Manton et al., 1994). But these
models met resistance because of their complexity. Perhaps as a result, they have not been
widely pursued.
In this paper, we characterize the multi-faceted health of the elderly and understand how
health along multiple dimensions has changed over time. Our data are from the Medicare
Current Beneficiary Survey (MCBS), a rotating panel of nearly 12,000 elderly people annually.
The survey started in 1991; we employ data through 2007. The MCBS has the virtue that it is a
person-based sample, not a housing-unit based sample. Thus, it samples and follows people
when they move into nursing homes and records death.
40%
45%
50%
55%
1991 1992 1993 1994 1995 1996 1997 1998 1999 2000 2001 2002 2003 2004 2005 2006 2007
Figure 1: Disability Among the Elderly

3
We first consider how to optimally combine different measures of health into a smaller
number of summary measures. Of course, the best way to summarize multiple measures of
health depends on the question being asked. The optimal measure to predict medical spending
may be somewhat different than the optimal measure to predict health transitions, for example.
We use a somewhat ad hoc approach and estimate factor models for 19 indicators of health in the
community-based population. These measures include specific ADL impairments, IADL
impairments, functional impairments, and sensory impairments.
We show that these 19 dimensions can be compressed into three broad summary
measures. The dominant factor is impairment in very basic physical and social tasks such as
dressing, eating, transferring in and out of bed, preparing meals, doing light housework, and
managing money. This encompasses many of the ADLs and IADLs, but not all. The second
factor loads heavily on functional limitations and includes measures such as walking moderate
distances, stooping, and reaching. The third dimension is sensory impairments – trouble seeing
and hearing.
After determining these factors, we analyze the evolution of these health dimensions over
time. We show that the set of physical and social limitations and sensory impairments have
declined rapidly over time. Functional ability was flat or increasing, after declining early in the
time period.
These results suggest many possible patterns. One possibility is that the community-
dwelling population is increasingly concentrated among the less severely ill, with more severely
ill individuals in nursing homes or having died. We show, however, that composition changes –
both people leaving the sample and new people entering the sample – cannot explain a change in
the health of the community-dwelling population. In a second scenario, it may be that people are

4
recovering from severe disability more frequently in later years in the sample, thanks to better
medical care or other environmental changes.
We investigate the evolution of health states in the final part of the paper. In particular,
we estimate models explaining within-person health trends over time, controlling for
demographic characteristics and year dummy variables. We examine health trends in the early
years in the sample (1991-96), middle years in the sample (1997-2001) and later years in the
sample (2002-2007). We show that health deteriorates less rapidly in later years of the sample
than in earlier years. This sets up an exploration of what shocks to health are occurring less
rapidly, which is the subject of ongoing research.
This paper is structured as follows. The first section describes the data we employ. The
second section presents information on trends in elderly health and reports the results of factor
analyses for the 1991-2007 period. The third section shows the evolution of summary health
measures of health over time, and the fourth section examines within-person changes. The last
section concludes.
I. The Data
Our primary data source is the Medicare Current Beneficiary Survey (MCBS). The
MCBS, sponsored by the Centers for Medicare and Medicaid Services (CMS), is a nationally
representative survey of aged, disabled, and institutionalized Medicare beneficiaries, that over-
samples the very old (aged 85 or older) and disabled Medicare beneficiaries. Since we are
interested in disability among the elderly, we restrict our sample to the population aged 65 and
older.

5
While a number of surveys have measures of disability in the elderly population
(Freedman et al., 2002), including the National Health Interview Study and the Health and
Retirement Study, the MCBS has a number of advantages. First, the sample size is large, about
10,000 to 18,000 people annually. In addition, the MCBS samples people regardless of whether
they live in a household or a long-term care facility, or switch between the two during the course
of the survey period. Finally, the set of health questions are very broad, encompassing health in
many domains.
The MCBS started as a longitudinal survey in 1991. In 1992 and 1993, the only
supplemental individuals added were to replace people lost to attrition and to account for newly
enrolled beneficiaries. Beginning in 1994, the MCBS began a transition to a rotating panel
design, with a four year sample inclusion. About one-third of the sample was rotated out in
1994, and new members were included in the sample. The remainder of the original sample was
rotated out in subsequent years. We use all interviews that are available for each person from the
start of the survey in 1991 through the 2007 survey.
The MCBS has two samples: a set of people who were enrolled for the entire year (the
Access to Care sample) and a set of ever enrolled beneficiaries (the Cost and Use sample). The
latter differs from the former in including people who die during the year and new additions to
the Medicare population. The primary data that we use are from the health status questionnaire
administered in the fall survey, which defines the Access to Care sample. We thus use the
Access to Care data. We supplement this with information about death in the year following the
fall interview, taken from the Cost and Use data. Because the Cost and Use data are only
available through 2006, our analysis of deaths, nursing home transitions, and loss to follow-up
go only through that year. Other data go through 2007.

6
Table 1 shows the number of individuals in the sample by year or interview and wave
(number of interviews for that person). The sample of new beneficiaries is low in 1992 and
1993, rises throughout the 1990s, and then declines in the early 2000s. The difference between
the number of people in one wave in year t and the next wave in year t+1 is an approximate death
and attrition rate across years.
Table 1: Sample Size for MCBS Wave
Year 1 2 3 4 5 6 Total
1991 10,495 10,4951992 1,685 8,495 10,1801993 1,795 1,516 7,391 10.7021994 4,011 1,510 1,408 6,472 13,4011995 4,250 3,270 1,244 809 3,411 12,9841996 6,494 3,443 2,803 1,037 277 1,046 15,1001997 6,274 3,764 3,036 2,450 --- --- 15,5241998 8,069 3,698 3,370 2,678 --- --- 17,8151999 5,341 3,545 3,289 2,958 --- --- 15,1332000 4,274 3,572 3,115 2,861 --- --- 13,8222001 4,279 3,563 3,172 2,709 --- --- 13,7232002 4,207 3,479 3,142 2,770 --- --- 13,5982003 4,160 3,437 2,996 2,741 --- --- 13,3342004 4,055 3,292 2,961 2,556 --- --- 12,8642005 4,195 3,302 2,916 2,617 --- --- 13,0302006 4,317 3,308 2,838 2,523 --- --- 12,9862007 4,203 3,411 2,910 2,485 --- --- 13,009Note: The sample is the elderly population in the Access to Care survey.
The health questions asked about in the MCBS are shown in Table 2. The questions are
generally the same for the community population and the institutional population, with the
exception that the institutionalized are not asked about three IADLs limitations – light
housework, preparing meals, and heavy lifting. The tabulations in table 1 are for people
interviewed in 1991-2007. On average, 5 percent of people are in a nursing home.

7
Table 2: Health questions in MCBS Prevalence Num
Question
Community (95%)
Institutionalized (5%)
Functional limitations: Difficulty
1 Stooping/crouching/kneeling 69% 93% 2 Lifting/carrying 10 pounds 37% 92% 3 Extending arms above shoulder 27% 68% 4 Writing/handling object 26% 63% 5 Walking ¼ mile or 2-3 blocks 44% 90%
Activities of Daily Living: Says difficulty doing by himself/herself because of a health or physical problem
6 Bathing or showering 11% 91% 7 Going in or out of bed or chairs 7% 80% 8 Eating 3% 48% 9 Dressing 13% 65%
10 Walking 24% 66% 11 Using the toilet 5% 70%
Instrumental Activities of Daily Living: Difficulty doing the following activities by yourself, because of a health or physical problem
12 Using the telephone 7% 61% 13 Doing light housework (like washing dishes,
straightening up, or light cleaning) 12% ---
14 Doing heavy housework (like scrubbing floors or washing windows)
31% ---
15 Preparing own meals 9% --- 16 Shopping for personal items 14% 85% 17 Managing money (like keeping track of
expenses or paying bills) 7% 85%
Sensory Problems
18 Trouble seeing 35% 44% 19 Trouble hearing 40% 39%
Note: Tabulations are from the MCBS Access to Care sample for 1991-2007 and use sample weights.
Functional limitations are most common. Sixty-nine percent of the community-dwelling
population report difficulty stooping, crouching, or kneeling, along with 93 percent of the
institutionalized. For other questions, positive responses are reported by a quarter to a half of the
population. Very severe physical impairments such as help needed bathing or toileting are very

8
common for the institutionalized, but rare in the community. The same is true about social
indicators such as managing money and shopping, with the exception that there is significant
difficulty doing heavy housework among people living in the community. About one-third of
both groups report difficulties seeing or hearing.
Figure 2 shows the trend in health for each of the dimensions identified in Table 2, along
with the share of people living in a nursing home. For each dimension, we determine the share
of people who report having being impaired in at least one specific item, in each year of the data.
For example, our ADL trend is the share of people in each year who report at least one ADL
impairment. In this analysis, we do not distinguish between one or more than one impairment.
Our models in the next section will do so.
There are very different patterns for the different dimensions of health. The share of
people who are in a nursing home, who have an ADL or IADL impairment, or who have a
sensory impairment has declined over time. The decline in nursing home residence is about 30
percent. The reduction in ADL impairment is also about 30 percent, while the reduction in
IADL impairment is about 20 percent. Sensory impairments declined by 24 percent. The share
of the population with functional limitations, in contrast, was relatively flat.
The Appendix shows the specific items that contribute to the trends for each dimension.
There is surprisingly little variation within the specific items in each domain. Almost all of the
ADL and IADL impairments have declined, as have both of the sensory impairments. Most of
the functional limitations have been relatively flat, as have the two cognitive measures. This
suggests that the grouping shown in Figure 1 may be relatively accurate as a true description of
elderly health. We turn to this next.

9
Figure 2: Summary Health Measures by Domain
Note: Data are from the Medicare Current Beneficiary Survey Cost and Use sample. Percentages use sample weights and are adjusted to the age/sex composition of the population in 2000.
0%
5%
10%
15%
Nursing Home Residence
45%
50%
55%
60%
65%
70%
Sensory Impairment
35%
40%
45%
50%
IADL Impairment
25%
30%
35%
40%
45%
ADL Impairment
70%
75%
80%
85%
Functional Limitation
10
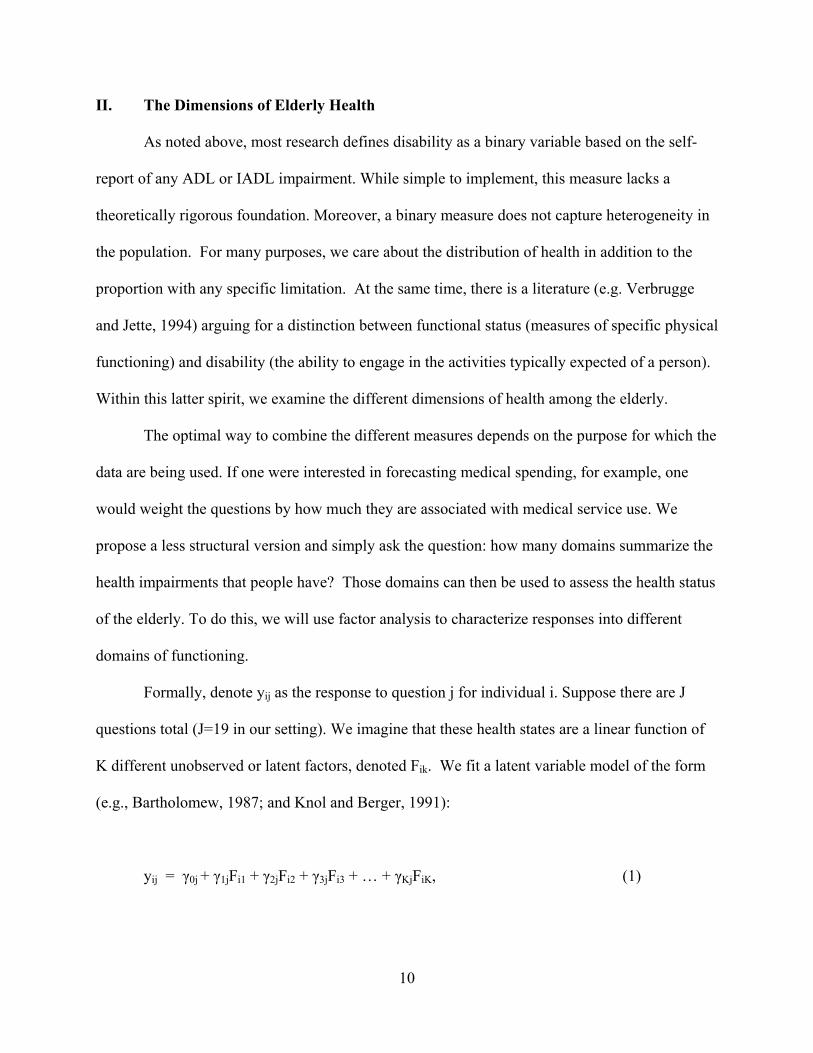
II. The Dimensions of Elderly Health
As noted above, most research defines disability as a binary variable based on the self-
report of any ADL or IADL impairment. While simple to implement, this measure lacks a
theoretically rigorous foundation. Moreover, a binary measure does not capture heterogeneity in
the population. For many purposes, we care about the distribution of health in addition to the
proportion with any specific limitation. At the same time, there is a literature (e.g. Verbrugge
and Jette, 1994) arguing for a distinction between functional status (measures of specific physical
functioning) and disability (the ability to engage in the activities typically expected of a person).
Within this latter spirit, we examine the different dimensions of health among the elderly.
The optimal way to combine the different measures depends on the purpose for which the
data are being used. If one were interested in forecasting medical spending, for example, one
would weight the questions by how much they are associated with medical service use. We
propose a less structural version and simply ask the question: how many domains summarize the
health impairments that people have? Those domains can then be used to assess the health status
of the elderly. To do this, we will use factor analysis to characterize responses into different
domains of functioning.
Formally, denote yij as the response to question j for individual i. Suppose there are J
questions total (J=19 in our setting). We imagine that these health states are a linear function of
K different unobserved or latent factors, denoted Fik. We fit a latent variable model of the form
(e.g., Bartholomew, 1987; and Knol and Berger, 1991):
yij = γ0j + γ1jFi1 + γ2jFi2 + γ3jFi3 + … + γKjFiK, (1)

11
where yij is a 0 or 1 outcome variable, γ0j is a threshold parameter that accounts for varying
prevalence of limitations in the population (for example, limitations climbing stairs are more
common that limitations in bathing) and the γkj’s are factor loadings that describe the relationship
between unobserved factor k and question j. Unobserved factors are assumed to follow a
Multivariate Normal distribution. The latent variable model described by (1) is similar to the
factor analyses and Grade of Membership models that have been previously used to describe
dimensions of disability (Lamb, 1996; Manton et al., 1998; Woodbury et al., 1978; Manton et al.,
1994).
We can fit this model provided K<J. Empirically, because the data tend to be highly
correlated and we have 19 dimensions of health, a small number of factors is associated with a
wide range of variation in the data.
Table 3 shows the results of the factor analysis on community-dwelling elderly over the
1991-2007 time period. By the usual criterion of eigenvalues greater than 1, there are three
significant factors. These three also have natural economic and demographic interpretations.
We thus work with those three.
Table 3: Factor Analysis for MCBS Data Eigenvalue Proportion Cumulative1 6.90 .363 .363 2 1.75 .092 .455 3 1.17 .062 .517 4 0.98 .051 .568 5 0.89 .047 .615 6 0.82 .043 .658 Note: The results are from factor analyses using the MCBS community-dwelling sample from 1991-2007. The sample includes 211,952 observations.

12
To aid in interpretation, we consider rotations of the factors that maximize the loading of
individual measures into single factors while also allowing correlation between latent factors.
Specifically, we use an oblique rotation of the three factor scores (promax=3). The predicted
factor scores are positively correlated. The correlation between factors 1 and 2 is .428, between
1 and 3 is .251, and between 2 and 3 is .242.
Figure 3 shows plots of the (rotated) first factor against factors 2 and 3. These plots are
primarily useful to see the individual items that are loading most highly on each dimension. The
first factor encompasses largely ADL and IADL limitations, with heavy loading on all of the
ADLs and IADLs such as shopping, light housework, and preparing meals. The second factor is
largely associated with functional limitations and related IADLs, including difficulty walking,
lifting, stooping, reading, and doing heavy housework. The third factor is concentrated in
sensory impairments, including both vision and hearing.
Figure 3: Factor Loadings
Note: Data are from the Medicare Current Beneficiary Survey Access to Care sample. The factor analysis is for people surveyed in 1991-2007. Table 2 has details.
tele
light
heavy
meal
shop
money
bath
dress
eat
transfer
a_walk
toilet
stoop lift
reach
write
fl_walk
vision
hearing
‐0.4
‐0.2
0
0.2
0.4
0.6
0.8
1
‐0.4 ‐0.2 0 0.2 0.4 0.6 0.8 1
Factor 1 vs. Factor 2
tele
lightheavy
mealshopmoney
bathdress
eat
transfera_walktoilet
stoop
lift
reach
write
fl_walk
vision
hearing
‐0.4
‐0.2
0
0.2
0.4
0.6
0.8
1
‐0.4 ‐0.2 0 0.2 0.4 0.6 0.8 1
Factor 1 vs. Factor 3
13
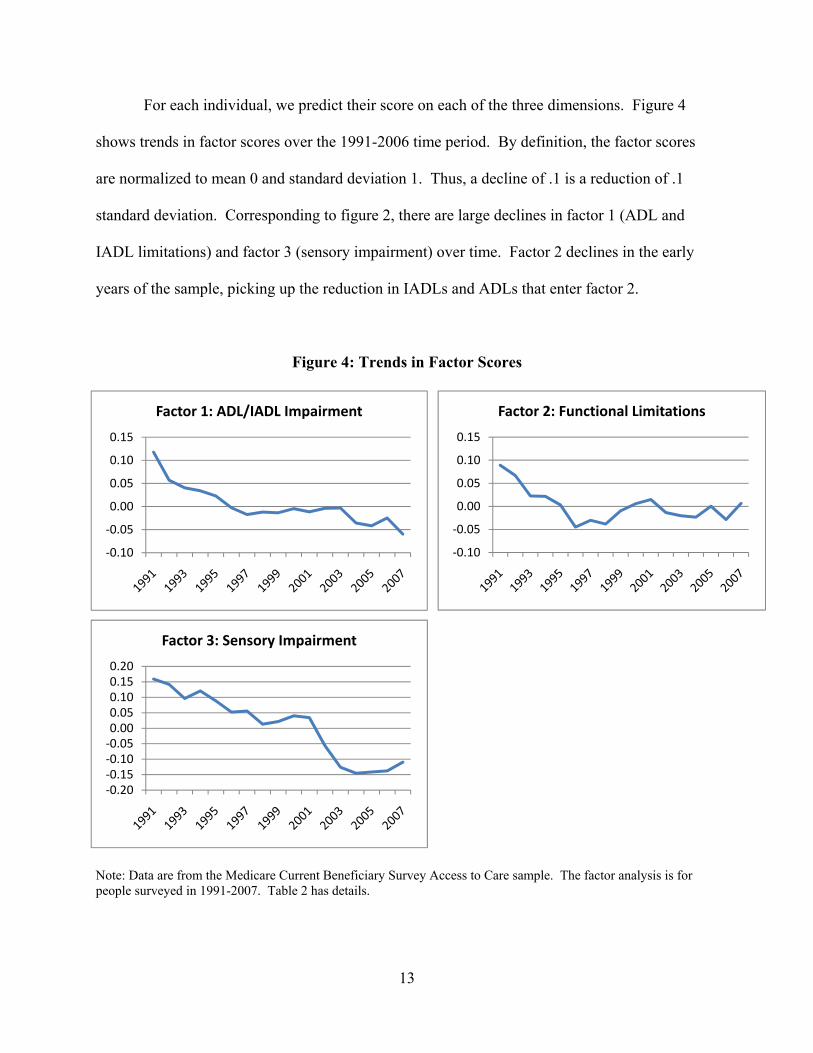
For each individual, we predict their score on each of the three dimensions. Figure 4
shows trends in factor scores over the 1991-2006 time period. By definition, the factor scores
are normalized to mean 0 and standard deviation 1. Thus, a decline of .1 is a reduction of .1
standard deviation. Corresponding to figure 2, there are large declines in factor 1 (ADL and
IADL limitations) and factor 3 (sensory impairment) over time. Factor 2 declines in the early
years of the sample, picking up the reduction in IADLs and ADLs that enter factor 2.
Figure 4: Trends in Factor Scores
Note: Data are from the Medicare Current Beneficiary Survey Access to Care sample. The factor analysis is for people surveyed in 1991-2007. Table 2 has details.
‐0.10
‐0.05
0.00
0.05
0.10
0.15
Factor 1: ADL/IADL Impairment
‐0.10
‐0.05
0.00
0.05
0.10
0.15
Factor 2: Functional Limitations
‐0.20‐0.15‐0.10‐0.050.000.050.100.150.20
Factor 3: Sensory Impairment

14
We next plot the factor scores by age. If all of the health improvement were at younger
elderly ages, the explanation would likely fall in the medical and environmental factors that
influence health of the working age population. Conversely, improvements in health at older
ages raise the possibility that conditions at those older ages are the driving factor (though they
don’t prove it, as the literature on the impact of in utero conditions shows; Barker, 1992).
Figure 5 shows the trend in each of the three factor scores by age. Health improvements
in factors 1 and 3 are prevalent at all ages. For example, the reduction in factor 1 is 0.1 (.1
standard deviation) for people aged 65-69 and 0.38 for people aged 85+.
Figure 5: Factor Scores by Age
Note: Data are from the Medicare Current Beneficiary Survey Access to Care sample. The factor analysis is for people surveyed in 1991-2007. Table 2 has details.
‐0.5
0
0.5
1
1991 1993 1995 1997 1999 2001 2003 2005 2007
Factor 1
65‐69 70‐74 75‐79 80‐84 >85
‐0.5
0
0.5
1
1991 1993 1995 1997 1999 2001 2003 2005 2007
Factor 2
65‐69 70‐74 75‐79 80‐84 >85
‐0.5
0
0.5
1
1991 1993 1995 1997 1999 2001 2003 2005 2007
Factor 3
65‐69 70‐74 75‐79 80‐84 >85

15
Since there are more young elderly than old elderly, the contribution of the older elderly
to the reduction in total disability is perhaps overstated. Another metric is to evaluate the share
of the total improvement in the health of the elderly is accounted for by improvements in the
health of each age group. At any time period t, F(t) = Σa pct(a,t) * F(a,t), where pct(a,t) is the
percent of the population at time t that is in age group a. The contribution of age group a to the
total change in health between two time periods is then pct(a,0)*ΔF(a), and the total change in
the population is Σa pct(a,0)*ΔF(a). The ratio of those two, pct(a,0)*ΔF(a) / Σa pct(a,0)*ΔF(a), is
the contribution of health improvements at age group a to the total change in population health.
Figure 6 shows these contribution shares for factors 1 and 3, the dimensions on which
health is improving most significantly, along with the population distribution by age. For both
factors 1 and 3, the oldest old contribute disproportionately to health improvements. People aged
85 and older are 14 percent of the population in 1991 but account for 30 to 50 percent of the
health improvement. This suggests that late life health and social conditions may be important
contributors to population health. At minimum, any theory of health improvement will have to
account for this age differential.
Note: Calculations are based on the trends shown in Figure 5.
0%
25%
50%
75%
100%
Population Share . Factor 1 Factor 3
Figure 6: Contribution of Different Ages to Health Improvement
85+
80‐84
75‐79
70‐74
65‐69

16
III. Explaining the Improvement in Health
The central economic challenge is to understand why health improves in so many
dimensions. We consider two explanations for improved health. The first explanation is
composition change: people with severe health impairments may be more likely to die or
transition into a nursing home over time. Alternatively, new entrants to the survey may be
healthier than the people they replace. Either of these situations would improve the health of the
community-dwelling population because of selection. Second, people may be impaired along the
same dimensions, but impairment may not progress to more severe stages as frequently as it did
formerly, either because of person-specific aging trends (e.g., richer people can manage their
chronic conditions better), or because of population-wide shocks (a new treatment for vision
impairment).
Figure 7 shows a schematic of the model that we estimate. We start off with the
community-dwelling population in year t. Between t and t+1, two things happen. First, the
sample changes. Some people leave the sample, either through death, loss to follow-up, or
nursing home entry, and others enter. The combination of these two transitions is the
composition effect. Second, new health shocks occur (for example, a heart attack or diagnosis of
cancer) and old health conditions exert an effect on health. An example of the latter is a
continued deterioration that might occur from untreated arthritis. The combination of
composition changes and health changes among the existing population yields the new
population health at t+1.

17
Figure 7: Schematic of Estimation Model
Composition Change
We now show the equations that we model, starting with the composition change.
Denote Fkit as the factor score in dimension k for person i in year t; Fit is the vector of factor
scores for person i in year t. The equations for nursing home entry (NH), death (Die), and loss to
follow-up (Loss) are given by:
NHit+1 = FitαNH + Xit+1θ
NH + μNHit+1 (2)
Dieit+1 = FitαDie + Xit+1θ
Die + μDieit+1 (3)
Lossit+1 = FitαLoss + Xit+1θ
Loss + μLossit+1 (4)
where i denotes individuals and t is year. In a general specification, the μ·it error terms might be
correlated. For simplicity, we assume they are not.
For new entrants, the issue is whether people who are new to the survey are healthier than
those who continue. We estimate this as follows:
Fkit = Xitθk + πk
1Wave1 + μkit (5)
Population at t (Ft)
New entrants
Population at t+1 (Ft+1)
Death Loss to Nursing follow-up home
New shocks (health, environment); Existing conditions

18
where Wave1 is a dummy for the first year in the survey. To the extent that new entrants at any
age are more or less healthy than people of the same age but who are continuing in the survey,
the coefficient π1 will be different from zero.
Health Trends Within Individuals
We then consider the model for health of the continuing population. We describe the
evolution of health for the surviving, community-dwelling population as:
Fkit = α0ik + α1ik t + α2ik hit + Yeart γk + εkit (6)
The factor score for an individual depends on their demographics (α0ik), aging (t), new and
ongoing health shocks (hit), and year dummy variables (γk).
It is natural for α0ik to vary in the population, for both measurable reasons (older people
are sicker than younger people) and unmeasurable reasons (random differences across
individuals). Similarly, aging and health shocks may affect different people differently.
Generally, we parameterize αjik (j=0, 1, and 2 – corresponding to the three α terms in equation
(6)) as follows:
αjik = βj0k + Xit βj1k + Periodit βj2k + ξjik (7)
Equation (7) relates the level and trend in health to a constant, person-specific factors, and the
time period.

19
In principle, the εkit errors may be correlated (factor scores in different domains), as might
the ξjik errors (coefficients on different control variables). A general formulation would model
these as ε ~ N(0, Σ) and ξ ~ N(0, Ψ). For this analysis, we assume that the ε’s are independent,
as are the ξ’s. Also for simplicity, we assume that the only coefficients that vary over people are
α0ik and α1ik – the constant term and the coefficient on the time trend. We parameterize α0ik as
depending on demographics and an error term (i.e. α0ik = β00k + Xit β01k + ξ0ik) and the β12k as
differing in three time periods: 1991-96; 1997-2001; and 2002-07 (i.e. α1ik = β10k + Periodit β12k +
ξ1ik). Finally, for this analysis, we leave out the health measures hit. We do this not because they
are unimportant, but because we wish to focus on the aging effect α1ik. We therefore estimate
β00k, β01k, β10k, β12k, var(ξ0ik), and var(ξ1ik).
Our X vector consists of basic demographics. We include dummy variables for age and
gender (a dummy for aged 65-69,70-74, 75-79, 80-84, and 85+ interacted with gender), and a
dummy for non-whites. We also include year dummy variables. Future work could naturally
incorporate a richer array of variables, including health shocks to the individual and other family
members, changes in socioeconomic status such as reductions in income or wealth, and
environmental conditions.
IV. Composition Change
All three exits from the community sample are common. About 1.5 percent of the elderly
population transitions into a nursing home in any year. This is smaller than the share of people
who are living in a nursing home at a point in time (around 5 to 6 percent) because of the long-
stayers. We also exclude from this analysis people who died between one survey wave and the
next, since we do not know about nursing home utilization for them. About 4 percent of the

20
population dies in any year (this is among the community-dwelling sample; a larger share of the
institutionalized population dies). Finally, about 12 percent of the population is lost to follow-up
each year. This share is particularly high early in the sample, when the initial population was
purposely phased out. Outside of those years, the average loss to follow-up is about 10 percent.
The primary question we explore is whether people who are sicker (that is, score higher
on the factor score) depart the sample more frequently, and whether this is particularly likely to
occur over time. Thus, we interact the factor scores in equations (2)-(4) with the period dummies
noted above: 1991-96, 1997-01, 2002-06. We then test whether being sick has a greater effect
on sample exit in later years of the sample.
Table 3 shows the estimates of death, transitions to a nursing home, or loss to follow-up.
Since we have repeat observations on the same individual, we cluster the standard errors by
individual – as we do in table 5 as well. In the first column, factor 1 is particularly predictive of
mortality. An increase of 1 standard deviation raises mortality rates by 3 percent. Factor 1 is
mildly more predictive of death in the later years of the sample than the earlier years. An F-test
rejects that that the coefficients in later years are the same as in earlier years. But the
quantitative difference is not large, .4 percentage points.
We determine the quantitative impact of this change on the health of survivors using a
simulation model. Specifically, we draw uniform random numbers and simulate for each person
death under the coefficients in the early time period, and then again using the coefficients in the
later time period, but keeping the X’s the same as in the early time period. We then average
health of the survival group in each case. We estimate that the average score on factor 1 would
decline by .004 because of the increased propensity of the sick to die. Given an overall decline

21
in factor 1 of .072 between the early and late time periods, mortality selection can explain only 5
percent of the decline in factor 1 over time.
Table 3: Transitions Out of the Community Sample
Independent Variable
Die
Enter a Nursing Home
Loss to Follow-Up
Factor 1 1991-96 .028**
(.001) .021** (.001)
.006** (.002)
1997-01 .031** (.002)
.020** (.001)
.007** (.002)
2002-06 .032** (.002)
.016** (.001)
.011** (.002)
Factor 2
1991-96 .009** (.001)
-.001 (.001)
.000 (.002)
1997-01 .010** (.001)
.000 (.001)
.002 (.002)
2002-06 .010** (.001)
.000 (.001)
.003 (.002)
Factor 3
1991-96 .000 (.001)
.003** (.001)
-.008** (.002)
1997-01 .001 (.001)
.002** (.001)
-.009** (.002)
2002-06 .001 (.001)
.002* (.001)
-.006* (.002)
Demographics Yes Yes Yes Wave dummies Yes Yes Yes Year dummies
Yes Yes Yes
N 153,214 123,270 153,214 R2
.053 .045 .032
Dependent variable mean
.035 .013 .125
Note: Data are from the Medicare Current Beneficiary Survey. Demographic controls include age-sex dummies (ages 65-69, 70-74, 75-79, 80-84, 85+, by gender), and a dummy for non-white. Standard errors are clustered by individual.

22
In the models for nursing home entry, shown in the second column, factor 1 is
particularly predictive of transitions into a nursing home. This corresponds to severe physical or
social impairment. Factors 2 and 3 (functional limitations and sensory impairment), in contrast,
have relatively little impact on nursing home transitions. The coefficient on factor 1 declines a
bit, implying that sicker people are more likely to be in the community in later years of the
sample.
The third column shows the model for loss to follow-up. If appropriate effort is put into
follow-up, loss to follow-up should be approximately random. Somewhat surprisingly, this is
not true in the data. Higher scores on factor 1 (that is, worse health) predicts loss to follow-up,
while those with sensory impairments are somewhat less likely to be lost to follow-up. These
coefficients are relatively small, however, and do not vary much over time.
We evaluate the combined impact of these three sources of sample attrition using the
simulation noted above. We draw random variables to predict death, nursing home entry, and
loss to follow-up and then simulate the community-dwelling population under the coefficients in
the early years of the sample and the later years of the sample. The simulation shows that factor
1 for the community-dwelling population would decline by .006 as a result of selection, or 8
percent of the total decline. For factor 3, the predicted change is only 1 percent of the total
improvement.
The regressions in table 3 have year dummies included, and these year dummies are
graphed in figure 8. Generally, the year dummies are relatively flat – death and nursing home
entry are no more or less likely over time, conditional on health status and demographics. As
noted above, loss to follow-up is high in two years of the sample (1991 and 1994) and constant
in other years.

23
Note: Figure shows the year dummy variables for models of death, nursing home entry, and loss to follow-up. Data are from the Medicare Current Beneficiary Survey Cost and Use sample. Table 3 describes the model.
The final component of composition change is the changing health of new enrollees to
the survey. We estimate equation (5) interacting the wave 1 dummy variable with dummy
variables for early, middle, and late periods of the sample. We then examine whether people in
the first wave of the survey are increasingly healthy over time.
Table 4 shows the results. The three columns show averages for factors 1, 2, and 3
respectively. New entrants to the survey are less healthy than existing members along factor 1,
but healthier in the second dimension. In both cases, the coefficients are relatively small.
Furthermore, the factor 1 and 3 coefficients are somewhat increasing over time. That is, health
of new entrants is on average deteriorating relative to the health of existing members across the
years.
‐10%
‐5%
0%
5%
10%
‐4%
‐2%
0%
2%
4%
1991 1993 1995 1997 1999 2001 2003 2005
Lost to Follo
w‐Up
Died / Nursing Home Entry
Figure 8: Year Effects for Leaving the Sample
Died Nursing Home Lost to Follow‐Up

24
Table 4: The Health of New Entrants Independent Variable
Factor 1
Factor 2
Factor 3
Coefficient on Wave 1 dummy 1991-96 .013
(.009) -.009** (.012)
-.008 (.009)
1997-01 .029** (.007)
-.021** (.008)
.006 (.008)
2002-07 .021** (.007)
-021** (.007)
.060** (.007)
Demographics Yes Yes Yes Year dummies
Yes Yes Yes
N 211,952 211,952 211,952 R2
.072 .085 .062
Note: Data are from the Medicare Current Beneficiary Survey. Demographic controls include age-sex dummies (ages 65-69, 70-74, 75-79, 80-84, 85+, by gender), year dummies, and a dummy for non-white. Standard errors are clustered by individual.
The implication of these transition models is therefore that the improving health of the
community-based population is not attributable to changes in the sample of people living in the
community, or picked up by the MCBS. By residual, then, it must be the case that the same
population is increasingly healthy over time.
V. The Evolution of Health Among Community-Dwellers
In this section, we turn to the evolution of health among the community-dwelling
population. Specifically, we estimate the model given by equations (6) and (7). Given the
results above, our primary focus is on the time trend, and how that varies in the early, middle,
and later years of the sample.

25
Table 5 shows the models health trends. The three columns correspond to models for the
three different factors. Within each model, we present the average aging effect (β10k) and the
standard deviation of that coefficient. There are also year dummies in the model, and these are
shown in Figure 9.
Table 5: The Evolution of Health
Independent Variable
Factor 1
Factor 2
Factor 3
Average Effects t*(1991-96) .065**
(.004) .041** (.003)
.019** (.004)
t*(1997-01) .035** (.003)
.037** (.003)
.010** (.003)
t*(2002-07) .034** (.003)
.031** (.002)
-.016** (.003)
Standard Deviation of Average t*(1991-96) .192 .087 .101 t*(1997-01) .137 .076 .089 t*(2002-07)
.128 .063 .092
Demographics Yes Yes Yes Year dummies
Yes Yes Yes
N 211,952 211,952 211,952 Note: Data are from the Medicare Current Beneficiary Survey. Demographic controls include age-sex dummies (ages 65-69, 70-74, 75-79, 80-84, 85+, by gender), and a dummy for non-white. Standard errors are clustered by individual.
The averages show considerable decline in health as a person ages. For example, factor 1
increases by .065 each year (.065 standard deviations) during the early phase of the sample, and
factor 3 increases by .019 each year.
The rate of decline in health has slowed over time. Relative to the increase in factor 1 of
.065 each year, as shown in the first time period, the increase is only .034 in the more recent time

26
period. This reduction, which occurs after 1997, accounts for a large change in health over time.
Had the decrement to health stayed the same after 1996 as before 1996, health in 2007 would
have been one-third of a standard deviation worse. Another way to show the impact of this
change is to consider the year effects in figure 8. While there are strong year trends in factors 1
and 2 up through 1996, there are no consistent year trends afterwards.
Health in the third dimension also deteriorates less rapidly over time, with roughly the
same pattern. Factor 3 increases by 0.019 per year in the early time period, and then declines by
.016 per year in the later time period. There is an unexplained year trend in the early time period
and again between 2001 and 2003. Other than those time periods, there is little aggregate drift.
Not only does the rate of decline in health slow, but health is actually estimated to
improve for many people. The standard deviations of health trends, shown in the middle rows of
table 5, are large. The standard deviation of .19 for factor 1 in the early time period implies that
‐25%
‐20%
‐15%
‐10%
‐5%
0%
1991 1993 1995 1997 1999 2001 2003 2005 2007
Factor Score
Figure 8: Year Effects in Factor Scores
Factor 1 Factor 2 Factor 3

27
the 95 percent interval for the impact of aging is -.32 to +.44. There are clearly many people
whose health is improving, even while health is deteriorating on average.
V. Conclusions and Next Steps
Our results provide important evidence on the well-noted decline in disability in the
elderly population. We show that health has several dimensions: one that is largely severe
physical and social impairment; a second that is less severe physical limitations; and a third that
encompasses sensory impairments. The first and third of these dimensions are improving over
time, while the second is not.
The reason for the improvement in health is complex. On the one hand, the health
improvement is not a result of sample or demographic changes. Younger people are healthier
than younger people used to be, but the same is true of older people. Rather, health is improving
because individual health deteriorates less rapidly now than in the past. We do not know exactly
why this occurs, but we show that the average trend masks significant heterogeneity. Even as
health deteriorates overall as people age, health is improving for a significant minority of people.
The next step is to develop a richer model of the change in health over time. To what
extent is the improvement in health a result of fewer new conditions developing, existing
problems being cared for better, or changes in the social and environmental circumstances that
the elderly face? Considering these questions is a fruitful area for further study.

References
Barker DJP, The Fetal and Infant Origins of Adult Disease, BMJ Books, London, 1992.
Bartholomew DJ. “Latent variable models and factor analysis”, New York: Oxford University Press, 1987.
Knol DL, Berger MP, “Empirical comparison between factor analysis and multidimensional item response
models”, Multivariate Behavioral Research, 1991, 26, 457-477.
Lamb VL, "A Cross-National Study of Quality of Life Factors Associated with Patterns of Elderly
Disablement." Social Science and Medicine, 1996, 42(3), pp. 363-77.
Manton KG, Gu X, “Changes in the prevalence of chronic disability in the United States black and
nonblack population above age 65 from 1982 to 1999”, Proceedings of the National Academy of
Sciences, 2001,98(11):6354-9
Manton KG, Stallard E, Corder LS, "The Dynamics of Dimensions of Age-Related Disability 1982 to 1994
in the U.S. Elderly Population." J Gerontol A Biol Sci Med Sci, 1998, 53(1), pp. B59-70.
Manton, KG, Woodbury H, Tolley D, “Statistical Applications Using Fuzzy Sets”, Wiley, New York,
1994.
Pardes, H Manton KG, Lander ES, Tolley HD, Ullian AD, Palmer H, “Effects of Medical Research on
Health Care and the Economy.” 1999 Science. 283(5398):36-7.
Schoeni RF, Freedman VA, Wallace RB, “Persistent, consistent, widespread, and robust? Another look at
recent trends in old-age disability”, Journal of Gerontology, Series B, 2001,56(4):S206-18.
Verbrugge LM, Jette AM, “The Disablement Process”, Social Science Medicine, 1994, 38:1-14.
Woodbury M, Clive J, Garson A, “Mathematical typology: a grade of membership technique for obtaining
disease definition”, Computers and Biomedical Research, 1978, 11, 277-298.
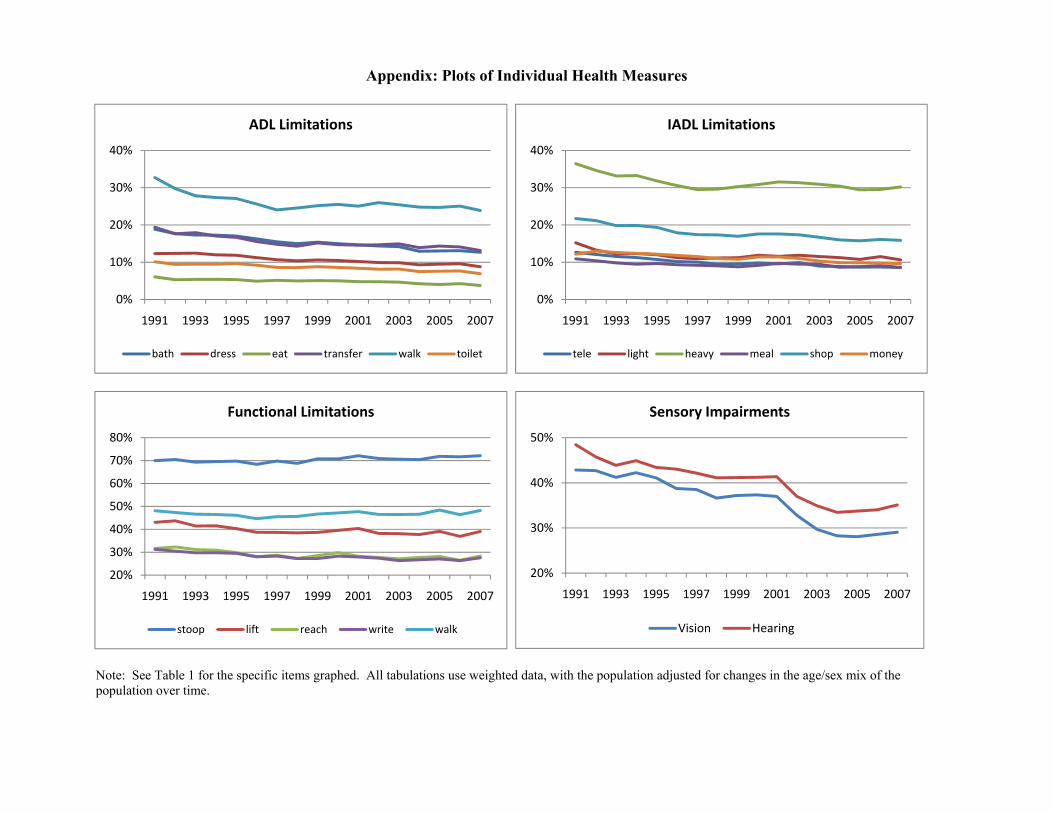
Appendix: Plots of Individual Health Measures
Note: See Table 1 for the specific items graphed. All tabulations use weighted data, with the population adjusted for changes in the age/sex mix of the population over time.
0%
10%
20%
30%
40%
1991 1993 1995 1997 1999 2001 2003 2005 2007
ADL Limitations
bath dress eat transfer walk toilet
0%
10%
20%
30%
40%
1991 1993 1995 1997 1999 2001 2003 2005 2007
IADL Limitations
tele light heavy meal shop money
20%
30%
40%
50%
60%
70%
80%
1991 1993 1995 1997 1999 2001 2003 2005 2007
Functional Limitations
stoop lift reach write walk
20%
30%
40%
50%
1991 1993 1995 1997 1999 2001 2003 2005 2007
Sensory Impairments
Vision Hearing