Embed Size (px)
Citation preview
1
F. Carle
Data Source
- Health Information System
- Survey
HSPA ITALY: NEW DEVELOPMENT
Essential Levels of
Assistance
Dimensions
effectivness efficiency safety equity In
tegr
ate
d C
are
Pat
hw
ays
Prevention and public
health
…………….
…………….
community
……………. …………….
Hospital
…………….
…………….
He
alth
Ne
ed
s
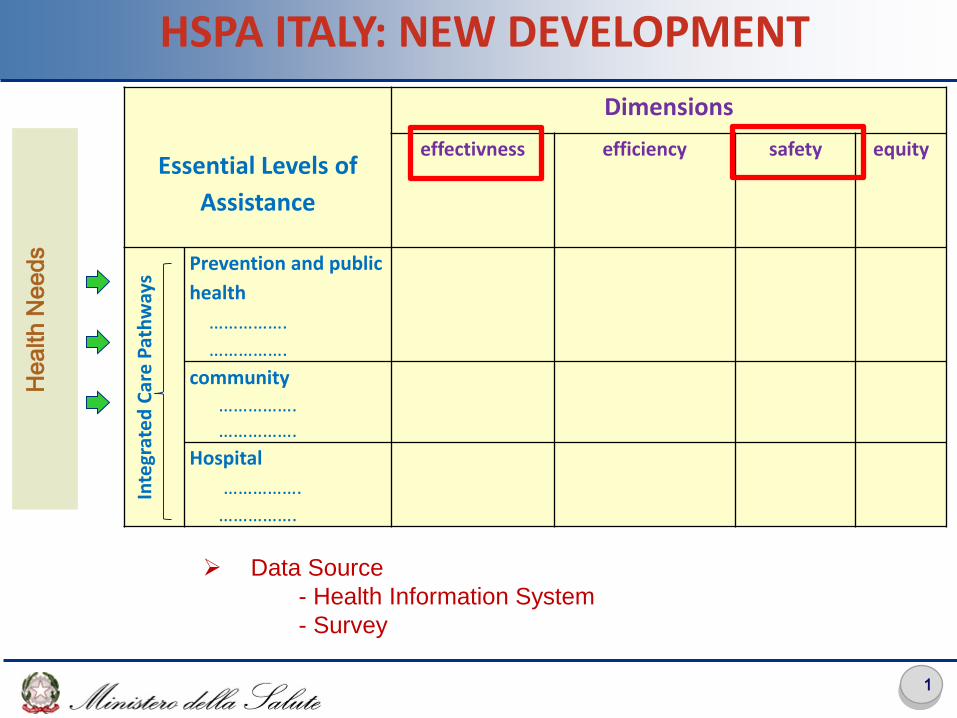
The overall mortality was
5.4% (range 2.1-11.4%)
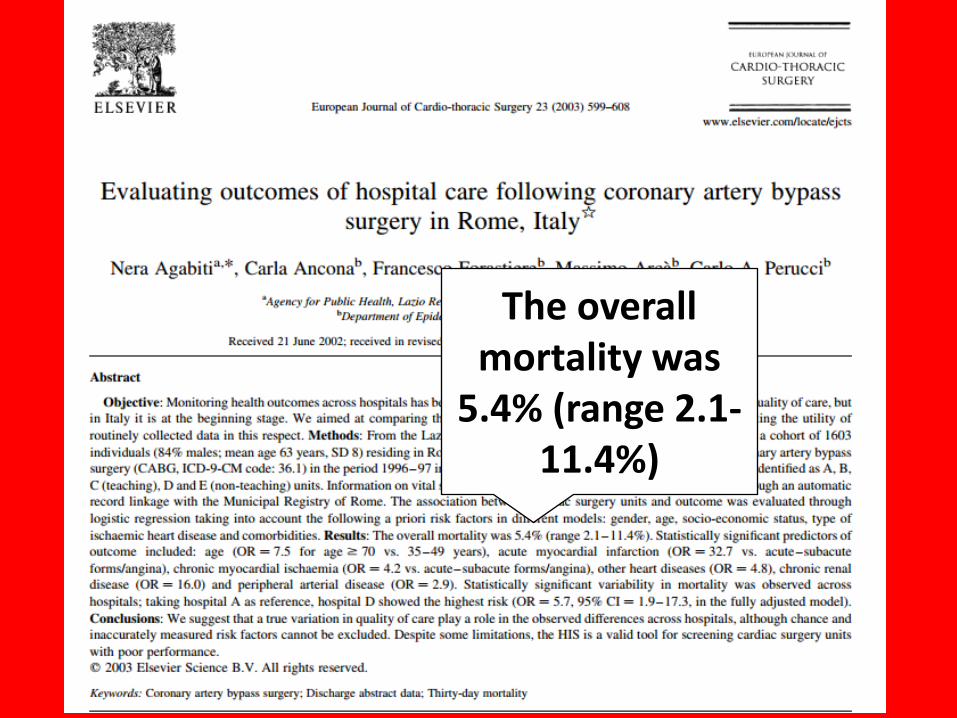
2007
DGR 301/2008
2009
2010

• Art. 15 comma 25 bis. L.135/2012 • Ai fini della attivazione dei programmi nazionali di valutazione
sull'applicazione delle norme di cui al presente articolo, il Ministero della salute provvede alla modifica ed integrazione di tutti i sistemi informativi del Servizio sanitario nazionale, anche quando gestiti da diverse amministrazioni dello Stato, ed alla interconnessione a livello nazionale di tutti i flussi informativi su base individuale. Il complesso delle informazioni e dei dati individuali così ottenuti e' reso disponibile per le attività di valutazione esclusivamente in forma anonima ai sensi dell'articolo 35 del decreto legislativo 23 giugno 2011, n. 118.
• Il Ministero della salute si avvale dell'AGENAS per lo svolgimento delle funzioni di valutazione degli esiti delle prestazioni assistenziali e delle procedure medico-chirurgiche nell'ambito del Servizio sanitario nazionale. A tal fine, AGENAS accede, in tutte le fasi della loro gestione, ai sistemi informativi interconnessi del Servizio sanitario nazionale di cui al presente comma in modalità anonima.
For the purpose of National Outcome Evaluation programs, the Ministry of
Health modifies and integrates all NHS informations systems on an individual
basis….the National Agency for Regional Health Services has access to the
interconnected information systems
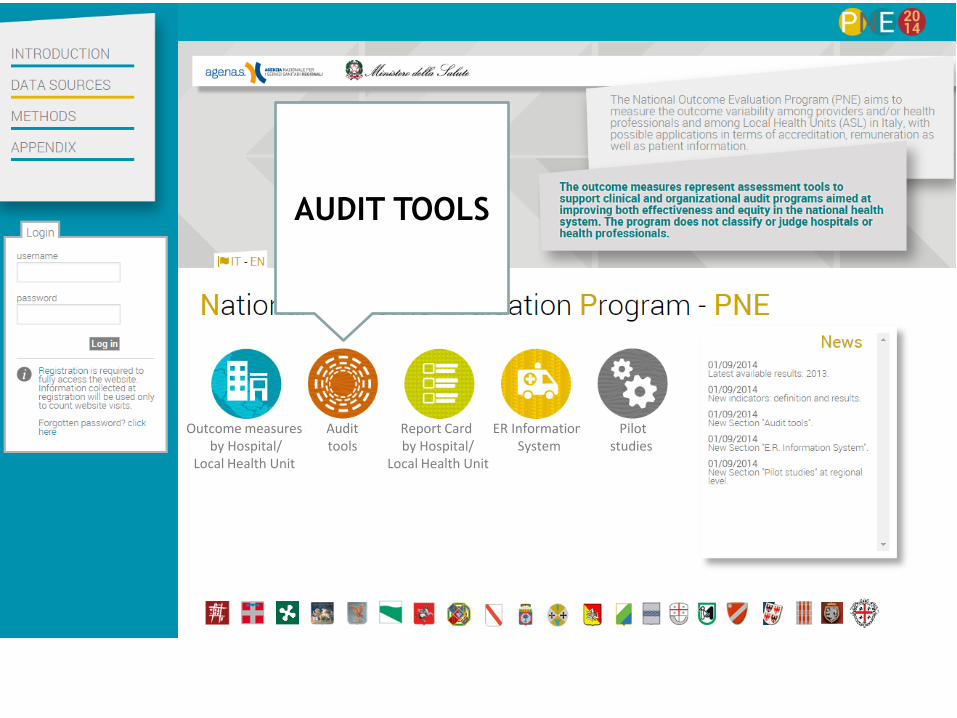
Outcome measures by Hospital/
Local Health Unit
Audit tools
Report Card by Hospital/
Local Health Unit
ER Information System
Pilot studies
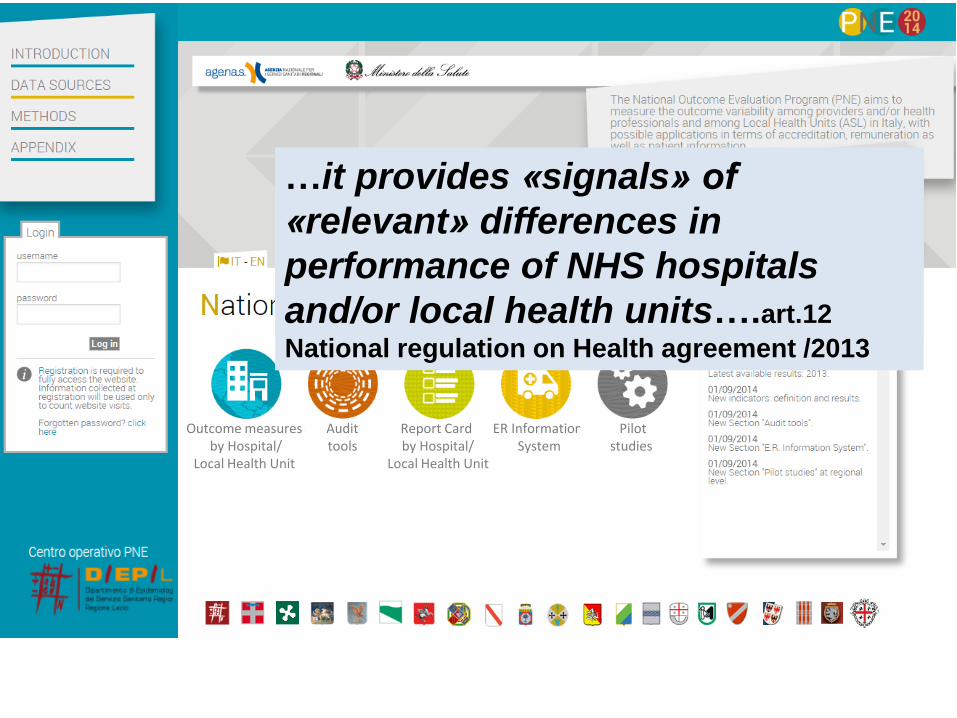
The National Outcome Evaluation
Programme measures the outcome
variability among providers and/or
health care local units in Italy
…it provides «signals» of
«relevant» differences in
performance of NHS hospitals
and/or local health units….art.12
National regulation on Health agreement /2013
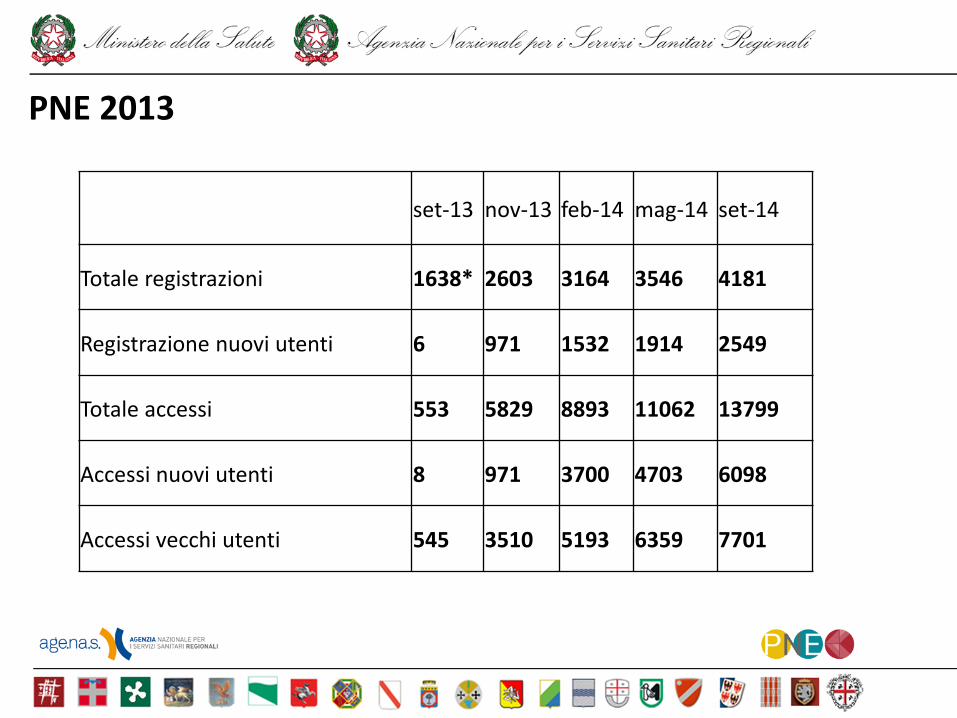
set-13 nov-13 feb-14 mag-14 set-14
Totale registrazioni 1638* 2603 3164 3546 4181
Registrazione nuovi utenti 6 971 1532 1914 2549
Totale accessi 553 5829 8893 11062 13799
Accessi nuovi utenti 8 971 3700 4703 6098
Accessi vecchi utenti 545 3510 5193 6359 7701
PNE 2013
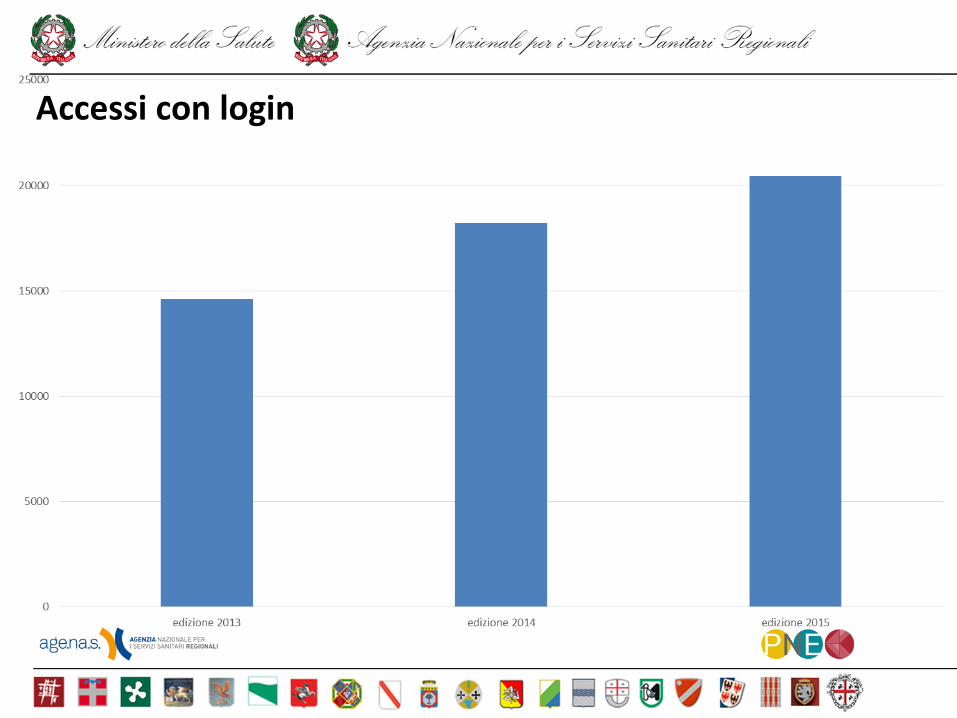
Accessi con login
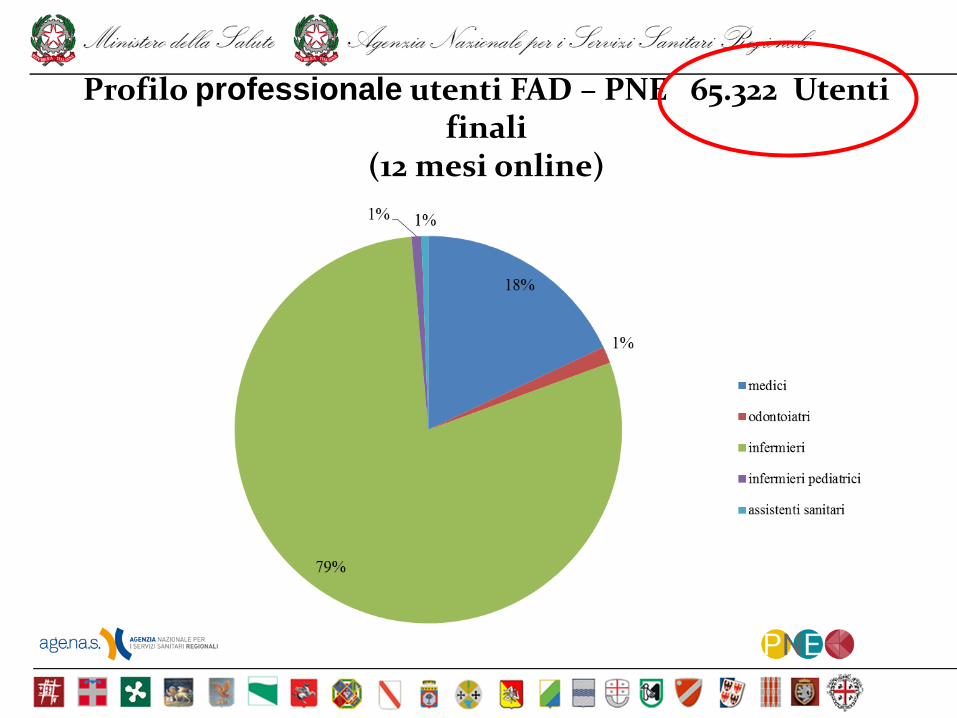
Profilo professionale utenti FAD – PNE 65.322 Utenti finali
(12 mesi online)
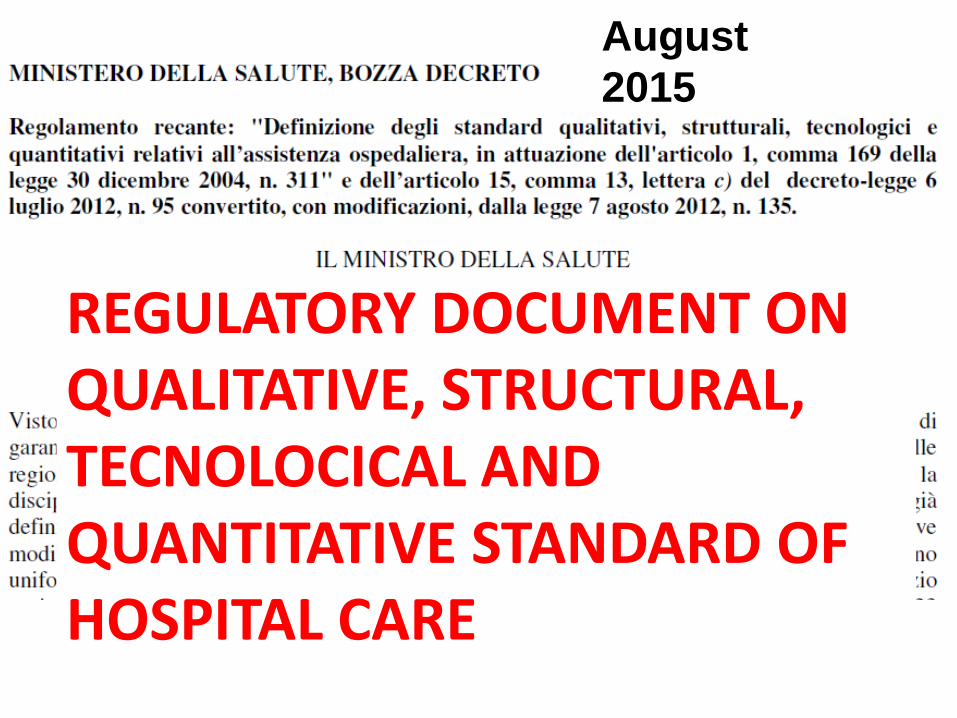
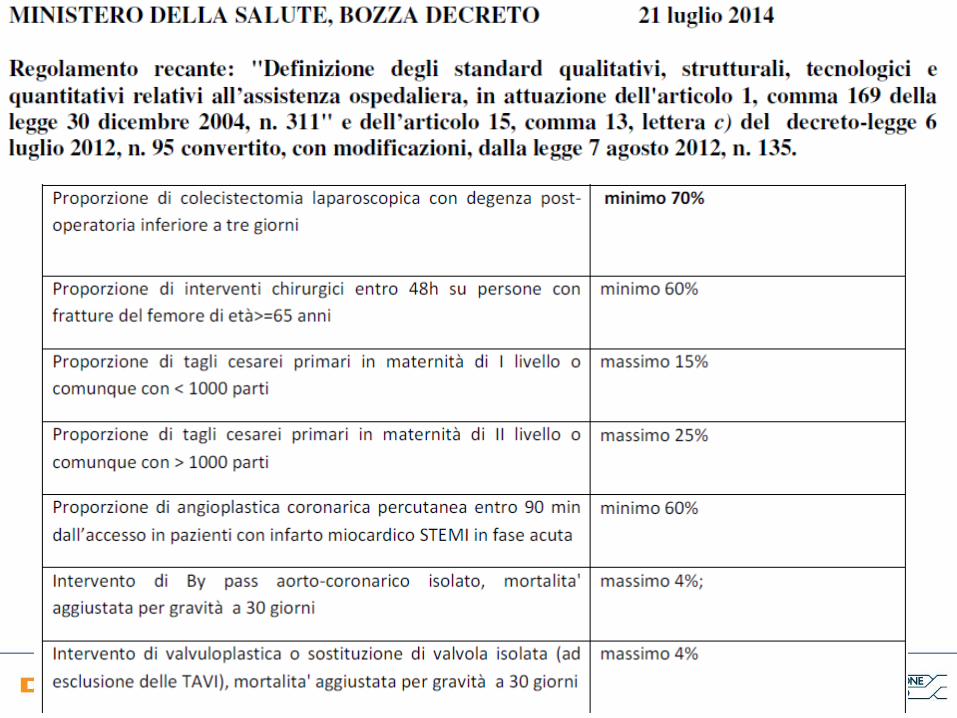
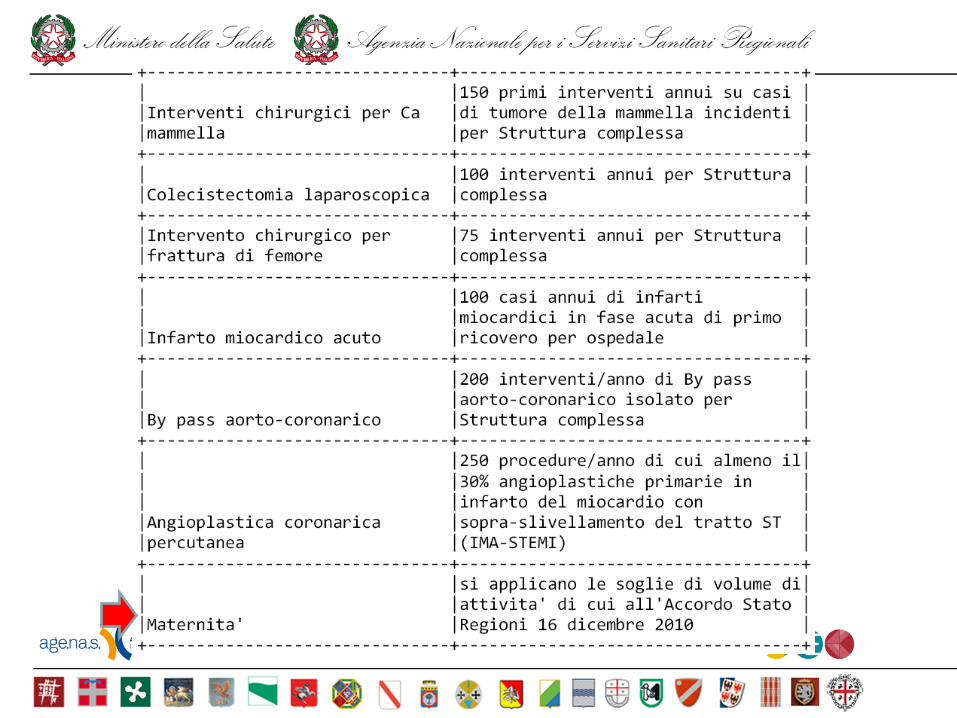
REGULATORY DOCUMENT ON QUALITATIVE, STRUCTURAL, TECNOLOCICAL AND QUANTITATIVE STANDARD OF HOSPITAL CARE
August
2015
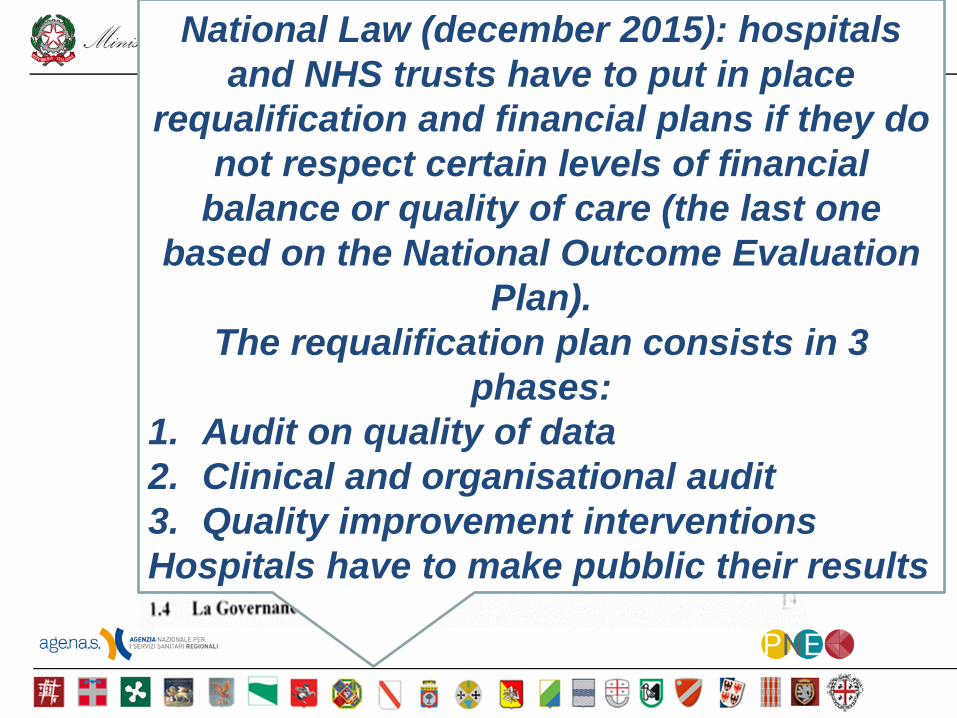
National Law (december 2015): hospitals
and NHS trusts have to put in place
requalification and financial plans if they do
not respect certain levels of financial
balance or quality of care (the last one
based on the National Outcome Evaluation
Plan).
The requalification plan consists in 3
phases:
1. Audit on quality of data
2. Clinical and organisational audit
3. Quality improvement interventions
Hospitals have to make pubblic their results
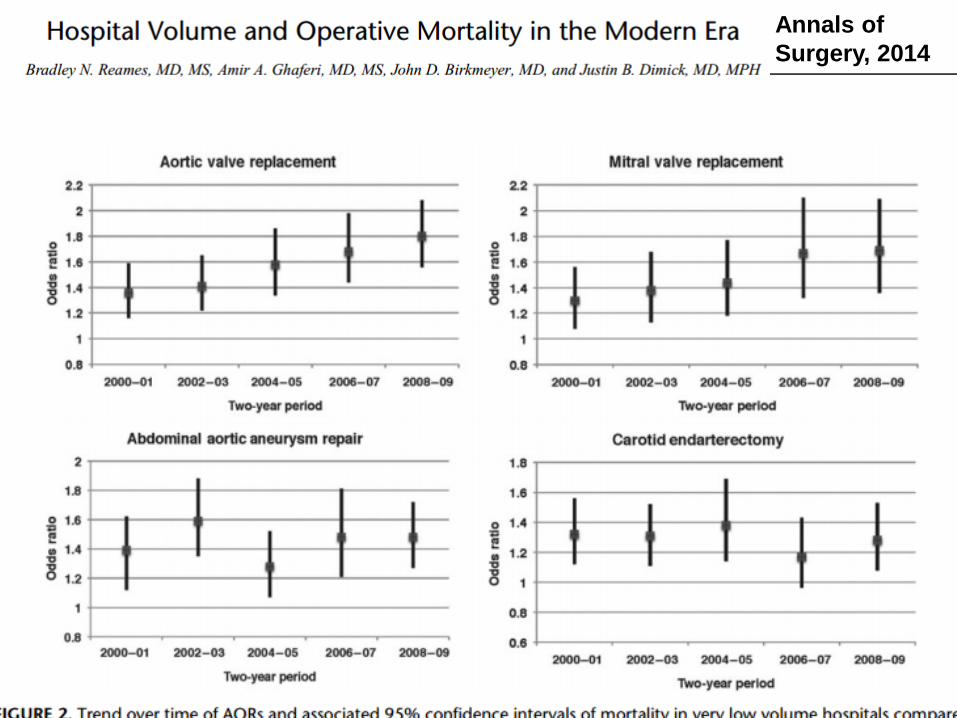
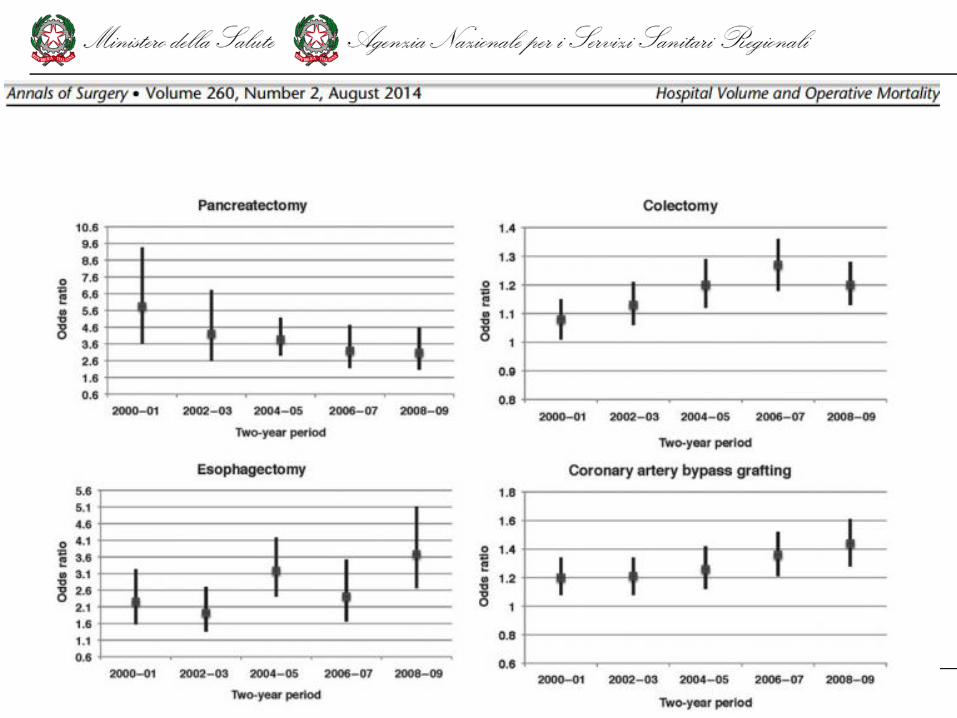
Annals of
Surgery, 2014
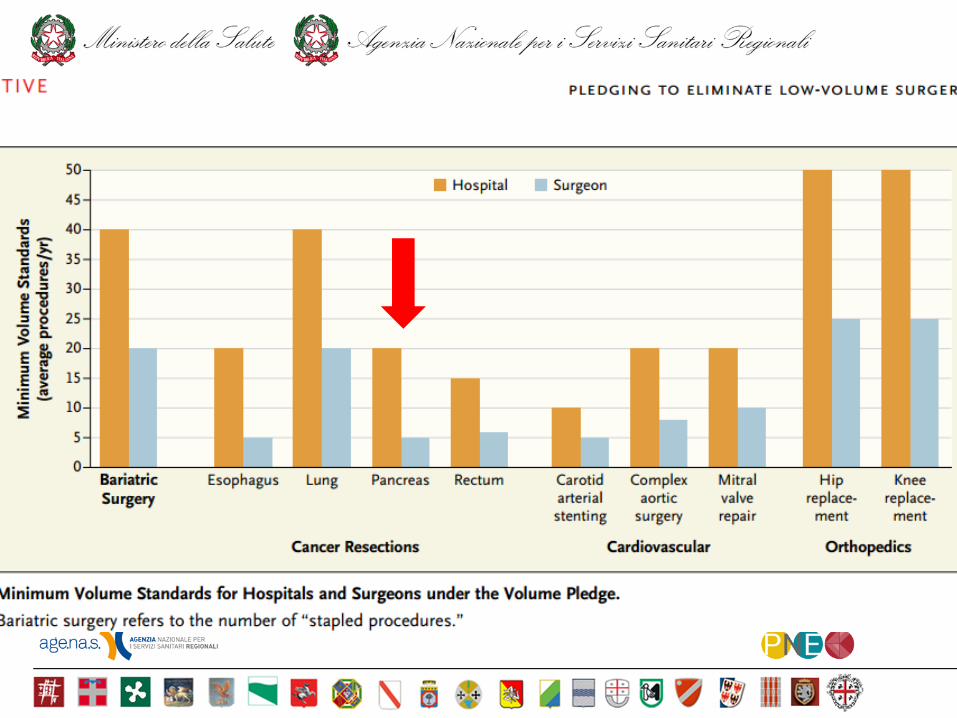
On May 18, 2015, leaders at three hospital systems —
Dartmouth–Hitchcock Medical Center, the Johns Hopkins
Hospital and Health System, and the University of
Michigan Health System — publicly announced a ―Take
the Volume Pledge‖ campaign to prevent
certain surgical procedures from being performed by their
surgeons who perform relatively few of them or at their
hospitals where relatively few such procedures are
performed.
n engl j med 373;15 nejm.org october 8, 2015
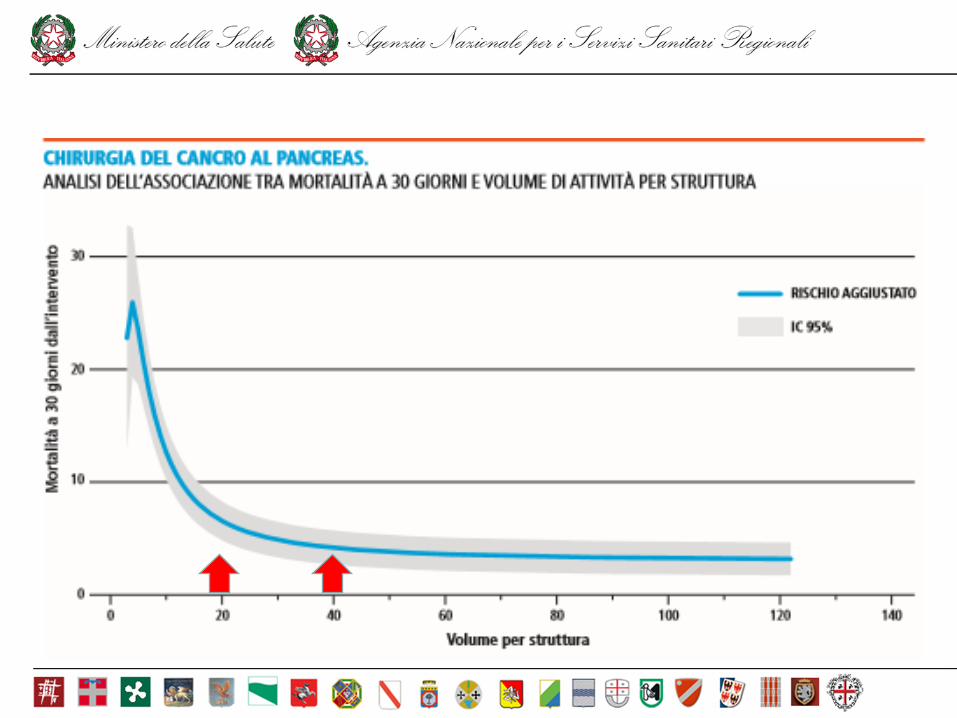
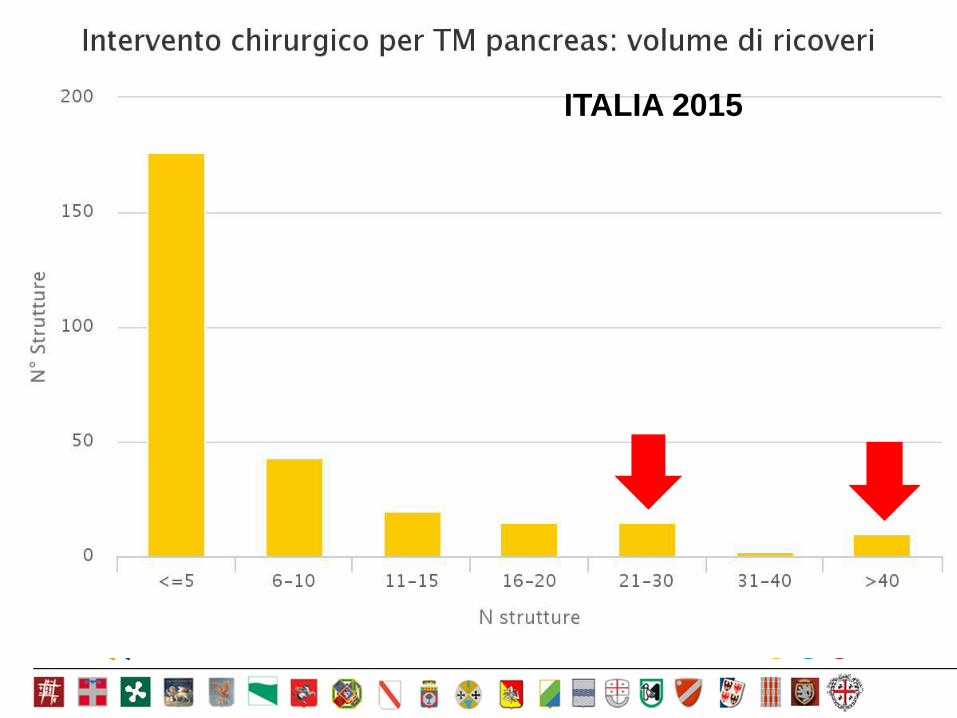
ITALIA 2015
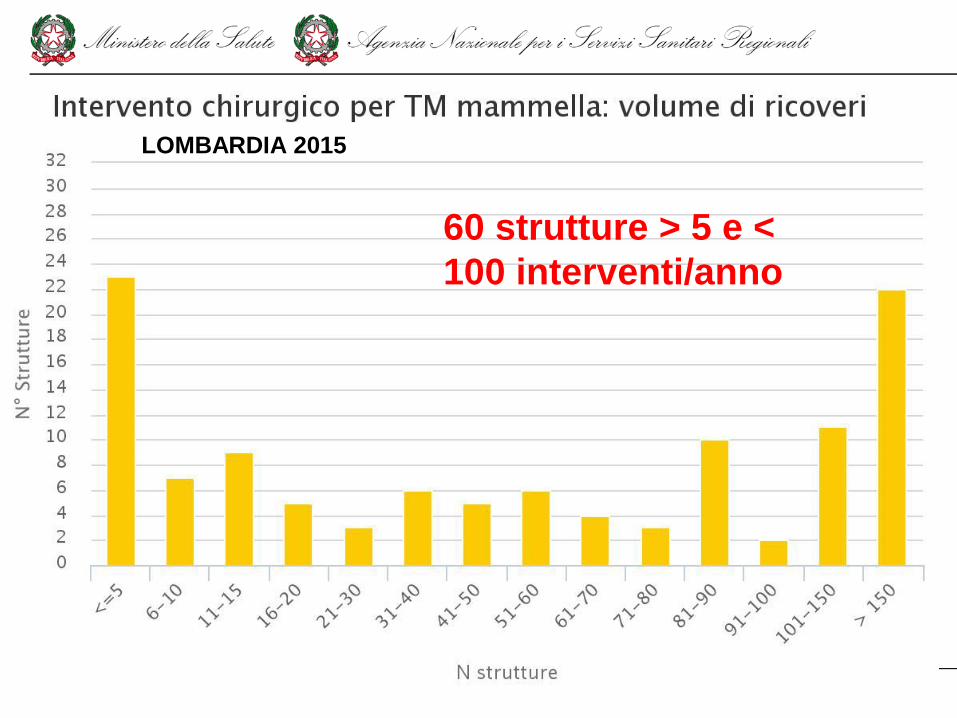
60 strutture > 5 e <
100 interventi/anno
LOMBARDIA 2015

Web site
www.cineca.it 31
Outcome measures by Hospital/
Local Health Unit
Audit tools
Report Card by Hospital/
Local Health Unit
ER Information System
Pilot studies
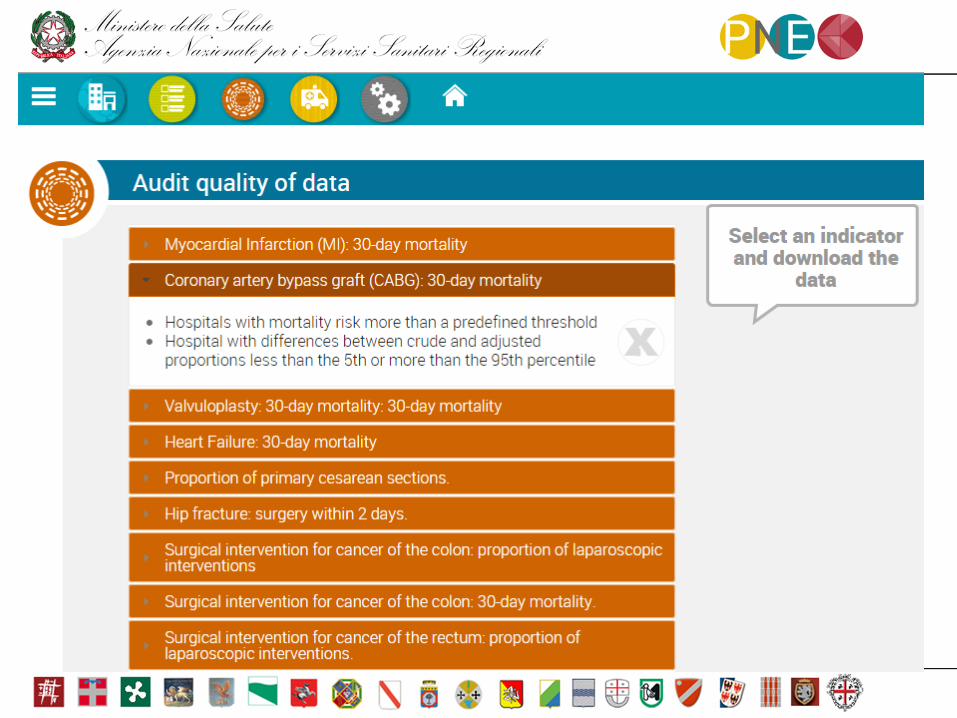
AUDIT TOOLS
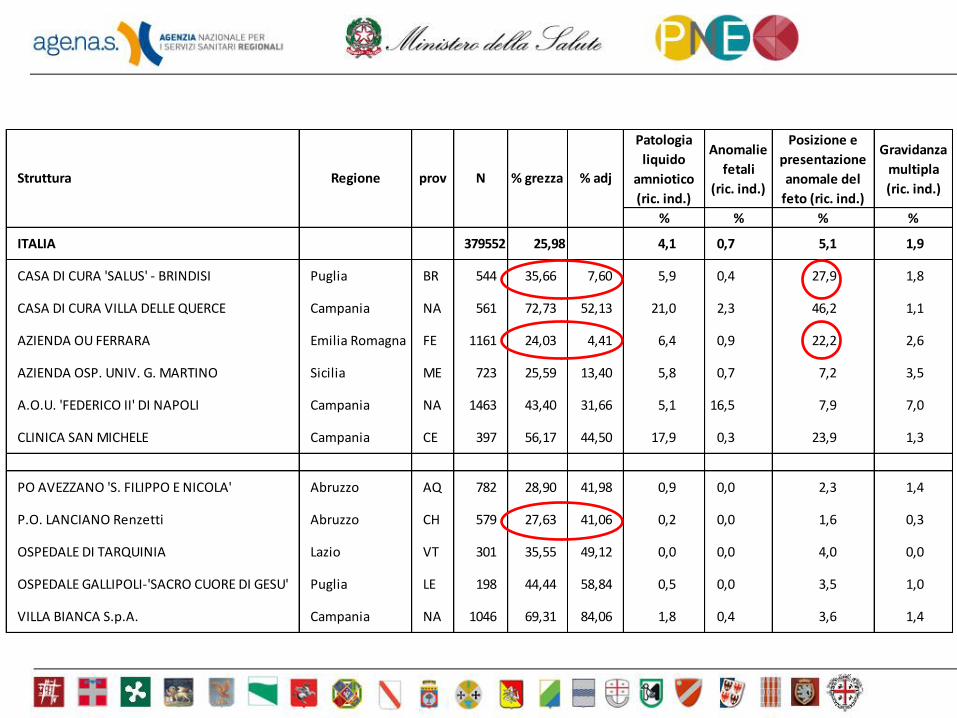
Patologia
liquido
amniotico
(ric. ind.)
Anomalie
fetali
(ric. ind.)
Posizione e
presentazione
anomale del
feto (ric. ind.)
Gravidanza
multipla
(ric. ind.)
% % % %
ITALIA 379552 25,98 4,1 0,7 5,1 1,9
CASA DI CURA 'SALUS' - BRINDISI Puglia BR 544 35,66 7,60 5,9 0,4 27,9 1,8
CASA DI CURA VILLA DELLE QUERCE Campania NA 561 72,73 52,13 21,0 2,3 46,2 1,1
AZIENDA OU FERRARA Emilia Romagna FE 1161 24,03 4,41 6,4 0,9 22,2 2,6
AZIENDA OSP. UNIV. G. MARTINO Sicilia ME 723 25,59 13,40 5,8 0,7 7,2 3,5
A.O.U. 'FEDERICO II' DI NAPOLI Campania NA 1463 43,40 31,66 5,1 16,5 7,9 7,0
CLINICA SAN MICHELE Campania CE 397 56,17 44,50 17,9 0,3 23,9 1,3
PO AVEZZANO 'S. FILIPPO E NICOLA' Abruzzo AQ 782 28,90 41,98 0,9 0,0 2,3 1,4
P.O. LANCIANO Renzetti Abruzzo CH 579 27,63 41,06 0,2 0,0 1,6 0,3
OSPEDALE DI TARQUINIA Lazio VT 301 35,55 49,12 0,0 0,0 4,0 0,0
OSPEDALE GALLIPOLI-'SACRO CUORE DI GESU' Puglia LE 198 44,44 58,84 0,5 0,0 3,5 1,0
VILLA BIANCA S.p.A. Campania NA 1046 69,31 84,06 1,8 0,4 3,6 1,4
Struttura Regione prov N % grezza % adj
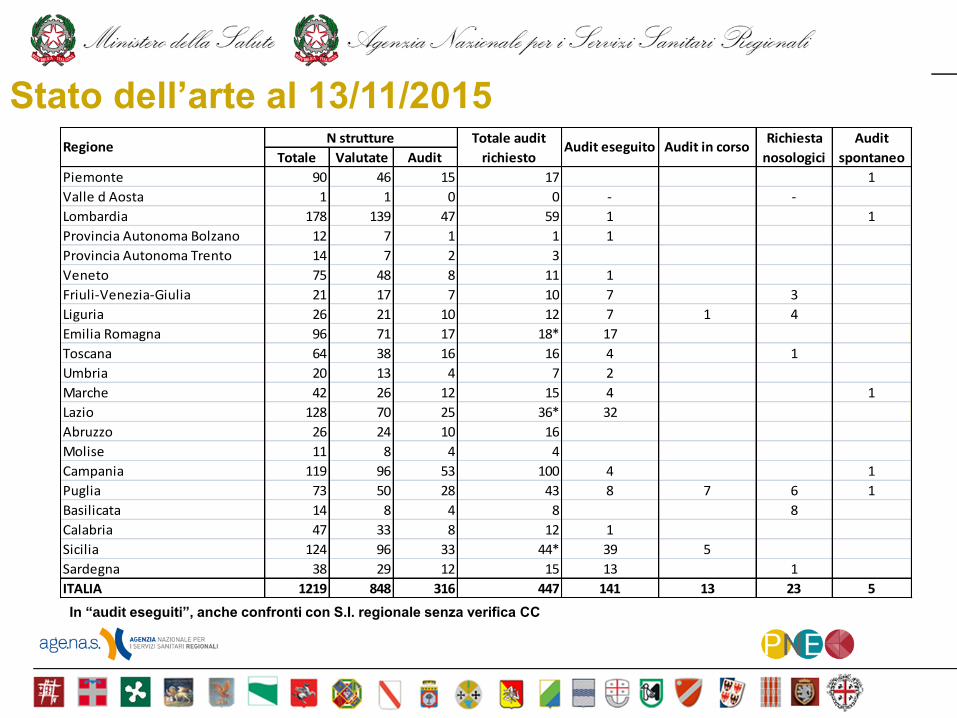
Stato dell’arte al 13/11/2015
Totale Valutate Audit
Piemonte 90 46 15 17 1
Valle d Aosta 1 1 0 0 - -
Lombardia 178 139 47 59 1 1
Provincia Autonoma Bolzano 12 7 1 1 1
Provincia Autonoma Trento 14 7 2 3
Veneto 75 48 8 11 1
Friuli-Venezia-Giulia 21 17 7 10 7 3
Liguria 26 21 10 12 7 1 4
Emilia Romagna 96 71 17 18* 17
Toscana 64 38 16 16 4 1
Umbria 20 13 4 7 2
Marche 42 26 12 15 4 1
Lazio 128 70 25 36* 32
Abruzzo 26 24 10 16
Molise 11 8 4 4
Campania 119 96 53 100 4 1
Puglia 73 50 28 43 8 7 6 1
Basilicata 14 8 4 8 8
Calabria 47 33 8 12 1
Sicilia 124 96 33 44* 39 5
Sardegna 38 29 12 15 13 1
ITALIA 1219 848 316 447 141 13 23 5
RegioneN strutture Totale audit
richiestoAudit eseguito
Richiesta
nosologici
Audit
spontaneoAudit in corso
In ―audit eseguiti‖, anche confronti con S.I. regionale senza verifica CC
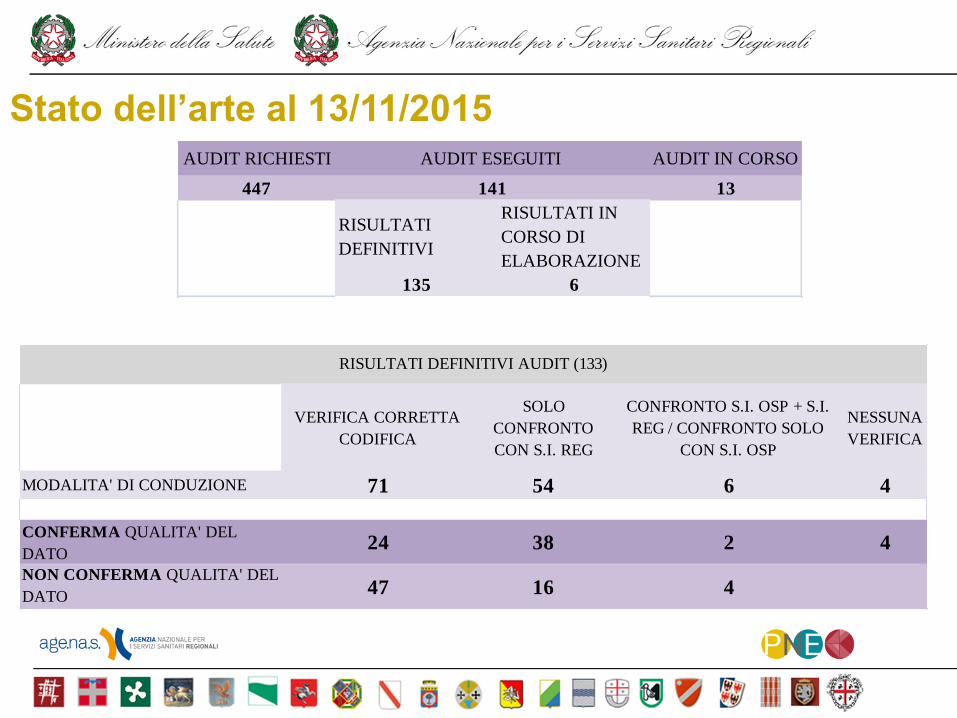
Stato dell’arte al 13/11/2015 AUDIT RICHIESTI AUDIT IN CORSO
447 13
RISULTATI
DEFINITIVI
RISULTATI IN
CORSO DI
ELABORAZIONE
135 6
AUDIT ESEGUITI
141
VERIFICA CORRETTA
CODIFICA
SOLO
CONFRONTO
CON S.I. REG
CONFRONTO S.I. OSP + S.I.
REG / CONFRONTO SOLO
CON S.I. OSP
NESSUNA
VERIFICA
MODALITA' DI CONDUZIONE 71 54 6 4
CONFERMA QUALITA' DEL
DATO24 38 2 4
NON CONFERMA QUALITA' DEL
DATO47 16 4
RISULTATI DEFINITIVI AUDIT (133)
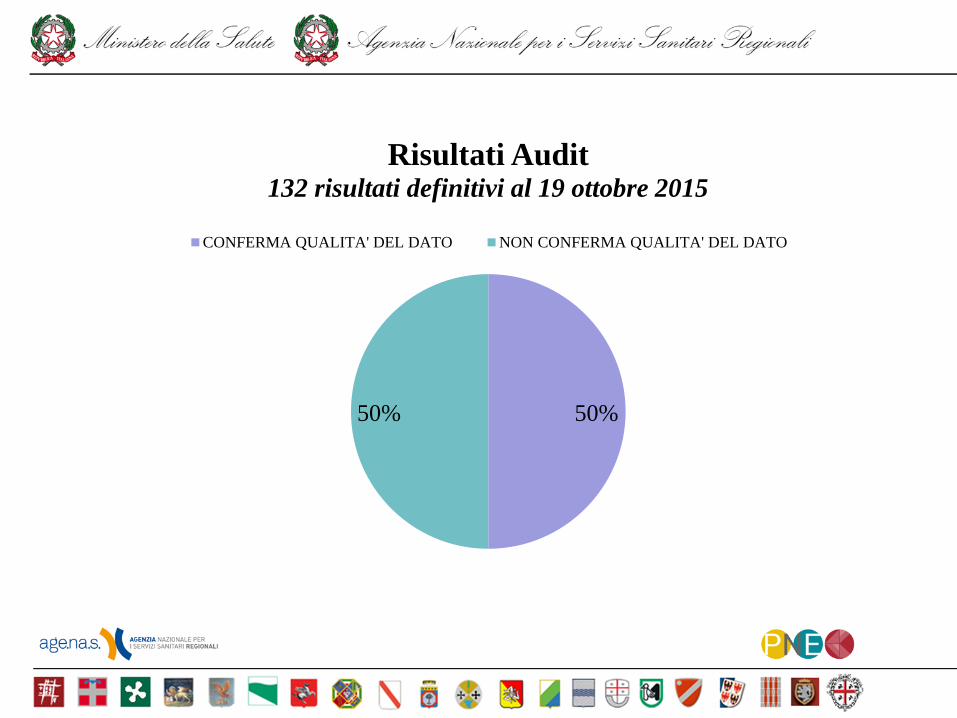
50% 50%
Risultati Audit 132 risultati definitivi al 19 ottobre 2015
CONFERMA QUALITA' DEL DATO NON CONFERMA QUALITA' DEL DATO
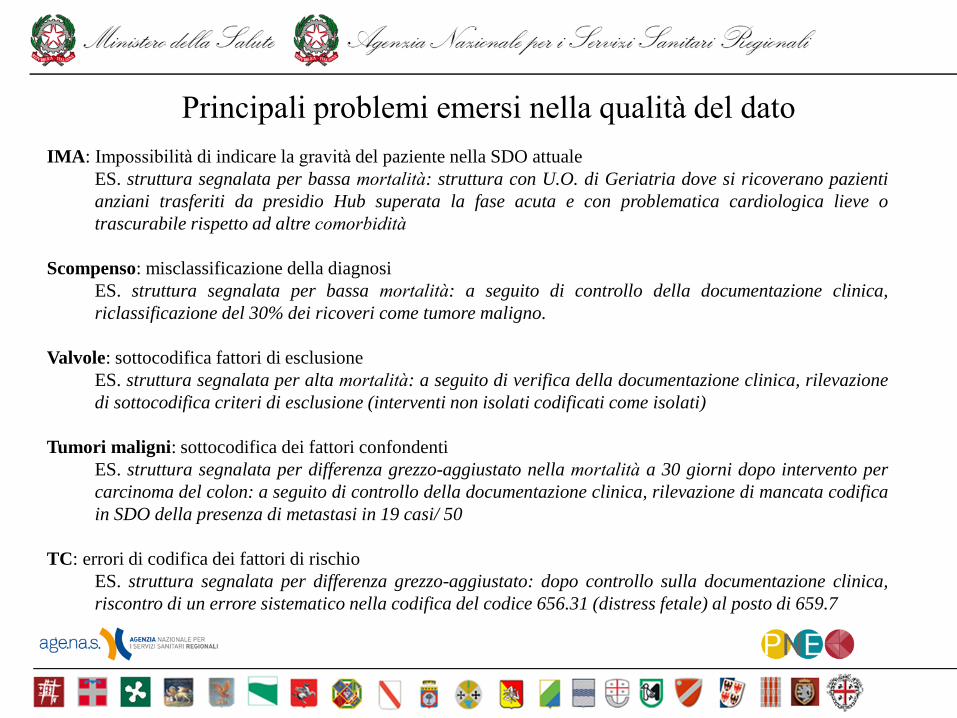
IMA: Impossibilità di indicare la gravità del paziente nella SDO attuale
ES. struttura segnalata per bassa mortalità: struttura con U.O. di Geriatria dove si ricoverano pazienti
anziani trasferiti da presidio Hub superata la fase acuta e con problematica cardiologica lieve o
trascurabile rispetto ad altre comorbidità
Scompenso: misclassificazione della diagnosi
ES. struttura segnalata per bassa mortalità: a seguito di controllo della documentazione clinica,
riclassificazione del 30% dei ricoveri come tumore maligno.
Valvole: sottocodifica fattori di esclusione
ES. struttura segnalata per alta mortalità: a seguito di verifica della documentazione clinica, rilevazione
di sottocodifica criteri di esclusione (interventi non isolati codificati come isolati)
Tumori maligni: sottocodifica dei fattori confondenti
ES. struttura segnalata per differenza grezzo-aggiustato nella mortalità a 30 giorni dopo intervento per
carcinoma del colon: a seguito di controllo della documentazione clinica, rilevazione di mancata codifica
in SDO della presenza di metastasi in 19 casi/ 50
TC: errori di codifica dei fattori di rischio
ES. struttura segnalata per differenza grezzo-aggiustato: dopo controllo sulla documentazione clinica,
riscontro di un errore sistematico nella codifica del codice 656.31 (distress fetale) al posto di 659.7
Principali problemi emersi nella qualità del dato
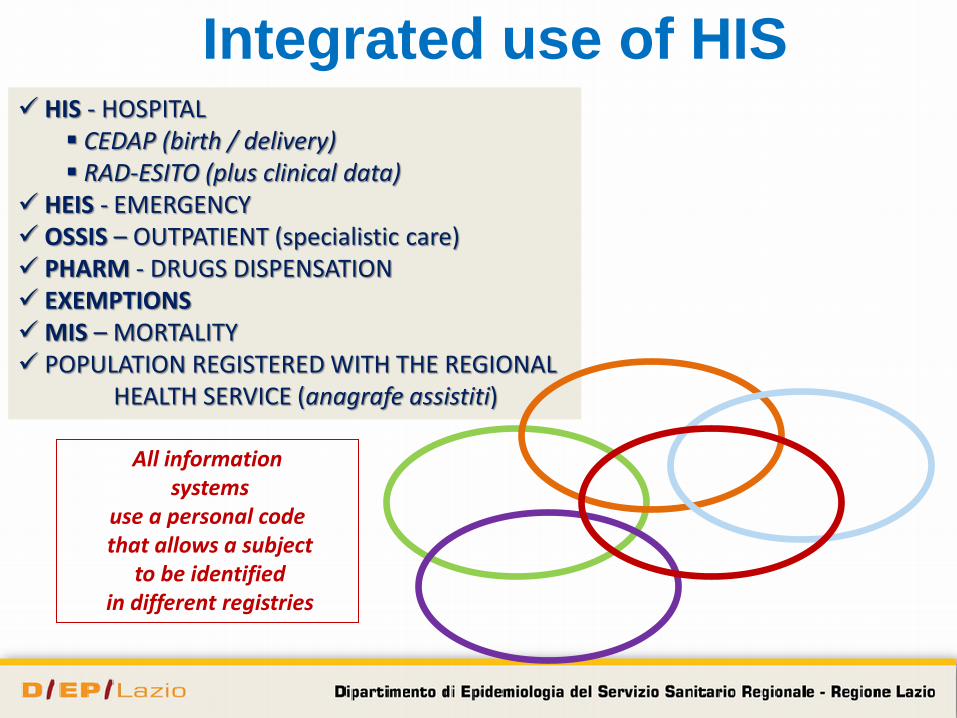
Integrated use of HIS HIS - HOSPITAL
CEDAP (birth / delivery) RAD-ESITO (plus clinical data)
HEIS - EMERGENCY OSSIS – OUTPATIENT (specialistic care) PHARM - DRUGS DISPENSATION EXEMPTIONS MIS – MORTALITY POPULATION REGISTERED WITH THE REGIONAL HEALTH SERVICE (anagrafe assistiti)
All information systems
use a personal code that allows a subject
to be identified in different registries
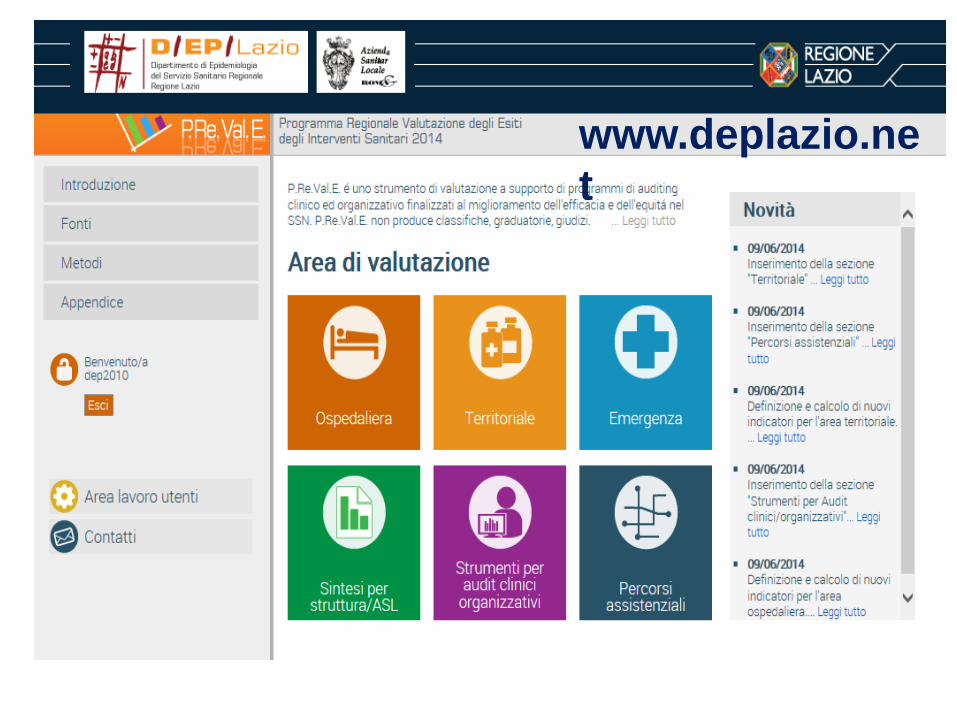
www.deplazio.ne
t
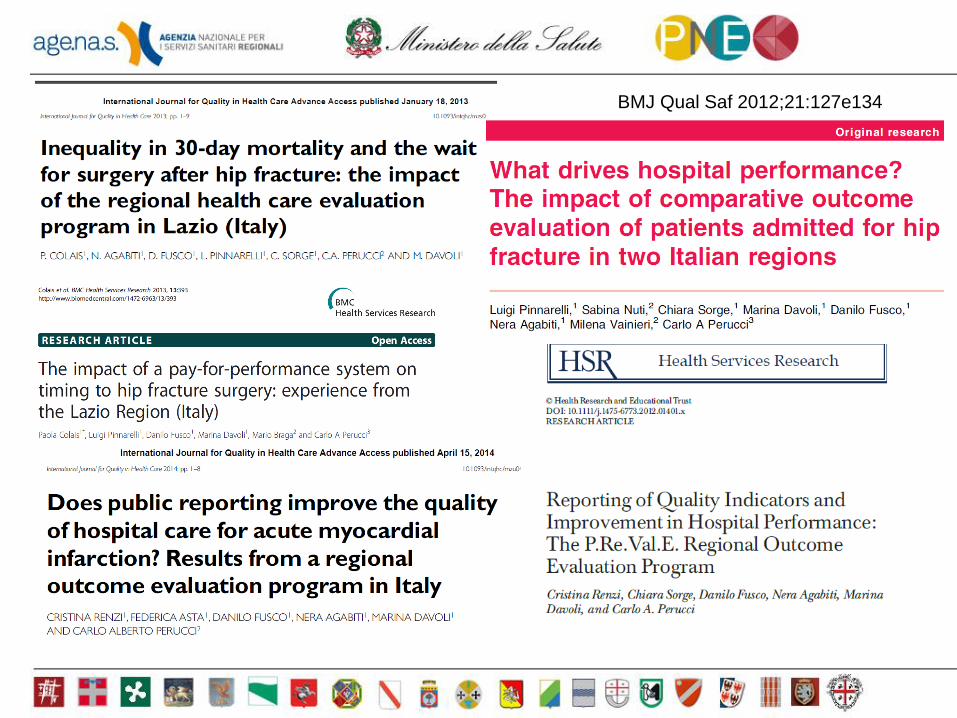
BMJ Qual Saf 2012;21:127e134
Outcome measures by Hospital/
Local Health Unit
Audit tools
Report Card by Hospital/
Local Health Unit
ER Information System
Pilot studies
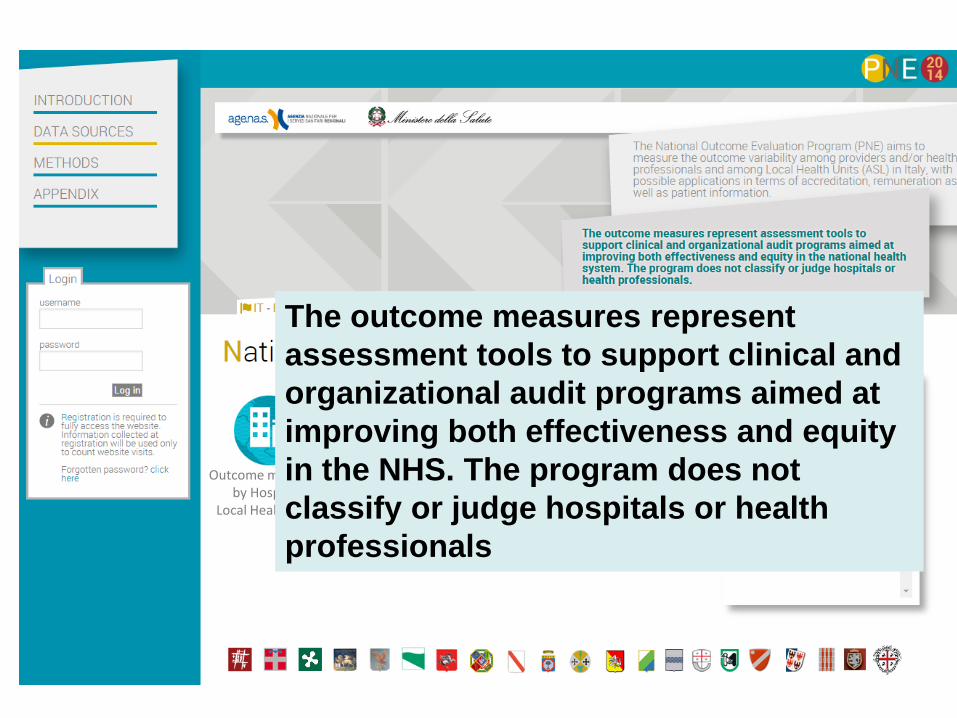
The outcome measures represent
assessment tools to support clinical and
organizational audit programs aimed at
improving both effectiveness and equity
in the NHS. The program does not
classify or judge hospitals or health
professionals
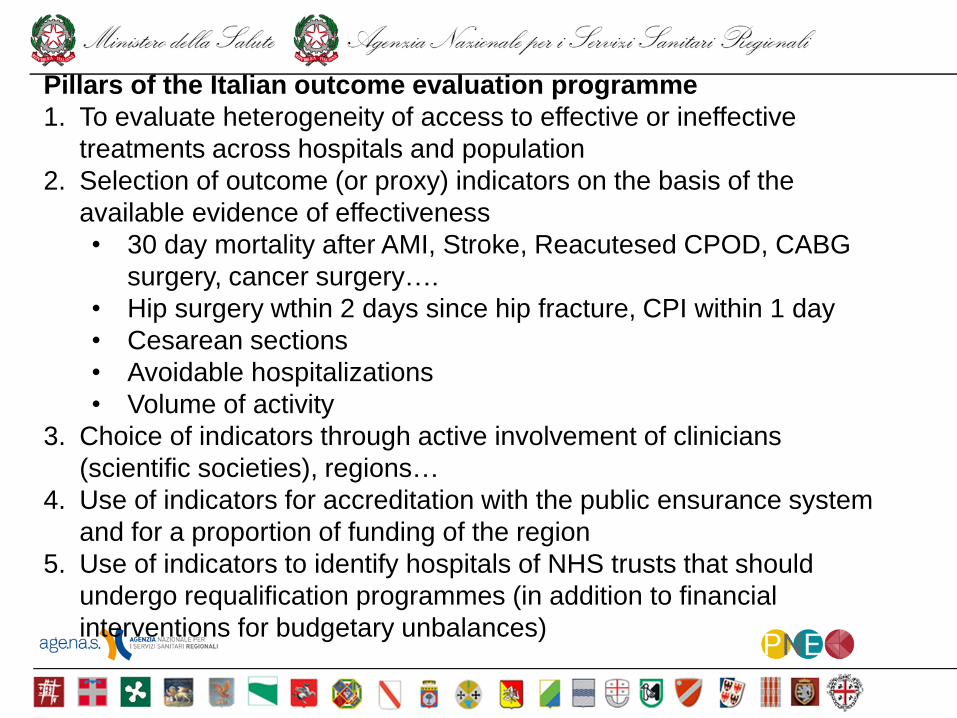
Pillars of the Italian outcome evaluation programme
1. To evaluate heterogeneity of access to effective or ineffective
treatments across hospitals and population
2. Selection of outcome (or proxy) indicators on the basis of the
available evidence of effectiveness
• 30 day mortality after AMI, Stroke, Reacutesed CPOD, CABG
surgery, cancer surgery….
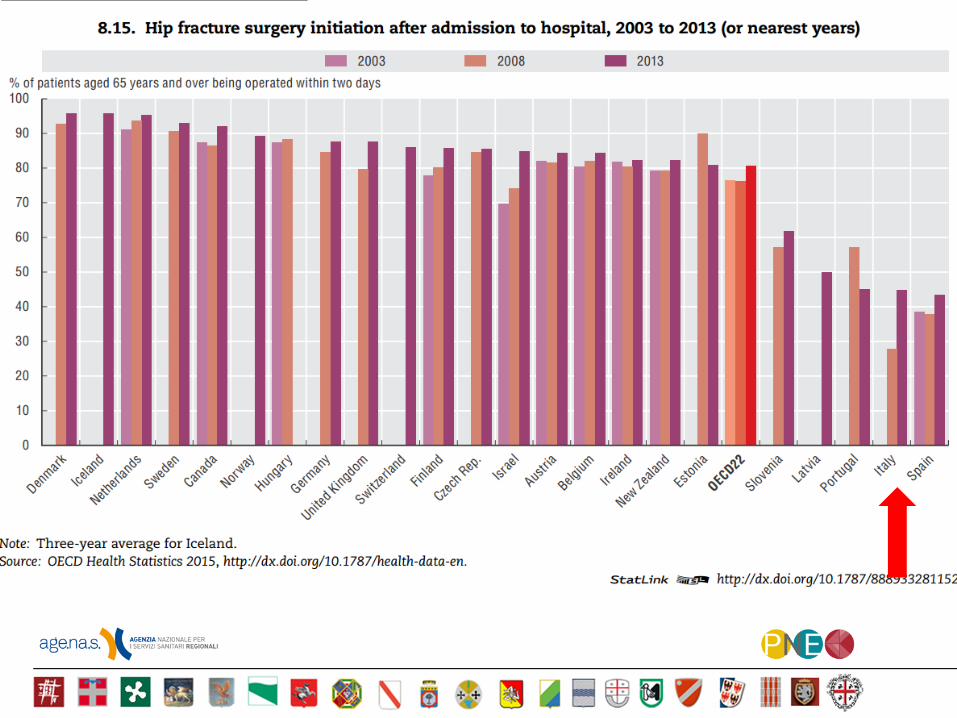
• Hip surgery wthin 2 days since hip fracture, CPI within 1 day
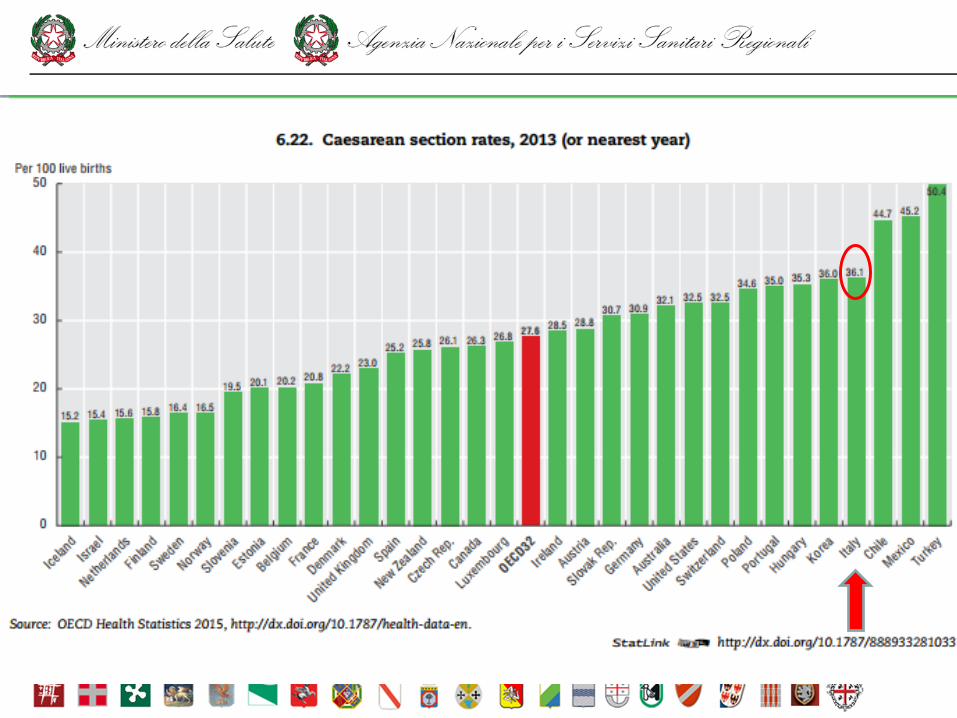
• Cesarean sections
• Avoidable hospitalizations
• Volume of activity
3. Choice of indicators through active involvement of clinicians
(scientific societies), regions…
4. Use of indicators for accreditation with the public ensurance system
and for a proportion of funding of the region
5. Use of indicators to identify hospitals of NHS trusts that should
undergo requalification programmes (in addition to financial
interventions for budgetary unbalances)
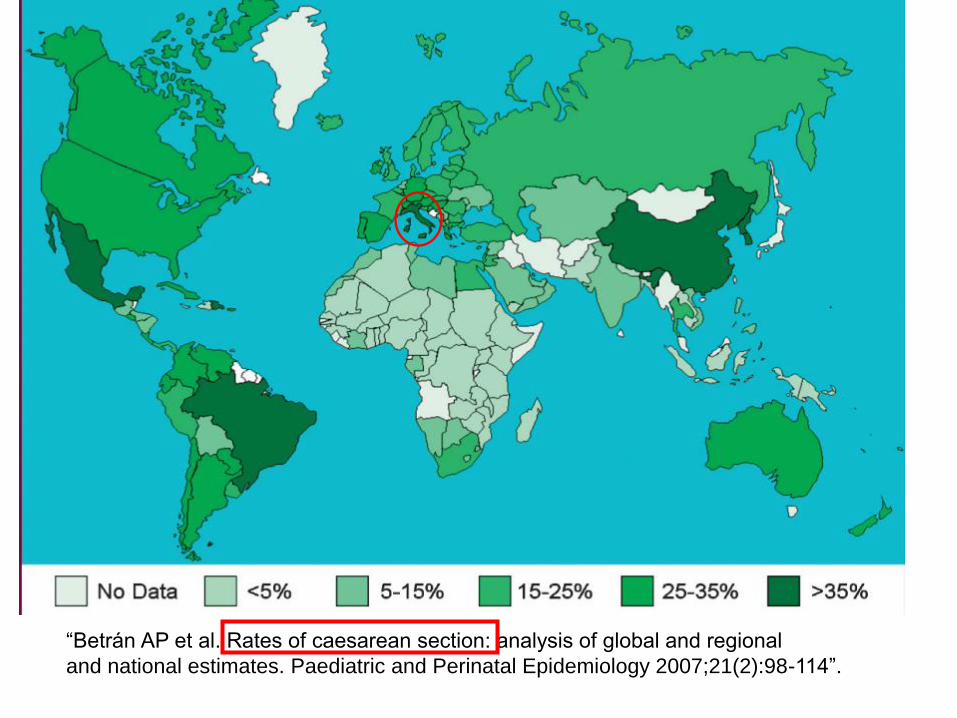
“Betrán AP et al. Rates of caesarean section: analysis of global and regional
and national estimates. Paediatric and Perinatal Epidemiology 2007;21(2):98-114”.
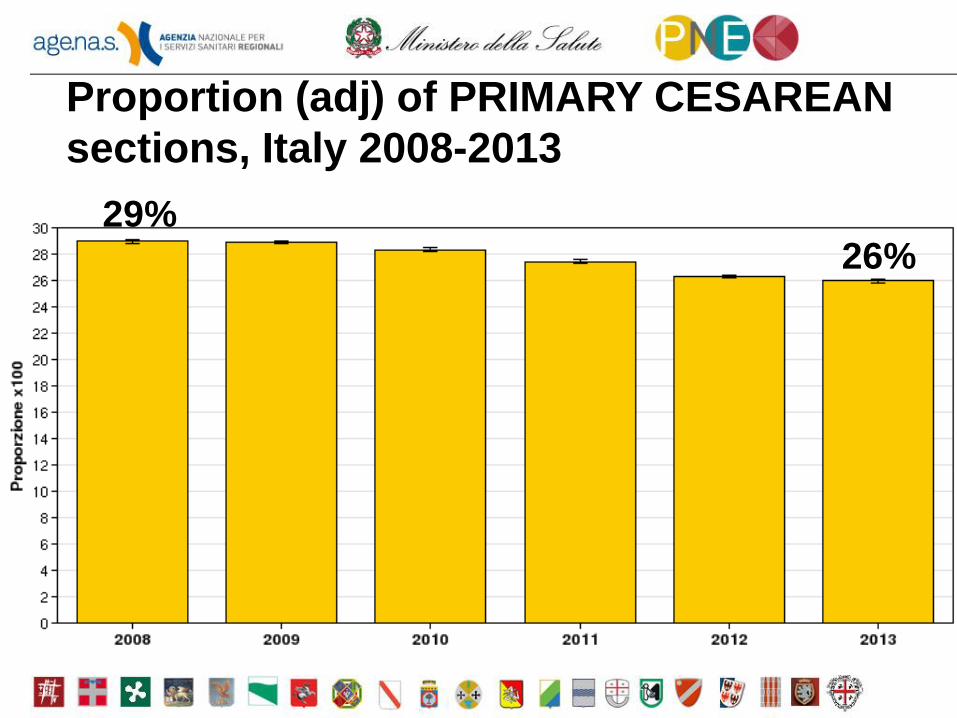
Proportion (adj) of PRIMARY CESAREAN
sections, Italy 2008-2013
29% 26%
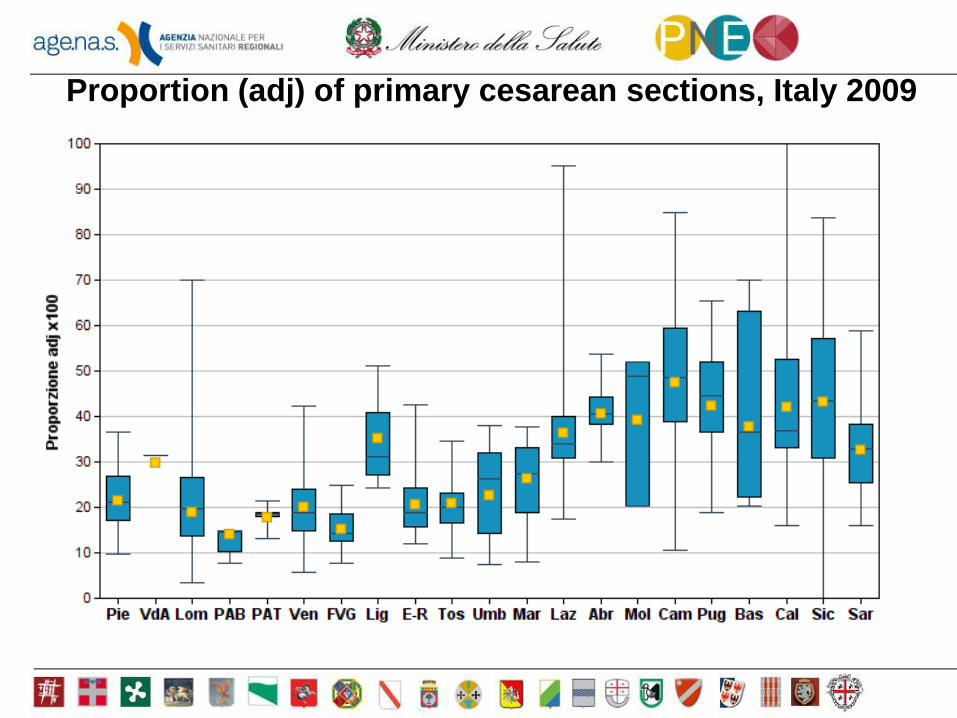
Proportion (adj) of primary cesarean sections, Italy 2009
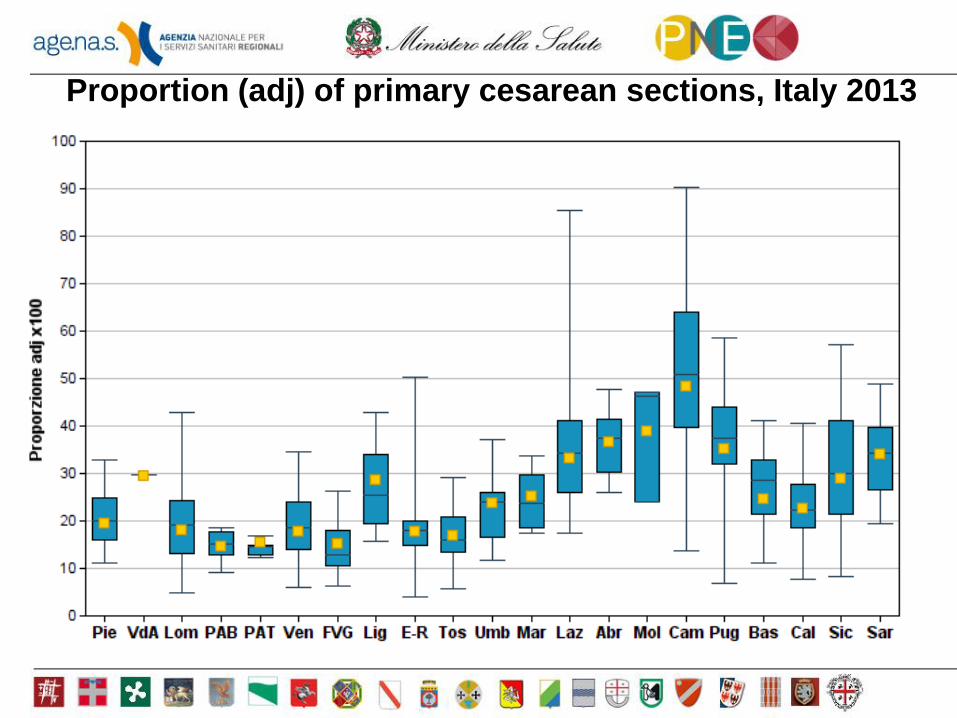
Proportion (adj) of primary cesarean sections, Italy 2013
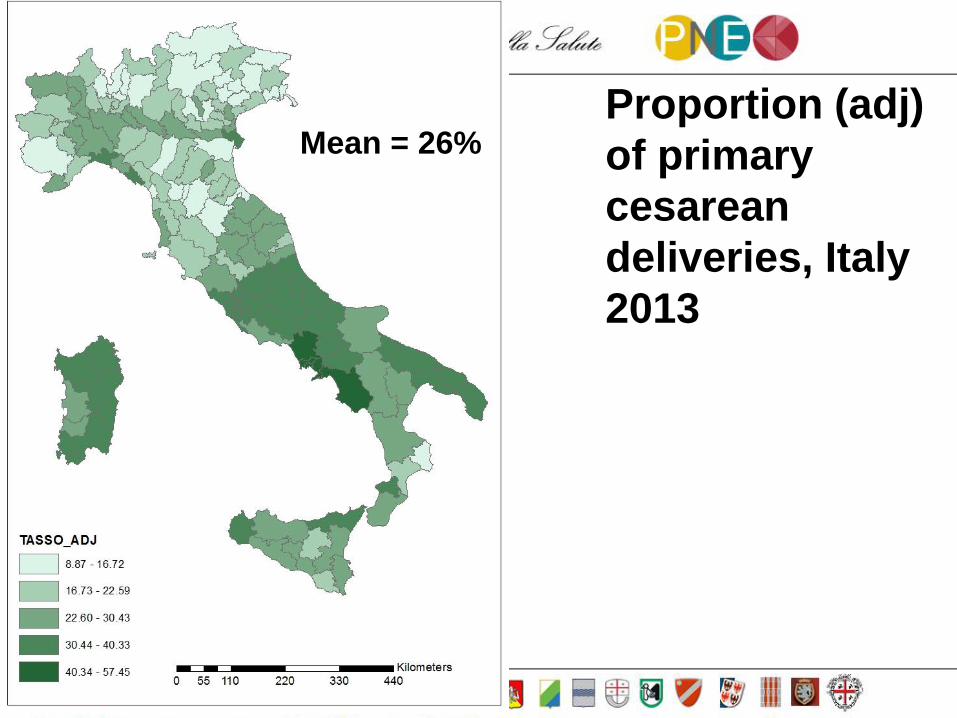
Proportion (adj)
of primary
cesarean
deliveries, Italy
2013
Mean = 26%
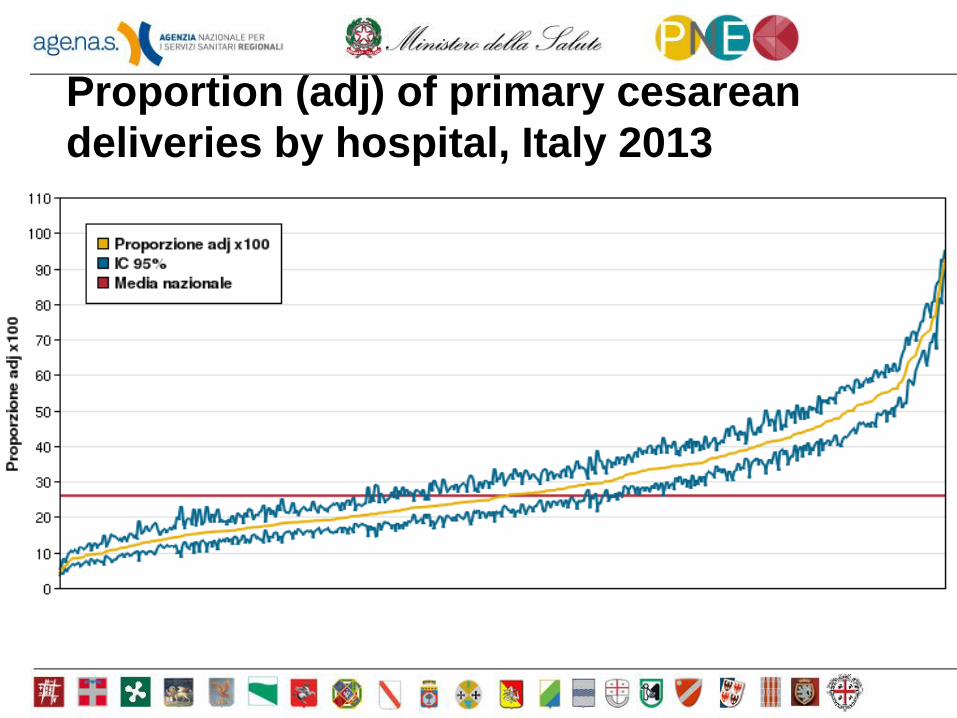
Proportion (adj) of primary cesarean
deliveries by hospital, Italy 2013
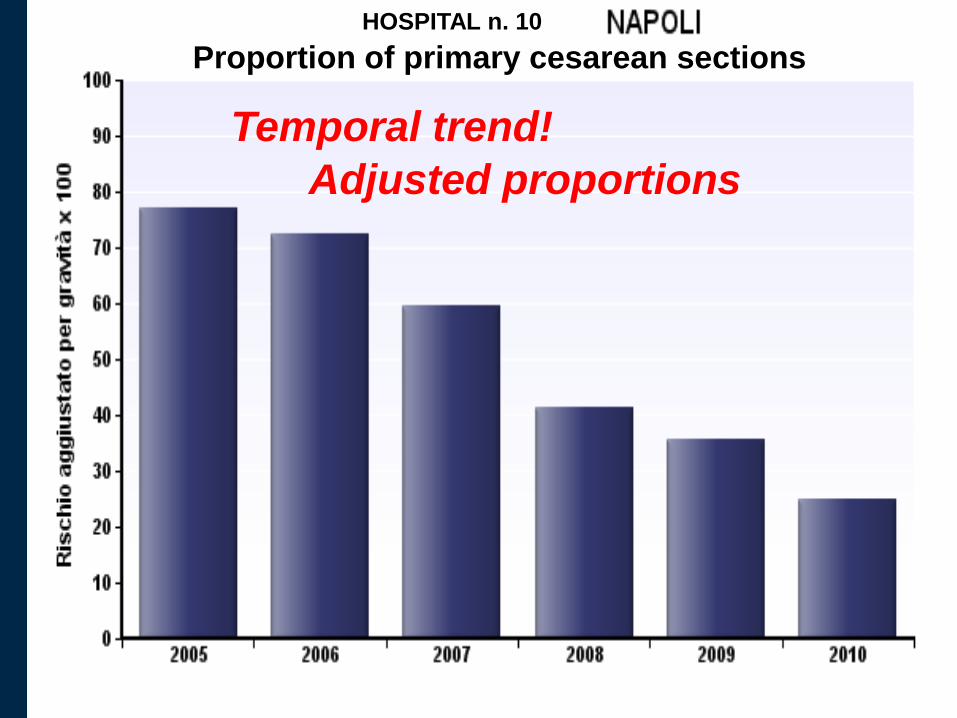
Adjusted proportions
Temporal trend!
Proportion of primary cesarean sections
HOSPITAL n. 10
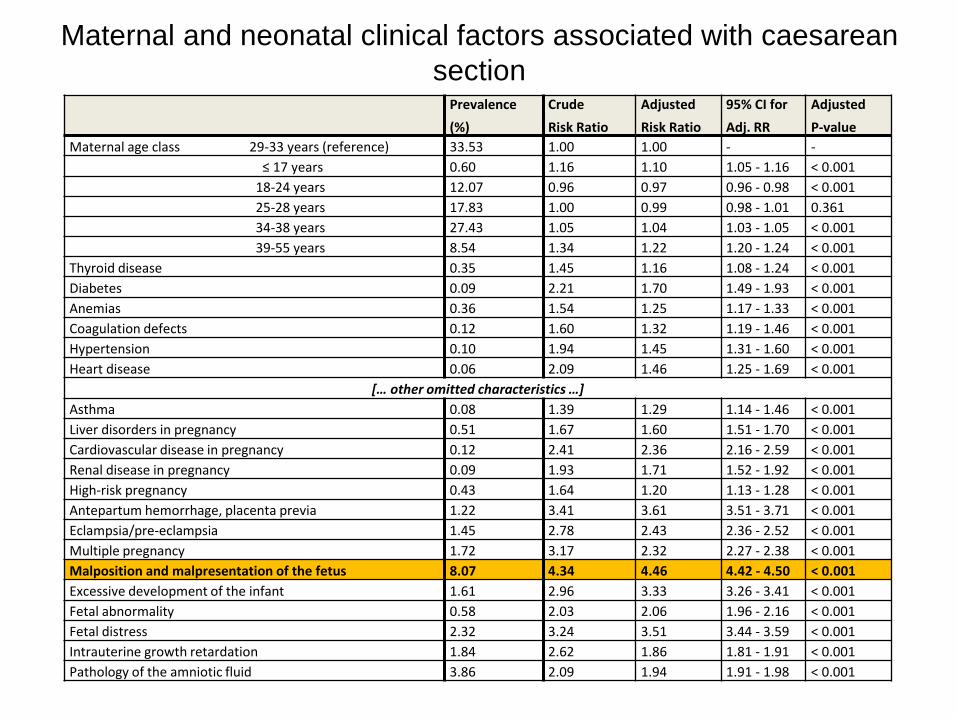
Prevalence
(%)
Crude
Risk Ratio
Adjusted
Risk Ratio
95% CI for
Adj. RR
Adjusted
P-value
Maternal age class 29-33 years (reference) 33.53 1.00 1.00 - -
≤ 17 years 0.60 1.16 1.10 1.05 - 1.16 < 0.001
18-24 years 12.07 0.96 0.97 0.96 - 0.98 < 0.001
25-28 years 17.83 1.00 0.99 0.98 - 1.01 0.361
34-38 years 27.43 1.05 1.04 1.03 - 1.05 < 0.001
39-55 years 8.54 1.34 1.22 1.20 - 1.24 < 0.001
Thyroid disease 0.35 1.45 1.16 1.08 - 1.24 < 0.001
Diabetes 0.09 2.21 1.70 1.49 - 1.93 < 0.001
Anemias 0.36 1.54 1.25 1.17 - 1.33 < 0.001
Coagulation defects 0.12 1.60 1.32 1.19 - 1.46 < 0.001
Hypertension 0.10 1.94 1.45 1.31 - 1.60 < 0.001
Heart disease 0.06 2.09 1.46 1.25 - 1.69 < 0.001
[… other omitted characteristics …]
Asthma 0.08 1.39 1.29 1.14 - 1.46 < 0.001
Liver disorders in pregnancy 0.51 1.67 1.60 1.51 - 1.70 < 0.001
Cardiovascular disease in pregnancy 0.12 2.41 2.36 2.16 - 2.59 < 0.001
Renal disease in pregnancy 0.09 1.93 1.71 1.52 - 1.92 < 0.001
High-risk pregnancy 0.43 1.64 1.20 1.13 - 1.28 < 0.001
Antepartum hemorrhage, placenta previa 1.22 3.41 3.61 3.51 - 3.71 < 0.001
Eclampsia/pre-eclampsia 1.45 2.78 2.43 2.36 - 2.52 < 0.001
Multiple pregnancy 1.72 3.17 2.32 2.27 - 2.38 < 0.001
Malposition and malpresentation of the fetus 8.07 4.34 4.46 4.42 - 4.50 < 0.001
Excessive development of the infant 1.61 2.96 3.33 3.26 - 3.41 < 0.001
Fetal abnormality 0.58 2.03 2.06 1.96 - 2.16 < 0.001
Fetal distress 2.32 3.24 3.51 3.44 - 3.59 < 0.001
Intrauterine growth retardation 1.84 2.62 1.86 1.81 - 1.91 < 0.001
Pathology of the amniotic fluid 3.86 2.09 1.94 1.91 - 1.98 < 0.001
Maternal and neonatal clinical factors associated with caesarean
section
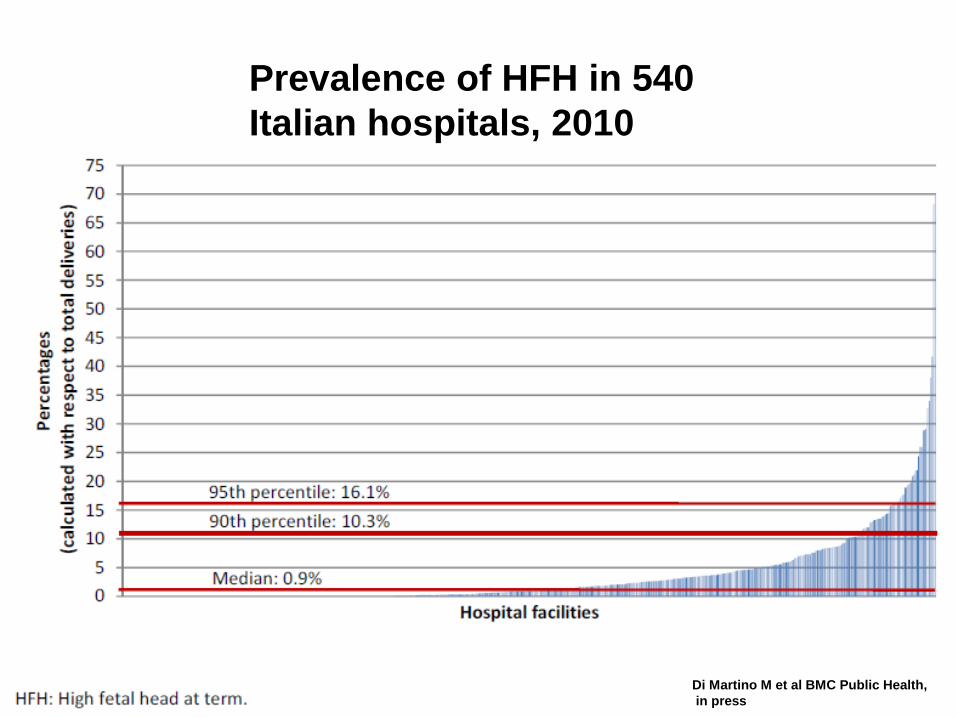
Di Martino M et al BMC Public Health,
in press
Prevalence of HFH in 540
Italian hospitals, 2010
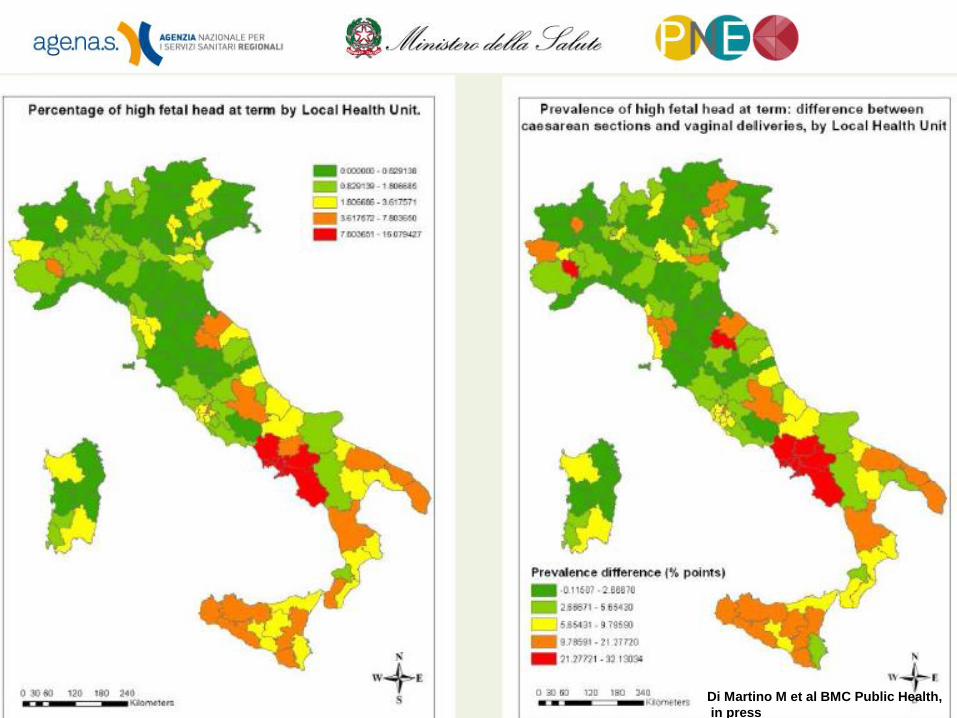
Di Martino M et al BMC Public Health,
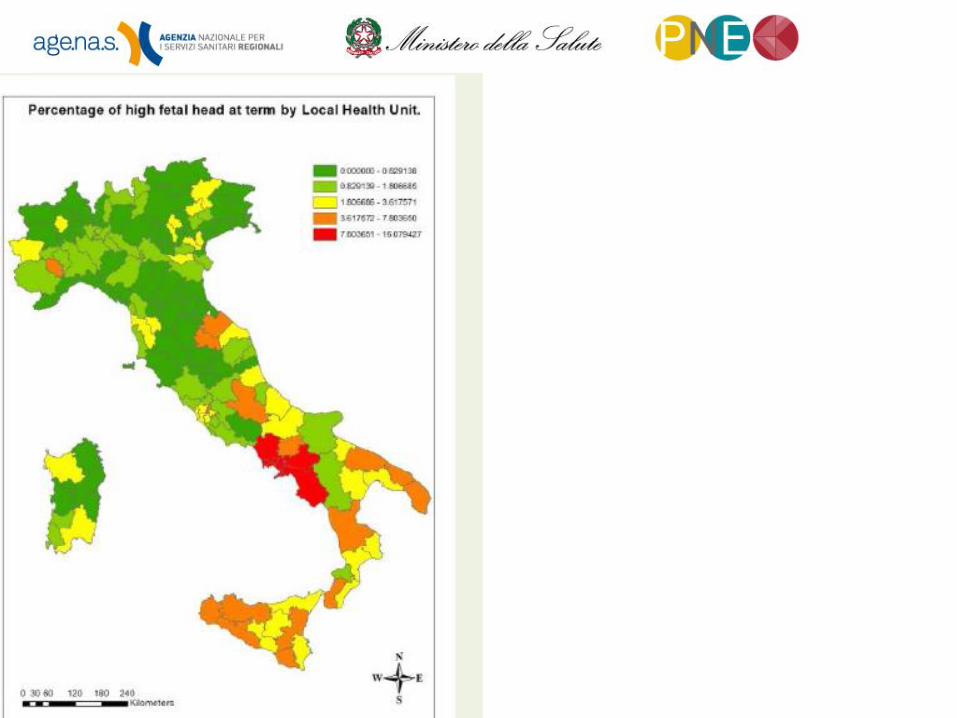
in press
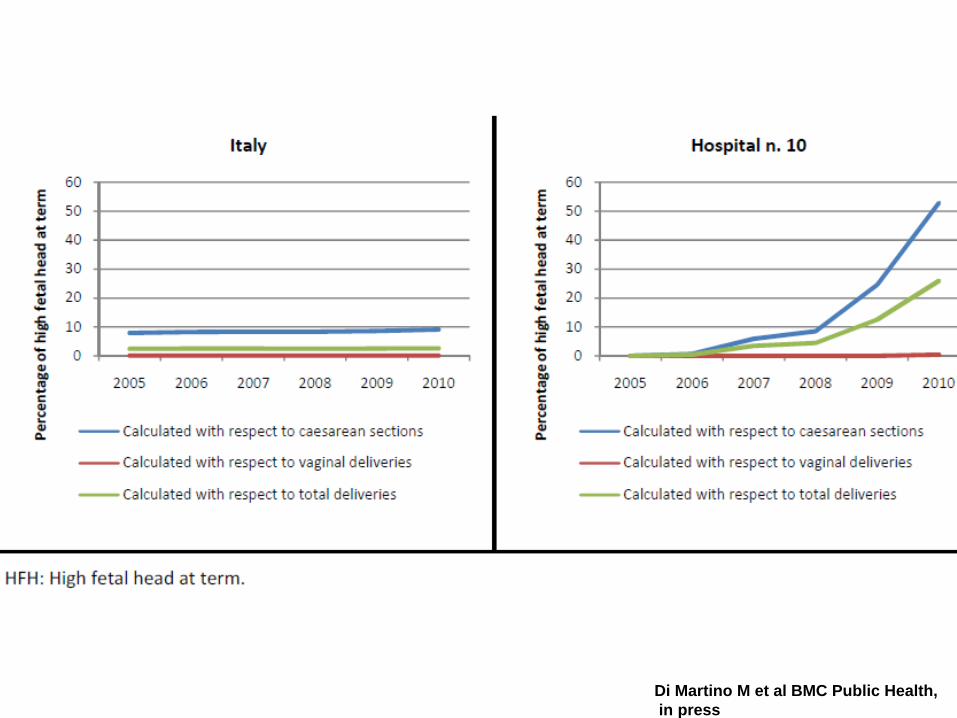
Di Martino M et al BMC Public Health,
in press

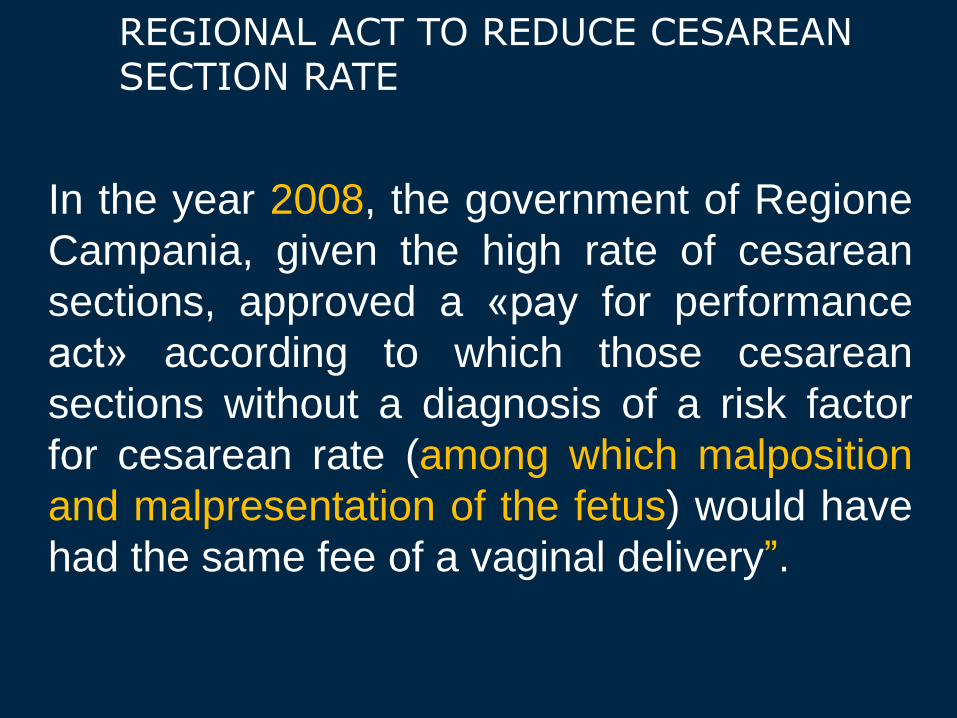
REGIONAL ACT TO REDUCE CESAREAN SECTION RATE
In the year 2008, the government of Regione
Campania, given the high rate of cesarean
sections, approved a «pay for performance
act» according to which those cesarean
sections without a diagnosis of a risk factor
for cesarean rate (among which malposition
and malpresentation of the fetus) would have
had the same fee of a vaginal delivery”.

www.cineca.it 60
National Health Information System: hospital discharges
% Nc < 5
% Nc 5 - 30
% Nc > 30
Figura 1. % of clinical charts with information non
corresponding to the HIS as of 8 gennaio 2013
Ministry of Health: correspondence between NHIS and clinical charts
Preliminary
results on 1117
clinical charts
F. Carle


![Untitled-1 [salvichem.com]salvichem.com/assets/SCI-IRON-SALTS-BOOKLET.pdf · NMT. 1 Oppm NMT 0.3% No turbidty is produced Wthin 5 minutes NMT 10ppm 16.5 to 18.5% FCC Passes Test NMT](https://img.pdfslide.us/doc/110x75/5f10a47d7e708231d44a1ca8/untitled-1-nmt-1-oppm-nmt-03-no-turbidty-is-produced-wthin-5-minutes-nmt.jpg)