Embed Size (px)
Citation preview
Dimensional Study of Thermoplastic Parts Made UsingSequential Injection Molding
Jorge Aisa, Javier CastanyT.I.I.P.—C.S.I.C. Associated Unit, Mech. Dpt of the University of Zaragoza, C/Maria de Luna 3, 50018,Zaragoza, Spain
As a result of new aesthetical and economical require-ments in injection molding, several processes havebeen developed during last years. In spite of conven-tional process, sequential injection molding is a versa-tile technique based on independent control for eachgate opening. This procedure allows part filling withoutweld lines or, at least, these defects can be relocatedin suitable positions. A short discussion about sequen-tial principles is made introducing computer simula-tions. Pressure required for part filling and moldingshrinkage were evaluated using experimental proce-dures with a prototype mold and using conventionaland sequential methods. Several setting up parameterswere also used to analyze the effect on injection pro-cess. Final results show that shrinkage in sequentialinjection is similar to conventional process but somenew effects could be induced by the process asymme-try and should be investigated further. POLYM. ENG.SCI., 49:1832–1838, 2009. ª 2009 Society of Plastics Engineers
INTRODUCTION
Injection molding is the most popular process of plastic
manufacturing for complex parts, because of its economical
advantages for large series, different shapes capabilities,
and high production rates. In the same way, narrow toleran-
ces can be achieved if the mold and the process are prop-
erly designed. All these reasons make the injection molding
process a necessary element for automotive industry, espe-
cially when all companies are interested in offering attrac-
tive parts and lighter components, reducing car fuel con-
sumption. In addition, films or textile layers can be over-
molded, getting a new appearance of aesthetic parts.
Basic rules for injection molding design are well
developed in different research articles and literature since
the 80s [1, 2], and the computer aided engineering (CAE)
changed the traditional sequential development method to
a concurrent one where all the actors involved are work-
ing together from the beginning of the project [3].
Injection molding has many variations [4] over the ba-
sic procedure to produce new parts improving their stiff-
ness or reducing assembly operations, for example. These
special injection methods, not only sequential injection
but gas-assisted or injection-compression, are not always
analyzed with care, giving to their users inadequate
results. For example, gas-assisted technology offered
shorter cycle times but could not be used easily, because
it required specific part design, or gas extends in non uni-
form ways inside the thickness of plastic part, giving a
non adequate aspect [5, 6].
In this way, there are no technical references for sequen-
tial injection molding far from its basic definition and its
general advantages [7–11]: this technology uses independent
gate opening control on each injection point, operated by a
computer system. The mold requires a hot runner system,
Fig. 1 (mold used in this work), and a control device, add-
ing new costs not required in a conventional system (mold
investment plus operating costs). Figures 2 and 3 show a
conventional filling sequence for a rectangular part using
two injection points. Weld line will be placed between
injection gates, and the aesthetical aspect and the mechani-
cal strength will be poor. Figures 4 and 5 show sequential
injection process for the same plastic sample: first, only one
gate is open; when polymer flow reaches the second gate
this will be opened, avoiding in this way weld lines caused
by shock of both flow fronts. After this action, generally
previous gates remain closed. At the beginning of the pack-
ing phase, all the gates will be opened again, to improve
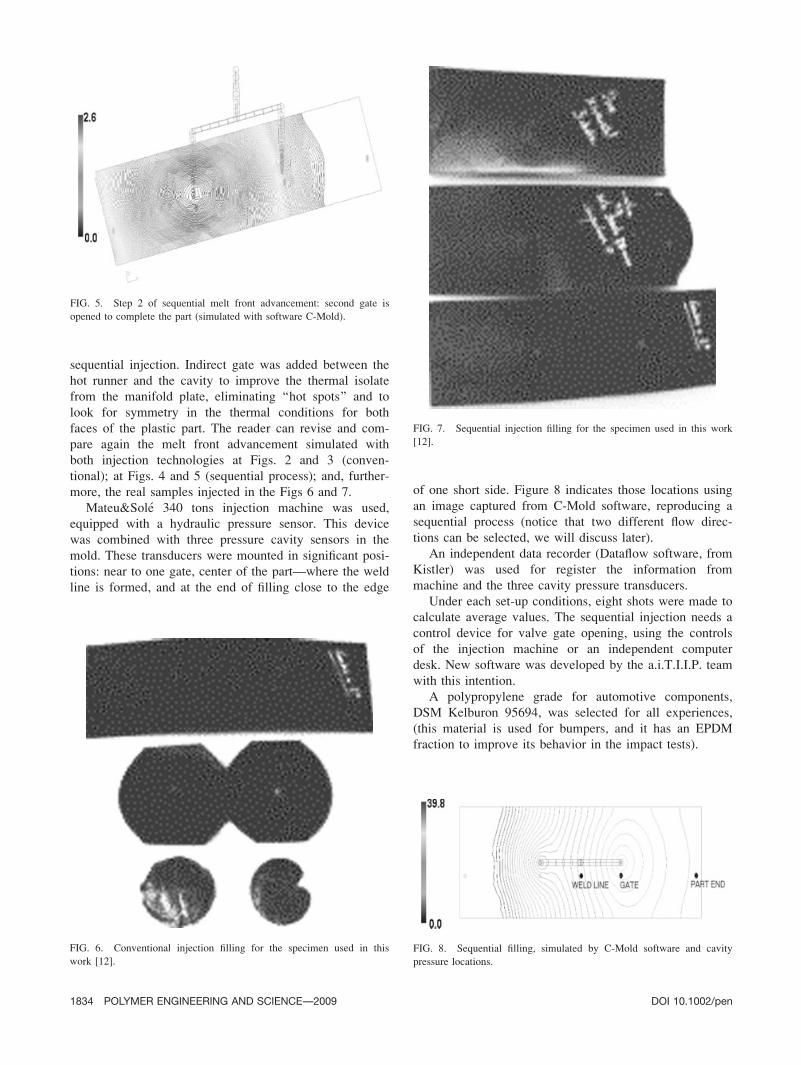
part quality. Figure 6 shows conventional filling of real
parts, and Fig. 7 illustrates the sequential process. Authors
describe in [12] that weld line elimination in sequential pro-
cess, giving interesting results about mechanical behavior of
different samples.
This injection molding technique is much used for
complex parts which can not present visible weld lines as
dashboards or car bumpers. Plastic painted parts are usu-
ally made by sequential injection too due to flaws caused
by weld lines. The designer has to combine weld line
position and general rules during mold design, and many
items are manufactured successfully (as dashboard or car
bumpers).
Correspondence to: J. Aisa; e-mail: [email protected]
DOI 10.1002/pen.21310
Published online in Wiley InterScience (www.interscience.wiley.com).
VVC 2009 Society of Plastics Engineers
POLYMER ENGINEERING AND SCIENCE—-2009
However, designers should be careful with common
rules cited above, because under simple rules, the position
of some gates may increase clamping force required due
to ‘‘overpacking’’ effects [13–15].
This article is focused on results about shrinkage in
injection molding comparing conventional and sequential
samples made using a prototype mold. Other added results
are the needed pressure to fill the cavity and the sample
weight. Both are included to explain some significant dif-
ferences between both technologies. All these data were
obtained at T.I.I.P. research group, Unit Associated to
C.S.I.C., (University of Zaragoza, Spain) with the support
of Foundation a.i.T.I.I.P. (www.aitiip.com), which lent its
facilities for the injection trials.
MATERIALS AND METHODS
For this study, a prototype mold was made. The mold
was planned looking for a frontal weld line and it is also
prepared, changing the cavity plate, for injecting an
adjacent weld line in the future as the literature explains
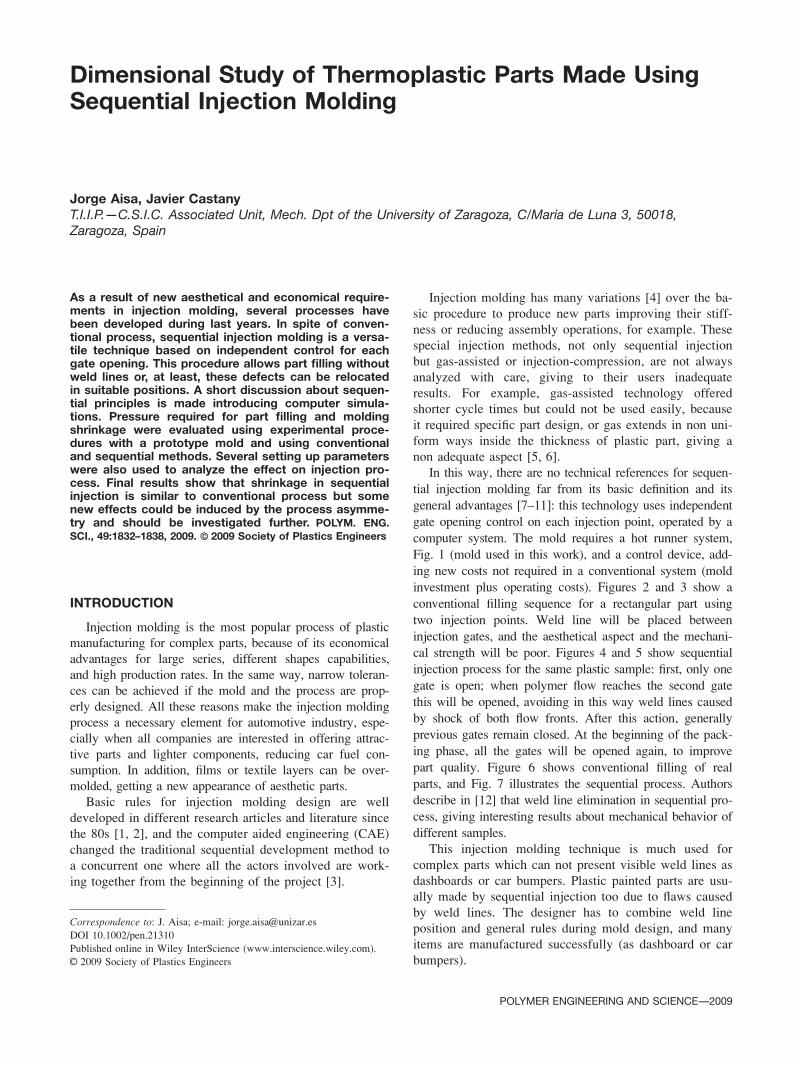
[16, 17]. Figure 1 shows a scheme of the actual part mod-
eled using C-Mold software (AC-Technology), showing
the hot runner system and the layout of mold cooling
lines. This computer program is used in this article to
illustrate how the flow fills the mold in the types of injec-
tion described.
The specimen tested is a rectangle, 450 3 150 mm,
2.5 mm thick, with two injection points separated
150 mm. A Mold-MastersTM hot runner was used equipped
with two DuraTM hydraulic valve gates. This disposition
generates a weld line very well defined, when conventional
process is used and the defect can be avoided with
FIG. 2. Step 1 of conventional melt front advancement for a rectangu-
lar part using two gates (simulated with software C-Mold).
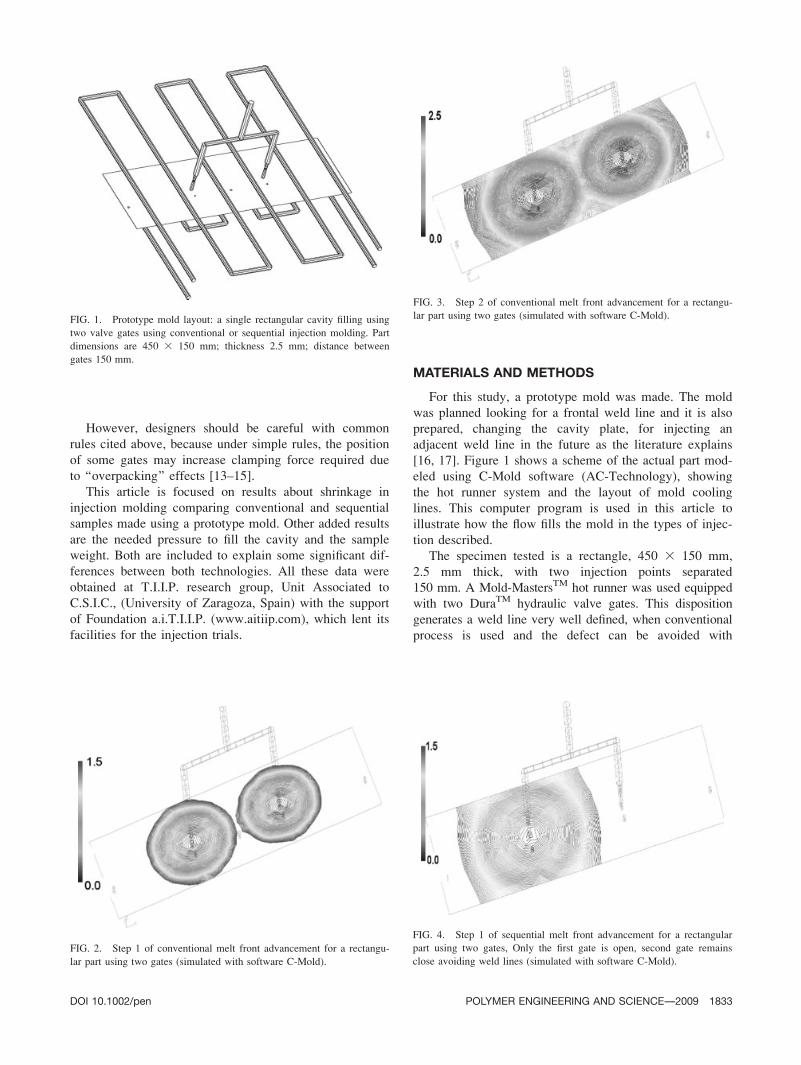
FIG. 3. Step 2 of conventional melt front advancement for a rectangu-
lar part using two gates (simulated with software C-Mold).
FIG. 4. Step 1 of sequential melt front advancement for a rectangular
part using two gates, Only the first gate is open, second gate remains
close avoiding weld lines (simulated with software C-Mold).
FIG. 1. Prototype mold layout: a single rectangular cavity filling using
two valve gates using conventional or sequential injection molding. Part
dimensions are 450 3 150 mm; thickness 2.5 mm; distance between
gates 150 mm.
DOI 10.1002/pen POLYMER ENGINEERING AND SCIENCE—-2009 1833
sequential injection. Indirect gate was added between the
hot runner and the cavity to improve the thermal isolate
from the manifold plate, eliminating ‘‘hot spots’’ and to
look for symmetry in the thermal conditions for both
faces of the plastic part. The reader can revise and com-
pare again the melt front advancement simulated with
both injection technologies at Figs. 2 and 3 (conven-
tional); at Figs. 4 and 5 (sequential process); and, further-
more, the real samples injected in the Figs 6 and 7.
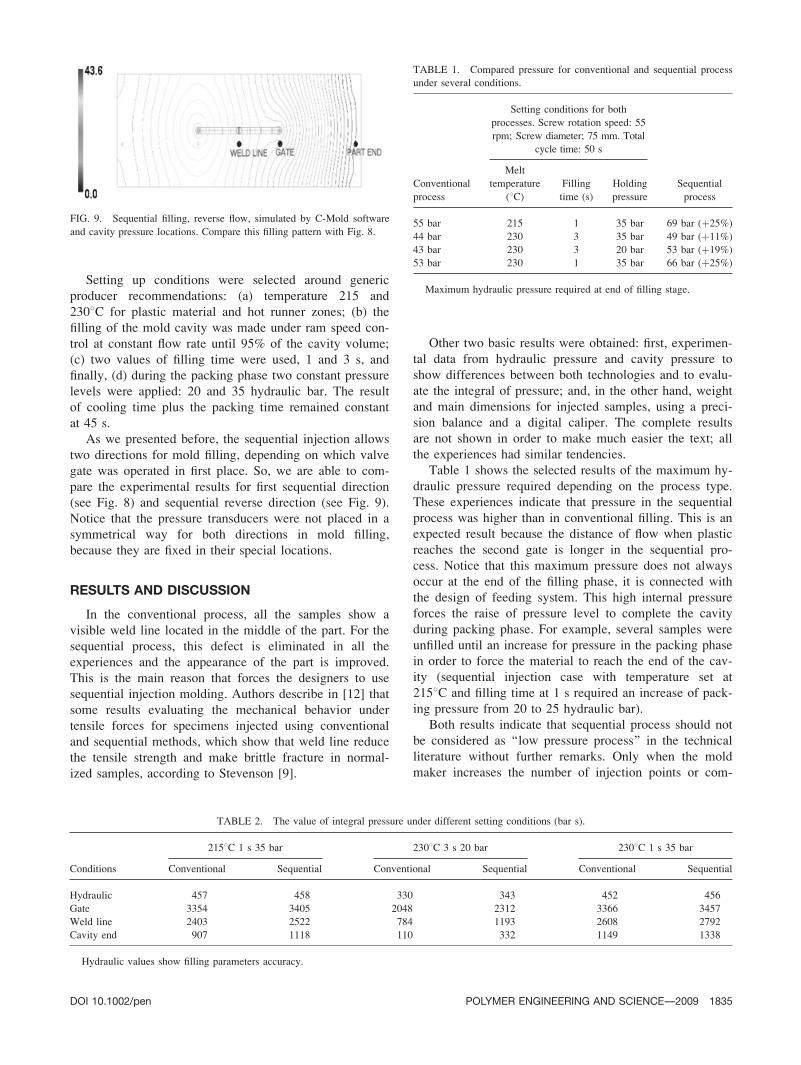
Mateu&Sole 340 tons injection machine was used,
equipped with a hydraulic pressure sensor. This device
was combined with three pressure cavity sensors in the
mold. These transducers were mounted in significant posi-
tions: near to one gate, center of the part—where the weld
line is formed, and at the end of filling close to the edge
of one short side. Figure 8 indicates those locations using
an image captured from C-Mold software, reproducing a
sequential process (notice that two different flow direc-
tions can be selected, we will discuss later).
An independent data recorder (Dataflow software, from
Kistler) was used for register the information from
machine and the three cavity pressure transducers.
Under each set-up conditions, eight shots were made to
calculate average values. The sequential injection needs a
control device for valve gate opening, using the controls
of the injection machine or an independent computer
desk. New software was developed by the a.i.T.I.I.P. team
with this intention.
A polypropylene grade for automotive components,
DSM Kelburon 95694, was selected for all experiences,
(this material is used for bumpers, and it has an EPDM
fraction to improve its behavior in the impact tests).
FIG. 5. Step 2 of sequential melt front advancement: second gate is
opened to complete the part (simulated with software C-Mold).
FIG. 6. Conventional injection filling for the specimen used in this
work [12].
FIG. 7. Sequential injection filling for the specimen used in this work
[12].
FIG. 8. Sequential filling, simulated by C-Mold software and cavity
pressure locations.
1834 POLYMER ENGINEERING AND SCIENCE—-2009 DOI 10.1002/pen
Setting up conditions were selected around generic
producer recommendations: (a) temperature 215 and
2308C for plastic material and hot runner zones; (b) the
filling of the mold cavity was made under ram speed con-
trol at constant flow rate until 95% of the cavity volume;
(c) two values of filling time were used, 1 and 3 s, and
finally, (d) during the packing phase two constant pressure
levels were applied: 20 and 35 hydraulic bar. The result
of cooling time plus the packing time remained constant
at 45 s.
As we presented before, the sequential injection allows
two directions for mold filling, depending on which valve
gate was operated in first place. So, we are able to com-
pare the experimental results for first sequential direction
(see Fig. 8) and sequential reverse direction (see Fig. 9).
Notice that the pressure transducers were not placed in a
symmetrical way for both directions in mold filling,
because they are fixed in their special locations.
RESULTS AND DISCUSSION
In the conventional process, all the samples show a
visible weld line located in the middle of the part. For the
sequential process, this defect is eliminated in all the
experiences and the appearance of the part is improved.
This is the main reason that forces the designers to use
sequential injection molding. Authors describe in [12] that
some results evaluating the mechanical behavior under
tensile forces for specimens injected using conventional
and sequential methods, which show that weld line reduce
the tensile strength and make brittle fracture in normal-
ized samples, according to Stevenson [9].
Other two basic results were obtained: first, experimen-
tal data from hydraulic pressure and cavity pressure to
show differences between both technologies and to evalu-
ate the integral of pressure; and, in the other hand, weight
and main dimensions for injected samples, using a preci-
sion balance and a digital caliper. The complete results
are not shown in order to make much easier the text; all
the experiences had similar tendencies.
Table 1 shows the selected results of the maximum hy-
draulic pressure required depending on the process type.
These experiences indicate that pressure in the sequential
process was higher than in conventional filling. This is an
expected result because the distance of flow when plastic
reaches the second gate is longer in the sequential pro-
cess. Notice that this maximum pressure does not always
occur at the end of the filling phase, it is connected with
the design of feeding system. This high internal pressure
forces the raise of pressure level to complete the cavity
during packing phase. For example, several samples were
unfilled until an increase for pressure in the packing phase
in order to force the material to reach the end of the cav-
ity (sequential injection case with temperature set at
2158C and filling time at 1 s required an increase of pack-
ing pressure from 20 to 25 hydraulic bar).
Both results indicate that sequential process should not
be considered as ‘‘low pressure process’’ in the technical
literature without further remarks. Only when the mold
maker increases the number of injection points or com-
FIG. 9. Sequential filling, reverse flow, simulated by C-Mold software
and cavity pressure locations. Compare this filling pattern with Fig. 8.
TABLE 1. Compared pressure for conventional and sequential process
under several conditions.
Conventional
process
Setting conditions for both
processes. Screw rotation speed: 55
rpm; Screw diameter; 75 mm. Total
cycle time: 50 s
Sequential
process
Melt
temperature
(8C)Filling
time (s)
Holding
pressure
55 bar 215 1 35 bar 69 bar (þ25%)
44 bar 230 3 35 bar 49 bar (þ11%)
43 bar 230 3 20 bar 53 bar (þ19%)
53 bar 230 1 35 bar 66 bar (þ25%)
Maximum hydraulic pressure required at end of filling stage.
TABLE 2. The value of integral pressure under different setting conditions (bar s).
Conditions
2158C 1 s 35 bar 2308C 3 s 20 bar 2308C 1 s 35 bar
Conventional Sequential Conventional Sequential Conventional Sequential
Hydraulic 457 458 330 343 452 456
Gate 3354 3405 2048 2312 3366 3457
Weld line 2403 2522 784 1193 2608 2792
Cavity end 907 1118 110 332 1149 1338
Hydraulic values show filling parameters accuracy.
DOI 10.1002/pen POLYMER ENGINEERING AND SCIENCE—-2009 1835
bines the sequential process with additional technologies
as injection—compression, this sentence will become true.
Mold design and operative costs have to be considered as
these restrictions before to plan the manufacture of new
plastic parts using this technique.
Table 2 shows values of the pressure integral for both
processes. This value is strongly connected with related to
dimensional quality and mechanical properties of molded
parts, as it is well established in the literature. The inte-
gral of hydraulic pressure shows that all the experiences,
independently from process type, could be compared
because this value is the same.
Notice that, depending on flow direction, this value of
the integral of pressure is different for the gate and cavity
end position in all the examples (Table 3). The value of
integral of pressure for the conventional process is placed
between sequential ones depending on plastic flow direc-
tion. These differences indicate that local shrinkage will
not be the same depending on selected process, or even
more, depending on flow direction.
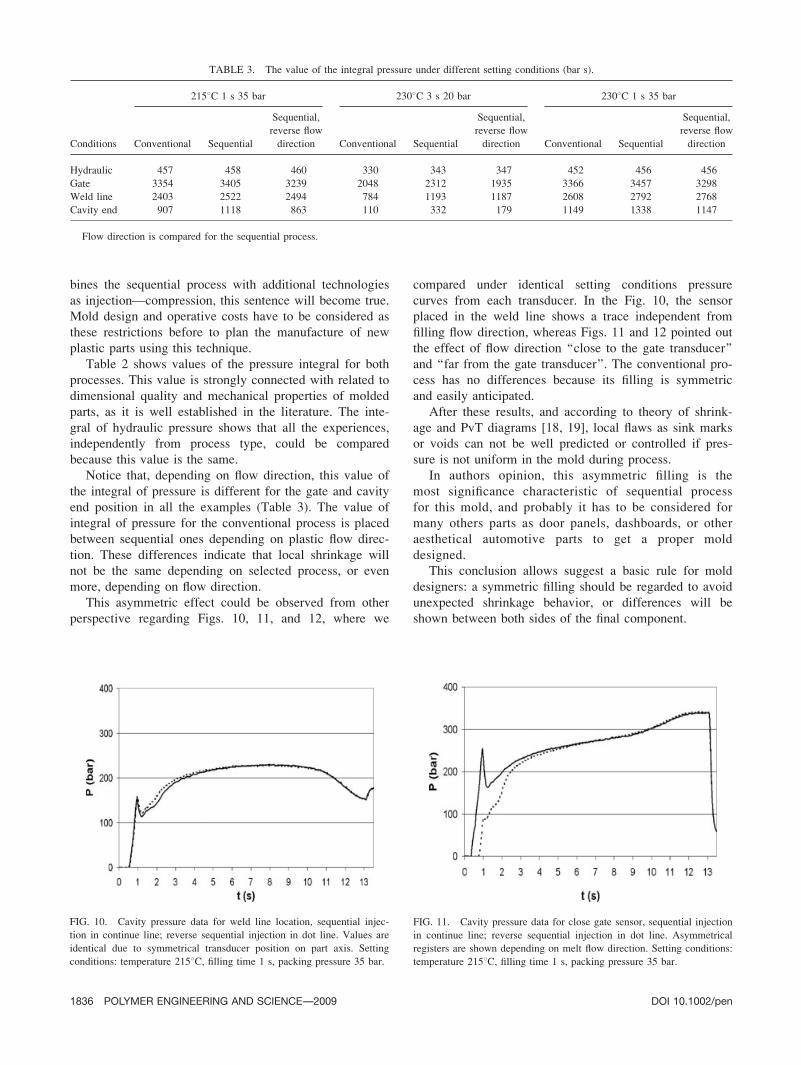
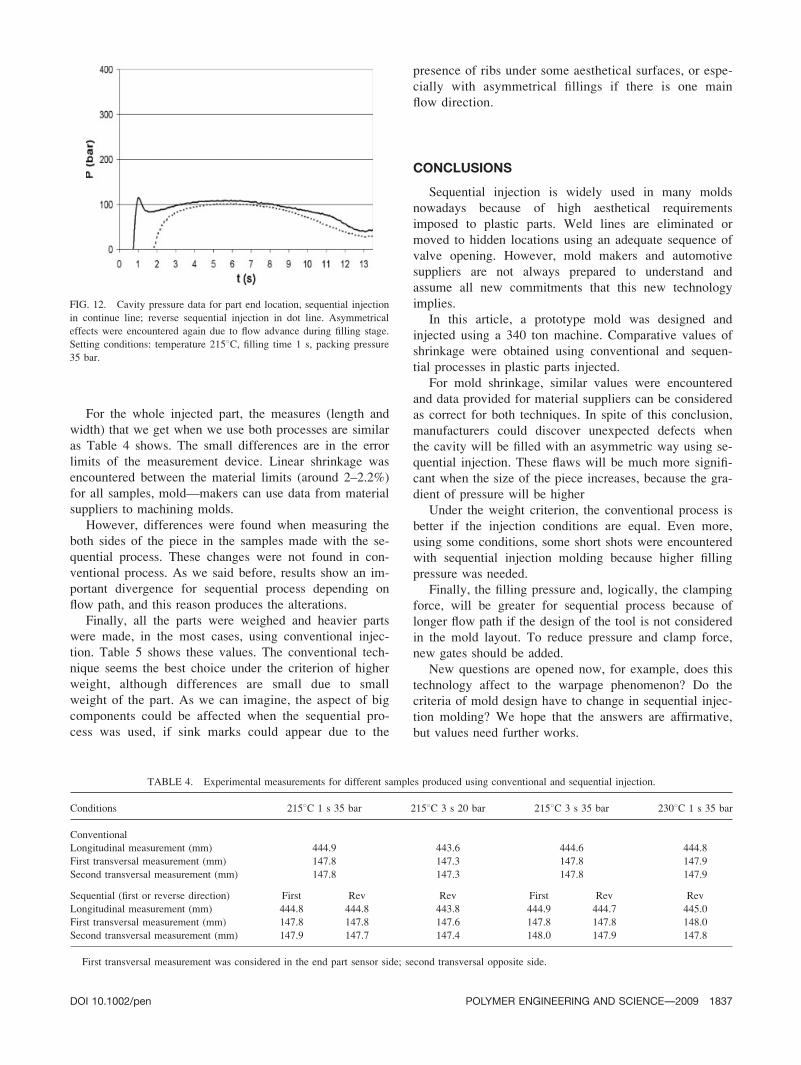
This asymmetric effect could be observed from other
perspective regarding Figs. 10, 11, and 12, where we
compared under identical setting conditions pressure
curves from each transducer. In the Fig. 10, the sensor
placed in the weld line shows a trace independent from
filling flow direction, whereas Figs. 11 and 12 pointed out
the effect of flow direction ‘‘close to the gate transducer’’
and ‘‘far from the gate transducer’’. The conventional pro-
cess has no differences because its filling is symmetric
and easily anticipated.
After these results, and according to theory of shrink-
age and PvT diagrams [18, 19], local flaws as sink marks
or voids can not be well predicted or controlled if pres-
sure is not uniform in the mold during process.
In authors opinion, this asymmetric filling is the
most significance characteristic of sequential process
for this mold, and probably it has to be considered for
many others parts as door panels, dashboards, or other
aesthetical automotive parts to get a proper mold
designed.
This conclusion allows suggest a basic rule for mold
designers: a symmetric filling should be regarded to avoid
unexpected shrinkage behavior, or differences will be
shown between both sides of the final component.
FIG. 10. Cavity pressure data for weld line location, sequential injec-
tion in continue line; reverse sequential injection in dot line. Values are
identical due to symmetrical transducer position on part axis. Setting
conditions: temperature 2158C, filling time 1 s, packing pressure 35 bar.
FIG. 11. Cavity pressure data for close gate sensor, sequential injection
in continue line; reverse sequential injection in dot line. Asymmetrical
registers are shown depending on melt flow direction. Setting conditions:
temperature 2158C, filling time 1 s, packing pressure 35 bar.
TABLE 3. The value of the integral pressure under different setting conditions (bar s).
Conditions
2158C 1 s 35 bar 2308C 3 s 20 bar 2308C 1 s 35 bar
Conventional Sequential
Sequential,
reverse flow
direction Conventional Sequential
Sequential,
reverse flow
direction Conventional Sequential
Sequential,
reverse flow
direction
Hydraulic 457 458 460 330 343 347 452 456 456
Gate 3354 3405 3239 2048 2312 1935 3366 3457 3298
Weld line 2403 2522 2494 784 1193 1187 2608 2792 2768
Cavity end 907 1118 863 110 332 179 1149 1338 1147
Flow direction is compared for the sequential process.
1836 POLYMER ENGINEERING AND SCIENCE—-2009 DOI 10.1002/pen
For the whole injected part, the measures (length and
width) that we get when we use both processes are similar
as Table 4 shows. The small differences are in the error
limits of the measurement device. Linear shrinkage was
encountered between the material limits (around 2–2.2%)
for all samples, mold—makers can use data from material
suppliers to machining molds.
However, differences were found when measuring the
both sides of the piece in the samples made with the se-
quential process. These changes were not found in con-
ventional process. As we said before, results show an im-
portant divergence for sequential process depending on
flow path, and this reason produces the alterations.
Finally, all the parts were weighed and heavier parts
were made, in the most cases, using conventional injec-
tion. Table 5 shows these values. The conventional tech-
nique seems the best choice under the criterion of higher
weight, although differences are small due to small
weight of the part. As we can imagine, the aspect of big
components could be affected when the sequential pro-
cess was used, if sink marks could appear due to the
presence of ribs under some aesthetical surfaces, or espe-
cially with asymmetrical fillings if there is one main
flow direction.
CONCLUSIONS
Sequential injection is widely used in many molds
nowadays because of high aesthetical requirements
imposed to plastic parts. Weld lines are eliminated or
moved to hidden locations using an adequate sequence of
valve opening. However, mold makers and automotive
suppliers are not always prepared to understand and
assume all new commitments that this new technology
implies.
In this article, a prototype mold was designed and
injected using a 340 ton machine. Comparative values of
shrinkage were obtained using conventional and sequen-
tial processes in plastic parts injected.
For mold shrinkage, similar values were encountered
and data provided for material suppliers can be considered
as correct for both techniques. In spite of this conclusion,
manufacturers could discover unexpected defects when
the cavity will be filled with an asymmetric way using se-
quential injection. These flaws will be much more signifi-
cant when the size of the piece increases, because the gra-
dient of pressure will be higher
Under the weight criterion, the conventional process is
better if the injection conditions are equal. Even more,
using some conditions, some short shots were encountered
with sequential injection molding because higher filling
pressure was needed.
Finally, the filling pressure and, logically, the clamping
force, will be greater for sequential process because of
longer flow path if the design of the tool is not considered
in the mold layout. To reduce pressure and clamp force,
new gates should be added.
New questions are opened now, for example, does this
technology affect to the warpage phenomenon? Do the
criteria of mold design have to change in sequential injec-
tion molding? We hope that the answers are affirmative,
but values need further works.
TABLE 4. Experimental measurements for different samples produced using conventional and sequential injection.
Conditions 2158C 1 s 35 bar 2158C 3 s 20 bar 2158C 3 s 35 bar 2308C 1 s 35 bar
Conventional
Longitudinal measurement (mm) 444.9 443.6 444.6 444.8
First transversal measurement (mm) 147.8 147.3 147.8 147.9
Second transversal measurement (mm) 147.8 147.3 147.8 147.9
Sequential (first or reverse direction) First Rev Rev First Rev Rev
Longitudinal measurement (mm) 444.8 444.8 443.8 444.9 444.7 445.0
First transversal measurement (mm) 147.8 147.8 147.6 147.8 147.8 148.0
Second transversal measurement (mm) 147.9 147.7 147.4 148.0 147.9 147.8
First transversal measurement was considered in the end part sensor side; second transversal opposite side.
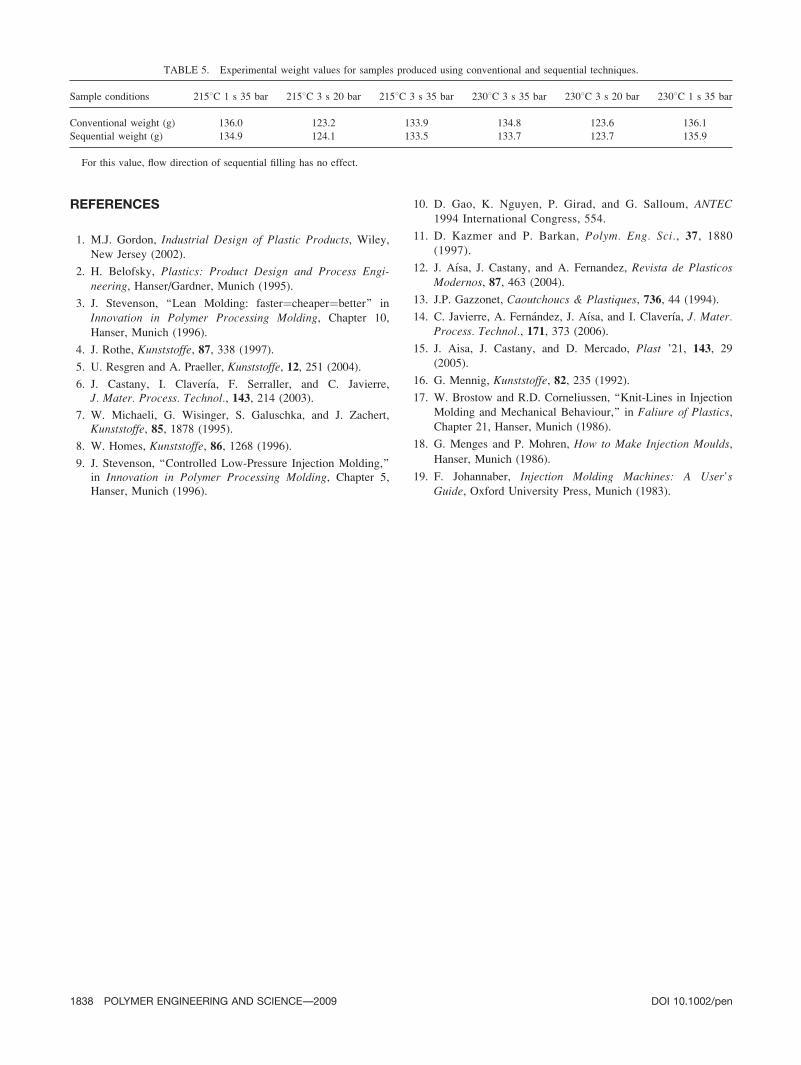
FIG. 12. Cavity pressure data for part end location, sequential injection
in continue line; reverse sequential injection in dot line. Asymmetrical
effects were encountered again due to flow advance during filling stage.
Setting conditions: temperature 2158C, filling time 1 s, packing pressure
35 bar.
DOI 10.1002/pen POLYMER ENGINEERING AND SCIENCE—-2009 1837
REFERENCES
1. M.J. Gordon, Industrial Design of Plastic Products, Wiley,
New Jersey (2002).
2. H. Belofsky, Plastics: Product Design and Process Engi-neering, Hanser/Gardner, Munich (1995).
3. J. Stevenson, ‘‘Lean Molding: faster¼cheaper¼better’’ in
Innovation in Polymer Processing Molding, Chapter 10,
Hanser, Munich (1996).
4. J. Rothe, Kunststoffe, 87, 338 (1997).
5. U. Resgren and A. Praeller, Kunststoffe, 12, 251 (2004).
6. J. Castany, I. Claverıa, F. Serraller, and C. Javierre,J. Mater. Process. Technol., 143, 214 (2003).
7. W. Michaeli, G. Wisinger, S. Galuschka, and J. Zachert,Kunststoffe, 85, 1878 (1995).
8. W. Homes, Kunststoffe, 86, 1268 (1996).
9. J. Stevenson, ‘‘Controlled Low-Pressure Injection Molding,’’in Innovation in Polymer Processing Molding, Chapter 5,Hanser, Munich (1996).
10. D. Gao, K. Nguyen, P. Girad, and G. Salloum, ANTEC1994 International Congress, 554.
11. D. Kazmer and P. Barkan, Polym. Eng. Sci., 37, 1880
(1997).
12. J. Aısa, J. Castany, and A. Fernandez, Revista de PlasticosModernos, 87, 463 (2004).
13. J.P. Gazzonet, Caoutchoucs & Plastiques, 736, 44 (1994).
14. C. Javierre, A. Fernandez, J. Aısa, and I. Claverıa, J. Mater.Process. Technol., 171, 373 (2006).
15. J. Aisa, J. Castany, and D. Mercado, Plast ’21, 143, 29
(2005).
16. G. Mennig, Kunststoffe, 82, 235 (1992).
17. W. Brostow and R.D. Corneliussen, ‘‘Knit-Lines in Injection
Molding and Mechanical Behaviour,’’ in Faliure of Plastics,Chapter 21, Hanser, Munich (1986).
18. G. Menges and P. Mohren, How to Make Injection Moulds,
Hanser, Munich (1986).
19. F. Johannaber, Injection Molding Machines: A User’sGuide, Oxford University Press, Munich (1983).
TABLE 5. Experimental weight values for samples produced using conventional and sequential techniques.
Sample conditions 2158C 1 s 35 bar 2158C 3 s 20 bar 2158C 3 s 35 bar 2308C 3 s 35 bar 2308C 3 s 20 bar 2308C 1 s 35 bar
Conventional weight (g) 136.0 123.2 133.9 134.8 123.6 136.1
Sequential weight (g) 134.9 124.1 133.5 133.7 123.7 135.9
For this value, flow direction of sequential filling has no effect.
1838 POLYMER ENGINEERING AND SCIENCE—-2009 DOI 10.1002/pen


![[PPT]PowerPoint Presentation - · Web viewInjection molding is a manufacturing process for producing parts from both thermoplastic and thermosetting plastic materials. Material is](https://img.pdfslide.us/doc/110x75/5aa3e33a7f8b9a2f048b7530/pptpowerpoint-presentation-viewinjection-molding-is-a-manufacturing-process.jpg)


![THERMOPLASTIC ELASTOMERIC (TPE) MATERIALS AND …ipme.ru/e-journals/RAMS/no_12911/02_amin.pdf · microelectronic chips etc.[1,2,4-6,12-14]. 1.4.1. Over molding [15] Over molding means](https://img.pdfslide.us/doc/110x75/6146b0f4f4263007b135576b/thermoplastic-elastomeric-tpe-materials-and-ipmerue-journalsramsno1291102aminpdf.jpg)