Embed Size (px)
Citation preview
ARTICLE IN PRESS
1352-2310/$ - se
doi:10.1016/j.at
�Correspondbustion Engine
Tel.: +43 316 8
E-mail addr
Atmospheric Environment 41 (2007) 7440–7461
www.elsevier.com/locate/atmosenv
Dilution and aerosol dynamics within a diesel car exhaustplume—CFD simulations of on-road measurement conditions
U. Uhrnera,�, S. von Lowisa, H. Vehkamakib, B. Wehnera, S. Brasela, M. Hermanna,F. Stratmanna, M. Kulmalab, A. Wiedensohlera
aLeibniz Institute for Tropospheric Research, 04318 Leipzig, GermanybDepartment of Physical Sciences, University of Helsinki, 00014 Helsinki, Finland
Received 7 June 2006; received in revised form 29 April 2007; accepted 24 May 2007
Abstract
Vehicle particle emissions are studied extensively because of their health effects, contribution to ambient PM levels and
possible impact on climate. The aim of this work was to obtain a better understanding of secondary particle formation and
growth in a diluting vehicle exhaust plume using 3-d information of simulations together with measurements. Detailed
coupled computational fluid dynamics (CFD) and aerosol dynamics simulations have been conducted for H2SO4–H2O and
soot particles based on measurements within a vehicle exhaust plume under real conditions on public roads.
Turbulent diffusion of soot and nucleation particles is responsible for the measured decrease of number concentrations
within the diesel car exhaust plume and decreases coagulation rates. Particle size distribution measurements at 0.45 and
0.9m distance to the tailpipe indicate a consistent soot mode (particle diameter Dp�50 nm) at variable operating
conditions. Soot mode number concentrations reached up to 1013m�3 depending on operating conditions and mixing.
For nucleation particles the simulations showed a strong sensitivity to the spatial dilution pattern, related cooling and
exhaust H2SO4(g). The highest simulated nucleation rates were about 0.05–0.1m from the axis of the plume. The simulated
particle number concentration pattern is in approximate accordance with measured concentrations, along the jet centreline
and 0.45 and 0.9m from the tailpipe. Although the test car was run with ultralow sulphur fuel, high nucleation particle
(Dpp15 nm) concentrations (41013m�3) were measured under driving conditions of strong acceleration or the
combination of high vehicle speed (4140 kmh�1) and high engine rotational speed (43800 revolutions per minute
(rpm)).
Strong mixing and cooling caused rapid nucleation immediately behind the tailpipe, so that the highest particle number
concentrations were recorded at a distance, x ¼ 0.45m behind the tailpipe. The simulated growth of H2SO4–H2O
nucleation particles was unrealistically low compared with measurements. The possible role of low and semi-volatile
organic components on the growth processes is discussed. Simulations for simplified H2SO4–H2O–octane–gasoil aerosol
resulted in sufficient growth of nucleation particles.
r 2007 Elsevier Ltd. All rights reserved.
Keywords: Aerosol dynamics modelling; Particle formation; Particle growth; Soot; Vehicle exhaust plume
e front matter r 2007 Elsevier Ltd. All rights reserved
mosenv.2007.05.057
ing author. Now at Institute for Internal Com-
s and Thermodynamics, 8010 Graz, Austria.
73 4588; fax: +43 316 873 8080.
ess: [email protected] (U. Uhrner).
1. Introduction
Adverse health effects such as lung cancer (e.g.Pope, 2000), cardiovascular disease (e.g. Peters
.
ARTICLE IN PRESSU. Uhrner et al. / Atmospheric Environment 41 (2007) 7440–7461 7441
et al., 2001) bronchitis, asthma (Peters et al., 1997)and mutations (Somers et al., 2004) are associatedwith respirable particles emitted from vehicles.Ultrafine particles (defined as Dpp100 nm) candeposit with high efficiency in the smallest vesselsof the lungs. One major source of these ultrafineparticles is vehicles. Furthermore, the influence oftraffic-generated combustion particles on the earthradiation budget is controversially discussed (e.g.Jacobson, 2002; Penner et al., 2003).
According to health effect studies, the particlenumber concentration to which the individual isexposed is more important than their mass (e.g.Donaldson et al., 1998; Sydbom et al., 2001). Thedeposition efficiency of particles in the smallestvessels in the lung increases with decreasing particlesize. For this reason and the fact that ultrafineparticles contribute much to number and little tomass emissions, it is important to study theformation and fate of ultrafine particles in theexhaust plume of vehicles. Thereby, various pro-cesses such as dispersion, coagulation, deposition,new particle formation and growth must beassessed.
Diesel engines primarily emit aerosol precursorgases such as SO2, SO3, H2SO4, NOx, H2O, low andsemi-volatile organic species as well as soot parti-cles. At the engine exhaust port, soot particles arefractal-like agglomerates, which undergo complexprocesses like compaction and condensation of lowand semi-volatile organics, which result in higherdensity and less irregular shape until they leave theexhaust pipe. Exhaust size distribution measure-ments made at various diesel cars are similar forcomparable operation conditions unless nucleationoccurs. They exhibit a consistent soot mode at aparticle mobility diameter of 50–100 nm (e.g. Harrisand Maricq, 2001). Dependent on fuel composition,engine operating conditions, exhaust aftertreatment,exhaust dilution and sampling methods, the sizedistribution can exhibit a second highly variablenucleation mode with diameters from 10 to 20 nm(e.g. Maricq et al., 2002; Vogt et al., 2003;Giechaskiel et al., 2005). Earlier works all under-taken on heavy-duty diesel engines resulted inqualitatively similar results (Baumgard and John-son, 1996; Khalek et al., 1999; Shi and Harrison,1999). Nucleation particles can dominate thenumber concentration of ultrafine particles. Incontrast to soot mode particles, there is only limitedinformation available on the chemical compositionof nucleation mode particles. Volatility tandem
DMA (VTDMA) measurements suggest that mostof these particles are semi-volatile and do not have asolid core (Scheer et al., 2005; Maricq et al., 2002).Highway roadside measurements by Wehner et al.(2004) showed a bi-modal distribution with avolatile nucleation mode and a small volatilefraction of soot mode particles. The nucleationmode is thought to originate from sulphuric acidand/or semi-volatile organic gases that nucleate andcondense during exhaust dilution. There is strongevidence that nucleation particles in vehicle exhaustmay be formed by binary homogenous nucleation ofsulphuric acid and water. In several studies, highparticle number concentrations were related to highfuel sulphur content and exhaust aftertreatmentsuch as the use of oxidation catalysts (e.g. Baum-gard and Johnson, 1996; Maricq et al., 2002; Vogtet al., 2003). Oxidation catalysts remove a largefraction of hydrocarbons and boost SO2 to SO3
oxidation. SO3 then rapidly reacts with exhaustH2O forming sulphuric acid. Further suggestedparticle formation mechanisms are homogeneousternary nucleation of H2SO4, NH3 and H2O (Shiand Harrison, 1999) and heterogeneous ion-inducednucleation (Yu, 2001). However, the relevance ofthese mechanisms is still not clear. Organic com-pounds are considered to control the growthof nucleation particles in diesel exhaust plumes(Khalek et al., 2000; Tobias et al., 2001; Sakuraiet al., 2003).
A key factor for nucleation is the dilution ofexhaust gases. During dilution, aerosol precursorgases cool and the saturation ratios of semi-volatilespecies go through a maximum, which may lead tonucleation and/or condensation. Engine test-bedinvestigations indicate that the occurrence ofnucleation particles strongly depends on dilutionratio, residence time, dilution temperature andrelative humidity. However, Maricq et al. (2002)and Vogt et al. (2003) encountered difficulties whencomparing laboratory data to either wind tunnel oron-road (e.g. chasing) measurements. Giechaskielet al. (2005) concluded that vehicle exhaust nuclea-tion mode particles can be at least qualitativelyreproduced in the lab.
In principle, a coupled CFD-aerosol modelapproach enables to account for all relevantconcurrent processes in the exhaust plume, includ-ing turbulent diffusion. Moreover, 3-d pattern of allparameters of interest are calculated and can beused for validation with point measurements andfurther interpretation due to the 3-d information.
ARTICLE IN PRESSU. Uhrner et al. / Atmospheric Environment 41 (2007) 7440–74617442
However, there have been very limited investiga-tions on the simulation of exhaust gas and particledispersion so far. Kim et al. (2002) found very goodagreement with CFD CO2 dispersion simulationscompared against measurements for a heavy tractor(truck without trailer) placed in an aircraft windtunnel. In a further study (Kim et al., 2001), basedon the dilution ratio of CO2, nucleation, condensa-tion and coagulation for H2SO4–H2O aerosol wascalculated with a non-coupled aerosol model in theplume. A good agreement between simulated andmeasured size distribution was obtained. Carbon-aceous particle emissions were not considered.
Jiang et al. (2005) showed the impact of vehiclespeed on soot particle size distributions based onCFD calculated CO2 dilution for the simulation ofdilution and coagulation on five streamlines. Theyfound that increasing vehicle speed caused morerapid dilution and inhibited coagulation.
In this project, the transformation processesunder turbulent diffusion within the exhaust plumein the wake of a passenger vehicle were studied fortypical atmospheric and on-road conditions. Parti-cle and trace gas measurements as well as tempera-ture and flow velocity measurements were madeunder real conditions on public roads. The motiva-tion for this combined approach by measurementsand simulations was to evaluate conditions leadingto particle formation within the exhaust plume andto gain insight into several important simultaneousprocesses affecting particle formation such as:cooling of exhaust gas upon turbulent dilution,dilution of particles and precursor gases withambient air, coagulation and condensation.Therefore, the dilution and aerosol dynamicswithin and around the exhaust plume weremodelled using computational fluid dynamicssoftware (FLUENT 6, www.fluent.com) togetherwith the add-on aerosol model FPM (Fine ParticleModel, www.particle-dynamics.de). The FPM, to-gether with FLUENT, represents a full Euleriansolution of the particle general dynamics equation.Therefore, in contrast to previous studies whereparticle dynamics was only computed along selectedstreamlines, use of the FPM permitted a fullycoupled Eulerian/Eulerian simulation of the aerosoldynamics on all grid cells.
In this work, the following key factors thatinfluence the formation and growth of new particlesin the exhaust plume were considered using 3-dnumerical simulations and point measurements:sulphuric acid flux, engine operating conditions, the
turbulent dilution of the exhaust flow, temperatureand humidity. Emitted soot mode particles influenceon nucleation by acting as condensational sink forsulphuric acid during dilution. The impact of low andsemi-volatile hydrocarbons on growth was estimated.
2. General approach
The test car and vehicle modelled was a European2003 estate car, which is used as a common staff carat the Institute for Tropospheric Research (IfT) inLeipzig. The car has a 2.0 l DTI 16V 74 kW (100 hp)diesel engine. The vehicle is equipped with anoxidation catalyst, but has no particle filter. Thecar attained the Euro 3 exhaust emission standard.The test car was run with low sulphur standard fuelscontaining �7 ppmm sulphur content. The test carhad been operated for 27,500 km before we did ourmeasurements.
In order to describe the interaction of flow,dilution and aerosol dynamics behind the exhaustpipe in the wake of the car FLUENT CFD-softwareand the FPM were used to compute 3-d particleconcentrations.
Due to computational limits, only steady-stateoperating conditions were examined and the focusof the modelling efforts was placed on the exhaustregion whereas the body of the car was simplified.Measurements have been used in particular for theverification of model results concerning nucleationand for certain boundary conditions like thedetermination of soot particle emissions, exhaustout temperature, gas composition and flow rate.
2.1. Measurements
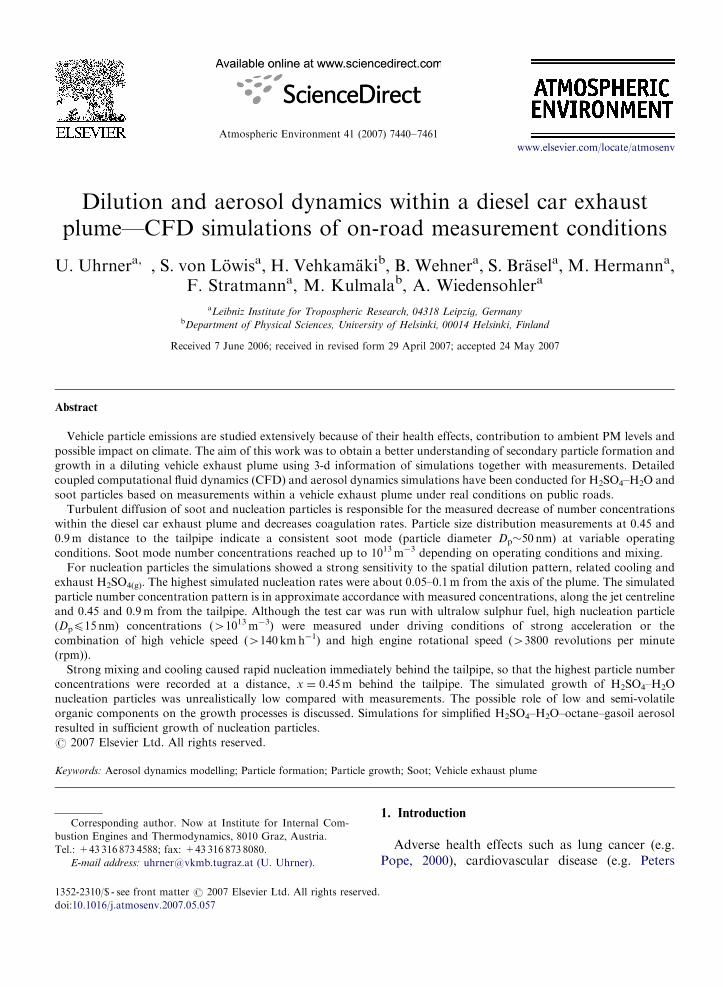
Here, measurement results recorded on 13 Octo-ber 2004 are presented for comparison with modelresults. The measurement devices and data acquisi-tion system were placed inside the car and the inletand sensor system was mounted on a bicycle rack(see Fig. 1). The following measurements were madewithin the exhaust plume: particle size distributionwith an Scanning Mobility Particle Sizer (SMPS)system, CO2 and NOx with a Multigas EmissionAnalyser (CLIR 2M Ansyco), relative humidity(RH) with Vaisala sensors, temperature (T) withthermocouples and Vaisala sensors, and velocitymeasurements with a Prandtl Pitot tube. Themeasurement range and time resolution of theinstruments are listed in Table 1. The spatial rangewithin the exhaust plume was confined to
ARTICLE IN PRESS
Fig. 1. Test car with mounted inlet and sensor system.
U. Uhrner et al. / Atmospheric Environment 41 (2007) 7440–7461 7443
a maximum of x ¼ 1m.1 For operating conditionsranging up to 148 kmh�1 and 4000 rpm, theminimum centreline distance was set to 0.45m inorder to avoid temperature damage to the Vaisalasensors, exceeding the maximum counting fre-quency of the SMPS system and to preventcondensation and new particle formation withinthe sampling system. One thermocouple was placedat the tailpipe exit to monitor the undiluted exhaustgas temperature. The sampling inlet was mounted ateither x ¼ 0.45 or 0.9m. The temperature andhumidity sensors were mounted within a few cmdistances to the inlets for the aerosol, gas and flowmeasurement systems.
Measurements concerning the vehicle operatingconditions such as vehicle speed, rpm, and air massflow were recorded with an Online Board Diagnosis(OBD) tool. The test legs were driven on theGerman motorway A38 between two differentmotorway exits. Further details about the measure-ments can be found in von Lowis (2006).
2.2. CFD model set-up and verification
FLUENT was used to solve the 3-d Reynoldsaveraged equations for flow, pressure, turbulenceparameters and the gas-phase concentration dis-tribution (FLUENT 6 User’s Guide, 2001). The‘‘two equation’’ standard k–e model based on theisotropic eddy viscosity assumption was chosen topredict the Reynolds stresses.
1For safety reasons, in Germany additional load and mount-
ings are only allowed up to a distance 1m behind the car.
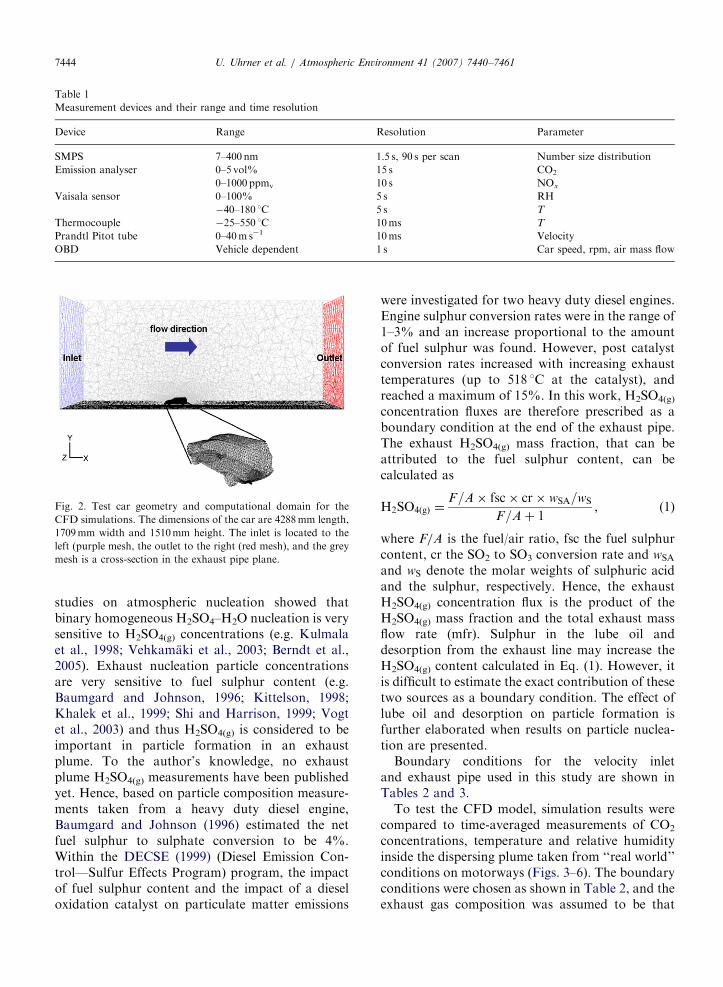
Because mixing behind the exhaust pipe of thevehicle was of primary interest in this study, theCFD model was not intended to be a detailedaerodynamic vehicle simulation. Due to CPU timeand memory limitations, we did not attempt to fullyresolve the vehicle geometry or the fluid boundarylayers surrounding the vehicle. These are expectedto have little effect on exhaust mixing in the wake ofthe test car. Based on a technical drawing of theestate car available on the manufacturer website, asimplified model geometry was created with GAM-BIT (www.fluent.com) and placed in a modeldomain 20m high, 20m wide and 50m long, essen-tially a computational wind tunnel (see Fig. 2). Thenumerical solution of the equations used anirregular grid that follows the shape of the car. Inthe near-exhaust region, the finest mesh resolutionwas created, decreasing exponentially in x-, y- andz-directions towards the outer boundaries of themodel domain. Approximately 260,000 tetrahedralgrid cells were utilised. Gradient adaptation wasapplied to further improve the mesh quality.Second-order upwind discretisation schemes wereused for the numerical solution to increase theaccuracy and reduce numerical diffusion.
The movement of the car was solved in therelative velocity frame of reference, i.e., no slip atthe car surfaces. The ambient air velocity was setequal to the car velocity but opposite in direction(see Fig. 2). Symmetric boundary conditions (zerogradient normal to boundary) were applied to thetop and the sidewalls approximating free streamconditions. The bottom of the domain, representingthe road was defined as ‘‘moving wall’’ (correspond-ing to vehicle speed) with a no-slip condition. Theleft side of the box shown in Fig. 2 was defined asvelocity inlet. The right side of the box is theoutflow region and was defined as pressure outlet.Here, the setting of boundary values concerningchemical composition and particle properties is onlyrelevant in case of backflow at the first iterations.The end of the exhaust pipe, 52mm in diameter, wasspecified as mass flow inlet (into the surroundingcontinuum) with an exhaust gas mass flow rate (inkg s�1) and species mass fractions, respectively. Theexhaust gas flow rate was assessed from our OBDdata for the air mass flow. The exhaust gas velocitywas calculated by the CFD model based on thegiven exhaust gas flow rate, temperature anddiameter. The exhaust gas composition and fuel/air ratio were chosen following motor test benchmeasurements and fuel sulphur content. Various
ARTICLE IN PRESS
Fig. 2. Test car geometry and computational domain for the
CFD simulations. The dimensions of the car are 4288mm length,
1709mm width and 1510mm height. The inlet is located to the
left (purple mesh, the outlet to the right (red mesh), and the grey
mesh is a cross-section in the exhaust pipe plane.
Table 1
Measurement devices and their range and time resolution
Device Range Resolution Parameter
SMPS 7–400 nm 1.5 s, 90 s per scan Number size distribution
Emission analyser 0–5 vol% 15 s CO2
0–1000 ppmv 10 s NOx
Vaisala sensor 0–100% 5 s RH
�40–180 1C 5 s T
Thermocouple �25–550 1C 10ms T
Prandtl Pitot tube 0–40m s�1 10ms Velocity
OBD Vehicle dependent 1 s Car speed, rpm, air mass flow
U. Uhrner et al. / Atmospheric Environment 41 (2007) 7440–74617444
studies on atmospheric nucleation showed thatbinary homogeneous H2SO4–H2O nucleation is verysensitive to H2SO4(g) concentrations (e.g. Kulmalaet al., 1998; Vehkamaki et al., 2003; Berndt et al.,2005). Exhaust nucleation particle concentrationsare very sensitive to fuel sulphur content (e.g.Baumgard and Johnson, 1996; Kittelson, 1998;Khalek et al., 1999; Shi and Harrison, 1999; Vogtet al., 2003) and thus H2SO4(g) is considered to beimportant in particle formation in an exhaustplume. To the author’s knowledge, no exhaustplume H2SO4(g) measurements have been publishedyet. Hence, based on particle composition measure-ments taken from a heavy duty diesel engine,Baumgard and Johnson (1996) estimated the netfuel sulphur to sulphate conversion to be 4%.Within the DECSE (1999) (Diesel Emission Con-trol—Sulfur Effects Program) program, the impactof fuel sulphur content and the impact of a dieseloxidation catalyst on particulate matter emissions
were investigated for two heavy duty diesel engines.Engine sulphur conversion rates were in the range of1–3% and an increase proportional to the amountof fuel sulphur was found. However, post catalystconversion rates increased with increasing exhausttemperatures (up to 518 1C at the catalyst), andreached a maximum of 15%. In this work, H2SO4(g)
concentration fluxes are therefore prescribed as aboundary condition at the end of the exhaust pipe.The exhaust H2SO4(g) mass fraction, that can beattributed to the fuel sulphur content, can becalculated as
H2SO4ðgÞ ¼F=A� fsc� cr� wSA=wS
F=Aþ 1, (1)
where F/A is the fuel/air ratio, fsc the fuel sulphurcontent, cr the SO2 to SO3 conversion rate and wSA
and wS denote the molar weights of sulphuric acidand the sulphur, respectively. Hence, the exhaustH2SO4(g) concentration flux is the product of theH2SO4(g) mass fraction and the total exhaust massflow rate (mfr). Sulphur in the lube oil anddesorption from the exhaust line may increase theH2SO4(g) content calculated in Eq. (1). However, itis difficult to estimate the exact contribution of thesetwo sources as a boundary condition. The effect oflube oil and desorption on particle formation isfurther elaborated when results on particle nuclea-tion are presented.
Boundary conditions for the velocity inletand exhaust pipe used in this study are shown inTables 2 and 3.
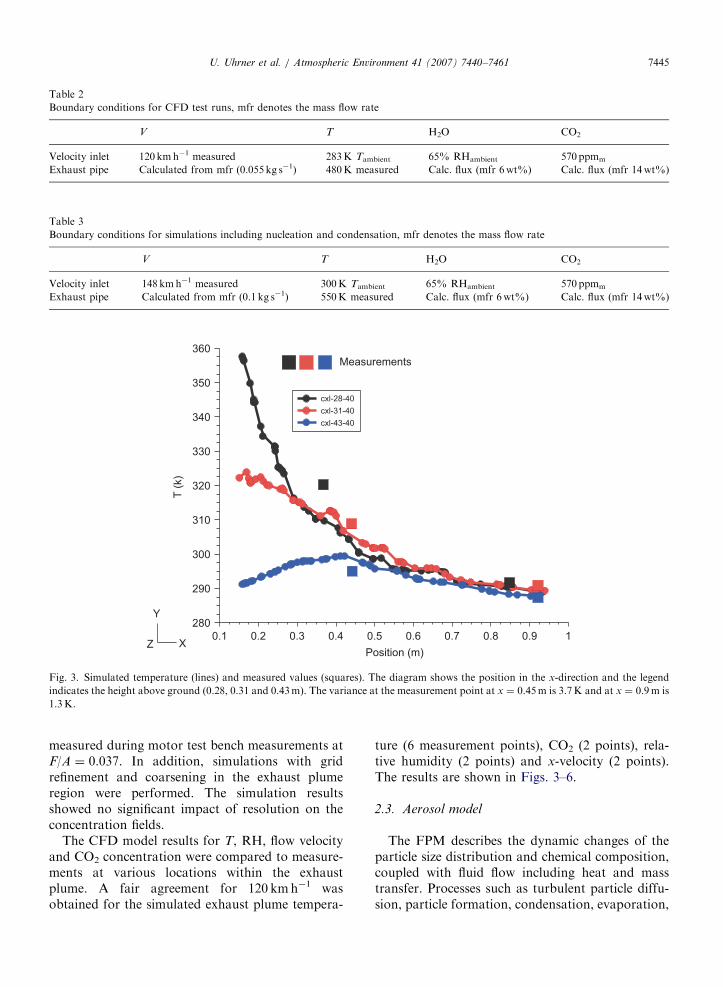
To test the CFD model, simulation results werecompared to time-averaged measurements of CO2
concentrations, temperature and relative humidityinside the dispersing plume taken from ‘‘real world’’conditions on motorways (Figs. 3–6). The boundaryconditions were chosen as shown in Table 2, and theexhaust gas composition was assumed to be that
ARTICLE IN PRESS
Table 2
Boundary conditions for CFD test runs, mfr denotes the mass flow rate
V T H2O CO2
Velocity inlet 120 kmh�1 measured 283K Tambient 65% RHambient 570 ppmm
Exhaust pipe Calculated from mfr (0.055 kg s�1) 480K measured Calc. flux (mfr 6wt%) Calc. flux (mfr 14wt%)
Table 3
Boundary conditions for simulations including nucleation and condensation, mfr denotes the mass flow rate
V T H2O CO2
Velocity inlet 148 kmh�1 measured 300K Tambient 65% RHambient 570 ppmm
Exhaust pipe Calculated from mfr (0.1 kg s�1) 550K measured Calc. flux (mfr 6wt%) Calc. flux (mfr 14wt%)
Z
Y
XPosition (m)
10.90.80.70.60.50.40.30.20.1
360
350
340
330
320
310
300
290
280
cxl-43-40
cxl-31-40
cxl-28-40
Measurements
T (
k)
Fig. 3. Simulated temperature (lines) and measured values (squares). The diagram shows the position in the x-direction and the legend
indicates the height above ground (0.28, 0.31 and 0.43m). The variance at the measurement point at x ¼ 0.45m is 3.7K and at x ¼ 0.9m is
1.3K.
U. Uhrner et al. / Atmospheric Environment 41 (2007) 7440–7461 7445
measured during motor test bench measurements atF/A ¼ 0.037. In addition, simulations with gridrefinement and coarsening in the exhaust plumeregion were performed. The simulation resultsshowed no significant impact of resolution on theconcentration fields.
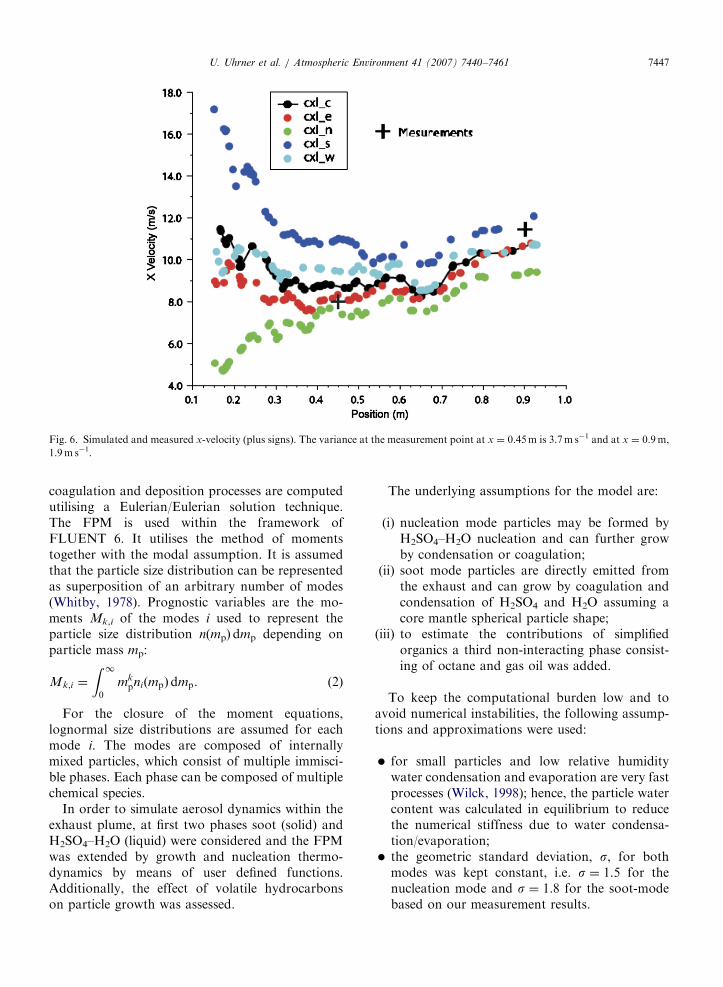
The CFD model results for T, RH, flow velocityand CO2 concentration were compared to measure-ments at various locations within the exhaustplume. A fair agreement for 120 kmh�1 wasobtained for the simulated exhaust plume tempera-
ture (6 measurement points), CO2 (2 points), rela-tive humidity (2 points) and x-velocity (2 points).The results are shown in Figs. 3–6.
2.3. Aerosol model
The FPM describes the dynamic changes of theparticle size distribution and chemical composition,coupled with fluid flow including heat and masstransfer. Processes such as turbulent particle diffu-sion, particle formation, condensation, evaporation,
ARTICLE IN PRESS
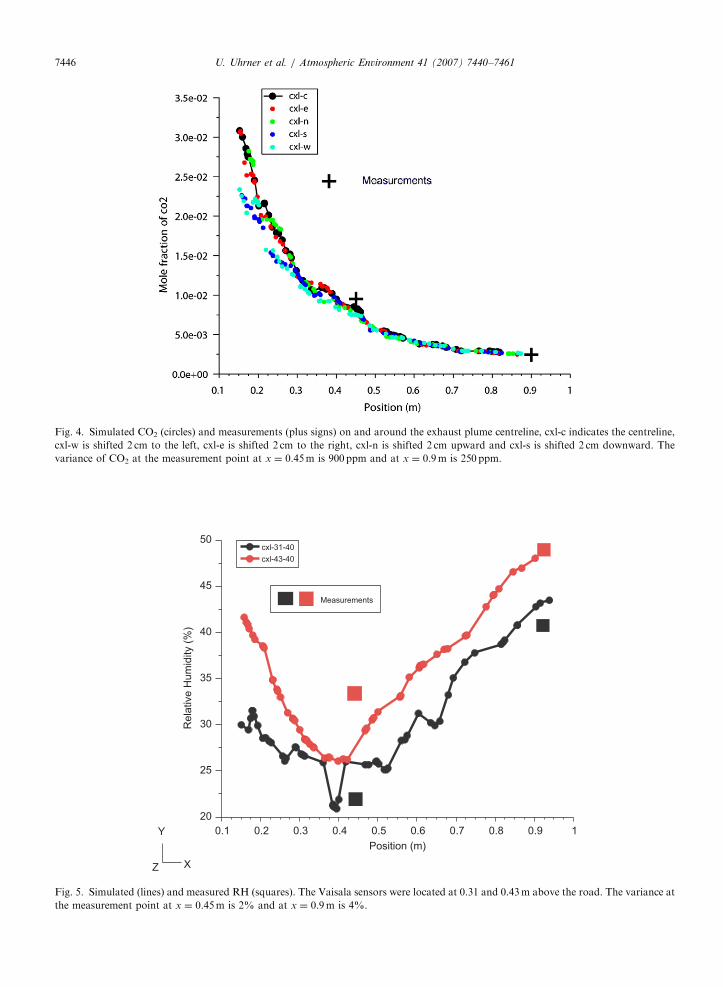
Fig. 4. Simulated CO2 (circles) and measurements (plus signs) on and around the exhaust plume centreline, cxl-c indicates the centreline,
cxl-w is shifted 2 cm to the left, cxl-e is shifted 2 cm to the right, cxl-n is shifted 2 cm upward and cxl-s is shifted 2 cm downward. The
variance of CO2 at the measurement point at x ¼ 0.45m is 900 ppm and at x ¼ 0.9m is 250 ppm.
Z
Y
X
Position (m)
10.90.80.70.60.50.40.30.20.1
50
45
40
35
30
25
20
cxl-43-40
cxl-31-40
Measurements
Re
lative
Hu
mid
ity (
%)
Fig. 5. Simulated (lines) and measured RH (squares). The Vaisala sensors were located at 0.31 and 0.43m above the road. The variance at
the measurement point at x ¼ 0.45m is 2% and at x ¼ 0.9m is 4%.
U. Uhrner et al. / Atmospheric Environment 41 (2007) 7440–74617446
ARTICLE IN PRESS
Fig. 6. Simulated and measured x-velocity (plus signs). The variance at the measurement point at x ¼ 0.45m is 3.7m s�1 and at x ¼ 0.9m,
1.9m s�1.
U. Uhrner et al. / Atmospheric Environment 41 (2007) 7440–7461 7447
coagulation and deposition processes are computedutilising a Eulerian/Eulerian solution technique.The FPM is used within the framework ofFLUENT 6. It utilises the method of momentstogether with the modal assumption. It is assumedthat the particle size distribution can be representedas superposition of an arbitrary number of modes(Whitby, 1978). Prognostic variables are the mo-ments Mk,i of the modes i used to represent theparticle size distribution n(mp) dmp depending onparticle mass mp:
Mk;i ¼
Z 10
mkpniðmpÞdmp. (2)
For the closure of the moment equations,lognormal size distributions are assumed for eachmode i. The modes are composed of internallymixed particles, which consist of multiple immisci-ble phases. Each phase can be composed of multiplechemical species.
In order to simulate aerosol dynamics within theexhaust plume, at first two phases soot (solid) andH2SO4–H2O (liquid) were considered and the FPMwas extended by growth and nucleation thermo-dynamics by means of user defined functions.Additionally, the effect of volatile hydrocarbonson particle growth was assessed.
The underlying assumptions for the model are:
(i)
nucleation mode particles may be formed byH2SO4–H2O nucleation and can further growby condensation or coagulation;(ii)
soot mode particles are directly emitted fromthe exhaust and can grow by coagulation andcondensation of H2SO4 and H2O assuming acore mantle spherical particle shape;(iii)
to estimate the contributions of simplifiedorganics a third non-interacting phase consist-ing of octane and gas oil was added.To keep the computational burden low and toavoid numerical instabilities, the following assump-tions and approximations were used:
�
for small particles and low relative humiditywater condensation and evaporation are very fastprocesses (Wilck, 1998); hence, the particle watercontent was calculated in equilibrium to reducethe numerical stiffness due to water condensa-tion/evaporation; � the geometric standard deviation, s, for bothmodes was kept constant, i.e. s ¼ 1.5 for thenucleation mode and s ¼ 1.8 for the soot-modebased on our measurement results.
ARTICLE IN PRESSU. Uhrner et al. / Atmospheric Environment 41 (2007) 7440–74617448
For H2SO4–H2O growth processes, the thermo-dynamics from Zeleznik (1991) was implemented bymeans of user-defined functions. The calculation ofthe H2SO4 and H2O mole fractions must be doneiteratively when the equilibrium approach for wateris utilised. To save CPU time parameterisationshave been developed and are described in theAppendix. The parameterised binary nucleationrate for high temperatures (300–400K) from Veh-kamaki et al. (2003) was used. The basic equationsof the FPM can be found in Wilck and Stratmann(1997).
2.4. Parameter settings and boundary conditions for
simulations
Due to the large computational efforts, we focuson two motorway operating conditions:
(a)
Fig.
coag
simu
120 kmh�1/5th gear/2600 rpm,
(b) 148 kmh�1/4th gear/4000 rpm.The measured size distribution showed a domi-nant soot mode for condition (a), whereas for (b)large dominant concentrations of nucleation parti-cles were recorded. The simulations are based on theassumption that number and size of soot mode
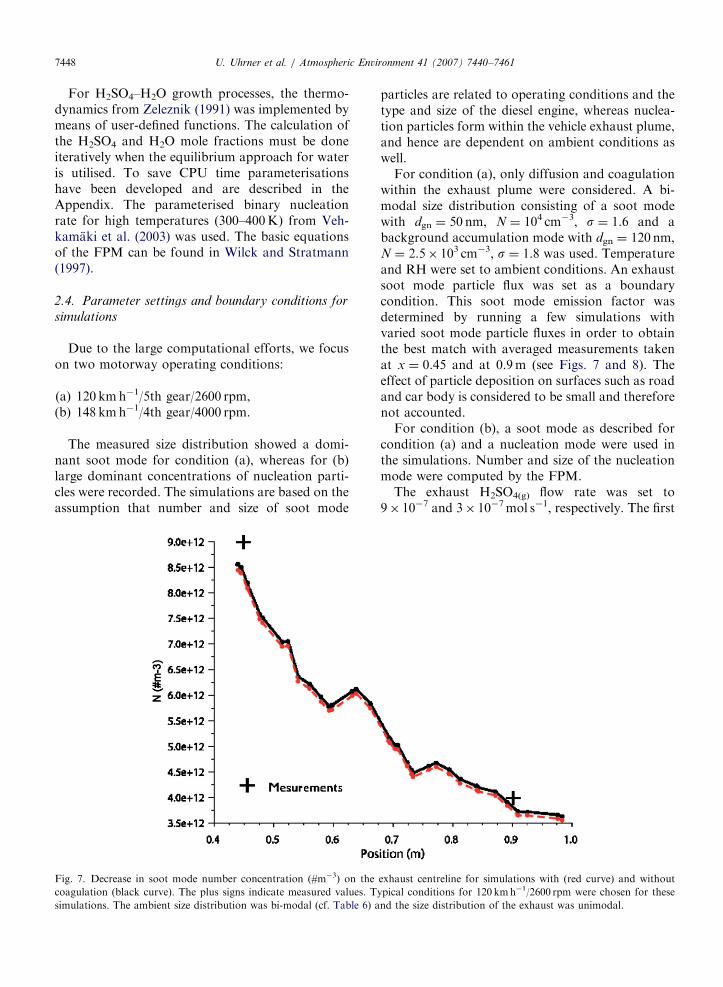
7. Decrease in soot mode number concentration (#m�3) on the
ulation (black curve). The plus signs indicate measured values. T
lations. The ambient size distribution was bi-modal (cf. Table 6) a
particles are related to operating conditions and thetype and size of the diesel engine, whereas nuclea-tion particles form within the vehicle exhaust plume,and hence are dependent on ambient conditions aswell.
For condition (a), only diffusion and coagulationwithin the exhaust plume were considered. A bi-modal size distribution consisting of a soot modewith dgn ¼ 50 nm, N ¼ 104 cm�3, s ¼ 1.6 and abackground accumulation mode with dgn ¼ 120 nm,N ¼ 2.5� 103 cm�3, s ¼ 1.8 was used. Temperatureand RH were set to ambient conditions. An exhaustsoot mode particle flux was set as a boundarycondition. This soot mode emission factor wasdetermined by running a few simulations withvaried soot mode particle fluxes in order to obtainthe best match with averaged measurements takenat x ¼ 0.45 and at 0.9m (see Figs. 7 and 8). Theeffect of particle deposition on surfaces such as roadand car body is considered to be small and thereforenot accounted.
For condition (b), a soot mode as described forcondition (a) and a nucleation mode were used inthe simulations. Number and size of the nucleationmode were computed by the FPM.
The exhaust H2SO4(g) flow rate was set to9� 10�7 and 3� 10�7mol s�1, respectively. The first
exhaust centreline for simulations with (red curve) and without
ypical conditions for 120 kmh�1/2600 rpm were chosen for these
nd the size distribution of the exhaust was unimodal.
ARTICLE IN PRESS
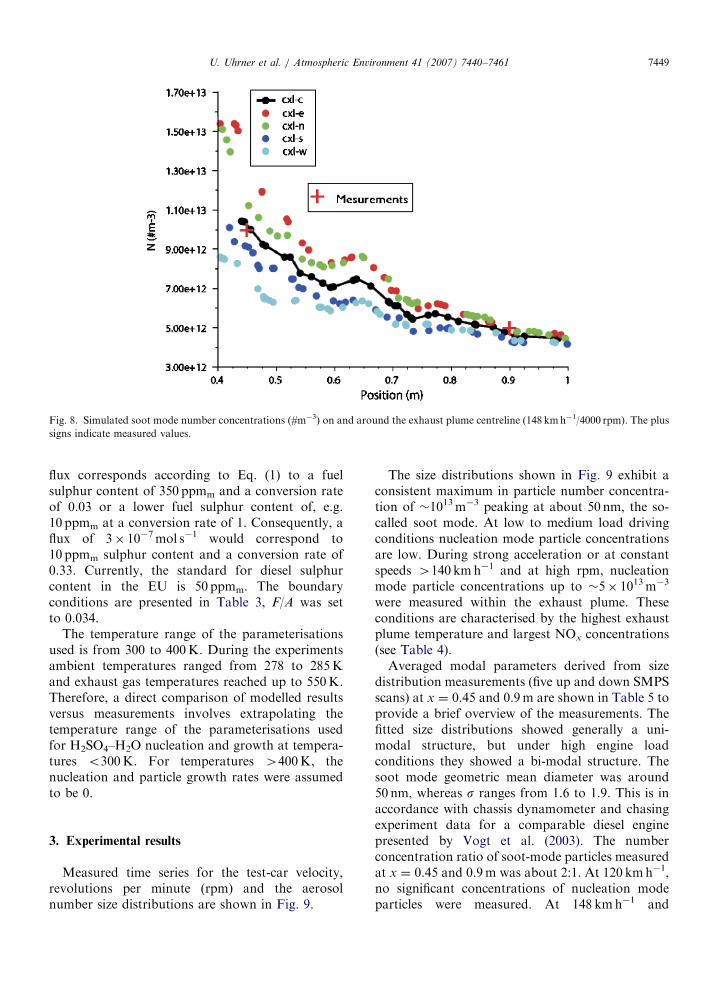
Fig. 8. Simulated soot mode number concentrations (#m�3) on and around the exhaust plume centreline (148 kmh�1/4000 rpm). The plus
signs indicate measured values.
U. Uhrner et al. / Atmospheric Environment 41 (2007) 7440–7461 7449
flux corresponds according to Eq. (1) to a fuelsulphur content of 350 ppmm and a conversion rateof 0.03 or a lower fuel sulphur content of, e.g.10 ppmm at a conversion rate of 1. Consequently, aflux of 3� 10�7mol s�1 would correspond to10 ppmm sulphur content and a conversion rate of0.33. Currently, the standard for diesel sulphurcontent in the EU is 50 ppmm. The boundaryconditions are presented in Table 3, F/A was setto 0.034.
The temperature range of the parameterisationsused is from 300 to 400K. During the experimentsambient temperatures ranged from 278 to 285Kand exhaust gas temperatures reached up to 550K.Therefore, a direct comparison of modelled resultsversus measurements involves extrapolating thetemperature range of the parameterisations usedfor H2SO4–H2O nucleation and growth at tempera-tures o300K. For temperatures 4400K, thenucleation and particle growth rates were assumedto be 0.
3. Experimental results
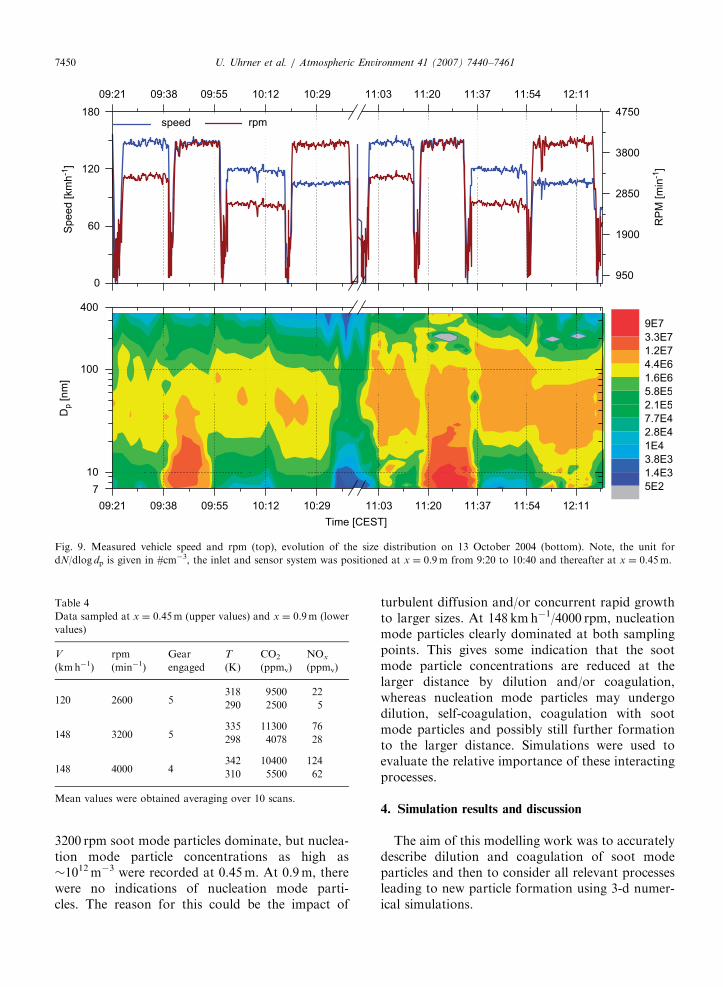
Measured time series for the test-car velocity,revolutions per minute (rpm) and the aerosolnumber size distributions are shown in Fig. 9.
The size distributions shown in Fig. 9 exhibit aconsistent maximum in particle number concentra-tion of �1013m�3 peaking at about 50 nm, the so-called soot mode. At low to medium load drivingconditions nucleation mode particle concentrationsare low. During strong acceleration or at constantspeeds 4140 kmh�1 and at high rpm, nucleationmode particle concentrations up to �5� 1013m�3
were measured within the exhaust plume. Theseconditions are characterised by the highest exhaustplume temperature and largest NOx concentrations(see Table 4).
Averaged modal parameters derived from sizedistribution measurements (five up and down SMPSscans) at x ¼ 0.45 and 0.9m are shown in Table 5 toprovide a brief overview of the measurements. Thefitted size distributions showed generally a uni-modal structure, but under high engine loadconditions they showed a bi-modal structure. Thesoot mode geometric mean diameter was around50 nm, whereas s ranges from 1.6 to 1.9. This is inaccordance with chassis dynamometer and chasingexperiment data for a comparable diesel enginepresented by Vogt et al. (2003). The numberconcentration ratio of soot-mode particles measuredat x ¼ 0.45 and 0.9m was about 2:1. At 120 kmh�1,no significant concentrations of nucleation modeparticles were measured. At 148 kmh�1 and
ARTICLE IN PRESS
09:21 09:38 09:55 10:12 10:29 11:03 11:20 11:37 11:54 12:11
7
10
100
400
Dp [
nm
]
5E2
1.4E3
3.8E3
1E4
2.8E4
7.7E4
2.1E5
5.8E5
1.6E6
4.4E6
1.2E7
3.3E7
9E7
0
60
120
180 speed
Sp
ee
d [
km
h-1
]
09:21 09:38 09:55 10:12 10:29 11:03 11:20 11:37 11:54 12:11
950
1900
2850
3800
4750
RP
M [
min
-1]
rpm
Time [CEST]
Fig. 9. Measured vehicle speed and rpm (top), evolution of the size distribution on 13 October 2004 (bottom). Note, the unit for
dN/dlog dp is given in #cm�3, the inlet and sensor system was positioned at x ¼ 0.9m from 9:20 to 10:40 and thereafter at x ¼ 0.45m.
Table 4
Data sampled at x ¼ 0.45m (upper values) and x ¼ 0.9m (lower
values)
V
(kmh�1)
rpm
(min�1)
Gear
engaged
T
(K)
CO2
(ppmv)
NOx
(ppmv)
120 2600 5318 9500 22
290 2500 5
148 3200 5335 11300 76
298 4078 28
148 4000 4342 10400 124
310 5500 62
Mean values were obtained averaging over 10 scans.
U. Uhrner et al. / Atmospheric Environment 41 (2007) 7440–74617450
3200 rpm soot mode particles dominate, but nuclea-tion mode particle concentrations as high as�1012m�3 were recorded at 0.45m. At 0.9m, therewere no indications of nucleation mode parti-cles. The reason for this could be the impact of
turbulent diffusion and/or concurrent rapid growthto larger sizes. At 148 kmh�1/4000 rpm, nucleationmode particles clearly dominated at both samplingpoints. This gives some indication that the sootmode particle concentrations are reduced at thelarger distance by dilution and/or coagulation,whereas nucleation mode particles may undergodilution, self-coagulation, coagulation with sootmode particles and possibly still further formationto the larger distance. Simulations were used toevaluate the relative importance of these interactingprocesses.
4. Simulation results and discussion
The aim of this modelling work was to accuratelydescribe dilution and coagulation of soot modeparticles and then to consider all relevant processesleading to new particle formation using 3-d numer-ical simulations.
ARTICLE IN PRESS
Table 6
PM background values
N (m�3) dgn (nm) s
Ait-mode 1e10 50 1.8
Acc-mode 2.5e9 120 1.9
Table 5
PM emissions: data sampled at x ¼ 0.45m (upper values) and x ¼ 0.9m (lower values)
V (kmh�1) rpm (min�1) Nnuc (m�3) dg-nuc (nm) snuc Nsoot (m
�3) dg-soot (nm) ssoot
120 2600– – – 9e12 45 1.6
– – – 4e12 51 1.6
148 32001e12 10 1.3 8e12 48 1.9
– – – 3e12 52 1.7
148 40005e13 6 1.9 1e13 44 1.8
2e13 11 1.5 5e12 45 1.6
Mean values were obtained by fitting SMPS size distributions to a log-normal distribution from 10 scans.
U. Uhrner et al. / Atmospheric Environment 41 (2007) 7440–7461 7451
Measurements or simulations of engine andexhaust aftertreatment-related effects and processesare beyond the scope of this work. Hence, exhaustgas flow and composition were prescribed. First,dilution and coagulation of a uni-modal exhaustsoot mode distribution will be examined beforeadditionally simulated growth and nucleation willbe analysed.
4.1. Dilution and coagulation of soot mode particles
An exhaust soot-mode emission factor of7� 1012 s�1 (2.1� 1014 km�1) was determined byfitting soot-mode number concentrations measure-ments to simulations at x ¼ 0.45 and 0.9m forsimulations representing operating conditions of120 kmh�1 and 2600 rpm (see Fig. 7).
In order to asses the impact of coagulation withinthe exhaust plume, two cases were calculatedconsidering (i) only particle diffusion and (ii) particlediffusion and coagulation. The boundary conditionswere the same in both cases (Table 2). Thebackground particle number concentrations repre-sent the urban background of Leipzig (Wehner,2000) and are shown in Table 6. Fig. 7 shows thatthe impact of coagulation in the near plume regionis negligible and the decrease in Nsoot within 1mdistance is primarily due to turbulent dilution. Thereason for the minor impact of coagulation is theshort residence time (o0.1 s) of particles in the near-exhaust region as opposed to rapid dilution.
Exhaust jet emissions do not penetrate to a largeextent in the recirculation zone higher up in thewake of the vehicle (see Fig. 10) where highresidence times can lead to a large effect ofcoagulation in reducing particle concentrations.Jiang et al. (2005) obtained similar results for theexhaust plume simulations of a slowly (up to32 kmh�1) moving truck.
4.2. Simulations with condensation and nucleation
The aim of the following simulations was to studyhomogeneous H2SO4–H2O nucleation within thewake of the car and to attain a 3-d representation ofnucleation particle concentrations and other rele-vant parameters. These fields were used to analysesecondary exhaust particle formation and furtherinterpretation of our measurements. As described inthe previous section, the impact of an accumulationmode to coagulation scavenging is negligible.Assuming a soot mode particle concentration of1012m�3 with 50 nm mean diameter within theexhaust plume, and a background accumulationmode concentration of 2.5� 109m�3 with 120 nmdiameter, the particle surface area concentration ofsoot mode particles is roughly two orders ofmagnitude larger than the accumulation modeconcentrations. Hence, the impact of a backgroundaccumulation mode acting as a condensational sinkwithin the test-car exhaust plume should benegligible as a first approximation. In the followingsimulations, focusing on nucleation and condensa-tion a bi-modal size distribution was used to reducethe computational burden compared with tri-modalsimulations.
The soot-mode emission factor was determined to1� 1013 s�1 (2.6� 1014 km�1) for 148 kmh�1 and4000 rpm (see Fig. 8).
As shown in Fig. 11, a sulphuric acid flux of9� 10�7mol s�1 results in �1013m�3 nucleation
ARTICLE IN PRESS
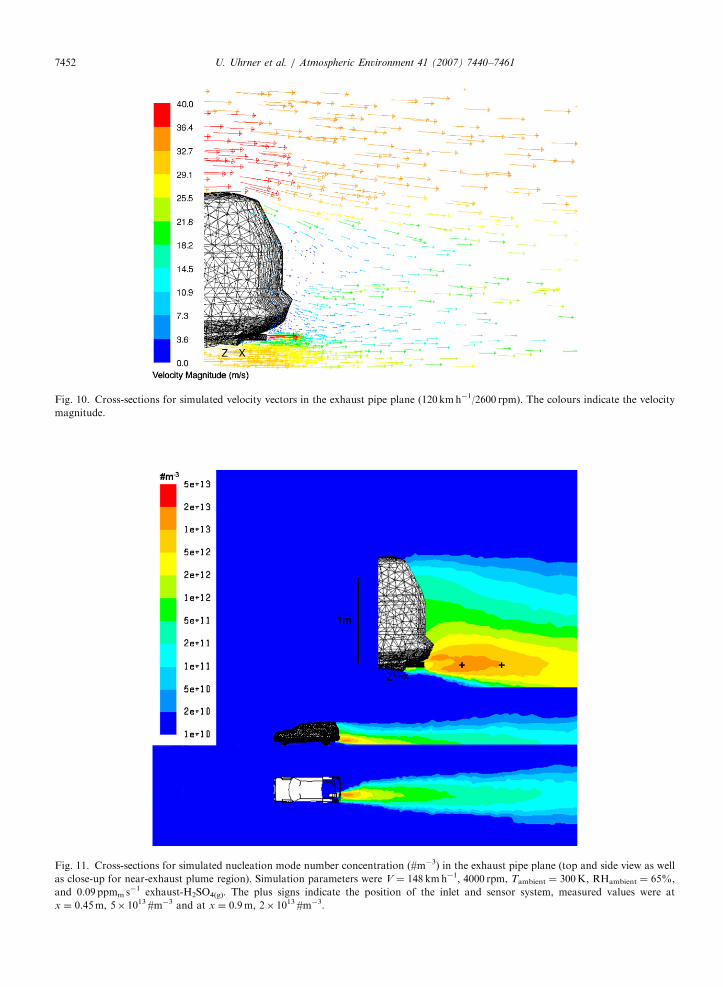
Fig. 10. Cross-sections for simulated velocity vectors in the exhaust pipe plane (120 kmh�1/2600 rpm). The colours indicate the velocity
magnitude.
Fig. 11. Cross-sections for simulated nucleation mode number concentration (#m�3) in the exhaust pipe plane (top and side view as well
as close-up for near-exhaust plume region). Simulation parameters were V ¼ 148 kmh�1, 4000 rpm, Tambient ¼ 300K, RHambient ¼ 65%,
and 0.09 ppmm s�1 exhaust-H2SO4(g). The plus signs indicate the position of the inlet and sensor system, measured values were at
x ¼ 0.45m, 5� 1013 #m�3 and at x ¼ 0.9m, 2� 1013 #m�3.
U. Uhrner et al. / Atmospheric Environment 41 (2007) 7440–74617452
ARTICLE IN PRESSU. Uhrner et al. / Atmospheric Environment 41 (2007) 7440–7461 7453
particles in the near-exhaust region (at x ¼ 0.45m,1.5� 1013m�3 and at x ¼ 0.9m, 0.9� 1013m�3. Afactor of 3 lower sulphuric acid flux results in asignificantly decreased nucleation rate and predictednucleation particle concentrations are slightly high-er than the background number concentrations, i.e.�1011m�3(not shown).
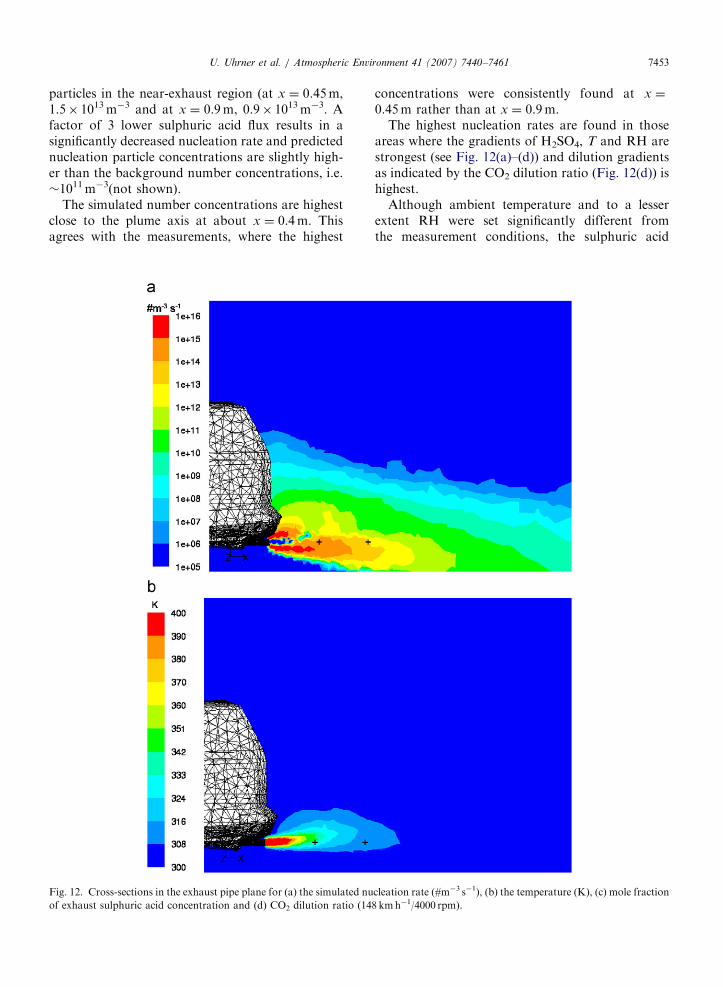
The simulated number concentrations are highestclose to the plume axis at about x ¼ 0.4m. Thisagrees with the measurements, where the highest
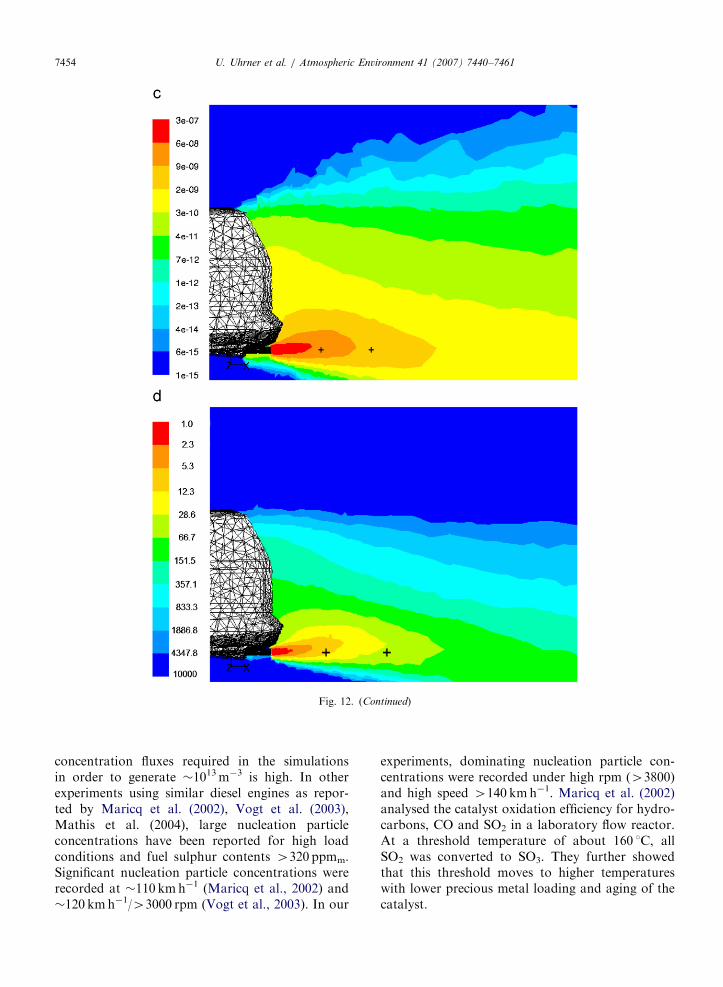
Fig. 12. Cross-sections in the exhaust pipe plane for (a) the simulated nu
of exhaust sulphuric acid concentration and (d) CO2 dilution ratio (14
concentrations were consistently found at x ¼
0.45m rather than at x ¼ 0.9m.The highest nucleation rates are found in those
areas where the gradients of H2SO4, T and RH arestrongest (see Fig. 12(a)–(d)) and dilution gradientsas indicated by the CO2 dilution ratio (Fig. 12(d)) ishighest.
Although ambient temperature and to a lesserextent RH were set significantly different fromthe measurement conditions, the sulphuric acid
cleation rate (#m�3 s�1), (b) the temperature (K), (c) mole fraction
8 kmh�1/4000 rpm).
ARTICLE IN PRESS
Fig. 12. (Continued)
U. Uhrner et al. / Atmospheric Environment 41 (2007) 7440–74617454
concentration fluxes required in the simulationsin order to generate �1013m�3 is high. In otherexperiments using similar diesel engines as repor-ted by Maricq et al. (2002), Vogt et al. (2003),Mathis et al. (2004), large nucleation particleconcentrations have been reported for high loadconditions and fuel sulphur contents 4320 ppmm.Significant nucleation particle concentrations wererecorded at �110 kmh�1 (Maricq et al., 2002) and�120 kmh�1/43000 rpm (Vogt et al., 2003). In our
experiments, dominating nucleation particle con-centrations were recorded under high rpm (43800)and high speed 4140 kmh�1. Maricq et al. (2002)analysed the catalyst oxidation efficiency for hydro-carbons, CO and SO2 in a laboratory flow reactor.At a threshold temperature of about 160 1C, allSO2 was converted to SO3. They further showedthat this threshold moves to higher temperatureswith lower precious metal loading and aging of thecatalyst.
ARTICLE IN PRESSU. Uhrner et al. / Atmospheric Environment 41 (2007) 7440–7461 7455
When the fuel sulphur content is low and thevehicle is operated under high load, lube oil canbecome a relevant additional source for exhaustH2SO4(g) due to its high sulphur content. The lubeoil consumption is increased in the engine andespecially at the turbo charger. Assuming a lube oilconsumption of 1/1000 of fuel consumption and alube oil sulphur content of 6000 ppmm, lube oil canmake up to 6 ppmm fuel equivalent (Mathis et al.,2004). The high engine load conditions may furtherincrease the lube oil consumption. In addition,purging of stored sulphur and further oxidationmay occur at high catalyst temperatures of about500 1C (Maricq et al., 2002).
Therefore, for a car running with diesel fuel withlow fuel sulphur content, the simulation resultssuggest that the measured nucleation particleconcentration may be explained by high engineload car operating conditions. At these operatingconditions, exhaust sulphuric acid concentrationscan be enhanced due to (i) higher sulphur–sulphateconversion rates at the catalyst related to higherexhaust temperature, (ii) release of stored sulphateon catalyst and other surfaces formed at lessextreme conditions (Maricq et al., 2002; Casatiet al., 2004), and (iii) a higher fuel and lube oilconsumption rate. Particle size distribution mea-surements made at busy urban roads indicate asignificant nucleation mode (Wehner et al., 2004).In urban traffic strong accelerations at, e.g.,traffic lights or driving uphill may also lead tohigh rpm and exhaust temperature, large airmass flow and consequently purging of storedsulphate which may lead to increased new particleformation.
Laboratory experiments with dilution devicesindicate a strong impact of dilution air temperatureand humidity on nucleation particles. Hence,ambient temperatures may have influenced thenumber concentrations. Kittelson et al. (2004)found higher number concentrations related tolower ambient temperature. However, these mea-surements were affected by a gasoline-dominatedvehicle fleet. In our simulation, ambient humiditywas set to the measured relative humidity, RH, of65%. However, due to limitations in the parameter-isations used (temperature range 300–400K), themodel ambient temperature was set to 300K, whichis �15K higher than the measured one. Extrapolat-ing the parameterisation beyond the validated rangerequires �3� 10�7mol s�1 H2SO4(g) exhaust flux toobtain number concentrations (at x ¼ 0.45m,
4� 1013m�3 and at x ¼ 0.9m, 2� 1013m�3) similarto measured ones (� an fsc of 10 ppmm and aconversion rate of 0.33).
It has been reported that the classical binaryH2SO4–H2O nucleation theory underestimates theobserved formation of nucleation mode particles byseveral orders of magnitude and thus further speciesare suspected to be involved in nucleation (Shi andHarrison, 1999; Khalek et al., 2000). Kim et al.(2002) suggested that HNO3 can act as a precursorin low sulphur fuel. Other authors suggested thatsimilar to the proposed ternary atmospheric nuclea-tion (Kulmala et al., 1998, 2000; Napari et al.,2002), ammonia can increase nucleation rates due toits significant presence in gasoline exhaust gas.Mathis et al. (2004) investigated the role of organicvapours in dilution air of diesel exhaust using a fuelwith 4300 ppmm sulphur content. Organic com-pounds such as toluene and alcohols increased thenumber of nucleation particles formed. Our simula-tion results using binary H2SO4–H2O theoriesindicate a strong sensitivity of particle formationto sulphuric acid concentrations. Given the mea-surement conditions at which dominant nucleationparticle concentrations were recorded, we concludethat in addition to strong mixing and high conver-sion rates, additional sulphur contributions fromlube oil and purging of stored sulphur are requiredto obtain an approximate accordance betweenmeasured and simulated nucleation particle numberconcentrations.
4.3. Growth of nucleation particles
For H2SO4–H2O nucleation particles, the simu-lated growth throughout the exhaust plume waslower than measured rates. Simulated nucleationparticles grew to about 2.5 nm in diameter, far lowerthan the detection limit of the SMPS system (7 nm).Soot mode particles increased only about �0.2 nmin diameter. Three control simulations were runwhere (i) the Kelvin effect was neglected using theparameterisation Eq. (A.1), (ii) the H2SO4(g) massflux was increased, and (iii) the H2SO4(g) mass fluxwas increased and the nucleation rate was reducedby a linear factor ( ¼ 0.001). For the given modelconfiguration, we found that neglecting the Kelvineffect did not result in significantly increased growthof nucleation particles. Increasing H2SO4(g) did notresult in detectable particles since the nucleationrate is highly sensitive to changes in the H2SO4(g)
flux leading to larger concentrations of particles too
ARTICLE IN PRESSU. Uhrner et al. / Atmospheric Environment 41 (2007) 7440–74617456
small to detect. However, case (iii) increasedH2SO4(g) fluxes and reduced nucleation rates,resulted in significant growth of nucleation parti-cles. Hence, the reason that nucleation particles donot grow sufficiently is mainly due to the small massof condensable vapour available and to the strongcondensational sink of soot mode particles. Thisfinding is consistent with Khalek et al. (2000). Theirresults indicated that there is not enough H2SO4
vapour in the exhaust to explain observed growth. Itshould be noted that the number of parametersaffecting nucleation and growth is large. TheH2SO4(g) saturation is affected by dilution, tem-perature, and number and size of nucleationand soot particles. Interaction with the exhaustplume water concentration also affects the nuclea-tion rate.
Kim et al. (2002) obtained in their truck windtunnel simulations particles growing up to �100 nmdiameter for a fuel with 125 ppmm and a conversionrate of 0.04. However, in their work, the presence ofsoot mode particles was not taken into account andCFD and the aerosol model were not fully coupled.
As indicated by several other studies on heavyduty diesel engines, condensation of low and semi-volatile hydrocarbons may explain sufficient growth(Khalek et al., 2000) and composition (Tobias et al.,2001; Sakurai et al., 2003), of nucleation particles.Sakurai et al. (2003) found that the volatilecomponent of diesel nanoparticles is comprised ofat least 95% of unburned lubricating oil. Further-more, the organic component was comprised ofcarbon numbers C24–C32 which were derivedentirely from unburned oil.
Two condensable hydrocarbon compounds werechosen to estimate contributions of low volatilehydrocarbons on nucleation particle growth atmaximum. The aliphatic hydrocarbons octane(C8H18) and gasoil (C19H29) were used. Interactionswith H2SO4 and H2O were not taken into account,i.e., H2SO4–H2O and hydrocarbons were treated asa two-phase liquid system as suggested by Tobiaset al. (2001). Mathis et al. (2004) investigated therole of organic vapours in dilution air of dieselexhaust and aliphatic hydrocarbons turned out tohave no effect on the nucleation process. For bothspecies, thermodynamic data from the FLUENTdatabase have been used. The exhaust gas flow waschosen to be �40% of EU HC emission limit(0.56 g km�1), the equilibrium vapour pressure wasset to 10�10 Pa based on an estimation of Tobiaset al. (2001).
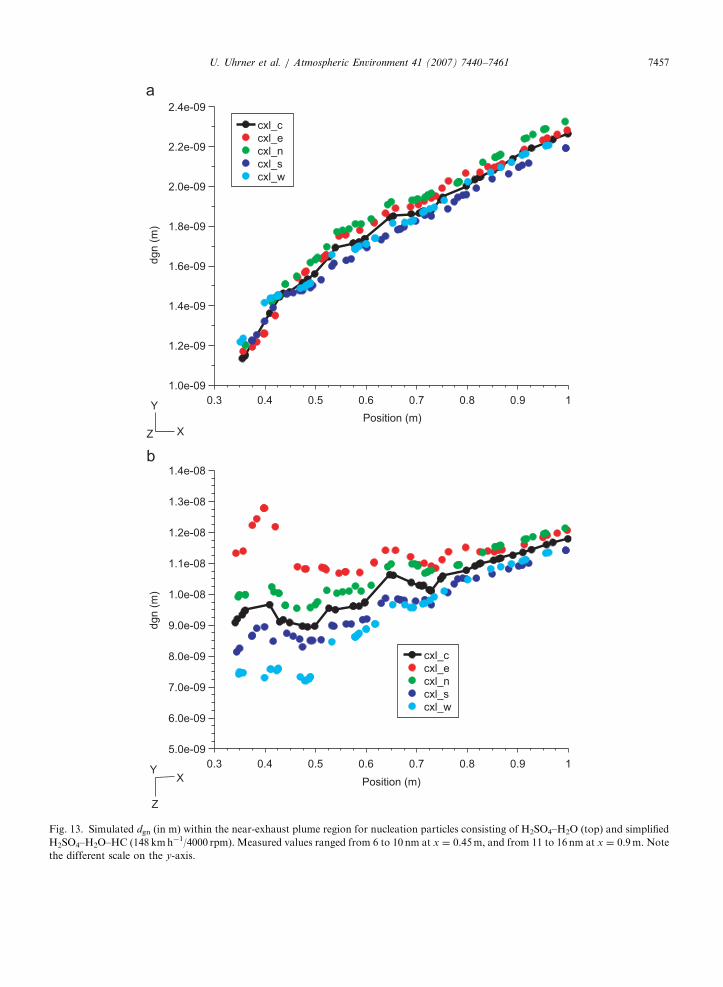
Fig. 13 shows the growth of simplified H2SO4–H2O–HC nucleation particles compared toH2SO4–H2O nucleation particles. The growth with-in the exhaust plume is significantly higher forparticles with hydrocarbons. Nucleation particlesgrow to 15 nm in the near-exhaust region comparedto the binary system, where they only grow to�2.5 nm.
These results, together with the measurements,suggest that at high exhaust temperature there couldbe an important combination of effects enhancingnew particle formation and particle growth. First,due to the high exhaust temperature a majorfraction of volatile and semi-volatile species remainin the vapour phase, unless rapid dilution in theexhaust plume occurs. Second, the large amount ofcondensable mass leaving the exhaust pipe leads tohigh supersaturations favouring nucleation andrapid growth during rapid dilution. In contrast, atlower temperatures the semi-volatile species mayalready condense on the solid soot-mode particleswithin the exhaust system.
Simulation results with additional simplifiedhydrocarbons showed the potential of semi-volatilehydrocarbons in nucleation particle growth. Thecondensational growth of octane and gas–oilhydrocarbons between the exhaust pipe exit and�1m distance was sufficient to grow particles to10 nm and larger.
5. Conclusions
A physical model was developed that accounts forthe effects of dilution, nucleation, condensation andcoagulation on particle formation and growth in theexhaust plume of a diesel fuelled vehicle, bycombining a CFD model (FLUENT) with a fullycoupled aerosol model, called the Fine ParticleModel (FPM). The CFD set-up was verified againstmeasurements within the exhaust plume. Fortemperature, humidity and CO2 fair agreementbetween measurements and simulation results wasobtained. Nucleation particle concentrations andgrowth were predicted using binary homogenousnucleation theory and assumptions about exhaustprecursor gas emissions. Exhaust soot mode particleemission factors were determined based on plumemeasurements at 0.45 and 0.9m. Two steady stateconditions were modelled, one representing dom-inating soot mode concentrations as predominantlyfound in our measurements at medium motorwayengine load conditions (120 kmh�1/2600 rpm).
ARTICLE IN PRESS
Z
Y
X
Position (m)
dgn (
m)
10.90.80.70.60.50.40.3
2.4e-09
2.2e-09
2.0e-09
1.8e-09
1.6e-09
1.4e-09
1.2e-09
1.0e-09
cxl_w
cxl_s
cxl_n
cxl_e
cxl_c
Z
YX Position (m)
dgn (
m)
10.90.80.70.60.50.40.3
1.4e-08
1.3e-08
1.2e-08
1.1e-08
1.0e-08
9.0e-09
8.0e-09
7.0e-09
6.0e-09
5.0e-09
cxl_w
cxl_s
cxl_n
cxl_e
cxl_c
Fig. 13. Simulated dgn (in m) within the near-exhaust plume region for nucleation particles consisting of H2SO4–H2O (top) and simplified
H2SO4–H2O–HC (148 kmh�1/4000 rpm). Measured values ranged from 6 to 10 nm at x ¼ 0.45m, and from 11 to 16 nm at x ¼ 0.9m. Note
the different scale on the y-axis.
U. Uhrner et al. / Atmospheric Environment 41 (2007) 7440–7461 7457
ARTICLE IN PRESSU. Uhrner et al. / Atmospheric Environment 41 (2007) 7440–74617458
The other represented high load test car operatingconditions (148 kmh�1/4000 rpm) under which highnucleation particle concentrations 41013m�3 weremeasured.
The simulations revealed the importance of anaccurate description of turbulent species and particletransport. Rapid dispersion of soot mode particles isthe dominating process to explain the measureddecrease of soot mode number concentrationsbetween 0.45 and 0.9m behind the exhaust pipe.The impact of coagulation on soot mode numberconcentrations was negligible. A soot mode emissionfactor of 2.1� 1014 km�1 was determined based onour measurements for conditions representing120kmh�1 and 2600 rpm, 2.6� 1014 km�1 for con-ditions representing 148kmh�1 and 4000 rpm.
Simulations for 148 kmh�1/4000 rpm showed astrong sensitivity of nucleation mode particles toprescribed H2SO4(g) exhaust fluxes: 9� 10�7mol s�1
resulted in up to 2� 1013m�3 at 0.45m and1� 1013m�3 at 0.9m distance behind the exhaustpipe. This H2SO4(g) exhaust flux corresponds to afuel sulphur content of 10 ppmm and a conversionrate of 1 at T ¼ 300K. Highest nucleation rates arelocated where gradients of temperature, humidityand H2SO4(g) are strongest and dilution gradients asindicated by CO2 are strongest.
In contrast to other measurements, the test carwas run with ultra low sulphur fuel (o10 ppmm),which has been the most common diesel fuel inGermany since 2005. Our results based on measure-ments and simulations suggest that large nucleationparticle number concentrations are related to strongdilution gradients, high SO2 to SO3 conversion ratesand additional sulphur contributions from lube oiland purging of stored sulphur at high engine loadconditions.
For the prescribed H2SO4(g) exhaust flux, thesimulated growth of H2SO4–H2O particles wasunrealistically low to explain measured nucleationparticle concentrations. The reason for the simu-lated insufficient growth is the limited condensableH2SO4–H2O vapour mass opposed to the strongadditional condensational sink of soot mode parti-cles. Hence, other low and semi-volatile condensa-ble species such as hydrocarbons are required toexplain size and number concentrations of mea-sured nucleation particles.
Simulation results with additional simplified lowand semi-volatile hydrocarbons suggest that thegrowth of nucleation mode particles within closedistance (�1m) from the exhaust pipe could be
caused by organic species with very low vapourpressures.
Our simulation results are limited with respect toexact boundary conditions and complex engine andexhaust aftertreatment thermodynamics affectingthe emissions of volatile species. Additional motortest-bed measurements (e.g. HC or even H2SO4) andmeasurements at the catalyst (e.g. catalyst tempera-ture) may provide further important information.Combined CFD and aerosol model simulations maybe used for the design of exhaust aftertreatmentdevices and their impact on, e.g., nucleation ordiffusion loss due to wall adsorption in the nearfuture.
Acknowledgements
This project was funded by the German ResearchCouncil (DFG). Technical support by Martin Wilckfrom Particle-Dynamics is highly acknowledged.We thank Ulf Kirchner (Ford Research CentreAachen), Thomas Beckmann (Daimler-Chrysler)and Michael Zallinger (TU-Graz) for interestingand helpful discussions.
Appendix
Mole fraction parameterisations
To save computing time, we developed a para-meterisation for the sulphuric acid mole fraction x
in water solution which results in a set relativehumidity, RH, in the equilibrium vapour oversolution surface. Separate parameterisations weredeveloped for the flat surface case and for thesolution droplet with radius r.
For the flat surface case, the equation giving themole fraction equilibrium is
RH ¼ Al;wðx;TÞ,
where Al,w is the experimentally based liquid phaseactivity of water for sulphuric acid solution and T istemperature. We used values for the liquid phaseactivity from Zeleznik (1991).
For the spherical droplet with radius r, theequation RH can be expressed as
RH ¼ Al;wðx;TÞ exp2sðx;TÞvwðx;TÞ
rkT
� �,
where k is the Boltzmann constant, s is the surfacetension of the solution, vw is the partial molecular
ARTICLE IN PRESS
0 20 40 60 80 100
0
0.1
0.2
0.3
0.4
0.5
Spherical droplet
RH (%)
x
r=1.5nm
r=96nm
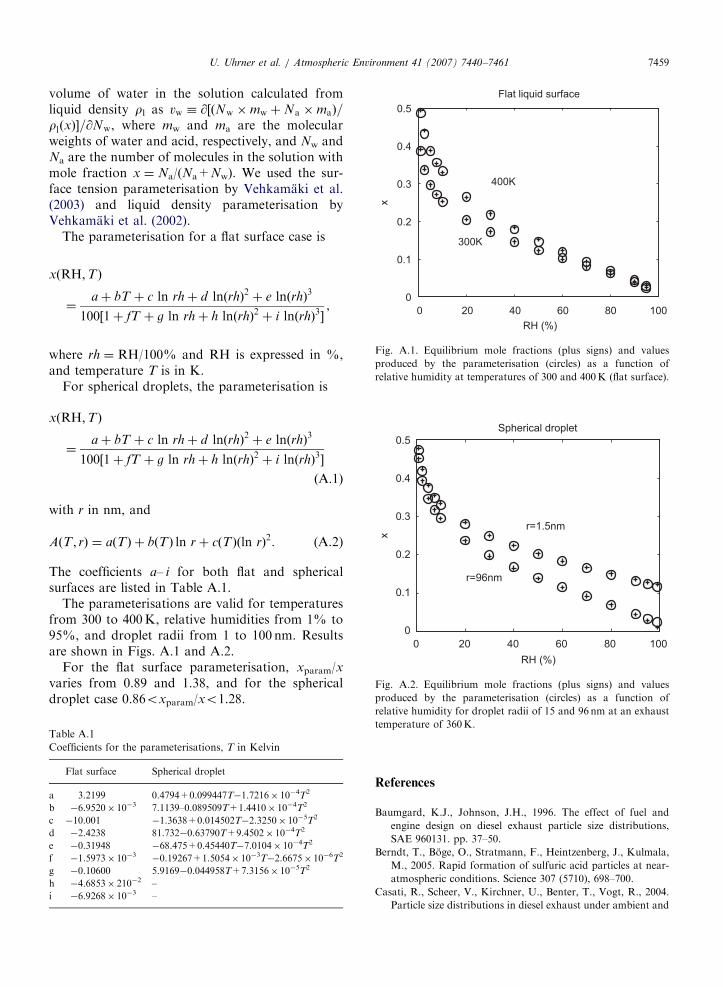
Fig. A.2. Equilibrium mole fractions (plus signs) and values
produced by the parameterisation (circles) as a function of
0 20 40 60 80 100
0
0.1
0.2
0.3
0.4
0.5
RH (%)
x
Flat liquid surface
400K
300K
Fig. A.1. Equilibrium mole fractions (plus signs) and values
produced by the parameterisation (circles) as a function of
relative humidity at temperatures of 300 and 400K (flat surface).
U. Uhrner et al. / Atmospheric Environment 41 (2007) 7440–7461 7459
volume of water in the solution calculated fromliquid density rl as vw � @½ðNw �mw þNa �maÞ=rlðxÞ�=@Nw, where mw and ma are the molecularweights of water and acid, respectively, and Nw andNa are the number of molecules in the solution withmole fraction x ¼ Na/(Na+Nw). We used the sur-face tension parameterisation by Vehkamaki et al.(2003) and liquid density parameterisation byVehkamaki et al. (2002).
The parameterisation for a flat surface case is
xðRH;TÞ
¼aþ bT þ c ln rhþ d lnðrhÞ2 þ e lnðrhÞ3
100½1þ fT þ g ln rhþ h lnðrhÞ2 þ i lnðrhÞ3�,
where rh ¼ RH/100% and RH is expressed in %,and temperature T is in K.
For spherical droplets, the parameterisation is
xðRH;TÞ
¼aþ bT þ c ln rhþ d lnðrhÞ2 þ e lnðrhÞ3
100½1þ fT þ g ln rhþ h lnðrhÞ2 þ i lnðrhÞ3�
ðA:1Þ
with r in nm, and
AðT ; rÞ ¼ aðTÞ þ bðTÞ ln rþ cðTÞðln rÞ2. (A.2)
The coefficients a– i for both flat and sphericalsurfaces are listed in Table A.1.
The parameterisations are valid for temperaturesfrom 300 to 400K, relative humidities from 1% to95%, and droplet radii from 1 to 100 nm. Resultsare shown in Figs. A.1 and A.2.
For the flat surface parameterisation, xparam/xvaries from 0.89 and 1.38, and for the sphericaldroplet case 0.86oxparam/xo1.28.
relative humidity for droplet radii of 15 and 96 nm at an exhaust
temperature of 360K.Table A.1
Coefficients for the parameterisations, T in Kelvin
Flat surface Spherical droplet
a 3.2199 0.4794+0.099447T�1.7216� 10�4T2
b �6.9520� 10�3 7.1139–0.089509T+1.4410� 10�4T2
c �10.001 �1.3638+0.014502T�2.3250� 10�5T2
d �2.4238 81.732�0.63790T+9.4502� 10�4T2
e �0.31948 �68.475+0.45440T�7.0104� 10�4T2
f �1.5973� 10�3 �0.19267+1.5054� 10�3T�2.6675� 10�6T2
g �0.10600 5.9169�0.044958T+7.3156� 10�5T2
h �4.6853� 210�2 –
i �6.9268� 10�3 –
References
Baumgard, K.J., Johnson, J.H., 1996. The effect of fuel and
engine design on diesel exhaust particle size distributions,
SAE 960131. pp. 37–50.
Berndt, T., Boge, O., Stratmann, F., Heintzenberg, J., Kulmala,
M., 2005. Rapid formation of sulfuric acid particles at near-
atmospheric conditions. Science 307 (5710), 698–700.
Casati, R., Scheer, V., Kirchner, U., Benter, T., Vogt, R., 2004.
Particle size distributions in diesel exhaust under ambient and
ARTICLE IN PRESSU. Uhrner et al. / Atmospheric Environment 41 (2007) 7440–74617460
laboratory dilution conditions. In: Proceedings of the
Eighth ETH Conference on Combustion Generated Nano-
particles.
DECSE, 1999. Phase I Interim Data Report No. 3: Diesel Fuel
Sulfur Effects on Particulate Matter Emissions, US Depart-
ment of Energy.
Donaldson, K., Li, X.Y., MacNee, W., 1998. Ultrafine (nano-
metre) particle mediated lung injury. Journal of Aerosol
Science 29, 553–560.
Giechaskiel, B., Ntziachristos, L., Samaras, Z., Scheer, V.,
Casati, R., Vogt, R., 2005. Formation potential of vehicle
exhaust nucleation mode particles on-road and in the
laboratory. Atmospheric Environment 39, 3191–3198.
Harris, S.J., Maricq, M.M., 2001. Signature size distributions for
diesel and gasoline engine exhaust particulate matter. Journal
of Aerosol Science 32, 749–764.
Jacobson, M.Z., 2002. Control of fossil-fuel particulate black
carbon and organic matter, possibly the most effective
method of slowing global warming. Journal of Geophysical
Research 107 (D19), 4410.
Jiang, P., Lignell, D.O., Kelly, K., Lighty, J.S., Sarofim, A.F.,
Montgomery, C.J., 2005. Simulation of the evolution of
particle size distributions in a vehicle exhaust plume with
unconfined dilution by ambient air. Journal of the Air &
Waste Management Association 55 (4).
Khalek, I.A., Kittelson, D.B., Brear, F., 1999. The influence of
dilution conditions on diesel exhaust particle size distribution
measurements, SAE 1999-01-1142.
Khalek, I.A., Kittelson, D.B., Brear, F., 2000. Nanoparticle
growth during dilution and cooling of diesel exhaust:
experimental investigation and theoretical assessment, SAE-
2000-01-0515.
Kim, D.-H., Gautam, M., Gera, M., 2001. On the prediction of
concentration variations in a dispersing heavy-duty truck
exhaust plume using k–e turbulent closure. Atmospheric
Environment 25, 5267–5275.
Kim, D.-H., Gautam, M., Gera, M., 2002. Parametric studies on
the formation of diesel particulate matter via nucleation
and coagulation modes. Journal of Aerosol Science 33,
1609–1621.
Kittelson, D.B., 1998. Engines and nanoparticles: a review.
Journal of Aerosol Science 29, 575–588.
Kittelson, D.B., Watts, W.F., Johnson, J.P., 2004. Nanoparticle
emissions on Minnesota highways. Atmospheric Environment
38, 9–19.
Kulmala, M., Laaksonen, A., Pirjola, L., 1998. Parameterisations
for sulphuric acid/water nucleation rates. Journal of Geo-
physical Research 103, 8301–8307.
Kulmala, M., Pirjola, L., Makela, J.M., 2000. Stable sulphate
clusters as a source of new atmospheric particles. Nature 404,
66–69.
Maricq, M.M., Chase, R.E., Xu, N., Laing, P., 2002. The effects
of the catalytic converter and fuel sulfur level on motor
vehicle particulate matter emissions: light duty diesel vehicles.
Environmental Science and Technology 36, 283–289.
Mathis, U., Mohr, M., Zenobi, R., 2004. Effect of organic
compounds on nanoparticles formation in diluted diesel
exhaust. Atmospheric Chemistry and Physics 4, 609–620.
Napari, I., Noppel, M., Vehkamaki, H., Kulmala, M., 2002.
Parameterization of ternary nucleation rates for H2SO4–
NH3–H2O vapors. Journal of Geophysical Research 107
(D19), 4318.
Penner, J.E., Zhang, S.Y., Chuang, C.C., 2003. Soot and smoke
aerosol may not warm climate. Journal of Geophysical
Research 108 (D21), 4657.
Peters, A., Wichmann, H.E., Tuch, Th., Heinrich, J., Heyder, J.,
1997. Respiratory effects are associated with the number of
ultrafine particles. American Journal of Respiratory and
Critical Care Medicine 155, 1376–1383.
Peters, A., Dockery, D., Muller, J.E., Mittleman, M.A., 2001.
Increased particulate air pollution and the triggering of
myocardinal infarction. Circulation 103, 2810–2815.
Pope, C.A., 2000. What do epidemiologic findings tell us about
heath effects of environmental aerosols? Journal of Aerosol
Medicine 1314, 335–354.
Sakurai, H., Tobias, H.J., Park, K., Zarling, D., Docherty, S.,
Kittelson, D.B., McMurry, P.H., Ziemann, P.J., 2003.
On-line measurements of diesel nanoparticles com-
position and volatility. Atmospheric Environment 37,
1199–1210.
Scheer, V., Kirchner, U., Casati, R., Vogt, R., Wehner, B.,
Philippin, S., Wiedensohler, A., Hock, N., Schneider, J.,
Weimer, S., Borrmann, S., 2005. Composition of semi-volatile
particles from diesel exhaust, SAE 2005-01-0197.
Shi, J.P., Harrison, R.M., 1999. Investigation of ultrafine particle
formation during diesel exhaust dilution. Environmental
Science and Technology 33, 3730–3736.
Somers, C.M., McCarry, B.E., Malek, F., Quinn, J.S., 2004.
Science 304, 1008–1010.
Sydbom, A., Blomberg, A., Parnia, S., Stenfors, N., Sandstrom,
T., Dahlen, S.E., 2001. Health effects of diesel exhaust
emissions. European Respiratory Journal 17, 733–746.
Tobias, H.J., Beving, D.E., Ziemann, P.J., Sakurai, H.,
Zuk, M., McMurry, P.H., Zarling, D., Waytulonis, R.,
Kittelson, D.B., 2001. Chemical analysis of diesel engine
nanoparticles using a nano-DMA/thermal desorption parti-
cle beam mass spectrometer. Environmental Science and
Technology 35, 2233–2243.
Vehkamaki, H., Kulmala, M., Napari, I., Lehtinen, K.E.J.,
Timmreck, C., Noppel, M., Laaksonen, A., 2002. An
improved parameterization for sulphuric acid-water nuclea-
tion rates for tropospheric and stratospheric conditions.
Journal of Geophysical Research 107 (D22), 4622.
Vehkamaki, H., Kulmala, M., Lehtinen, K.E.J., Noppel, M.,
2003. Modelling binary homogeneous nucleation of water—
sulfuric acid vapurs: parameterisation for high tempera-
ture emissions. Environmental Science and Technology 37,
3392–3398.
Vogt, R., Scheer, V., Casati, R., Benter, Th., 2003. On-road
measurement of particle emission in the exhaust plume of a
diesel passenger car. Environmental Science and Technology
37, 4070–4076.
von Lowis, S., 2006. Measurements within the exhaust
plume of passenger cars under real atmospheric dilution
and on-road driving conditions. Dissertation, Universitat
Leipzig.
Wehner, B., 2000. Particle formation in the urban atmosphere.
Dissertation, Universitat Leipzig.
Wehner, B., Philippin, S., Wiedensohler, A., Scheer, V., Vogt, R.,
2004. Variability of non-volatile fractions of atmospheric
aerosol particles with traffic influence. Atmospheric Environ-
ment 38, 6081–6090.
Whitby, K.T., 1978. The physical characteristics of sulfur
aerosols. Atmospheric Environment 12, 135–159.

ARTICLE IN PRESSU. Uhrner et al. / Atmospheric Environment 41 (2007) 7440–7461 7461
Wilck, M., 1998. Modal modelling of multicomponent aerosols.
Dissertation, Universitat Leipzig.
Wilck, M., Stratmann, F., 1997. A 2-D multicomponent modal
aerosol model and its application to laminar flow reactors.
Journal of Aerosol Science 28, 959–972.
Yu, F., 2001. Chemiions and nanoparticles formation in diesel
engine exhaust. Geophysical Research Letters 28, 4191–4194.
Zeleznik, F.J., 1991. Thermodynamic properties of the aqueous
sulphuric system to 350K. Journal of Physical and Chemical
Reference Data 20, 1157–1200.


![Solidification · 2017-09-12 · solidification. 0.2 kBTm for homogenous nucleation in pure metals [4]. The addition of foreign substrates in the melt provides nucleation sites with](https://img.pdfslide.us/doc/110x75/5ec892b94b6bd71ac95ffd98/solidification-2017-09-12-solidification-02-kbtm-for-homogenous-nucleation-in.jpg)