Embed Size (px)
Citation preview

Published: December 16, 2011
r 2011 American Chemical Society 1173 dx.doi.org/10.1021/ie2025739 | Ind. Eng. Chem. Res. 2012, 51, 1173–1185
ARTICLE
pubs.acs.org/IECR
Dilute Acid Hydrolysis of Sugar Cane Bagasse at High Temperatures:A Kinetic Study of Cellulose Saccharification and GlucoseDecomposition. Part I: Sulfuric Acid as the CatalystLeandro Vinícius Alves Gurgel,† Karen Marabezi,† M�arcia Dib Zanbom,† andAntonio Aprigio da Silva Curvelo*,†,‡
†Grupo de Físico-química organica, Departamento de Físico-química, Instituto de Química de S~ao Carlos, Universidade de S~ao Paulo,Av. Trabalhador S~ao Carlense, 400, Caixa Postal 780, 13560-970 S~ao Carlos, S~ao Paulo, Brazil‡Laborat�orio Nacional de Ciencia e Tecnologia do Bioetanol (CTBE), Centro de Pesquisa em Energia e Materiais (CNPEM), CaixaPostal 6179, 13083-970 Campinas, S~ao Paulo, Brazil
bS Supporting Information
ABSTRACT: The kinetics of sugar cane bagasse cellulose saccharification and the decomposition of glucose under extremely lowacid (ELA) conditions, (0.07%), 0.14%, and 0.28% H2SO4, and at high temperatures were investigated using batch reactors. Thefirst-order rate constants were obtained by weight loss, remaining glucose, and fitting glucose concentration profiles determined withHPLC using the Saeman model. The maximum glucose yields reached 67.6% (200 �C, 0.07% H2SO4, 30 min), 69.8% (210 �C,0.14% H2SO4, 10 min), and 67.3% (210 �C, 0.28% H2SO4, 6 min). ELA conditions produced remarkable glucose yields whenapplied to bagasse cellulose. The first-order rate constants were used to calculate activation energies and extrathermodynamicparameters to elucidate the reaction mechanism under ELA conditions. The effect of acid concentration on cellulose hydrolysis andglucose decomposition was also investigated. The observed activation energies and reaction orders with respect to hydronium ionfor cellulose hydrolysis and glucose decomposition were 184.9 and 124.5 kJ/mol and 1.27 and 0.75, respectively.
1. INTRODUCTION
Climate change and rising oil prices combined with strategicneeds for energy production have motivated an unprecedentedeffort to produce alternative fuels. Brazil stands out as the countrywith the most advanced alternative fuel-related technologies andpolicies in the world due to its pioneering use of sugar cane-basedethanol as fuel since the 1970s.1
In addition to the accumulated experience in ethanol produc-tion, highly selected crop varieties, sophisticated industrial pro-cesses, climate, and availability of arable lands may allow Brazil tocontinue to be a leader in ethanol production technology.1 Thereare many strategies for the production of fermentable sugarsfrom biomass. Therefore, it is very important to investigate andoptimize strategies for processing the biomass in order tominimize the cost of production. The optimal strategy willdepend on the availability, type (i.e., wood or nonwood), andcomposition of biomass that will be processed. In Brazil, the mostabundant biomass is sugar cane bagasse. According to the lastnational crop survey released by the Brazilian National Companyof Supply (CONAB), the estimated harvest during the 2010/2011 season is expected to reach 651.5 million tons, a 7.8%increase relative to the 2009/2010 season.2 However, tomaintaina leading position in a competitive field, Brazil needs to maintainconsistent investments in generating new technologies to in-crease the production of ethanol per unit of planted area. Withinthis context, the conversion of lignocellulosic materials intofermentable sugars for ethanol production has been consideredas a promising route to achieve the level of production necessaryto supply world demand without increasing the planted area.1
The conversion of lignocellulosic materials into fermentablesugars can be achieved through acid or enzymatic hydrolysis.Acid hydrolysis can be classified into two categories: concen-trated and dilute. Concentrated acid hydrolysis requires reactorsthat are resistant to corrosion, and the acid must be recoveredafter hydrolysis to make the process economically feasible.Enzymatic hydrolysis requires pretreatment of lignocellulosicmaterial to improve accessibility and large investments in geneticengineering to develop modified microorganisms that are ca-pable of synthesizing hydrolytic enzymes on a large scale at lowcost. Therefore, dilute acid hydrolysis has many advantagescompared with concentrated acid and enzymatic hydrolysis, suchas reduced corrosion, shorter reaction times, and higher reactionrates.3,4
In pilot and industrial5 scales, processes employing acidhydrolysis such as Dedini Rapid Hydrolysis6 (DRH), Scholler,7
Madison,8 Grethlein,9 and Two-Stage10 have usually been per-formed with dilute sulfuric acid at temperatures ranging from 170to 240 �C.11 The lack of an operating commercial cellulosicethanol plant is related to the technical and operational difficul-ties that result in a high cost of the final product, which isapproximately US$0.80 per kg of ethanol.1 This cost mustcompete with the cost of ethanol production from sugar canesucrose (US$0.35 per kg),1 referred to as first-generation ethanol
Received: July 14, 2011Accepted: December 16, 2011Revised: December 12, 2011
1174 dx.doi.org/10.1021/ie2025739 |Ind. Eng. Chem. Res. 2012, 51, 1173–1185
Industrial & Engineering Chemistry Research ARTICLE
and corn starch (US$0.27 per kg).1 Part of the final product costis based on the requirements of high temperatures and pressuresfor dilute acid hydrolysis. In a sugar and alcohol plant, this cost isminimized by bagasse burning, which provides steam for theboilers and electric energy consumed in the process.1 Anotherdifficulty arises from the need to neutralize the acid solution thatcontains the sugars, adjusting the pH to allow for the fermentationprocess. In general, calciumhydroxide is used to neutralize the acidsolution, and it cannot be reused. In addition, the reaction betweencalcium hydroxide and sulfuric acid produces calcium sulfate(gypsum) that requires disposal. These are the main factorscontributing to the high cost of the technology. In order to achieveacceptable levels of commercialization, the costs related to con-sumption and reuse of acid must be reduced, the efficiency inbiomass conversion to sugars must be improved, and excessiveformation of degradation sugar products that inhibit thefermentation process must be avoided.12,13
Within this context, the National Renewable Energy Labora-tory (NREL) developed a dilute acid hydrolysis process forlignocellulosic biomass, which occurs under extremely lowacid (ELA) conditions of sulfuric acid at low concentration,0.07 wt %.14�19 According to Torget et al.,18 Kim et al.,19 Xianget al.,14,15 and Ojumu et al.,20,21 there are distinct advantages ofusing the ELA conditions. The low acidity minimizes gypsumproduction, and the corrosion characteristics of the ELA condi-tions are similar to those of neutral aqueous reactions so thatstandard-grade stainless steel equipment can be used instead ofhigh cost nickel alloy equipment. The ELA conditions produce asignificant cost savings in equipment relative to the other diluteacid hydrolysis processes. A process using the ELA conditionsalso qualifies as a “green technology” because it has a minimalenvironmental impact. Recent advancements in this technologyhave developed the acid hydrolysis process such that it cancompete with the enzymatic hydrolysis process in overall processeconomics. In addition, recent findings at NREL have proventhat yields of approximately 90% are attainable under the ELAconditions.18,19 Therefore, the ELA hydrolysis process has greatpotential to produce fermentable sugars. The literature data onthe acid hydrolysis of glucan under the ELA conditions arelimited to those published by NREL and its co-workers14�19 andOjumu et al.20,21 at the present time.
The aim of this study was to investigate the saccharificationkinetics of cellulose obtained from sugar cane bagasse and thedecomposition of glucose under extremely low acid (ELA) athigh temperature conditions, employing sulfuric acid as thecatalyst. In addition, this investigation was undertaken to com-pare the kinetic data provided by the experiments using the ELAconditions (0.07% H2SO4) with 0.14% and 0.28% sulfuric acid,i.e., two- and four-fold increases in H2SO4 concentration relativeto the ELA conditions. The comparison between these data mayreveal possible further insights into the hydrolysis reactionmechanism, and consequently, the potential application of theELA conditions in the production of fermentable sugars fromsugar cane bagasse cellulose, one of the most abundant biomassmaterials available in Brazil.
2. EXPERIMENTAL SECTION
2.1. Chemicals. Sodium hydroxide and sulfuric acid (95�98%) were purchased from Qhemis (Brazil). Anthraquinone(98%) was provided by Lwarcel Cellulose (S~ao Paulo, Brazil).D-glucose was purchased from Vetec (Brazil). Chromatography
standards cellobiose, D-glucose, D-xylose, L-arabinose, acetic acid(49�51%), formic acid (49�51%), 5-hydroxymethyl-2-furfur-aldehyde (HMF), and 2-furfuraldehyde (furfural) were pur-chased from Sigma-Aldrich.2.2. Sugar Cane Bagasse Preparation. Sugar cane bagasse
was provided by the Ipiranga ethanol and sugar company,Descalvado, S~ao Paulo, Brazil. Raw bagasse was treated withwater at 70 �C for 1 h with mechanical stirring to remove sugarsremaining after the milling process. Fiber and pith fractions wereseparated by submitting raw bagasse to a wet depithing proce-dure. The depithing was performed using a sieve system contain-ing two screens of 16 (1.19 mm) and 60 (0.250 mm) mesh. Acontinuous water flow was used to force the pith fraction to passthrough a 16mesh screen while fiber fraction was retained on thisscreen. Depithed bagasse was air-dried until a 7.7% equilibriummoisture content was achieved. The chemical composition ofdepithed bagasse was analyzed according to TAPPI standardmethods for extractives,22 cellulose and hemicelluloses,23 Klasonsoluble and insoluble lignin,24 and ash.25
2.3. Hemicelluloses Extraction. Hemicelluloses extractionwas performed in a 1000mL Parr reactor. The reactor was loadedwith 65 g of depithed bagasse containing 7.7% moisture contentand 715 mL of distilled water. The water quantity added to thereactor was calculated considering the bagasse moisture contentto produce a solid to liquid ratio of 1:12. The reactor was heatedto 160 �C andmaintained at this temperature for 1 h. The heatingtime required to reach 160 �C was 70 min. The reactor pressureat 160 �C was measured and found to be 80 psi. After hydrolysis,the heating was stopped, and the reactor was quenched in an icebath and depressurized. The prehydrolyzed depithed bagasse waswashed with water to remove sugars and oligomers releasedduring the hydrolysis. In order to reduce moisture content,prehydrolyzed bagasse was centrifuged for 30 min in ARNOcentrifuge equipment. Afterward, moisture content was deter-mined by an OHAUS-MB 200 dry-weight scale set at 105 �C for3 h and found to be 59.0%.2.4. Soda Anthraquinone Pulping. Soda anthraquinone
pulping of prehydrolyzed bagasse was performed in a 1000 mLParr reactor. The reactor was loaded with 110.4 g of prehydro-lyzed bagasse containing 59% moisture content, 9.34 g of NaOH(16% alkali expressed as Na2O), 67.9 mg of anthraquinone(0.15%), and 523 mL of distilled water.26 The water quantityadded to the reactor was calculated considering the prehydro-lyzed bagasse moisture content to produce a solid to liquid ratioof 1:13. The chemicals added to the reactor were calculatedtaking into account the prehydrolyzed depithed bagasse on dryweight basis. The reactor was heated to 160 �C andmaintained atthis temperature for 1 h. The heating time required to reach160 �Cwas 75min. The reactor pressure at 160 �Cwasmeasuredand found to be 80 psi. At the end of the allotted time, the heatingwas stopped, and the reactor was quenched in an ice bath. Thepulp was defibered, and the black liquor was removed withfiltration. This procedure was repeated three times. The obtainedpulp was washed with water until the water was at pH 6. In orderto reduce the moisture content, the pulp was centrifuged for30 min in ARNO centrifuge equipment. Then, the moisturecontent was determined using an OHAUS-MB 200 dry-weightscale set at 105 �C for 3 h and found to be 66.8%.2.5. Batch Kinetic Experiments. All batch kinetic experi-
ments were performed using sealed tubular reactors. The reactors(16.0 cm3 internal volume) were constructed of stainless steel316 L tubing (25.0 mm OD � 15.7 mm ID � 83.2 mm length).

1175 dx.doi.org/10.1021/ie2025739 |Ind. Eng. Chem. Res. 2012, 51, 1173–1185
Industrial & Engineering Chemistry Research ARTICLE
The reactors were equipped with self-sealed O-ring closuresmade of polytetrafluoroethylene (PTFE) resistant to hightemperatures (>250 �C), and the cap screw was made ofaluminum.For hydrolysis of the cellulosic pulp, the reactorswere loadedwith
0.6 g of cellulosic pulp (on dry basis) and 12.0 mL of 0.07%, 0.14%,or 0.28%H2SO4 to reach a solid to liquid ratio of 1:20. The sampleswere hydrolyzed at 180, 190, 200, 210, 215, 220, 225, and 230 �C forvarious reaction times. For glucose decomposition, the reactorswere loaded with 5.0 mL of acid�glucose solution containing0.07%, 0.14%, or 0.28% H2SO4. The glucose decomposition studywas conducted at 200, 210, and 220 �C for various times.The reactors were submerged in a glycerin bath set at the
desired reaction temperature. The heat transfer experimentsshowed that the contents in the reactors achieved the desiredreaction temperature in 3 min. After the desired reaction timehad elapsed, the reactors were removed from the bath and rapidlyquenched in an ice bath to stop the reaction. The contents of thereactors were collected and then analyzed by high performanceliquid chromatography (HPLC) for cellobiose, glucose, xylose,arabinose, formic acid, furfural, and HMF. The remaining cellu-lose was filtered using a sintered glass funnel ASTM 10�15M,rinsed in distilled water, and then dried at 60 �C in an oven for12 h and at 60 �C under reduced pressure (100 mbar) for further12 h, stored in a desiccator and weighed. The cellulose remainingwas calculated as follows
Cellulose remaining; % ¼ X � 100 ¼ mcelt
mcel0
!� 100 ð1Þ
where mcel0 and mcelt are the weights of cellulosic pulp at time 0and t, respectively.2.6. Analysis of the Hydrolysates. The chemical com-
position of the hydrolysates was determined by HPLC usingShimadzu chromatography equipment equipped with a pump(LC-10AD), a system controller (SCL-10A), a refractive indexdetector (RID-6A), an UV�vis detector (SPD-10A) set at274 nm, and an oven (CTO-10A). Cellobiose, glucose, xylose,arabinose, and formic acid were separated and quantified using aBio-RadAminexHPX-87Hcolumn (300� 7.8mm) at 45 �Cwith0.005 mol/L H2SO4 as the eluent and a flow rate of 0.6 mL/min,while 2-furfuraldehyde (furfural) and 5-hydroxymethyl-2-furfur-aldehyde (HMF) were separated and quantified using an RP 18(C18) Hewlett-Packard column (200 mm) at 25 �C with aceto-nitrile:water (1:8) with 1% acetic acid as the eluent and a flowrate of 0.8 mL/min. For the analysis of sugars and formic acid, thesamples were filtered through a Sep Pak C18 filter (Waters) priorto chromatography, whereas for furfural and HMF analyses, thesamples were filtered through a 0.45 μm membrane (Millipore)before injection (20 μL).
3. RESULTS AND DISCUSSION
Sugar cane bagasse is composed of two fractions: fiber bundlesand pith. Pith contains higher ash content (5.4%) than the fiber
fraction (1.1%).27 According to the studies performed bySaeman,28 biomass exhibits a buffering capacity for acids cor-related with its ash content. As the ELA conditions employlow acid concentrations, it is expected that the ash content willinterfere with the hydrolysis yields and sugar decomposition.Therefore, the study of the saccharification kinetics of sugarcane bagasse requires the separate study of the bagasse frac-tions: fiber and pith. The chemical composition of depithedbagasse was analyzed using TAPPI standard methods and isshown in Table 1.
Hemicelluloses are more easily hydrolyzed than cellulose inacidic media at high temperatures. In addition, sugars fromhemicelluloses, xylose, arabinose, and glucose are degraded intofurfural and 5-hydroxymethyl-2-furfuraldehyde (HMF), contam-inating the hydrolysate with excessive amounts of degradationproducts.29 Therefore, in order to investigate the saccharificationkinetics of cellulose from depithed bagasse, it is necessary toremove the hemicelluloses fraction from the starting material.With this in mind, depithed bagasse was submitted to a hemi-celluloses extraction process in order to remove the maximumpossible percentage of hemicelluloses from the starting materialwithout affecting the cellulose amorphous fraction. After thehemicelluloses extraction process, prehydrolyzed depithedbagasse was delignified using the soda anthraquinone method.The soda anthraquinone method is a pulping process thatachieves a high degree of delignification for sugar cane bagasse.30
Anthraquinone also acts as a protecting agent against the oxi-dation of end carbonyl groups of cellulose chains, preventingalkaline depolymerization. The chemical compositions of pre-hydrolyzed depithed bagasse and pulp obtained through the sodaanthraquinone method were also determined by using TAPPIstandard methods22�25 and are shown in Table 1. A flowchartshowing the pretreatment steps used to prepare sugar canebagasse cellulose is shown in Figure 1. The cellulosic pulp, withlow hemicelluloses and ash content, was used to investigate thesaccharification kinetics of sugar cane bagasse cellulose.3.1. Kinetic Models. 3.1.1. Cellulose Hydrolysis. Saeman28
proposed the first kinetic model for cellulose hydrolysis fromexperiments using wood free of hemicelluloses obtained fromDouglas fir in a batch reactor. Dilute acid hydrolysis wasdescribed using two consecutive pseudohomogeneous first-orderreactions as described by the reaction scheme as follows
Cellulose sfk1
Glucose sfk2
Degradation products
The hydrolysis of the β(1f4) glycosidic bonds of cellulosefollows first-order reaction kinetics, as is well established.31,32
The first-order rate constant for acid hydrolysis of cellulose wasevaluated by eq 2 as follows33
ln X ¼ � k1t ð2Þwhere the term X is the cellulose remaining fraction (eq 1).Under these conditions, the Saeman model28 showed
that the hydrolysis of cellulose is described by following
Table 1. Chemical Composition of the Materials
material cellulose (%) hemicelluloses (%) lignin (%) ash (%) extractives (%)
depithed sugar cane bagasse 49.49 ( 0.31 24.34 ( 0.78 22.69 ( 0.08 0.34 ( 0.03 1.8 ( 0.67
prehydrolyzed depithed bagasse 55.22 ( 0.25 17.54 ( 0.22 24.08 ( 0.30 0.59 ( 0.05 �bagasse cellulosic pulp 88.32 ( 0.07 11.31 ( 0.09 1.45 ( 0.07 0.46 ( 0.04 �

1176 dx.doi.org/10.1021/ie2025739 |Ind. Eng. Chem. Res. 2012, 51, 1173–1185
Industrial & Engineering Chemistry Research ARTICLE
equation
G ¼ C0k1
k2 � k1
� �ðe�k1t � e�k2tÞ ð3Þ
where G (g/L) is the glucose concentration, C0 (g/L) is thecellulose concentration expressed as potential glucose (C0 =48.3 g/L), k1 and k2 (min�1) are the first-order rate constantsfor cellulose hydrolysis and glucose decomposition, and t(min) is the reaction time.Residual cellulose decreases constantly during the hydrolysis
reaction, and the amount of decomposition products alsoincreases constantly, whereas the amount of glucose producedincreases, reaches a maximum (given by eq 4), and thendecreases. The maximum glucose concentration and the timein which the maximum concentration is reached are given byeqs 4 and 5
G ¼ C0k2k1
� �ðk2=k1 � k2Þð4Þ
tmax ¼ ln k2 � ln k1k2 � k1
� �ð5Þ
There have been several modifications for the kinetic modeloriginally suggested by Saeman. According to the Saeman kineticmodel (eq 3), glucose monomer is the only sugar product in thehydrolysate. In addition, cellulose hydrolysis cannot be treatedas homogeneous, as it contains a crystalline and an amorphousfraction. The acid depolymerization of both cellulose fractionsleads to amixture of water-soluble oligosaccharides, such as cello-biose, cellotriose, and cellotetrose, which are further hydrolyzedin the aqueous homogeneous phase to glucose as follows
Cellulose sfk1
CelloðmÞose sfk1,m Glucose sfk2
Degradation products
where m is equal to bi, tri, tetr,..., and depends on the number ofglucopyranose units in the oligosaccharide chain.14,15,34
Although cellulose depolymerization is a heterogeneous reac-tion, in the case of dilute acid hydrolysis at high temperatures, ithas been shown that cellulose hydrolysis can be treated ashomogeneous on the basis of that the diffusion of the oligosac-charides is relatively fast.35 Therefore, the hydrolysis of oligo-saccharides to glucose is expected to be faster than hydrolysis ofcellulose to oligosaccharides.An extended model was suggested by Conner et al.36 in a study
of the reversion reactions of glucose. These authors consideredthe formation of disaccharides, anhydrosugars, and degradationproducts from glucose. Abatzoglou et al.34 and Sidiras andKoukios35 also suggested modified models on the basis of thepresence of oligomers during cellulose hydrolysis. Xiang et al.14
studied the hydrolysis of yellow poplar in batch and BSFTreactors under the ELA conditions. These authors have demon-strated that significant amounts of oligomers were also found inthe hydrolysate in addition to glucose monomer. Xiang et al.14
also proposed a modified kinetic model by inserting a parallelpathway for the release of oligomers. This modified modelassumes that during the catalytic acid hydrolysis process, thehydronium ions randomly attack the glycosidic bonds andconsequently decrease the stability of hydrogen bonds. Whenboth glycosidic and hydrogen bonds are cleaved, glucose andoligosaccharides are readily released into the solution.3.1.2. Glucose Decomposition.McKibbins et al.37 conducted a
series of glucose decomposition experiments and verified that thedecomposition of glucose at constant temperature and pH is alsoa first-order reaction. Pilath et al.38 have demonstrated that5-hydroxymethyl-2-furfuraldehyde (HMF) formation becomessignificant at high temperatures (>140 �C) and at relatively lowglucose concentrations (∼10 g/L). The reaction scheme andfirst-order reaction rate equation are shown as follows
Glucose sfk2
HMF sfk3
Degradation products
ln½G�t½G�0
¼ � k2t ð6Þ
where Gt and G0 (g/L) are the concentrations of glucose at timet and 0.3.1.3. Dependence of Hydrolysis and Decomposition Rate
Constants on Temperature and Acid Concentration. The first-order rate constants obey the empirical Arrhenius equation witha modification to include the acid dependence term as follows39
ki ¼ Ai½Hþ�ni eð�Ea, i=RTÞ ð7Þwhere ki (min�1) is the first-order rate constant with i equalto 1 for cellulose hydrolysis and 2 for glucose decomposition,
Figure 1. Flowchart of the steps used in the pretreatment of sugar canebagasse.

1177 dx.doi.org/10.1021/ie2025739 |Ind. Eng. Chem. Res. 2012, 51, 1173–1185
Industrial & Engineering Chemistry Research ARTICLE
Ai (min�1) is the pre-exponential frequency factor, ni is the
reaction order with respect to hydronium ion, Ea,i (J/mol) is theactivation energy, R (J/K 3mol) is the ideal gas constant, and T(K) is absolute temperature.The Arrhenius equation was wholly empirical in terms of its
derivation. A related but more rigorous form of the theory is that
of Eyring. The Eyring equation is40
lnkiT
� �¼ �ΔH
RT
q
þ ΔSq
Rþ ln
kBh
� �ð8Þ
where kB is the Boltzmann’s constant, h is Plank’s constant,ΔH
q
(J/mol) is the activation enthalpy change associated with
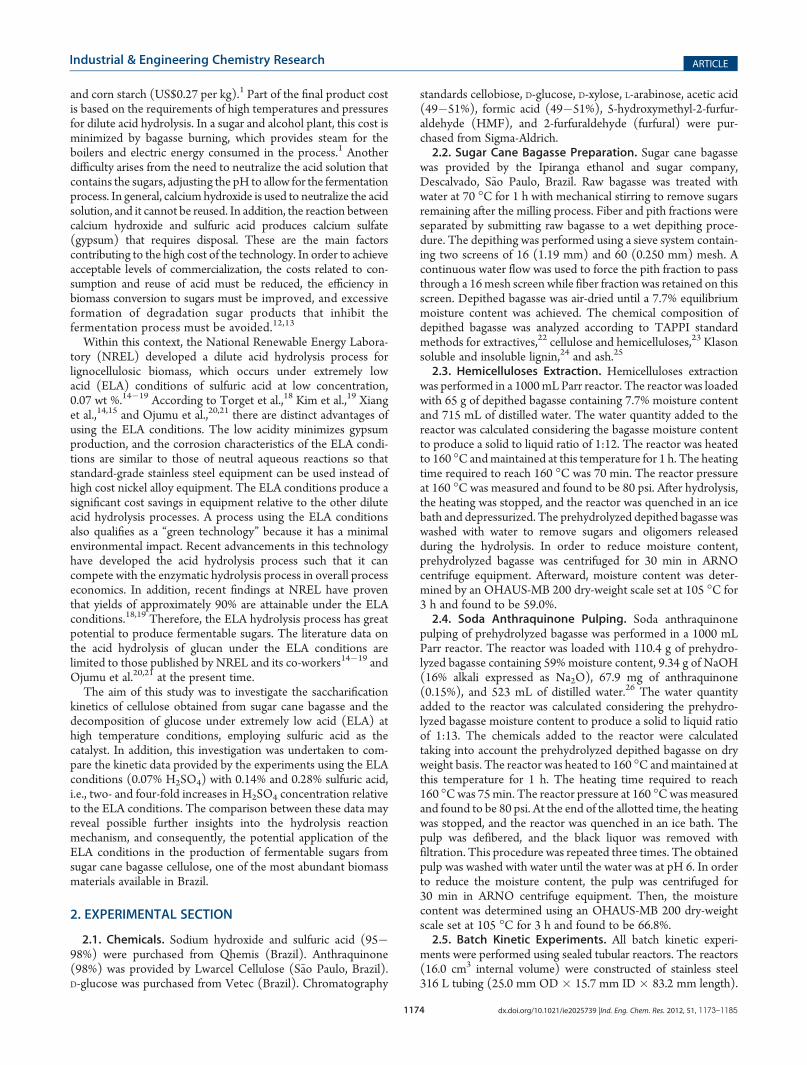
Figure 2. Effect of temperature on hydrolysis rate of cellulosic pulp obtained from weight loss data and profile of glucose concentration determined byHPLC (a) and (d) 0.07% H2SO4, (b) and (e) 0.14% H2SO4, and (c) and (f) 0.28% H2SO4.
1178 dx.doi.org/10.1021/ie2025739 |Ind. Eng. Chem. Res. 2012, 51, 1173–1185
Industrial & Engineering Chemistry Research ARTICLE
forming the activated complex and ΔSq (J/K 3mol) is theactivation entropy change. The logarithmic term ln (kB/h) hasa value of 23.76. Finally, the value of ΔG
q
(J/mol) is obtainedthrough the following relationship40
ΔGq ¼ ΔHq � TΔSq ð9ÞSpecific acid catalysis is observed when a reaction proceedsthrough a protonated intermediate that is in equilibrium withits conjugate base. Because the position of this equilibrium is afunction of the concentration of solvated protons, only a singleacid-dependent term appears in the kinetic expression.40 Forcellulose hydrolysis and glucose decomposition, the kineticexpression that shows the effect of acid concentration underconditions of constant temperature is given by eq 10
ki ¼ kHþ ½Hþ�ni ð10Þwhere ki (min
�1) is the first-order rate constant with i equal to 1for cellulose hydrolysis and 2 for glucose decomposition, [H+] isthe sulfuric acid concentration (in %), and ni is the reaction orderwith respect to hydronium ion.3.2. Hydrolysis of Cellulosic Pulp as a Function of Tem-
perature and Acid Concentration. A kinetic study was under-taken to determine the factors that affect the rate of hydrolysis ofcellulosic pulp obtained from prehydrolyzed depithed bagasse.This kinetic study was performed at temperatures ranging from180 to 230 �C with a solid to liquid ratio of 1:20 and 0.07%,0.14%, and 0.28% (w/v) H2SO4 for various reaction times. Theexperimental data for hydrolysis of cellulosic pulp is shown inFigure 2. Panels (a), (b), and (c) of Figure 2 show logarithmicplots of the percentage of cellulosic pulp remaining as a functionof reaction time (Table 4 of the Supporting Information). Theslopes of the straight lines (Figure 2a�c) represent the first-orderrate constants obtained by weight loss data. The observed first-order rate constants (k1,obs) for each acid hydrolysis conditionswere determined from linear regression analyses of the data(Figure 2a�c) as described by eq 2 using Microcal Origin 8.1software. As shown in panels (a)�(c) of Figure 2, the hydrolysis
of cellulosic pulp obtained from depithed bagasse followed first-order reaction kinetics. Panels (d), (e), and (f) of Figure 2showplots of glucose concentration in the hydrolysates on the basis ofHPLC analyses as a function of reaction time. The Saemanmodel(eq 3) was used tomodel the experimental glucose concentrationprofiles shown in panels (d)�(f) of Figure 2. From the glucoseconcentration profiles determined by HPLC analyses, it waspossible to obtain the calculated first-order rate constants forboth cellulose hydrolysis (k1,calc) and glucose decomposition(k2,calc) using Microcal Origin 8.1 software (Table 3 of the Sup-porting Information). These data were obtained using nonlinearfitting procedure in Microcal Origin and the Saeman model(eq 3) as a fitting function with k1,calc and k2,calc as variables.Table 2 gives the first-order reaction rate constants for
cellulose hydrolysis calculated from weight loss data, k1,obs andthe Saeman model, k1,calc. Table 2 also gives the half-life times,t1/2, and coefficients of determination, R2. As shown in Table 2,both methods used to obtain first-order rate constants forcellulose hydrolysis exhibited high coefficients of determination.However, the rate constants obtained from the weight loss data weresmaller than those obtained by the Saemanmodel. For 0.07%H2SO4,from 180 to 230 �C, k1,obs differed from k1,calc by 92.9% to 22.4%.For 0.14%and0.28%H2SO4, from190 to 220 �C, k1,obs differed fromk1,calc by 33.7% to 23.9%, and by 28.8% to 11.9%, respectively. Theseresults showed that as the sulfuric acid concentration and reactiontemperature were increased, k1,obs was closer to k1,calc.As shown in panels (a)�(c) of Figure 2, cellulose hydrolysis
was favored by increasing the acid concentration and reactiontemperature, which indicates that the supramolecular structure ofcellulose is very sensitive to reaction conditions. According toXiang et al.,14 who studied the hydrolysis ofα-cellulose in a BSFTreactor at 205 �C and 0.07% H2SO4, at low temperatures(<210 �C) or low acid concentration (<0.07% H2SO4), theintra- and intermolecular hydrogen bonds between hydroxylgroups are relatively stable, and high-DP oligomers remain onthe surface of the cellulose chains because of the strong hydrogenbonds until they are further hydrolyzed to glucose. Whereas at
Table 2. Hydrolysis of Cellulosic Pulp Obtained from Depithed Sugarcane Bagasse in 0.07%, 0.14%, and 0.28% Sulfuric Acid atVarious Temperatures and Reaction Times
first-order rate constant k1 (min‑1) half-life t1/2 (min)
H2SO4 (%) temperature (�C) observed R2 calculated R2 observed calculated
0.07 180 0.0014 ( 0.0002 0.9500 0.0027 ( 0.0001 0.9956 488.1 ( 55.0 254.8 ( 9.4
190 0.0037 ( 0.0001 0.9980 0.0065 ( 0.0002 0.9918 188.4 ( 4.1 107.0 ( 3.6
200 0.0098 ( 0.0002 0.9981 0.0189 ( 0.0006 0.9925 70.8 ( 1.4 36.6 ( 1.2
210 0.0279 ( 0.0018 0.9833 0.0396 ( 0.0007 0.9964 24.8 ( 1.6 17.5 ( 0.3
215 0.0420 ( 0.0018 0.9905 0.0672 ( 0.0019 0.9833 16.5 ( 0.7 10.3 ( 0.3
220 0.0795 ( 0.0033 0.9933 0.0994 ( 0.0011 0.9965 8.7 ( 0.4 7.0 ( 0.1
225 0.1290 ( 0.0061 0.9911 0.1584 ( 0.0022 0.9930 5.4 ( 0.3 4.4 ( 0.1
230 0.2031 ( 0.0071 0.9951 0.2485 ( 0.0105 0.9349 3.4 ( 0.1 2.8 ( 0.1
0.14 190 0.0107 ( 0.0006 0.9832 0.0143 ( 0.0004 0.9931 64.8 ( 3.8 48.3 ( 1.4
200 0.0264 ( 0.0005 0.9985 0.0342 ( 0.0011 0.9913 26.3 ( 0.5 20.3 ( 0.7
210 0.0660 ( 0.0019 0.9958 0.0954 ( 0.0011 0.9967 10.5 ( 0.3 7.3 ( 0.1
220 0.1734 ( 0.0079 0.9897 0.2148 ( 0.0061 0.9896 4.0 ( 0.2 3.2 ( 0.1
0.28 190 0.0226 ( 0.0017 0.9739 0.0291 ( 0.0012 0.9854 30.7 ( 2.3 23.8 ( 1.0
200 0.0601 ( 0.0022 0.9948 0.0808 ( 0.0039 0.9829 11.5 ( 0.4 8.6 ( 0.4
210 0.1469 ( 0.0077 0.9919 0.2033 ( 0.0103 0.9144 4.7 ( 0.3 3.4 ( 0.2
220 0.4006 ( 0.0114 0.9968 0.4481 ( 0.0068 0.9940 1.7 ( 0.1 1.6 ( 0.0

1179 dx.doi.org/10.1021/ie2025739 |Ind. Eng. Chem. Res. 2012, 51, 1173–1185
Industrial & Engineering Chemistry Research ARTICLE
high temperature (>210 �C) or high acid concentration (>0.07%H2SO4), the intra- and intermolecular hydrogen bonds becomesprogressively less stable, and low DP-oligomers are directlyreleased to the solution and further hydrolyzed to glucose. Theincrease in the reaction temperature provided higher hydrolysisreaction rates, allowing for increased glucose formation at shorterreaction times. According to Table 2, an increase in the reactiontemperature led to progressively more severe action of sulfuricacid on cellulosic pulp producing higher glucose yields.Table 3 shows the maximum glucose yields observed experi-
mentally and those calculated from the Saeman model. Theobserved and calculated glucose yields were quite similar,demonstrating that the experimental data were fit well by theSaeman model. The results displayed in Table 3 indicate that theELA conditions applied for the hydrolysis of cellulosic pulpproduced remarkable results in that unusually high glucose yieldswere achieved, such as 67.6% (200 �C, 0.07%, 30 min), 69.8%(210 �C, 0.14%, 10 min), and 68.0% (210 �C, 0.28% H2SO4,6 min). These glucose yields were markedly higher than those ofapproximately 61% obtained by Ojumu et al.21 The maximumglucose yields obtained by Kim et al.19 for α-cellulose hydrolysisemploying the ELA conditions were also approximately 60% for atemperature range of 205�220 �C and 0.07% H2SO4. However,glucose yields obtained in this study at high temperatures of220�230 �C were lower than 61%. The same behavior wasreported by Kim et al.19 and Ojumu et al.21, and it is contrary to theconventional concept of cellulose hydrolysis where glucose yieldsshould increase as temperature increases. According to Kim et al.19,this behavior is not unique to the ELA conditions, and it has beenobserved in hydrolysis with higher acid concentrations.3.2.1. Activation Energy and Extrathermodynamic Para-
meters for Cellulose Hydrolysis from Experimental and Calcu-lated Data.The first-order rate constants for cellulose hydrolysis
obtained from weight loss data and the Saeman model were alsoentered into an Arrhenius plot, plotting ln k1 versus 1/T(Figure 3a,b), and into an Eyring plot, plotting ln (k1/T) versus1/T (Figure 3c,d). Activation energies, enthalpies, and entropieswere obtained from the straight lines (Figure 3a�d) for all acidconcentrations and are shown in Table 4. Both the Arrhenius andEyring plots were linear, exhibiting high coefficients of determi-nation across the temperature and acid concentration rangesstudied. As shown in Table 4, observed activation energies werevery similar for all acid concentrations used in the hydrolysisexperiments. The same behavior was observed in the calculatedactivation energies obtained from the Saeman model. Theseresults suggest that the reaction mechanism for cellulose hydro-lysis is the same across the acid concentration range studied,including the ELA conditions.If the reaction mechanism is the same across the temperature
and acid concentration ranges studied, it is possible to express theactivation energy by using an average value. This findings are notconsistent with those reported by Xiang et al.,14,15 who reportedan abrupt increase in the hydrolysis reaction rates between 210and 225 �C for dilute acid hydrolysis of α-cellulose and pre-treated yellow poplar in batch reactors. According to Xianget al.,15 this abrupt change in the reaction rates caused a breakpoint in the Arrhenius plots near to 215 �C for acid hydrolysis ofα-cellulose and between 210 and 225 �C for pretreated yellowpoplar. Activation energies calculated from the hydrolysis rateconstants obtained from weight loss data and the Saeman modelwere quite similar, indicating that the Saeman model can be usedto estimate the overall hydrolysis process in a simplified manner.Both the observed (184.9 kJ/mol) and calculated (172.6 kJ/
mol) average activation energies are in good agreement withthose obtained by Saeman28 for the hydrolysis of Douglas fir freeof hemicelluloses (179.3 kJ/mol) in a temperature range from
Table 3. Influence of Temperature and Sulfuric Acid Concentration on the Maximum Glucose Yield for the Hydrolysis ofCellulosic Pulp
observeda calculatedb
H2SO4 (%) temperature (�C) time (min) glucose yield (%) time (min)c glucose yield (%)
0.07 180 120 53.6 150 54.3
190 60 60.0 77 59.4
200 30 67.6 35 67.3
210 20 54.8 19 50.2
215 10 66.4 12.9 66.9
220 10 55.6 9.3 55.9
225 6 58.6 6.4 59.5
230 4.5 60.2 4.4 59.8
0.14 190 40 55.9 45 56.0
200 20 63.8 24 63.7
210 10 69.8 10.6 69.1
220 4.5 63.4 5.4 64.0
0.28 190 25 57.6 28 57.0
200 12.5 67.3 12.8 66.7
210 6 68.0 6 67.4
220 3 60.3 3 60.5aGlucose yields were calculated using the following relationships: Gyield = [(Gt/Gpot)� 100] and Gpot = C0[1� (X/100)]. Where Gyield is the yield ofglucose (%), Gt is the maximum glucose concentration (g/L) at time t determined using HPLC analysis, Gpot is the potential glucose (g/L), X isthe cellulose remaining (%) (Table 4 of the Supporting Information), and C0 is the cellulose concentration expressed as potential glucose(C0 = 48.3 g/L). bGlucose yields were calculated using eq 4, k1,calc, and k2,calc (Table 2 and 5). cThe times in which the maximum glucose yieldsoccurred were calculated using eq 5 (Tables 2 and 5).

1180 dx.doi.org/10.1021/ie2025739 |Ind. Eng. Chem. Res. 2012, 51, 1173–1185
Industrial & Engineering Chemistry Research ARTICLE
170 to 190 �C and 0.4 to 1.6% H2SO4 and Lin et al.39 for thehydrolysis of α-cellulose (178.5 kJ/mol) in a temperature rangefrom 160 to 180 �C and 1.5%H2SO4. From Table 4, it is possibleto notice that the activation energy predicted by the Saemanmodel differed by 7.1% from that obtained from the weightloss data.Table 4 also shows extrathermodynamic parameters for the
hydrolysis of cellulosic pulp obtained from weight loss data andthe Saeman model. As shown in Table 4, the average observedand calculated activation entropies were found to be +103.0and +80.2 J/K 3mol, respectively. The activation entropy pre-dicted by the Saeman model differed by 28.4% from thatobtained by weight loss data.Nelson41 also provided a summary of activation energies
calculated from literature data. According to Nelson’s calcula-tions, on the basis of weight loss data, the activation entropy forthe hydrolysis of Douglas fir in 0.8% H2SO4 at an averagetemperature of 180 �C and wood cellulose in 2% H2SO4 at anaverage temperature of 160 �Cwere found to be +74.0 and +38.5J/K 3mol. Timell
42 studied the hydrolysis of various methyl α-and β-D-glucopyranosides, cellobiose, and xylobiose using fourdifferent mineral acids. The activation entropies were also foundto be higher than +37.6 J/K 3mol. On the basis of those results,
Timell concluded that the hydrolysis of glycosides is a unimo-lecular reaction and that the rate-determining step is the forma-tion of the oxynium ion. On the basis of the results obtained here,the literature data and considering that the plots of log k1,obs andlog k1,calc versus log CH+were linear, with coefficients of determina-tion higher than 0.98 (figure not shown), it is possible to con-clude that the mechanism of hydrolysis of cellulosic pulp underthe ELA conditions and 0.14% and 0.28% H2SO4 also proceedsthrough a unimolecular reaction.As also shown in Table 4, the magnitude of the activation
enthalpy (ΔHq) and activation entropy (ΔSq) reflected a transi-tion state (TS) structure. The activation energy required forbond reorganization in cellulose hydrolysis was reflected in thevalues of observed and calculated activation enthalpies of theactivated complex. The activation entropy is also a measure ofthe degree of organization resulting from the formation ofthe activated complex. Glucose formation led to an increase oftranslational, vibrational, and rotational degrees of freedom thatresulted in high positive change in the observed and calculatedactivation entropies. The observed and calculated activation freeenergies (ΔGq) exhibited certain uniformity considering theestimated errors as the acid concentration was increased asshown in Table 4.
Figure 3. Arrhenius and Eyring plots for cellulosic pulp hydrolysis in sulfuric acid at high temperatures. Arrhenius plots for first-order rate constantsobtained from weight loss data (a) and from the Saemanmodel (b). Eyring plots for first-order rate constants obtained from weight loss data (c) and theSaeman model (d).

1181 dx.doi.org/10.1021/ie2025739 |Ind. Eng. Chem. Res. 2012, 51, 1173–1185
Industrial & Engineering Chemistry Research ARTICLE
3.2.2. Effect of Acid Concentration on the Hydrolysis RateConstants for Cellulose Hydrolysis. The effect of acid concentra-tion on the hydrolysis rate constant was also investigated by varyingthe sulfuric acid concentration from 0.07 to 0.28% (w/v) at fixedtemperatures of 190, 200, 210, and 220 �C. The first-order rateconstants obtained fromweight loss data and the Saemanmodelwerealso plotted as log k1,obs and log k1,calc versus log CH+ (figure notshown). Both plots were fit to straight lines with high coefficients ofdetermination. The reaction orders with respect to hydronium ionwere obtained from the slopes of the straight lines of log k1,obs and/orlog k1,calc versus log CH+ (eq 10) and are summarized in Table 1 ofthe Supporting Information. The observed and calculated effect ofacid concentration on hydrolysis rate obtained from weight loss dataand the Saeman model were similar, 1.27 and 1.11, respectively. Thedifference between n1,obs and n1,calc was 14.4%. The observed effect ofacid concentration on the hydrolysis of cellulosic pulp under the ELAconditions (0.07%), 0.14%, and 0.28% H2SO4 was similar to thatreported by Saeman28 (1.34) for the hydrolysis of Douglas fir.The empirical dependence of the rate constant for the hydrolysis of
cellulosic pulp on acid concentration and temperature can be ex-pressed by inserting the observed and calculated values (Table 4 andTable 1 of the Supporting Information) of reaction orderwith respectto hydronium ion, n1, activation energy, Ea,1, and the pre-exponentialfrequency factor, A1, in eq 7 as follows
k1, obs ¼ 1:32� 1019½Hþ�1:27eð � 184900=RTÞ ð11Þ
k1, calc ¼ 5:23� 1017½Hþ�1:11eð � 172600=RTÞ ð12ÞThese equations can be used to predict the rate constants for
the dilute sulfuric acid hydrolysis of cellulosic pulp at different
acid concentrations and temperatures.39 Comparing eq 11 witheq 12 may indicate that the mathematical expression of eq 12cannot be used to predict the rate constants with a high degree ofaccuracy due to the deviations between observed and calculatedvalues for pre-exponential frequency factor, reaction order, andactivation energy.3.3. Glucose Decomposition as Function of Temperature
and Acid Concentration. A kinetic study of the decompositionof a glucose solution was undertaken to determine the factorsthat affect the rate. The aim of this study was to provide glucosedecomposition rate constants to compare with those obtainedfrom fitting glucose concentration profiles using the Saemanmodel. The kinetic study was conducted at 200, 210, and 220 �Cin 0.07%, 0.14%, and 0.28% H2SO4 (w/v) at a glucose concen-tration of 0.11 mol/L (20 g/L). The profiles of glucose decom-position as a function of time are shown in Figure 1 of theSupporting Information. When the logarithm of remainingglucose in percentage was plotted as function of reaction time,linear relationships were observed for all acid concentrations andtemperatures. As expected, glucose decomposition obeyed thefirst-order reaction kinetics. The slopes of the straight linesrepresent the first-order rate constants for glucose decomposi-tion as described by eq 6. The observed first-order rate constants(k2,obs) for each glucose degradation conditions were obtainedfrom linear regression analyses of the data (Figure 1 and Table 5of the Supporting Information) using Microcal Origin 8.1.Table 5 shows the first-order rate constants for glucose decom-position obtained bymeasuring the remaining glucose, k2,obs, andfrom the Saeman model, k2,calc.Using Table 5, it is possible to compare glucose decomposi-
tion rate constants obtained from linear regression analyses of
Table 4. Activation Energy, Pre-Exponential Factor, and Extrathermodynamic Parameters for Hydrolysis of Cellulosic Pulp andDecomposition of Glucose Obtained from Weight Loss, Glucose Decomposition Experiments, and the Saeman Model
H2SO4 (%) Ea1,obs (kJ/mol) A1,obs (min‑1) R2 Ea1,calc (kJ/mol) A1,calc (min‑1) R2
0.07% 194.3 ( 3.1 2.9 � 1019 ( 5.0 � 1017 0.9982 171.6 ( 3.2 1.5 � 1017 ( 3.0 � 1015 0.9976
0.14% 177.2 ( 4.6 9.6 � 1017 ( 2.7 � 1016 0.9980 175.2 ( 6.0 8.1 � 1017 ( 3.0 � 1016 0.9965
0.28% 183.3 ( 3.7 1.0 � 1019 ( 2.1 � 1017 0.9988 170.9 ( 3.3 6.1 � 1017 ( 1.2 � 1016 0.9989
average 184.9 ( 5.0 1.3 � 1019 ( 8.1 � 1018 � 172.6 ( 1.3 5.2 � 1017 ( 2.0 � 1017 �
H2SO4 (%) Ea2,obs (kJ/mol) A2,obs (min‑1) R2 Ea2,calc (kJ/mol) A2,calc (min‑1) R2
0.07 129.2 ( 0.4 4.9 � 1012 ( 1.5 � 1010 0.9999 102.4 ( 2.0 8.3 � 109 ( 1.8 � 108 0.9973
0.14 124.3 ( 5.2 2.4 � 1012 ( 1.1 � 1011 0.9965 104.5 ( 4.3 1.9 � 1010 ( 8.4 � 108 0.9950
0.28 120.0 ( 3.9 1.6 � 1012 ( 5.4 � 1010 0.9979 110.4 ( 1.7 1.2 � 1011 ( 1.9 � 109 0.9993
average 124.5 ( 2.7 3.0 � 1012 ( 1.0 � 1012 � 105.8 ( 2.4 4.9 � 1010 ( 3.5 � 1010 �
H2SO4 (%) ΔHq1,obs (kJ/mol) ΔSq1,obs (J/K 3mol) ΔGq
1,obsa(kJ/mol) R2 ΔHq
1,calc (kJ/mol) ΔSq1,calc (J/K 3mol) ΔGq1,calc
a(kJ/mol) R2
0.07% 190.3 ( 3.1 115.3 ( 6.4 135.1 ( 7.8 0.9982 167.6 ( 3.2 71.7 ( 6.5 133.3 ( 12.3 0.9975
0.14% 173.2 ( 4.6 87.1 ( 9.6 131.5 ( 14.9 0.9979 171.2 ( 6.0 85.7 ( 12.5 130.2 ( 19.6 0.9963
0.28% 179.3 ( 3.6 106.7 ( 7.5 128.2 ( 9.4 0.9988 167.2 ( 3.4 83.3 ( 6.9 127.4 ( 10.8 0.9988
average 180.9 ( 5.0 103.0 ( 8.3 131.6 ( 2.0 � 168.7 ( 1.3 80.2 ( 4.3 130.3 ( 1.7 �
H2SO4 (%) ΔHq2,obs (kJ/mol) ΔSq2,obs (J/K 3mol) ΔGq
2,obsb (kJ/mol) R2 ΔHq
2,calc (kJ/mol) ΔSq2,calc (J/K 3mol) ΔGq2,calc
b (kJ/mol) R2
0.07 125.2 ( 0.4 �14.3 ( 0.0 132.1 ( 0.5 0.9999 98.4 ( 2.0 �67.3 ( 0.3 130.9 ( 2.7 0.9971
0.14 120.3 ( 5.1 �20.1 ( 0.5 130.0 ( 6.4 0.9964 100.5 ( 4.2 �60.6 ( 0.5 129.8 ( 5.6 0.9947
0.28 116.0 ( 3.9 �23.9 ( 0.4 127.5 ( 4.8 0.9977 106.4 ( 1.7 �45.2 ( 0.2 128.3 ( 2.1 0.9993
average 120.5 ( 2.7 �19.4 ( 2.8 129.9 ( 1.3 � 101.8 ( 2.4 �57.7 ( 6.6 129.7 ( 0.8 �aActivation free energy was calculated by using the average temperature (205 �C) from the study of hydrolysis of cellulosic pulp. bActivation free energywas calculated by using the average temperature (210 �C) from the study of glucose decomposition.

1182 dx.doi.org/10.1021/ie2025739 |Ind. Eng. Chem. Res. 2012, 51, 1173–1185
Industrial & Engineering Chemistry Research ARTICLE
the remaining glucose in the glucose decomposition experi-ments, k2,obs, and the rate constants obtained from glucose con-centration profiles after cellulose hydrolysis using Saemanmodel,k2,calc. For 0.07% H2SO4 (ELA conditions) and a temperaturerange from 200 to 220 �C, k2,obs was smaller than k2,calc, whereasfor 0.28%H2SO4, k2,obs was higher than k2,calc. For 0.14%H2SO4
at 200 and 210 �C, k2,obs was smaller than k2,calc, and at 220 �C,k2,obs was very similar to k2,calc. Therefore, as acid concentrationand reaction temperature were increased, i.e., the severity of thehydrolysis was increased, k2,obs was closer to k2,calc. A similartendency related to k1,obs and k1,calc values for dilute acidhydrolysis of cellulosic pulp was also observed. As mentionedearlier, Xiang et al.15 demonstrated that oligomer formationincreases as acid concentration and reaction temperature areincreased. As the Saeman model does not take into accountoligomer formation and estimates glucose decomposition rateconstants using only glucose concentration, it is expected that theSaeman model underestimates k2 values as acid concentrationand reaction temperature are increased because the oligomersreleased were not converted into glucose and glucose concentra-tion in the reaction medium is smaller than it was expected to be.If the oligomers concentration were taken into account and thenconverted into glucose concentration, glucose concentration willincrease and probably k2,calc will be closer to k2,obs. These findingsjustify the decrease in k2,calc relative to k2,obs as the reactionconditions become progressively more severe.As shown in Table 5, it is possible to conclude that for all sul-
furic acid concentrations studied, an increase in the temperatureprovided a greater effect on cellulose hydrolysis reaction ratesthan glucose decomposition rates.Therefore, comparing theobtained results, it is also possible to conclude that an increasein the acid concentration from 0.07% to 0.28% also provided agreater response in cellulose hydrolysis reaction rates than glucosedecomposition rates.The k2/k1 ratio was defined by Saeman28 as the power of
glucose formation. According to Saeman,28 the maximum heightof the curves shown in panels (d)�(f) of Figure 2 is a function of
the k2/k1 ratio. Figure 4 shows the evolution of observed andcalculated k2/k1 ratios on increasing temperature for the acidconcentrations studied. Figure 4 also shows observed k2/k1 ratiosobtained by Saeman28 in the study of dilute sulfuric acidhydrolysis of Douglas fir in batch reactor. As shown in Tables 2and 5 and Figure 4 (also Table 2 of the Supporting Information),an increase in the reaction temperature from 180 to 230 �C for0.07% H2SO4 decreased the ratio k2,calc/k1,calc from 4.827 to0.827. For 0.14% and 0.28% H2SO4 from 190 to 220 �C, k2,calc/k1,calc ratios decreased from 2.248 to 0.752 and from 1.452 to0.533, respectively. If k2/k1 is less than the unity, the rate ofglucose formation is higher than the rate of glucose decomposi-tion. In these reaction conditions, the glucose yield is expected tobe much higher. The difference between observed and calculatedk2/k1 ratios also increased as the reaction temperature and acid
Table 5. Decomposition of Glucose in 0.07%, 0.14%, and 0.28% Sulfuric Acid at Various Temperatures and Reaction Times inAccordance with the Study of Glucose Decomposition and the Saeman Model
first-order rate constant k2 (min‑1) half-life t1/2 (min)
H2SO4 (%) temperature (�C) observed R2 calculated R2 observed calculated
0.07 180 � 0.0131 ( 0.0009 0.9956 � 52.8 ( 3.5
190 � 0.0229 ( 0.0012 0.9918 � 30.3 ( 1.6
200 0.0266 ( 0.0002 0.9998 0.0418 ( 0.0019 0.9925 26.0 ( 0.2 16.6 ( 0.8
210 0.0526 ( 0.0005 0.9995 0.0717 ( 0.0010 0.9964 13.2 ( 0.1 9.7 ( 0.1
215 � 0.0893 ( 0.0026 0.9833 � 7.8 ( 0.2
220 0.1006 ( 0.0022 0.9976 0.1157 ( 0.0011 0.9965 6.9 ( 0.2 6.0 ( 0.1
225 � 0.1528 ( 0.0017 0.9930 � 4.5 ( 0.1
230 � 0.2054 ( 0.0065 0.9349 � 3.4 ( 0.1
0.14 190 � 0.0322 ( 0.0018 0.9931 � 21.5 ( 1.2
200 0.0464 ( 0.0011 0.9979 0.0509 ( 0.0035 0.9913 14.9 ( 0.3 13.6 ( 0.9
210 0.0864 ( 0.0016 0.9989 0.0927 ( 0.0011 0.9967 8.0 ( 0.1 7.5 ( 0.1
220 0.1685 ( 0.0046 0.9971 0.1616 ( 0.0044 0.9896 4.1 ( 0.1 4.3 ( 0.1
0.28 190 � 0.0423 ( 0.0027 0.9854 � 16.4 ( 1.0
200 0.0882 ( 0.0047 0.9917 0.0757 ( 0.0066 0.9829 7.9 ( 0.4 9.2 ( 0.8
210 0.1551 ( 0.0193 0.9551 0.1330 ( 0.0062 0.9144 4.5 ( 0.6 5.2 ( 0.3
220 0.3042 ( 0.0175 0.9934 0.2390 ( 0.0053 0.9940 2.0 ( 0.2 2.9 ( 0.1
Figure 4. Profile evolution of the observed and calculated k2/k1 ratioson increasing temperature for the acid concentrations studied. Compar-ison with Saeman28 data.

1183 dx.doi.org/10.1021/ie2025739 |Ind. Eng. Chem. Res. 2012, 51, 1173–1185
Industrial & Engineering Chemistry Research ARTICLE
concentration were increased, except for 0.07%H2SO4 at 200 �C(Table 2 of the Supporting Information). This behavior isattributed to the Saeman model that underestimates glucosedecomposition rate constants, decreasing the calculated k2/k1ratios relative to the observed ratios.3.3.1. Activation Energy and Extrathermodynamic Para-
meters for Glucose Decomposition from Experimental andCalculated Data. First-order rate constants for glucose decom-position obtained from experiments and the Saeman model werealso used in an Arrhenius plot of ln k2,obs and ln k2,calc versus 1/Tand into an Eyring plot of ln (k2,obs/T) and ln (k2,calc/T) versus1/T (figures not shown). Activation energies, enthalpies, andentropies were obtained from the slopes of the straight lines andare shown in Table 4. As shown in Table 4, the observed andcalculated activation energies for glucose decomposition weresimilar for all acid concentrations used in the glucose decompositionexperiments. This result suggests that the glucose decompositionmechanism was the same for the ELA conditions, 0.14%, and 0.28%H2SO4. The average Ea2,obs differed from the average Ea2,calc by17.7%. Xiang et al.16 studied glucose decomposition under the ELAconditions and found an activation energy of 139 kJ/mol. The valuesof activation energies obtained from experiments monitoringthe remaining glucose and predicted by the Saeman model for theELA conditions in the present study were found to be 129.2 and102.4 kJ/mol, respectively. These values are 7.6% and 26.3% smallerthan that reported by Xiang et al.,16 respectively. The average valuesof observed (124.5 kJ/mol) and calculated (105.8 kJ/mol) activa-tion energies were also smaller than those reported in literatureby Saeman28 and McKibbins et al.,37 who found activation energiesfor glucose decomposition in dilute sulfuric acid of 137.5 and137.1 kJ/mol.Table 4 shows extrathermodynamic parameters for glucose
decomposition. Activation entropies for glucose decompositionunder the ELA conditions obtained from the glucose decom-position experiments and the Saeman model were �13.3 and�67.3 J/K 3mol, respectively, whereas the observed and calcu-lated average activation entropies were �19.4 and �57.7J/K 3mol, respectively. The data reported by Saeman28 and Pilathet al.38 were used to calculate extrathermodynamic parametersfor glucose decomposition. The activation entropies obtainedin this study contradict those reported by Saeman28 (+15.6J/K 3mol) and more recently by Pilath et al.38 (+4.5 J/K 3mol),who based their studies on glucose reversion reactions in 1.2 wt%H2SO4 at temperatures from 140 to 180 �C. The observed andcalculated activation entropies found in this study were negativelike those reported by Baek et al.43 (�69.3 J/K 3mol), whostudied glucose decomposition in 0.5%, 1.0%, and 2.0 wt%H2SO4 at temperatures from 190 to 220 �C. Lu and L€u44 havestudied glucose decomposition kinetics catalyzed by copperchloride at temperatures ranging from 150 to 190 �C. Fromtheir reported kinetic data, the activation entropy was found to be�6.4 J/K 3mol.It is interesting to note that the glucose decomposition
reactions described by Baek et al.43 were performed in stainlesssteel 316 reactors, whereas the reactions developed by Saeman28
and Pilath et al.38 occurred in reactors made of inert materials,such as glass ampules and PTFE. In the present study, stainlesssteel 316 L was used to investigate both cellulose hydrolysis andglucose decomposition reactions. Xiang et al.16 have also studiedglucose decomposition in the presence of different metalsand demonstrated how various metals used to construct indus-trial reactors may affect the overall degradation of glucose. In
particular, iron had the strongest impact on glucose decomposi-tion, causing the rapid disappearance of glucose in the reactionmedium.As demonstrated by Lu and L€u44 and Xiang et al.,16 glucose
decomposition rates are affected by the presence of metals in thereaction medium. The positive values of activation entropycalculated from data reported by Saeman28 and Pilath et al.38
suggest the possibility that the rate-determining step for glucosedecomposition, at least in reactors made of inert materials, is aunimolecular reaction. Nevertheless, the activation entropiescalculated from data reported by Baek et al.43 and Lu and L€u44
and those obtained in this study suggest that the rate-determin-ing step for reactions that occurred in reactors made of stainlesssteel is a bimolecular reaction. Overall, the influence of metals onglucose decomposition rates remains unclear, and no definiteconclusions regarding mechanism can be drawn.Stainless steel reactors are mainly used for industrial purposes.
A stainless steel 316 L reactor was used by Dedini S/A in a pilotplant for saccharification of sugar cane bagasse. This process wascalled Dedini rapid hydrolysis (DRH) and consisted of a con-tinuous process for acid hydrolysis of a lignocellulosic material,sugar cane bagasse, through which delignification and sacchar-ification operations occur in a single reaction cycle by using asolubilizing organic solvent for lignin and a strong and dilute acidsimilar to the ELA conditions. The maximum yield achieved instable and continuous operation mode was 88%, expressed astotal reducing sugars (TRS).6
The observed and calculated values of the activation freeenergy (ΔG
q
) for glucose decomposition displayed a milddecrease as acid concentration was increased. The same behaviorwas observed for cellulose hydrolysis.3.3.2. Effect of Acid Concentration on the Hydrolysis Rate
Constants for Glucose Decomposition. The first-order rateconstants for glucose degradation obtained from glucose decom-position experiments and the Saeman model were also plotted aslog k2,obs and log k2,calc versus log CH+ (figure not shown). Bothplots were fit to straight lines with high coefficients of determina-tion. The reaction order with respect to hydronium ion wasobtained from the slopes of the straight lines of log k2,obs andlog k2,calc versus log CH+ (eq 10) (Table 1 of the SupportingInformation). The observed and calculated effects of acid con-centration on glucose decomposition under the ELA conditions(0.07%), 0.14%, and 0.28% H2SO4 were found to be 0.75 and0.44 (Table 1 of the Supporting Information), respectively, andare smaller than those reported by Saeman28 and McKibbins37
for glucose decomposition (1.02 and 0.86) and higher than thatreported by Baek et al.43 (0.61). These results indicate that theSaeman model cannot predict glucose decomposition ratesunder the ELA conditions, 0.14%, and 0.28% H2SO4. Xianget al.16 also observed that the Saeman model cannot predictglucose decomposition rate constants under the ELA conditions.Another interesting point, considering the literature data and theresults obtained in this study, is that the reaction order withrespect to hydronium ion obtained from the glucose decomposi-tion experiments conducted in reactors constructed from inertmaterials was higher than that obtained from the experimentsperformed in reactors made of stainless steel.The empirical dependence of glucose decomposition rate con-
stant on acid concentration and temperature can be expressed byinserting the observed and calculated values (Table 4 andTable 1 ofthe Supporting Information) of reaction order with respect tohydronium ion, n2, activation energy, Ea,2, and the pre-exponential

1184 dx.doi.org/10.1021/ie2025739 |Ind. Eng. Chem. Res. 2012, 51, 1173–1185
Industrial & Engineering Chemistry Research ARTICLE
frequency factor, A2, in eq 7 as follows
k2, obs ¼ 2:96� 1012½Hþ�0:75eð � 124520=RTÞ ð13Þ
k2, calc ¼ 4:85� 1010½Hþ�0:44eð � 105800=RTÞ ð14ÞThese equations can be used to predict the rate constants for
the dilute sulfuric acid degradation of glucose at different acidconcentrations and temperatures.39 Inspection of eqs 13 and 14may indicate that eq 14 cannot be used to predict the rateconstants with a high degree of accuracy due to the deviationsbetween observed and calculated values for pre-exponentialfrequency factor, reaction order and activation energy.
4. CONCLUSIONS
The ELA conditions were successfully applied to the hydro-lysis of sugar cane bagasse cellulose in batch reactors and pro-duced remarkable glucose yields close to 70%. It was found thatthe reaction under ELA conditions obeyed Arrhenius theory, andno abrupt change in the rate constants have been found for thetemperature range and acid concentrations studied. The higheractivation entropies and the linearity of the plot of log k1 versuslog CH+ suggest that hydrolysis of cellulose under the ELAconditions is a unimolecular reaction. However, the mechanismof glucose decomposition under the ELA conditions employingstainless steel reactors requires further clarification.
’ASSOCIATED CONTENT
bS Supporting Information. Profiles of glucose decomposi-tion at 200, 210, and 220 �C in 0.07%, 0.14%, and 0.28% (w/v)H2SO4. Reaction orders with respect to hydronium ion forcellulose hydrolysis and glucose decomposition. The k2/k1 ratiosobtained from experimental data and fitting glucose profilesusing the Saeman model. Glucose experimental kinetic data fordetermination of k1,calc and k2,calc by fitting Saeman model.Remaining cellulose data for determination of k1,obs. Residualglucose data for determination of k2,obs. This information isavailable free of charge via the Internet at http://pubs.acs.org.
’AUTHOR INFORMATION
Corresponding Author*Tel.: +55 16 3373-9938. Fax: +55 16 3373-9952. E-mail address:[email protected].
’ACKNOWLEDGMENT
The authors are grateful to Conselho Nacional de Pesquisa eDesenvolvimento (CNPq), Fundac-~ao de Amparo �a Pesquisa doEstado de S~ao Paulo (FAPESP), and Oxiteno for providingfinancial support for this research. The authors also thank theInstituto de Química de S~ao Carlos (IQSC) and ProfessorMarcelo Gehlen for important discussions of the Saeman modeland Professor Cl�audio Sansígolo who helped us prepare thesugarcane bagasse pulp for this study.
’REFERENCES
(1) Buckeridge, M. S.; Santos, W. D. d.; Souza, A. P. d. As Rotas Parao Etanol Celul�osico no Brasil. In Bioetanol de Cana-de-Ac-�ucar: Pesquisa eDesenvolvimento Para Produtividade e Sustentabilidade; Cortez, L. A. B.,Ed.; Edgard Bl€ucher Ltda: S~ao Paulo, 2010; pp 365�380.
(2) CONAB. Companhia Nacional de Abastecimento. Avaliac-~ao daSafra Agrícola Brasileira de cana-de-ac-�ucar, safra 2010, segundo levanta-mento, Setembro;2010, in Portuguese.
(3) Badger, P. C. Ethanol from Cellulose: A General Review. InTrends in New Crops and New Uses; Janick, J., Whipkey, A., Eds.; ASHSPress: Alexandria, VA, 2002; pp 17�21.
(4) Huang, H. J.; Lin, W. L.; Ramaswamy, S.; Tschirner, U. Processmodeling of comprehensive integrated forest biorefinery: An integratedapproach. Appl. Biochem. Biotechnol. 2009, 154 (1�3), 205–216.
(5) Binder, J. B.; Raines, R. T. Fermentable sugars by chemical hydro-lysis of biomass. Proc. Natl. Acad. Sci. U.S.A. 2010, 107 (10), 4516–4521.
(6) Hilst, A. G. P. Process for Rapid Acid Hydrolysis of Lignocellu-losic Material and Hydrolysis Reactor. U.S. Patent 5,879,463, 1999.
(7) Faith, W. L. Development of the scholler process in the UnitedStates. Ind. Eng. Chem. 1945, 37 (1), 9–11.
(8) Harris, E. E.; Beglinger, E.Madison wood sugar process. Ind. Eng.Chem. 1946, 38 (9), 890–895.
(9) Thompson, D. R.; Grethlein, H. E. Design and evaluation of aplug flow reactor for acid-hydrolysis of cellulose. Ind Eng Chem Prod Rd1979, 18 (3), 166–169.
(10) Harris, J. F.; Baker, A. J.; Connor, A. H.; Jeffries, T. W.; Minor,J. L.; Pettersen, R. C.; Scott, R. C.; Springer, E. L.; Wegner, T. H.; Zerbe,J. L. Two-Stage Dilute Sulfuric Acid Hydrolysis of Wood; GeneralTechnical Report FPL-45; Department of Agriculture Forest ProductsLaboratory: Madison, WI, 1985.
(11) Rinaldi, R.; Schuth, F. Acid hydrolysis of cellulose as the entrypoint into biorefinery schemes. ChemSusChem 2009, 2 (12), 1096–1107.
(12) Kaylen, M.; Van Dyne, D. L.; Choi, Y. S.; Blase, N. Economicfeasibility of producing ethanol from lignocellulosic feedstocks. Bio-resour. Technol. 2000, 72 (1), 19–32.
(13) Goldemberg, J. Ethanol for a sustainable energy future. Science2007, 315 (5813), 808–810.
(14) Xiang, Q.; Kim, J. S.; Lee, Y. Y. A comprehensive kinetic modelfor dilute-acid hydrolysis of cellulose. Appl. Biochem. Biotechnol. 2003a,105, 337–352.
(15) Xiang, Q.; Lee, Y. Y.; Pettersson, P. O.; Torget, R. Hetero-geneous aspects of acid hydrolysis of alpha-cellulose. Appl. Biochem.Biotechnol. 2003b, 105, 505–514.
(16) Xiang, Q.; Lee, Y. Y.; Torget, R. W. Kinetics of glucosedecomposition during dilute-acid hydrolysis of lignocellulosic biomass.Appl. Biochem. Biotechnol. 2004, 113�16, 1127–1138.
(17) Pettersson, P. O.; Torget, R. W.; Eklund, R.; Xiang, Q.; Lee,Y. Y.; Zacchi, G. Simplistic modeling approach to heterogeneous dilute-acid hydrolysis of cellulose microcrystallites. Appl. Biochem. Biotechnol.2003, 105, 451–455.
(18) Torget, R. W.; Kim, J. S.; Lee, Y. Y. Fundamental aspects ofdilute acid hydrolysis/fractionation kinetics of hardwood carbohydrates.1. Cellulose hydrolysis. Ind. Eng. Chem. Res. 2000, 39 (8), 2817–2825.
(19) Kim, J. S.; Lee, Y. Y.; Torget, R. W. Cellulose hydrolysis underextremely low sulfuric acid and high-temperature conditions. Appl.Biochem. Biotechnol. 2001, 91�3, 331–340.
(20) Ojumu, T. V.; Ogunkunle, O. A. Production of glucose fromlignocellulosic under extremely low acid and high temperature in batchprocess, auto-hydrolysis approach. J. Appl. Sci. 2005, 5 (1), 15–17.
(21) Ojumu, T. V.; AttahDaniel, B. E.; Betiku, E.; Solomon, B. O.Auto-hydrolysis of lignocellulosics under extremely low sulphuric acidand high temperature conditions in batch reactor. Biotechnol. BioprocessEng. 2003, 8 (5), 291–293.
(22) TAPPI Test Methods, T204 cm-97, Solvent Extractives ofWood and Pulp; TAPPI Press: Atlanta, GA, 1997.
(23) TAPPI Test Methods, T249 cm-00, Carbohydrate Composi-tion of Extractive-Free Wood and Wood Pulp by Gas-Liquid Chroma-tography; TAPPI Press: Atlanta, GA, 2000.
(24) T222 om-02, Acid-Insoluble Lignin in Wood and Pulp; TAPPIPress: Atlanta, GA, 2002.
(25) TAPPI Test Methods, T211 om-93, Ash in Wood, Pulp, Paperand Paperboard: Combustion at 525 �C; TAPPI Press: Atlanta, GA,1993.

1185 dx.doi.org/10.1021/ie2025739 |Ind. Eng. Chem. Res. 2012, 51, 1173–1185
Industrial & Engineering Chemistry Research ARTICLE
(26) Saad, S. M.; Nada, A. M. A.; Ibrahim, A. A.; Tawfik, H. Sodaanthraquinone pulping of bagasse. Holzforschung 1988, 42 (1), 67–69.(27) Sanju�an, R.; Anzaldo, J.; Vargas, J.; Turrado, J.; Patt, R.
Morphological and chemical composition of pith and fibers fromMexican sugarcane bagasse. Holz Roh- Werkst. 2001, 59 (6), 447–450.(28) Saeman, J. F. Kinetics of wood saccharification: Hydrolysis of
cellulose and decomposition of sugars in dilute acid at high temperature.Ind. Eng. Chem 1945, 37 (1), 43–52.(29) Mamman, A. S.; Lee, J. M.; Kim, Y. C.; Hwang, I. T.; Park, N. J.;
Hwang, Y. K.; Chang, J. S.; Hwang, J. S. Furfural: Hemicellulose/xylose-derived biochemical. Biofuels, Bioprod. Biorefin. 2008, 2 (5), 438–454.(30) Khristova, P.; Kordsachia, O.; Patt, R.; Karar, I.; Khider, T.
Environmentally friendly pulping and bleaching of bagasse. Ind. CropsProd. 2006, 23 (2), 131–139.(31) Springer, E. L. Hydrolysis of aspenwood xylan with aqueous
solutions of hydrochloric acid. Tappi 1966, 49 (3), 102–106.(32) Daruwalla, E. H.; Shet, R. T. Heterogeneous acid hydrolysis of
alpha-cellulose from sudanese cotton. Text. Res. J. 1962, 32 (11),942–954.(33) Sasaki, M.; Fang, Z.; Fukushima, Y.; Adschiri, T.; Arai, K.
Dissolution and hydrolysis of cellulose in subcritical and supercriticalwater. Ind. Eng. Chem. Res. 2000, 39 (8), 2883–2890.(34) Abatzoglou, N.; Bouchard, J.; Chornet, E.; Overend, R. P.
Dilute acid depolymerization of cellulose in aqueous phase: Experi-mental evidence of the significant presence of soluble oligomericintermediates. Can. J. Chem. Eng. 1986, 64 (5), 781–786.(35) Sidiras, D. K.; Koukios, E. G. Acid saccharification of ball-milled
straw. Biomass 1989, 19 (4), 289–306.(36) Conner, A. H.; Wood, B. F.; Hill, C. G.; Harris, J. F., Cellulose:
Structure, Modification and Hydrolysis. In Structure, Swelling andBonding of Cellulose Fibers; Young, R. A., Rowell, R. M., Eds.; JohnWiley: New York, 1986; pp 281�296.(37) McKibbins, S. W.; Harris, J. F.; Saeman, J. F.; Neil, W. K.
Kinetics of the acid catalyzed conversion of glucose to 5-hydroxymethyl-2-furadehyde and levulinic acid. Forest Prod. J. 1962, 12, 17–23.(38) Pilath, H. M.; Nimlos, M. R.; Mittal, A.; Himmel, M. E.;
Johnson, D. K. Glucose reversion reaction kinetics. J. Agric. Food Chem.2010, 58 (10), 6131–6140.(39) Lin, C. H.; Conner, A. H.; Hill, C. G. The heterogeneous
character of the dilute acid-hydrolysis of crystalline cellulose. III. Kineticand X-ray data. J. Appl. Polym. Sci. 1992, 45 (10), 1811–1822.(40) Carey, F. A.; Sundberg, R. J., Advanced organic chemistry:. 5th
ed.; Springer: New York, 2007.(41) Nelson, M. L. Apparent activation energy of hydrolysis of some
cellulosic materials. J. Polym. Sci. 1960, 43 (142), 351–371.(42) Timell, T. E. Acid hydrolysis of glycosides. I. General condi-
tions effect of nature of aglycone.Can. J. Chem. 1964, 42 (6), 1456–1472.(43) Baek, S. W.; Kim, J. S.; Park, Y. K.; Kim, Y. S.; Oh, K. K. The
effect of sugar decomposed on the ethanol fermentation and decom-position reactions of sugars. Biotechnol. Bioprocess Eng. 2008, 13 (3),332–341.(44) Lu, C.; L€u, X. Copper chloride catalyzed decomposition
kinetics of glucose in high temperature liquid water. Huagong Xuebao/CIESC J. 2010, 61 (6), 1450–1456.