Embed Size (px)
Citation preview

Dilatancy stabilises shear failure in rock
Franciscus M. Aben, Nicolas BrantutDepartment of Earth SciencesUniversity College London, UK
Abstract
Failure and fault slip in crystalline rocks is associated with dilation. When pore fluids are presentand drainage is insufficient, dilation leads to pore pressure drops, which in turn lead to strengtheningof the material. We conducted laboratory rock fracture experiments with direct in-situ fluid pressuremeasurements which demonstrate that dynamic rupture propagation and fault slip can be stabilised (i.e.,become quasi-static) by such a dilatancy strengthening effect. We also observe that, for the same effectivepressures but lower pore fluid pressures, the stabilisation process may be arrested when the pore fluidpressure approaches zero and vaporises, resulting in dynamic shear failure. In case of a stable rupture, wewitness continued prolonged slip after the main failure event that is the result of pore pressure rechargeof the fault zone. All our observations are quantitatively explained by a spring-slider model combiningslip-weakening behaviour, slip-induced dilation, and pore fluid diffusion. Using our data in an inverseproblem, we estimate the key parameters controlling rupture stabilisation, fault dilation rate and faultzone storage. These estimates are used to make predictions for the pore pressure drop associated withfaulting, and where in the crust we may expect dilatancy stabilisation or vaporisation during earthquakes.For intact rock and well consolidated faults, we expect strong dilatancy strengthening between 4 and 6km depth regardless of ambient pore pressure, and at greater depths when the ambient pore pressureapproaches lithostatic pressure. In the uppermost part of the crust (< 4 km), we predict vaporisation ofpore fluids that limits dilatancy strengthening. The depth estimates where dilatant stabilisation is mostlikely coincide with geothermal energy reservoirs in crystalline rock (typically between 2 and 5 km depth)and in regions where slow slip events are observed (pore pressure that approaches lithostatic pressure).
1 Introduction
Pore fluids are ubiquitous throughout the earth’s crust, and may govern or affect fault dynamics in settingsranging from subduction zones, crustal scale strike-slip faults to geothermal reservoirs. Pore fluid pressureis controlled by changes in pore volume, which can be induced by deformation and fault slip. One keypore volume change phenomenon is dilatancy, which is the increase of the pore volume in rocks by small-scale brittle deformation (e.g., microfractures, opening of pore space between grains), and is expected tobe significant in rocks with a low porosity and well consolidated fault gouges. The added pore volumeacts as a pore pressure sink when the fault zone is partially or entirely undrained – a scenario likely tooccur during faulting, when new pore volume is created at a rate larger than the rate of fluid recharge fromoutside the fault zone. A drop in fault zone pore pressure increases the normal stress on the fault, therebyincreasing the shear resistance. Dilatancy strengthening is a transient phenomenon, as the extraneous shearresistance vanishes when pore pressure recovers to its initial value over time. Theoretical work over thepast four decades (e.g., Rice and Rudnicki , 1979; Rudnicki and Chen, 1988; Segall and Rice, 1995; Segallet al., 2010; Ciardo and Lecampion, 2019) has shown that dilatancy strengthening can potentially stabilisean otherwise (i.e., under dry or drained conditions) unstable fault by suppressing or delaying accelerationof slip, which has primary consequences for earthquake nucleation and rupture dynamics, and increases ourability to observe potential earthquake precursory signals (e.g. Nur , 1972; Scholz et al., 1973; Bouchon et al.,2013; Shreedharan et al., 2021). Despite the central role played by dilatancy in the mechanics of faulting,theoretical predictions have remained largely untested and only indirect, qualitative experimental evidence
1
arX
iv:2
101.
1003
6v2
[ph
ysic
s.ge
o-ph
] 1
3 M
ay 2
021

of rupture and slip stabilisation in granite (Martin III , 1980) and fault gouge (Lockner and Byerlee, 1994;Xing et al., 2019; Proctor et al., 2020) have been brought forward.
Two main obstacles remain to assess quantitatively the impact of dilatancy on earthquake nucleationand slip. Firstly, direct experimental evidence of dilatancy-induced rupture stabilisation is still lacking, andit remains unclear whether the common model assumptions are a correct representation of the reality ofhydro-mechanical coupling during rock failure and fault slip. Secondly, quantitative measurements of keymodel parameters under in-situ conditions are still not available. Indeed, most theoretical studies emphasisethe lack of experimental measurements on the effectiveness of a shear fault zone to act as a pore pressuresink, which severally impedes application of their theoretical understanding to make meaningful predictionsof dilatancy stabilisation. Two parameters are required to describe a fault’s effectiveness as a pore pressuresink: The dilation rate, i.e., how porosity increases with fault slip and other evolving quantities, and theso-called storage capacity of the fault zone material, which is a compressibility that relates the pore volumechange to the change in pore pressure.
Dilation rates have been measured during slip on natural and simulated fault gouges (e.g., Marone et al.,1990; Lockner and Byerlee, 1994; Samuelson et al., 2009), after shear failure of intact rock (e.g., Rummelet al., 1978), and during reactivation by pore fluid injection of a natural fault zone (Guglielmi et al., 2015).By contrast, fault zone storage is very difficult to measure. Fault zone storage describes how changes in porepressure are buffered by compression/extension of the pore fluid and the pore space. It can be estimatedfrom the storage capacity Sf of the dilated fault zone material (given by the compressibilities of the porespace and pore fluid times the porosity (e.g., Jaeger et al., 2007)) multiplied by the width of the fault zonedisturbed by dilatancy. Measuring Sf and the disturbed fault zone width is challenging: For fault gouges,storage capacities have been measured only in an undisturbed state (e.g., Wibberley , 2002), and the width ofthe disturbed gouge layer in natural fault zones may vary over some orders of magnitude even during a slipevent (see discussion in Rice, 2006). Measurements of the local pore pressure in the fault zone during faultslip are required to estimate the effective fault zone storage. Previous experimental studies that report ondilatancy stabilisation in intact rock (Martin III , 1980) and stick-slip events in consolidated gouge (Locknerand Byerlee, 1994; Xing et al., 2019) lacked the on-fault pore pressure measurements to calculate the faultzone storage. Recent advances in laboratory instrumentation (e.g., Brantut and Aben, 2021) allow for directmeasurements of the pore pressure drop caused by dilatancy during shear failure of intact rock (Brantut ,2020) and during slip on a saw-cut granite surface and in a gouge layer (Proctor et al., 2020). Such newtechniques open the way for systematic studies of dilatancy strengthening phenomena, including direct testsof model predictions and quantitative parameter estimation.
Here, we leverage our newly developed in-situ pore pressure measurement technique (Brantut , 2020;Brantut and Aben, 2021) to show direct evidence of rupture stabilisation by dilatancy strengthening, estimatethe key parameters necessary to quantify dilatancy strengthening in faults, and to predict at which depthsand pore pressure conditions dilatancy strengthening can indeed cause stabilisation of shear failure.
2 Results
The experimental setup used in this study allows us to measure local pore pressure changes at several locationson the surface of a cylindrical rock sample during deformation in a conventional triaxial loading apparatus.The local pore pressure changes were measured with in-house developed miniature pore pressure sensors(Brantut and Aben, 2021). We used Westerly granite cylindrical samples with two opposite facing notchescut at a 30◦ angle with respect to the sample axis, in order to have prior knowledge of the prospective failureplane during axial loading (Figure 1a). The samples were thermally cracked at 600◦C, and intact hydraulicproperties of the samples were characterised prior to deformation (see Methods and Figure S4). The sampleswere deformed at nominal effective pressures of 40 MPa and 80 MPa, with a varying combination of confiningpressure Pc and imposed pore pressure p0 (Table 1). The imposed pore pressure during deformation waskept constant at both sample ends. Axial load was increased by imposing a constant overall deformation rateof 10−6 s−1. The samples were loaded until shear failure, after which the piston displacement was arresteduntil complete reequilibration of the pore pressure, so that the total pore volume change due to failure in
2

Table 1: Summary of shear failure experiments. Nominal strain rate was 10−6 s−1 for all experiments.
Effective Confining Pore Min. pore Peak slip Dilation Storage Slippressure pressure pressure Failure pressure rate rate capacity weakening
Rock Peff Pc p0 mode pmin vmax dw/dδ Sfw δc(MPa) (MPa) (MPa) (MPa) (mm s−1) (-) (mm GPa−1) (mm)
WG6 40 40 0 (dry) stable† - - - - -WG3a 40 60 20 dynamic 0b > 10c 0.094 - -WG2a 40 70 30 dynamic 0b > 10c - - -WG5 40 100 60 stable 26 0.74 0.146 3.84 1.68WG12 40 110 70 stable 42 0.27 0.171 5.93 2.01WG4 40 120 80 stable 37 1.23 0.082 1.65 1.84WG10 80 120 40 dynamic 0b > 10c 0.054 - -WG7 80 160 80 dynamic < 14d > 10c 0.069 - -WG8 80 160 80 stable 16 0.65 0.077 1.28 1.87† Stable rupture was achieved by controlling acoustic emission rate as in Aben et al. (2019).a From Brantut (2020).b Pore water at partially vaporised or degassed.c 10 mm s−1 is the maximum detectable value in our system.d Pore pressure transducers out of range.
the sample could be measured. Deformation was subsequently resumed, and slip continued on the newlyformed fault. Periods of stable sliding or stick-slip events occurred. After each slip increment, we pauseddeformation to remeasure pore volume changes. More details are provided in the Methods section.
2.1 Shear failure of intact rock
Under the pressure and temperature conditions of our tests, thermally cracked Westerly granite is brittleand when conducted under dry conditions deformation is always characterised by dynamic failure along ashear fault. Here, in our water saturated experiments, two types of behaviour were observed dependingon the initial pore pressure p0 (Table 1). At Peff = 40 MPa, tests conducted at p0 = 20 and 30 MPaunderwent dynamic shear failure. At Peff = 80 MPa, the test conducted at p0 = 40 MPa and one test wherep0 = 80 MPa also failed dynamically. Dynamic failures are characterised by the well-known ‘bang’. We firstobserved a slow onset of the reduction in stress beyond the peak fracture strength that accelerated strongly.The majority of the stress reduction during dynamic failure was accommodated within less than a second(Figure 1b, dashed segment). No clear deceleration in the stress reduction rate was observed.
By contrast, at initially high pore pressure (p0 = 60 to 80 MPa and Peff = 40 MPa, and one test atp0 = 80 MPa and Peff = 80 MPa), sample failure occurred silently, which indicates that failure remainedquasistatic. The entire stress drop took several minutes, and the largest reduction in stress occurred in atimespan of the order of tens of seconds. The peak slip rate was typically less than 1 mm s−1. We termthese ruptures “stable”.
A clear shear fault formed between the notches for most experiments (e.g., Figure 1a), except for twosamples (deformed at Pc = 100 MPa, p0 = 60 MPa, and Pc = 110 MPa, p0 = 70 MPa) where the fault planedeflected from its prospective path towards the sample’s end.
Pore pressure was recorded on the fault by two local pressure sensors, and recorded outside of the failurezone by two additional sensors (Figures S1, 2). In all samples, the pore pressure remained uniform in thesample until the peak differential stress, at about one MPa lower than the imposed pore pressure (Figure 2).Beyond the peak stress, pore pressure decreased homogeneously throughout the sample at first, and thendropped more rapidly on-fault than off-fault. In both the dynamic and stable cases, the stress drop duringfailure was associated with a strong pore pressure drop on the fault, of the order of several tens of MPa.The off-fault pore pressure also decreased but in a more gradual manner, and with a delay.
3

slip [mm]
shea
rstre
ss[M
Pa]
Pe� = 40MPa
dynamic failure
stable failure
controlledfailure
notchedintact
thermallycracked
post−failure
2 cm
(a) (b)
Figure 1: (a): Notched Westerly granite samples that are intact (left), thermally cracked (center) andthermally cracked and failed under triaxial loading conditions (right). (b): Shear stress versus slip duringstable and dynamic shear failure experiments performed at 40 MPa effective pressure. Dynamic failureis indicated by the dashed portion of the curve. Dry quasi-static failure at 40 MPa effective pressure wasachieved by acoustic emission rate controlled loading feedback, and provides a direct estimate of the minimumbreakdown work necessary to reach the residual frictional strength of the fault. Gray dashed line: Cohesion-weakening function f(δ) used in spring-slider simulations. Inset: Some stress versus strain curves for stable,dynamic, and controlled shear failure at 40 MPa (black curves) and at 80 MPa (purple curves) effectivepressure.
The pore pressure evolution during and after failure was different between dynamic and stable ruptures.In all samples that failed dynamically, the on-fault pore pressure dropped to zero concurrently with themain shear stress drop, and remained constant for the subsequent 5 to 10 minutes, while deformation wasstopped. The off-fault pore pressure did not drop to zero but also remained constant at very small values (afew MPa) for the same time period. The shear stress dropped immediately towards zero, overshooting theresidual frictional strength of the rock (Figure 1b) – a typical observation for dynamic laboratory failures.The lack of an immediate pore pressure recovery in the fault zone can be interpreted as an indication forlocal vaporisation or degassing (Brantut , 2020).
By contrast, during stable failure, the on-fault pore pressure dropped to a minimum significantly abovezero (typically tens of MPa) as slip rate reached it maximum and shear stress experienced a relatively rapidfirst drop. After this first stress drop, we stopped deformation by locking the axial piston in place. The porepressure on the fault immediately increased, while shear stress decreased further and more fault slip wasaccumulated. The on-fault pore pressure then asymptotically recovered to the imposed p0 at the boundary ofthe sample. The off-fault pore pressure experienced a gradual decrease during failure, followed by a recovery.The pore pressure recovery was slower off than on the fault, to the extent that the off-fault pore pressurewas transiently lower than that measured on the fault, indicating more rapid recharge inside the fault zonethan outside it.
The total pore volume in the samples, as measured by the difference in intensifier volume before ruptureand after complete pressure reequilibration, increased strongly during the failure of the intact rock (Figure3). On average, additional pore volume created during failure at 80 MPa initial effective pressure is lowerthan at 40 MPa effective pressure. We express dilation as an increase in fault width w as a function of faultslip δ, which is computed from the measured pore volume change (see Method section). We find dilationrates dw/dδ between 0.055 and 0.171 for shear failure from an intact state (Table 1). The two highestdilation rates were observed for samples where the fault curved away from one of the notches instead offollowing the intended trajectory, resulting in a more wavy fault zone (samples WG5 and WG12). For thetwin experiments performed at the same imposed experimental conditions (Pc = 160 MPa, p0 = 80 MPa),
4

0
100
200
shea
rstr
ess
[MPa
]
(a): stable failurePc = 120, p0 = 80MPa
0
25
50
75
pore
pres
sure
[MPa
]
0 10
50
75 off-fault
on-fault
0
1
2
slip
[mm
]
0
100
200 (b): dynamic failurePc = 60, p0 = 20MPa
0
25
50
75 0 10
0
20
0
1
2
0
100
200
shea
rstr
ess
[MPa
]
(c): stable failurePc = 160, p0 = 80MPa
0
25
50
75
pore
pres
sure
[MPa
]
100 0 100 200time since main failure [s]
0
1
2
slip
[mm
]
0
100
200(d): dynamic failure
Pc = 120, p0 = 40MPa
0
25
50
75 0 10
0
25
100 0 100 200time since main failure [s]
0
1
2
Figure 2: Records of shear stress (top), pore pressure (middle), and fault slip (bottom) for stable failure at(a): Peff = 40 MPa (sample WG4) and at (b): Peff = 80 MPa (sample WG8), and for dynamic failure at(c): Peff = 40 MPa (sample WG3) and at (d): Peff = 80 MPa (sample WG10). Interval for dynamic intervalshown as a dashed curve. Middle panel: On-fault pore pressure records shown as black curves, off-fault porepressure records shown as gray curves. Insets show pore pressures around the main failure event. Data fromother samples are shown in Figure S2.
5

0 2 4fault slip [mm]
0.0
0.2
0.4
0.6
0.8
1.0
pore
volu
me
chan
ge[c
m3 ]
Peff = 40MPa
Peff = 80MPa
Figure 3: Cumulative pore volume change versus fault slip for shear failure (large markers) and subsequentepisodes of fault slip (small markers) in samples deformed at an initial effective pressure of 40 MPa (blackcurves) and 80 MPa (gray curves). Left-pointing triangle = WG3, diamond = WG4, circle = WG5, square= WG7, inverted triangle = WG8, hexagon = WG10, right-pointing triangle = WG12.
we observe a marginally higher dilation rate for the stable failure (sample WG8) relative to the dynamicfailure (sample WG7).
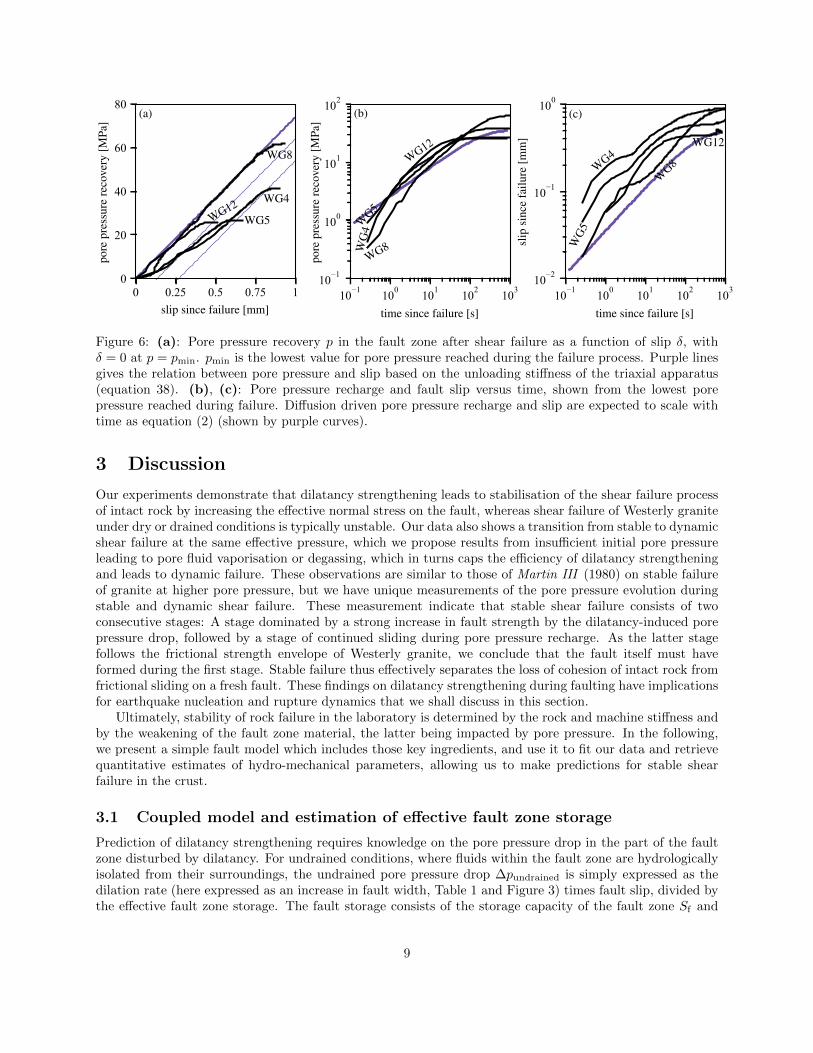
The large drop in pore pressure localised in the fault zone and the increase in pore volume provide directevidence for strong fault zone dilatancy during shear failure. We can use the pore pressure recorded in thefault zone during shear failure to decouple mechanical weakening and pore pressure effects. We compute theeffective normal stress on the fault, obtained as σn − p, where p is the measured on-fault pore pressure, andanalyse the stress paths in a Mohr diagram (Figure 4). The unloading path for shear failure of Westerlygranite under drained or dry conditions is shown for reference (Figure 4, gray curve). The unloading pathsfor both stable and dynamic shear failure under partially drained conditions deviate from the drained case.Considering stable failure first, we identify two consecutive stages in the unloading path: An increase ineffective normal stress, directing the unloading path towards the frictional strength envelope for Westerlygranite (Byerlee, 1967; Lockner , 1998) (Stage 1, Figure 4), followed by a decrease in normal stress so thatthe unloading path closely follows the frictional strength envelope (stage 2). The fault slip rate increasesduring stage 1, and decreases during stage 2. Fault slip accumulated during this part of the shear stress dropincreases nearly linearly with the recovery of the fault zone pore pressure towards the imposed pore pressure(Figure 6a) and both the rate of pore pressure recharge and slip decrease with time (Figure 6b, c). Theonset of dynamic shear failure under partially drained conditions occurs during stage 1, where the dynamicunloading path runs parallel to the drained unloading path but at higher normal stress (dashed lines, Figure4).
2.2 Fault slip by stable sliding and stick-slip events
After shear failure, we imposed between 8 and 10 intervals of slip on the freshly formed fault at a slip rateof 1.15 µm s−1 or 11.5 µm s−1. We arrested the slip rate between each interval to allow pore pressure toreequilibrate and measure total pore volume change. For each slip interval, fault slip was accommodatedeither by stable sliding, by stick-slip, or by a combination of the two. We measured 6 to 8 stick-slip eventsper sample. The pore pressure initially increased at the onset of each interval, concurrently with an increasein shear stress (Figure 5). This was followed by a decrease in pore pressure, whilst shear stress approachedeither a new steady state value and fault slip remained stable, or the shear stress approached a peak valuebefore dropping dynamically during a stick-slip event. During the stick-slip events, the pore pressure droppedby 1 to 10 MPa in the fault zone (Figure 5). After a stick-slip event, we observed a similar behaviour ofpore pressure, fault slip, and shear stress to that observed after stable shear failure: Pore pressure recoveredtowards its imposed value, while shear stress decreases further and the fault continued to accumulate slip.
6

50 100 150 200 250 300normal stress [MPa]
50
100
150
200
250
shea
rstr
ess
[MPa
] dynamic
drai
ned
drai
ned
stable
stable
stage 1
stage 2
0 σn
τ
frictional stre
ngthfracture stre
ngth
4 2 0
log10 slip rate
[mm s−1]
Figure 4: (a): Shear failure stress paths from the fracture strength (peak shear stress) down to the residualfrictional strength for dry or drained shear failure (gray curves), and for partially drained stable and dynamicshear failure (black curves, unstable experiments shown up to the onset of dynamic failure). Fault normalstress is corrected for the fault zone pore pressure measured during failure. Frictional strength for Westerlygranite from Byerlee (1967) (dashed line). The inset shows the overall trend of fracture and frictionalstrength (Byerlee, 1967) and highlights the approximate range of our experiments in the main panel.
7

80
100
shea
rstr
ess
[MPa
]
Pc = 120MPap0 = 80MPa
3200 7800
60
80
70
75
80
pore
pres
sure
[MPa
] off-faulton-fault
6000 6200 6400 6600 6800 7000time since shear failure [s]
2.6
2.8
slip
[mm
]
Ûδ = 0 Ûδ = 0
Ûδ = 1.15µms−1 Ûδ = 11.5µms−1
Figure 5: Records of the shear stress (top), pore pressure (middle), and fault slip (bottom) during progressivesliding on a fresh fault in granite. The records contains stick-slip events at imposed slip rates of 1.15 µm s−1
and 11.5 µm s−1(dynamic intervals shown by dashed curve). On-fault pore pressure records shown as blackcurves, off-fault pore pressure records shown as gray curves. Inset shows shear stress for the entire series ofstick-slip events recorded for this sample (sample WG8).
The pore volume in the samples continued to increase during prolonged slip along the fault at a lesser ratethan during shear failure (Figure 3). Dilation rates computed for sliding along the freshly created fault varybetween 0.011 and 0.046, and do not vary between episodes of stable sliding or stick-slip.
The initial increase of fault zone pore pressure suggests some compaction of the fault zone material fromaxial loading before the onset of dilation. The rise in shear strength and drop in pore pressure are indicativeof dilatancy strengthening of the fault, but the strengthening effect is not sufficient to suppress unstablebehaviour, as illustrated by the stick-slip events. These observations agree with recent observations of shearstress and local pore pressure in a simulated gouge layer and a bare granite saw cut experiment subject toimposed slip by Proctor et al. (2020).
8
0 0.25 0.5 0.75 1slip since failure [mm]
0
20
40
60
80po
repr
essu
rere
cove
ry[M
Pa]
(a)
WG4
WG8
WG12WG5
10 1 100 101 102 103
time since failure [s]
10 1
100
101
102
pore
pres
sure
reco
very
[MPa
]
(b)
WG
4
WG8
WG12
WG5
10 1 100 101 102 103
time since failure [s]
10 2
10 1
100
slip
sinc
efa
ilure
[mm
]
(c)
WG4
WG8
WG12
WG
5
Figure 6: (a): Pore pressure recovery p in the fault zone after shear failure as a function of slip δ, withδ = 0 at p = pmin. pmin is the lowest value for pore pressure reached during the failure process. Purple linesgives the relation between pore pressure and slip based on the unloading stiffness of the triaxial apparatus(equation 38). (b), (c): Pore pressure recharge and fault slip versus time, shown from the lowest porepressure reached during failure. Diffusion driven pore pressure recharge and slip are expected to scale withtime as equation (2) (shown by purple curves).
3 Discussion
Our experiments demonstrate that dilatancy strengthening leads to stabilisation of the shear failure processof intact rock by increasing the effective normal stress on the fault, whereas shear failure of Westerly graniteunder dry or drained conditions is typically unstable. Our data also shows a transition from stable to dynamicshear failure at the same effective pressure, which we propose results from insufficient initial pore pressureleading to pore fluid vaporisation or degassing, which in turns caps the efficiency of dilatancy strengtheningand leads to dynamic failure. These observations are similar to those of Martin III (1980) on stable failureof granite at higher pore pressure, but we have unique measurements of the pore pressure evolution duringstable and dynamic shear failure. These measurement indicate that stable shear failure consists of twoconsecutive stages: A stage dominated by a strong increase in fault strength by the dilatancy-induced porepressure drop, followed by a stage of continued sliding during pore pressure recharge. As the latter stagefollows the frictional strength envelope of Westerly granite, we conclude that the fault itself must haveformed during the first stage. Stable failure thus effectively separates the loss of cohesion of intact rock fromfrictional sliding on a fresh fault. These findings on dilatancy strengthening during faulting have implicationsfor earthquake nucleation and rupture dynamics that we shall discuss in this section.
Ultimately, stability of rock failure in the laboratory is determined by the rock and machine stiffness andby the weakening of the fault zone material, the latter being impacted by pore pressure. In the following,we present a simple fault model which includes those key ingredients, and use it to fit our data and retrievequantitative estimates of hydro-mechanical parameters, allowing us to make predictions for stable shearfailure in the crust.
3.1 Coupled model and estimation of effective fault zone storage
Prediction of dilatancy strengthening requires knowledge on the pore pressure drop in the part of the faultzone disturbed by dilatancy. For undrained conditions, where fluids within the fault zone are hydrologicallyisolated from their surroundings, the undrained pore pressure drop ∆pundrained is simply expressed as thedilation rate (here expressed as an increase in fault width, Table 1 and Figure 3) times fault slip, divided bythe effective fault zone storage. The fault storage consists of the storage capacity of the fault zone Sf and
9

the width of the fault, so that the undrained isothermal pore pressure drop is
∆pundrained = (dw/dδ)δ/Sfw. (1)
Undrained conditions may have been approached during dynamic shear failure of intact rock; however, thisdata cannot be used to estimate fault zone storage since the pore pressure drop was capped by the imposedpore pressure. We can estimate fault zone storage directly from the pore pressure drop measured duringthe dynamic interval of the stick-slip events, assuming undrained conditions. To do so, we quantified fromthe data the pore pressure drop ∆pundrained and concurrent fault slip δ during the dynamic slip events(typically occurring between 1 or 2 data points, i.e., < 200 ms). We used the dilation rate measured duringprogressive slip on the fault, which we approximate as constant regardless of stable sliding or episodes ofstick-slip (Figure 3). For a total of 25 analysed stick-slip events measured on 4 samples, most values forSfw lie between 1 × 10⁻¹³ Pa−1m and 6 × 10⁻¹³ Pa−1m (3 stick-slip events fall below this range, and 3above). Note that Brantut (2020) followed a similar approach to assess fault zone storage, but a larger timeinterval was used that includes a partially drained pressure drop and slip preceding dynamic slip. His valuestherefore must be treated as an upper bound as they may overestimate fault zone storage.
During stable shear failure of intact rock the fault zone is partially drained, thus we cannot obtain faultzone storage from equation (1). Instead, we use a 1D spring-slider model to simulate shear failure underpartially drained conditions (Figure 7a), adapted from Rudnicki and Chen (1988). The spring-slider modeluses a cohesive type constitutive law for the strength of the fault, with a residual fault friction that dependson the pore pressure, and allows for fault-normal fluid flow and dilation as a function of slip (see Methodssection). We use the spring-slider model and our experimental data in an inverse problem to estimate faultzone storage Sfw and cohesion-weakening distance δc for each experiment that exhibited stable shear failure(see Methods section). δc in the model is akin to the slip-weakening distance measured in triaxial (controlled)rupture experiments on intact granite (Figure 1, sample WG6 in Table 1) (e.g., Wong , 1982; Lockner et al.,1991; Aben et al., 2020). However, δc in the model depends on the definition of cohesion-weakening functionand may vary from the measured slip-weakening distances. We therefore treat δc as an unknown parameter.
Spring-slider simulations with the best fitting pair of values for Sfw and δc simulates fairly well theaccelerating slip rate and pore pressure reduction leading up to stable failure (Figure 7c, d). The simulatedon-fault pore fluid pressure recharge after failure does not follow the experimental record (Figure 7d), likelythe result of assuming fault-normal flow only in simulations (further discussed in section 3.2).
The four experiments yield best fits for δc that vary between 1.7 mm to 2 mm (Table 1), similar tovalues measured for the slip-weakening distance of granite (Aben et al., 2020) (Figure 1). We use this toquantify the transition from stable to dynamic failure in our experiments, which occurs when the loadingstiffness of the machine k (see Method section for computation of k) is lower than the critical stiffness ofthe fault kcr. kcr depends on the sharpest decrease of the cohesion weakening function (f(δ/δc) in thespring-slider model, Methods section). For our expression for f , kdrained
cr = 1.5τp/δc, where τp is the cohesionshear stress drop at constant normal stress (Methods section). The undrained critical stiffness is given bykundrained
cr = (1.5τp − µ∆pundrained)/δc. Using representative values for failure at 40 MPa effective pressure(τp ≈ 85 MPa, δc ≈ 1.5 mm, µ = 0.6), we see that kdrained
cr /k = 1.16 and drained conditions always leadto failure. However, the fault is stable (i.e, kundrained
cr /k < 1) when the undrained pore pressure drop largerthan 28 MPa. This is similar to the smallest partially drained pore pressure drop measured during stablefailure (28 MPa at Pc = 110, p0 = 70, Table 1). Note that, although the measured partially drained porepressure drop is not the undrained pore pressure drop, it has the same effect on the critical fault stiffness. Asproposed, if the potential pore pressure drop is limited by the magnitude of the imposed pore pressure, thedilatancy strengthening effect cannot reach a sufficient magnitude to stabilise shear failure. Thus we expectvaporisation and dynamic failure if imposed pore pressure p0 < 28 MPa. Indeed, we observe dynamic failureat the experiment performed at Pc = 70, p0 = 30. Hence, in our experimental setup we always expect stablefailure of granite in the presence of pore fluids, provided that the initial pore pressure is sufficiently high tosustain the on-fault pore pressure drop during failure.
The best fitting values for effective fault zone storage Sfw for the two experiments with the smaller dilationrates are around 1.5 × 10⁻¹² m Pa−1, the two experiments with larger dilation rates yield values that are
10

(y = 0, p = p0 )
(y = L)
S, κ
w
k
fault zone
σn fluid inlet
Sf , dw/dδ
τ
host rock
spring slider model schematic
(a)
observed
simulated
(c)
slip
rate
[mm
/s]
time since failure [s]
(d)
time since failure [s]
faul
tzon
epo
repr
essu
re[M
Pa]
(b) sample WG4
cohesion weakening distance [mm]
faul
tzon
est
orag
e[P
a−1m
]
Figure 7: (a): Sketch of the spring-slider model that allows for dilation within the fault zone. (b): Prob-ability density resulting from exploring (δc, Sfw)-space, computed using a least absolute value criterion forthe misfit between observed and simulated data for experiment WG4. Best fitting simulation indicated byblack marker. (c): Observed (gray curve) and simulated (black) slip rate over time. (d): Observed (graycurve) and simulated (black) fault zone pore pressure.
11

approximately 3 to 4 times as large (Table 1). We then simulated the dynamic failure experiments withfault zone storages between 1× 10⁻¹² and 6× 10⁻¹² m Pa−1. Using this range, we always predict dynamicshear failure associated with fluid vaporisation (i.e., on-fault pore pressure reaches zero and is capped therein the simulation) for the samples with the lowest imposed pore pressures p0 = 20 MPa and p0 = 30 MPa.For dynamic failure at Pc = 120 MPa, p0 = 40 MPa and Pc = 160 MPa, p0 = 80 MPa, dynamic failure waspredicted only when Sfw was smaller than 1.5× 10⁻¹² and 1.9× 10⁻¹² m Pa−1, respectively.
We measured a smaller partially drained pore pressure drops for faults with a larger dilation rate comparedto faults with a smaller dilation rate (Table 1). This may seem counterintuitive at a first glance, but∆pundrained is effectively the ratio of dilation rate over fault zone storage (equation (1)): The dilation ratedoubles from the least dilatant to the most dilatant fault zone, whereas the fault zone storage increasesthree or fourfold. Of the twin experiments performed at Pc = 160 MPa and p0 = 80 MPa, dynamic failureoccurred for a lower dilation rate (and so a larger pore fluid pressure drop leading to vaporisation) comparedto the stable failure.
Effective fault zone storage for stick-slip events is about one order of magnitude smaller than storageestimated for shear failure of intact rock. The difference may be ascribed to i) a change in storage capacityof the fault zone material, which evolves from a micro-fracture dominated zone at the onset of shear failureto a gouge and cataclasite bearing zone of deformation as fault slip progresses, and ii) a difference in thewidth of the fault zone that is disturbed by dilation. Visual inspection of the samples, and microstructurespublished by Brantut (2020), suggest a fault zone width of around 1 to 3 mm for shear failure of intactrock. Microstructures in simulated gouge show strong localisation during stick-slip events, with shear zonesof the order of 10 µm wide (Scuderi et al., 2017). Dilation outside these principal shear zones is likely, andlocalisation may be less in rough faults presented here than in simulated gouge. Nonetheless, an order ofmagnitude decrease in disturbed fault zone width for stick-slip events compared to shear failure remainsrealistic.
3.2 Afterslip driven by pore pressure recovery
We observed progressive fault slip after stable shear failure that scales linearly with on-fault pore pressurerecovery (Figure 6a). As the pore pressure recovers, the shear resistance to faulting decreases by τ = µ(σn−p).Elastic unloading of the fault’s surrounding medium (i.e., the loading piston and the host rock) providesthe driving force to overcome the shear resistance, and is given by the elastic unloading stiffness −k of thesurrounding medium times fault slip δ. For stable sliding observed in the experiments, shear resistance τand imposed load −kδ are in balance. From this, it follows that afterslip is linearly proportional to porepressure recovery, with a slope proportional to µ/k. Indeed, the slope of the data can be fitted with thisratio, adjusted for the triaxial conditions of the experiment (Figure 6) (see Methods section for details).
Post-failure slip is primarily driven by diffusive pore pressure recharge of the fault: The fault zone afterfailure is at a lower pore pressure than its surroundings, and pore pressure reequilibration subsequentlyoccurs at a rate controlled by the hydraulic diffusivity of the fault walls. Specifically, if we assume that thefault is embedded in an infinite medium (i.e., the distance to any boundary where pore pressure is maintainedconstant is very large compared to hydraulic diffusion length), the on-fault pore pressure evolution is givenby (Carslaw and Jaeger , 1959, , Chap. 12, p. 306)
p(t)− p0 ≈ ∆pundrained
(1− et/trechargeerfc(
√t/trecharge)
), (2)
where trecharge = ηS2f w
2/(4Sκ) is the characteristic recharge time. Using independently measured repre-sentative values for each parameter, we obtain trecharge ≈ 16 s, and the time evolution of post-failure porepressure is well predicted by Equation 2 (Figure 6b). As stated above and directly observed in the data(Figure 6a), the slip evolution is proportional to the pore pressure evolution, and is also well predicted bythe recharge equation 2 (Figure 6c).
The details of the pore pressure and slip evolution deviate from the simple semi-infinite model because (1)further slip is likely to generate some dilation, limiting the recharge, (2) the imposed constant pore pressureat the ends of the sample accelerates the recharge, and (3) the fault geometry likely leads to along-fault pore
12

pressure diffusion, which also accelerates the recharge, as directly evidenced by the transient time intervalwhere pore pressure is lower off- than on the fault (Figure 2) – a situation that is impossible if fluid flowwas only one-dimensional. Despite these caveats, the simple recharge model coupled to elastic relaxationexplains remarkably well the phenomenon of short-term post-failure slip.
3.3 Implications for fault slip, earthquakes, and rupture dynamics
We successfully simulated the experimental findings on dilatancy strengthening using a simple 1D springslider model, which contains the appropriate ingredients to assess dilatancy strengthening in realistic faultzone settings. The key parameters to assess at which slip rate (or shear rate in a wider zone of deformation)a fault zone transitions from drained to undrained conditions are the hydraulic diffusivity of the host rockoutside the zone of dilation, and the fault zone dilation rate and storage. Assessing these latter two param-eters for natural fault zones is a challenge for future studies: Larger scale fault zone roughness (e.g., faultbends, dilatational jogs) will influence dilation rate, and the width of the dilating zone (i.e., component w infault storage Sfw) may vary. In the following section, we discuss the implications of dilatancy strengtheningon fault slip, earthquakes, and rupture dynamics using the experimentally constrained parameters, keepingin mind that these values may change according to, amongst others, host rock and fault zone material, andfault roughness.
Dilatancy-induced pore pressure changes in the crust We shall first predict the dilatancy-inducedpore pressure drop in the crust for materials with large cohesion, such as intact rock and consolidated faults,for the two end-member cases of fully drained and fully undrained conditions. The dilation rate during shearfailure of intact rock decreases with increasing effective pressure, as we can see from our data and those ofRummel et al. (1978, Figure 6), which can be described by an exponential function (Figure S6). We usedthis function to express a mean dilation rate with upper- and lower bounds (Figure S6). With these values,the undrained isothermal pore pressure drop (equation (1)) is between 50 and 100 MPa at effective pressuresbelow 50 MPa, and becomes negligible at effective pressures above 200 MPa (Figure S8a).
Effective pressure in the crust depends on the depth and the ambient pore fluid pressure, which typicallyvaries between hydrostatic and lithostatic pore pressure. Using the pressure-dependent undrained porepressure drop, we predict that vaporisation during shear failure is likely to occur down to a depth of 4 km(for average dilation) regardless of the initial pore pressure (Figure 8). At very low pore pressure, vaporisationmay occur down to 8 km depth. We thus do not expect significant failure stabilisation in the uppermost partof the crust. We do however expect a strong dilatancy strengthening effect in the 2 kilometres directly belowthe vaporisation zone, where the undrained pore pressure drop is between 20% and 100% of the ambientpore pressure. Dilatancy strengthening becomes negligible at high effective pressures, below around 6 kmdepth, but remains significant in regions in the crust with a low effective pressure – i.e., regions where thepore pressure approaches lithostatic pressure.
In the above analyses, the fault zone storage Sfw remained constant with effective pressure. Storagecapacities of rocks typically decrease with increasing pressure (see for instance Figure S4), and we expect thesame for the fault zone storage capacity Sf . Qualitatively, a pressure-dependent fault zone storage capacitywould yield a larger undrained pore pressure drop at higher effective pressure, i.e., greater depth.
Note that our estimates of pressure drop rely on a slip-dependent dilation model, which is representativeof slip occurring on intact or consolidated faults, possibly with some natural roughness. The direct slip de-pendence is motivated by observations (Figure 3), but also reflects the end-member case of a rate-and-statefault subject to rapid steps in slip rate without healing. In that context, the evolution of porosity with slipreported here reflects irreversible state evolution of the fault. For mature, smooth faults containing uncon-solidated fault gouge (relevant at shallow depth), a model where dilatancy and compaction fully depends onrate and state evolution (Marone et al., 1990; Samuelson et al., 2009) would be more appropriate, althoughthis dependence is rather small compared to the dilation measured here (Brantut , 2020, Section 5.3).
13

0 100 200 300 400ambient pore pressure p0 [MPa]
14
12
10
8
6
4
2
0de
pth
[km
]
vaporisation
∆pundr.=
p0,
average dilationlarge dilation
small dilation
lithostatic pore pressure
hydrostaticpore
pressure
0 0.5 1
∆pundrained/p0
0.0 0.5 1.0 1.5critical fault length [m]
14
12
10
8
6
4
2
0
drai
ned
undrained
,
hydrostatic
undr
aine
d,ne
arlit
host
atic
Figure 8: Undrained isothermal pore pressure drop during shear failure of intact material in a crustal depthprofile with a range of ambient pore pressures (hydrostatic and lithostatic pore pressure profiles shown asdashed lines). The undrained pore pressure drop is normalised by the ambient pore pressure, shown here foraverage fault zone dilation. Black curves show where the undrained pore pressure drop equals the ambientpore pressure (i.e., net zero pore pressure), for average, small, and large dilation. At depths smaller thanthese curves, vaporisation is expected. Left panel: Critical length of the slipping patch of the fault, belowwhich the fault is stable. Gray curve: drained critical fault length, black curves: undrained critical faultlength for a hydrostatic pore pressure profile and a near lithostatic pore pressure profile. Critical fault lengthcalculated with a shear modulus of 25 GPa and poisson’s ratio of 0.22.
14

Implications for fault slip We predict strong dilatancy strengthening in the upper crust (between 4and 6 km) and at increased depth if the ambient pore pressure approaches lithostatic pressure. This hasimplications for the behaviour of fault slip and rupture dynamics across the entire “spectrum of fault slip”from slow slip rates to earthquakes.
In the last two decades, a range of fault slip rates in different crustal settings have been measured thatare slower than dynamic slip during earthquakes (Peng and Gomberg , 2010; Burgmann, 2018), such as slowslip events (SSEs) at the base of the seismogenic crust in subduction zones and in crustal-scale strike slipfaults. Ambient pore pressure in these regions are typically high and may approach the lithostatic porepressure (e.g., Thomas et al., 2009; Matsubara et al., 2009). Many SSEs are episodic, and may occur onparts of the fault that are also subject to fast slip (i.e., earthquakes) (Burgmann, 2018). Slow slip eventsrequire initial weakening of the fault zone material to achieve a notable increase of fault slip, followed bysome strengthening mechanism to limit the slip rate and rupture velocity. Dilatancy strengthening of avelocity-weakening material has been proposed as one of these strengthening mechanisms (e.g., Segall et al.,2010), motivated by the abundance of pore fluids within most SSE settings. Our experiments support thisidea directly, observing that dilatancy strengthening leads to the formation of an 8 cm long fault in around3 s, giving a propagation velocity of around 2.3 km per day that matches with propagation velocities forSSEs of around 10 km per day (Gomberg et al., 2016).
We observed that dilatancy generates two separate phases of fault slip: The initial weakening processfollowed by prolonged fault slip and stress reduction driven by pore pressure recharge of the fault. Thetimescale of the first phase is an elastodynamic one, governed by the slip-weakening distance and, in ourtests, machine stiffness, and in nature by elastic properties of the surrounding rock. The rate of the secondphase is determined by the characteristic timescale trecharge (section 3.2, equation 2), which depends ondilation zone width w. If the recharge timescale is much larger than the initial elastodynamic weakeningtimescale, pore pressure reequilibration can lead to prolonged slip far from the rupture tip within a singlerupture event. The characteristic timescale for the experiments is around 16 s. However, in nature, thedilatant region could be orders of magnitude larger due to fault roughness. In this case, afterslip maybe observed as transient post-seismic slip, with post-seismic fluid migration potentially driving aftershocksequences (e.g., Nur and Booker , 1972; Miller , 2020).
Implications for earthquake nucleation Strong dilatancy strengthening may not always prevent earth-quake nucleation. An earthquake nucleates when the loading stiffness of the material surrounding the faultis lower than the faults’ critical stiffness (kcr). The loading stiffness decreases with growth of the slippingfault section, whilst the faults’ critical stiffness decreases with dilatancy as follows: We use the same formu-lation for drained and undrained kcr as in section 3.1, now with pressure-dependent values for ∆pundrained
and τp. Pressure-dependent τp for Westerly granite was obtained from Byerlee (1967, Figure 5 and 9).At effective pressures below 200 MPa, the undrained critical stiffness is greatly reduced compared with thedrained critical stiffness (Figure S8b). At higher effective pressures, the dilatancy strengthening effect on thecritical stiffness vanishes. The loading stiffness of the surrounding material for faults embedded in an elasticcontinuum is approximated by k = G/W , where G is the shear modulus and W is the length of the slippingfault section. Therefore, the critical stiffness is inversely proportional to a critical length of the slipping faultsection, so that the slipping fault section becomes unstable when it exceeds this critical nucleation length.Using our data on Westerly Granite, the drained nucleation length remains more or less stable throughoutthe brittle crust at around 0.3 to 0.4 m (Figure 8). For an undrained fault zone at ambient hydrostaticpore pressure, the nucleation length in the top two km of the crust increase fourfold (i.e., in the zone wherewe predict vaporisation), and reverts to the drained nucleation length at increased depth. For undrainedconditions at ambient pore pressures approaching lithostatic pore pressure, we expect that the nucleationlength increases by a factor of 4 below the vaporisation zone and by a factor of 3 at 15 km depth (Figure 8).
The near-lithostatic pore pressure zones correspond to the zones where SSEs occur, and although thenucleation length of Westerly granite may not be representative for the material that host SSEs, we stillexpect a strong increase in nucleation length for these materials. The critical nucleation length for Westerlygranite is directly applicable in regions in the crust with human subsurface activities, such as geothermal
15

energy reservoirs. These are generally located between 2 and 5 km depth (e.g., Tomac and Sauter , 2018),which overlaps with the depth range for pore fluid vaporisation and for strong dilatancy hardening (Figure8).
Dilatancy strengthening leads to slow slip over increased distances, but does not necessarily change theinherent seismogenic character of the material and also allows for seismicity. This is evident from the stick-slip events during continued fault slip in our experiments, where dilatancy strengthening was insufficientto suppress dynamic rupture. The approach towards dynamic rupture is however extended by dilatancystrengthening. Such a longer precursory phase may allow for better identification of active earthquakeprecursory phenomena such as foreshocks (e.g., Ohnaka, 1992; Bouchon et al., 2013) or precursory creep(e.g., Roeloffs, 2006), and passive phenomena such as changes in vp/vs ratios (e.g., Nur , 1972) and changesin seismic wave amplitudes (e.g., Shreedharan et al., 2021). These two latter phenomena may be particularlysensitive to local pressure changes and fracture damage induced by dilatancy (Shreedharan et al., 2021).Hence, crustal regions with strong dilatancy strengthening may be best suitable to find reliable precursoryphenomena.
Implications for rupture energy budget Dilatancy strengthening affects the dynamics of rupture.Rupture propagation is governed by the partitioning of stored elastic strain energy: A small part of it maybe released as radiated energy when failure is dynamic, whereas most is dissipated to overcome residualfault friction during sliding (frictional work) and as breakdown work done in excess of the frictional work.Breakdown work Wb is a collective term for energy spent to reduce the intact strength of the fault zonetowards its residual steady-state frictional strength. The work done to overcome the dilatancy-inducedextraneous shear resistance that we observe in our experiments is in excess of the (drained) residual friction,and is thus part of the breakdown work. Breakdown work can be estimated simply as the area under theshear stress versus slip curve in excess of the residual shear stress (Wong , 1982) (Figure 1b). Doing sofor the experimental data provides values for Wb at stable shear failure of 102 kJm−2 (sample WG12),104 kJm−2 (sample WG5), and 122 kJm−2 (sample WG4) at 40 MPa effective pressure, and 143 kJm−2 at80 MPa effective pressure (sample WG8). The minimum breakdown work necessary to form a fault zoneand reach the residual frictional strength of a rock (also known as shear fracture energy) may be measuredfrom a quasi-static or “controlled” shear failure experiment (e.g., Lockner et al., 1991; Aben et al., 2020). Weperformed such experiments on a notched, thermally cracked Westerly granite samples at 40 MPa effectivepressure (Figure 1b), and obtain Wb = 76 kJm−2. For slow shear rupture, we thus see a 34-60% increasein breakdown work attributed to dilatancy strengthening at 40 MPa effective pressure, and so less releasedstrain energy may be used to accelerate rupture and slip – the failure process remains stable.
We expect a further increase in breakdown work as rupture accelerates. At low rupture velocity, wehave shown that the dilatancy-induced pore pressure drop near the rupture tip is partially drained, as themeasured pore pressure drop is less than ∆pundrained. At higher velocity, the fault zone dilates in a shortertime interval and so the pore pressure drop approaches the undrained pore pressure drop. The resistanceto slip thus increases more for a fast rupture than for a slow rupture. The strengthening effect remainstransient and vanishes with pore pressure recharge, but the time delay, or distance along the fault, betweenthe initial stress drop at the rupture tip and the second stress drop from pore pressure recovery is controlledby how fast the rupture propagates and how fast pore pressure diffusion can compensate the undrainedpressure drop near the tip. Thus, the breakdown work increases with rupture velocity 1) because of a largerdilatancy strengthening effect, and 2) because a larger amount of slip is accumulated before the fault zonepore pressure reaches its ambient value.
Weakening processes acting behind the rupture tip at faster fault slip may be impacted by dilatancystrengthening. For example, we expect that the onset of weakening by thermal pressurisation of pore fluids(e.g., Lachenbruch, 1980; Rice, 2006) will be delayed by the dilatancy-induced pore pressure drop at therupture tip compared to a fully drained case, as the thermal pressurisation process needs to overcome thedeficit in pore pressure first. This may increase the temperature in the fault zone due to frictional heating,which is otherwise buffered by thermal pressurisation weakening (Garagash and Rudnicki , 2003).
16

4 Conclusions
Our laboratory experiments demonstrate that dilatant strengthening stabilises rock failure and fault slip.The effect of dilatancy is capped by the zero lower bound for pore pressure, where fluid vaporises. All ourtests where failure was dynamic experienced transient fluid vaporisation. In the presence of pressurisedfluids, rupture occurs in two stages: An initial stage driven by intrinsic weakening and elastic energy releaseform the surrounding medium, and a second stage where post-failure pore pressure reequilibration leadsto prolonged slip and stress drop, purely controlled by pore pressure changes. Our laboratory data arequantitatively explained by a simple spring-slider model, which we use to constrain a key previously unknownquantity, the fault zone storage capacity. The consequences of dilatant stabilisation of rupture are manifold,including an increase in nucleation size, slowing of rupture propagation and increases in breakdown work.Our laboratory techniques opens the way to systematic quantification of hydro-mechanical parameters underin-situ conditions, so that the wealth of theoretical knowledge on diltancy (e.g., Rice and Rudnicki , 1979;Segall and Rice, 1995; Segall et al., 2010; Ciardo and Lecampion, 2019) can be used and testable predictionscan be made.
Acknowledgements
This study was funded by the UK Natural Environmental Research Council grant NE/S000852/1 to N.B.,and the European Research Council under the European Union’s Horizon 2020 research and innovation pro-gramme (project RockDEaF, grant agreement #804685 to N.B.). We thank Neil Hughes for technical assis-tance with development of the pore pressure sensors. All data needed to evaluate the conclusions in the papercan be found at the NGDC repository of the British Geological Survey (https://www.bgs.ac.uk/services/NGDC,dataset ID165485).
References
Aben, F., N. Brantut, T. Mitchell, and E. David (2019), Rupture Energetics in Crustal RockFrom Laboratory-Scale Seismic Tomography, Geophysical Research Letters, 46, 7337–7344, doi:10.1029/2019GL083040.
Aben, F., N. Brantut, and T. Mitchell (2020), Off-fault damage characterisation during and after experi-mental quasi-static and dynamic rupture in crustal rock from laboratory, Journal of Geophysical Research:Solid Earth, doi:10.1029/2020JB019860.
Bouchon, M., V. Durand, D. Marsan, H. Karabulut, and J. Schmittbuhl (2013), The long precursory phaseof most large interplate earthquakes, Nature Geoscience, 6 (4), 299–302, doi:10.1038/ngeo1770.
Brantut, N. (2020), Dilatancy-induced fluid pressure drop during dynamic rupture: Direct experimentalevidence and consequences for earthquake dynamics, Earth and Planetary Science Letters, 538, 116,179,doi:10.1016/j.epsl.2020.116179.
Brantut, N., and F. Aben (2021), Fluid pressure heterogeneity during fluid flow in rocks: Newlaboratory measurement device and method, Geophysical Journal International, 225, 968–983, doi:10.1093/gji/ggab019.
Burgmann, R. (2018), The geophysics, geology and mechanics of slow fault slip, Earth and Planetary ScienceLetters, 495, 112–134, doi:10.1016/j.epsl.2018.04.062.
Byerlee, J. (1967), Frictional Characteristics of Granite under High Confining Pressure, Journal of Geophys-ical Research, 72 (14), 3639–3648.
Carslaw, H., and J. Jaeger (1959), Conduction of heat in solids, 2nd ed., Clarendon Press, Oxford.
17
Ciardo, F., and B. Lecampion (2019), Effect of Dilatancy on the Transition From Aseismic to Seismic SlipDue to Fluid Injection in a Fault, Journal of Geophysical Research: Solid Earth, 124, 3724–3743, doi:10.1029/2018JB016636.
Garagash, D., and J. Rudnicki (2003), Shear heating of a fluid-saturated slip-weakening dilatant fault zone 1.Limiting regimes, Journal of Geophysical Research: Solid Earth, 108 (B2), 1–19, doi:10.1029/2001jb001653.
Gomberg, J., A. Wech, K. Creager, K. Obara, and D. Agnew (2016), Reconsidering earthquake scaling,Geophysical Research Letters, 43 (12), 6243–6251, doi:10.1002/2016GL069967.
Guglielmi, Y., F. Cappa, J.-P. Avouac, P. Henry, and D. Elsworth (2015), Seismicity triggered by fluidinjection-induced aseismic slip, Science, 348 (6240), 1224–1226, doi:10.1126/science.aab0476.
Jaeger, J., N. Cook, and R. Zimmerman (2007), Fundamentals of Rock Mechanics, fourth edi ed., 488 pp.,Blackwell Publishing.
Kennedy, C., and M. Carpenter (2003), Additive Runge–Kutta schemes for convection–diffusion–reactionequations, Applied Numerical Mathematics, 44 (1-2), 139–181.
Lachenbruch, A. (1980), Frictional heating, fluid pressure, and the resistance to fault motion., Journal ofGeophysical Research, 85 (B11), 6097–6112, doi:10.1029/JB085iB11p06097.
Lockner, D. (1998), A generalized law for brittle deformation of Westerly granite, Journal of GeophysicalResearch, 103 (B3), 5107–5123.
Lockner, D., and J. Byerlee (1994), Dilatancy in hydraulically isolated faults and the suppression of insta-bility, Geophysical Research Letters, 21 (22), 2353–2356.
Lockner, D., J. Byerlee, V. Kuksenko, A. Ponomarev, and A. Sidorin (1991), Quasi-static fault growth andshear fracture energy in granite, Nature, 350 (6313), 39–42, doi:10.1038/350039a0.
Marone, C., C. Raleigh, and C. Scholz (1990), Frictional behavior and constitutive modeling of simulatedfault gouge, Journal of Geophysical Research, 95 (B5), 7007–7025, doi:10.1029/JB095iB05p07007.
Martin III, R. (1980), Pore pressure stabilization of failure in westerly granite, Geophysical Research Letters,7 (5), 404–406.
Matsubara, M., K. Obara, and K. Kasahara (2009), High-VP/VS zone accompanying non-volcanictremors and slow-slip events beneath southwestern Japan, Tectonophysics, 472 (1-4), 6–17, doi:10.1016/j.tecto.2008.06.013.
Miller, S. (2020), Aftershocks are fluid-driven and decay rates controlled by permeability dynamics, NatureCommunications, 11 (1), 1–11, doi:10.1038/s41467-020-19590-3.
Nur, A. (1972), Dilatancy, pore fluids, and premonitory variations of ts/tp travel times, Bulletin of theSeismological Society of America, 62 (5), 1217–1222.
Nur, A., and J. Booker (1972), Aftershocks caused by pore fluid flow?, Science, 175 (4024), 885–887, doi:10.1126/science.175.4024.885.
Ohnaka, M. (1992), Earthquake source nucleation: A physical model for short-term precursors, Tectono-physics, 211 (1-4), 149–178, doi:10.1016/0040-1951(92)90057-D.
Peng, Z., and J. Gomberg (2010), An integrated perspective of the continuum between earthquakes andslow-slip phenomena, Nature Geoscience, 3 (September), doi:10.1038/ngeo940.
Proctor, B., D. Lockner, B. Kilgore, T. Mitchell, and N. Beeler (2020), Direct Evidence for Fluid Pressure,Dilatancy, and Compaction Affecting Slip in Isolated Faults, Geophysical Research Letters, 47 (16), doi:10.1029/2019GL086767.
18

Rackauckas, C., and Q. Nie (2017), DifferentialEquations.jl – A Performant and Feature-Rich Ecosystem forSolving Differential Equations in Julia, Journal of Open Research Software, 5 (1), 15, doi:10.5334/jors.151.
Rice, J. (2006), Heating and weakening of faults during earthquake slip, Journal of Geophysical Research:Solid Earth, 111 (5), 1–29, doi:10.1029/2005JB004006.
Rice, J., and J. Rudnicki (1979), Earthquake Precursory Effects Due to Pore Fluid Stabilization of a Weak-ening Fault Zone, Journal of Geophysical Research, 84 (B5), 2177–2193.
Roeloffs, E. (2006), Evidence for aseismic deformation rate changes prior to earthquakes, Annual Review ofEarth and Planetary Sciences, 34, 591–627, doi:10.1146/annurev.earth.34.031405.124947.
Rudnicki, J., and C.-H. Chen (1988), Stabilization of Rapid Frictional Slip on a Weakening Fault by DilatantHardening, Journal of Geophysical Research, 93 (B5), 4745–4757.
Rummel, F., H. Alheid, and C. Frohn (1978), Dilatancy and fracture induced velocity changes in rockand their relation to frictional sliding, Pure and Applied Geophysics PAGEOPH, 116 (4-5), 743–764, doi:10.1007/BF00876536.
Samuelson, J., D. Elsworth, and C. Marone (2009), Shear-induced dilatancy of fluid-saturated faults: Experi-ment and theory, Journal of Geophysical Research: Solid Earth, 114 (12), 1–15, doi:10.1029/2008JB006273.
Scholz, C., L. Sykes, and Y. Aggarwal (1973), Earthquake Prediction: A Physical Basis, Science, 181 (4192),803–810.
Scott, J. S., T. G. Masters, and F. L. Vernon (1994), 3???D velocity structure of the San Jacinto faultzone near Anza, California???I. P waves, Geophysical Journal International, 119 (2), 611–626, doi:10.1111/j.1365-246X.1994.tb00145.x.
Scuderi, M., C. Collettini, C. Viti, E. Tinti, and C. Marone (2017), Evolution of shear fabric in granularfault gouge from stable sliding to stick slip and implications for fault slip mode, Geology, 45 (8), 731–734,doi:10.1130/G39033.1.
Segall, P., and J. Rice (1995), Dilatancy, compaction, and slip instability of a fluid-infiltrated fault, Journalof Geophysical Research, 100 (B11), 22,155–22,171.
Segall, P., A. Rubin, A. Bradley, and J. Rice (2010), Dilatant strengthening as a mechanism for slow slipevents, Journal of Geophysical Research, 115 (B12305), 1–37, doi:10.1029/2010JB007449.
Shreedharan, S., D. Bolton, J. Riviere, and C. Marone (2021), Competition between preslip and deviatoricstress modulates precursors for laboratory earthquakes, Earth and Planetary Science Letters, 553, 116,623,doi:10.1016/j.epsl.2020.116623.
Tarantola, A. (2005), Inverse problem theory and methods for model parameter estimation, 2nd ed., Societyfor Industrial and Applied Mathematics, Philadelphia.
Tembe, S., D. Lockner, and T.-F. Wong (2010), Effect of clay content and mineralogy on frictional slidingbehavior of simulated gouges: Binary and ternary mixtures of quartz, illite, and montmorillonite, Journalof Geophysical Research: Solid Earth, 115 (3), 1–22, doi:10.1029/2009JB006383.
Thomas, A., R. Nadeau, and R. Burgmann (2009), Tremor-tide correlations and near-lithostatic pore pressureon the deep San Andreas fault, Nature, 462 (7276), 1048–1051, doi:10.1038/nature08654.
Tomac, I., and M. Sauter (2018), A review on challenges in the assessment of geomechanical rock performancefor deep geothermal reservoir development, Renewable and Sustainable Energy Reviews, 82 (May 2016),3972–3980, doi:10.1016/j.rser.2017.10.076.
19

Wibberley, C. (2002), Hydraulic diffusivity of fault gouge zones and implications for thermal pressurizationduring seismic slip, Earth, Planets and Space, 54 (11), 1153–1171, doi:10.1186/BF03353317.
Wong, T.-F. (1982), Micromechanics of faulting in westerly granite, International Journal of Rock Mechanicsand Mining Sciences and, 19 (2), 49–64, doi:10.1016/0148-9062(82)91631-X.
Xing, T., W. Zhu, M. French, and B. Belzer (2019), Stabilizing Effect of High Pore Fluid Pressure onSlip Behaviors of Gouge-bearing Faults, Journal of Geophysical Research: Solid Earth, 124, 1–20, doi:10.1029/2019JB018002.
20

Methods
Sample preparation Cylindrical Westerly granite samples of 40 mm diameter and 100 mm height werecored and their surfaces were ground parallel. We cut two 17 mm deep notches into the cylindrical surfaceat a 30◦ angle with the cylinder axis (Figure S1a). The notches were aligned opposite each other so thatthe plane in between was most likely to fail during axial loading. The samples were subjected to thermalmicrocracking to increase the hydraulic diffusivity of the rock, achieved by placing the samples in a tubefurnace that was heated at a rate of 3◦C min−1 to 600◦C. This temperature was maintained for the durationof two hours, followed by cooling over the course of about 12 hours by switching off the furnace. The notcheswere filled with Teflon disks prior to insertion in a rubber jacket (Figure S1a). The Teflon spacers do notcompact or dilate, they deform in a plastic manner, have a low frictional resistance to sliding, and areconsiderably weaker than Westerly granite. The plastic behaviour is evidenced by the shape of the spacersat the end of each experiment. Hence, we assume that the spacers do not impact the mechanical behaviour ofthe fault by pinning the fault plane or inhibiting fault sliding. The jacket was equipped with four miniaturepore pressure sensors: Two on the prospective failure plane, and two at the same height on the intact partof the sample.
Pore pressure sensors The pore pressure sensors consist of a steel 12 mm diameter cap with a thicknessof 2.5 mm (Figure S1b). On the inside edge of the cap, an 0.2 mm high lip creates a small reservoir inwhich pore fluid resides. The cap is placed over a metal stem so that the inside lip rests on the stem’ssurface. The pore fluid within the cap is isolated from the confining medium by an O-ring on the stem.The metal stem is glued into the rubber jacket, and allows pore fluid to pass from the metal cap to thesurface of the sample through an 0.4 mm diameter wide bore in its centre. A diaphragm strain gauge (fourindividual strain gauges arranged in a circular pattern, where two strain gauges measure tangential strainand two measure circumferential strain, wired in a full bridge configuration) is bonded to the outer surfaceof the steel cap. When pressure is applied to the steel cap from the outside (i.e., by confining pressure),the steel cap will elastically deflect inwards. Pore fluid pressure applied from the inside of the steel cap willinduce elastic deflection in the opposite direction. The elastic strain of the steel cap with effective pressure(confining pressure minus pore fluid pressure) is measured as a linear change in resistivity of the diaphragmstrain gauge. The change in resistivity was measured by a Fylde DC Transducer and Amplifier and digitallylogged. The sensor were calibrated prior to the onset of deformation by a number of confining pressure stepsand pore pressure steps. Further details on these sensors and their calibration are found in Brantut andAben (2021).
Experimental setup The shear failure experiments were executed in a conventional oil-medium triaxialloading apparatus at University College London. Axial load was measured by an external load cell correctedfor friction at the piston seal. Axial shortening was measured by a pair of Linear Variable DifferentialTransducers (LVDTs) outside the confining pressure vessel, corrected for the elastic shortening of the piston.Up- and downstream pore pressures were measured by pressure transducers located outside the pressurevessel, and pore pressure was controlled by a single pore pressure intensifier equipped with an LVDT tomeasure the volume change in the intensifier reservoir.
The samples were deformed at nominal effective pressures of 40 MPa or 80 MPa, with a varying combi-nation of confining and imposed pore pressure (Table 1). The imposed pore pressure during deformation waskept constant at both sample ends. Axial load was increased by imposing a constant piston displacementrate of 1 × 10⁻⁴ mm s−1 that corresponds to a strain rate of 1 × 10⁻⁶ s−1. The samples were loaded untilshear failure, after which the piston displacement was arrested to measure the pore volume change ∆Vp inthe sample. After the measurements, we continued to accumulate slip on the newly formed fault; either bystable sliding or by stick-slip events. After each slip increment, we paused deformation to remeasure porevolume changes. Pore volume change was measured from the volume change in the pore pressure intensifier,which we ascribe entirely to the change in pore volume in the sample. After arresting the movement ofthe loading piston, the pore pressure throughout the sample was allowed to recover towards the imposed
21

value. This recovery was achieved when the volume of the pore pressure intensifier reached a stable value.We defined the pore volume change for an interval of fault slip between two such equilibration points. Notethat we expect some minor compaction of fault material when waiting for equilibration of the pore volumebetween slip intervals, so that the actual fault zone porosity during sliding might be slightly higher. Thefirst point in this series is at zero fault slip, defined at the peak differential stress where we did not arrestdeformation, but nonetheless recorded a nearly homogenous pore pressure throughout the sample.
Corrections for normal and shear stress The normal and shear stress on the fault are both a functionof differential stress and confining pressure and where calculated following equation (8) with a known angleψ = 30◦. Two corrections should then be applied to the normal and shear stresses: One for the reduction infault contact area as a function of fault slip, and one for the presence of the Teflon spacers. We did not applythe latter correction to the normal stress record, as we assume that the spacers support normal stresses, butwe did correct the normal stress for the reduction in fault contact area with fault slip using equations A3and A4 from Tembe et al. (2010).
The shear stress was corrected for the presence of the Teflon spacers, which have a lower shear resistancethan the rock. We assume a constant coefficient of friction of the rock-Teflon-rock “sandwich” µteflon, sothat the maximum shear force supported by the spacers is:
Fteflon = σnµteflon × 2Ateflon, (3)
with normal stress σn (already corrected for contact area reduction), and the surface area of the spacerAteflon. The total shear force is given by the uncorrected shear stress times the total fault surface area. Wethen obtain the corrected shear stress as the difference between the total shear force and Fteflon, dividedby the difference between total surface area and 2Ateflon. However, we do not have direct measurementsfor the coefficient of friction µteflon. We therefore estimate µteflon by fitting the corrected peak shear stresswith the peak shear stress measured on samples of Westerly granite without notches at 50 and 100 MPaconfining pressure (unpublished data, Figure S3). Both sets of data were obtained using the same triaxialdeformation apparatus, had the same sample dimensions, and samples were cored from the same blocks ofWesterly granite. We could match the trend of peak shear stress versus normal stress of the unnotchedsamples for a shear stress correction with µteflon = 0.4 (Figure S3). This shear stress correction was appliedto all shear stress data in this study. We neglected the shear stress correction for the reduction in faultcontact area because the contact area that is lost consists of Teflon, resulting in a small correction factorthat is of the same order of magnitude as the uncertainties in estimating the correction for the presence ofthe Teflon spacers.
Calculation of dilation rate We compute dilation rate from the pore volume data, assuming any changein pore volume occurred in the fault zone after the peak stress was surpasses. Similar to shear experiments onsimulated gouge in a direct shear setup, our fault zone experiences i) simple shear, ii) dilation or compactionof the fault zone material, and iii) extrusion of material by fault sliding at the sample edges leading togeometrical thinning (e.g., Figure 6 in Scott et al., 1994). The pore volume change we measure is thusthe volume change by ii) plus the volume change by iii). We note that at the start of our experiment thefault zone has its lowest porosity because the prospective fault plane consists of intact granite. Hence, inthe knowledge that Teflon does not dilate or compact (i.e., the volume of the spacers remains constant),the Teflon spacers do not prop open the fault zone, nor do they contribute to changes in pore volume bycontribution ii). However, as the Teflon spacers are positioned at the fault extremities, they will extrudesomewhat, leading to geometrical thinning and reduction of fault zone volume.
We express dilation as the rate of increase in fault zone width w with fault slip δ. The volume of the faultzone is approximated as an elliptic cylinder with fault zone width w, a long axis radius a = 40 mm and ashort axis radius b = 20 mm. The axes remains constant during deformation so that all pore volume changethat has been measured is accommodated by a change in w. This allows us to calculate dw = ∆Vp/πabfor the slip interval in which intact failure occurred, and for the slip intervals after shear failure. Faultslip was calculated from the 30◦ angle between the fault and the direction of axial load and the axial strain
22

measurements corrected by the intact Young’s modulus of the sample, thereby assuming that all deformationafter the peak stress was accommodated by fault slip. The elliptic cylinder, which we assume hosts all porevolume change, partly consists of volume-neutral Teflon spacers, and so projecting the pore volume changein an elliptic cylinder leads to an underestimation of the fault zone porosity change. This underestimate isoffset by extrusion of the Teflon spacers from the fault zone and by some pore volume change due to damageoutside the main failure zone observed on the post-mortem samples.
Here, dilation rate has been presented as a function of fault slip δ, which is the desired representation ofthe dilation rate for slip-weakening or cohesion-weakening models that include dilatancy strengthening (e.g.,Rudnicki and Chen, 1988). Dilation has also been expressed as a function of an increase in imposed slip ratefor frictional sliding experiments on simulated gouge in the context of rate and state friction (Marone et al.,1990; Samuelson et al., 2009). In these studies, the overall trend of gouge compaction from geometric thinningwas removed from the gouge thickness data to reveal small changes related to steps in slip rate. The increasein fault zone width w was directly measured and normalised by the initial width of the gouge layer. Wecannot compare our data with these studies because: i) Slip rate steps were not performed as we arrested slipin between slip intervals to measure pore volume changes. ii) Our setup cannot (yet) continuously measurethe instantaneous pore volume increase from monitoring the fault zone thickness directly. iii) We do notknow the initial thickness of the fault zone required to normalise dilatancy as defined by Marone et al. (1990);Samuelson et al. (2009).
Hydraulic characterisation of intact rock Permeability κ and storage capacity S of the intact rockwere obtained prior to deformation by a transient pore pressure front method akin to the pulse-decay method.A 5 MPa pore pressure step was produced at a rate of 5 MPa s−1 in the upstream pore pressure intensifier.The downstream end of the sample was undrained, with a known downstream storage capacity. The porepressure records and the upstream pore volume change for the pore pressure pulse may be expressed bya closed-form solution with two unknown parameters that are commensurate to permeability and storagecapacity. The solution can be used for any location along the sample height between the upstream anddownstream reservoirs, assuming homogenous hydraulic properties in the sample. This allows us to invertthe pore pressure and pore pressure intensifier volume records to obtain the best-fitting pair of values forthe permeability and storage capacity, with the intermediate pore pressure records measured by the effectivepressure transducers providing some additional constraints to the solution. For more details on the porepressure front method, see Brantut and Aben (2021). The results of the hydraulic characterisation of thesamples are presented in Figure S4.
Spring-slider model: Setup We consider the sample as a rigid body split by a shear fault (Figure 7a).We impose a fault slip rate v∞ through an elastic medium with stiffness k in the direction of fault slip δ.For quasistatic fault motion, the imposed load is equal to the shear resistance τ of the fault:
k(v∞t− δ)− τ − χv = 0, (4)
where v is the slip rate, and χ is a viscous damping parameter preventing velocity to become unboundedduring instabilities. Typically χv remains negligible compared to other terms unless v becomes extremelylarge (e.g., Segall and Rice, 1995). We then follow Rudnicki and Chen (1988) and use a cohesive typeconstitutive law for the strength of the fault, with a residual fault friction that depends on the pore pressure(as seen in our data, Figure 6):
τ = τp(1− f(δ/δc))︸ ︷︷ ︸cohesion
+µ(σn − p)︸ ︷︷ ︸friction
, (5)
where τp is the drop in shear stress from fracture strength to frictional strength for a constant normal stress(Figure S2). The function f describes the loss of cohesion with slip, with f(0) = 0, f(1) = 1. δc is acharacteristic slip-weakening distance (Figure S2a). Here, we use f = −2(δ/δc)3 + 3(δ/δc)2 as suggested byRudnicki and Chen (1988, equation 3) (Figure S2a). The shape of this cohesion-weakening function matcheswell with the overall shape of the quasi-static controlled rupture (Figure 1a).
23

To simulate changes in p, we first consider that the fault zone itself is of a uniform width w and hasa uniform pore pressure, so that only fault-normal fluid flow may occur in spirit with the 1D spring-slidersystem. The fault zone is considered a “reservoir” with effective fault zone storage Sfw. The fault zone isin hydraulic communication with the intact host rock, so that the pore pressure is governed by a diffusionequation:
∂p
∂t=
κ
ηS
∂2p
∂y2, (6)
where κ is host rock permeability, S is the storage capacity of the host rock, and η is the fluid viscosity.The coordinate y is the fault-normal spatial dimension, with y = 0 being the upstream end of the sample,and y = L the fault position (i.e., the half-length of the sample) (Figure 7a). The experimental boundaryconditions impose that p(y = 0, t) = p0. Note that the system is symmetric here so we only consider onehalf of the sample. A mass balance leads to the following boundary condition at y = L:
∂p
∂t+
2κ
Sfwη
∂p
∂y= −∆φ
Sf(y = L), (7)
where ∆φ is the rate of inelastic porosity change inside the fault zone – describing dilation as a functionof slip. Recall that from the experimental data, we expressed dilation as a linear increase in fault zonewidth with slip dw/dδ. We then obtain the rate of porosity change as ∆φ = (dw/dδ)/w × v. For undrainedconditions, equation (7) reverts back to equation (1) for the undrained isothermal pore pressure drop. Furtherdetails to account for triaxial conditions, normalisation of variables, and numerical implementation to solvethe problem are presented in the next paragraph.
Spring-slider model: Application to triaxial experiments The spring-slider model as defined byequations (4) and (5) are for a constant normal stress and a spring load parallel to the sliding direction.Here, the experiments were conducted under triaxial conditions, so that the normal and shear stress are botha function of the differential stress Q and confining pressure Pc:
τ = (Q/2) sin(2ψ), (8)
σn = Pc + (Q/2)(1− cos(2ψ)
), (9)
where ψ is the angle between loading direction and the fault zone. From this, we obtain
τ = τ0(1− f(δ/δc)) + µ(Pc − p)/(
1− µ1− cos(2ψ)
sin(2ψ)
), (10)
with
τ0 = τp/
(1− µ1− cos(2ψ)
sin(2ψ)
). (11)
We understand τ0 to be the shear stress drop measured in triaxial failure experiments (Figure S2b). Theloading piston and intact parts of the rock sample act as the spring load. Differential stress decreases fromelastic relaxation of the loading piston by ∆Q = −k′ε, with k′ being the machine stiffness and ε the axialelastic lengthening of the piston. As Q decreases, the rock sample increases in length by elastic rebound asεk′/E × 2L, where L is the half length of the sample and E is the Young’s modulus of the sample. Becausethe movement of the top of the piston was arrested during shear failure, ε and the relaxation of the rocksample are both accommodated by slip along the fault δ so that ε = δ cos(ψ)/(1 + 2k′E/L). From this andequation 8, it follows that the fault parallel stiffness k is
k =k′ sin(2ψ) cos(ψ)
2(1 + 2k′L/E). (12)
24

Spring-slider model: Numerical solution for partially drained case We nondimensionalise ourgoverning equations prior to numerical implementation for partially drained conditions. We use the followingscales:
t← t/tdiff , (13)
y ← y/L, (14)
p← p/∆pundrained, (15)
τ ← τ/τ0 (16)
δ ← δ/δc, (17)
v ← v/(δc/tdiff), (18)
where
tdiff =L2ηS
κ(19)
is the diffusion timescale across the sample, the undrained isothermal pore pressure drop ∆pundrained is givenby equation (1) (Figure S2b) (with dw/dδ normalised w.r.t. δc already), and τ0 is given by equation (11).The static equilibrium (equation (4)) is thus rewritten as
K(v∞t− δ)− (1− f(δ))− τD(λ− p)−Xv = 0, (20)
where
K = kδc/τ0, (21)
τD = µ∆pundrained/τp, (22)
λ = Pc/∆pundrained, (23)
X = χδcκ/(L2τ0ηS). (24)
Note that τD is to be understood as the cohesion loss over the undrained pore pressure change times thefriction coefficient – i.e., the undrained dilatancy-induced increase in shear resistance (Figure S2b). Thegoverning equation for pore pressure becomes
∂p
∂t=∂2p
∂y2, (25)
with boundary conditions
p(0) = p0/∆pundrained, (26)
∂p
∂t+ `
∂p
∂y= −v (y = L), (27)
where
` =2SL
Sfw. (28)
The equation we are solving numerically is simply:
dv
dt= [K(v∞ − v)− f ′[δ]v + τDp] /χ, (29)
dδ
dt= v, (30)
where we compute the pressure rate in the fault by solving the full diffusion problem (Equation 25) usingfinite differences in space and the method of lines, so we can use very efficient stiff ODE solvers for the task.
25

Relabelling the space coordinate y = 1−y, so that the fault is at position y = 0 and sample edge is at y = 1,the diffusion problem reads
∂p
∂t=∂2p
∂y2, (31)
p(y = 1, t) = 1, (32)
∂p
∂t
∣∣∣y=0,t
− `∂p∂y
∣∣∣y=0,t
= −v. (33)
We discretise space into N + 1 nodes at positions y0, . . . , yN uniformly spaced with spacing ∆y, and usecentered finite differences to evaluate spatial derivatives:
dpndt
=pn+1 − 2pn + pn−1
∆y2, (34)
valid for n = 0, . . . , N − 1, and boundary conditions read
dpNdt
= 0 (35)
anddp0
dt− `p1 − p−1
2∆y= h′[δ]v/δ0, (36)
where a ghost node at n = −1 was introduced. Combining (36) into (34) at n = 0, we find the time derivativeof pore pressure in the fault as
dp0
dt=
[p1 − p0
∆y+h′[δ]v/δ0
`
]/(∆y/2 + 1/`). (37)
Equations (29), (30), (34) for n = 1, . . . , N − 1, (35) and (37) form a system of N + 3 ODEs in timefor unknowns {v, δ, p0, . . . , pN}. We solve this system using a 5th order, A-L stable, stiffly-accurate, explicitsingly diagonal implicit Runge-Kutta method with splitting (see Kennedy and Carpenter (2003), methodimplemented as KenCarp5() in the DifferentialEquations.jl package, see Rackauckas and Nie (2017)).
All physical parameters, with the exception of the storage Sfw and characteristic cohesion-weakeningdistance δc, have been measured or imposed during the shear failure experiments: Intact hydraulic parametersκ and S were measured prior to deformation (Figure S1), the shear stress drop and coefficient of frictionwere obtained from mechanical data, and Pc and p0 were imposed (Table 1).
We assume that dilation is linear with slip, and we set the dilation rate to zero for fault slip beyondthe cohesion weakening distance δc, thereby assuming that dilation is largest during the formation of thefault and neglecting dilation during fluid recharge driven slip. This is supported by the order of magnitudedifference between dilation rates measured for failure and for slip (Figure 3). To ensure that the total increasein pore volume after shear failure in the simulations is equal to the measured increase in pore volume, wenormalised the dilation rate dw (i.e., increase in fault zone width) by the input value used for δc. Hence,the dilation rates for shear failure given in Table 1 are a lower bound. Note that more elaborate functionsto describe dilation with slip have been proposed (e.g., Rudnicki and Chen, 1988; Segall and Rice, 1995),based on dilation rates measured in gouge. However, for shear failure of intact rock, dilation was onlymeasured afterwards, so that a linear increase during failure and subsequent slip is the most straigthforwardapproximation.
We use the spring-slider model to simulate the slip rate and pore pressure during shear failure for a rangeof values for δc and Sfw. We then calculate the misfit between the observed maximum slip rate and minimumpore pressure during shear failure (Table 1) and the simulated maximum slip rate and minimum pore pressure,using a least absolute criterion and assuming a Laplacian probability density function (Tarantola, 2005). Weuse uncertainties of 0.1 mm s−1 and 5 MPa for the slip rate and pore pressure, respectively. From theresulting probability density, we pick the best fitting pair of values for Sfw and δc (Figure 7d, Table 1). Forthe simulation results of the other stable ruptures, see Figure S4.
26

Pore pressure recovery versus slip for triaxial experiments: For the relation between pore pressurerecovery and slip after the largest drop in pore pressure (Figure 6) we consider the fault strength is givenas τ = µ(σn − p), and is in balance with the imposed load −kδ. Using the triaxial relations for shear andnormal stress and machine stiffness (equations (8) and (12)), we obtain:
p = δk
(1
µ− (1− cos(2ψ))
sin(2ψ)
). (38)
With E ≈ 40 GPa, measured during unloading of the sample at the end of the experiment, L = 5 cm,ψ = 30◦, k′ = 382 GPa m−1, and µ = 0.6, we observe that this relation follows the slip versus pore pressuredata from the stable failure experiments, where deviations for samples WG4 and WG5 are explained byvariations in µ, which are near to 0.7 (Figure 6).
27

jacket
sample
prospectivefailureplane
Peff
transducer
(a)
Peff
transducer
(b)
Figure S1: (a): Schematic of the sample setup, with two effective pressure transducers on the prospectivefailure plane, and two transducers on the hanging block of the sample. (b): Photo of an effective pressuretransducer.
0slip
0
shea
rstr
ess,
poro
sity
chan
ge
δc
τpeak
τr
τp ∆φ=dw/dδw
δ
(a)
0effective pressure
shea
rstr
ess
τobsr
τr
τpeak
frictional stre
ngth
fracture strength
∆pundrained
τpτ0
(b)
Figure S2: (a): Sketch of the cohesion shear stress drop τp from peak stress τpeak down to residual frictionalstrength τr (black curve) for a constant normal stress and a linear increase in porosity (gray curve) asfunctions of slip. (b): The components of the resistance to sliding on the fault depicted in a normal stressversus shear stress sketch. One component is the cohesion shear stress drop τp for a constant normal stress.The normal stress is not constant for triaxial deformation experiments, so that the observed shear stressdrop τ0 is larger than τp. The other component is caused by a localised pore pressure reduction, here weshow an example of how the undrained isothermal pore pressure drop ∆pundrained increases the resistance tofrictional sliding on the fault.
28

50 100 150 200 250 300normal stress [MPa]
150
200
250
300
350
shea
r stre
ss [M
Pa]
intact unnotchedWesterly (UCL)
notched Westerlyuncorrected
notched Westerly correctedµteflon = 0.4
Figure S3: Peak stresses measured on intact Westerly granite with notches (round filled marks, this study)and on intact Westerly granite samples without notches (triangular markers, unpublished data). The un-notched samples were tested at 50 and 100 MPa confining pressure. Both sets of experiments where performedin the same triaxial loading apparatus, and samples were cored from the same granite blocks. The peak shearstresses of the notched samples are matched with those of the intact samples for a shear stress correctionwith a rock-Teflon-rock friction coefficient of 0.4.
29

0 50 100 150effective pressure [MPa]
10 19
10 18
10 17
perm
eabi
lity
[m2 ]
(a)
0 50 100 150effective pressure [MPa]
10 11
10 10
10 9
stor
age
capa
city
[Pa−
1 ]
(b)
Figure S4: Permeability κ (a) and storage capacity S (b) as a function of effective pressure, measuredon undeformed thermally cracked Westerly granite using the transient pore pressure step method. Fittedexponential functions describing effective pressure dependence are shown as grey curves. Dashed verticallines at experimental imposed effective pressures of 40 and 80 MPa. Left-pointing triangle = WG3, diamond= WG4, circle = WG5, square = WG7, inverted triangle = WG8, hexagon = WG10, right-pointing triangle= WG12. See Table 1 for sample reference.
30

0
100
200
shea
rstr
ess
[MPa
]
(a): stable failurePc = 70, p0 = 30MPa
0
25
50
75
pore
pres
sure
[MPa
]
0 10
0
25off-fault
on-fault
0
1
2
slip
[mm
]
0
100
200 (b): dynamic failurePc = 100, p0 = 60MPa
0
25
50
75
0 10
40
60
0
1
2
0
100
200
shea
rstr
ess
[MPa
]
(c): stable failurePc = 110, p0 = 70MPa
0
25
50
75
pore
pres
sure
[MPa
]
0 1040
60
100 0 100 200time since main failure [s]
0
1
2
slip
[mm
]
0
100
200 (d): dynamic failurePc = 120, p0 = 40MPa
0
25
50
75 0 10
0
50
100 0 100 200time since main failure [s]
0
1
2
Figure S5: Pore pressure records during (a) dynamic failure (sample WG2, Pc = 70 MPa, p0 = 30 MPa), (b)and (c) stable failure (sample WG5, Pc = 100 MPa, p0 = 60 MPa, and WG12, Pc = 110 MPa, p0 = 70 MPa),and (d) dynamic failure (sample WG7, Pc = 160 MPa, p0 = 80 MPa). See Table 1 for sample reference.
31

0 50 100Peff
10 2
10 1
100
dw/dδ[−]
Rummel et al. (1978)
this study
Figure S6: Dilation rate with slip for intact samples versus effective pressure measured in this study(black symbols) and extracted from shear failure data of intact Fichtelgebirge granite from Rummel et al.(1978). The effective pressure dependency of dw/dδ is estimated by an exponential relation dw/dδ =A× exp(−0.018Peff), where the constant A = 0.27 for thermally cracked Westerly granite (black curve) andA = 0.6 for Fichtelgebirge granite (gray curve). Upper and lower bound estimates for Westerly granite (thinblack curves) are A = 0.35 and A = 0.16, respectively. Left-pointing triangle = WG3, diamond = WG4,circle = WG5, square = WG7, inverted triangle = WG8, hexagon = WG10, right-pointing triangle = WG12.
32

0.3 1 10δc [mm]
10−12
10−11S fw[P
a−1 m]
(a) sample WG5
5 0 5t [s]
0.0
0.2
0.4
0.6
v[m
m/s]
observed
simulated
(b)
100 0 100 200t [s]
20
40
60
80
p[M
Pa]
(c)
0.3 1 10δc [mm]
10 12
S fw[P
a−1 m]
(d) sample WG8
5 0 5t [s]
0.0
0.2
0.4
0.6
v[m
m/s]
observed
simulated
(e)
200 0 200t [s]
20
40
60
80
p[M
Pa]
(f)
0.3 1 10δc [mm]
10 12
10 11
S fw[P
a−1 m]
(g) sample WG12
5 0 5t [s]
0.0
0.1
0.2
0.3
v[m
m/s]
observed
simulated
(h)
100 0 100 200t [s]
20
40
60
80
p[M
Pa]
(i)
Figure S7: Spring-slider simulation results for stable shear failure experiment WG5 (top), WG8 (centre), andWG12 (bottom). (a): Probability density resulting from exploring (δc, Sfw)-space, computed using a leastabsolute value criterion for the misfit between observed and simulated data. Best fitting simulation indicatedby black marker. (b): Observed (gray curve) and simulated (black) slip rate over time. (c): Observed (graycurve) and simulated (black) fault zone pore pressure. Inset: Magnified pore pressure record around thestable failure event.
33

0
100
undr
aine
dpo
repr
essu
redr
op[M
Pa]
small dil.
large dil.
0 100 200 300 400effective pressure [MPa]
0
50
100
150
criti
cals
tiffn
ess
[GPa
m−1
]
undr
aine
d
drained
machinestiffness
stable
dynamic
(b)
Figure S8: (a) Undrained isothermal pore pressure drop ∆pundrained and (b) critical stiffness kcr versuseffective pressure. Solid black line is based on the average of the estimates for Sfw, the large and smalldilation curves (dashed) are based on minimum and maximum estimates for Sfw and dw/dδ (Table 1).Drained critical stiffness in gray. Machine stiffness is given by equation 12.
34