Embed Size (px)
Citation preview

© 2018 Vizient, Inc. and JD Healthcare. All rights reserved.
Effect of the Ministry Alignment Agreement between Dignity Health and Catholic Health Initiatives on the Availability and Accessibility of Healthcare Services to the Communities Served by Dignity Health’s Hospitals Located in Los Angeles County
Prepared for the Office of the California Attorney General
August 15, 2018

2
Table of Contents
Introduction & Purpose .................................................................................................................. 5
Introduction ................................................................................................................................ 5
Purpose ....................................................................................................................................... 7
Background & Description of the Transaction ................................................................................ 8
Background ................................................................................................................................. 8
Strategic Rationale, Transaction Process & Timing .................................................................... 8
Summary of the Ministry Alignment Agreement ..................................................................... 11
System Corporation Post the Effective Date of the Ministry Alignment Agreement ............... 12
System Corporation Post Debt Consolidation (Within 36 Months) ......................................... 13
Structures and Responsibilities ................................................................................................. 14
Dignity Health Commitments ................................................................................................... 19
Use of Net Sale Proceeds .......................................................................................................... 22
Profile of Catholic Health Initiatives ............................................................................................. 23
Overview ................................................................................................................................... 23
Key Statistics ............................................................................................................................. 24
Payer Mix .................................................................................................................................. 24
Financial Profile ......................................................................................................................... 25
Profile of Dignity Health ................................................................................................................ 26
Payer Mix .................................................................................................................................. 27
Financial Profile ......................................................................................................................... 28
Dignity Health’s California Hospitals Overview ........................................................................ 29
Analysis of Dignity Health’s Los Angeles County Hospital Market Share ..................................... 30
Profile of California Hospital Medical Center ............................................................................... 32
Overview ................................................................................................................................... 32
Key Statistics ............................................................................................................................. 33
Patient Utilization Trends ......................................................................................................... 34
Financial Profile ......................................................................................................................... 35
Cost of Hospital Services ........................................................................................................... 36
Charity Care ............................................................................................................................... 36
Community Benefit Services ..................................................................................................... 38
Reproductive Health ................................................................................................................. 41
Analysis of California Hospital Medical Center ............................................................................. 43
Service Area Definition ............................................................................................................. 43
Service Area Map ...................................................................................................................... 44
Hospital Market Share .............................................................................................................. 45
Market Share by Payer Type ..................................................................................................... 46
Market Share by Service Line .................................................................................................... 47
Market Share by ZIP Code ......................................................................................................... 48
Profile of Glendale Memorial Hospital and Health Center ........................................................... 49

3
Overview ................................................................................................................................... 49
Key Statistics ............................................................................................................................. 50
Patient Utilization Trends ......................................................................................................... 51
Financial Profile ......................................................................................................................... 52
Cost of Hospital Services ........................................................................................................... 53
Charity Care ............................................................................................................................... 53
Community Benefit Services ..................................................................................................... 55
Reproductive Health ................................................................................................................. 57
Analysis of Glendale Memorial Hospital and Health Center ........................................................ 58
Service Area Definition ............................................................................................................. 58
Service Area Map ...................................................................................................................... 59
Hospital Market Share .............................................................................................................. 60
Market Share by Payer Type ..................................................................................................... 61
Market Share by Service Line .................................................................................................... 62
Market Share by ZIP Code ......................................................................................................... 63
Profile of St. Mary Medical Center ............................................................................................... 64
Overview ................................................................................................................................... 64
Key Statistics ............................................................................................................................. 65
Patient Utilization Trends ......................................................................................................... 66
Financial Profile ......................................................................................................................... 67
Cost of Hospital Services ........................................................................................................... 68
Charity Care ............................................................................................................................... 68
Community Benefit Services ..................................................................................................... 70
Reproductive Health ................................................................................................................. 73
Analysis of St. Mary Medical Center ............................................................................................. 74
Service Area Definition ............................................................................................................. 74
Service Area Map ...................................................................................................................... 75
Hospital Market Share .............................................................................................................. 76
Market Share by Payer Type ..................................................................................................... 77
Market Share by Service Line .................................................................................................... 78
Market Share by ZIP Code ......................................................................................................... 79
Profile of Northridge Hospital Medical Center ............................................................................. 80
Overview ................................................................................................................................... 80
Key Statistics ............................................................................................................................. 81
Patient Utilization Trends ......................................................................................................... 82
Financial Profile ......................................................................................................................... 83
Cost of Hospital Services ........................................................................................................... 84
Charity Care ............................................................................................................................... 84
Community Benefit Services ..................................................................................................... 86
Reproductive Health ................................................................................................................. 90
Analysis of Northridge Hospital Medical Center .......................................................................... 91

4
Service Area Definition ............................................................................................................. 91
Service Area Map ...................................................................................................................... 92
Hospital Market Share .............................................................................................................. 93
Market Share by Payer Type ..................................................................................................... 94
Market Share by Service Line .................................................................................................... 95
Market Share by ZIP Code ......................................................................................................... 96
Assessment of Potential Issues Associated with the Availability or Accessibility of Healthcare Services ......................................................................................................................................... 98
Continuation as General Acute Care Hospitals ......................................................................... 98
Emergency Services ................................................................................................................ 101
Reproductive Health Services ................................................................................................. 103
Effects on the Level & Type of Charity Care Historically Provided ......................................... 105
Effects on Services to Medi-Cal, Medicare & Other Classes of Patients ................................ 105
Effects on Community Benefit Programs................................................................................ 107
Effects on Hospital Licensed Services ..................................................................................... 108
Effects on Programs and Services ........................................................................................... 110
Effects on Staffing & Employee Rights .................................................................................... 112
Effects on Medical Staff .......................................................................................................... 113
Effects on City and County Contracts ..................................................................................... 113
Alternatives ............................................................................................................................. 113
Conclusions and Recommendations ........................................................................................... 114
Appendix ..................................................................................................................................... 128
California Hospital Medical Center License ............................................................................ 128
Glendale Memorial Hospital and Health Center License ........................................................ 129
St. Mary Medical Center License ............................................................................................ 130
Northridge Hospital Medical Center License .......................................................................... 132

5
Introduction & Purpose JD Healthcare, Inc. and Vizient, Inc. were retained by the Office of the California Attorney General to prepare this healthcare impact statement to assess the potential impact of the proposed Ministry Alignment Agreement by and between Dignity Health, a California nonprofit public benefit corporation, and Catholic Health Initiatives, a Colorado nonprofit corporation (CHI), on the availability and accessibility of healthcare services to the communities served in Los Angeles County. Dignity Health owns and operates 31 general acute care hospitals in California, including four in Los Angeles County: California Hospital Medical Center, located in Los Angeles, Glendale Memorial Hospital and Health Center, located in Glendale, St. Mary Medical Center, located in Long Beach and Northridge Hospital Medical Center, located in Northridge. CHI is the parent organization of several nonprofit corporations that own and/or operate over 100 hospitals in 18 states. CHI neither owns, nor controls any general acute care hospitals or other facilities in California. CHI is a Catholic organization. Introduction Catholic Health Care Federation (CHCF) is a public juridic person1 within the meaning of Canon Law and the canonical sponsor2 of CHI. While Dignity Health is not a Catholic organization, its Catholic hospitals are sponsored by six congregations of Women Religious3. Dignity Health owns and operates 31 general acute care hospitals in California4. Nineteen of the 31 California hospitals are Catholic and 12 are non-Catholic hospitals (also referred to as community hospitals). Four of the 12 non-Catholic general acute care hospitals are owned by separately incorporated California nonprofit public benefit corporations that have Dignity Health as their sole corporate member5. Dignity Health also owns and operates five hospitals in Arizona and three hospitals in Nevada.
1 A public juridic person is a group or persons approved by the Roman Catholic Church to oversee and ensure that the mission of its healthcare organization is carried out according to Catholic principles. 2 The Catholic Health Association has defined canonical sponsorship of a healthcare ministry as a formal relationship between an authorized Catholic organization and a legally formed system, hospital, clinic, nursing home (or other institution) entered into for the sake of promoting and sustaining Christ's healing ministry to people in need. 3 A group of Roman Catholic women who dedicate their lives to the Gospel of Jesus Christ and take vows of poverty, chastity, obedience and service. The six congregations are: Sisters of Mercy of the Americas, Sister of Charity of the Incarnate Word, Dominican Sisters of San Rafael, Sisters of St. Francis of Penance and Christian Charity, Adrian Dominican Sisters and the Congregation of Sisters of St. Dominic of St. Catherine of Siena. Dignity Health’s sponsorship council is comprised of one sister from each congregation. 4 The California Department of Public Health has issued twenty-eight general acute care hospital licenses with respect to these 31 facilities. Marian Regional Medical Center, Arroyo Grande campus and Marian Regional Medical Center West operates under a consolidated license issued to Marian Regional Medical Center, and Mercy Southwest Hospital operates under a consolidated license issued to Mercy Hospital (in Bakersfield). 5 The four facilities are Bakersfield Memorial Hospital, Community Hospital of San Bernardino, Saint Francis Memorial Hospital, and Sierra Nevada Memorial-Miners Hospital.

6
The following summary chart is a list of Dignity Health owned and operated hospitals6.
In addition to the hospitals listed above, Dignity Health has a management agreement with Mark Twain Medical Center Corporation, a California nonprofit public benefit corporation, to operate Mark Twain Medical Center, a 25-bed critical access hospital7 located at 768 Mountain Ranch Road, San Andreas, California. Mark Twain Medical Center is leased by Mark Twain Medical Center Corporation from the Mark Twain Healthcare District. The current lease
6 St. Joseph Medical Center of Stockton and St. Joseph Behavioral Health Center are owned by Port City Operating Company, LLC, a joint venture between Kaiser Foundation Hospitals and Dignity Health. Dignity Health owns 80% of Port City Operating Company, LLC, and Kaiser Foundation Hospitals owns the remaining 20%. 7 A critical access hospital is a designation given to eligible rural hospitals, or those grandfathered as rural, by the Centers for Medicare and Medicaid Services. Conditions to obtain a Critical Access Hospital designation include having less than or equal to 25 acute care beds, being located more than 35 miles from another hospital, maintaining an annual average length of stay of 96 hours or less for acute care patients, and providing 24-hour emergency care services.
Dignity Health
Arizona Hospitals
California Hospitals
Dignity Health Owned Hospitals
Subsidiary Hospitals
Nevada Hospitals
*Denotes non-Catholic hospitals. All other hospitals are ministries of the Catholic Church 1*Arizona General Hospital is owned by a separate limited liability company of which Dignity Health is a sole corporate member
St. Rose Dominican, Rose de Lima Campus
St. Rose Dominican, San Martin Campus
St. Rose Dominican, Siena Campus
Arizona General Hospital1*
Chandler Regional Medical Center*
Mercy Gilbert Medical Center
St. Joseph’s Hospital and Medical Center
St. Joseph’s Westgate Medical Center
Dominican Hospital
Marian Regional Medical Center
Marian Regional Medical Center, Arroyo Grande Campus*
Marian Regional Medical Center West
Mercy General Hospital
Mercy Hospital
Mercy Hospital of Folsom
Mercy Medical Center Merced
Mercy Medical Center Mt. Shasta
Mercy Medical Center Redding
Mercy San Juan Medical Center
Mercy Southwest Hospital
St. Bernardine Medical Center
St. Elizabeth Community Medical Center
St. John’s Pleasant Valley Medical Center
St. John’s Regional Medical Center
St. Joseph’s Medical Center of Stockton
St. Joseph’s Behavioral Health Center
St. Mary Medical Center
St. Mary’s Medical Center
California Hospital Medical Center*
French Hospital Medical Center*
Glendale Memorial Hospital*
Methodist Hospital of Sacramento*
Northridge Hospital Medical Center*
Sequoia Hospital*
Woodland Memorial Hospital*
Bakersfield Memorial Hospital*
Community Hospital of San Bernardino*
Saint Francis Memorial Hospital*
Sierra Nevada Memorial- Miners Hospital*

7
agreement with the Mark Twain Healthcare District expires on December 31, 2019. On June 6, 2018, the voters in the Healthcare District approved Ballot Measure A to enter into a new 30-year lease for Mark Twain Medical Center. Purpose This healthcare impact statement describes the potential effects that the proposed transaction may have on the availability and accessibility of healthcare services to the residents served by California Hospital Medical Center, Glendale Memorial Hospital and Health Center, St. Mary Medical Center and Northridge Hospital Medical Center. In preparation of this report, JD Healthcare, Inc. and Vizient, Inc. performed the following:
● A review of the written notice delivered to the California Attorney General on March 29, 2018 and supplemental information subsequently provided by Dignity Health;
● A review of press releases and articles related to this and other hospital transactions;
● Interviews with representatives of Dignity Health;
● An analysis of financial, utilization, and service information provided by Dignity Health
and the California Office of Statewide Health Planning and Development (OSHPD); and
● An analysis of publicly available data related to service areas for California Hospital Medical Center, Glendale Memorial Hospital and Health Center, St. Mary Medical Center and Northridge Hospital Medical Center including hospital utilization rates and trends and hospital inpatient market share.

8
Background & Description of the Transaction Background Dignity Health was formerly known as Catholic Healthcare West. Catholic Healthcare West was founded in 1986 when the Sisters of Mercy Burlingame Regional Community and the Sisters of Mercy Auburn Regional Community merged their healthcare ministries. In 2009, the United States Conference of Catholic Bishops changed the Ethical and Religious Directives8 (ERDs) regarding partnerships between community and Catholic organizations. As a result of the changes to the ERDs, Catholic Healthcare West went through a process, between 2009 and 2011, to review its governance structure and its relationship to its owned and controlled non-Catholic community hospitals. In 2012, as a result of this review and based on discussions with its canonical sponsors, Catholic Healthcare West reorganized its governance structure and changed its name to Dignity Health. Dignity Health was no longer recognized as a Catholic organization, although many of its hospitals are Catholic. The restructure was designed to satisfy the requirements of the United States Conference of Catholic Bishops regarding partnerships with non-Catholic community hospitals while allowing Dignity Health to maintain its Catholic and non-Catholic hospitals under a single organization. Following the 2012 reorganization, the six congregations of Women Religious began the exploration of alternatives models for sponsorship of Dignity Health’s Catholic hospitals, including the possibility for Dignity Health being recognized as a Catholic ministry. To facilitate this process, the Sponsors engaged a canon lawyer9 to help explore all of the options, such as the creation of a new public juridic person or a merger with a Catholic healthcare system sponsored by an existing public juridic person. As further described below, the alignment discussions between Dignity Health and CHI revealed many significant potential strategic benefits for both organizations, including CHI’s current sponsorship by a public juridic person known as Catholic Health Care Federation. Strategic Rationale, Transaction Process & Timing The leadership of Dignity Health and CHI had numerous partnership discussions over the previous ten years. In 2013, they explored potential affiliations between the two health systems. Dignity Health and CHI identified several opportunities to collaborate on programs and services, including telehealth, micro-hospitals, and precision medicine10. In September 2016, they formed a joint-venture named the Precision Medicine Alliance, LLC to create a large precision medicine program.
8 The Ethical and Religious Directives for Catholic Healthcare Services is a national code that guides Catholic healthcare providers on conformance with Christian theology. 9 A canon lawyer is a lawyer who is knowledgeable of the ordinances and regulations made by ecclesiastical authority. 10 Precision medicine is an emerging approach for disease treatment and prevention that uses extensive databases and takes into account individual variability in genes, environment, and lifestyle for each person.

9
In the spring of 2016, the executive leadership of Dignity Health and CHI began jointly exploring the potential for an alignment of their ministries. In March 2016, an outside advisor prepared a white paper11 that analyzed the potential for an affiliation between Dignity Health and CHI that was shared with the boards of directors of Dignity Health and CHI in June 2016. The boards of directors of Dignity Health and CHI concluded that they:
● Share a vision of transformation for themselves and for the industry;
● Have highly complementary organizational missions, visions, and values;
● Serve complementary communities;
● Share strategic objectives in areas such as population health, quality, consumer focus, growth, and others; and
● Have multiple key complementary strengths – for example, CHI’s clinical excellence and
Dignity Health’s operating model. As a result, the boards of directors of Dignity Health and CHI requested that a business analysis for the aligned ministry be developed. That analysis identified the following potential synergies of aligned ministries:
● Enhancing clinical excellence;
● Improving patient experience;
● Ensuring care for the vulnerable and underserved;
● Developing talent and creating a learning organization;
● Improving access to care;
● Accelerating innovation and research; and
● Expanding the capabilities that support the health system of the future. In addition, the white paper identified high level economic implications and synergies of an alignment that have the potential to:
● Provide the financial resources and complementary strengths to support the capabilities needed for a changing health system;
11 The white paper is entitled “Creating a Transformative Ministry in Response to the Signs of the Times, Cultural, Strategic, Business and Financial Planning for an Aligned Ministry.”

10
● Extend the mission of social justice through a national platform for care that is accessible and equitable to all people, with particular attention to the vulnerable and underserved; and
● Develop new models for integrated, community focused care that combine clinical excellence, health improvement and innovation.
On October 24, 2016, the boards of directors of Dignity Health and CHI announced the signing of a non-binding letter of intent to explore aligning the organizations. After the signing of the letter of intent, independent advisors from Kaufman Hall Associates, PricewaterhouseCoopers, McKinsey & Company, and Dentons US LLP provided analyses regarding the strategic, cultural, financial, legal, operational, and structural aspects of the alignment of the organizations. A steering committee, comprised of executives from both organizations, was formed to negotiate the terms of the Ministry Alignment Agreement. In March 2017, Dignity Health and CHI sought a moral analysis12 from several Catholic theologians for the purposes of obtaining a nihil obstat13 from Archbishop Aquila of the Denver Archdiocese and Archbishop Cordileone of the San Francisco Archdiocese. On April 20, 2017, the boards of directors of Dignity Health passed a resolution authorizing and approving the execution of the Ministry Alignment Agreement subject to the moral analysis. The resolution cited the intention to combine Dignity Health and CHI into a new nationwide health system that would:
● Serve as an unprecedented platform to further Catholic identity and the Catholic health ministry;
● Provide an opportunity for Dignity Health and CHI’s employees, physicians, partners and
people in the communities served by Dignity Health and CHI to experience and participate in the enhanced Catholic health ministry;
● Enhance and expand access to care and the healthcare services performed for the poor
and underserved;
● Possess a strong voice for social justice and promote advocacy at local, state and national levels;
● Be a leader in healthcare’s transformation;
● Promote clinical efficiency and effectiveness in the delivery of healthcare and medical
services;
● Provide a platform to accomplish other goals, objectives, and benefits for the communities served by the CHI and Dignity Health;
12 A formal report by a Catholic theologian on the appropriate application of Catholic moral teachings. 13A Roman Catholic Church certification by an official censor that something is not objectionable on doctrinal or moral grounds.

11
The nihil obstats were received in October 2017. The Ministry Alignment Agreement was signed by Dignity Health and CHI on December 6, 2017. On March 29, 2018, Dignity Health submitted the written notice to the California Attorney General’s Office and requested the California Attorney General’s consent to the Ministry Alignment Agreement. Summary of the Ministry Alignment Agreement
The Ministry Alignment Agreement will be implemented primarily through the reorganization and renaming of CHI’s current corporation. This reorganized entity will become the parent organization (henceforth referred to as "System Corporation") over the new health system and will be renamed before the Closing Date14 of the transaction. The governing board of the System Corporation will initially be comprised of six directors each from the legacy boards of directors of Dignity Health and CHI, and the Chief Executive Officers from each organization (i.e., a total of 14 directors). As part of the transaction, Dignity Health formed a separate Colorado nonprofit corporation named Integrated Healthcare Operations (IHO). As of the Effective Date15 of the transaction, Dignity Health will transfer the assets of its eight non-Catholic owned hospitals (seven of which are in California and one in Arizona) to IHO. IHO will also become the sole corporate member of Dignity Health’s four subsidiary hospitals in California for a total of 12 hospitals. The System Corporation is not a member of IHO. However, the System Corporation approves the majority of the IHO board from nominees selected by the IHO board and holds reserve powers over certain actions to be taken by IHO. IHO will not be Catholic, and the eleven California non-Catholic hospitals16 transferred to IHO from Dignity Health and one Arizona non-Catholic hospital will remain non-Catholic and not subject to the ERDs. The 12 non-Catholic Dignity Health hospitals are not obligated to alter, restrict, or terminate any clinical medical service or program that was permitted on the effective date of the transaction by reason of Catholic doctrine or theology or any amendments to the Statement of Common Values17 or Designated Procedures18 that increases or expands prohibited services. The 12 non-Catholic Dignity Health hospitals will be provided with the same benefits, systems, services, and programs, and on the same terms as all other hospitals in System Corporation. The 12 non-Catholic Dignity Health hospitals will retain or adopt Dignity Health’s Statement of Common Values.
14 The Closing Date is the date the parties exchange all signed documents pursuant to the conditions precedent set forth in the Ministry Alignment Agreement. One of those conditions precedent requires the Attorney General’s consent. 15 As of 12:00:01am on the day immediately after the “Closing Date”. 16 Marian Regional Medical Center, Arroyo Grande Campus is and will remain a non-Catholic general acute care hospital. It operates under a consolidated license issued to a Catholic general acute care hospital, Marian Regional Medical Center. Marian Regional Medical Center, Arroyo Grande Campus will not be transferred to IHO. 17 Dignity Health’s Statement of Common Values prohibits direct abortions, in-vitro fertilizations, and provider or physician-assisted suicide or aid in dying. The most common medical procedure performed in hospitals that is prohibited by the ERDs is tubal ligation (a surgical procedure for female sterilization that involves severing and tying the fallopian tubes). Tubal ligations are not prohibited by Dignity Health’s Statement of Common Values. 18 Designated Procedures means “direct sterilizations” that consist of an elective procedure, the primary purpose of which is to render the patient permanently incapable of reproducing; provided, however, that procedures that induce sterility do not constitute a “Designated Procedure” when their effect is the cure or alleviation of a present and serious pathology, and a simpler treatment is not available.

12
On the Effective Date, the System Corporation will become the sole corporate member of Dignity Health and the board of directors of Dignity Health will be comprised of the same persons who comprise the board of directors of the System Corporation. On the Closing Date, Catholic Healthcare Federation becomes the sponsor of all Catholic activities, including Dignity Health’s Catholic hospitals. The board members of System Corporation and Dignity Health will be identical. A single executive management team will manage the System Corporation, Dignity Health, and CHI Regional and Subsidiary Corporations19. System Corporation Post the Effective Date of the Ministry Alignment Agreement The following chart shows the organization of System Corporation after the Closing Date of the Ministry Alignment Agreement. System Corporation would be the sole member of Dignity Health and the CHI Regional and Subsidiary Corporations20. System Corporation would not be a member of IHO, however, a majority of the nominees to IHO’s board of directors will be subject to approval by System Corporation and IHO’s hospitals will retain or adopt Dignity Health’s Statement of Common Values.
19 Both Dignity Health’s and IHO’s local hospital community boards associated with each owned hospital, as well as the boards associated with the four subsidiary hospitals, will continue to exist. 20The majority of CHI hospitals are organized into eight regional corporations.
Oversight Committees (Designated Procedures)
Catholic Healthcare Federation (Canonical Sponsor)
CHI Regional and Subsidiary Corps Dignity Health
Integrated Healthcare Operations (IHO)
Joint Ventures
19 CA Catholic Hospitals & Arroyo
Grande Subsidiaries 4 CA Hospital
Subsidiaries
7 CA Community Hospitals + AZ
Community Hospital
System Corporation (CHI)
Other Subsidiaries
Joint Ventures

13
System Corporation Post Debt Consolidation (Within 36 Months) After the Closing Date and after the restructuring and consolidation of the existing tax-exempt bonds and other debt of CHI and Dignity Health, Dignity Health and the CHI Regional and Subsidiary Corporations will merge into System Corporation, and the four non-Catholic separately-incorporated hospitals will merge into IHO.
Oversight Committees (Designated Procedures)
Catholic Healthcare Federation (Canonical Sponsor)
CHI Regional and Subsidiary Corps Dignity Health
Integrated Healthcare Operations (IHO)
Joint Ventures
19 CA Catholic Hospitals & Arroyo
Grande Subsidiaries 4 CA Hospital
Subsidiaries
7 CA Community Hospitals + AZ
Community Hospital
System Corporation (CHI)
Other Subsidiaries
Joint Ventures
Mer
ger
Mer
ger

14
Major Provisions of the Ministry Alignment Agreement
The major provisions of the Ministry Alignment Agreement, dated December 6, 2017, include the following: Structures and Responsibilities
Catholic Health Care Federation (CHCF)
o CHCF, as a public juridic person, shall be the Catholic canonical sponsor of System Corporation, and shall serve as the canonical sponsor of all of the Catholic ministries that are a part of the Ministry Alignment Agreement;
o CHCF’s governance composition will be reconstituted after the Effective Date of the Ministry Alignment Agreement:
o Dignity Health and CHI shall each select six individuals from their existing
governing bodies to serve as the initial CHCF members. In addition, the members of CHCF shall also include the current president and CEO of Dignity Health, and the current CEO of CHI, for a total of fourteen members. No later than twelve months after the Effective Date, CHCF shall approve and appoint one individual who was previously neither a member of CHCF, nor the board of directors of Dignity Health or CHI to serve as the fifteenth CHCF member;
o CHCF shall continue to provide for the participation of its congregations, and shall admit the six congregations of Women’s Religious as additional participating congregations; and
o CHCF reserves the rights to approve or remove any member of the Board of Stewardship Trustees and veto any amendments or changes to Dignity Health’s Statement of Common Values.
● System Corporation
o System Corporation, formerly known as Catholic Health Initiatives, shall become
the parent entity and the surviving corporation;
o System Corporation shall be a ministry of the Catholic Church and shall be subject to the ERDs;

15
o System Corporation shall be governed by a board called the Board of Stewardship Trustee that shall consist of the same persons who serve as the CHCF members; and
o Under the supervision of the CHCF, the Board of Stewardship Trustee reserves
the rights to control or manage the property, affairs and activities of System Corporation. Responsibilities include approving the policies of System Corporation, developing System Corporation’s strategic plan, and approving the System Corporation’s articles of incorporation and bylaws.
● Dignity Health
o Dignity Health shall continue to be a California nonprofit corporation with
federal tax-exempt 501 (c)(3) status until after debt consolidation between Dignity Health and CHI, at which point Dignity Health will merge into System Corporation;
o As of the Effective Date:
o Dignity Health shall transfer all of the assets and liabilities associated with the Dignity Health businesses and operations of the following California non-Catholic hospitals to IHO:
● California Hospital Medical Center;
● French Hospital Medical Center;
● Glendale Memorial Hospital and Health Center;
● Methodist Hospital of Sacramento;
● Northridge Hospital Medical Center;
● Sequoia Hospital; and
● Woodland Memorial Hospital.
o Dignity Health shall cause the four subsidiary hospitals that are separately incorporated, Bakersfield Memorial Hospital, Community Hospital of San Bernardino, Saint Francis Memorial Hospital, and Sierra Nevada Memorial-Miners Hospital, to first substitute its membership from Dignity Health to IHO, until after debt consolidation between Dignity Health and CHI, at which point these four subsidiary hospitals will merge into IHO; and

16
o Marian Regional Medical Center, Arroyo Grande Campus, a non-Catholic hospital, will remain with Dignity Health under a consolidated license with Marian Regional Medical Center, a Catholic hospital. Marian Regional Medical Center, Arroyo Grande Campus will not adhere to the ERDs. It will adopt or retain Dignity Health’s Statement of Common Values. It does not offer obstetrics or women’s healthcare services.
o Dignity Health’s nineteen Catholic hospitals shall remain a ministry of the Catholic Church and subject to the ERDs;
o System Corporation (after the transfers of the community hospitals to IHO) shall become the sole corporate member of Dignity Health; and
o Dignity Health shall be governed by a board consisting of the same individuals
who are serving as the board for System Corporation and are also the members of CHCF.
● Integrated Healthcare Operations
o IHO was formed by Dignity Health prior to the signing date without involvement, input, or direction from CHI. IHO shall continue to be a Colorado nonprofit corporation;
o IHO and its subsidiaries shall not become ministries of the Catholic Church, shall not use the name “Catholic” for their respective public businesses, shall not be subject to the ERDs, and shall operate consistent with Dignity Health’s Statement of Common Values;
o IHO shall be governed by a board of directors consisting of individuals who shall:
o Be initially appointed by Dignity Health and then nominated by the board
of directors of IHO or a committee thereof;
o Serve in their individual capacities and not in any manner as a representative of System Corporation; and
o Not contemporaneously serve; as a CHCF Member, or on the board of
System Corporation, Dignity Health, nor any other subsidiary of System Corporation;
o After the Effective Date, a majority of the members of the IHO Board who are
subject to nomination or re-appointment shall be nominated by the IHO Board

17
then in effect, subject to the acceptance (or rejection) of a majority of such nominees by the board of System Corporation;
o IHO is anticipated to operate on a collaborative basis with System Corporation. Neither CHCF, System Corporation, Dignity Health, or any other subsidiary of System Corporation shall be the corporate member of IHO; and
o Prior to the Effective Date of the contemplated merger, Dignity Health
shall require IHO and each of its subsidiary operating hospitals to create a Community Hospital Oversight Committee for each hospital. These committees will act as a separate governance body to oversee the operations, management, and financial results related to the Designated Procedures performed in each community hospital.
o With respect to the Designated Procedures performed at each community hospital:
● Such community hospital shall separately account for and
regularly report to the Community Hospital Oversight Committee on the net revenues and expenses reasonably allocated to such Designated Procedures together with the net financial results (i.e. either a net profit or net loss);
● The Community Hospital Oversight Committee shall donate any
net profits to one or more healthcare related tax-exempt charities that provide or advocate for activities, services, or procedures benefitting the communities served by the hospital and that are not inconsistent with the ERDs.
o On an annual basis, and not more than four months following the end of
each fiscal year of IHO, each Community Hospital Oversight Committee shall prepare and deliver a written certification to the IHO Board and to the Local Hospital Community Board or the applicable board of one of the four subsidiaries:
● The Community Hospital Oversight Committee has not amended its charter in any manner that violates or otherwise modifies the structure or authorities contained in the IHO bylaws;
● The composition of the Community Hospital Oversight Committee complies with the requirements; and

18
● All donations or grants (if any) of the net profits from the performance of the Designated Procedures were contributed to one or more healthcare related tax-exempt charities.
o IHO reserves the right to approve changes of non-Catholic hospitals, its
subsidiaries and its joint ventures. Changes include changing the mission or philosophical direction of entities, and approval or removal of entities under IHO. Modifications to Dignity Health’s Statement of Common Values must be approved by the board of System Corporation and can be vetoed by CHCF.
● Port City Operating Company, LLC
o St. Joseph Medical Center of Stockton and St. Joseph Behavioral Health
Center are owned by Port City Operating Company, LLC, a joint venture between Kaiser Foundation Hospitals and Dignity Health. Dignity Health owns 80% of Port City Operating Company, LLC and Kaiser Foundation Hospitals owns the remaining 20%. Dignity Health’s continued ownership in Port City Operating Company, LLC after a change of control of Dignity Health will be subject to Kaiser Foundation Hospitals’ consent; and
o Dignity Health’s ownership interest of Port City Operating Company, LLC will transfer to System Corporation.
● CHI Regional Corporations
o Each of the CHI Regional Corporations shall continue to be nonprofit
corporations organized in their respective states of incorporation until Dignity Health and CHI consolidate debt. Afterwards, the CHI Regional Corporations will merge into System Corporation.
● Mark Twain Medical Center
o Dignity Health and CHI acknowledge that the continued management of Mark Twain Medical Center by Dignity Health after a change of control of Dignity Health may be subject to consent from outside parties.

19
Dignity Health Commitments
● Licensed Acute Care Hospital Commitments
o For a period of five years from the Effective Date of the transaction:
▪ The System Corporation and Dignity Health shall continue to operate and maintain each Dignity Health owned hospital as a licensed general acute care hospital;
▪ IHO shall continue to operate and maintain each IHO owned hospital as a
licensed general acute care hospital; and
▪ IHO and each IHO subsidiary shall continue to operate and maintain the IHO subsidiary hospital as a licensed general acute care hospital.
● Licensed Specialty Service Commitments and Additional Specialty Services
Commitments
o For a period of five years from the Effective Date of the transaction:
▪ System Corporation and Dignity Health, with respect to the Dignity Health owned hospitals, IHO owned hospitals, and the IHO subsidiary hospitals shall continue to operate, provide and maintain the following services at each California hospital:
● Twenty-four-hour emergency medical services at current licensure, with the current number of emergency treatment stations, the current types and levels of emergency medical services, and the current designations or certifications associated with such emergency medical services;
● Core specialty and additional specialty healthcare services at current licensure and designation with current minimum types and/or levels of services21; and
● Additional specialty healthcare services at current licensure and
designation with current types and/or levels of services.
21 See the “Assessment of Potential Issues Associated with the Availability or Accessibility of Healthcare Services” for a complete listing of commitments made by Dignity Health for California Hospital Medical Center, Glendale Memorial Hospital and Health Center, St. Mary Medical Center and Northridge Hospital Medical Center

20
● Women's Healthcare Services Commitments
o For a period of five years from the Effective Date: ▪ System Corporation and Dignity Health, with respect to the Dignity
Health owned hospitals, IHO owned hospitals, and the IHO subsidiary hospitals, shall continue to provide women's healthcare services.
▪ Those Dignity Health California hospitals that are non-Catholic shall retain
their identity as community hospitals and shall not become ministries of the Catholic Church, nor be subject to the ERDs. In addition, they will retain or adopt Dignity Health’s Statement of Common Values.
● Medicare & Medi-Cal Commitment
o For a period of five years from the Effective Date of the transaction:
▪ System Corporation and Dignity Health, with respect to the Dignity Health owned hospitals, IHO owned hospitals, and the IHO subsidiary hospitals, shall:
● Continue to be certified to participate in the Medicare program;
● Continue to be certified to participate in the Medi-Cal program;
and
● Continue to have and maintain their respective Medi-Cal Managed Care contracts in effect as of the signing date.
● City/County Contract Commitment:
o For a period of five years from the Effective Date of the transaction:
▪ System Corporation and Dignity Health, with respect to the Dignity
Health owned hospitals, IHO owned hospitals, and the IHO subsidiary hospitals, shall maintain healthcare-related services contracts, with any city or county in the State of California as of the signing date.
● Charity Care Commitment
o For the six fiscal years from the Effective Date, System Corporation and Dignity Health, with respect to the Dignity Health owned hospitals, IHO owned hospitals, and the IHO subsidiary hospitals, in California shall:

21
▪ Provide an annual amount of charity care at each hospital equal to or greater than the average annual amount of charity care provided by such hospital during the three fiscal years prior to the signing date and adjusted for cost-of-living-adjustments.
● Community Benefit Program Commitment
o For a period of six fiscal years from the Effective Date, System Corporation and
Dignity Health, with respect to the Dignity Health owned hospitals, IHO owned hospitals, and the IHO subsidiary hospitals in California, shall provide an annual amount of community benefit services at each such Dignity Health California Hospital equal to or greater than the average annual amount of community benefit services provided by hospital during the three fiscal years prior to the signing date and adjusted for cost-of-living adjustments.
● Medical Staff and Related Commitments
o System Corporation and Dignity Health, with respect to the Dignity Health owned hospitals, IHO owned hospitals, and the IHO subsidiary hospitals in California, shall maintain privileges for the current medical staff members of each such hospital who are in good standing as of the Effective Date.
● LGBT Non-Discrimination Commitments
o There shall be no discrimination against any lesbian, gay, bisexual, or transgender individuals at any Dignity Health California hospitals. System Corporation and Dignity Health, with respect to the Dignity Health owned hospitals, and IHO with respect to the IHO owned hospitals and the IHO subsidiary hospitals, shall cause this prohibition to be explicitly set forth in the written policies applicable to such hospitals, adhered to and strictly enforced.
● Seismic Compliance Commitments
o System Corporation, Dignity Health and IHO shall commit the necessary investments required to meet and maintain OSHPD seismic compliance requirements at each Dignity Health California hospital until January 1, 2030
● Union Commitments
○ Dignity Health and CHI agree that the collective bargaining agreements in effect
as of the Effective Date shall remain in full force and effect following the Effective Date in accordance with their respective terms.
● Hospital Quality Assurance Fee Program Participation

22
○ System Corporation, Dignity Health and IHO commit to continue participation in the California Department of Health Care Services’ Hospital Quality Assurance Fee Program for five years for all California hospitals.
Use of Net Sale Proceeds
There will be no net proceeds as a result of the proposed transaction.

23
Profile of Catholic Health Initiatives Overview
CHI is a nonprofit, faith-based health system that formed in 1996 through the consolidation of three Catholic health systems: Catholic Health Corporation, Franciscan Health System, and Sisters of Charity Health System. CHI, headquartered in Englewood, Colorado, has a service area that covers approximately 54 million people and operates acute care facilities in 13 states. CHI’s network consists of 97 acute care facilities, academic health centers and major teaching hospitals, critical-access facilities, community health-service organizations, nursing colleges, and senior living communities. The health system has more than 95,000 employees, including approximately 4,700 employed physicians and advanced practice clinicians.
CHI Acute Care Facilities
REGION ACUTE CARE
FACILITIES Arkansas 4 Colorado and Kansas 12 Iowa and Nebraska 21 Kentucky 13 Minnesota 4 North Dakota 10 Ohio 5 Tennessee 2 Texas 16 Oregon and Washington 10
Source: 2017 CHI Annual Report
CHI OPERATIONS
Acute Care Facilities 97
Home Services Location 52
Critical- Access Hospitals 30
Long-Term Facilities 16
Clinical Integrated Networks 11
Academic Medical Centers a Major Teaching Hospital 3
Community Health Services Organizations 2
Source: 2017 CHI Annual Report

24
Key Statistics In Fiscal Year (FY) 2017, CHI reported growth in the number of admissions, outpatient emergency visits, outpatient non-emergency visits, physician office visits, the number of full-time equivalent employees, and total employees overall compared to FY 2016. CHI reported a decrease in acute patient days, average daily census, residential days, and long-term care days.
CHI STATISTICAL HIGHLIGHTS FY 2016 – FY 2017 Fiscal Year ended June 30, 2017 FY 2016 FY 2017 Change Acute Patient Days 2,382,402 2,366,980 -0.6% Acute Average Daily Census 6,527 6,485 -0.6% Acute Admissions 498,464 504,593 1.2% Acute Average Length of stay, in days 4.8 4.7 -2.1% Outpatient emergency visits 1,951,714 1,966,342 0.7% Outpatient non-emergency visits 5,557,647 5,804,586 4.4% Physician office visits 9,635,875 10,540,482 9.4% Residential days 751,072 665,885 -11.3% Long-term care days 503,450 483,151 -4.0% Full-time equivalent employees 79,194 84,463 6.7% Employees 93,697 95,968 2.4% Acute inpatient revenues as a percentage of total 44.70% 44.70% - Source: CHI 2017 Annual Report
Payer Mix The following chart represents the gross revenue by payer for CHl's consolidated operations for the FY 2017.
Source: CHI Annual Report
Medicare42%
Medicaid16%
Commercial Managed
Care29%
Commercial5%
Self-pay4%
Other4%
Gross Revenue By Payer

25
Financial Profile CHI’s audited consolidated financial statements show the following system-wide performance of CHI and its affiliates:
CHI COMBINED STATEMENT OF OPERATIONS
FY 2016 – FY 2017 (In Thousands)
Unrestricted Revenues and Support FY 2016 FY 2017 Net Patient Service Revenue Less Bad Debt Provision $13,847,027 $14,450,868 Donations $36,983 $30,954 Changes in Equity of Unconsolidated Organizations $133,375 $48,404 Gains on Business Combinations $223,036 - Hospital Ancillary Revenues $351,509 $339,072 Other $597,657 $678,166
Total Operating Revenues $15,189,587 $15,547,464
Expenses
Salaries and Wages $6,117,712 $6,294,834 Employee Benefits $1,182,203 $1,201,044 Purchased Services, Medical Professional Fees, Medical Claims and Consulting $2,232,689 $2,402,478 Supplies $2,490,524 $2,550,328 Utilities $212,732 $210,285 Rentals, Leases, Maintenance and Insurance $898,020 $901,272 Depreciation and Amortization $833,394 $846,291 Interest $281,581 $295,476 Other $1,019,385 $1,056,536 Restructuring, Impairment and Other Losses $292,758 $374,167
Total Expenses $15,560,998 $16,132,711
Income From Operations ($371,411) ($585,247)
Non-operating Income (Loss)
Investment Income (Loss), net ($3,384) $638,519 Loss on early extinguishment of debt ($29,469) ($19,586) Realized and Unrealized Gains (Losses) on Interest Rate Swaps ($154,816) $92,698 Other Non-operating Gains (Losses) ($16,491) $2,006
Total Non-operating Income (Loss) ($204,160) $713,637
Excess of revenues over Expenses ($575,571) $128,390
Source: CHI Audited Financial Statements
● Net Patient Service Revenue (less provision for bad debts) of $14.5 billion in FY 2017
represents a net increase of approximately $600 million, or 4.4%, as compared to FY 2016. Total operating revenues increased by $358 million, or 2.4%, from $15.2 billion in FY 2016 to $15.5 billion in FY 2017;
Total expenses increased by 3.7% from $15.6 billion in FY 2016 to $16.1 billion in FY 2017. CHI’s salaries, wages and employee benefits expense accounted for 46% of total expenses;
● In FY 2017, CHI realized a non-operating gain of approximately $714 million, a substantial increase from the non-operating loss of $204 million loss in FY 2016; and
● Excess revenue over expenses increased from a loss of approximately $576 million in FY 2016 to a gain of approximately $128 million in FY 2017. This is mainly due to an increase in non-operating revenue.

26
Profile of Dignity Health Dignity Health is a California nonprofit public benefit corporation that traces its history to the Sisters of Mercy, founded by Catherine McAuley in Dublin, Ireland in 1831. On December 8, 1854, eight Sisters of Mercy left Ireland and arrived in San Francisco, California to begin caring for residents struck by influenza, cholera and typhoid. The Sisters of Mercy opened St. Mary’s Hospital, the oldest operating hospital in San Francisco, on July 27, 1857. Today, Dignity Health has grown to be one of the largest health systems in the United States. Dignity Health provides healthcare services in California, Arizona and Nevada. In California, Dignity Health owns and operates 31 hospitals across 17 counties with an estimated 11,500 physicians on its hospitals’ medical staff. Dignity Health also operates five general acute care hospitals in Arizona and three in Nevada.

27
Payer Mix The following chart shows inpatient discharges by payer for Dignity Health’s consolidated California operations for FY 2016.
DIGNITY HEALTH TOTAL PAYER MIX COMPARISON FY 201622
Dignity Health FY 2016 California FY 20161
Discharges % of
Total Discharges
% of Total
Medi-Cal Traditional 42,492 15.20% 441,300 14.70% Medi-Cal Managed Care 65,590 23.40% 590,581 19.70% Medi-Cal Total 108,082 38.60% 1,031,881 34.40% Medicare Traditional 88,052 31.40% 829,621 27.60% Medicare Managed Care 27,196 9.70% 315,579 10.50% Medicare Total 115,248 41.10% 1,145,200 38.10% Third-Party Managed Care 47,682 17.00% 648,533 21.60% Third-Party Managed Care Total 47,682 17.00% 648,533 21.60% Third-Party Traditional 5,245 1.90% 100,382 3.30% Other Payers 2,495 0.90% 44,809 1.50% Other Indigent 1,344 0.50% 17,246 0.60% County Indigent 76 0.00% 15,160 0.50% Other Total 9,160 3.30% 177,597 5.90%
Total 280,172 100% 3,003,211 100%
Source: OSHPD Disclosure Reports, FY 2016 1 FY 2017 California data was not available when the data was collected to prepare this report.
● Dignity Health’s largest payer in California by percentage of inpatient discharges is
Medicare (41.1%), followed by Medi-Cal (38.6%), and Third-Party Managed Care
(17.0%);
● Dignity Health’s California hospitals care for 10.5% of all California Medi-Cal inpatient
discharges;
● Dignity Health’s California hospitals had 10.1% of all California Medicare inpatient
discharges; and
● In FY 2016, Dignity Health’s California hospitals cared for 9.3% of all inpatient discharges
in California.
22 Fiscal Year from July 1 through June 30.
28
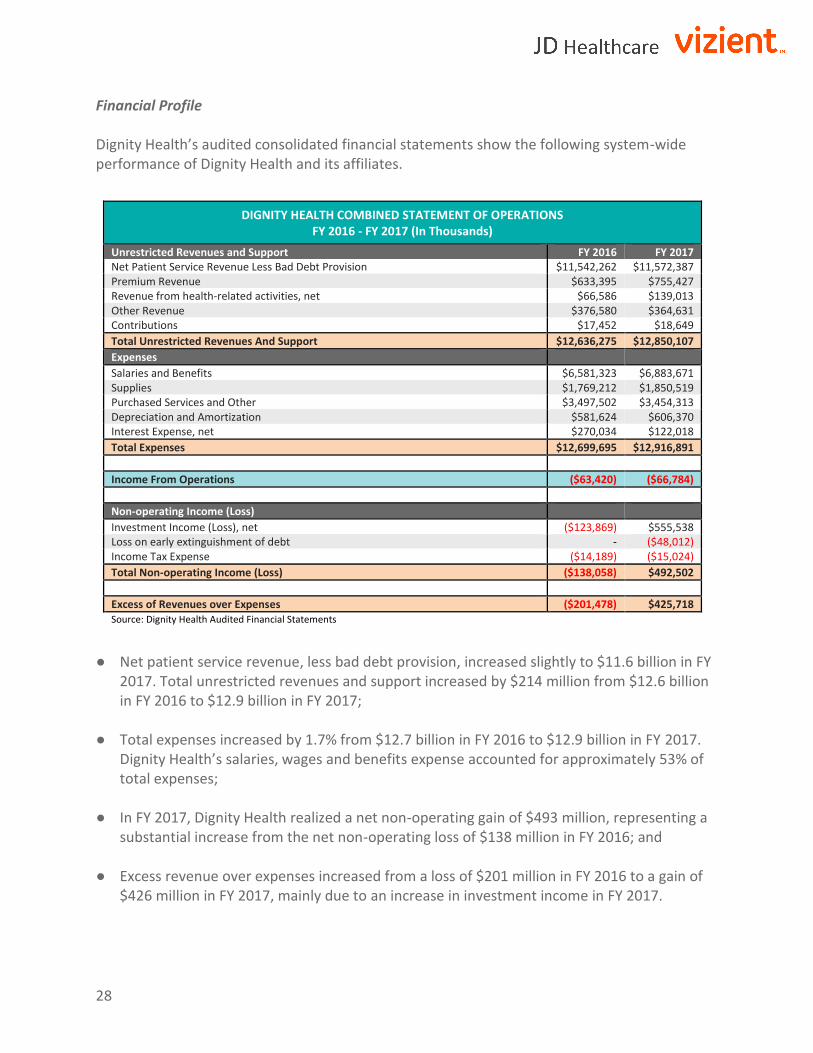
Financial Profile Dignity Health’s audited consolidated financial statements show the following system-wide performance of Dignity Health and its affiliates.
DIGNITY HEALTH COMBINED STATEMENT OF OPERATIONS FY 2016 - FY 2017 (In Thousands)
Unrestricted Revenues and Support FY 2016 FY 2017 Net Patient Service Revenue Less Bad Debt Provision $11,542,262 $11,572,387 Premium Revenue $633,395 $755,427 Revenue from health-related activities, net $66,586 $139,013 Other Revenue $376,580 $364,631 Contributions $17,452 $18,649
Total Unrestricted Revenues And Support $12,636,275 $12,850,107
Expenses
Salaries and Benefits $6,581,323 $6,883,671 Supplies $1,769,212 $1,850,519 Purchased Services and Other $3,497,502 $3,454,313 Depreciation and Amortization $581,624 $606,370 Interest Expense, net $270,034 $122,018
Total Expenses $12,699,695 $12,916,891
Income From Operations ($63,420) ($66,784)
Non-operating Income (Loss)
Investment Income (Loss), net ($123,869) $555,538 Loss on early extinguishment of debt - ($48,012) Income Tax Expense ($14,189) ($15,024)
Total Non-operating Income (Loss) ($138,058) $492,502
Excess of Revenues over Expenses ($201,478) $425,718 Source: Dignity Health Audited Financial Statements
● Net patient service revenue, less bad debt provision, increased slightly to $11.6 billion in FY 2017. Total unrestricted revenues and support increased by $214 million from $12.6 billion in FY 2016 to $12.9 billion in FY 2017;
● Total expenses increased by 1.7% from $12.7 billion in FY 2016 to $12.9 billion in FY 2017. Dignity Health’s salaries, wages and benefits expense accounted for approximately 53% of total expenses;
● In FY 2017, Dignity Health realized a net non-operating gain of $493 million, representing a
substantial increase from the net non-operating loss of $138 million in FY 2016; and ● Excess revenue over expenses increased from a loss of $201 million in FY 2016 to a gain of
$426 million in FY 2017, mainly due to an increase in investment income in FY 2017.

29
Dignity Health’s California Hospitals Overview The following table lists the location of each Dignity Health owned and managed hospital in
California.
DIGNITY HEALTH'S OWNED & OPERATED CALIFORNIA HOSPITALS
Hospital County City
Memorial Hospital Bakersfield Kern County Bakersfield
Mercy Hospital Downtown Kern County Bakersfield
Mercy Hospital Southwest Kern County Bakersfield
California Hospital Medical Center Los Angeles Los Angeles
Glendale Memorial Hospital Los Angeles Glendale
Northridge Hospital Medical Center Los Angeles Northridge
St. Mary Medical Center Los Angeles Long Beach
Mercy Medical Center Merced Merced County Merced
Sierra Nevada Memorial Hospital Nevada County Grass Valley
Marian Regional Medical Center, Arroyo Grande San Luis Obispo County Arroyo Grande
French Hospital Medical Center San Luis Obispo County San Luis Obispo
Mercy General Hospital Sacramento County Sacramento
Mercy Hospital of Folsom Sacramento County Folsom
Mercy San Juan Medical Center Sacramento County Carmichael
Methodist Hospital of Sacramento Sacramento County Sacramento
Community Hospital of San Bernardino San Bernardino San Bernardino
St. Bernardine Medical Center San Bernardino San Bernardino
Saint Francis Memorial Hospital San Francisco County San Francisco
St. Mary's Medical Center San Francisco County San Francisco
St. Joseph's Behavioral Health Center San Joaquin County Stockton
Sequoia Hospital San Mateo County Redwood City
St. Joseph's Medical Center San Joaquin County Stockton
Marian Regional Medical Center Santa Barbara County Santa Maria
Marian Regional Medical Center West Santa Barbara County Santa Maria
Dominican Hospital Santa Cruz County Santa Cruz
Mercy Medical Center Redding Shasta County Redding
Mercy Medical Center Mt Shasta Siskiyou County Mt. Shasta
St. Elizabeth Community Hospital Tehama County Red Bluff
St. John's Pleasant Valley Hospital Ventura County Camarillo
St. John's Regional Medical Center Ventura County Oxnard
Woodland Memorial Hospital Yolo County Woodland
Source: Dignity Health

30
Analysis of Dignity Health’s Los Angeles County Hospital Market Share Los Angeles County has over 10 million residents and encompasses over 4,000 square miles. The map below depicts the location of the four Dignity Health general acute care facilities located in Los Angeles County and their respective primary service areas.

31
There are 105 general acute care hospitals located within Los Angeles County, four of which are
Dignity Health hospitals. California Hospital Medical Center, Glendale Memorial Hospital and
Health Center, St. Mary Medical Center and Northridge Hospital Medical Center. The Hospitals
have a combined 5.5% market share of inpatient discharges in Los Angeles County. The
following table shows Los Angeles County’s inpatient market share for calendar year (CY) 2016,
the most recent data available from OSHPD. A profile for each Dignity Health Hospital located
in Los Angeles County is described in the following sections.
LOS ANGELES COUNTY MARKET SHARE BY HOSPITAL CY 2016
Hospital CY 2016
Discharges Market
Share
Cedars Sinai Medical Center 43,051 4.5% Huntington Memorial Hospital 27,889 2.9% LAC+USC Medical Center 26,984 2.8% Torrance Memorial Medical Center 25,680 2.7% Kaiser Foundation Hospital - Los Angeles 22,093 2.3% Adventist Health Glendale 20,776 2.2% Providence Little Company of Mary Medical Center Torrance 20,292 2.1% St. Francis Medical Center 20,147 2.1% Adventist Health White Memorial 18,593 1.9% California Hospital Medical Center 18,215 1.9% Providence Holy Cross Medical Center 17,769 1.9% Antelope Valley Hospital 17,464 1.8% Long Beach Memorial Medical Center 17,104 1.8% LAC/Harbor-UCLA Medical Center 16,960 1.8% Ronald Reagan UCLA Medical Center 16,945 1.8% Northridge Hospital Medical Center 13,068 1.4% St. Mary Medical Center Long Beach 10,553 1.1% Glendale Memorial Medical Center 9,526 1.0% All Other Dignity Health Hospitals in California 819 0.1% All Other 592,756 62.0%
Total Discharges 956,684 100%
Total Dignity Health Discharges 52,181 5.5%
Source: CY 2016 OSHPD Discharge Database
Note: Excludes normal newborns
● California Hospital Medical Center has the largest market share (1.9%) of Los Angeles
County’s inpatient discharges among Dignity Health Hospitals;
● Cedars Sinai Medical Center is the inpatient leader in Los Angeles County with 4.5%
market share; and

32
● “All Other Dignity Health Hospitals in California” includes Los Angeles County residents
that received inpatient care at Dignity Health Hospitals located outside of Los Angeles
County.
Profile of California Hospital Medical Center Overview California Hospital Medical Center is a general acute care hospital located at 1401 South Grand Avenue in downtown Los Angeles, California. It was founded in 1887 by Dr. Walter Lindley and operated as a physician-owned hospital. Today, California Hospital Medical Center offers a range of services including a Level II Trauma Center, a Primary Stroke Center, cardiac catheterization, a birthing center, and a Level III Neonatal Intensive Care Unit. The Hospital is recognized as the busiest private trauma center in Los Angeles County. The Hospital has seven surgical operating rooms and a “basic” emergency department23 with 35 emergency treatment stations. According to California Hospital Medical Center’s current hospital license, it is licensed for 318 beds as shown below.
CALIFORNIA HOSPITAL MEDICAL CENTER
LICENSED BED DISTRIBUTION 2018
Licensed Bed Type Number of Beds1
General Acute Care Beds
Neonatal Intensive Care 26
Perinatal 37
Intensive Care 28
Pediatric 12
Coronary Care 8
Unspecified General Acute Care 207
Total General Acute Care Beds 318
Total Licensed Beds 318 1 2018 Hospital License
23 A “basic” emergency department provides emergency medical care in a specifically designated part of a hospital that is staffed and equipped at all times to provide prompt care for any patient presenting urgent medical problems.

33
Key Statistics California Hospital Medical Center reported 17,799 inpatient discharges, 74,435 patient days, and an average daily census of 204 patients (approximately 64% occupancy) for FY 2017.
CALIFORNIA HOSPITAL MEDICAL CENTER KEY STATISTICS FY 2015 - FY 20171
FY 2015 FY 2016 FY 2017 Inpatient Discharges 17,329 18,255 17,799 Licensed Beds 318 318 318 Patient Days 77,452 84,759 74,435 Average Daily Census 212 232 204 Occupancy 66.7% 73.0% 64.1% Average Length of Stay 4.5 4.6 4.2 Cardiac Catheterization Procedures 1,396 1,857 3,962 Emergency Service Visits 84,416 79,303 80,607 Total Live Births 3,612 3,788 3,657 Sources: OSHPD Disclosure Reports, FY 2015 - FY 2017 1 FY 2015 and FY 2016 data is from audited OSHPD Disclosure Reports whereas FY 2017 data is from unaudited.
● Since FY 2015, inpatient discharges increased by 3%, while patient days decreased by
4%;
● In FY 2017, 80,607 emergency service visits were reported, a 5% decrease from FY 2015;
● In FY 2017, 3,962 cardiac catheterization procedures were reported; and
● Between FY 2015 and FY 2017, total live births remained relatively constant, with an average of 3,686 births annually.

34
Patient Utilization Trends The following table shows FY 2013 - FY 2017 patient volume trends at California Hospital Medical Center.
CALIFORNIA HOSPITAL MEDICAL CENTER SERVICE VOLUMES FY 2013 - FY 20171
PATIENT DAYS FY 2013 FY 2014 FY 2015 FY 2016 FY 2017 Medical/Surgical2 35,472 34,757 39,835 46,849 45,697 Neonatal Intensive Care 7,648 7,805 7,142 6,616 6,393 Intensive Care 6,844 7,625 9,192 9,387 9,100 Obstetrics 11,578 10,509 12,448 9,587 8,491 Pediatrics Acute 2,099 2,153 2,140 2,119 1,767 Skilled Nursing 5,321 3,635 3,585 3,855 1,220 Sub-Acute Care - - 3,110 6,346 1,767 Total 68,962 66,484 77,452 84,759 74,435 DISCHARGES Medical/Surgical2 9,643 8,645 9,864 10,948 10,320 Neonatal Intensive Care 605 491 573 484 545 Intensive Care 2,029 797 1,048 372 1,077 Obstetrics 3,824 4,200 3,565 3,957 3,730 Pediatrics Acute 637 1,697 1,969 2,185 2,060 Skilled Nursing 389 318 166 148 27 Sub-Acute Care - - 144 161 20 Total 17,127 16,148 17,329 18,255 17,779 AVERAGE LENGTH OF STAY Medical/Surgical2 3.7 4.0 4.0 4.3 4.4 Neonatal Intensive Care 12.6 15.9 12.5 13.7 11.7 Intensive Care 3.4 9.6 8.8 25.2 8.4 Obstetrics 3.0 2.5 3.5 2.4 2.3 Pediatrics Acute 3.3 1.3 1.1 1.0 .9 Skilled Nursing 13.7 11.4 21.6 26.0 45.2 Sub-Acute Care - - 21.6 39.4 88.4 Total 4.0 4.1 4.5 4.6 4.2 AVERAGE DAILY CENSUS Medical/Surgical2 97.2 95.2 109.1 128.4 125.2 Neonatal Intensive Care 21.0 21.4 19.6 18.1 17.5 Intensive Care 18.8 20.9 25.2 25.7 24.9 Obstetrics 31.7 28.8 34.1 26.3 23.3 Pediatrics Acute 5.8 5.9 5.9 5.8 4.8 Skilled Nursing 14.6 10.0 9.8 10.6 3.3 Sub-Acute Care - - 8.5 17.4 4.8 Total 189 182 212 232 204 OTHER SERVICES Inpatient Surgeries 5,920 6,393 3,327 3,374 3,538 Outpatient Surgeries 7,351 7,826 3,873 3,769 3,601 Emergency Service Visits 68,991 72,916 84,416 79,303 80,607 Total Live Births 4,425 4,425 3,612 3,788 3,657
Sources: OSHPD Disclosure Reports, FY 2013 - FY 2017 1 FY 2013 to FY 2016 data is from audited OSHPD Disclosure Reports whereas FY 2017 is from unaudited. 2 Includes Definitive Observation Beds
A review of California Hospital Medical Center’s historical utilization trends between FY 2013
and FY 2017 supports the following conclusions:
● Total patient days increased by 8% but decreased the last three years by 4%;
● Inpatient discharges increased by 4%;

35
● The average daily census increased by 8% from 189 patients in FY 2013 to 204 patients in FY 2017;
● Between FY 2013 and FY 2017, total live births decreased by 17% from 4,425 in FY 2013 to 3,657 in FY 2017; and
● Emergency service visits have increased by 17% to 80,607 visits in FY 2017. Financial Profile Over the last five fiscal years, California Hospital Medical Center’s net income has fluctuated from a loss of $8.3 million in FY 2014 to a gain of $27.3 million in FY 2017. Between FY 2013 and FY 2017, net patient revenue and total operating revenue increased by 28% and 29% respectively. Over the same period, the Hospital’s operating expenses increased by 24% from $331.0 million in FY 2013 to $408.8 million in FY 2017. Other operating revenue24 increased by 53% over the five-year period from $15.8 million in FY 2013 to $24.2 million in FY 2017. The Hospital’s current ratio25 has decreased over the last five years from 3.29 in FY 2013 to 2.58 in FY 2017. The California current ratio in FY 2016 was 1.56. The Hospital’s FY 2017 percentage of bad debt is 1.1% and higher than the State average of 0.8%.
CALIFORNIA HOSPITAL MEDICAL CENTER FINANCIAL AND RATIO ANALYSIS FY 2013 - FY 20171
FY 2013 FY 2014 FY 2015 FY 2016 FY 2017
Patient Days 68,962 66,484 77,452 84,759 74,435 -
Discharges 17,127 16,148 17,329 18,255 17,425 -
ALOS 4.0 4.1 4.5 4.6 4.3 -
Net Patient Revenue $324,345,736 $300,758,211 $445,878,662 $428,387,392 $414,549,348 -
Other Operating Revenue $15,802,481 $15,494,107 $21,503,454 $23,010,964 $24,195,223 -
Total Operating Revenue $340,148,217 $316,252,318 $467,382,116 $451,398,356 $438,744,571 -
Operating Expenses $331,006,165 $327,098,283 $404,650,357 $415,738,707 $408,815,484 -
Net from Operations $9,142,052 ($10,845,965) $62,731,759 $35,659,649 $29,929,087 -
Net Non-Operating Revenues and Expenses $2,520,603 $2,500,849 $618,022 $1,515,521 ($2,668,410) -
Net Income $11,662,655 ($8,345,116) $63,349,781 $37,175,170 $27,260,677 -
2016 California
Average2
Current Ratio 3.29 3.61 3.43 2.44 2.58 1.56
Days in A/R 48.5 75.0 46.1 49.2 45.1 57.1
Bad Debt Rate 3.5% 1.8% 0.7% 0.9% 1.1% 0.8%
Operating Margin 2.69% -3.43% 13.42% 7.90% 6.82% 2.74%
Source: OSHPD Disclosure Reports, FY 2013 - FY 2017 1 FY 2013 to FY 2016 data is from audited OSHPD Disclosure Reports whereas FY 2017 is from unaudited. 2 FY 2017 California data was not available when the data was collected to prepare this report.
24 Other operating revenue represents amounts received for services that are central to the provision of healthcare services but are not directly related to patient care. 25 The current ratio compares a company’s total current assets to its current liabilities to measure its ability to pay short-term and long-term debt obligations. A low current ratio of less than 1.0 could indicate that a company may have difficulty meeting its current obligations. The higher the current ratio, the more capable the company is of paying its obligations as it has a larger proportion of assets relative to its liabilities.

36
Cost of Hospital Services California Hospital Medical Center’s operating cost of services includes both inpatient and outpatient care. In FY 2017, 74% of total costs were associated with Medi-Cal, 16% with Medicare and 7% with Third-Party.
CALIFORNIA HOSPITAL MEDICAL CENTER OPERATING EXPENSES BY PAYER CATEGORY FY 2013 - FY 20171
FY 2013 FY 2014 FY 2015 FY 2016 FY 2017 Operating Expenses $331,006,165 $327,098,283 $404,650,357 $415,738,707 $408,815,484 Cost of Services By Payer: Medicare $50,492,140 $55,823,894 $65,958,299 $57,948,546 $67,431,424 Medi-Cal $189,092,630 $210,279,105 $286,872,058 $301,736,436 $304,317,796 County Indigent $6,178,311 $10,387,800 $1,474,446 $1,352,973 $0 Third-Party $34,501,641 $17,815,430 $29,890,630 $29,841,099 $28,105,354 Other Indigent $35,262,044 $23,838,710 $14,771,004 $18,935,755 $4,411,836 All Other Payers $15,479,400 $8,953,344 $5,683,921 $5,923,898 $4,549,073 Source: OSHPD Disclosure Reports, FY 2013 - 2017 1 FY 2013 to FY 2016 data is from audited OSHPD Disclosure Reports whereas FY 2017 is from unaudited.
Charity Care The following table shows a comparison of charity care and bad debt for California Hospital Medical Center to all general acute care hospitals in the State of California. The five-year (FY 2013 – FY 2017) average of charity care and bad debt, as a percentage of gross patient revenue, was 8.1% and greater than the four-year statewide average of 2.5%. According to OSHPD, “…the determination of what is classified as charity care can be made by establishing whether or not the patient has the ability to pay. The patient’s accounts receivable must be written off as bad debt if the patient has the ability but is unwilling to pay off the account.”
CALIFORNIA HOSPITAL MEDICAL CENTER CHARITY CARE COMPARISON FY 2013 - FY 20171 (In Thousands)
FY 2013 FY 2014 FY 2015 FY 2016 FY 2017
Hospital CA Hospital CA Hospital CA Hospital CA Hospital CA 2 Gross Patient Revenue $1,027,686 $320,382,471 $1,114,009 $338,322,364 $1,285,261 $365,501,463 $1,372,388 $396,427,743 $1,450,997 -
Charity $121,396 $6,563,487 $91,975 $5,113,965 $58,613 $3,441,227 $79,644 $3,457,868 $26,276 -
Bad Debt $36,394 $5,891,632 $19,643 $4,365,936 $9,294 $3,262,642 $12,434 $3,108,971 $16,299 -
Total Charity & Bad Debt $157,790 $12,455,119 $111,617 $9,479,902 $67,907 $6,703,869 $92,078 $6,566,839 $42,575 -
Charity Care as a % of Gross Patient Revenue 11.8% 2.0% 8.3% 1.5% 4.6% 0.9% 5.8% 0.9% 1.8% -
Bad Debt as a % of Gross Patient Revenue 3.5% 1.8% 1.8% 1.3% 0.7% 0.9% 0.9% 0.8% 1.1% -
Total as a % of Gross Patient Revenue 15.4% 3.9% 10.0% 2.8% 5.3% 1.8% 6.7% 1.7% 2.9% -
Uncompensated Care
Cost to Charge Ratio 30.7% 24.5% 28.0% 23.6% 29.8% 24.1% 28.6% 23.8% 26.5% -
Charity $37,234 $1,608,711 $25,727 $1,207,919 $17,473 $828,647 $22,791 $822,627 $6,965 -
Bad Debt $11,162 $1,444,039 $5,494 $1,031,234 $2,771 $785,644 $3,558 $739,624 $4,321 -
Total $48,396 $3,052,750 $31,221 $2,239,153 $20,244 $1,614,292 $26,349 $1,562,251 $11,286 -
Source: OSHPD Disclosure Reports FY 2013 - FY 2017 1 FY 2013 to FY 2016 data is from audited OSHPD Disclosure Reports whereas FY 2017 is from unaudited. 2 FY 2017 California data was not available when the data was collected to prepare this report.

37
The following table shows the Hospital’s historical costs for charity care as reported to OSHPD. Charity care costs have decreased from $37.2 million in FY 2013 to $7.0 million in FY 2017. The average cost of charity care for the last five-year period was $22.0 million, while the three-year average, the cost of charity care was $15.7 million.
CALIFORNIA HOSPITAL MEDICAL CENTER
COST OF CHARITY CARE FY 2013 - FY 20171
Year Charity Care
Charges
Cost to Charge
Ratio
Cost of Charity Care
to the Hospital
FY 2017 $26,275,979 26.5% $6,965,054
FY 2016 $79,643,916 28.6% $22,791,209
FY 2015 $58,612,893 29.8% $17,472,988
FY 2014 $91,974,595 28.0% $25,726,603
FY 2013 $121,396,051 30.7% $37,233,631
FY 2015 - FY 2017 Average $15,743,084
FY 2013 - FY 2017 Average $22,037,897
Source: OSHPD Disclosure Reports FY 2013 - FY 2017 1 FY 2013 to FY 2016 data is from audited OSHPD Disclosure Reports whereas FY 2017 is from unaudited.
In the application to the California Attorney General, Dignity Health reported the following combined distribution of charity care costs by inpatient, outpatient, and emergency room costs in the table below.
CALIFORNIA HOSPITAL MEDICAL CENTER COST OF CHARITY CARE BY SERVICE FY 2013 - FY 2017
Inpatient Outpatient Emergency
Room Total Costs FY 2017: Cost of Charity $2,599,213 $1,785,739 $2,063,124 $6,448,076 Visits/Discharges 190 965 2,525 FY 2016: Cost of Charity $5,486,986 $2,797,450 $3,213,078 $11,497,514 Visits/Discharges 444 1,681 4,364 FY 2015: Cost of Charity $6,831,783 $5,725,557 $6,217,442 $18,774,782 Visits/Discharges 531 3,264 8,475 FY 2014: Cost of Charity $15,685,253 $3,747,615 $4,013,459 $23,446,327 Visits/Discharges 1,401 2,398 6,060 FY 2013: Cost of Charity $25,168,701 $3,458,853 $4,207,495 $32,835,049 Visits/Discharges 2,554 2,645 6,439 Source: Dignity Health

38
Note that these totals are different than what Dignity Health reported to OSHPD. However, after discussions with JD Healthcare Inc and Vizient Inc, Dignity Health has acknowledged that an error was made in its calculation of charity care cost. Dignity Health has stated that they will comply with the charity care cost amounts determined in the manner above. Community Benefit Services In the last five years, California Hospital Medical Center has provided a significant contribution for community benefit services. As shown in the table below, the average annual cost of community benefit services over the last three years has been $14.7 million. The average annual cost of community benefit services over the last five years has been $17.2 million.
CALIFORNIA HOSPITAL MEDICAL CENTER
COMMUNITY BENEFIT SERVICES FY 2013 - FY 2017
Community Benefit Programs FY 2013 FY 2014 FY 2015 FY 2016 FY 2017
FY 2015 - FY 2017 Average
FY 2013 - FY 2017 Average
Benefits for Living in Poverty $20,586,076 $8,558,389 $24,666,333 $5,785,797 $4,737,333 $11,729,821 $12,866,786 Benefits for Broader Community $7,135,546 $2,580,447 $4,512,169 $5,355,684 $6,348,941 $5,405,598 $5,186,557
Totals $27,721,622 $11,138,836 $29,178,502 $11,141,481 $11,086,274 $16,065,005 $18,316,644
Medi-Cal Provider Fee CHFT Grant Expense ($1,063,251) ($486,136) ($2,474,039) ($736,278) ($1,014,852) - -
Adjusted Totals $26,658,371 $10,652,700 $26,704,463 $10,405,203 $10,071,422 $14,656,615 $17,161,733 Source: Dignity Health, California Hospital Medical Center’s Community Benefit Reports and Plans
● The Hospital’s five-year average cost of community benefit services for persons living in poverty is $12.9 million per year;
● The Hospital’s five-year average cost of community benefit services for the broader community is $5.2 million per year; and
● Over the five-year period, the Hospital’s adjusted total cost of community benefit services decreased from $26.7 million per year in FY 2013 to $10 million per year in FY 2017.

39
The Hospital’s community benefit services over the past five fiscal years included the following programs with costs $10,000 in FY 2017:
CALIFORNIA HOSPITAL MEDICAL CENTER
COST OF COMMUNITY BENEFIT SERVICES FY 2013 - FY 2017 Services over $10,000 in cost in FY 2017: FY 2013 FY 2014 FY 2015 FY 2016 FY 2017 Community Benefit Programs Development $160,200 $159,125 $157,234 $158,260 $151,216 Community Benefit Programs Management $144,342 $149,152 $129,502 $125,575 $119,024 Community Dental Partnership - Oral Hygiene Class $9,028 $13,549 $8,173 $8,127 $5,683 Community Dental Partnership - Care Coordination $29,997 $55,115 $67,773 $52,028 $30,223 Dignity Health Community Grants Program - - - $158,332 $340,857 Grants on Community Education for Children and Families (incl. Hope Street Family Center programs) $2,953,818 $3,563,887 $3,771,492 $4,370,060 $2,888,412 Health Education - Korean Health Education Program Coordination - - - - $32,121 Health Ministry - Blood Pressure Screening $10,917 $10,593 $10,084 $10,359 $10,912 Health Ministry - Cholesterol Screening1 $9,535 $10,593 $10,128 $10,359 $8,162 Health Ministry - Comm Health Education Coordination $98,830 $120,807 $116,775 $138,573 $133,196 Health Ministry - Diabetes Glucose Screening $10,400 $10,593 $10,276 $10,359 $10,912 Health Ministry - Hemoglobin Screening $9,107 $10,593 $10,128 $10,359 $10,842 Health Ministry - Parish Nurse Health Ministry Coordinator $42,354 $24,127 $14,440 $20,592 $24,152 Health Ministry - Your Body Weight and Body Mass Index $8,784 $10,593 $10,128 $10,359 $10,912 Heart HELP - Initial and Follow Up Screenings $8,794 $10,050 $8,425 $11,901 $14,519 Heart HELP CVD - Program Implementation $90,448 $74,390 $90,692 $72,765 $81,301 LTIP 2013 - Heart HELP (CVD) $13,655 $16,337 $15,722 $17,078 $17,542 Residency Program $3,286,475 $3,657,158 $3,545,731 $4,535,780 $5,965,674 Transportation-Vans, & Bus Tokens - - - $256,026 $196,790 Type 2 Diabetes Intake-A1c hemoglobin and total cholesterol $8,948 $10,593 $10,128 $10,359 $10,659 Source: Dignity Health 1 Program commitment under $10,000 in cost in FY 2017
● Community Benefit Programs Development: Expenses incurred by contracting with
outside consultants for triannual Community Health Needs Assessment and/or grant-
writing services;
● Community Benefit Programs Management: Funding for community health operations
staff that includes the community health manager, parish nurse, and two promotoras;
● Community Dental Partnership - Care Coordination: As part of the Community Dental
Partnership grant that ended 6/30/17, provided care coordination for uninsured
patients who had medication-dependent type 2 diabetes and who were referred to the
program by their medical home for free basic dental and periodontal services;
● Grants on Community Education for Children and Families (including Hope Street Family
Center programs): The Hospital actively partners with nonprofit organizations to
improve health status and quality of life in the communities served. Grant funds are
used to deliver services and strengthen service systems, to improve the health and well-
being of vulnerable populations and reduce disparities, guided by significant needs
identified in the hospital's community health needs assessment;

40
● Health Education – Korean Health Education Program: Grant-funded program to provide
health education services for the Korean-speaking community in California Hospital
Medical Center’s service area;
● Health Ministry – Blood Pressure Screening: Parish nurse screens for chronic
hypertension at over 60 locations in the service area;
● Health Ministry – Cholesterol Screening: Parish nurse screens for hyperlipidemia at over
60 sites in the service area;
● Health Ministry – Community Health Education Coordination: Parish nurse from the
Health Ministry program refers people with a variety of chronic conditions to California
Hospital Medical Center’s health education programs as well as those of community
partners;
● Health Ministry - Diabetes Glucose Screening: Parish nurse from the Health Ministry
program screens for type 2 diabetes in over 60 sites in California Hospital Medical
Center’s service area;
● Health Ministry – Hemoglobin Screening: A parish nurse from the Health Ministry
program screens for anemia in over 60 sites in California Hospital Medical Center’s
service area;
● Health Ministry - Parish Nurse Health Ministry Coordinator: A parish nurse from the
Health Ministry program works with the Health Cabinetes of various congregations in
California Hospital Medical Center’s service area;
● Health Ministry - Your Body Weight and Body Mass Index: A parish nurse from the
Health Ministry program screens for overweight/obesity;
● Heart HELP - Initial and Follow Up Screenings: A promotoras offers a series of weekly
workshops on cardiovascular disease, and the parish nurse from the Health Ministry
program performs initial and follow-up health screens before and after the workshop
series to assess the outcome of this intervention program;
● Heart HELP CVD - Program Implementation: Provides a series of weekly workshops on
cardiovascular disease, including heart failure;
● Residency Program: A Family Medicine Residency program;

41
● Transportation – Vans & Bus Tokens: A service that provides vans, bus tokens and taxi
vouchers for vulnerable clients requiring a ride home from the Hospital or emergency
department; and
● Type 2 Diabetes Intake-A1c hemoglobin and total cholesterol: A Parish Nurses performs
initial and follow up health screens for participants.
Reproductive Health For CY 2016, California Hospital Medical Center reported 130 inpatient discharges related to reproductive health services26. The following table lists reproductive services by diagnostic related group discharges (DRG) for CY 2016.
CALIFORNIA HOSPITAL MEDICAL CENTER CY 2016 REPRODUCTIVE SERVICE BY DIAGNOSTIC RELATED GROUP
Discharges 778-Threatened Abortion 46 777-Ectopic Pregnancy 25 770-Abortion W D&C1, Aspiration Curettage or Hysterotomy 21 779-Abortion W/O D&C1 21 767-Vaginal Delivery W Sterilization &/Or D&C1 17 Total Discharges: 130 Source: CY 2016 OSHPD Patient Discharge Database
1 D&C is an abbreviation for Dilation and Curettage
● Out of the five diagnostic related groups, DRG 778-Threatened Abortion has the highest
number of reproductive service inpatient discharges.
26 California Hospital Medical Center is not a Catholic hospital and is not subject to the Catholic ERDs.

42
According to Dignity Health representatives, the table indicates whether the Hospital performs the following women’s reproductive health services.
CALIFORNIA HOSPITAL MEDICAL CENTER REPRODUCTIVE SERVICES
Procedure Currently Performed?
(Y/N) Caesarean delivery with sterilization Yes Terminate pregnancy when:
A. Placenta previa No B. Premature rupture of membranes No (It's done when the Mother's life/safety
is compromised such as infection) C. Second trimester bleeding with previable fetus No (It's done when the Mother's life/safety
is compromised) Placement of an IUD at time of other gynecological surgery No Postpartum placement of IUD No Gender affirming surgery No Emergency contraception as emergency room or inpatient service No Ectopic pregnancy treatment with methotrexate (medication in lieu of surgery) Yes, it's done in the emergency department Source: Dignity Health

43
Analysis of California Hospital Medical Center Service Area Definition California Hospital Medical Center’s service area is comprised of 33 ZIP Codes from which 76% of its discharges originated in CY 2016. Approximately 50% of the Hospital’s discharges originated from the top nine ZIP Codes, all of which are in the City of Los Angeles. In CY 2016, the Hospital’s market share in the service area was 9.3%.
CALIFORNIA HOSPITAL MEDICAL CENTER PATIENT ORIGIN CY 2016
ZIP Codes Community Total
Discharges % of
Discharges Cumulative % of
Discharges Total Area Discharges
Market Share
90011 Los Angeles 2,219 11.7% 11.7% 10,289 21.6% 90037 Los Angeles 1,890 10.0% 21.7% 7,546 25.0% 90044 Los Angeles 1,095 5.8% 27.4% 12,188 9.0% 90003 Los Angeles 1,009 5.3% 32.7% 8,307 12.1% 90018 Los Angeles 773 4.1% 36.8% 6,081 12.7% 90062 Los Angeles 701 3.7% 40.5% 3,935 17.8% 90007 Los Angeles 694 3.7% 44.2% 3,146 22.1% 90006 Los Angeles 668 3.5% 47.7% 5,484 12.2% 90047 Los Angeles 455 2.4% 50.1% 6,944 6.6% 90015 Los Angeles 452 2.4% 52.5% 1,917 23.6% 90043 Los Angeles 431 2.3% 54.7% 6,403 6.7% 90001 Los Angeles 426 2.2% 57.0% 6,129 7.0% 90016 Los Angeles 392 2.1% 59.0% 5,956 6.6% 90002 Los Angeles 383 2.0% 61.1% 5,983 6.4% 90019 Los Angeles 340 1.8% 62.9% 6,177 5.5% 90008 Los Angeles 298 1.6% 64.4% 4,261 7.0% 90013 Los Angeles 281 1.5% 65.9% 3,014 9.3% 90059 Los Angeles 204 1.1% 67.0% 5,717 3.6% 90057 Los Angeles 192 1.0% 68.0% 5,687 3.4% 90061 Los Angeles 186 1.0% 69.0% 3,777 4.9% 90255 Huntington Park 183 1.0% 69.9% 6,210 2.9% 90026 Los Angeles 178 0.9% 70.9% 4,948 3.6% 90004 Los Angeles 150 0.8% 71.7% 4,911 3.1% 90014 Los Angeles 147 0.8% 72.4% 1,426 10.3% 90302 Inglewood 121 0.6% 73.1% 3,219 3.8% 90017 Los Angeles 121 0.6% 73.7% 2,261 5.4% 90005 Los Angeles 101 0.5% 74.2% 2,763 3.7% 90020 Los Angeles 99 0.5% 74.8% 2,779 3.6% 90021 Los Angeles 55 0.3% 75.1% 547 10.1% 90058 Los Angeles 53 0.3% 75.3% 419 12.6% 90305 Inglewood 47 0.2% 75.6% 1,844 2.5% 90012 Los Angeles 42 0.2% 75.8% 3,368 1.2% 90036 Los Angeles 34 0.2% 76.0% 3,178 1.1%
Subtotal 14,420 76.0% 76.0% 156,814 9.2%
Other ZIP Codes 4,557 24.0% 100.0%
Total Discharges 18,977 100.0%
Note: Excludes normal newborns Source: CY 2016 OSHPD Patient Discharge Database

44
Service Area Map California Hospital Medical Center’s service area has approximately 1.5 million residents. There are eight other hospitals located within California Hospital Medical Center’s service area: Good Samaritan Hospital, St. Vincent Medical Center, Silver Lake Medical Center, Temple Community Hospital, Los Angeles Metropolitan Medical Center, Olympia Medical Center, Community Hospital of Huntington Park, and Martin Luther King Jr. Community Hospital. There are 18 other hospitals located within approximately 15 miles from California Hospital Medical Center. California Hospital Medical Center is the inpatient market share leader in the service area.

45
Hospital Market Share
The table below provides the market share of inpatient discharges by individual hospital within California Hospital Medical Center’s service area from CY 2013 to CY 2016.
CALIFORNIA HOSPITAL MEDICAL CENTER SERVICE AREA MARKET SHARE BY HOSPITAL CY 2013 – CY 2016
Hospital CY 2013 CY 2014 CY 2015 CY 2016 Trend
California Hospital Medical Center 9.0% 9.0% 9.3% 9.3% ↗ LAC+USC Medical Center 7.1% 7.4% 6.7% 7.2% → Cedars Sinai Medical Center 6.6% 6.2% 6.6% 6.7% → Centinela Hospital Medical Center 6.9% 7.2% 6.5% 6.1% ↘ Good Samaritan Hospital-Los Angeles 5.8% 5.9% 5.4% 4.9% ↘ St. Francis Medical Center 4.5% 4.6% 4.4% 4.4% → St. Vincent Medical Center 3.1% 3.1% 3.7% 4.2% ↗ Hollywood Presbyterian Medical Center 4.4% 4.3% 4.2% 4.1% ↘ Adventist Health White Memorial 3.4% 3.3% 3.2% 3.2% ↘ Kaiser Foundation Hospital - Los Angeles 3.2% 3.2% 3.1% 3.1% → LAC/Harbor-UCLA Medical Center 3.5% 3.3% 3.0% 3.0% ↘ Martin Luther King, Jr. Community Hospital 0.0% 0.0% 0.7% 3.0% ↗ Kaiser Foundation Hospital - West LA 4.0% 4.0% 3.9% 2.8% ↘ Children's Hospital of Los Angeles 2.4% 2.5% 2.6% 2.6% → Southern California Hospital at Culver City 2.4% 2.7% 2.6% 2.3% ↘ Olympia Medical Center 1.7% 1.6% 2.4% 2.3% ↗ Pacific Alliance Medical Center¹ 2.6% 2.6% 2.5% 2.1% ↘ Community Hospital of Huntington Park 1.8% 1.5% 1.4% 1.4% ↘ Silver Lake Medical Center 0.6% 0.6% 0.9% 1.4% ↗ Memorial Hospital of Gardena 1.3% 1.5% 1.4% 1.4% → All Other 25.7% 25.6% 25.5% 24.6% ↘
Total Percentage 100% 100% 100% 100%
Total Discharges 150,693 150,246 153,229 156,814 ↗ Source: OSHPD Discharge Database, CY 2013 – CY 2016 Note: Excludes normal newborns ¹ Pacific Alliance Medical Center closed on 12/31/2017
● The number of discharges in California Hospital Medical Center’s service area has
increased by 4.1% from approximately 151,000 inpatient discharges in CY 2013 to nearly 157,000 discharges in CY 2016;
● From CY 2013 to CY 2016, California Hospital Medical Center consistently ranked first in terms of overall market share for its service area based on inpatient discharges (9.3% in 2016); and
● In CY 2016, LAC + USC Medical Center ranked second in market share (7.2%) followed by Cedars Sinai Medical Center (6.7%).
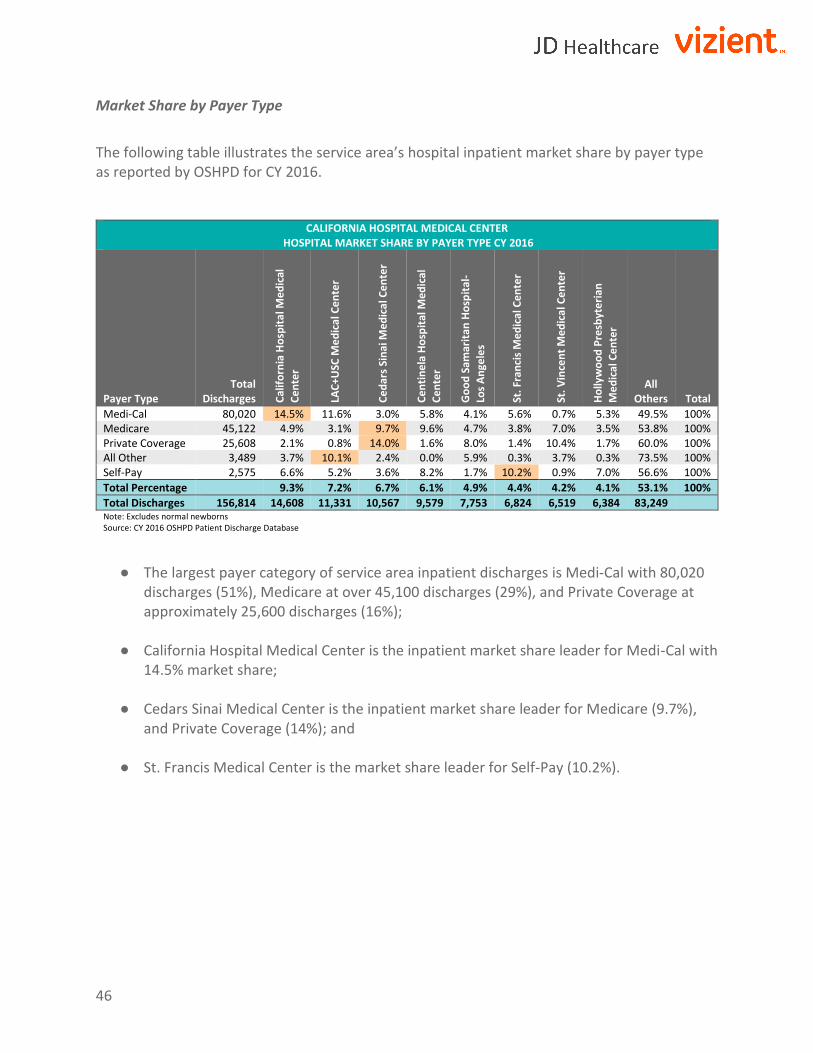
46
Market Share by Payer Type
The following table illustrates the service area’s hospital inpatient market share by payer type as reported by OSHPD for CY 2016.
CALIFORNIA HOSPITAL MEDICAL CENTER
HOSPITAL MARKET SHARE BY PAYER TYPE CY 2016
Payer Type
Total Discharges C
alif
orn
ia H
osp
ita
l Me
dic
al
Ce
nte
r
LA
C+U
SC M
ed
ical
Ce
nte
r
Ce
dar
s Si
nai
Me
dic
al C
en
ter
Ce
nti
ne
la H
osp
ital
Me
dic
al
Ce
nte
r
Go
od
Sam
arit
an H
osp
ital
-
Lo
s A
nge
les
St.
Fra
nci
s M
ed
ical
Ce
nte
r
St.
Vin
cen
t M
ed
ica
l Ce
nte
r
Ho
llyw
oo
d P
resb
yte
rian
M
ed
ical
Ce
nte
r
All Others Total
Medi-Cal 80,020 14.5% 11.6% 3.0% 5.8% 4.1% 5.6% 0.7% 5.3% 49.5% 100%
Medicare 45,122 4.9% 3.1% 9.7% 9.6% 4.7% 3.8% 7.0% 3.5% 53.8% 100%
Private Coverage 25,608 2.1% 0.8% 14.0% 1.6% 8.0% 1.4% 10.4% 1.7% 60.0% 100%
All Other 3,489 3.7% 10.1% 2.4% 0.0% 5.9% 0.3% 3.7% 0.3% 73.5% 100%
Self-Pay 2,575 6.6% 5.2% 3.6% 8.2% 1.7% 10.2% 0.9% 7.0% 56.6% 100%
Total Percentage 9.3% 7.2% 6.7% 6.1% 4.9% 4.4% 4.2% 4.1% 53.1% 100%
Total Discharges 156,814 14,608 11,331 10,567 9,579 7,753 6,824 6,519 6,384 83,249 Note: Excludes normal newborns Source: CY 2016 OSHPD Patient Discharge Database
● The largest payer category of service area inpatient discharges is Medi-Cal with 80,020 discharges (51%), Medicare at over 45,100 discharges (29%), and Private Coverage at approximately 25,600 discharges (16%);
● California Hospital Medical Center is the inpatient market share leader for Medi-Cal with 14.5% market share;
● Cedars Sinai Medical Center is the inpatient market share leader for Medicare (9.7%), and Private Coverage (14%); and
● St. Francis Medical Center is the market share leader for Self-Pay (10.2%).
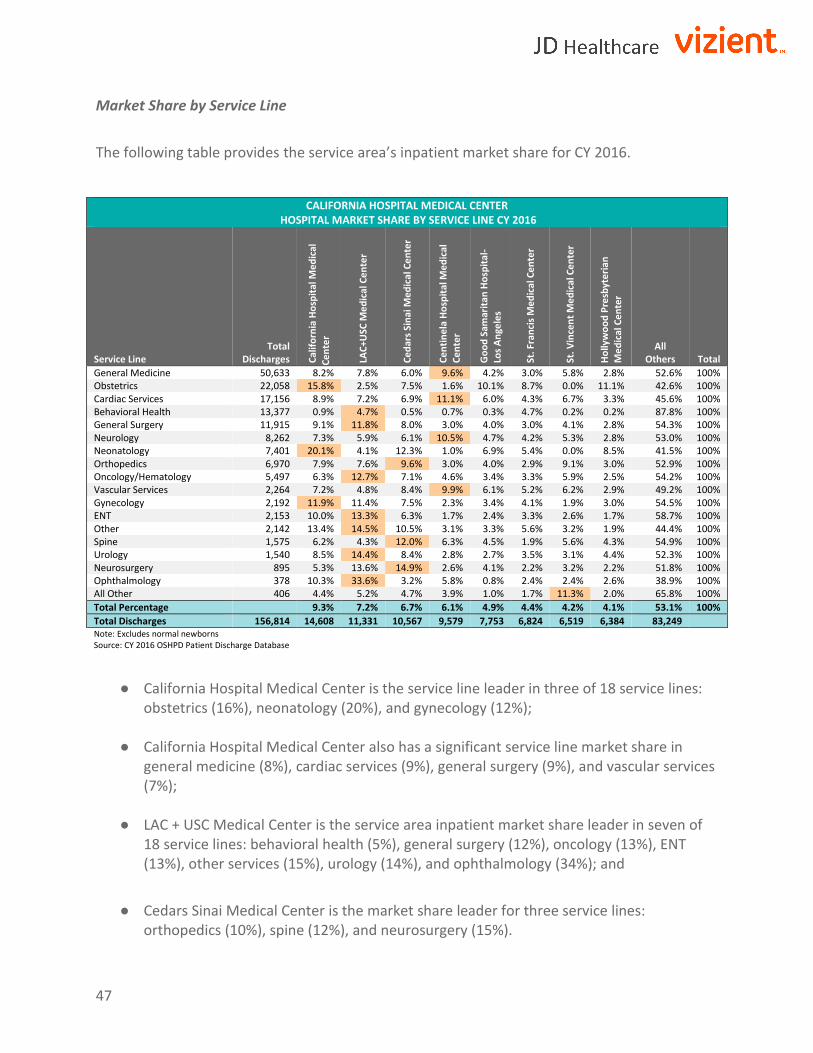
47
Market Share by Service Line
The following table provides the service area’s inpatient market share for CY 2016.
CALIFORNIA HOSPITAL MEDICAL CENTER
HOSPITAL MARKET SHARE BY SERVICE LINE CY 2016
Service Line
Total Discharges C
alif
orn
ia H
osp
ital
Me
dic
al
Ce
nte
r
LA
C+U
SC M
ed
ical
Ce
nte
r
Ce
dar
s Si
nai
Me
dic
al C
en
ter
Ce
nti
ne
la H
osp
ital
Me
dic
al
Ce
nte
r
Go
od
Sam
arit
an H
osp
ital
- L
os
An
gele
s
St.
Fra
nci
s M
ed
ical
Ce
nte
r
St.
Vin
cen
t M
ed
ical
Ce
nte
r
Ho
llyw
oo
d P
resb
yte
rian
M
ed
ical
Ce
nte
r
All Others Total
General Medicine 50,633 8.2% 7.8% 6.0% 9.6% 4.2% 3.0% 5.8% 2.8% 52.6% 100%
Obstetrics 22,058 15.8% 2.5% 7.5% 1.6% 10.1% 8.7% 0.0% 11.1% 42.6% 100%
Cardiac Services 17,156 8.9% 7.2% 6.9% 11.1% 6.0% 4.3% 6.7% 3.3% 45.6% 100%
Behavioral Health 13,377 0.9% 4.7% 0.5% 0.7% 0.3% 4.7% 0.2% 0.2% 87.8% 100%
General Surgery 11,915 9.1% 11.8% 8.0% 3.0% 4.0% 3.0% 4.1% 2.8% 54.3% 100%
Neurology 8,262 7.3% 5.9% 6.1% 10.5% 4.7% 4.2% 5.3% 2.8% 53.0% 100%
Neonatology 7,401 20.1% 4.1% 12.3% 1.0% 6.9% 5.4% 0.0% 8.5% 41.5% 100%
Orthopedics 6,970 7.9% 7.6% 9.6% 3.0% 4.0% 2.9% 9.1% 3.0% 52.9% 100%
Oncology/Hematology 5,497 6.3% 12.7% 7.1% 4.6% 3.4% 3.3% 5.9% 2.5% 54.2% 100%
Vascular Services 2,264 7.2% 4.8% 8.4% 9.9% 6.1% 5.2% 6.2% 2.9% 49.2% 100%
Gynecology 2,192 11.9% 11.4% 7.5% 2.3% 3.4% 4.1% 1.9% 3.0% 54.5% 100%
ENT 2,153 10.0% 13.3% 6.3% 1.7% 2.4% 3.3% 2.6% 1.7% 58.7% 100%
Other 2,142 13.4% 14.5% 10.5% 3.1% 3.3% 5.6% 3.2% 1.9% 44.4% 100%
Spine 1,575 6.2% 4.3% 12.0% 6.3% 4.5% 1.9% 5.6% 4.3% 54.9% 100%
Urology 1,540 8.5% 14.4% 8.4% 2.8% 2.7% 3.5% 3.1% 4.4% 52.3% 100%
Neurosurgery 895 5.3% 13.6% 14.9% 2.6% 4.1% 2.2% 3.2% 2.2% 51.8% 100%
Ophthalmology 378 10.3% 33.6% 3.2% 5.8% 0.8% 2.4% 2.4% 2.6% 38.9% 100%
All Other 406 4.4% 5.2% 4.7% 3.9% 1.0% 1.7% 11.3% 2.0% 65.8% 100%
Total Percentage 9.3% 7.2% 6.7% 6.1% 4.9% 4.4% 4.2% 4.1% 53.1% 100%
Total Discharges 156,814 14,608 11,331 10,567 9,579 7,753 6,824 6,519 6,384 83,249 Note: Excludes normal newborns
Source: CY 2016 OSHPD Patient Discharge Database
● California Hospital Medical Center is the service line leader in three of 18 service lines: obstetrics (16%), neonatology (20%), and gynecology (12%);
● California Hospital Medical Center also has a significant service line market share in
general medicine (8%), cardiac services (9%), general surgery (9%), and vascular services (7%);
● LAC + USC Medical Center is the service area inpatient market share leader in seven of
18 service lines: behavioral health (5%), general surgery (12%), oncology (13%), ENT (13%), other services (15%), urology (14%), and ophthalmology (34%); and
● Cedars Sinai Medical Center is the market share leader for three service lines: orthopedics (10%), spine (12%), and neurosurgery (15%).
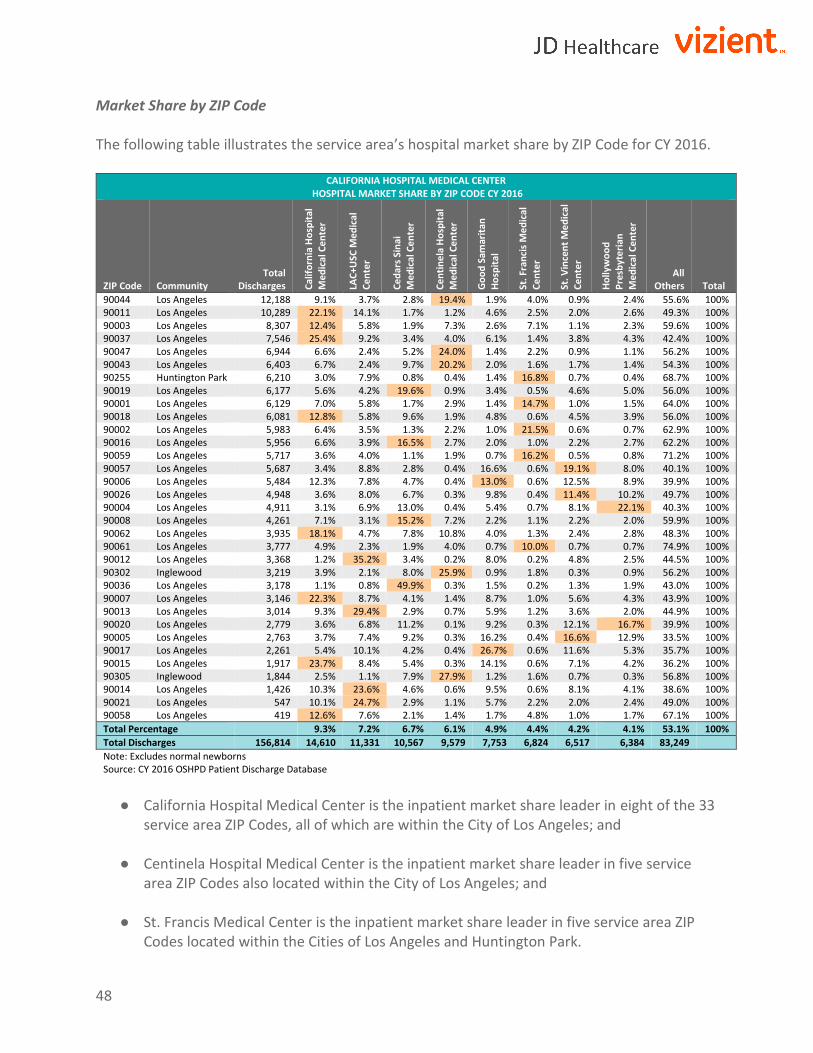
48
Market Share by ZIP Code The following table illustrates the service area’s hospital market share by ZIP Code for CY 2016.
CALIFORNIA HOSPITAL MEDICAL CENTER
HOSPITAL MARKET SHARE BY ZIP CODE CY 2016
ZIP Code Community Total
Discharges Cal
ifo
rnia
Ho
spit
al
Me
dic
al C
en
ter
LA
C+U
SC M
ed
ical
C
en
ter
Ce
dar
s Si
nai
M
ed
ical
Ce
nte
r
Ce
nti
ne
la H
osp
ital
M
ed
ical
Ce
nte
r
Go
od
Sam
arit
an
Ho
spit
al
St.
Fra
nci
s M
ed
ical
Ce
nte
r
St.
Vin
cen
t M
ed
ical
C
en
ter
Ho
llyw
oo
d
Pre
sbyt
eri
an
Me
dic
al C
en
ter
All Others Total
90044 Los Angeles 12,188 9.1% 3.7% 2.8% 19.4% 1.9% 4.0% 0.9% 2.4% 55.6% 100%
90011 Los Angeles 10,289 22.1% 14.1% 1.7% 1.2% 4.6% 2.5% 2.0% 2.6% 49.3% 100%
90003 Los Angeles 8,307 12.4% 5.8% 1.9% 7.3% 2.6% 7.1% 1.1% 2.3% 59.6% 100%
90037 Los Angeles 7,546 25.4% 9.2% 3.4% 4.0% 6.1% 1.4% 3.8% 4.3% 42.4% 100%
90047 Los Angeles 6,944 6.6% 2.4% 5.2% 24.0% 1.4% 2.2% 0.9% 1.1% 56.2% 100%
90043 Los Angeles 6,403 6.7% 2.4% 9.7% 20.2% 2.0% 1.6% 1.7% 1.4% 54.3% 100%
90255 Huntington Park 6,210 3.0% 7.9% 0.8% 0.4% 1.4% 16.8% 0.7% 0.4% 68.7% 100%
90019 Los Angeles 6,177 5.6% 4.2% 19.6% 0.9% 3.4% 0.5% 4.6% 5.0% 56.0% 100%
90001 Los Angeles 6,129 7.0% 5.8% 1.7% 2.9% 1.4% 14.7% 1.0% 1.5% 64.0% 100%
90018 Los Angeles 6,081 12.8% 5.8% 9.6% 1.9% 4.8% 0.6% 4.5% 3.9% 56.0% 100%
90002 Los Angeles 5,983 6.4% 3.5% 1.3% 2.2% 1.0% 21.5% 0.6% 0.7% 62.9% 100%
90016 Los Angeles 5,956 6.6% 3.9% 16.5% 2.7% 2.0% 1.0% 2.2% 2.7% 62.2% 100%
90059 Los Angeles 5,717 3.6% 4.0% 1.1% 1.9% 0.7% 16.2% 0.5% 0.8% 71.2% 100%
90057 Los Angeles 5,687 3.4% 8.8% 2.8% 0.4% 16.6% 0.6% 19.1% 8.0% 40.1% 100%
90006 Los Angeles 5,484 12.3% 7.8% 4.7% 0.4% 13.0% 0.6% 12.5% 8.9% 39.9% 100%
90026 Los Angeles 4,948 3.6% 8.0% 6.7% 0.3% 9.8% 0.4% 11.4% 10.2% 49.7% 100%
90004 Los Angeles 4,911 3.1% 6.9% 13.0% 0.4% 5.4% 0.7% 8.1% 22.1% 40.3% 100%
90008 Los Angeles 4,261 7.1% 3.1% 15.2% 7.2% 2.2% 1.1% 2.2% 2.0% 59.9% 100%
90062 Los Angeles 3,935 18.1% 4.7% 7.8% 10.8% 4.0% 1.3% 2.4% 2.8% 48.3% 100%
90061 Los Angeles 3,777 4.9% 2.3% 1.9% 4.0% 0.7% 10.0% 0.7% 0.7% 74.9% 100%
90012 Los Angeles 3,368 1.2% 35.2% 3.4% 0.2% 8.0% 0.2% 4.8% 2.5% 44.5% 100%
90302 Inglewood 3,219 3.9% 2.1% 8.0% 25.9% 0.9% 1.8% 0.3% 0.9% 56.2% 100%
90036 Los Angeles 3,178 1.1% 0.8% 49.9% 0.3% 1.5% 0.2% 1.3% 1.9% 43.0% 100%
90007 Los Angeles 3,146 22.3% 8.7% 4.1% 1.4% 8.7% 1.0% 5.6% 4.3% 43.9% 100%
90013 Los Angeles 3,014 9.3% 29.4% 2.9% 0.7% 5.9% 1.2% 3.6% 2.0% 44.9% 100%
90020 Los Angeles 2,779 3.6% 6.8% 11.2% 0.1% 9.2% 0.3% 12.1% 16.7% 39.9% 100%
90005 Los Angeles 2,763 3.7% 7.4% 9.2% 0.3% 16.2% 0.4% 16.6% 12.9% 33.5% 100%
90017 Los Angeles 2,261 5.4% 10.1% 4.2% 0.4% 26.7% 0.6% 11.6% 5.3% 35.7% 100%
90015 Los Angeles 1,917 23.7% 8.4% 5.4% 0.3% 14.1% 0.6% 7.1% 4.2% 36.2% 100%
90305 Inglewood 1,844 2.5% 1.1% 7.9% 27.9% 1.2% 1.6% 0.7% 0.3% 56.8% 100%
90014 Los Angeles 1,426 10.3% 23.6% 4.6% 0.6% 9.5% 0.6% 8.1% 4.1% 38.6% 100%
90021 Los Angeles 547 10.1% 24.7% 2.9% 1.1% 5.7% 2.2% 2.0% 2.4% 49.0% 100%
90058 Los Angeles 419 12.6% 7.6% 2.1% 1.4% 1.7% 4.8% 1.0% 1.7% 67.1% 100%
Total Percentage 9.3% 7.2% 6.7% 6.1% 4.9% 4.4% 4.2% 4.1% 53.1% 100%
Total Discharges 156,814 14,610 11,331 10,567 9,579 7,753 6,824 6,517 6,384 83,249
Note: Excludes normal newborns
Source: CY 2016 OSHPD Patient Discharge Database
● California Hospital Medical Center is the inpatient market share leader in eight of the 33
service area ZIP Codes, all of which are within the City of Los Angeles; and
● Centinela Hospital Medical Center is the inpatient market share leader in five service area ZIP Codes also located within the City of Los Angeles; and
● St. Francis Medical Center is the inpatient market share leader in five service area ZIP Codes located within the Cities of Los Angeles and Huntington Park.

49
Profile of Glendale Memorial Hospital and Health Center
Overview Glendale Memorial Hospital and Health Center, located at 1420 South Central Avenue in Glendale, California, serves the residents of Glendale, La Crescenta, La Cañada, Burbank, and the eastern portion of the San Fernando Valley corridor. Six Glendale community members opened Glendale Memorial Hospital and Health Center (originally Physicians and Surgeons Hospital) as a 47 licensed bed hospital in 1926. Today, Glendale Memorial Hospital and Health Center offers a range of services including: Nine surgical operating rooms and a basic emergency department with 21 emergency treatment stations, six of which are fast track27 treatment stations. According to Glendale Memorial Hospital and Health Center’s current hospital license, it is licensed for 334 beds as shown below, however, 19 beds are in suspense
GLENDALE MEMORIAL HOSPITAL AND HEALTH CENTER LICENSED BED DISTRIBUTION
Licensed Bed Type Number of Beds1
General Acute Care Beds Perinatal2 24 Rehabilitation 14 Neonatal Intensive Care 13 Coronary Care 12 Intensive Care 12 Unspecified General Acute Care 180
Total General Acute Care Beds 255
Acute Psychiatric (D/P) 28 493
Skilled Nursing (D/P) 30
Total Licensed Beds 334 1 2018 Hospital License 2 6 Perinatal beds are being utilized as LDRP rooms 3 19 of the 49 Acute Psychiatric beds are in suspense
27 Provides emergency level medical care for patients aged two and older who have minor illnesses and injuries. 28 The Hospital is Lanterman-Petris-Short Act designated 24-hour facility to receive Welfare and Institutions Code section 5150 patients. This designation allows medical personnel to place an involuntary 72-hour hold on a person who is: a danger to themselves, a danger to others, or gravely disabled.

50
Key Statistics For FY 2017, Glendale Memorial Hospital and Health Center reported 10,030 inpatient discharges, 47,417 patient days, and an average daily census of 130 patients (approximately 39% occupancy).
GLENDALE MEMORIAL HOSPITAL AND HEALTH CENTER KEY STATISTICS FY 2015 - FY 20171
FY 2015 FY 2016 FY 2017 Inpatient Discharges 12,026 10,167 10,030 Licensed Beds 334 334 334 Patient Days 51,541 53,644 47,417 Average Daily Census 141 147 130 Occupancy 42.3% 44.0% 38.9% Average Length of Stay 4.3 5.3 4.7 Cardiac Catheterization Procedures 3,174 3,595 3,904 Emergency Service Visits 39,258 39,896 38,514 Total Live Births 1,997 1,757 1,718 Sources: OSHPD Disclosure Reports, FY 2015 - FY 2017 1 FY 2015 and FY 2016 data is from audited OSHPD Disclosure Reports whereas FY 2017 data is from unaudited.
● Since FY 2015, both inpatient discharges and patient days have decreased by approximately 17% and 8% respectively;
● Between FY 2015 and FY 2017, emergency service visits have remained relatively stable;
● In FY 2017, there were 3,904 cardiac catheterization procedures reported; and
● Between FY 2015 and FY 2017, total live births decreased by 14%, with an average of 1,824 births annually.

51
Patient Utilization Trends The following table shows FY 2013-FY 2017 volume trends at Glendale Memorial Hospital and Health Center.
GLENDALE MEMORIAL HOSPITAL AND HEALTH CENTER
SERVICE VOLUMES FY 2013 - FY 20171 PATIENT DAYS FY 2013 FY 2014 FY 2015 FY 2016 FY 2017
Medical/Surgical2 31,846 34,925 34,650 36,976 32,191
Neonatal Intensive Care 3,078 3,394 2,814 2,395 2,602
Intensive Care 5,467 4,183 5,216 5,051 4,142
Obstetrics 5,587 5,760 5,592 5,588 5,040
Physical Rehabilitation Care 2,471 2,009 3,269 3,634 3,442
Total 48,449 50,271 51,541 53,644 47,417
DISCHARGES
Medical/Surgical2 7,245 7,051 9,265 7,483 7,540
Neonatal Intensive Care 301 254 249 252 245
Intensive Care 300 508 258 266 226
Obstetrics 1,990 1,873 1,985 1,853 1,734
Physical Rehabilitation Care 178 163 269 313 285
Total 10,014 9,849 12,026 10,167 10,030
AVERAGE LENGTH OF STAY
Medical/Surgical2 4.4 5.0 3.7 4.9 4.3
Neonatal Intensive Care 10.2 13.4 11.3 9.5 10.6
Intensive Care 18.2 8.2 20.2 19.0 18.3
Obstetrics 2.8 3.1 2.8 3.0 2.9
Physical Rehabilitation Care 13.9 12.3 12.2 11.6 12.1
Total 4.8 5.1 4.3 5.3 4.7
AVERAGE DAILY CENSUS
Medical/Surgical2 87.2 95.7 94.9 101.3 88.2
Neonatal Intensive Care 8.4 9.3 7.7 6.6 7.1
Intensive Care 15.0 11.5 14.3 13.8 11.3
Obstetrics 15.3 15.8 15.3 15.3 13.8
Physical Rehabilitation Care 6.8 5.5 9.0 10.0 9.4
Total 133 138 141 147 130
OTHER SERVICES
Inpatient Surgeries 1,864 2,046 1,950 1,859 3,538
Outpatient Surgeries 3,026 2,950 2,643 2,509 3,601
Emergency Service Visits 23,078 22,503 31,956 32,635 31,928
Total Live Births 2,034 2,034 1,997 1,757 1,718
Sources: OSHPD Disclosure Reports, FY 2013 - FY 2017 1 FY 2013 to FY 2016 data is from audited OSHPD Disclosure Reports whereas FY 2017 is from unaudited. 2 Includes Definitive Observation Beds
A review of Glendale Memorial Hospital and Health Center’s historical utilization trends
between FY 2013 and FY 2017 supports the following conclusions:
● Total patient days have decreased by 2%;
● Inpatient discharges have remained relatively unchanged with the exception of FY 2015 (approximately 12,000 inpatient discharges);
● Total live births have decreased by 16% from 2,034 in FY 2013 to 1,718 in FY 2017; and ● Emergency service visits increased by nearly 27% over the five-year period to 31,928
visits in FY 2017.

52
Financial Profile
Over the last five fiscal years, Glendale Memorial Hospital and Health Center has had a negative net income ranging from a loss of $25.1 million in FY 2013 to a loss of $43.1 million in FY 2017. Between FY 2013 and FY 2017, net patient revenue and total operating revenue decreased by 4% and 7%, respectively. Over the same period, the Hospital’s operating expenses increased by 2% from $232.6 million in FY 2013 to $236.7 million in FY 2017. Other operating revenue decreased 82% over the five-year period from $6.4 million in FY 2013 to $1.2 million in FY 2017. The Hospital’s current-ratio has fluctuated over the last five years from 1.08 in FY 2013 to 1.25 in FY 2017. The California current ratio in FY 2016 was 1.56. The Hospital’s percentage of bad debt is equal to that of the state average of 0.8%.
GLENDALE MEMORIAL HOSPITAL AND HEALTH CENTER FINANCIAL AND RATIO ANALYSIS FY 2013 - FY 20171
FY 2013 FY 2014 FY 2015 FY 2016 FY 2017 Patient Days 48,449 50,271 51,541 53,644 47,417 - Discharges 10,014 9,849 12,026 10,167 10,030 - ALOS 4.8 5.1 4.3 5.3 4.7 - Net Patient Revenue $200,252,912 $173,384,636 $234,606,133 $222,702,205 $191,345,798 - Other Operating Revenue $6,433,643 $3,360,266 $2,584,065 $2,967,117 $1,189,406 - Total Operating Revenue $206,686,555 $176,744,902 $237,190,198 $225,669,322 $192,535,204 - Operating Expenses $232,602,871 $211,860,389 $252,051,087 $252,752,883 $236,662,171 - Net from Operations ($25,916,316) ($35,115,487) ($14,860,889) ($27,083,561) ($44,126,967) - Net Non-Operating Revenues and Expenses $805,653 $279,639 ($8,628,747) $466,292 $997,561 - Net Income ($25,110,663) ($34,835,848) ($23,489,636) ($26,617,269) ($43,129,406) -
2016
California Average2
Current Ratio 1.08 1.43 1.74 1.32 1.25 1.56 Days in A/R 53.8 74.5 50.5 60.6 59.6 57.1 Bad Debt Rate 3.1% 2.6% -0.3% 1.0% 0.8% 0.8% Operating Margin -12.54% -19.87% -6.27% -12.00% -22.92% 2.74%
Source: OSHPD Disclosure Reports, FY 2013 - FY 2017 1 FY 2013 to FY 2016 data is from audited OSHPD Disclosure Reports whereas FY 2017 is from unaudited. 2 FY 2017 California data was not available when the data was collected to prepare this report.

53
Cost of Hospital Services
Glendale Memorial Hospital and Health Center’s operating cost of services includes both inpatient and outpatient care. In FY 2017, 50% of total costs were associated with Medicare, 36% with Medi-Cal, and 12% with Third-Party.
GLENDALE MEMORIAL HOSPITAL AND HEALTH CENTER OPERATING EXPENSES BY PAYER CATEGORY FY 2013 - FY 20171
FY 2013 FY 2014 FY 2015 FY 2016 FY 2017 Operating Expenses $232,602,871 $211,860,389 $252,051,087 $252,752,883 $236,662,171 Cost of Services By Payer: Medicare $101,911,882 $105,331,599 $127,126,955 $125,056,802 $117,538,307 Medi-Cal $69,483,101 $71,919,484 $88,725,727 $98,192,324 $85,780,886 County Indigent $0 $0 $0 $0 $0 Third-Party $48,274,818 $24,839,724 $30,785,099 $21,979,778 $29,339,247 Other Indigent $983,706 $2,603,382 $2,909,925 $1,866,483 $781,092 All Other Payers $11,949,363 $7,166,199 $2,503,381 $5,657,495 $3,222,638 Source: OSHPD Disclosure Reports, FY 2013 - FY 2017 1 FY 2013 to FY 2016 data is from audited OSHPD Disclosure Reports whereas FY 2017 is from unaudited.
Charity Care
The following table shows a comparison of charity care and bad debt for Glendale Memorial Hospital and Health Center and all general acute care hospitals in the State of California. The five-year (FY 2013 – FY 2017) average of charity care and bad debt, as a percentage of gross patient revenue, was 3.4% and higher than the four-year statewide average of 2.5%. According to OSHPD, “…the determination of what is classified as charity care can be made by establishing whether or not the patient has the ability to pay. The patient’s accounts receivable must be written off as bad debt if the patient has the ability but is unwilling to pay off the account.”
GLENDALE MEMORIAL HOSPITAL AND HEALTH CENTER CHARITY CARE COMPARISON FY 2013 - FY 20171 (In Thousands)
FY 2013 FY 2014 FY 2015 FY 2016 FY 2017
Hospital CA Hospital CA Hospital CA Hospital CA Hospital CA 2 Gross Patient Revenue $942,833 $320,382,471 $975,478 $338,322,364 $1,010,250 $365,501,463 $1,030,178 $396,427,743 $965,496 - Charity $25,047 $6,563,487 $15,785 $5,113,965 $28,837 $3,441,227 $24,350 $3,457,868 $5,587 - Bad Debt $29,695 $5,891,632 $24,892 $4,365,936 ($3,486) $3,262,642 $10,001 $3,108,971 $8,156 -
Total Charity & Bad Debt $54,741 $12,455,119 $40,677 $9,479,902 $25,351 $6,703,869 $34,351 $6,566,839 $13,743 -
Charity Care as a % of Gross Patient Revenue 2.7% 2.0% 1.6% 1.5% 2.9% 0.9% 2.4% 0.9% 0.6% - Bad Debt as a % of Gross Patient Revenue 3.1% 1.8% 2.6% 1.3% -0.3% 0.9% 1.0% 0.8% 0.8% - Total as a % of Gross Patient Revenue 5.8% 3.9% 4.2% 2.8% 2.5% 1.8% 3.3% 1.7% 1.4% - Uncompensated Care Cost to Charge Ratio 24.0% 24.5% 21.4% 23.6% 24.7% 24.1% 24.2% 23.8% 24.4% - Charity $6,008 $1,608,711 $3,374 $1,207,919 $7,121 $828,647 $5,904 $822,627 $1,363 - Bad Debt $7,123 $1,444,039 $5,320 $1,031,234 ($861) $785,644 $2,425 $739,624 $1,989 -
Total $13,131 $3,052,750 $8,694 $2,239,153 $6,260 $1,614,292 $8,329 $1,562,251 $3,352 -
Source: OSHPD Disclosure Reports FY 2013 - FY 2017 1 FY 2013 to FY 2016 data is from audited OSHPD Disclosure Reports whereas FY 2017 is from unaudited. 2 FY 2017 California data was not available when the data was collected to prepare this report.

54
The following table shows the Hospital’s historical costs for charity care as reported to OSHPD. Charity care costs have decreased from approximately $6.0 million in FY 2013 to $1.4 million in FY 2017. The average cost of charity care for the last three-year and five-year periods was both $4.8 million.
GLENDALE MEMORIAL HOSPITAL AND HEALTH CENTER COST OF CHARITY CARE FY 2013 - FY 20171
Year
Charity Care
Charges
Cost to Charge
Ratio
Cost of Charity Care to the
Hospital
FY 2017 $5,587,190 24.4% $1,362,648
FY 2016 $24,349,949 24.2% $5,904,095
FY 2015 $28,837,088 24.7% $7,120,911
FY 2014 $15,785,073 21.4% $3,373,925
FY 2013 $25,046,765 24.0% $6,008,281
FY 2015 - FY 2017 Average $4,795,885
FY 2013 - FY 2017 Average $4,753,972
Source: OSHPD Disclosure Reports FY 2013 - FY 2017 1 FY 2013 to FY 2016 data is from audited OSHPD Disclosure Reports whereas FY 2017 is from unaudited.
In the application to the California Attorney General, Dignity Health reported the following combined distribution of charity care costs by inpatient, outpatient, and emergency room costs in the table below. Note that these totals are different than what Dignity Health reported to OSHPD.
GLENDALE MEMORIAL HOSPITAL AND HEALTH CENTER COST OF CHARITY CARE BY SERVICE FY 2013 - FY 2017
Inpatient Outpatient Emergency Room Total Costs FY 2017: Cost of Charity $803,033 $305,837 $137,393 $1,246,263 Visits/Discharges 60 247 243 FY 2016: Cost of Charity $838,900 $508,898 $210,679 $1,558,477 Visits/Discharges 63 498 396 FY 2015: Cost of Charity $1,889,089 $1,152,766 $457,732 $3,499,587 Visits/Discharges 154 1,153 865 FY 2014: Cost of Charity $1,213,941 $1,313,767 $488,270 $3,015,978 Visits/Discharges 91 1,431 841 FY 2013: Cost of Charity $2,753,731 $1,339,904 $444,756 $4,538,391 Visits/Discharges 238 1,531 825 Source: Dignity Health
Note that these totals are different than what Dignity Health reported to OSHPD. However, after discussion with JD Healthcare Inc. and Vizient Inc., Dignity Health has acknowledged that

55
an error was made in its calculation of charity care costs. Dignity Health has stated that they will comply with the charity care cost amounts determined in the manner described above.
Community Benefit Services In the last five years, Glendale Memorial Hospital and Health Center has spent a significant amount on community benefit services. As shown in the table below, the average annual cost of community benefit services over the last three years has been $1.1 million. The average annual cost of community benefit services over the last five years has been $1.6 million.
GLENDALE MEMORIAL HOSPITAL AND HEALTH CENTER
COMMUNITY BENEFIT SERVICES FY 2013 - FY 2017
Community Benefit Programs FY 2013 FY 2014 FY 2015 FY 2016 FY 2017
FY 2015- FY 2017 AVERAGE
FY 2013- FY 2017 AVERAGE
Benefits for Living in Poverty $988,126 $480,040 $922,595 $311,300 $410,522 $548,139 $622,517
Benefits for Broader Community $2,304,075 $2,068,264 $2,051,370 $235,193 $672,896 $986,486 $1,466,360
Totals $3,292,201 $2,548,304 $2,973,965 $546,493 $1,083,418 $1,534,625 $2,088,876
Non-Community Benefit Programs
Medi-Cal Provider Fee CHFT Grant Expense ($817,633) ($343,287) ($788,695) ($205,577) ($285,522) - -
Adjusted Totals $2,474,568 $2,205,017 $2,185,270 $340,916 $797,896 $1,108,027 $1,600,733
Source: Dignity Health, Dignity Health Glendale Memorial Hospital and Health Center Community Benefit Reports and Plans
● The Hospital’s five-year average cost of community benefit services for persons living in
poverty is $623,000 per year;
● The Hospital’s five-year average cost of community benefit services for the broader community is $1.5 million per year; and
● Over the five-year period, the Hospital’s adjusted total cost of community benefit
services decreased from $2.5 million per year in FY 2013 to $798,000 per year in FY 2017.
Glendale Memorial Hospital and Health Center’s community benefit services over the past five
fiscal years include the following programs with costs over $10,000 in FY 2017:
GLENDALE MEMORIAL HOPSITAL AND HEALTH CENTER
COST OF COMMUNITY BENEFIT SERVICES FY 2013 - FY 2017 Services over $10,000 in cost in FY 2017: FY 2013 FY 2014 FY 2015 FY 2016 FY 2017 50Plus Senior Services $14,322 $17,231 $23,367 $11,757 $30,549
Breastfeeding Resource Center (BFRC) - Support Group $8,491 $13,283 $10,372 - $12,147
Breastfeeding Resource Center (BFRC) - Telephone Warm Line $11,498 $12,984 $13,380 - $14,372
Clinical Rotation for Ultrasound Students (AMSC and CBD) $114,434 $328,143 $276,304 $80,503 $374,955
Clinical Rotation for X-Ray Students $150,990 $217,102 $136,660 $31,043 $178,947
Community Benefit Package $72,715 $56,045 - - $33,678
Dignity Health Community Grants Program $156,554 $117,989 $119,171 $105,242 $125,000
Community Health Fair - $32,501 $29,056 $9,430 $10,862
Community Health Needs Assessment - - - - $13,308
Source: Dignity Health

56
50Plus Senior Services: A program provided for adults 50 years and older. This program
includes health education, health activities, and community resources to improve the
participants' overall health and well-being;
Breastfeeding Resource Center (BFRC) – Support Group: Weekly support group for
breastfeeding mothers and pregnant mothers to address breastfeeding questions,
assess breastfeeding issues, provide resources and for mothers to network;
Breastfeeding Resource Center (BFRC) – Telephone Warm Line: Telephone support for
breastfeeding mothers in the community with questions and concerns regarding
breastfeeding;
Clinical Rotation for Ultrasound Students (AMCS and CBD): Clinical rotation for
ultrasound students from American Medical Science Center and Community Based
Education;
Clinical Rotation for X-Ray Students: Clinical rotation for X-Ray students from Pasadena
City College;
Community Benefit Package: Include costs associated with assigned staff not allocated
to specific programs, as well as other costs associated with community benefit strategy
and operations;
Dignity Health Community Grants Program: Grant funding to nonprofit organizations
working to improve the health and well-being of vulnerable and underserved
populations and reduce disparities;
Community Health Fair: Provide health screenings, education and information at
community events; and
Community Health Needs Assessment: Costs related to conducting a community health
needs assessment, creating an implementation strategy and preparing community
benefit reports.

57
Reproductive Health For CY 2016, Glendale Memorial Hospital and Medical Center reported 88 inpatient discharges related to reproductive health services29. The table below lists inpatient reproductive services by diagnostic related group (DRG) discharges for CY 2016.
GLENDALE MEMORIAL HOSPITAL AND HEALTH CENTER
CY 2016 REPRODUCTIVE SERVICE BY DIAGNOSTIC RELATED GROUP
Discharges
767-Vaginal Delivery W Sterilization &/Or D&C1 45
778-Threatened Abortion 21
777-Ectopic Pregnancy 11
770-Abortion W D&C1, Aspiration Curettage Or Hysterotomy 7
779-Abortion W/O D&C1 4
Total Discharges: 88 Source: CY 2016 OSHPD Patient Discharge Database 1D&C is an abbreviation for Dilation and Curettage
● Out of the five diagnostic related groups, 767-Vaginal delivery with sterilization has the
highest number of reproductive service inpatient discharges.
According to Dignity Health representatives, the table indicates whether the Hospital performs the following women’s reproductive health services.
GLENDALE MEMORIAL HOSPITAL & MEDICAL CENTER REPRODUCTIVE SERVICES
Procedure Currently Performed?
(Y/N)
Caesarean delivery with sterilization Yes Terminate pregnancy when:
A. Placenta previa No B. Premature rupture of membranes Yes, if medically indicated C. Second trimester bleeding with previable fetus Yes, if medically indicated
Placement of an IUD at time of other gynecological surgery No, placement done in our outpatient clinics Postpartum placement of IUD No, not in the hospital Gender affirming surgery No, in the planning stages Emergency contraception as emergency room or inpatient service Yes, if indicated, in cases of rape in the ED. Ectopic pregnancy treatment with methotrexate (medication in lieu of surgery) Yes Source: Dignity Health
29 Glendale Memorial Hospital is not a Catholic hospital and is not subject to the Catholic ERDs.

58
Analysis of Glendale Memorial Hospital and Health Center Service Area Definition Glendale Memorial Hospital and Health Center’s primary service area and secondary service area are comprised of 60 ZIP Codes from which 76.5% of its discharges originated in CY 2016. Twenty of the 60 ZIP Codes constitute the Hospital’s primary service area (56.9% of inpatient discharges) and the remaining originate from the Hospital’s secondary service area. Approximately 50% of the Hospital’s discharges originated from the top 11 ZIP Codes, including the cities of Glendale and Los Angeles. In CY 2016, market share in the Hospital’s primary service and secondary service area was 4.1%.
GLENDALE MEMORIAL HOSPITAL AND HEALTH CENTER PATIENT ORIGIN CY 2016
ZIP Codes Community Total
Discharges % of
Discharges Cumulative % of Discharges
Total Area Discharges
Market Share
Pri
mar
y Se
rvic
e A
rea
91205 Glendale 1,166 11.6% 11.6% 4,666 25.0%
91204 Glendale 755 7.5% 19.0% 2,141 35.3%
90065 Los Angeles 700 6.9% 26.0% 4,150 16.9%
90039 Los Angeles 526 5.2% 31.2% 2,387 22.0%
90027 Los Angeles 351 3.5% 34.7% 4,438 7.9%
91206 Glendale 340 3.4% 38.0% 3,760 9.0%
91202 Glendale 339 3.4% 41.4% 2,367 14.3%
90042 Los Angeles 335 3.3% 44.7% 5,348 6.3%
91203 Glendale 269 2.7% 47.4% 1,513 17.8%
91201 Glendale 223 2.2% 49.6% 2,462 9.1%
90041 Los Angeles 173 1.7% 51.3% 2,636 6.6%
90031 Los Angeles 127 1.3% 52.6% 3,201 4.0%
91504 Burbank 87 0.9% 53.4% 2,153 4.0%
91501 Burbank 87 0.9% 54.3% 1,780 4.9%
91207 Glendale 82 0.8% 55.1% 1,061 7.7%
91502 Burbank 76 0.8% 55.8% 1,315 5.8%
91208 Glendale 46 0.5% 56.3% 1,439 3.2%
91020 Montrose 31 0.3% 56.6% 1,022 3.0%
91506 Burbank 20 0.2% 56.9% 1,778 1.1%
91210 Glendale 10 0.1% 56.7% 57 17.5%
Primary Service Area Sub-Total 5,743 56.9% 56.9% 49,674 11.6%
Secondary Service Area Sub-Total 1,982 19.6% 76.5% 136,716 1.4% SSA+PSA 7,725 76.5% 76.5% 186,390 4.1%
Other ZIPs 2,368 23.5% 100.0%
Total Discharges 10,093 100.0%
Note: Excludes normal newborns Source: CY 2016 OSHPD Patient Discharge Database

59
Service Area Map Glendale Memorial Hospital and Health Center’s primary service area and secondary service areas have approximately 2 million residents. There are five other hospitals located within Glendale Memorial Hospital and Health Center’s primary service area and nine other hospitals within the secondary service area. There are 21 other hospitals located within approximately 15 miles from Glendale Memorial Hospital and Health Center. Glendale Memorial Hospital and Health Center has second-largest inpatient market share in the primary service area.

60
Hospital Market Share
The table below provides the market share of inpatient discharges by individual hospital within Glendale Memorial Hospital and Health Center’s primary service area from CY 2013 to CY 2016.
GLENDALE MEMORIAL HOSPITAL AND HEALTH CENTER PRIMARY SERVICE AREA MARKET SHARE BY HOSPITAL CY 2013 – CY 2016
Hospital CY 2013 CY 2014 CY 2015 CY 2016 Trend
Adventist Health Glendale 25.1% 25.2% 25.6% 26.6%
Glendale Memorial Hospital and Health Center 12.7% 12.8% 12.6% 11.6%
Providence Saint Joseph Medical Center 9.0% 9.1% 9.4% 9.3%
Kaiser Foundation Hospital - Los Angeles 6.9% 6.7% 7.1% 7.4%
Huntington Memorial Hospital 5.3% 5.6% 5.9% 6.3%
Hollywood Presbyterian Medical Center 3.5% 3.7% 3.5% 3.4%
LAC+USC Medical Center 3.8% 3.9% 3.4% 3.4%
Cedars Sinai Medical Center 3.2% 3.0% 3.3% 3.3%
USC Verdugo Hills Hospital 3.2% 3.2% 3.1% 3.2%
Adventist Health White Memorial 2.3% 2.1% 2.1% 2.0%
Children's Hospital of Los Angeles 1.7% 2.0% 1.9% 1.9%
Pacific Alliance Medical Center 1.3% 1.5% 1.3% 1.4%
Good Samaritan Hospital-Los Angeles 1.2% 1.3% 1.2% 1.2%
Keck Hospital of USC 1.0% 1.3% 1.2% 1.2%
St. Vincent Medical Center 1.2% 1.0% 1.0% 1.1%
Ronald Reagan UCLA Medical Center 0.8% 0.8% 1.0% 0.9%
Alhambra Hospital Medical Center 0.7% 0.9% 0.8% 0.9%
Los Angeles County Olive View-UCLA Medical Center 1.2% 1.0% 0.8% 0.8%
Kaiser Foundation Hospital- Panorama City 0.8% 0.7% 0.8% 0.7%
Garfield Medical Center 0.8% 0.6% 0.7% 0.7%
Southern California Hospital at Hollywood 0.9% 0.8% 0.7% 0.6%
Silver Lake Medical Center - Downtown Campus 0.3% 0.2% 0.4% 0.6%
California Hospital Medical Center 0.4% 0.5% 0.5% 0.6%
All Other 12.6% 11.8% 11.5% 11.0%
Total Percentage 100% 100% 100% 100%
Total Discharges 50,734 49,269 48,813 49,674
Source: OSHPD Discharge Database, CY 2013 – CY 2016
Note: Excludes normal newborns
● The number of discharges in Glendale Memorial Hospital and Health Center’s primary service area decreased by 2%;
● Since CY 2013, Adventist Health Glendale has consistently ranked first in market share for the primary service area (26.6% of inpatient discharges in CY 2016); and

61
Market Share by Payer Type
The following table illustrates the service area’s hospital inpatient market share by payer type as reported by OSHPD for CY 2016.
GLENDALE MEMORIAL HOSPITAL AND HEALTH CENTER
HOSPITAL MARKET SHARE BY PAYER CY 2016
Payer Type
Total Discharges A
dve
nti
st H
eal
th G
len
dal
e
Gle
nd
ale
Me
mo
rial
Ho
spit
al A
nd
He
alth
Ce
nte
r
Pro
vid
en
ce S
ain
t Jo
sep
h M
ed
ica
l
Ce
nte
r
Kai
ser
Fou
nd
atio
n H
osp
ita
l - L
os
An
gele
s
Hu
nti
ngt
on
Me
mo
ria
l Ho
spit
al
Ho
llyw
oo
d P
resb
yte
rian
Me
dic
al
Ce
nte
r
LA
C+U
SC M
ed
ical
Ce
nte
r
Ce
dar
s Si
nai
Me
dic
al C
en
ter
All Others Total
Medicare 21,225 32.5% 14.2% 10.9% 7.2% 4.6% 3.4% 1.4% 2.2% 23.6% 100%
Medi-Cal 14,147 26.9% 14.5% 5.7% 1.6% 3.3% 5.7% 8.5% 1.0% 32.8% 100%
Private Coverage 12,753 17.6% 4.9% 10.6% 14.7% 12.1% 1.1% 0.7% 7.8% 30.5% 100%
All Other 832 12.5% 2.2% 4.3% 1.1% 9.4% 0.5% 7.7% 1.3% 61.1% 100%
Self-Pay 717 25.8% 6.0% 15.3% 4.0% 9.3% 5.7% 3.9% 1.1% 28.7% 100%
Total Percentage 26.6% 11.6% 9.3% 7.4% 6.3% 3.4% 3.4% 3.3% 28.7% 100%
Total Discharges 49,674 13,233 5,743 4,633 3,663 3,121 1,712 1,688 1,627 14,254
Note: Excludes normal newborns Source: CY 2016 OSHPD Patient Discharge Database
● The largest payer type for inpatient discharges is Medicare with approximately 21,200 discharges (43%), followed by Medi-Cal with approximately 14,100 discharges (28%), and Private Coverage with nearly 12,800 discharges (26%);
● Adventist Health Glendale is the market share leader for all payer types listed: Medicare (33%), Medi-Cal (27%), Self-Pay (26%), and Private Coverage (18%); and
● Glendale Memorial Hospital and Health Center ranks second-largest market share leader in both inpatient Medicare (14%) and Medi-Cal (15%).

62
Market Share by Service Line
The following table provides the service area’s inpatient market share for CY 2016.
CY 2016 GLENDALE MEMORIAL HOSPITAL AND HEALTH CENTER
HOSPITAL MARKET SHARE BY SERVICE LINE
Service Line
Total Discharges A
dve
nti
st H
eal
th G
len
dal
e
Gle
nd
ale
Me
mo
rial
Ho
spit
al
An
d H
eal
th C
en
ter
Pro
vid
en
ce S
ain
t Jo
sep
h
Me
dic
al C
en
ter
Kai
ser
Fou
nd
atio
n H
osp
ita
l –
Lo
s A
nge
les
Hu
nti
ngt
on
Me
mo
rial
H
osp
ita
l
Ho
llyw
oo
d P
resb
yte
rian
Me
dic
al C
en
ter
LA
C+U
SC M
ed
ical
Ce
nte
r
Ce
dar
s Si
nai
Me
dic
al C
en
ter
All Others Total
General Medicine 15,669 27.5% 12.6% 9.7% 6.3% 5.3% 4.5% 3.4% 2.2% 28.5% 100%
Cardiac Services 6,339 35.4% 14.7% 10.3% 6.9% 3.7% 4.4% 2.6% 2.2% 19.8% 100%
Obstetrics 5,456 23.1% 15.4% 9.8% 12.0% 8.0% 3.6% 1.6% 7.1% 19.4% 100%
General Surgery 4,011 20.3% 9.8% 11.1% 7.1% 7.4% 2.6% 5.0% 4.0% 32.6% 100%
Behavioral Health 3,522 29.0% 5.3% 0.7% 3.6% 4.5% 0.7% 2.2% 0.2% 53.8% 100%
Orthopedics 3,387 25.1% 9.9% 9.1% 7.3% 7.6% 2.8% 3.5% 3.2% 31.6% 100%
Neurology 2,566 29.8% 10.8% 10.2% 7.1% 6.2% 3.3% 3.1% 1.7% 27.7% 100%
Neonatology 1,947 19.9% 12.8% 10.0% 12.4% 11.0% 2.8% 3.1% 9.6% 18.3% 100%
Oncology/Hematology 1,752 26.4% 7.4% 10.6% 7.3% 4.5% 2.7% 5.9% 3.3% 31.9% 100%
Urology 856 26.1% 9.6% 12.0% 7.9% 6.7% 2.1% 2.5% 2.7% 30.5% 100%
Spine 840 24.8% 7.9% 8.9% 6.3% 15.2% 1.1% 2.3% 5.4% 28.2% 100%
Gynecology 802 19.7% 6.0% 14.7% 6.0% 8.5% 2.2% 5.0% 5.2% 32.7% 100%
Other 710 18.3% 7.6% 8.5% 10.0% 10.3% 2.1% 10.6% 3.8% 28.9% 100%
Vascular Services 637 24.2% 16.3% 11.3% 5.5% 4.6% 6.3% 1.7% 2.8% 27.3% 100%
ENT 618 24.3% 7.0% 7.3% 7.4% 7.9% 1.9% 6.8% 2.1% 35.3% 100%
Neurosurgery 379 18.7% 5.0% 5.3% 13.2% 7.7% 1.1% 7.1% 6.3% 35.6% 100%
Ophthalmology 88 10.2% 5.7% 5.7% 5.7% 11.4% 4.5% 21.6% 2.3% 33.0% 100%
No-match-found 70 7.1% 0.0% 5.7% 10.0% 10.0% 2.9% 7.1% 8.6% 48.6% 100%
Total Percentage 26.7% 11.6% 9.3% 7.4% 6.3% 3.4% 3.4% 3.3% 28.7% 100%
Total Discharges 49,649 13,233 5,743 4,629 3,663 3,118 1,712 1,688 1,627 14,236 Note: Excludes normal newborns Source: CY 2016 OSHPD Patient Discharge Database
● Glendale Memorial Hospital and Health Center is not a service line leader in its primary service area for any of the service lines but does have significant inpatient market share in general medicine (13%), cardiac services (15%), obstetrics (15%), neurology (11%), neonatology (13%), urology (10%) and vascular services (16%); and
● Adventist Health Glendale is the primary service area inpatient market share leader for
16 service lines with market share ranging from (18.7%) neurosurgery to (35.4%) cardiac services.

63
Market Share by ZIP Code
The following table illustrates the service area’s hospital market share by ZIP Code for CY 2016.
GLENDALE MEMORIAL HOSPITAL AND HEALTH CENTER
HOSPITAL MARKET SHARE BY ZIP CODE CY 2016
ZIP Code Community Total
Discharges Ad
ven
tist
Hea
lth
Gle
nd
ale
Gle
nd
ale
Mem
ori
al H
osp
ital
An
d
Hea
lth
Ce
nte
r
Pro
vid
ence
Sai
nt
Jose
ph
Med
ical
Cen
ter
Kai
ser
Fou
nd
atio
n H
osp
ital
- L
os
An
gele
s
Hu
nti
ngt
on
Mem
ori
al H
osp
ital
Ho
llyw
oo
d P
resb
yter
ian
Med
ical
Cen
ter
LA
C+
USC
Me
dic
al C
ente
r
Ced
ars
Sin
ai M
edic
al C
en
ter
All Others Total
90042 Los Angeles 5,348 22.4% 6.3% 0.8% 8.9% 20.7% 0.8% 4.9% 1.9% 33.4% 100%
91205 Glendale 4,666 44.8% 25.0% 1.8% 4.6% 1.8% 1.2% 1.6% 1.5% 17.6% 100%
90027 Los Angeles 4,438 5.8% 7.9% 2.2% 11.8% 1.3% 28.8% 2.3% 9.9% 30.0% 100%
90065 Los Angeles 4,150 21.1% 16.9% 1.1% 10.6% 8.5% 1.2% 6.7% 3.3% 30.7% 100%
91206 Glendale 3,760 55.4% 9.0% 2.7% 5.9% 4.4% 0.8% 0.9% 1.7% 19.2% 100%
90031 Los Angeles 3,201 7.3% 4.0% 0.4% 7.7% 5.4% 1.1% 18.2% 1.2% 54.7% 100%
90041 Los Angeles 2,636 39.2% 6.6% 1.8% 10.4% 13.9% 0.6% 2.2% 2.7% 22.8% 100%
91201 Glendale 2,462 31.5% 9.1% 22.8% 5.1% 2.5% 0.7% 1.1% 2.6% 24.7% 100%
90039 Los Angeles 2,387 10.8% 22.0% 3.1% 14.6% 3.7% 3.4% 3.1% 7.8% 31.4% 100%
91202 Glendale 2,367 47.7% 14.3% 7.6% 4.0% 4.6% 0.5% 0.9% 2.7% 17.7% 100%
91504 Burbank 2,153 10.4% 4.0% 44.9% 4.4% 2.4% 0.7% 0.8% 3.4% 29.0% 100%
91204 Glendale 2,141 27.9% 35.3% 2.7% 4.2% 1.5% 1.1% 3.0% 1.6% 22.7% 100%
91501 Burbank 1,780 15.9% 4.9% 40.8% 5.3% 2.4% 0.7% 0.7% 3.6% 25.7% 100%
91506 Burbank 1,778 5.4% 1.1% 52.9% 4.9% 2.2% 0.2% 1.6% 3.3% 28.5% 100%
91203 Glendale 1,513 45.0% 17.8% 4.0% 5.5% 4.3% 0.7% 2.0% 2.5% 18.2% 100%
91208 Glendale 1,439 32.0% 3.2% 2.8% 6.4% 10.1% 0.3% 0.4% 2.2% 42.7% 100%
91502 Burbank 1,315 18.3% 5.8% 39.2% 3.0% 1.3% 0.9% 0.8% 2.4% 28.4% 100%
91207 Glendale 1,061 46.8% 7.7% 6.2% 6.0% 7.4% 0.2% 0.7% 3.3% 21.6% 100%
91020 Montrose 1,022 20.8% 3.0% 0.9% 5.2% 7.9% 0.6% 0.3% 1.6% 59.7% 100%
91210 Glendale 57 19.3% 17.5% 0.0% 7.0% 0.0% 3.5% 0.0% 15.8% 36.8% 100%
Total Percentage 26.6% 11.6% 9.3% 7.4% 6.3% 3.4% 3.4% 3.3% 28.7% 100%
Total Discharges 49,674 13,233 5,743 4,633 3,663 3,121 1,712 1,688 1,627 14,254
Note: Excludes normal newborns Source: CY 2016 OSHPD Patient Discharge Database
● Glendale Memorial Hospital and Health Center is the inpatient market share leader in two of the 20 ZIP Codes within the primary service area; and
● Adventist Health Glendale is the inpatient market share leader in 12 of the 20 ZIP Codes
within the primary service area.
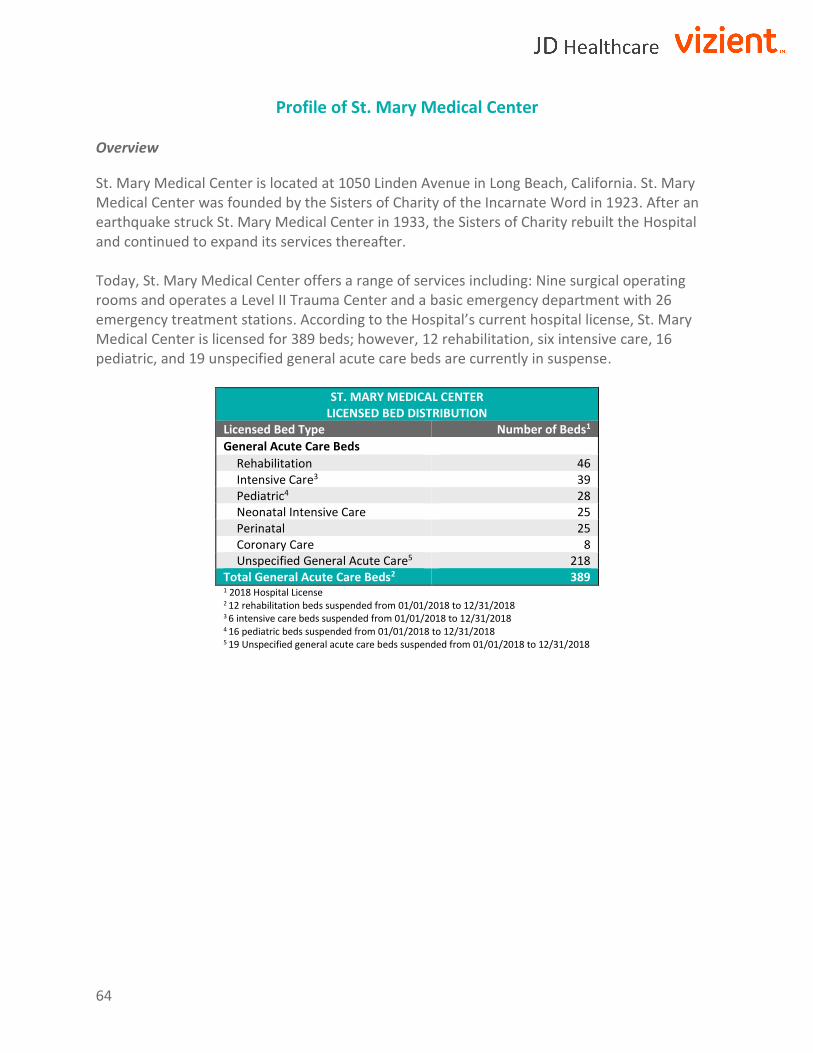
64
Profile of St. Mary Medical Center Overview
St. Mary Medical Center is located at 1050 Linden Avenue in Long Beach, California. St. Mary Medical Center was founded by the Sisters of Charity of the Incarnate Word in 1923. After an earthquake struck St. Mary Medical Center in 1933, the Sisters of Charity rebuilt the Hospital and continued to expand its services thereafter. Today, St. Mary Medical Center offers a range of services including: Nine surgical operating rooms and operates a Level II Trauma Center and a basic emergency department with 26 emergency treatment stations. According to the Hospital’s current hospital license, St. Mary Medical Center is licensed for 389 beds; however, 12 rehabilitation, six intensive care, 16 pediatric, and 19 unspecified general acute care beds are currently in suspense.
ST. MARY MEDICAL CENTER LICENSED BED DISTRIBUTION
Licensed Bed Type Number of Beds1
General Acute Care Beds Rehabilitation 46 Intensive Care3 39 Pediatric4 28 Neonatal Intensive Care 25 Perinatal 25 Coronary Care 8 Unspecified General Acute Care5 218
Total General Acute Care Beds2 389 1 2018 Hospital License 2 12 rehabilitation beds suspended from 01/01/2018 to 12/31/2018 3 6 intensive care beds suspended from 01/01/2018 to 12/31/2018 4 16 pediatric beds suspended from 01/01/2018 to 12/31/2018 5 19 Unspecified general acute care beds suspended from 01/01/2018 to 12/31/2018

65
Key Statistics For FY 2017, St. Mary Medical Center reported 11,222 inpatient discharges, 54,632 patient days, and an average daily census of 150 patients (approximately 50% occupied based on 389 available beds).
ST. MARY MEDICAL CENTER
KEY STATISTICS FY 2015 - FY 20171
FY 2015 FY 2016 FY 2017
Inpatient Discharges 10,943 11,249 11,222
Licensed Beds 389 389 389
Patient Days 49,296 54,433 54,632
Average Daily Census 135 149 150
Occupancy 34.7% 38.3% 38.5%
Average Length of Stay 4.5 4.8 4.9
Emergency Service Visits 56,001 54,234 54,745
Total Live Births 2,412 2,314 2,489
Sources: OSHPD Disclosure Reports, FY 2015 - FY 2017
1 FY 2015 and FY 2016 data is from audited OSHPD Disclosure Reports whereas FY 2017 data is from unaudited.
● Inpatient discharges have increased by 3%;
● Between FY 2015 and FY 2017, emergency service visits decreased by 2%;
● Between FY 2015 and FY 2017, total live births have remained relatively constant, with an average of 2,405 births annually.

66
Patient Utilization Trends
The following table shows FY 2013 – FY 2017 volume trends at St. Mary Medical Center.
ST. MARY MEDICAL CENTER SERVICE VOLUMES FY 2013 - FY 20171
PATIENT DAYS FY 2013 FY 2014 FY 2015 FY 2016 FY 2017 Medical/Surgical2 24,125 24,871 26,174 31,340 29,500 Neonatal Intensive Care 2,605 2,739 2,831 2,741 2,644 Intensive Care 5,674 6,008 5,824 6,635 7,893 Obstetrics 8,583 8,746 7,874 6,989 7,911 Physical Rehabilitation Care 5,224 5,350 4,985 5,513 5,606 Pediatrics Acute 1,407 1,596 1,608 1,215 1,078 Total 47,618 49,310 49,296 54,433 54,632 DISCHARGES Medical/Surgical2 5,452 5,911 6,670 7,079 7,506 Neonatal Intensive Care 152 191 200 201 218 Intensive Care 1,345 1,452 1,517 1,699 1,764 Obstetrics 2,927 2,968 2,832 2,596 2,687 Physical Rehabilitation Care 376 339 389 451 429 Pediatric Acute 454 243 499 428 413
Total 10,706 11,104 10,943 11,249 11,222 AVERAGE LENGTH OF STAY Medical/Surgical2 4.4 4.2 3.9 4.4 3.9 Neonatal Intensive Care 17.1 14.3 14.2 13.6 12.1 Intensive Care 4.2 4.1 3.8 3.9 4.5 Obstetrics 2.9 2.9 2.8 2.7 2.9 Physical Rehabilitation Care 13.9 15.8 12.8 12.2 13.1 Pediatrics Acute 3.1 6.6 3.2 2.8 2.6 Total 4.4 4.4 4.5 4.8 4.9 AVERAGE DAILY CENSUS Medical/Surgical2 66.1 68.1 71.7 85.9 80.8 Neonatal Intensive Care 7.1 7.5 7.8 7.5 7.2 Intensive Care 15.5 16.5 16.0 18.2 21.6 Obstetrics 23.5 24.0 21.6 19.1 21.7 Physical Rehabilitation Care 14.3 14.7 13.7 15.1 15.4 Pediatrics Acute 3.9 4.4 4.4 3.3 3.0 Total 130 135 135 149 150 OTHER SERVICES Inpatient Surgeries 1,111 1,414 1,416 1,651 1,726 Outpatient Surgeries 3,607 4,284 1,936 2,239 2,794 Emergency Service Visits 55,919 54,012 56,001 54,234 54,745 Total Live Births 2,584 2,743 2,412 2,314 2,489
Sources: OSHPD Disclosure Reports, FY 2013 - FY 2017 1 FY 2013 to FY 2016 data is from audited OSHPD Disclosure Reports whereas FY 2017 is from unaudited. 2 Includes Definitive Observation Beds
A review of St. Mary Medical Center’s historical utilization trends between FY 2013 and FY 2017
supports the following conclusions:
● Total patient days have increased by approximately 15% over the five-year period; ● Inpatient discharges have increased by 5% from 10,706 inpatient discharges in FY 2013
to 11,222 in FY 2017;

67
● The average daily census has increased by 15% from 130 patients in FY 2013 to 150 patients in FY 2017;
● Total live births decreased by 4%; and
● Emergency service visits have decreased by 2%.
Financial Profile Over the last five fiscal years, St. Mary Medical Center has had a negative net income, with the exception of a $13.9 million gain in FY 2015. Between FY 2013 and FY 2017, net patient revenue and total operating revenue increased by nearly 19% and 22% respectively, while operating expenses have increased by 32%. Other operating revenue, totaling more than $59 million over the course of the five-year period, has served to offset some of these increased operating expenses. The Hospital’s current ratio has fluctuated over the last five years but increased from of 1.42 in FY 2013 to a high of 1.54 in FY 2017. The California current ratio in FY 2016 was 1.56. The Hospital’s percentage of bad debt of 0.9% is similar to the state average of 0.8%.
ST. MARY MEDICAL CENTER FINANCIAL AND RATIO ANALYSIS FY 2013 - FY 20171
FY 2013 FY 2014 FY 2015 FY 2016 FY 2017 Patient Days 47,618 49,310 49,296 54,433 54,632 - Discharges 10,706 11,104 10,943 11,249 11,222 - ALOS 4.4 4.4 4.5 4.8 4.9 - Net Patient Revenue $218,161,618 $204,244,775 $273,533,650 $272,869,849 $258,998,730 - Other Operating Revenue $7,777,634 $8,889,050 $13,126,241 $12,149,069 $17,186,795 - Total Operating Revenue $225,939,252 $213,133,825 $286,659,891 $285,018,918 $276,185,525 - Operating Expenses $232,824,696 $228,117,723 $270,784,805 $296,611,110 $307,928,584 - Net from Operations ($6,885,444) ($14,983,898) $15,875,086 ($11,592,192) ($31,743,059) - Net Non-Operating Revenues and Expenses $113,792 ($1,699,508) ($1,998,948) ($6,941,514) ($6,448,250) - Net Income ($6,771,652) ($16,683,406) $13,876,138 ($18,533,706) ($38,191,309) -
2016
California Average2
Current Ratio 1.42 1.82 2.66 1.47 1.54 1.56 Days in A/R 48.9 75.8 53.8 58.7 58.8 57.1 Bad Debt Rate 3.6% 1.2% 0.7% 1.7% 0.9% 0.8% Operating Margin -3.05% -7.03% 5.54% -4.07% -11.49% 2.74%
Source: OSHPD Disclosure Reports, FY 2013 - FY 2017 1 FY 2013 to FY 2016 data is from audited OSHPD Disclosure Reports whereas FY 2017 is from unaudited. 2 FY 2017 California data was not available when the data was collected to prepare this report.

68
Cost of Hospital Services St. Mary Medical Center’s operating cost of services includes both inpatient and outpatient care. In FY 2017, 50% of total costs were associated with Medi-Cal, 34% with Medicare, and 13% with Third-Party.
ST. MARY MEDICAL CENTER OPERATING EXPENSES BY PAYER CATEGORY FY 2013 - FY 20171
FY 2013 FY 2014 FY 2015 FY 2016 FY 2017 Operating Expenses $232,824,696 $228,117,723 $270,784,805 $296,611,110 $307,928,584 Cost of Services By Payer: Medicare $85,074,379 $79,652,121 $93,568,735 $109,500,300 $105,078,711 Medi-Cal $93,168,797 $100,171,524 $127,764,518 $138,898,323 $152,706,636 County Indigent $6,549,823 $4,218,231 $349,739 $342,245 $131,677 Third-Party $25,845,564 $28,971,363 $40,448,575 $33,977,445 $39,280,215 Other Indigent $12,365,736 $10,762,209 $2,316,175 $5,512,570 $2,724,785 All Other Payers $9,820,397 $4,342,274 $6,337,062 $8,380,227 $8,006,561
Source: OSHPD Disclosure Reports, FY 2013 - FY 2017 1 FY 2013 to FY 2016 data is from audited OSHPD Disclosure Reports whereas FY 2017 is from unaudited.
Charity Care The following table shows a comparison of charity care and bad debt for St. Mary Medical Center and all general acute care hospitals in the State of California. The five-year (FY 2013 – FY 2017) average of charity care and bad debt, as a percentage of gross patient revenue, was 5.0% and higher than the four-year statewide average of 2.5%. According to OSHPD, “…the determination of what is classified as charity care can be made by establishing whether or not the patient has the ability to pay. The patient’s accounts receivable must be written off as bad debt if the patient has the ability but is unwilling to pay off the account.”
ST. MARY MEDICAL CENTER
CHARITY CARE COMPARISON FY 2013 - FY 20171 (In Thousands) FY 2013 FY 2014 FY 2015 FY 2016 FY 2017
Hospital CA Hospital CA Hospital CA Hospital CA Hospital CA 2 Gross Patient Revenue $803,592 $320,382,471 $857,596 $338,322,364 $826,408 $365,501,463 $904,392 $396,427,743 $942,308 - Charity $51,490 $6,563,487 $47,012 $5,113,965 $12,072 $3,441,227 $25,055 $3,457,868 $10,217 - Bad Debt $28,760 $5,891,632 $9,887 $4,365,936 $5,904 $3,262,642 $15,351 $3,108,971 $8,064 -
Total Charity & Bad Debt $80,250 $12,455,119 $56,898 $9,479,902 $17,976 $6,703,869 $40,406 $6,566,839 $18,280 -
Charity Care as a % of Gross Patient Revenue 6.4% 2.0% 5.5% 1.5% 1.5% 0.9% 2.8% 0.9% 1.1% - Bad Debt as a % of Gross Patient Revenue 3.6% 1.8% 1.2% 1.3% 0.7% 0.9% 1.7% 0.8% 0.9% - Total as a % of Gross Patient Revenue 10.0% 3.9% 6.6% 2.8% 2.2% 1.8% 4.5% 1.7% 1.9% - Uncompensated Care Cost to Charge Ratio 28.0% 24.5% 25.6% 23.6% 31.2% 24.1% 31.5% 23.8% 30.9% - Charity $14,420 $1,608,711 $12,018 $1,207,919 $3,764 $828,647 $7,881 $822,627 $3,152 - Bad Debt $8,054 $1,444,039 $2,527 $1,031,234 $1,841 $785,644 $4,828 $739,624 $2,488 -
Total $22,474 $3,052,750 $14,545 $2,239,153 $5,605 $1,614,292 $12,709 $1,562,251 $5,640 -
Source: OSHPD Disclosure Reports FY 2013 - FY 2017 1 FY 2013 to FY 2016 Hospital data is from audited OSHPD Disclosure Reports whereas FY 2017 data is from unaudited. 2 FY 2017 California data was not available when the data was collected to prepare this report.

69
The following table shows St. Mary Medical Center’s historical costs for charity care as reported to OSHPD. St. Mary Medical Center’s charity care costs have decreased from approximately $14.4 million in FY 2013 to $3.2 million in FY 2017. The average cost of charity care for the last five-year period was approximately $8.2 million, while the three-year average cost of charity care was approximately $4.9 million.
ST. MARY MEDICAL CENTER
COST OF CHARITY CARE FY 2013 - FY 20171
Year Charity Care
Charges
Cost to Charge
Ratio Cost of Charity Care
to the Hospital
FY 2017 $10,216,671 30.9% $3,152,276
FY 2016 $25,054,743 31.5% $7,880,567
FY 2015 $12,071,945 31.2% $3,763,805
FY 2014 $47,011,509 25.6% $12,017,630
FY 2013 $51,489,848 28.0% $14,419,800
FY 2015 - FY 2017 Average $4,932,216
FY 2013 - FY 2017 Average $8,246,816
Source: OSHPD Disclosure Reports FY 2013 - FY 2017 1 FY 2013 to FY 2016 data is from audited OSHPD Disclosure Reports whereas FY 2017 is from unaudited.
In the application to the California Attorney General, Dignity Health reported the following combined distribution of charity care costs by inpatient, outpatient, and emergency room costs in the table below.
ST. MARY MEDICAL CENTER COST OF CHARITY CARE BY SERVICE FY 2013 – FY 2017
Inpatient Outpatient Emergency Room Total Costs FY 2017: Cost of Charity $1,162,217 $1,240,621 $952,115 $3,354,953 Visits/Discharges 76 1,133 1,306 FY 2016: Cost of Charity $1,894,149 $1,474,994 $1,181,313 $4,550,456 Visits/Discharges 136 1,459 1,935 FY 2015: Cost of Charity $2,166,407 $2,970,405 $2,278,301 $7,415,113 Visits/Discharges 195 2,896 4,467 FY 2014: Cost of Charity $6,490,443 $2,910,846 $2,172,530 $11,573,819 Visits/Discharges 584 4,044 4,267 FY 2013: Cost of Charity $7,874,693 $3,393,721 $2,603,042 $13,871,456 Visits/Discharges 734 4,756 5,073 Source: Dignity Health

70
Note that these totals are different than what Dignity Health reported to OSHPD. However, after discussion with JD Healthcare Inc and Vizient Inc, Dignity Health has acknowledged that an error was made in its calculation of charity care cost. Dignity Health has stated that they will comply with the charity care cost amounts determined in the manner above. Community Benefit Services In the last five years, St. Mary Medical Center has spent a significant amount on community benefit services. As shown in the table below, the average annual cost of community benefit services over the last three years has been $12.1 million. The average annual cost of community benefit services over the last five years has been $11.8 million.
ST. MARY MEDICAL CENTER
COMMUNITY BENEFIT SERVICES FY 2013 - FY 2017
Community Benefit Programs FY 2013 FY 2014 FY 2015 FY 2016 FY 2017 FY 2015- FY 2017
AVERAGE
FY 2013- FY 2017 AVERAGE
Benefits for Living in Poverty $7,717,838 $3,508,923 $6,182,461 $3,420,735 $3,519,450 $4,374,215 $4,869,881 Benefits for Broader Community $8,281,324 $6,532,530 $8,602,123 $8,178,597 $8,968,944 $8,583,221 $8,112,704
Totals $15,999,162 $10,041,453 $14,784,584 $11,599,332 $12,488,394 $12,957,437 $12,982,585 Non-Community Benefit Programs Medi-Cal Provider Fee CHFT Grant Expense ($2,401,619) ($937,679) ($1,630,954) ($251,679) ($628,332) - -
Adjusted Totals $13,597,543 $9,103,774 $13,153,630 $11,347,653 $11,860,062 $12,120,448 $11,812,532
Source: Dignity Health, St. Mary Medical Center Community Benefit Reports and Plans
● The Hospital’s five-year average cost of community benefit services for persons living in poverty is $4.9 million per year;
● The Hospital’s five-year average cost of community benefit services for the broader community is $8.1 million per year; and
● Over the five-year period, the Hospital’s adjusted total cost of community benefit services decreased from $13.6 million per year in FY 2013 to $11.9 million per year in FY 2017.

71
St. Mary Medical Center’s community benefit services over the past five fiscal years include the following programs with costs over $10,000 in FY 2017:
ST. MARY MEDICAL CENTER COST OF COMMUNITY BENEFIT SERVICES FY 2013 - FY 2017
Services over $10,000 in cost in FY 2017: FY 2013 FY 2014 FY 2015 FY 2016 FY 2017
Car Seat Program $67,494 - $64,782 $87,866 - Diabetes Outpatient Self-Management $84,077 - - - $11,528
Dignity Health Community Grants $109,760 $120,660 $111,900 $110,761 $131,000
Disaster Resource Center $485,169 $137,564 $400,720 $166,831 $202,820
Events Financially Supported $25,655 $58,856 $45,111 $22,041 $42,816
Families in Good Health: Multiple Programs $1,523,585 $1,148,419 $2,635,342 $1,549,159 $1,434,166
GME Medical Education $6,682,508 $6,036,399 $7,838,169 $7,664,399 $8,316,458
Health Workforce Transformation: Clinical Care Extender, Red Shirt $232,548 $266,642 $295,114 $273,393 $371,042
Helping Hands Christmas Give Away $15,000 - $15,000 $25,950 $14,178
Low Vision Center Program $479,253 $185,134 $326,548 $172,496 $160,329
Mobile Care Van Clinic $427,713 $620,890 $718,253 $401,771 $160,787
Radiology Education Program (Students) $70,917 $70,375 $68,120 $73,974 $78,624
Senior Center Programs (Bazzeni Wellness Center) $355,175 $138,793 $316,328 $365,583 $547,700
Transportation Program Indigent $370,853 $289,173 $317,218 $405,661 $386,950
Source: Dignity Health
Car Seat Program: Program provides car seats to low-income patients who cannot
provide their own and whose infant(s) are born or cared for at the facility;
Diabetes Outpatient Self-Management: Diabetics learn the tools to manage their
diabetes by improving A1C, controlling weight, making lifestyle changes and improving
their quality of life;
Dignity Health Community Grants: Grant funding to nonprofit organizations working to
improve the health and well-being of vulnerable and underserved populations and
reduce disparities;
Disaster Resource Center (DRC): Program coordinates, plans and implements effective
regional hospital disaster response for the Long Beach community. The DRC also
stockpiles disaster supplies;
Events Financially Supported: Table sponsorships and cash donations to nonprofits;
Families in Good Health (Multiple Programs): A multilingual, multicultural health and
social education outpatient service center that helps the community make informed
choices and gain access to health and social resources;
GME Medical Education: Internal Medicine Residency Program for physician training;

72
Health Workforce Transformation: Clinical Care Extender, Red Shirt: Program
introducing high school and pre-health school professionals into the healthcare industry
with a year-long clinical internship;
Helping Hands Christmas Give Away: Food baskets and toys for needy families;
Low Vision Center Program: Provides services that include: near and distance acuity
testing, assistance in the selection of appropriate aids, training in the use of optical aids,
training in the use of electronic video equipment, and lectures for public and private
organizations;
Mobile Care Van Clinic: Provides screening for identification of chronic diseases and
provides health education and navigation;
Radiology Education Program (Students): Provides a clinical site for various programs.
Senior Center Programs (Bazzeni Wellness Center): Promotes healthy lifestyles to those
50 years of age or older. Ongoing services include: free health education classes and
workshops, free health screenings, free transportation, low-cost exercise programs and
a free resource center; and
Transportation Program Indigent: Transportation services to the Hospital for the
uninsured or underinsured.

73
Reproductive Health For CY 2016, St. Mary Medical Center reported 136 inpatient discharges related to reproductive health services30. The table below lists all reproductive services by diagnostic related group (DRG) discharges for CY 2016.
ST. MARY MEDICAL CENTER CY 2016 REPRODUCTIVE SERVICE BY DIAGNOSTIC RELATED GROUP
Discharges
778-Threatened Abortion 66
777-Ectopic Pregnancy 31
770-Abortion W D&C1, Aspiration Curettage Or Hysterotomy 20
779-Abortion W/O D&C1 15
767-Vaginal Delivery W Sterilization &/Or D&C1 4
Total Discharges: 136
Source: CY 2016 OSHPD Patient Discharge Database 1D&C is an abbreviation for Dilation and Curettage
● Out of the five diagnostic related groups, 778-Threatened Abortion has the highest
number of reproductive service inpatient discharges.
According to Dignity Health representatives, the table indicates whether the Hospital performs the following women’s reproductive health services.
ST. MARY MEDICAL CENTER REPRODUCTIVE SERVICES
Procedure
Currently Performed?
(Y/N)
Caesarean delivery with sterilization No
Terminate pregnancy when:
A. Placenta previa Yes
B. Premature rupture of membranes Yes
C. Second trimester bleeding with previable fetus Yes
Placement of an IUD at time of other gynecological surgery No
Postpartum placement of IUD No
Gender affirming surgery No
Emergency contraception as emergency room or inpatient service No
Ectopic pregnancy treatment with methotrexate (medication in lieu of surgery) No Source: Dignity Health
30 St. Mary Medical Center is a Catholic hospital and is subject to the ERDs.

74
Analysis of St. Mary Medical Center Service Area Definition
St. Mary Medical Center’s service area is comprised of 26 ZIP Codes from which 79.6% of its discharges originated in CY 2016. Approximately 50% of St. Mary Medical Center’s inpatient discharges originated from the top five ZIP Codes, including the cities of Long Beach and Wilmington. In CY 2016, St. Mary Medical Center’s market share in the service area was 8.8%.
ST. MARY MEDICAL CENTER PATIENT ORIGIN CY 2016
ZIP Codes Community Total
Discharges % of
Discharges
Cumulative % of
Discharges Total Area Discharges
Market Share
90813 Long Beach 2,427 21.8% 21.8% 7,155 33.9% 90802 Long Beach 1,091 9.8% 31.5% 4,197 26.0% 90806 Long Beach 681 6.1% 37.6% 5,149 13.2% 90804 Long Beach 624 5.6% 43.2% 3,795 16.4% 90744 Wilmington 603 5.4% 48.6% 5,188 11.6% 90805 Long Beach 575 5.2% 53.8% 9,994 5.8% 90810 Long Beach 412 3.7% 57.5% 3,986 10.3% 90803 Long Beach 266 2.4% 59.9% 2,509 10.6% 90723 Paramount 246 2.2% 62.1% 4,671 5.3% 90221 Compton 236 2.1% 64.2% 5,750 4.1% 90706 Bellflower 226 2.0% 66.2% 7,673 2.9% 90731 San Pedro 225 2.0% 68.2% 6,743 3.3% 90807 Long Beach 208 1.9% 70.1% 3,623 5.7% 90815 Long Beach 189 1.7% 71.8% 3,602 5.2% 90220 Compton 158 1.4% 73.2% 5,697 2.8% 90814 Long Beach 143 1.3% 74.5% 1,379 10.4% 90808 Long Beach 108 1.0% 75.5% 3,515 3.1% 90745 Carson 106 1.0% 76.4% 6,080 1.7% 90755 Signal Hill 92 0.8% 77.2% 1,042 8.8% 90712 Lakewood 70 0.6% 77.9% 2,686 2.6% 90713 Lakewood 68 0.6% 78.5% 2,391 2.8% 90801 Long Beach 47 0.4% 78.9% 277 17.0% 90746 Carson 37 0.3% 79.2% 2,894 1.3% 90704 Avalon 32 0.3% 79.5% 297 10.8% 90707 La Habra 5 0.0% 79.5% 67 7.5% 90809 Long Beach 4 0.0% 79.6% 50 8.0%
Subtotal 8,879 79.6% 79.6% 100,410 8.8%
Other ZIP Codes 2,278 20.4% 100.0%
Total Discharges 11,157 100.0% Note: Excludes normal newborns Source: CY 2016 OSHPD Patient Discharge Database

75
Service Area Map St. Mary Medical Center’s service area has approximately one million residents. There are six other hospitals located within St. Mary Medical Center’s service area: Long Beach Memorial Medical Center, Earl and Loraine Miller Children’s Hospital, Community Hospital of Long Beach, Providence Little Company of Mary Medical Center – San Pedro, Lakewood Regional Medical Center, and Kaiser Foundation Hospital South Bay. There are ten other hospitals located within approximately 10 miles from St. Mary Medical Center. Long Beach Memorial Medical Center is the inpatient market share leader in the service area.

76
Hospital Market Share
The table below provides the market share of inpatient discharges from CY 2013 to CY 2016.
ST. MARY MEDICAL CENTER SERVICE AREA INPATIENT MARKET SHARE BY HOSPITAL CY 2013 – CY 2016
Hospital CY 2013 CY 2014 CY 2015 CY 2016 Trend
Long Beach Memorial Medical Center 14.7% 14.1% 13.8% 14.1% → Earl and Loraine Miller Children’s Hospital 9.4% 9.7% 9.3% 9.8% ↗ St. Mary Medical Center 9.1% 9.2% 9.2% 8.8% ↘ Torrance Memorial Medical Center 4.4% 4.6% 4.7% 5.2% ↗ Lakewood Regional Medical Center 5.1% 5.2% 5.2% 5.1% → LAC/Harbor-UCLA Medical Center 5.7% 5.4% 4.8% 5.0% ↘ Kaiser Foundation Hospital - South Bay 5.1% 5.0% 5.0% 4.7% ↘ Kaiser Foundation Hospital - Downey 4.9% 5.0% 4.8% 4.7% ↘ Community Hospital Long Beach¹ 3.2% 3.5% 3.7% 3.9% ↗ Providence Little Company - San Pedro 3.4% 3.4% 3.8% 3.5% → College Medical Center 3.7% 3.6% 4.5% 3.5% → St. Francis Medical Center 3.2% 3.3% 3.4% 3.5% ↗ Los Alamitos Medical Center 2.4% 2.6% 2.5% 2.4% → Providence Little Company - Torrance 2.0% 2.1% 2.3% 2.3% ↗ PIH Hospital - Downey 1.3% 1.0% 1.0% 0.9% ↘ Kaiser Foundation Hospital - Los Angeles 1.0% 1.0% 1.0% 0.9% → Del Amo Hospital 0.9% 0.9% 0.9% 0.9% → Memorial Hospital of Gardena 1.0% 1.0% 1.0% 0.9% → College Hospital 1.1% 1.1% 0.9% 0.9% → All Other 18.2% 18.1% 18.6% 18.9% ↗
Total Percentage 100% 100% 100% 100%
Total Discharges 102,684 101,717 102,885 100,410 ↘ Source: OSHPD Discharge Database, CY 2013 – CY 2016 Note: Excludes normal newborns ¹ Scheduled to close in July 2018
● The number of inpatient discharges in St. Mary Medical Center’s service area decreased by over 2% between CY 2013 and CY 2016;
● From CY 2013 to CY 2016, Long Beach Memorial Medical Center has consistently ranked
first in market share for the service area based on inpatient discharges (14.1% in CY 2016); and
● St. Mary Medical Center’s service area market share has decreased from 9.1% in CY
2013 to 8.8% in CY 2016.

77
Market Share by Payer Type
The following table illustrates the service area’s hospital inpatient market share by payer type as reported by OSHPD for CY 2016.
ST. MARY MEDICAL CENTER HOSPITAL MARKET SHARE BY PAYER TYPE CY 2016
Payer Type Total
Discharges Lon
g B
eac
h M
emo
rial
Me
dic
al
Ce
nte
r
Ear
l an
d L
ora
ine
Mill
er
Ch
ildre
n’s
Ho
spit
al
St.
Mar
y M
ed
ical
Ce
nte
r
To
rran
ce M
em
ori
al M
ed
ical
Ce
nte
r
Lak
ew
oo
d R
egi
on
al M
ed
ical
C
en
ter
LA
C/H
arb
or-
UC
LA M
ed
ical
Ce
nte
r
Kai
ser
Fou
nd
atio
n H
osp
ital
–
Sou
th B
ay
Kai
ser
Fou
nd
atio
n H
osp
ital
–
Do
wn
ey
All Others Total
Medi-Cal 38,263 11.2% 16.7% 13.3% 1.8% 3.5% 9.3% 1.2% 1.5% 41.5% 100% Medicare 33,044 19.9% 0.1% 8.4% 6.7% 7.5% 2.3% 4.8% 4.9% 45.5% 100% Private Coverage 25,523 11.7% 12.5% 3.3% 8.8% 4.6% 0.8% 10.2% 9.5% 38.4% 100% All Other 1,803 8.8% 5.8% 3.8% 2.5% 2.8% 13.5% 0.2% 0.4% 62.2% 100% Self-Pay 1,777 10.7% 5.4% 4.5% 2.7% 2.6% 15.7% 2.5% 3.6% 52.3% 100%
Total Percentage 14.1% 9.8% 8.8% 5.2% 5.1% 5.0% 4.7% 4.7% 42.6% 100%
Total Discharges 100,410 14,166 9,809 8,879 5,237 5,106 5,037 4,712 4,708 42,756
Note: Excludes normal newborns Source: CY 2016 OSHPD Patient Discharge Database
● The largest payer type for inpatient discharges is Medi-Cal with approximately 38,300 discharges (38%), followed by Medicare with over 33,000 discharges (33%) and Private Coverage with approximately 25,500 discharges (25%);
● Long Beach Memorial Medical Center is the market share leader for Medicare (19.9%);
● Earl and Loraine Miller Children’s Hospital is the market share leader for Medi-Cal
(16.7%) and Private Coverage (12.5%); and
● LAC/Harbor-UCLA Medical Center is the market share leader for Self-Pay (15.7%).

78
Market Share by Service Line
The following table provides the service area’s inpatient market share for CY 2016.
ST. MARY MEDICAL CENTER MARKET SHARE BY SERVICE LINE CY 2016
Service Line Total
Discharges Lo
ng
Bea
ch M
emo
ria
l
Med
ica
l Cen
ter
Ear
l an
d L
ora
ine
Mill
er
Ch
ildre
n’s
Ho
spit
al
St.
Mar
y M
edic
al C
ente
r
To
rran
ce M
em
ori
al M
edic
al
Cen
ter
Lak
ew
oo
d R
egio
nal
Me
dic
al
Cen
ter
LA
C/H
arb
or-
UC
LA M
edic
al
Cen
ter
Kai
ser
Fou
nd
atio
n H
osp
ital
-
Sou
th B
ay
Kai
ser
Fou
nd
atio
n H
osp
ital
–
Do
wn
ey
All Others Total
General Medicine 30,289 16.4% 4.8% 9.7% 5.4% 7.7% 4.7% 4.4% 4.4% 42.6% 100% Obstetrics 14,323 1.3% 34.7% 14.6% 5.5% 0.1% 2.2% 7.8% 7.3% 26.4% 100% Cardiac Services 10,001 20.4% 0.6% 10.9% 7.1% 8.5% 4.7% 3.1% 3.8% 40.9% 100% Behavioral Health 9,506 1.2% 0.2% 0.9% 0.2% 1.0% 1.6% 0.3% 0.3% 94.2% 100% General Surgery 8,492 18.6% 4.3% 7.1% 7.2% 5.5% 9.1% 7.7% 4.5% 36.0% 100% Orthopedics 5,720 19.6% 3.5% 6.8% 5.5% 5.6% 7.2% 5.2% 6.5% 40.1% 100% Neurology 4,854 22.2% 4.1% 10.5% 4.8% 7.7% 4.0% 2.8% 4.0% 39.8% 100% Neonatology 4,633 0.0% 41.7% 9.0% 5.4% 0.0% 3.8% 9.7% 9.6% 20.8% 100% Oncology/Hematology 3,349 25.6% 7.1% 5.0% 5.0% 5.4% 9.4% 3.6% 4.4% 34.5% 100% Gynecology 1,656 23.3% 1.3% 5.7% 8.8% 4.8% 10.7% 3.9% 5.2% 36.2% 100% Other 1,494 23.0% 6.1% 9.2% 5.6% 6.9% 9.3% 2.3% 2.6% 35.1% 100% ENT 1,347 26.6% 13.1% 5.6% 4.5% 3.7% 10.2% 2.2% 1.7% 32.4% 100% Spine 1,277 26.8% 2.2% 6.1% 4.9% 3.1% 3.8% 0.6% 5.9% 46.6% 100% Urology 1,210 19.0% 2.5% 4.5% 6.3% 5.3% 7.8% 2.9% 7.0% 44.8% 100% Vascular Services 1,186 23.7% 0.2% 7.3% 4.4% 8.5% 9.4% 7.1% 3.7% 35.8% 100% Neurosurgery 655 28.1% 5.6% 5.3% 2.6% 3.2% 5.5% 0.9% 0.6% 48.1% 100% Ophthalmology 177 27.7% 4.0% 13.0% 4.0% 2.3% 16.9% 2.8% 1.1% 28.2% 100% All others 241 18.7% 0.8% 3.7% 3.3% 3.7% 7.1% 0.4% 1.2% 61.0% 100%
Total Percentage 14.1% 9.8% 8.8% 5.2% 5.1% 5.0% 4.7% 4.7% 42.6% 100%
Total Discharges 100,410 14,166 9,809 8,879 5,237 5,106 5,037 4,712 4,708 42,756
Note: Excludes normal newborns Source: CY 2016 OSHPD Patient Discharge Database
● St. Mary Medical Center is not a leader for any of the service lines but has significant inpatient market share in obstetrics (14.6%), cardiac services (10.9%), neurology (10.5%), and ophthalmology (13%);
● Long Beach Memorial Medical Center is the inpatient market share leader for 15 service
lines, including cardiac services (20.4%), neurology (22.2%), oncology/ hematology (25.6%), spine (26.8%), vascular services (23.7%), and neurosurgery (28.1%); and
● Earl and Loraine Miller Children’s Hospital is the inpatient market share leader in
obstetrics (34.7%) and neonatology (41.7%).

79
Market Share by ZIP Code
The following table illustrates service area’s hospital market share by ZIP Code for CY 2016.
ST. MARY MEDICAL CENTER HOSPITAL MARKET SHARE BY ZIP CODE CY 2016
ZIP Code Community Total
Discharges
Lo
ng
Bea
ch M
emo
ria
l Med
ical
Cen
ter
Ear
l an
d L
ora
ine
Mill
er
Ch
ildre
n’s
Ho
spit
al
St.
Mar
y M
edic
al C
ente
r -
Lo
ng
Bea
ch
To
rran
ce M
em
ori
al M
edic
al
Cen
ter
Lak
ew
oo
d R
egio
nal
Me
dic
al
Cen
ter
LA
C/H
arb
or-
UC
LA M
edic
al
Cen
ter
Kai
ser
Fou
nd
atio
n H
osp
ital
-
So
uth
Bay
Kai
ser
Fou
nd
atio
n H
osp
ital
–
Do
wn
ey
All Others Total
90805 Long Beach 9,994 21.2% 14.9% 5.8% 1.3% 11.8% 3.3% 1.7% 6.0% 34.1% 100% 90706 Bellflower 7,673 5.8% 8.2% 2.9% 0.7% 15.8% 2.7% 0.6% 13.9% 49.3% 100% 90813 Long Beach 7,155 13.8% 13.1% 33.9% 0.5% 0.9% 3.4% 2.4% 0.6% 31.4% 100% 90731 San Pedro 6,743 2.0% 4.3% 3.3% 12.4% 0.2% 7.7% 8.2% 0.3% 61.6% 100% 90745 Carson 6,080 4.0% 2.4% 1.7% 28.0% 0.3% 16.1% 10.8% 0.4% 36.2% 100% 90221 Compton 5,750 8.8% 10.2% 4.1% 1.2% 5.5% 5.2% 1.2% 9.1% 54.6% 100% 90220 Compton 5,697 7.0% 7.7% 2.8% 4.5% 2.8% 7.9% 7.1% 5.9% 54.4% 100% 90744 Wilmington 5,188 3.8% 5.7% 11.6% 19.3% 0.3% 12.6% 11.3% 0.4% 35.0% 100% 90806 Long Beach 5,149 29.2% 14.4% 13.2% 0.9% 1.2% 2.9% 4.1% 1.2% 32.9% 100% 90723 Paramount 4,671 5.7% 10.9% 5.3% 0.8% 12.5% 4.0% 0.7% 12.4% 47.7% 100% 90802 Long Beach 4,197 15.1% 9.0% 26.0% 1.3% 1.2% 2.5% 3.5% 1.0% 40.4% 100% 90810 Long Beach 3,986 28.2% 13.9% 10.3% 3.3% 1.6% 4.5% 5.8% 1.7% 30.7% 100% 90804 Long Beach 3,795 16.4% 12.6% 16.4% 0.6% 1.1% 3.4% 4.7% 1.4% 43.3% 100% 90807 Long Beach 3,623 31.3% 10.7% 5.7% 1.3% 2.7% 1.4% 4.7% 3.3% 38.9% 100% 90815 Long Beach 3,602 22.4% 10.3% 5.2% 1.2% 1.4% 1.0% 3.3% 3.4% 51.7% 100% 90808 Long Beach 3,515 22.9% 10.7% 3.1% 1.3% 3.6% 1.0% 2.2% 6.2% 49.1% 100% 90746 Carson 2,894 5.3% 3.1% 1.3% 17.9% 0.9% 12.3% 17.0% 2.6% 39.7% 100% 90712 Lakewood 2,686 17.2% 10.8% 2.6% 2.3% 20.1% 1.4% 2.6% 12.3% 30.7% 100% 90803 Long Beach 2,509 23.8% 8.0% 10.6% 1.0% 1.3% 0.5% 4.0% 2.0% 48.8% 100% 90713 Lakewood 2,391 14.6% 10.7% 2.8% 1.7% 16.5% 1.2% 1.7% 12.3% 38.6% 100% 90814 Long Beach 1,379 19.6% 11.1% 10.4% 1.1% 1.5% 1.4% 6.8% 2.2% 46.0% 100% 90755 Signal Hill 1,042 25.5% 13.4% 8.8% 0.4% 1.2% 1.1% 7.2% 2.9% 39.5% 100% 90704 Avalon 297 24.2% 13.1% 10.8% 19.5% 0.0% 3.4% 0.3% 0.0% 28.6% 100% 90801 Long Beach 277 23.5% 4.3% 17.0% 0.7% 3.6% 5.4% 2.9% 0.4% 42.2% 100% 90707 Bellflower 67 6.0% 4.5% 7.5% 3.0% 14.9% 3.0% 4.5% 14.9% 41.8% 100% 90809 Long Beach 50 2.0% 12.0% 8.0% 0.0% 6.0% 2.0% 4.0% 4.0% 62.0% 100%
Total Percentage 14.1% 9.8% 8.8% 5.2% 5.1% 5.0% 4.7% 4.7% 42.6% 100%
Total Discharges 100,410 14,166 9,809 8,879 5,237 5,102 5,037 4,712 4,708 42,760
Note: Excludes normal newborns Source: CY 2016 OSHPD Patient Discharge Database
● St. Mary Medical Center is the inpatient market share leader in three of the 26 ZIP Codes, all of which are located within the community of Long Beach;
● Long Beach Memorial Medical Center is the inpatient market share leader in eleven service area ZIP Codes located within the communities of Long Beach, Signal Hill, and Avalon; and
● Lakewood Regional Medical Center is the inpatient market share leader in five service
area ZIP Codes located in the communities of Bellflower, Lakewood, and Paramount.

80
Profile of Northridge Hospital Medical Center Overview
Northridge Hospital Medical Center is a general acute care hospital located at 18300 Roscoe Boulevard in Northridge, California. It began as a single story 49-bed hospital with a one-room emergency room and grew as the demand for hospital services in the local community increased. Today, Northridge Hospital Medical Center offers a range of services including a Level II Trauma Center, a Level II Pediatric Trauma Center, a family birthing center and is certified as a Primary Stroke Center. The Hospital has 11 surgical operating rooms and operates a “basic” emergency department with 32 emergency treatment stations. According to Northridge Hospital Medical Center’s current hospital license, it is licensed for 424 beds as shown below.
NORTHRIDGE HOSPITAL MEDICAL CENTER LICENSED BED DISTRIBUTION
Licensed Bed Type Number of Beds1
General Acute Care Rehabilitation 36 Perinatal 35 Intensive Care 24
Coronary Care 22 Pediatric 20 Intensive Care Newborn Nursery 18 Unspecified General Acute Care 229
Total General Acute Care Beds 384
Acute Psychiatric (D/P) 40
Total Licensed Beds 424 1 2018 Hospital License
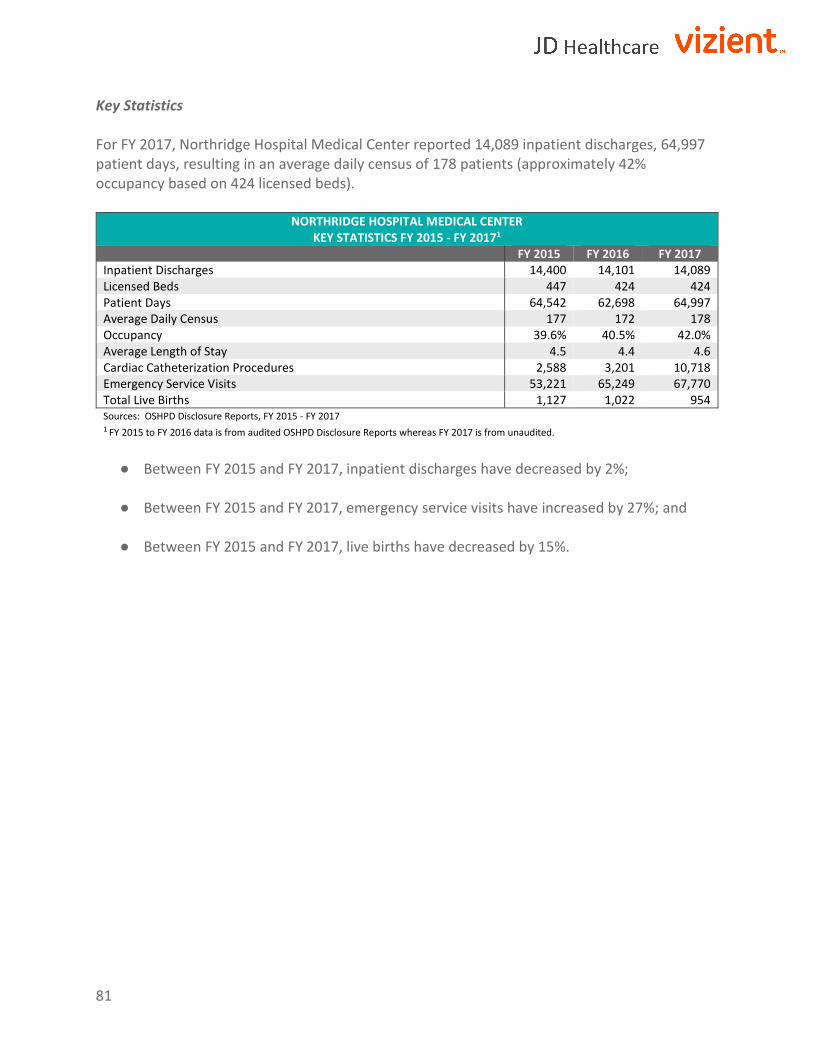
81
Key Statistics For FY 2017, Northridge Hospital Medical Center reported 14,089 inpatient discharges, 64,997 patient days, resulting in an average daily census of 178 patients (approximately 42% occupancy based on 424 licensed beds).
NORTHRIDGE HOSPITAL MEDICAL CENTER
KEY STATISTICS FY 2015 - FY 20171
FY 2015 FY 2016 FY 2017
Inpatient Discharges 14,400 14,101 14,089
Licensed Beds 447 424 424
Patient Days 64,542 62,698 64,997
Average Daily Census 177 172 178
Occupancy 39.6% 40.5% 42.0%
Average Length of Stay 4.5 4.4 4.6
Cardiac Catheterization Procedures 2,588 3,201 10,718
Emergency Service Visits 53,221 65,249 67,770
Total Live Births 1,127 1,022 954
Sources: OSHPD Disclosure Reports, FY 2015 - FY 2017 1 FY 2015 to FY 2016 data is from audited OSHPD Disclosure Reports whereas FY 2017 is from unaudited.
● Between FY 2015 and FY 2017, inpatient discharges have decreased by 2%;
● Between FY 2015 and FY 2017, emergency service visits have increased by 27%; and
● Between FY 2015 and FY 2017, live births have decreased by 15%.

82
Patient Utilization Trends
The following table shows FY 2013 – FY 2017 volume trends at Northridge Hospital Medical Center.
NORTHRIDGE HOSPITAL MEDICAL CENTER SERVICE VOLUMES FY 2013 - FY 20171
PATIENT DAYS FY 2013 FY 2014 FY 2015 FY 2016 FY 2017 Medical/Surgical2 38,153 35,416 37,223 36,887 39,544 Neonatal Intensive Care 2,971 3,024 2,330 1,668 2,074 Intensive Care 6,055 5,376 5,278 5,070 5,696 Obstetrics 4,880 4,288 3,317 2,888 2,647 Physical Rehabilitation Care 4,968 4,414 4,414 4,154 3,868 Pediatric Intensive Care 2,066 721 787 635 552 Pediatrics Acute 1,692 1,836 2,466 2,251 2,032 Psychiatric Acute - Adult 8,871 9,086 8,727 9,145 8,584 Total 69,656 64,161 64,542 62,698 64,997 DISCHARGES
Medical/Surgical2 10,114 9,448 9,654 9,710 9,702
Neonatal Intensive Care 224 244 193 157 157 Intensive Care 373 317 301 266 266 Obstetrics 1,632 1,470 1,188 1,106 1,105 Physical Rehabilitation Care 256 243 233 238 238 Pediatric Intensive Care 694 189 185 139 139 Pediatrics Acute 741 859 1,034 812 811 Psychiatric Acute - Adult 1,722 1,701 1,612 1,673 1,671 Total 15,756 14,471 14,400 14,101 14,089 AVERAGE LENGTH OF STAY Medical/Surgical2 3.8 3.7 3.9 3.8 4.9 Neonatal Intensive Care 13.3 12.4 12.1 10.6 13.2 Intensive Care 16.2 17.0 17.5 19.1 21.4 Obstetrics 3.0 2.9 2.8 2.6 2.4 Physical Rehabilitation Care 19.4 18.2 18.9 17.5 16.3 Pediatric Intensive Care 3.0 3.8 4.3 4.6 4.0 Pediatrics Acute 2.3 2.1 2.4 2.8 2.5 Psychiatric Acute - Adult 5.2 5.3 5.4 5.5 5.1 Total 4.4 4.4 4.5 4.4 4.6 AVERAGE DAILY CENSUS Medical/Surgical2 104.5 97.0 102.0 101.1 108.3 Neonatal Intensive Care 8.1 8.3 6.4 4.6 5.7 Intensive Care 16.6 14.7 14.5 13.9 15.6 Obstetrics 13.4 11.7 9.1 7.9 7.3 Physical Rehabilitation Care 13.6 12.1 12.1 11.4 10.6 Pediatric Intensive Care 5.7 2.0 2.2 1.7 1.5 Pediatrics Acute 4.6 5.0 6.8 6.2 5.6 Psychiatric Acute - Adult 24.3 24.9 23.9 25.1 23.5 Total 191 176 177 172 178 OTHER SERVICES Inpatient Surgeries 3,038 3,142 3,299 2,814 2,896 Outpatient Surgeries 5,716 5,454 5,563 3,731 1,150 Emergency Service Visits 54,679 53,013 53,221 65,249 67,770 Total Live Births 1,511 1,511 1,127 1,022 954
Sources: OSHPD Disclosure Reports, FY 2013 - FY 2017 1 FY 2013 to FY 2016 data is from audited OSHPD Disclosure Reports whereas FY 2017 is from unaudited. 2 Includes Definitive Observation Beds
A review of Northridge Hospital Medical Center’s historical utilization trends between FY 2013 and FY 2017 supports the following conclusions:
● Total patient days have decreased by 7%;

83
● Inpatient discharges have decreased by 5%;
● Total births have decreased by 37% from 1,511 births in FY 2013 to 954 births in FY 2017; and
● Emergency service visits have significantly increased by nearly 24% over the five-year
period from 54,679 in FY 2013 to 67,770 in FY 2017.
Financial Profile
Over the last five fiscal years, Northridge Hospital Medical Center’s net income decreased from a gain of $24.5 million in FY 2013 to a loss of $11.7 million in FY 2017. Between FY 2013 and FY 2017, net patient revenue and total operating revenue increased by 6% and 7% respectively. Over that same period, the Hospital’s operating expenses increased by 18% from $346.0 million in FY 2013 to $408.4 million in FY 2017. Other operating revenue increased over the five-year period by 13% from approximately $6.5 million in FY 2013 to $7.4 million in FY 2017. The Hospital’s current ratio has decreased over the last five years from 5.54 in FY 2013 to 3.56 in FY 2017. The California current ratio in FY 2016 was 1.56. Northridge Hospital Medical Center’s percentage of bad debt of 1.4% is higher than the state average 0.8%.
NORTHRIDGE HOSPITAL MEDICAL CENTER FINANCIAL AND RATIO ANALYSIS FY 2013 - FY 20171
FY 2013 FY 2014 FY 2015 FY 2016 FY 2017 Patient days 69,656 64,161 64,542 62,698 64,997 - Discharges 15,756 14,471 14,400 14,101 14,089 - ALOS 4.4 4.4 4.5 4.4 4.6 - Net Patient Revenue $364,487,337 $330,838,003 $403,223,460 $374,067,418 $387,575,677 - Other Operating Revenue $6,530,459 $8,808,809 $8,159,596 $8,317,717 $7,405,644 - Total Operating Revenue $371,017,796 $339,646,812 $411,383,056 $382,385,135 $394,981,321 - Operating Expenses $346,008,684 $326,120,155 $393,319,750 $385,319,077 $408,388,871 - Net from Operations $25,009,112 $13,526,657 $18,063,306 ($2,933,942) ($13,407,550) - Net Non-Operating Revenues and Expenses
($531,812) $1,415,000 $1,125,187 $1,590,978 $1,687,809 -
Net Income $24,477,300 $14,941,657 $19,188,493 ($1,342,964) ($11,719,741) -
2016 California
Average2 Current Ratio 5.54 7.15 5.43 3.79 3.56 1.56 Days in A/R 60.9 80.6 69.6 67.3 67.8 57.1 Bad Debt Rate 2.2% 0.7% 1.0% 1.2% 1.4% 0.8% Operating Margin 6.74% 3.98% 4.39% -0.77% -3.39% 2.74%
Source: OSHPD Disclosure Reports, FY 2013 - FY 2017 1 FY 2013 to FY 2016 data is from audited OSHPD Disclosure Reports whereas FY 2017 is from unaudited. 2 FY 2017 California data was not available when the data was collected to prepare this report.

84
Cost of Hospital Services
Northridge Hospital Medical Center’s operating cost of services includes both inpatient and outpatient care. In FY 2017, approximately 46% of total costs were with Medicare, 26% with Medi-Cal, and 26% with Third-Party.
NORTHRIDGE HOSPITAL MEDICAL CENTER OPERATING EXPENSES BY PAYER CATEGORY FY 2013 - FY 20171
FY 2013 FY 2014 FY 2015 FY 2016 FY 2017 Operating Expenses $346,008,684 $326,120,155 $393,319,750 $385,319,077 $408,388,871 Cost of Services By Payer: Medicare $146,314,471 $139,273,376 $173,522,516 $170,540,230 $186,948,499 Medi-Cal $73,696,372 $77,585,707 $99,414,125 $103,674,269 $106,983,444 County Indigent $0 $0 $0 $11,681 $0 Third-Party $110,949,493 $98,011,140 $112,982,895 $102,930,471 $106,154,640 Other Indigent $9,948,934 $9,427,251 $3,679,778 $4,665,885 $1,249,435 All Other Payers $5,099,413 $1,822,681 $3,720,437 $3,496,542 $7,052,854 Source: OSHPD Disclosure Reports, FY 2013 - FY 2017 1 FY 2013 to FY 2016 data is from audited OSHPD Disclosure Reports whereas FY 2017 is from unaudited.
Charity Care The following table shows a comparison of charity care and bad debt for Northridge Hospital Medical Center and all general acute care hospitals in the State of California. The five-year (FY 2013 – FY 2017) average of charity care and bad debt, as a percentage of gross patient revenue, was 3.3% and higher than the four-year statewide average of 2.5%. According to OSHPD, “…the determination of what is classified as charity care can be made by establishing whether or not the patient has the ability to pay. The patient’s accounts receivable must be written off as bad debt if the patient has the ability but is unwilling to pay off the account.
NORTHRIDGE HOSPITAL MEDICAL CENTER CHARITY CARE COMPARISON FY 2013 - FY 20171 (In Thousands)
FY 2013 FY 2014 FY 2015 FY 2016 FY 2017
Hospital CA Hospital CA Hospital CA Hospital CA Hospital CA 2 Gross Patient Revenue $1,724,974 $320,382,471 $1,750,254 $338,322,364 $1,812,769 $365,501,463 $1,935,787 $396,427,743 $2,161,625 - Charity $60,910 $6,563,487 $57,374 $5,113,965 $20,756 $3,441,227 $27,316 $3,457,868 $11,639 - Bad Debt $38,707 $5,891,632 $11,498 $4,365,936 $18,753 $3,262,642 $23,366 $3,108,971 $30,957 -
Total Charity & Bad Debt $99,617 $12,455,119 $68,872 $9,479,902 $39,509 $6,703,869 $50,682 $6,566,839 $42,597 -
Charity Care as a % of Gross Patient Revenue
3.5% 2.0% 3.3% 1.5% 1.1% 0.9% 1.4% 0.9% 0.5% -
Bad Debt as a % of Gross Patient Revenue
2.2% 1.8% 0.7% 1.3% 1.0% 0.9% 1.2% 0.8% 1.4% -
Total as a % of Gross Patient Revenue
5.8% 3.9% 3.9% 2.8% 2.2% 1.8% 2.6% 1.7% 2.0% -
Uncompensated Care Cost to Charge Ratio 19.7% 24.5% 18.1% 23.6% 21.2% 24.1% 19.5% 23.8% 18.6% - Charity $11,987 $1,608,711 $10,402 $1,207,919 $4,410 $828,647 $5,320 $822,627 $2,159 - Bad Debt $7,618 $1,444,039 $2,085 $1,031,234 $3,984 $785,644 $4,551 $739,624 $5,743 -
Total $19,605 $3,052,750 $12,486 $2,239,153 $8,395 $1,614,292 $9,871 $1,562,251 $7,902 -
Source: OSHPD Disclosure Reports FY 2013 - FY 2017 1 FY 2013 to FY 2016 data is from audited OSHPD Disclosure Reports whereas FY 2017 is from unaudited. 2 FY 2017 California data was not available when the data was collected to prepare this report.

85
The following table shows Northridge Hospital Medical Center historical costs for charity care as reported to OSHPD. Charity care costs have decreased from $12.0 million in FY 2013 to $2.2 million in FY 2017. The average cost of charity care for the last five-year period was $6.9 million, while for the three-year average, the cost of charity care was $4.0 million.
NORTHRIDGE HOSPITAL MEDICAL CENTER
COST OF CHARITY CARE FY 2013 - FY 20171
Year Charity Care
Charges
Cost to Charge
Ratio
Cost of Charity Care to the
Hospital
FY 2017 $11,639,403 18.6% $2,159,119
FY 2016 $27,316,465 19.5% $5,319,979
FY 2015 $20,756,339 21.2% $4,410,112
FY 2014 $57,373,876 18.1% $10,401,566
FY 2013 $60,909,960 19.7% $11,987,198
FY 2015 - FY 2017 Average $3,963,070
FY 2013 - FY 2017 Average $6,855,595
Source: OSHPD Disclosure Reports FY 2013 - FY 2017 1 FY 2013 to FY 2016 data is from audited OSHPD Disclosure Reports whereas FY 2017 is from unaudited.
In the application to the California Attorney General, Dignity Health reported the following combined distribution of charity care costs by inpatient, outpatient, and emergency room costs in the table below.
NORTHRIDGE HOSPITAL MEDICAL CENTER COST OF CHARITY CARE BY SERVICE FY 2013 - FY 20171
Inpatient Outpatient Emergency
Room Total Costs
FY 2017:
Cost of Charity $944,925 $871,477 $723,600 $2,540,002
Visits/Discharges 43 489 834
FY 2016:
Cost of Charity $3,229,532 $1,231,415 $1,063,061 $5,524,008
Visits/Discharges 170 674 1,332
FY 2015:
Cost of Charity $3,675,171 $2,256,290 $1,522,197 $7,453,658
Visits/Discharges 205 1,316 2,004
FY 2014:
Cost of Charity $5,085,591 $2,178,701 $1,310,539 $8,574,831
Visits/Discharges 313 1,326 1,936
FY 2013:
Cost of Charity $7,083,116 $2,747,520 $1,340,149 $11,170,785
Visits/Discharges 470 1,627 2,204 Source: Dignity Health

86
Note that these totals are different than what Dignity Health reported to OSHPD. However, after discussion with JD Healthcare Inc and Vizient Inc, Dignity Health has acknowledged that an error was made in its calculation of charity care cost. Dignity Health has stated that they will comply with the charity care cost amounts determined in the manner above.
Community Benefit Services
In the last five years, Northridge Hospital Medical Center has provided significant community benefit services. As shown in the table below, the average annual cost of community benefit services over the three years has been $15.5 million. The average annual cost of community benefit services over the five years has been $16.0 million.
NORTHRIDGE HOSPITAL MEDICAL CENTER COMMUNITY BENEFIT SERVICES FY 2013 - FY 2017
Community Benefit Programs FY 2013 FY 2014 FY 2015 FY 2016 FY 2017 FY 2015- FY 2017
Average FY 2013- FY 2017
Average Benefits for Living in Poverty $14,524,076 $12,904,045 $14,784,176 $13,842,184 $9,697,603 $12,774,654 $13,150,417 Benefits for Broader Community $2,508,768 $2,081,685 $3,133,206 $2,612,417 $2,302,779 $2,682,801 $2,837,993
Totals $17,032,844 $14,985,730 $17,132,333 $15,725,461 $11,178,484 $15,457,455 $15,988,409 Non-Community Benefit Programs
Medi-Cal Provider Fee CHFT Grant Expense ($1,431,533) ($569,821) ($1,512,754) ($890,241) ($508,746) - -
Adjusted Totals $16,359,202 $15,209,126 $16,404,628 $15,564,360 $11,491,636 $14,486,875 $15,005,790
Source: Dignity Health, Dignity Health- Northridge Hospital Medical Center Community Benefit Reports and Plans
● The Hospital’s five-year average cost of community benefit services for persons living in
poverty is $13.2 million per year;
● The Hospital’s five-year average cost of community benefit services for the broader community is $2.8 million per year; and
● Over the five-year period, The Hospital’s combined total cost of community benefit services decreased from $16.4 million per year in FY 2013 to $11.5 million per year in FY 2017.
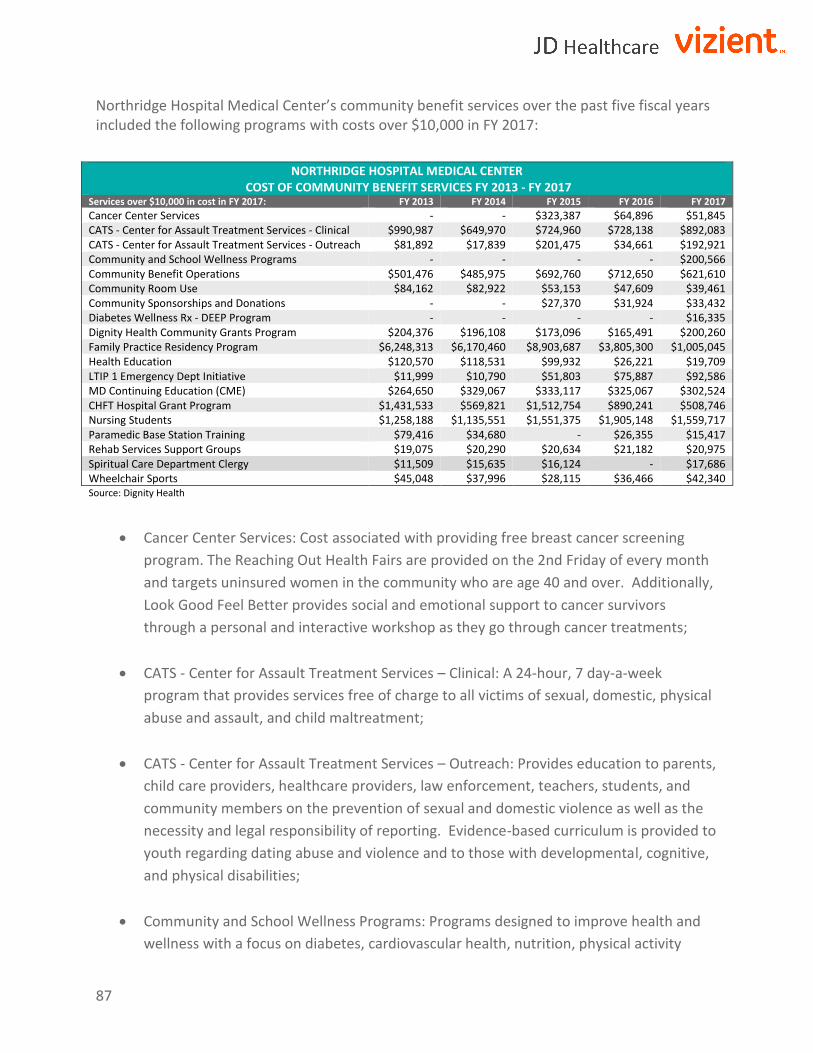
87
Northridge Hospital Medical Center’s community benefit services over the past five fiscal years included the following programs with costs over $10,000 in FY 2017:
NORTHRIDGE HOSPITAL MEDICAL CENTER COST OF COMMUNITY BENEFIT SERVICES FY 2013 - FY 2017
Services over $10,000 in cost in FY 2017: FY 2013 FY 2014 FY 2015 FY 2016 FY 2017
Cancer Center Services - - $323,387 $64,896 $51,845
CATS - Center for Assault Treatment Services - Clinical $990,987 $649,970 $724,960 $728,138 $892,083
CATS - Center for Assault Treatment Services - Outreach $81,892 $17,839 $201,475 $34,661 $192,921
Community and School Wellness Programs - - - - $200,566
Community Benefit Operations $501,476 $485,975 $692,760 $712,650 $621,610
Community Room Use $84,162 $82,922 $53,153 $47,609 $39,461
Community Sponsorships and Donations - - $27,370 $31,924 $33,432
Diabetes Wellness Rx - DEEP Program - - - - $16,335
Dignity Health Community Grants Program $204,376 $196,108 $173,096 $165,491 $200,260
Family Practice Residency Program $6,248,313 $6,170,460 $8,903,687 $3,805,300 $1,005,045
Health Education $120,570 $118,531 $99,932 $26,221 $19,709
LTIP 1 Emergency Dept Initiative $11,999 $10,790 $51,803 $75,887 $92,586
MD Continuing Education (CME) $264,650 $329,067 $333,117 $325,067 $302,524
CHFT Hospital Grant Program $1,431,533 $569,821 $1,512,754 $890,241 $508,746
Nursing Students $1,258,188 $1,135,551 $1,551,375 $1,905,148 $1,559,717
Paramedic Base Station Training $79,416 $34,680 - $26,355 $15,417
Rehab Services Support Groups $19,075 $20,290 $20,634 $21,182 $20,975
Spiritual Care Department Clergy $11,509 $15,635 $16,124 - $17,686
Wheelchair Sports $45,048 $37,996 $28,115 $36,466 $42,340
Source: Dignity Health
Cancer Center Services: Cost associated with providing free breast cancer screening
program. The Reaching Out Health Fairs are provided on the 2nd Friday of every month
and targets uninsured women in the community who are age 40 and over. Additionally,
Look Good Feel Better provides social and emotional support to cancer survivors
through a personal and interactive workshop as they go through cancer treatments;
CATS - Center for Assault Treatment Services – Clinical: A 24-hour, 7 day-a-week
program that provides services free of charge to all victims of sexual, domestic, physical
abuse and assault, and child maltreatment;
CATS - Center for Assault Treatment Services – Outreach: Provides education to parents,
child care providers, healthcare providers, law enforcement, teachers, students, and
community members on the prevention of sexual and domestic violence as well as the
necessity and legal responsibility of reporting. Evidence-based curriculum is provided to
youth regarding dating abuse and violence and to those with developmental, cognitive,
and physical disabilities;
Community and School Wellness Programs: Programs designed to improve health and
wellness with a focus on diabetes, cardiovascular health, nutrition, physical activity

88
promotion, obesity, and chronic disease prevention. School Wellness programs include
34 public schools in Los Angeles Unified School District;
Community Benefit Operations: Costs associated with assigned staff managing or
overseeing community benefit that are not allocated to specific programs, as well as
other costs associated with community benefit tracking and reporting;
Community Room Use: Free use of Hospital meeting rooms to approved community
based nonprofit groups that support community support groups, meetings, health
education seminars, mental health peer support groups, and meetings;
Community Sponsorships and Donations: Provides donations and/or sponsorships to
organizations supporting community services and programs;
Diabetes Wellness Rx - DEEP Program: Free diabetes self-management classes to
community members to raise awareness about diabetes type 2;
Dignity Health Community Grants Program: Grant funding to nonprofit organizations
working to improve the health and well-being of vulnerable and underserved
populations and reduce disparities;
Family Practice Residency Program: Provide medical professions with education and
training on the provision of care to the underserved population in the community;
Health Education: Community classes/seminars, support groups, health fairs and
outreach events provided in low income communities;
LTIP 1 Emergency Dept Initiative: A partnership with Tarzana Treatment Center created
to reduce health disparities among populations with disproportionate unmet health-
related needs, specifically individuals with alcohol and/or chemical dependency and
behavioral health issues including the homeless;
MD Continuing Education (CME): Education offered to physicians on hospital’s medical
staff and to physicians outside the medical staff to increase skills and knowledge base;
Nursing Students: Precepting and mentoring for nursing students at both a staff and
leadership level. Includes room use for RN to BSN, BSN, and MSN students from multiple
local colleges and universities;

89
Paramedic Base Station Training: Provides training and education to pre-hospital
personnel in the community to assure that community members arrive at appropriate
facility based on age and condition;
Rehab Services Support Groups: Various rehab support groups for patients, previous
patients, and care givers including, but not limited to, stroke support, pain support,
brain injury, spinal cord injury and more;
Spiritual Care Department Clergy: Staff Chaplains from the Spiritual Care Department
facilitate 10-week Healing Journey grief support groups open to all community members
that have experienced the loss of a loved one; and
Wheelchair Sports: Financial and human resources to support disabled, wheelchair-
bound athletes to participate in a wide variety of wheelchair sports.

90
Reproductive Health For CY 2016, Northridge Hospital Medical Center reported 81 inpatient discharges related to reproductive health services31. The table below lists all reproductive services by diagnostic related group discharges for CY 2016.
NORTHRIDGE HOSPITAL MEDICAL CENTER CY 2016 REPRODUCTIVE SERVICE BY DIAGNOSTIC RELATED GROUP
Discharges
767-Vaginal Delivery W Sterilization &/Or D&C1 47
778-Threatened Abortion 11
779-Abortion W/O D&C1 10
777-Ectopic Pregnancy 7
770-Abortion W D&C1, Aspiration Curettage or Hysterotomy 6
Total Discharges: 81
Source: CY 2016 OSHPD Patient Discharge Database 1D&C is an abbreviation for Dilation and Curettage
● Out of the five diagnostic related groups, 767-Vaginal delivery with sterilization has the
highest number of reproductive service inpatient discharges.
According to Dignity Health representatives, the table indicates whether the Hospital performs the following women’s reproductive health services.
NORTHRIDGE HOSPITAL MEDICAL CENTER REPRODUCTIVE SERVICES
Procedure Currently Performed?
(Y/N)
Caesarean delivery with sterilization Yes Terminate pregnancy when:
A. Placenta previa No B. Premature rupture of membranes Yes, Delivery would be induced when there is risk to mother's
health/life and no chance of preserving baby C. Second trimester bleeding with
previable fetus Yes, Delivery would be induced when there is risk to mother's
health/life and no chance of preserving baby Placement of an IUD at time of other gynecological surgery Yes Postpartum placement of IUD No Gender affirming surgery No Emergency contraception as emergency room or inpatient service No Ectopic pregnancy treatment with methotrexate (medication in lieu of surgery) Yes Source: Dignity Health
31 Northridge Hospital Medical Center is not a Catholic hospital and is not subject to the ERDs.

91
Analysis of Northridge Hospital Medical Center
Service Area Definition
Northridge Hospital Medical Center’s service area is comprised of 35 ZIP Codes from which 76.6% of its discharges originated in CY 2016. Approximately 51% of Northridge Hospital Medical Center’s inpatient discharges originated from the top eight ZIP Codes, located in the City of Los Angeles’ communities of Reseda, Winnetka, Northridge, Chatsworth, Canoga Park, North Hills, and Porter Ranch. In CY 2016, Northridge Hospital Medical Center’s inpatient market share in the service area was 11.6%.
NORTHRIDGE HOSPITAL MEDICAL CENTER PATIENT ORIGIN CY 2016
ZIP Codes Community
Total Discharges
% of Discharges Cumulative % of Discharges
Total Area Discharges
Market Share
91335 Reseda 2045 15% 15% 7892 26%
91306 Winnetka 981 7% 21% 4221 23%
91325 Northridge 957 7% 28% 2784 34%
91324 Northridge 941 7% 35% 2671 35%
91311 Chatsworth 629 4% 39% 3390 19%
91304 Canoga Park 604 4% 44% 4166 14%
91343 North Hills 553 4% 48% 5028 11%
91326 Porter Ranch 545 4% 51% 2476 22%
91406 Van Nuys 533 4% 55% 4667 11%
91344 Granada Hills 486 3% 59% 4678 10%
91303 Canoga Park 327 2% 61% 2209 15%
91402 Panorama City 276 2% 63% 6638 4%
91367 Woodland Hills 242 2% 65% 3632 7%
91331 Pacoima 212 2% 66% 8683 2%
91405 Van Nuys 201 1% 68% 5254 4%
91328 Northridge 160 1% 69% 175 91%
91356 Tarzana 154 1% 70% 3258 5%
91307 West Hills 136 1% 71% 2422 6%
93063 Simi Valley 120 1% 72% 1723 7%
93065 Simi Valley 118 1% 73% 1886 6%
91316 Encino 112 1% 73% 2838 4%
91364 Woodland Hills 110 1% 74% 2339 5%
91345 Mission Hills 75 1% 75% 1789 4%
91340 San Fernando 75 1% 75% 3018 2%
91411 Van Nuys 63 0% 76% 2351 3%
91436 Encino 40 0% 76% 1445 3%
93021 Moorpark 39 0% 76% 628 6%
91313 Chatsworth 9 0% 76% 51 18%
91357 Tarzana 8 0% 76% 60 13%
91416 Encino 7 0% 76% 35 20%
91346 Mission Hills 7 0% 76% 33 21%
91603 North Hollywood 7 0% 76% 55 13%
91305 Canoga Park 7 0% 76% 34 21%
91409 Van Nuys 5 0% 77% 50 10%
91365 Woodland Hills 5 0% 77% 58 9%
Subtotal 10,789 76.6% 76.6% 92,637 11.6%
Other ZIP Codes 3,302 23.4% 100.0%
Total Discharges 14,091 100.0%
Note: Excludes normal newborns
Source: CY 2016 OSHPD Patient Discharge Database

92
Service Area Map
Northridge Hospital Medical Center’s service area has approximately 1.2 million residents. There are eight other hospitals located within the service area. Providence Holy Cross Medical Center, Providence Tarzana Medical Center, Valley Presbyterian Hospital, West Hills Hospital and Medical Center, Kaiser Foundation Hospital-Woodland Hills, Los Angeles County Olive View-UCLA Medical Center, and Mission Community Hospital-Panorama Campus. There are 16 other hospitals located within approximately 10 miles of Northridge Hospital Medical Center. Northridge Hospital Medical Center is the inpatient market share leader in the service area.
Trauma Boundary Service Area

93
Hospital Market Share
The table below provides the market share of inpatient discharges by individual hospital within Northridge Hospital Medical Center’s service area from CY 2013 to CY 2016.
NORTHRIDGE HOSPITAL MEDICAL CENTER SERVICE AREA MARKET SHARE BY HOSPITAL CY 2013 – CY 2016
Hospital CY 2013 CY 2014 CY 2015 CY 2016 Trend
Northridge Hospital Medical Center 12.5% 12.0% 11.7% 11.6%
Providence Holy Cross Medical Center 9.9% 10.6% 11.2% 11.5%
Providence Tarzana Medical Center 10.3% 10.1% 10.6% 10.7%
Valley Presbyterian Hospital 10.4% 10.5% 9.4% 9.4%
West Hills Hospital and Medical Center 6.6% 7.2% 7.7% 7.6%
Kaiser Foundation Hospital - Woodland Hills 8.0% 8.2% 8.4% 7.5%
Los Angeles County Olive View-UCLA Medical Center 5.9% 5.8% 5.1% 5.2%
Mission Community Hospital - Panorama Campus 4.3% 4.2% 4.1% 3.8%
Kaiser Foundation Hospital - Panorama City 4.2% 3.8% 3.7% 3.7%
Cedars Sinai Medical Center 3.1% 3.1% 3.1% 3.2%
Ronald Reagan UCLA Medical Center 2.0% 2.0% 2.3% 2.2%
Providence Saint Joseph Medical Center 2.1% 1.9% 2.0% 2.2%
Kaiser Foundation Hospital - Los Angeles 2.1% 2.0% 1.9% 1.9%
Sherman Oaks Hospital 1.1% 1.5% 1.8% 1.6%
Children's Hospital of Los Angeles 1.3% 1.5% 1.5% 1.5%
Encino Hospital Medical Center 1.3% 1.3% 1.4% 1.4%
Pacifica Hospital of The Valley 1.7% 1.6% 1.3% 1.1%
Adventist Health Glendale 0.9% 0.9% 0.9% 0.9%
Santa Monica - UCLA Medical Center and Orthopedic Hospital 0.9% 1.0% 1.0% 0.9%
Tarzana Treatment Center 0.8% 0.7% 0.7% 0.8%
LAC+USC Medical Center 0.7% 0.8% 0.8% 0.8%
Providence Saint John's Health Center 0.6% 0.6% 0.6% 0.7%
Keck Hospital of USC 0.6% 0.7% 0.7% 0.6%
Glendale Memorial Hospital and Health Center 0.4% 0.4% 0.5% 0.6%
Del Amo Hospital 0.4% 0.4% 0.4% 0.5%
All Other 7.6% 7.6% 7.4% 8.0%
Total Percentage 100% 100% 100% 100%
Total Discharges 94,367 94,132 94,835 92,637
Source: OSHPD Discharge Database, CY 2013 – CY 2016
Note: Excludes normal newborns
● The number of inpatient discharges in the Hospital’s service area has remained relatively stable;
● From CY 2013 to CY 2016, Northridge Hospital Medical Center has consistently ranked
first in market share (11.6% in CY 2016); and
● Providence Holy Cross Medical Center ranks second in market share (11.5% in CY 2016).

94
Market Share by Payer Type
The following table illustrates the service area’s hospital inpatient market share by payer type as reported by OSHPD for CY 2016.
NORTHRIDGE HOSPITAL MEDICAL CENTER
MARKET SHARE BY PAYER CY 2016
Payer Type
Total Discharges N
ort
hri
dge
Ho
spit
al M
ed
ical
Ce
nte
r
Pro
vid
en
ce H
oly
Cro
ss M
ed
ical
Ce
nte
r
Pro
vid
en
ce T
arza
na
Me
dic
al C
en
ter
Val
ley
Pre
sbyt
eria
n H
osp
ital
We
st H
ills
Ho
spit
al a
nd
Me
dic
al
Ce
nte
r
Kai
ser
Fou
nd
atio
n H
osp
ital
-
Wo
od
lan
d H
ills
Lo
s A
nge
les
Co
un
ty O
live
Vie
w-U
CLA
Me
dic
al C
en
ter
Mis
sio
n C
om
mu
nit
y H
osp
ital
–
Pan
ora
ma
Cam
pu
s
All Others Total
Medicare 33,685 14.6% 11.5% 13.1% 4.9% 10.9% 10.5% 1.4% 4.4% 28.7% 100%
Medi-Cal 27,574 11.7% 14.2% 8.1% 9.4% 4.6% 1.4% 14.5% 5.4% 30.8% 100%
Private Coverage 27,498 8.6% 9.0% 10.5% 15.7% 6.6% 10.6% 0.3% 1.7% 37.1% 100%
All Other 2,238 6.4% 5.0% 3.6% 2.9% 8.4% 0.4% 11.2% 1.3% 60.8% 100%
Self-Pay 1,642 8.5% 16.4% 15.4% 5.1% 4.4% 7.4% 3.4% 3.3% 36.1% 100%
Total Percentage 11.6% 11.5% 10.7% 9.4% 7.6% 7.5% 5.2% 3.8% 32.7% 100%
Total Discharges 92,637 10,789 10,625 9,869 8,697 7,036 6,948 4,839 3,516 30,318
Note: Excludes normal newborns Source: CY 2016 OSHPD Patient Discharge Database
● For CY 2016, the largest payer types are Medicare (36%), and Medi-Cal and Private Coverage with 30% each;
● Northridge Hospital Medical Center is the market share leader for Medicare (14.6%);
● Providence Holy Cross Medical Center is the market share leader for Self-Pay (16.4%); and
● Los Angeles County Olive View-UCLA Medical Center is the market share leader for
Medi-Cal (14.5%).

95
Market Share by Service Line
The following table provides the service area’s inpatient market share for CY 2016.
NORTHRIDGE HOSPITAL MEDICAL CENTER MARKET SHARE BY SERVICE LINE CY 2016
Service Line Total
Discharges
No
rth
rid
ge H
osp
ital
Med
ical
Cen
ter
Pro
vid
ence
Ho
ly C
ross
Med
ical
Cen
ter
Pro
vid
ence
Tar
zan
a
Med
ical
Cen
ter
Val
ley
Pre
sbyt
eria
n
Ho
spit
al
Wes
t H
ills
Ho
spit
al
An
d M
edic
al C
en
ter
Kai
ser
Fou
nd
atio
n
Ho
spit
al -
Wo
od
lan
d H
ills
Lo
s A
nge
les
Co
un
ty
Oliv
e V
iew
-UC
LA
Med
ical
Cen
ter
Mis
sio
n C
om
mu
nit
y
Ho
spit
al -
Pa
no
ram
a
Cam
pu
s
All Others Total
General Medicine 28,022 13.3% 11.4% 12.4% 8.6% 10.3% 8.5% 6.1% 4.9% 24.4% 100%
Obstetrics 13,101 7.4% 16.2% 14.7% 19.2% 5.1% 9.5% 2.7% 0.0% 25.3% 100%
Cardiac Services 9,917 14.3% 11.6% 10.6% 8.9% 10.9% 6.8% 7.1% 4.3% 25.4% 100%
General Surgery 7,861 10.5% 13.4% 10.0% 8.3% 7.7% 6.9% 7.7% 0.9% 34.5% 100%
Behavioral Health 7,550 11.5% 0.6% 0.5% 0.5% 1.1% 0.5% 3.0% 15.3% 67.0% 100%
Orthopedics 6,312 12.3% 11.3% 8.7% 8.6% 7.4% 13.2% 1.1% 2.1% 35.3% 100%
Neurology 4,339 16.8% 11.1% 7.9% 8.3% 7.6% 6.1% 4.0% 4.1% 34.1% 100%
Neonatology 3,864 7.2% 15.5% 13.2% 11.9% 4.5% 10.4% 4.4% 0.0% 33.0% 100%
Oncology/Hematology 2,841 8.8% 10.4% 9.3% 6.8% 7.9% 6.9% 9.8% 1.8% 38.4% 100%
Spine 1,425 11.0% 7.3% 7.6% 6.1% 6.2% 1.4% 0.9% 3.4% 56.1% 100%
Gynecology 1,415 8.1% 15.9% 13.1% 9.8% 4.7% 2.6% 16.9% 0.6% 28.4% 100%
Urology 1,394 5.7% 11.5% 13.4% 5.7% 5.7% 6.5% 7.9% 1.1% 42.5% 100%
Other 1,317 20.0% 12.8% 5.3% 4.2% 10.0% 4.8% 2.1% 0.8% 40.1% 100%
Vascular Services 1,101 8.1% 10.7% 17.8% 11.7% 6.9% 9.4% 4.0% 1.5% 29.9% 100%
ENT 1,101 10.8% 9.1% 11.9% 9.5% 4.3% 3.5% 7.7% 2.2% 41.1% 100%
Neurosurgery 756 10.2% 8.2% 3.0% 2.6% 2.4% 0.8% 0.9% 0.3% 71.6% 100%
No-match-found 155 7.7% 7.1% 10.3% 3.9% 3.2% 4.5% 2.6% 1.9% 58.7% 100%
Ophthalmology 123 15.4% 9.8% 4.9% 1.6% 4.1% 1.6% 13.0% 0.8% 48.8% 100%
Total Percentage 11.6% 11.5% 10.7% 9.4% 7.6% 7.5% 5.2% 3.8% 32.7% 100%
Total Discharges 92,594 10,781 10,619 9,869 8,683 7,036 6,948 4,839 3,516 30,303
Note: Excludes normal newborns
Source: CY 2016 OSHPD Patient Discharge Database
● Northridge Hospital Medical Center is the service line leader in six of 18 service lines: general medicine (13%), cardiac services (14.3%), neurology (16.8%), spine (11%), neurosurgery (10%) and ophthalmology (15.4%); and
● Providence Tarzana Medical Center is the service area inpatient market share leader in
three of 18 service lines: urology (13%), vascular services (17%) and ENT (12%).

96
Market Share by ZIP Code The following table provides the service area’s hospital market share by ZIP Code for CY 2016.
NORTHRIDGE HOSPITAL MEDICAL CENTER MARKET SHARE BY ZIP CODE CY 2016
ZIP Code Community Total
Discharges No
rth
rid
ge H
osp
ital
M
ed
ical
Ce
nte
r
Pro
vid
en
ce H
oly
Cro
ss
Me
dic
al C
en
ter
Pro
vid
en
ce T
arza
na
Me
dic
al C
en
ter
Val
ley
Pre
sbyt
eria
n
Ho
spit
al
We
st H
ills
Ho
spit
al A
nd
M
ed
ical
Ce
nte
r
Kai
ser
Fou
nd
atio
n H
osp
ital
-
Wo
od
lan
d H
ills
Lo
s A
nge
les
Co
un
ty O
live
Vie
w-U
CLA
Me
dic
al C
en
ter
Mis
sio
n C
om
mu
nit
y
Ho
spit
al -
Pan
ora
ma
C
amp
us
All Others Total
91331 Pacoima 8,683 2.4% 29.9% 2.2% 10.2% 0.3% 0.4% 13.6% 3.0% 38.0% 100%
91335 Reseda 7,892 25.9% 3.5% 20.8% 6.0% 3.3% 7.8% 3.8% 1.5% 27.4% 100%
91402 Panorama City 6,638 4.2% 10.6% 2.4% 18.1% 0.5% 0.3% 9.5% 19.5% 35.0% 100%
91405 Van Nuys 5,254 3.8% 4.0% 3.6% 32.0% 0.6% 0.5% 6.6% 5.3% 43.5% 100%
91343 North Hills 5,028 11.0% 18.4% 4.5% 15.7% 1.0% 2.0% 7.3% 9.5% 30.7% 100%
91344 Granada Hills 4,678 10.4% 34.0% 4.5% 3.1% 1.6% 4.8% 4.0% 2.5% 35.2% 100%
91406 Van Nuys 4,667 11.4% 5.4% 10.2% 22.1% 1.5% 4.0% 6.1% 4.5% 34.8% 100%
91306 Winnetka 4,221 23.2% 4.0% 11.0% 7.0% 16.8% 11.6% 3.6% 2.2% 20.7% 100%
91304 Canoga Park 4,166 14.5% 3.8% 10.0% 5.0% 28.2% 12.5% 3.1% 1.2% 21.7% 100%
91367 Woodland Hills 3,632 6.7% 1.5% 17.6% 2.1% 28.5% 14.5% 1.0% 0.4% 27.8% 100%
91311 Chatsworth 3,390 18.6% 8.5% 6.9% 3.4% 19.4% 15.0% 2.3% 1.3% 24.7% 100%
91356 Tarzana 3,258 4.7% 1.6% 42.3% 3.1% 2.4% 8.8% 0.8% 1.1% 35.1% 100%
91340 San Fernando 3,018 2.5% 44.0% 2.1% 6.2% 0.5% 0.4% 13.9% 1.5% 28.9% 100%
91316 Encino 2,838 3.9% 1.7% 39.7% 3.0% 2.5% 6.6% 1.3% 1.4% 39.8% 100%
91325 Northridge 2,784 34.4% 9.6% 9.0% 5.0% 2.7% 8.2% 2.7% 2.0% 26.5% 100%
91324 Northridge 2,671 35.2% 6.2% 9.5% 4.6% 4.3% 8.6% 4.3% 1.5% 25.9% 100%
91326 Porter Ranch 2,476 22.0% 17.2% 8.9% 2.7% 4.4% 8.8% 1.5% 0.9% 33.6% 100%
91307 West Hills 2,422 5.6% 2.0% 10.3% 1.7% 42.9% 14.2% 0.9% 0.6% 21.8% 100%
91411 Van Nuys 2,351 2.7% 3.2% 5.8% 26.3% 0.3% 2.2% 5.8% 5.1% 48.6% 100%
91364 Woodland Hills 2,339 4.7% 0.9% 20.8% 2.5% 22.4% 14.2% 0.7% 0.6% 33.2% 100%
91303 Canoga Park 2,209 14.8% 2.5% 12.2% 6.6% 27.0% 10.3% 5.6% 0.8% 20.3% 100%
93065 Simi Valley 1,886 6.3% 3.2% 4.4% 1.3% 5.6% 33.1% 0.4% 0.2% 45.5% 100%
91345 Mission Hills 1,789 4.2% 40.7% 2.3% 5.3% 0.6% 1.2% 6.0% 6.2% 33.5% 100%
93063 Simi Valley 1,723 7.0% 5.1% 3.6% 1.6% 5.7% 34.8% 0.6% 0.7% 41.0% 100%
91436 Encino 1,445 2.8% 0.7% 23.9% 3.3% 1.2% 6.1% 0.4% 0.1% 61.5% 100%
93021 Moorpark 628 6.2% 1.8% 3.7% 1.6% 3.0% 33.4% 0.0% 0.5% 49.8% 100%
91328 Northridge 175 91.4% 1.1% 0.6% 0.6% 0.6% 1.7% 0.0% 0.0% 4.0% 100%
91357 Tarzana 60 13.3% 0.0% 16.7% 3.3% 13.3% 8.3% 1.7% 3.3% 40.0% 100%
91365 Woodland Hills 58 8.6% 0.0% 8.6% 3.4% 29.3% 10.3% 0.0% 0.0% 39.7% 100%
91603 North Hollywood 55 12.7% 5.5% 3.6% 7.3% 0.0% 3.6% 7.3% 0.0% 60.0% 100%
91313 Chatsworth 51 17.6% 0.0% 5.9% 9.8% 9.8% 23.5% 2.0% 0.0% 31.4% 100%
91409 Van Nuys 50 10.0% 14.0% 2.0% 12.0% 2.0% 4.0% 12.0% 2.0% 42.0% 100%
91416 Encino 35 20.0% 0.0% 31.4% 0.0% 0.0% 11.4% 0.0% 0.0% 37.1% 100%
91305 Canoga Park 34 20.6% 2.9% 8.8% 26.5% 11.8% 0.0% 0.0% 2.9% 26.5% 100%
91346 Mission Hills 33 21.2% 12.1% 6.1% 15.2% 0.0% 9.1% 3.0% 0.0% 33.3% 100%
Total Percentage 11.6% 11.5% 10.7% 9.4% 7.6% 7.5% 5.2% 3.8% 32.7% 100%
Total Discharges 92,637 10,789 10,625 9,869 8,697 7,036 6,948 4,839 3,516 30,318 Note: Excludes normal newborns Source: CY 2016 OSHPD Patient Discharge Database
● Northridge Hospital Medical Center is the market share leader in eight of the 35 ZIP Codes, located in the City of Los Angeles’ communities of Reseda, Winnetka, Northridge, Porter Ranch, North Hollywood and Mission Hills;

97
● West Hills Hospital and Medical Center is a market share leader in seven of 35 ZIP Codes located in the City of Los Angeles’ communities of Canoga Park, Woodland Hills, Chatsworth, West Hills; and
● Providence Holy Cross Medical Center is the market share leader in six of the 35 ZIP Codes located in the City of San Fernando and in the City of Los Angeles’ communities of Pacoima, North Hills, Granada Hills, Mission Hills, and Van Nuys.

98
Assessment of Potential Issues Associated with the Availability or Accessibility of Healthcare Services
In the Ministry Alignment Agreement, Dignity Health and CHI have made commitments to maintain all Dignity Health owned hospitals, IHO owned hospitals, and IHO subsidiary hospitals with their current levels of health services and programs. An analysis of these commitments is provided in the following sections. Continuation as General Acute Care Hospitals In the Ministry Alignment Agreement, Dignity Health and CHI committed to maintaining California Hospital Medical Center, Glendale Memorial Hospital and Health Center, St. Mary Medical Center and Northridge Hospital Medical Center as licensed acute care hospitals for five years after the Effective Date. Each hospital provides a significant amount of healthcare to the communities served as shown by their inpatient volume and market share. California Hospital Medical Center In FY 2017, the hospitals located within California Hospital Medical Center’s service area had a combined total of 1,661 licensed beds with an aggregate average occupancy rate of approximately 51%. In FY 2017, California Hospital Medical Center had 318 licensed beds that operated at an occupancy rate of 64%. In CY 2016, California Hospital Medical Center was the market share leader with 9% of the service area inpatient discharges. Furthermore, of the hospitals located within its service area, California Hospital Medical Center had 29% of the total inpatient discharges, representing 24% of the patient days. The table below shows the hospitals located within the Hospital’s service area.
SERVICE AREA HOSPITAL DATA
Hospital City
Licensed Beds
Inpatient Discharges
Patient Days
Average Daily
Census
Percent Occupied
Miles From
Hospital California Hospital Medical Center Los Angeles 318 17,799 74,435 204 64.1% -
Good Samaritan Hospital Los Angeles Los Angeles 408 11,944 56,205 154 37.7% 1.8
St. Vincent Medical Center Los Angeles 366 11,088 64,539 177 48.3% 2.8
Silver Lake Medical Center1 Los Angeles 234 7,011 53,263 146 62.4% 4.5
Olympia Medical Center1 Los Angeles 204 5,352 27,501 75 36.9% 6.3
Martin Luther King, Jr. Community Hospital
Los Angeles 131 7,496 30,762 84 64.3% 10.3
Total 1,661 60,690 306,705 840 51% Source: OSHPD Disclosure Report 1FY2017 OSHPD Discharges not reported. Audited FY 2016 is shown
Since California Hospital Medical Center has the highest number of inpatient discharges (17,799) and the largest market share (9.3%) of the hospitals located within the service area, it is a very important provider of healthcare services to the community.

99
Glendale Memorial Hospital and Health Center In FY 2017, the hospitals located within Glendale Memorial Hospital and Health Center’s primary service area had a combined total of 2,865 licensed beds with an aggregate average occupancy rate of approximately 57%. In FY 2017, Glendale Memorial Hospital and Health Center had 334 licensed beds in operation and operated at an occupancy rate of 39%. In CY 2016, Adventist Health Glendale was the market share leader with 26.6% of the primary service area discharges. Glendale Memorial Hospital and Health Center had the second largest market share with 11.6%. Furthermore, of the hospitals located within its service area, Glendale Memorial Hospital and Health Center had 9% of the total inpatient discharges, representing 8% of the patient days. The table below shows the hospitals located within the Hospital’s service area.
SERVICE AREA HOSPITAL DATA
Hospital City Licensed
Beds Inpatient
Discharges Patient
Days
Average Daily
Census Percent
Occupied
Miles From
Hospital Glendale Memorial Hospital and Health Center Glendale 3342 10,030 47,417 130 38.9% - Glendale Adventist Medical Center1 Glendale 515 21,157 104,057 285 55.3% 2.9 Keck Hospital Of USC Los Angeles 401 12,339 82,561 226 56.4% 7.3 Kaiser Foundation Hospitals - Sunset1 Los Angeles 528 25,974 129,375 354 67.0% 3.8 Hollywood Presbyterian Medical Center1 Los Angeles 434 12,977 88,401 242 55.8% 3.6 Children's Hospital Los Angeles Los Angeles 495 16,895 108,072 296 59.8% 3.6 USC Verdugo Hills Hospital Glendale 158 6,520 32,713 90 57.0% 8.6
Total 2,865 105,892 592,596 1,624 57%
Source: OSHPD Disclosure Report, Google Maps 1FY2017 OSHPD Discharges not reported. Audited FY 2016 is shown 219 Beds in Suspense
While Glendale Memorial Hospital and Health Center is an important provider of services with an average of daily census of 130 patients, all service area hospitals, except USC Verdugo Hills Hospital, have more licensed beds, a higher average daily census and excess capacity.

100
St. Mary Medical Center In FY 2017, the hospitals located within St. Mary Medical Center’s service area had a combined total of 2,094 licensed beds with an aggregate average occupancy rate of 53%. In FY 2017, St. Mary Medical Center had 389 licensed beds that operated at an occupancy rate of nearly 50%. In CY 2016, Long Beach Memorial Medical Center was the market share leader with 14.1% of the service area inpatient discharges. St. Mary Medical Center had the third largest market share with 8.8%. Furthermore, of the hospitals located within its service area, St. Mary Medical Center had 14% of the total inpatient discharges, representing 13% of the patient days. Community Hospital of Long Beach, that had an average daily census of 70 patients in FY 2017, closed on July 3, 2018. The following table shows the hospitals located within the Hospital’s service area.
SERVICE AREA HOSPITAL DATA
Hospital City
Licensed Beds
Inpatient Discharges
Patient Days
Average Daily
Census
Percent Occupied
Miles From
Hospital St. Mary Medical Center Long Beach 389 11,222 54,632 150 38.6% -
Long Beach Memorial Medical Center Long Beach 458 20,428 103,288 283 61.8% 2.2
Earl and Loraine Miller Children's Hospital Long Beach 355 15,603 72,153 198 55.7% 2.2
Community Hospital Long Beach Long Beach 158 5,760 25,429 70 44.1% 4.9
Lakewood Regional Medical Center Lakewood 172 8,688 40,539 111 64.6% 5.6
Kaiser Foundation Hospitals - South Bay1 Harbor Park 293 11,112 36,809 101 34.4% 7.9
Providence Little Co Of Mary Med Ctr - San Pedro1 San Pedro 356 7,917 72,987 200 56.2% 11.1
Total 2,094 80,730 405,837 1,113 53% Source: OSHPD Disclosure Report 1FY2017 OSHPD Discharges not reported. Audited FY 2016 is shown 253 Beds in Suspense
With an average of daily census of 150 patients and because the recent closure of Community Hospital of Long Beach, St. Mary Medical Center remains a very important provider of healthcare services to the community.

101
Northridge Hospital Medical Center
In FY 2017, the hospitals located within Northridge Hospital Medical Center’s service area had a combined total of 2,480 licensed beds with an aggregate average occupancy rate of 51%. In FY 2017, Northridge Hospital Medical Center was the largest area hospital with 424 licensed beds that operated at an occupancy rate of 42%. In CY 2016, Northridge Hospital Medical Center was the market share leader with 11.6% of the service area inpatient discharges. Furthermore, Northridge Hospital Medical Center had 14% of the total inpatient discharges, representing 14% of the patient days. The table below shows the hospitals located within the Hospitals service area.
SERVICE AREA HOSPITAL DATA
Hospital City
Licensed Beds
Inpatient Discharges
Patient Days
Average Daily
Census
Percent Occupied
Miles From
Hospital Northridge Hospital Medical Center Northridge 424 14,089 64,997 178 42.0% -
Tarzana Psychiatric Hospital Tarzana 60 2,524 14,513 40 66.3% 3.4
Providence Tarzana Medical Center1 Tarzana 249 13,377 52,195 143 57.4% 4.2
Mission Community Hospital - Panorama1 Panorama City 145 7,610 41,311 113 78.1% 4.4
Valley Presbyterian Hospital Van Nuys 350 13,481 69,470 190 54.4% 5.9
Kaiser Foundation Hospitals – Panorama1 Panorama City 218 9,097 29,025 80 36.5% 6.1
Encino Hospital Medical Center1 Encino 148 2,349 19,645 54 36.4% 6.7
Kaiser Foundation Hospitals - Woodland Hills1 Woodland Hills 284 9,607 32,395 89 31.3% 6.9
West Hills Hospital and Medical Center1 West Hills 225 9,105 42,567 117 51.8% 7.2
Providence Holy Cross Medical Center1 Mission Hills 377 18,263 92,550 254 67.3% 8.2
Total 2,480 99,502 458,668 1,258 51% Source: OSHPD Disclosure Report 1FY2017 OSHPD Discharges not reported. Audited FY 2016 is shown
Since Northridge Hospital Medical Center has the most licensed beds with the second highest number of inpatient discharges and the largest market share of hospitals located within the service area, it is a very important provider of healthcare services to the community. Emergency Services California Hospital Medical Center, Glendale Memorial Hospital and Health Center, St. Mary Medical Center and Northridge Hospital Medical Center are important providers of emergency services to the residents of their respective surrounding communities. In FY 2017, California Hospital Medical Center reported 80,607 emergency service visits to its 35 emergency treatment stations, operating at over 115% capacity32. During that same time period, Glendale Memorial Hospital and Health Center (a Level II Trauma Center) reported 38,514 emergency service visits to its 21 emergency treatment stations33, operating at 92% of capacity. In FY 2017, St. Mary Medical Center reported 54,745 emergency service visits to its 26 emergency treatment stations, operating at over 105% capacity. In FY 2017, Northridge Hospital Medical Center reported 67,770 emergency service visits to its 32 emergency treatment stations, operating at over 106% capacity.
32 Industry sources, including the American College of Emergency Physicians, use a benchmark of 2,000 visits per emergency station, per year, to estimate the
capacity. 33 Includes 6 Fast Track Treatment Stations.

102
As a result of the ACA and California’s participation in Medicaid expansion, more individuals are now eligible for healthcare coverage. This influx of newly insured individuals, combined with the growing shortage of primary care physicians, is expected to increase emergency department utilization. Keeping California Hospital Medical Center’s, Glendale Memorial Hospital and Health Center’s, St. Mary Medical Center’s, and Northridge Hospital Medical Center’s emergency departments open is important for providing area residents access to emergency services. In the Ministry Alignment Agreement, Dignity Health and CHI committed to maintaining the emergency services at all Dignity Health owned hospitals, IHO owned hospitals, and IHO subsidiary hospitals at current types and levels of services and current designations for five years after the Effective Date of the Ministry Alignment Agreement as shown below: The five-year commitments to California Hospital Medical Center’s existing emergency services include:
● 35 Treatment Stations; ● Paramedic Base Station; ● Level II Trauma Center; ● Perinatal Approved34; ● Emergency Department Approved for Pediatrics; and ● Certified Primary Stroke Center.
The five-year commitments to Glendale Memorial Hospital and Health Center’s existing emergency services include:
● 21 Treatment Stations (includes 6 Fast Track Treatment Stations)35; ● Certified Primary Stroke Center; ● STEMI Receiving Center; and ● County Lanterman-Petris-Short Designated 24-Hour Facility.
The five-year commitments to St. Mary Medical Center’s existing emergency services36 include:
● 26 Treatment Stations37; ● Paramedic Base Station; ● Level II Trauma Center; ● STEMI Receiving Center; and ● Emergency Department Approved for Pediatrics.
34 Perinatal Approved is not a formally recognized emergency center designation 35 Dignity Health committed to 31 treatment stations (includes 16 Fast Track Treatment Stations) at Glendale Memorial Hospital and Health Center in the Ministry Alignment Agreement; however, there are only 21 treatment stations, six of which are Fast Track Treatment Stations. 36 St. Mary Medical Center is also Primary Stroke Center. 37 Dignity Health committed to 23 treatment stations at St. Mary Medical Center in the Ministry Alignment Agreement; however, there are 26 treatment stations.

103
The five-year Commitments to Northridge Hospital Medical Center’s existing emergency services include:
● 32 Treatment Stations; ● Level II Trauma Center; ● Pediatric Trauma Center; ● Certified Primary Stroke Center; and ● County Lanterman-Petris-Short Designated 24-Hour Facility.
As a result of healthcare reform, aging demographics, and the growing shortage of primary care physicians, emergency department utilization is expected to continue to increase within each hospital’s primary service area. Maintaining California Hospital Medical Center’s, Glendale Memorial Hospital and Health Center’s, St. Mary Medical Center’s and Northridge Hospital Medical Center’s emergency departments open with at least their current number of emergency department stations and current Trauma Center Level designations is critical to providing emergency services within each hospital’s service area. The Los Angeles County Emergency Medical Services Director stated that while all of Dignity Health’s Los Angeles County emergency services are important, the Pediatric Trauma Center at Northridge Hospital Medical Center is especially important to remain in operation for patients needing pediatric trauma services given the distance of other Pediatric Trauma Centers within Los Angeles County. The table below shows Pediatric Trauma Centers within Los Angeles County and their distance from Northridge Hospital Medical Center.
LOS ANGELES COUNTY PEDIATRIC TRAUMA CENTERS1
Hospital Level
Distance from Northridge Hospital Medical
Center (miles)2
Northridge Hospital Medical Center II -
Ronald Regan UCLA Medical Center I 15.5
Cedars-Sinai Medical Center II 19.2
Children's Hospital of Los Angeles I 19.3
LAC + USC Medical Center II 29.2
Harbor UCLA Medical Center II 35.9
Long Beach Memorial + Miller Children's Medical Center II 41.2 1 As of June 2017 2 Distance by motor vehicle
Reproductive Health Services California Hospital Medical Center, Glendale Memorial Hospital and Health Center, St. Mary Medical Center and Northridge Hospital Medical Center are all important providers of healthcare services to women. These four Hospitals reported the following average live births per year between FY 2015 and FY 2017:

104
California Hospital Medical Center: 3,686 live births per year;
Glendale Memorial Hospital and Health Center: 1,824 live births per year;
St. Mary Medical Center: 2,405 live births per year; and
Northridge Hospital Medical Center: 1,034 live births per year. California Hospital Medical Center, Glendale Memorial Hospital and Health Center and Northridge Hospital Medical Center are non-Catholic hospitals and are not subject to the ERDs. Under the Ministry Alignment Agreement, all Dignity Health non-Catholic hospitals are not subject to the ERDs. Dignity Health’s non-Catholic hospitals will transition to IHO on the Effective Date. All IHO hospitals will adopt Dignity Health’s Statement of Common Values that prohibits direct abortion, in-vitro fertilization, and physician-assisted suicide. Because these hospitals are subject to Dignity Health’s Statement of Common Values and not to the ERDs, no reductions in the availability or accessibility of reproductive healthcare services are expected at California Hospital Medical Center, Glendale Memorial Hospital and Health Center and Northridge Hospital Medical Center as a result of this transaction. St. Mary Medical Center is a Catholic hospital and currently subject to the ERDs and will continue to be subject to the ERDs after the Effective Date. Under the ERDs, some women’s reproductive health services, including direct abortions and tubal ligations, are prohibited. Although the ERDs prohibit tubal ligations and direct abortions, these procedures are performed at St. Mary Medical Center when the pathology is determined to present a medical need and/or a clear and present danger to the patient. St. Mary Medical Center is an important provider of a range of women’s reproductive services and provides these services to a large underserved population that has lower rates of prenatal care, resulting in an increased number of high-risk births. This can increase instances of stillborn delivery, miscarriage, and fetal abnormalities. No future reductions in availability and accessibility of reproductive health services are expected at St. Mary Medical Center as a result of the Ministry Alignment Agreement.

105
The table below shows recorded inpatient reproductive service procedures in CY 2016 at California Hospital Medical Center, Glendale Memorial Hospital and Health Center, St. Mary Medical Center and Northridge Hospital Medical Center.
CY 2016 REPRODUCTIVE SERVICE BY DIAGNOSTIC RELATED GROUP
Diagnostic Related Group
Glendale Memorial
Hospital Medical
Center
California Hospital Medical
Center
St. Mary Medical
Center
Northridge Hospital Medical
Center 767-Vaginal Delivery W Sterilization &/Or D&C 45 17 4 47 770-Abortion W D&C, Aspiration Curettage Or Hysterotomy 7 21 20 6 779-Abortion W/O D&C 4 21 15 10 777-Ectopic Pregnancy 11 25 31 7 778-Threatened Abortion 21 46 66 11 Total CY 2016 Discharges: 88 130 136 81
Source: CY 2016 OSHPD Patient Discharge Database 1D&C is an abbreviation for Dilation and Curettage
Effects on the Level & Type of Charity Care Historically Provided Dignity Health committed to providing an annual amount of charity care based on the three most recent fiscal years as shown in the following table. As noted previously, Dignity Health has acknowledged that an error was made in its calculation of charity care costs. Dignity Health has stated that they will comply with the charity care cost amounts determined in the manner previously described.
CHARITY CARE COSTS
Dignity Health1 OSHPD Reported2
FY 2015 - FY 2017 Average
FY 2013 - FY 2017 Average
FY 2015 - FY 2017 Average
FY 2013 - FY 2017 Average
California Hospital Medical Center $12,240,124 $18,600,350 $15,743,084 $22,037,897
Glendale Memorial Hospital and Health Center $2,101,442 $2,771,739 $4,795,885 $4,753,972
St. Mary Medical Center $2,101,442 $2,771,739 $4,932,216 $8,246,816
Northridge Hospital Medical Center $5,172,556 $7,052,657 $3,963,070 $6,855,595 1 Dignity Health charity care commitment as calculated by Dignity Health FY 2015 - FY 2017 2 Charity care as reported in OSHPD Disclosure Reports FY 2013 - FY 2017.
Effects on Services to Medi-Cal, Medicare & Other Classes of Patients California Hospital Medical Center, Glendale Memorial Hospital and Health Center, St. Mary Medical Center and Northridge Hospital Medical Center all participate in the Medicare and Medi-Cal programs, contract with Medi-Cal managed care plans, and provide services to other indigent, county indigent, and private pay patients. As a result of the expansion of Medi-Cal due to the ACA, fewer low income individuals and families are uninsured. Additionally, in Los Angeles County, qualified low income patients are able to access the County owned clinics and hospitals. As a result, even though county indigent
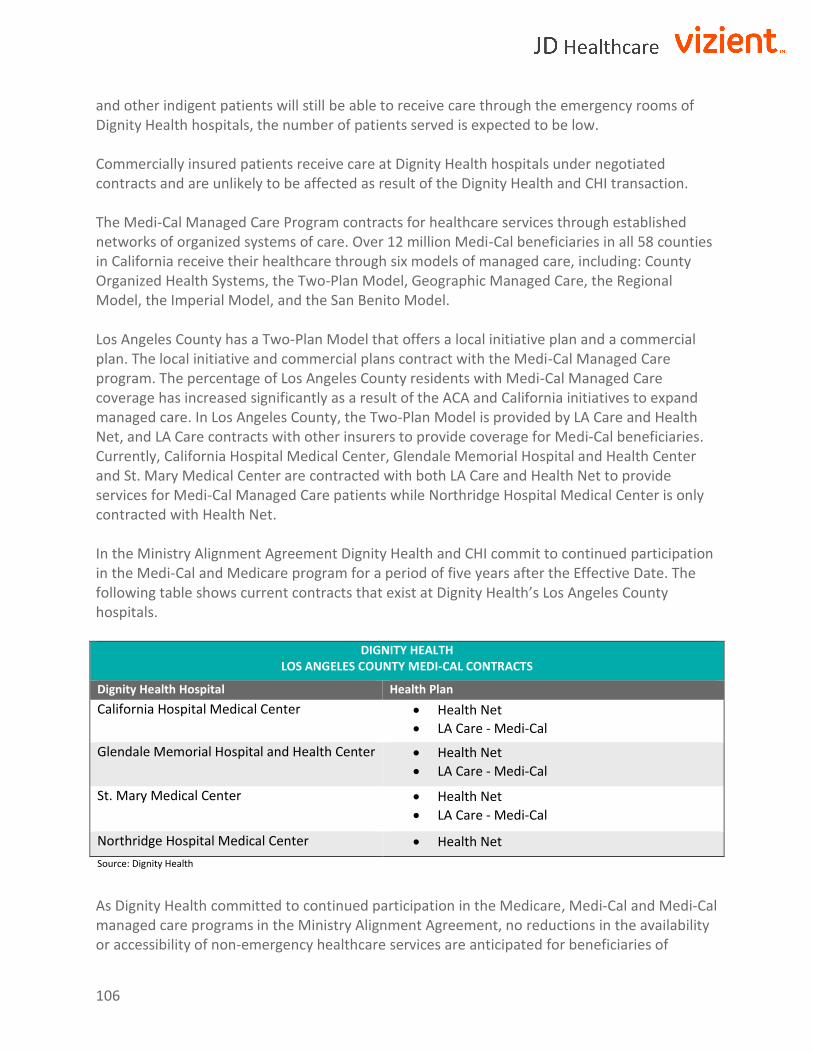
106
and other indigent patients will still be able to receive care through the emergency rooms of Dignity Health hospitals, the number of patients served is expected to be low. Commercially insured patients receive care at Dignity Health hospitals under negotiated contracts and are unlikely to be affected as result of the Dignity Health and CHI transaction. The Medi-Cal Managed Care Program contracts for healthcare services through established networks of organized systems of care. Over 12 million Medi-Cal beneficiaries in all 58 counties in California receive their healthcare through six models of managed care, including: County Organized Health Systems, the Two-Plan Model, Geographic Managed Care, the Regional Model, the Imperial Model, and the San Benito Model. Los Angeles County has a Two-Plan Model that offers a local initiative plan and a commercial plan. The local initiative and commercial plans contract with the Medi-Cal Managed Care program. The percentage of Los Angeles County residents with Medi-Cal Managed Care coverage has increased significantly as a result of the ACA and California initiatives to expand managed care. In Los Angeles County, the Two-Plan Model is provided by LA Care and Health Net, and LA Care contracts with other insurers to provide coverage for Medi-Cal beneficiaries. Currently, California Hospital Medical Center, Glendale Memorial Hospital and Health Center and St. Mary Medical Center are contracted with both LA Care and Health Net to provide services for Medi-Cal Managed Care patients while Northridge Hospital Medical Center is only contracted with Health Net. In the Ministry Alignment Agreement Dignity Health and CHI commit to continued participation in the Medi-Cal and Medicare program for a period of five years after the Effective Date. The following table shows current contracts that exist at Dignity Health’s Los Angeles County hospitals.
DIGNITY HEALTH LOS ANGELES COUNTY MEDI-CAL CONTRACTS
Dignity Health Hospital Health Plan
California Hospital Medical Center Health Net
LA Care - Medi-Cal
Glendale Memorial Hospital and Health Center Health Net
LA Care - Medi-Cal
St. Mary Medical Center Health Net
LA Care - Medi-Cal
Northridge Hospital Medical Center Health Net
Source: Dignity Health
As Dignity Health committed to continued participation in the Medicare, Medi-Cal and Medi-Cal managed care programs in the Ministry Alignment Agreement, no reductions in the availability or accessibility of non-emergency healthcare services are anticipated for beneficiaries of

107
Medicare, Medi-Cal, and Medi-Cal managed care programs for at least five years after the Effective Date. Effects on Community Benefit Programs California Hospital Medical Center, Glendale Memorial Hospital and Health Center, St. Mary Medical Center, and Northridge Hospital Medical Center support a significant number of ongoing community benefit programs that serve the residents of the surrounding communities. In the Ministry Alignment Agreement, Dignity Health and CHI have made commitments to maintain expenditures for community benefit services based on an average of the expenditures for the years FY 2015-2017. The table below shows the annual average for both the three and five fiscal years at California Hospital Medical Center, Glendale Memorial Hospital and Health Center, St. Mary Medical Center, and Northridge Hospital Medical Center.
LOS ANGELES COUNTY COMMUNITY BENEFIT
FY 2015 - FY 2017* FY 2013 – FY 2017*
California Hospital Medical Center $14,656,615 $17,161,733 Glendale Memorial Hospital & Health Center $1,108,027 $1,600,733
St. Mary Medical Center $12,120,448 $11,812,532
Northridge Hospital Medical Center $14,486,875 $15,005,790 *Less Medi-Cal Provider Fees and other non-community benefit costs as detailed in the profile sections.
While all four facilities offer various community benefit programs, the Ministry Alignment Agreement includes commitments to maintain some, but not all, of the community benefit programs. The following table shows the service and program commitments made by Dignity Health and CHI.

108
COMMITTED COMMUNITY BENEFIT SERVICES AND PROGRAMS
Hospital Name Community Benefit Service and Program Name
California Hospital Medical Center Dignity Health Community Grants Program
Grants on Community Education for Children and Families
Health Ministry – Blood Pressure Screening
Health Ministry - Cholesterol Screening
Health Ministry – Comm Health Education Coordination
Health Ministry – Diabetes Glucose Screening
Health Ministry – Hemoglobin Screening
Health Ministry – parish nurse Health Ministry Coordinator
Health Ministry – Your Body Weight and Body Mass Index
Health HELP – Initial and Follow Up Screenings
Health HELP CVD – Program Implementation
Residency Program
Glendale Memorial Hospital and Health Center
50Plus Senior Services
Breastfeeding Resource Center (BFRC) – Support Group
Breastfeeding Resource Center (BFRC) – Telephone Warm Line
Dignity Health Community Grants Program
Community Health Fair
St. Mary Medical Center Diabetes Outpatient Self Management
Dignity Health Community Grants
Families in Good Health: Multiple Programs
GME Medical Education
Mobile Care Van Clinic
Senior Center Programs (Bazzeni Wellness Center)
Transportation Program Indigent
Northridge Hospital Medical Center CATS – Center for Assault Treatment Services – Clinical
CATS – Center for Assault Treatment Services – Outreach
Community and School Wellness Programs
Community Room Use
Diabetes Wellness Rx – DEEP Program
Dignity Health Community Grants Program
Family Practice Residency Program
Health Education
Nursing Students
Effects on Hospital Licensed Services California Hospital Medical Center, Glendale Memorial Hospital and Health Center, St. Mary Medical Center and Northridge Hospital Medical Center are important providers of inpatient services to the residents of their respective communities. Dignity Health and CHI committed to maintaining all licensed services at current types and levels of services and current designations for five years after the Effective Date of the Ministry Alignment Agreement as follows: Licensed Service Commitments for California Hospital Medical Center:
● Obstetrics services, including a minimum of 37 licensed perinatal beds; ● Critical care services, including a minimum of 28 licensed intensive care beds38;
38 The licensed intensive care beds are scheduled to be relocated to California Hospital Medical Center’s new tower in 2021. The new building will accommodate 22 licensed intensive care beds.
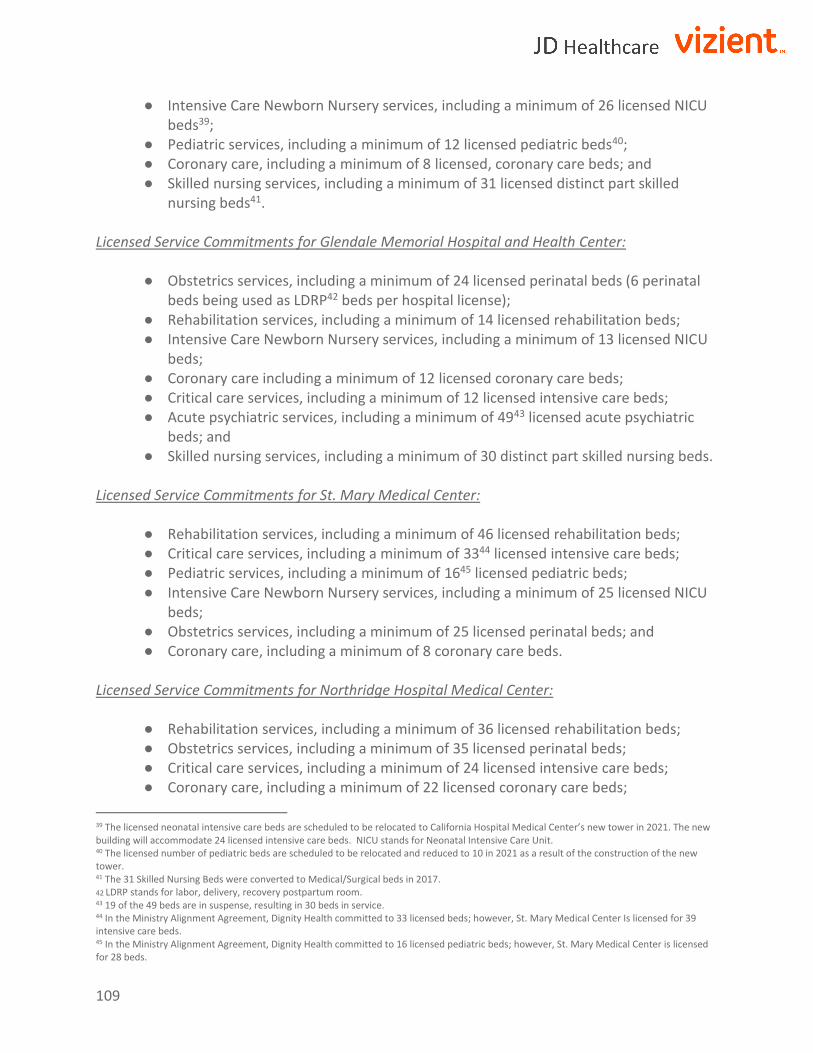
109
● Intensive Care Newborn Nursery services, including a minimum of 26 licensed NICU beds39;
● Pediatric services, including a minimum of 12 licensed pediatric beds40; ● Coronary care, including a minimum of 8 licensed, coronary care beds; and ● Skilled nursing services, including a minimum of 31 licensed distinct part skilled
nursing beds41. Licensed Service Commitments for Glendale Memorial Hospital and Health Center:
● Obstetrics services, including a minimum of 24 licensed perinatal beds (6 perinatal
beds being used as LDRP42 beds per hospital license); ● Rehabilitation services, including a minimum of 14 licensed rehabilitation beds; ● Intensive Care Newborn Nursery services, including a minimum of 13 licensed NICU
beds; ● Coronary care including a minimum of 12 licensed coronary care beds; ● Critical care services, including a minimum of 12 licensed intensive care beds; ● Acute psychiatric services, including a minimum of 4943 licensed acute psychiatric
beds; and ● Skilled nursing services, including a minimum of 30 distinct part skilled nursing beds.
Licensed Service Commitments for St. Mary Medical Center:
● Rehabilitation services, including a minimum of 46 licensed rehabilitation beds; ● Critical care services, including a minimum of 3344 licensed intensive care beds; ● Pediatric services, including a minimum of 1645 licensed pediatric beds; ● Intensive Care Newborn Nursery services, including a minimum of 25 licensed NICU
beds; ● Obstetrics services, including a minimum of 25 licensed perinatal beds; and ● Coronary care, including a minimum of 8 coronary care beds.
Licensed Service Commitments for Northridge Hospital Medical Center:
● Rehabilitation services, including a minimum of 36 licensed rehabilitation beds; ● Obstetrics services, including a minimum of 35 licensed perinatal beds; ● Critical care services, including a minimum of 24 licensed intensive care beds; ● Coronary care, including a minimum of 22 licensed coronary care beds;
39 The licensed neonatal intensive care beds are scheduled to be relocated to California Hospital Medical Center’s new tower in 2021. The new building will accommodate 24 licensed intensive care beds. NICU stands for Neonatal Intensive Care Unit. 40 The licensed number of pediatric beds are scheduled to be relocated and reduced to 10 in 2021 as a result of the construction of the new tower. 41 The 31 Skilled Nursing Beds were converted to Medical/Surgical beds in 2017. 42 LDRP stands for labor, delivery, recovery postpartum room. 43 19 of the 49 beds are in suspense, resulting in 30 beds in service. 44 In the Ministry Alignment Agreement, Dignity Health committed to 33 licensed beds; however, St. Mary Medical Center Is licensed for 39 intensive care beds. 45 In the Ministry Alignment Agreement, Dignity Health committed to 16 licensed pediatric beds; however, St. Mary Medical Center is licensed for 28 beds.

110
● Pediatric services, including a minimum of 20 licensed pediatric beds; ● Intensive Care Newborn Nursery services, including a minimum of 18 licensed NICU
beds; and ● Acute psychiatric services, including a minimum of 40 licensed distinct part acute
psychiatric beds, and outpatient behavioral health services. Since Dignity Health and CHI make extensive five-year commitments to licensed inpatient services, no reductions in the availability or accessibility of healthcare services are expected for California Hospital Medical Center, Glendale Memorial Hospital and Health Center, St. Mary Medical Center and Northridge Hospital Medical Center for at least five years as a result of the Ministry Alignment Agreement. Effects on Programs and Services California Hospital Medical Center, Glendale Memorial Hospital and Health Center, St. Mary Medical Center and Northridge Hospital Medical Center are important providers of inpatient and outpatient programs and services to the residents of their respective surrounding communities. Dignity Health and CHI committed to maintaining additional licensed programs and services at current types and levels and current designations for five years after the Effective Date of the Ministry Alignment Agreement as follows:
Programs and Services Commitment for California Hospital Medical Center:
● Cardiovascular services; ● Oncology services, including radiation therapy services46; ● Orthopedic surgery services, including total joint replacements; ● General surgery services; ● Nuclear medicine services; ● Imaging and radiology services (inpatient and outpatient); ● Outpatient Services – Radiology & Imaging at Women’s Health Center; ● Laboratory services; ● Occupational therapy services; ● Physical therapy services; ● Respiratory care services; ● Social services; and ● Speech pathology services.
Programs and Services Commitment for Glendale Memorial Hospital and Health Center:
● Cardiovascular services; ● Neuroscience services, including neurosurgery services; ● Oncology services, including inpatient medical and surgical oncology services;
46 Radiation therapy services are provided in conjunction with an outside service provider, Vantage Oncology.

111
● Orthopedic surgery services, including total joint replacements; ● General surgery services, including bariatric surgery services; ● Outpatient Services – G.I. Lab/Surgery; ● Outpatient Services - AIDS Clinic; ● Colorectal Surgery Institute Clinic; ● Outpatient Services – Diagnostic Testing/Wound Care; ● Outpatient Services - OB/Gyn; ● Outpatient Services – GI Lab/Surgery; ● Outpatient Services – Physical Therapy, Occupational Therapy and Speech Therapy; ● Nuclear medicine services; ● Imaging and radiology services (inpatient and outpatient); ● Laboratory services; ● Audiology services; ● Occupational therapy services; ● Physical therapy services; ● Respiratory care services; ● Social services; and ● Speech pathology services.
Programs and Services Commitment for St. Mary Medical Center:
● Cardiovascular services ● Neuroscience services, including neurosurgery services; ● Oncology services, including inpatient medical and surgical oncology services;
o Outpatient Services - Radiation Center; ● Orthopedic surgery services, including total joint replacements; ● General surgery services, including bariatric surgery services;
o Outpatient Clinic - Center for Surgical Treatment for Obesity; ● Outpatient Services - Ambulatory Surgery Center; ● Nuclear medicine services; ● Imaging and radiology services (inpatient and outpatient); ● Laboratory services; ● Outpatient Services - Geriatrics Clinic; ● Outpatient Services - Care Clinic (AIDS/HIV); ● Outpatient Services - SMMC Perinatal Clinic; ● Outpatient Services – OB Clinic; ● Outpatient Services – Dental services; ● Audiology services; ● Occupational therapy services; ● Physical therapy services; ● Respiratory care services; ● Social services; and ● Speech pathology services.

112
Programs and Services Commitment Northridge Hospital Medical Center:
● Oncology services, including inpatient medical and surgical oncology services; ● Radiation therapy services; ● Outpatient Services – chemotherapy;
● Neuroscience services, including neurosurgery services; ● Outpatient Services – Neurology/Cath Lab; ● Orthopedic surgery services, including total joint replacements; ● General surgery services; ● Outpatient Services - Women’s Health Clinic; ● Nuclear medicine services; ● Imaging and radiology services (inpatient and outpatient), including Mobile Unit –
MRI; ● Outpatient Services – clinical pathology/cardiology; ● Laboratory services; ● Occupational therapy services; ● Physical therapy services; ● Respiratory care services; ● Social services; ● Speech pathology services; and ● Speech therapy services.
Since Dignity Health and CHI have committed to maintaining these additional licensed services and programs for five years after the Effective Date at California Hospital Medical Center, Glendale Memorial Hospital and Health Center, St. Mary Medical Center, and Northridge Hospital Medical Center, no negative impacts on the access and availability of healthcare services are expected for at least five years as a result of the Ministry Alignment Agreement.
Effects on Staffing & Employee Rights Dignity Health states that the proposed transaction will not change the status of any of Dignity Health’s non-executive employees. Dignity Health and CHI in the Ministry Alignment Agreement also agree to maintain the respective terms of the collective bargaining agreements that are in effect as of the Effective Date as shown below. Union Contracts for California Hospital Medical Center:
Committee of Interns and Residents- Service Employees International Union (CIR SEIU);
California Nurses Association (CNA); and
Service Employees International Union- United Healthcare Workers West (SEIU UHW). Union Contracts for Glendale Memorial Hospital and Health Center:

113
Caregiver and Healthcare Employees Union (CHEU);
California Nurses Association (CNA); and
Service Employees International Union- United Healthcare Workers West (SEIU UHW).
Union Contracts for St. Mary Medical Center:
Committee of Interns and Residents- Service Employees International Union (CIR SEIU);
California Nurses Association (CNA); and
Service Employees International Union- United Healthcare Workers West (SEIU UHW). Union Contracts for Northridge Hospital Medical Center:
Caregiver and Healthcare Employees Union (CHEU); and
Service Employees International Union- United Healthcare Workers West (SEIU UHW). It is anticipated that no reductions in the number of non-executive employees are expected at California Hospital Medical Center, Glendale Memorial Hospital and Health Center, St. Mary Medical Center and Northridge Hospital Medical Center as a result of the Ministry Alignment Agreement. Effects on Medical Staff Dignity Health and CHI have committed to maintaining privileges for the current medical staff members of each Dignity Health California Hospital who are in good standing as of the Effective Date of the Ministry Alignment Agreement. Since Dignity Health committed to maintain the medical staffs’ privileges, no reductions in the medical staff at California Hospital Medical Center, Glendale Memorial Hospital and Health Center, St. Mary Medical Center and Northridge Hospital Medical Center are expected. Effects on City and County Contracts California Hospital Medical Center, Glendale Memorial Hospital and Health Center, St. Mary Medical Center and Northridge Hospital Medical Center have a number of contracts with Los Angeles County to provide and support specific services. According to the Ministry Alignment Agreement, these contracts will be maintained for a period of five years after the Effective Date, unless the contract is terminated for cause or expires in accordance with its current terms. Alternatives If the proposed Ministry Alignment Agreement is not approved, Dignity Health is expected to
continue to operate as it has in the past. It may look for future partnerships; however, none are
evident at this time.

114
Conclusions and Recommendations Based on Dignity Health’s and CHI’s commitments contained in the Ministry Alignment Agreement, the proposed transaction is likely to preserve the accessibility and availability of healthcare services to the communities served for at least five years. If the transaction is not approved, Dignity Health will have no obligation to maintain these commitments. Potential Conditions for California Attorney General Approval of the Ministry Alignment Agreement If the California Attorney General approves the proposed transaction, JD Healthcare Inc. and Vizient Inc. recommend the following conditions be required to minimize any potential negative healthcare impact that might result from the transaction: California Hospital Medical Center
1. For at least ten years from the Closing Date of the Ministry Alignment Agreement, California Hospital Medical Center shall continue to operate as a general acute care hospital;
2. For at least five years from the Closing Date of the Ministry Alignment Agreement, California Hospital Medical Center shall maintain 24-hour emergency services at no less than current licensure and designation with the same types and/or levels of services, including the following:
a. 35 Treatment Stations; b. Paramedic Base Station; c. Level II Trauma Center; d. Emergency Department Approved for Pediatrics; and e. Certified Primary Stroke Center.
3. For at least five years from the Closing Date of the Ministry Alignment Agreement,
California Hospital Medical Center shall maintain the following services at current licensure, types, and/or levels of services:
a. Obstetrics services, including a minimum of 37 licensed perinatal beds; b. Critical care services, including a minimum of 22 licensed intensive care beds and
a minimum of 8 licensed coronary care beds; c. Intensive Care Newborn Nursery services, including a minimum of 24 neonatal
intensive care beds; and d. Pediatric services, including a minimum of 10 pediatric beds;
4. For at least five years from the Closing Date of the Ministry Alignment Agreement, California Hospital Medical Center shall maintain currently provided women’s

115
healthcare services as well as the Women’s Health Center currently located at 1513 South Grand Avenue, Suite 400, Los Angeles, California 90015;
5. For at least five years from the Closing Date of the Ministry Alignment Agreement, California Hospital Medical Center shall maintain the following services as committed to Attachment D in Exhibit L of the Ministry Alignment Agreement:
a. Cardiovascular services; b. Oncology services, including radiation and therapy services; c. Orthopedic surgery services, including total joint replacements; d. General surgery services; e. Nuclear medicine services; f. Imaging and radiology services (inpatient and outpatient); g. Laboratory services; h. Occupational therapy services; i. Physical therapy services; j. Respiratory care services; k. Social services; and l. Speech pathology services.
6. For at least five years from the Closing Date of the Ministry Alignment Agreement,
California Hospital Medical Center shall maintain a charity care policy that is no less favorable than its current charity care policy and in compliance with California and Federal law, and California Hospital Medical Center shall provide an annual amount of charity care equal to or greater than $22,037,897 (the “Minimum Charity Care Amount”). Alternatively, because of the impact of Medi-Cal expansion and the ACA, the California Attorney General could consider adjusting the required commitment to charity care based on available data from time periods after implementation of the ACA. An example would be to require a commitment based on a three-year rolling average of the most recent available data. For FY 2018, California Hospital Medical Center’s required Minimum Charity Care amount using the three-year rolling average from FY 2015 to FY 2017 would be $15,743,084. For purposes herein, the term “Charity Care” shall mean the amount of charity care costs (not charges) incurred by California Hospital Medical Center in connection with the operations and provision of services at California Hospital Medical Center. The definition and methodology for calculating “Charity Care” and the methodology for calculating “cost” shall be the same as that used by OSHPD for annual hospital reporting purposes. The Minimum Charity Care Amount will be increased on an annual basis by the rate of inflation as measured by the Consumer Price Index from the U.S. Bureau of Labor Statistics;
7. For at least five years from the Closing Date of the Ministry Alignment Agreement, California Hospital Medical Center shall continue to expend no less than $17,161,733 annually in community benefit services. This amount should be increased annually based on the Consumer Price Index for Los Angeles-Long Beach-Anaheim, California. In

116
addition, the following community benefit programs shall continue to be offered for at least five years from closing;
a. Hope Street Family Center; b. Health Ministry - Blood Pressure Screening; c. Health Ministry - Cholesterol Screening; d. Health Ministry - Comm Health Education Coordination; e. Health Ministry - Diabetes Glucose Screening; f. Health Ministry - Hemoglobin Screening; g. Health Ministry - Parish nurse Health Ministry Coordinator; h. Health Ministry - Your Body Weight and Body Mass Index; i. Heart HELP - Initial and Follow Up Screenings; j. Heart HELP CVD - Program Implementation; and k. Residency Program
8. For at least five years from the Closing Date of the Ministry Alignment Agreement,
California Hospital Medical Center shall maintain its participation in the Medicare program, providing the same types and/or levels of emergency and non-emergency services to Medicare beneficiaries, on the same terms and conditions as other similarly situated hospitals, by maintaining a Medicare Provider Number;
9. For at least five years from the Closing Date of the Ministry Alignment Agreement, California Hospital Medical Center shall be certified to participate in the Medi-Cal program, providing the same type, and/or levels of emergency and non-emergency services to Medi-Cal beneficiaries;
10. For at least five years from the Closing Date of the Ministry Alignment Agreement, California Hospital Medical Center shall maintain its participation in the Medi-Cal Managed Care program, providing the same types and/or levels of emergency and non-emergency services to Medi-Cal beneficiaries, on the same terms and conditions as other similarly situated hospitals offering substantially the same services, without any loss, interruption of service, or decrease of quality, or gap in contracted hospital coverage, including continuation of the following contracts:
a. Commercial Plan: Health Net or its successor; and b. Local Initiative: L.A. Care Health Plan or its successor.
11. For at least five years from the Closing Date of the Ministry Alignment Agreement,
California Hospital Medical Center shall maintain its current city/county contracts for the programs listed below:
a. Community Health Coverage Agreement (Children’s Health Outreach Enrollment, Utilization and Retention Services);
b. Mental Health Services;

117
c. Family Preservation – Metro North Regional Services Area; d. Family Preservation – Vermont Corridor Regional Services Area; e. Extension of Wraparound Approach Services Contract; f. Family Strengthening Oversight Entity; g. Grant Agreement for Family Strategy 1 – Welcome Baby Hospitals Initiative; h. Proposition K Grant Agreement for Maintenance Funding; i. Participation in the Hospital Preparedness Program; j. Affiliation Agreement for Physicians in Postgraduate Training Catholic Healthcare
West; and k. First 5 LA MAMA’s Neighborhood.
12. Dignity Health and CHI shall commit the necessary investments required to meet and
maintain OSHPD seismic compliance requirements at California Hospital Medical Center
until January 1, 2030 under the Alfred E. Alquist Hospital Facilities Seismic Safety Act of
1983, as amended by the California Hospital Facilities Seismic Safety Act (Health &
Safety Code, § 129675-130070); and
13. California Hospital Medical Center shall maintain written policies that prohibit
discrimination against lesbian, gay, bisexual, or transgender individuals.
Glendale Memorial Hospital and Health Center:
1. For at least five years from the Closing Date of the Ministry Alignment Agreement,
Glendale Memorial Hospital and Health Center shall continue to operate as a general acute care hospital;
2. For at least five years from the Closing Date of the Ministry Alignment Agreement, Glendale Memorial Hospital and Health Center shall maintain 24-hour emergency services at no less than current licensure and designation with the same types and/or levels of services, including the following:
a. 21 Treatment Stations (includes six Fast Track Treatment Stations); b. Emergency Department Approved for Pediatrics c. Certified Primary Stroke Center; d. STEMI Receiving Center; and e. County Lanterman-Petris-Short Designated 24-Hour Facility.
3. For at least five years from the Closing Date of the Ministry Alignment Agreement, Glendale Memorial Hospital and Health Center shall maintain the following services at current licensure, types, and/or levels of services:
a. Obstetrics services, including a minimum of 24 licensed perinatal beds (6 perinatal beds being used as LDRP beds per hospital license);

118
b. Rehabilitation services, including a minimum of 14 licensed rehabilitation beds;
c. Intensive Care Newborn Nursery services, including a minimum of 13 licensed NICU beds;
d. Critical care services, including a minimum of 12 licensed intensive care beds and a minimum of 8 licensed coronary care beds;
e. Acute psychiatric services, including a minimum of 30 licensed acute psychiatric beds; and
f. Skilled nursing services, including a minimum of 30 distinct part skilled nursing beds.
4. For at least five years from the Closing Date of the Ministry Alignment Agreement,
Glendale Memorial Hospital and Health Center shall maintain currently provided women’s healthcare services, as well as the Women’s Center and the Marcia Ray Breastlink Women’s Imaging Center currently located at 222 West Eulalia Street, Glendale, California 91204;
5. For at least five years from the Closing Date of the Ministry Alignment Agreement,
Glendale Memorial Hospital and Health Center shall maintain the following services as committed to in Exhibit L of the Ministry Alignment Agreement:
a. Cardiovascular service; b. Neuroscience services, including neurosurgery services; c. Oncology services, including inpatient medical and surgical oncology services; d. Orthopedic surgery services, including total joint replacements; e. General surgery services, including bariatric surgery services; f. Outpatient Services - G.I. Lab/Surgery; g. Outpatient Services - AIDS Clinic; h. Outpatient Services - Colorectal Surgery Institute Clinic; i. Outpatient Services - Diagnostic Testing/Wound Care; j. Outpatient Services - OB/Gyn; k. Outpatient Services - Physical Therapy, Occupational Therapy and Speech
Therapy; l. Nuclear medicine services; m. Imaging and radiology services (inpatient and outpatient); n. Laboratory services; o. Audiology services; p. Occupational therapy services; q. Physical therapy services; r. Respiratory care services; s. Social services; and t. Speech pathology services.

119
6. For at least five years from the Closing Date of the Ministry Alignment Agreement, Glendale Memorial Hospital and Health Center shall maintain a charity care policy that is no less favorable than its current charity care policy and in compliance with California and Federal law, and Glendale Memorial Hospital and Health Center shall provide an annual amount of charity care equal to or greater than $4,753,972 (the “Minimum Charity Care Amount”). Alternatively, because of the impact of Medi-Cal expansion and the ACA, the California Attorney General could consider adjusting the required commitment to charity care based on available data from time periods after implementation of the ACA. An example would be to require a commitment based on a three-year rolling average of the most recent available data. For FY 2018, Glendale Memorial Hospital and Health Center’s required Minimum Charity Care amount using the three-year rolling average from FY 2015 to FY 2017 would be $4,795,885. For purposes herein, the term “Charity Care” shall mean the amount of charity care costs (not charges) incurred by Glendale Memorial Hospital and Health Center in connection with the operations and provision of services at Glendale Memorial Hospital and Health Center. The definition and methodology for calculating “Charity Care” and the methodology for calculating “cost” shall be the same as that used by OSHPD for annual hospital reporting purposes. The Minimum Charity Care Amount will be increased on an annual basis by the rate of inflation as measured by the Consumer Price Index from the U.S. Bureau of Labor Statistics;
7. For at least five years from the Closing Date of the Ministry Alignment Agreement, Glendale Memorial Hospital and Health Center shall continue to expend no less than $1,600,733 annually in community benefit services. This amount should be increased annually based on the Consumer Price Index for Los Angeles-Long Beach-Anaheim, California. In addition, the following community benefit programs shall continue to be offered for at least five years from closing;
a. 50Plus Senior Services; b. Breastfeeding Resource Center (BFRC) - Support Group; c. Breastfeeding Resource Center (BFRC) - Telephone Warm Line; d. Dignity Health Community Grants Program; and e. Community Health Fair.
8. For at least five years from the Closing Date of the Ministry Alignment Agreement,
Glendale Memorial Hospital and Health Center shall maintain its participation in the Medicare program, providing the same types and/or levels of emergency and non-emergency services to Medicare beneficiaries, on the same terms and conditions as other similarly situated hospitals, by maintaining a Medicare Provider Number.
9. For at least five years from the Closing Date of the Ministry Alignment Agreement, Glendale Memorial Hospital and Health Center shall be certified to participate in the Medi-Cal program, providing the same type, and/or levels of emergency and non-emergency services to Medi-Cal beneficiaries;

120
10. For at least five years from the Closing Date of the Ministry Alignment Agreement,
Glendale Memorial Hospital and Health Center shall maintain its participation in the Medi-Cal Managed Care program, providing the same types and/or levels of emergency and non-emergency services to Medi-Cal beneficiaries, on the same terms and conditions as other similarly situated hospitals offering substantially the same services, without any loss, interruption of service, or decrease of quality, or gap in contracted hospital coverage, including continuation of the following contracts:
a. Commercial Plan: Health Net or its successor; and b. Local Initiative: L.A. Care Health Plan or its successor.
11. For at least five years from the Closing Date of the Ministry Alignment Agreement,
Glendale Memorial Hospital and Health Center shall maintain its current city/county contract for the program listed below:
a. Glendale City, Police Department in Custody Services Agreement.
12. Dignity Health and CHI shall commit the necessary investments required to meet and maintain OSHPD seismic compliance requirements at Glendale Memorial Hospital and Health Center until January 1, 2030 under the Alfred E. Alquist Hospital Facilities Seismic Safety Act of 1983, as amended by the California Hospital Facilities Seismic Safety Act (Health & Safety Code, § 129675-130070); and
13. Glendale Memorial Hospital and Health Center shall maintain written policies that prohibit discrimination against lesbian, gay, bisexual, or transgender individuals.
St. Mary Medical Center
1. For at least ten years from the Closing Date of the Ministry Alignment Agreement, St.
Mary Medical Center shall continue to operate as a general acute care hospital;
2. For at least five years from the Closing Date of the Ministry Alignment Agreement, St. Mary Medical Center shall maintain 24-hour emergency services at no less than current licensure and designation with the same types and/or levels of services, including the following:
a. 26 Treatment Stations; b. Paramedic Base Station; c. Level II Trauma Center; d. STEMI Receiving Center; e. Primary Stroke Center; and f. Emergency Department Approved for Pediatrics.

121
3. For at least five years from closing, St. Mary Medical Center shall maintain the following services at current licensure, types, and/or levels of services:
a. Rehabilitation services, including a minimum of 34 licensed rehabilitation beds; b. Critical care services, including a minimum of 33 licensed intensive care beds and
a minimum of 8 licensed coronary care beds; c. Pediatric services, including a minimum of 12 licensed pediatric beds; d. Intensive Care Newborn Nursery services, including a minimum of 25 licensed
NICU beds; e. Obstetrics services, including a minimum of 25 licensed perinatal beds; and
4. For at least five years from the Closing Date of the Ministry Alignment Agreement, St.
Mary Medical Center shall maintain currently provided women’s healthcare services, as well as the St. Mary Sabina Sullivan Women’s Health Center & Vincent Esposito Imaging Center currently located at 1045 Atlantic Avenue Suite 105, Long Beach, California 90813;
5. For at least five years from the Closing Date of the Ministry Alignment Agreement, St.
Mary Medical Center shall maintain the following services as committed to in Exhibit L of the Ministry Alignment Agreement:
a. Cardiovascular services; b. Neuroscience services, including neurosurgery services; c. Oncology services, including inpatient medical and surgical oncology services and
Outpatient Services - Radiation Center; d. Orthopedic surgery services, including total joint replacements; e. General surgery services, including bariatric surgery services;
i. Outpatient Clinic - Center for Surgical Treatment for Obesity; f. Outpatient Services - Ambulatory Surgery Center; g. Nuclear medicine services; h. Imaging and radiology services (inpatient and outpatient); i. Laboratory services; j. Outpatient Services - Geriatrics Clinic; k. Outpatient Services - Care Clinic (AIDS/HIV); l. Outpatient Services - SMMC Perinatal Clinic; m. Outpatient Services - OB Clinic; n. Outpatient Services - Dental services; o. Audiology services; p. Occupational therapy services; q. Physical therapy services; r. Respiratory care services; s. Social services; and t. Speech pathology services.

122
6. For at least five years from the Closing Date of the Ministry Alignment Agreement, St.
Mary Medical Center shall maintain a charity care policy that is no less favorable than its current charity care policy and in compliance with California and Federal law, and St. Mary Medical Center shall provide an annual amount of charity care equal to or greater than $8,246,816 (the “Minimum Charity Care Amount”). Alternatively, because of the impact of Medi-Cal expansion and the ACA, the California Attorney General could consider adjusting the required commitment to charity care based on available data from time periods after implementation of the ACA. An example would be to require a commitment based on a three-year rolling average of the most available data. For FY 2018, St. Mary Medical Center’s required Minimum Charity Care amount using the three-year rolling average from FY 2015 to FY 2017 would be $4,932,216. For purposes herein, the term “Charity Care” shall mean the amount of charity care costs (not charges) incurred by St. Mary Medical Center in connection with the operations and provision of services at St. Mary Medical Center. The definition and methodology for calculating “Charity Care” and the methodology for calculating “cost” shall be the same as that used by OSHPD for annual hospital reporting purposes. The Minimum Charity Care Amount will be increased on an annual basis by the rate of inflation as measured by the Consumer Price Index from the U.S. Bureau of Labor Statistics;
7. For at least five years from the Closing Date of the Ministry Alignment Agreement, St. Mary Medical Center shall continue to expend no less than $11,812,532 annually in community benefit services. This amount should be increased annually based on the Consumer Price Index for Los Angeles-Long Beach-Anaheim, California. In addition, the following community benefit programs shall continue to be offered for at least five years from closing;
a. Car Seat Program; b. Diabetes Outpatient Self Management; c. Dignity Health Community Grants; d. Families in Good Health; e. GME Medical Education; f. Mobile Care Van Clinic; g. Senior Center Programs (Bazzeni Wellness Center); and h. Transportation Program for Indigent Patients.
8. For at least five years from the Closing Date of the Ministry Alignment Agreement, St.
Mary Medical Center shall maintain its participation in the Medicare program, providing the same types and/or levels of emergency and non-emergency services to Medicare beneficiaries, on the same terms and conditions as other similarly situated hospitals, by maintaining a Medicare Provider Number;
9. For at least five years from the Closing Date of the Ministry Alignment Agreement, St. Mary Medical Center shall be certified to participate in the Medi-Cal program, providing

123
the same type, and/or levels of emergency and non-emergency services to Medi-Cal beneficiaries;
10. For at least five years from the Closing Date of the Ministry Alignment Agreement, St. Mary Medical Center shall maintain its participation in the Medi-Cal Managed Care program, providing the same types and/or levels of emergency and non-emergency services to Medi-Cal beneficiaries, on the same terms and conditions as other similarly situated hospitals offering substantially the same services, without any loss, interruption of service, or decrease of quality, or gap in contracted hospital coverage, including continuation of the following contracts:
a. Commercial Plan: Health Net or its successor; and b. Local Initiative: L.A. Care Health Plan or its successor.
11. For at least five years from the Closing Date of the Ministry Alignment Agreement, St.
Mary Medical Center shall maintain its current city/county contracts for the programs listed below:
a. HIV/AIDS Ambulatory Outpatient Med Services Contract; b. HIV/AIDS Oral Health Services Contract; c. HIV/AIDS Medical Care Coordination Services Contract; d. HIV/AIDS Benefit Specialty Services Contract; e. HIV/AIDS Biomedical HIV Prevention Services Contract; f. HIV/AIDS Case Management, Home-Based Services Contract; g. Participation in the Hospital Preparedness Program; and h. Trauma Center Service Agreement.
12. Dignity Health and CHI shall commit the necessary investments required to meet and
maintain OSHPD seismic compliance requirements at St. Mary Medical Center until
January 1, 2030 under the Alfred E. Alquist Hospital Facilities Seismic Safety Act of 1983,
as amended by the California Hospital Facilities Seismic Safety Act (Health & Safety
Code, § 129675-130070); and
13. St. Mary Center shall maintain written policies that prohibit discrimination against
lesbian, gay, bisexual, or transgender individuals.

124
Northridge Hospital Medical Center
1. For at least ten years from the Closing Date of the Ministry Alignment Agreement, Northridge Hospital Medical Center shall continue to operate as a general acute care hospital;
2. For at least five years from the Closing Date of the Ministry Alignment Agreement, Northridge Hospital Medical Center shall maintain 24-hour emergency services at no less than current licensure and designation with the same types and/or levels of services, including the following:
a. 32 Treatment Stations b. STEMI Receiving Center; c. Level II Trauma Center; d. Level II Pediatric Trauma Center; e. Certified Primary Stroke Center; and f. County Lanterman-Petris-Short Designated 24-Hour Facility.
3. For at least five years from the Closing Date of the Ministry Alignment Agreement,
Northridge Hospital Medical Center shall maintain the following services at current licensure, types, and/or levels of services:
a. Rehabilitation services, including a minimum of 36 licensed rehabilitation beds; b. Obstetrics services, including a minimum of 35 licensed perinatal beds; c. Critical care services, including a minimum of 24 licensed intensive care beds and
a minimum of 22 licensed coronary care beds; d. Pediatric services, including a minimum of 20 licensed pediatric beds; e. Intensive Care Newborn Nursery services, including a minimum of 18 licensed
NICU beds; and f. Acute psychiatric services, including a minimum of 40 licensed distinct part acute
psychiatric beds, and outpatient behavioral health services.
4. For at least five years from the Closing Date of the Ministry Alignment Agreement, Northridge Hospital Medical Center shall maintain currently provided women’s healthcare services, as well as the Carol Pump Women’s Center currently located at 18300 Roscoe Boulevard, Northridge, California 91325;
5. For at least five years from the Closing Date, Northridge Hospital Medical Center shall maintain the following services as committed to in Exhibit L of the Ministry Alignment Agreement:
a. Cardiovascular services; b. Neuroscience services, including neurosurgery services; c. Outpatient Services - Neurology/Cath Lab;

125
a. Orthopedic surgery services, including total joint replacements; b. General surgery services; c. Outpatient Services – Carole Pump Women’s Health Center; d. Nuclear medicine services; e. Imaging and radiology services (inpatient and outpatient), including Mobile Unit
– MRI; f. Outpatient Services - Clinical pathology/cardiology; g. Laboratory services; h. Occupational therapy services; i. Physical therapy services; j. Respiratory care services; k. Social services; l. Speech pathology services; and m. Speech therapy services.
6. For at least five years from the Closing Date of the Ministry Alignment Agreement,
Northridge Hospital Medical Center shall maintain a charity care policy that is no less favorable than its current charity care policy and in compliance with California and Federal law, and Northridge Hospital Medical Center shall provide an annual amount of charity care equal to or greater than $6,855,595 (the “Minimum Charity Care Amount”). Alternatively, because of the impact of Medi-Cal expansion and the ACA, the California Attorney General could consider adjusting the required commitment to charity care based on available data from time periods after implementation of the ACA. An example would be to require a commitment based on a three-year rolling average of the most recent available data. For FY 2018, Northridge Hospital Medical Center’s required Minimum Charity Care amount using the three-year rolling average from FY 2015 to FY 2017 would be $3,963,070. For purposes herein, the term “Charity Care” shall mean the amount of charity care costs (not charges) incurred by Northridge Hospital Medical Center in connection with the operations and provision of services at Northridge Hospital Medical Center. The definition and methodology for calculating “Charity Care” and the methodology for calculating “cost” shall be the same as that used by OSHPD for annual hospital reporting purposes. The Minimum Charity Care Amount will be increased on an annual basis by the rate of inflation as measured by the Consumer Price Index from the U.S. Bureau of Labor Statistics;
7. For at least five years from the Closing Date of the Ministry Alignment Agreement, Northridge Hospital Medical Center shall continue to expend no less than $15,005,790 annually in community benefit services. This amount should be increased annually based on the Consumer Price Index for Los Angeles-Long Beach-Anaheim, California. In addition, the following community benefit programs shall continue to be offered for at least five years from closing;
a. Center for Assault Treatment Services – Clinical & Outreach; b. Community and School Wellness Programs;
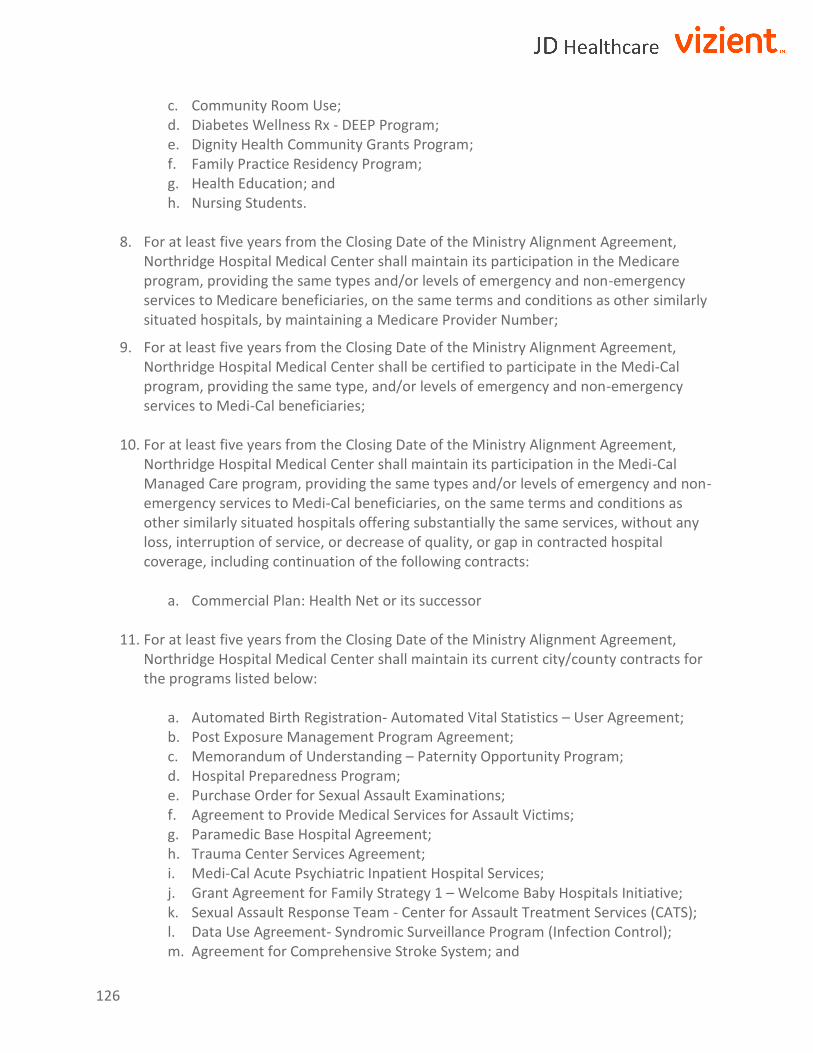
126
c. Community Room Use; d. Diabetes Wellness Rx - DEEP Program; e. Dignity Health Community Grants Program; f. Family Practice Residency Program; g. Health Education; and h. Nursing Students.
8. For at least five years from the Closing Date of the Ministry Alignment Agreement,
Northridge Hospital Medical Center shall maintain its participation in the Medicare program, providing the same types and/or levels of emergency and non-emergency services to Medicare beneficiaries, on the same terms and conditions as other similarly situated hospitals, by maintaining a Medicare Provider Number;
9. For at least five years from the Closing Date of the Ministry Alignment Agreement, Northridge Hospital Medical Center shall be certified to participate in the Medi-Cal program, providing the same type, and/or levels of emergency and non-emergency services to Medi-Cal beneficiaries;
10. For at least five years from the Closing Date of the Ministry Alignment Agreement, Northridge Hospital Medical Center shall maintain its participation in the Medi-Cal Managed Care program, providing the same types and/or levels of emergency and non-emergency services to Medi-Cal beneficiaries, on the same terms and conditions as other similarly situated hospitals offering substantially the same services, without any loss, interruption of service, or decrease of quality, or gap in contracted hospital coverage, including continuation of the following contracts:
a. Commercial Plan: Health Net or its successor
11. For at least five years from the Closing Date of the Ministry Alignment Agreement, Northridge Hospital Medical Center shall maintain its current city/county contracts for the programs listed below:
a. Automated Birth Registration- Automated Vital Statistics – User Agreement; b. Post Exposure Management Program Agreement; c. Memorandum of Understanding – Paternity Opportunity Program; d. Hospital Preparedness Program; e. Purchase Order for Sexual Assault Examinations; f. Agreement to Provide Medical Services for Assault Victims; g. Paramedic Base Hospital Agreement; h. Trauma Center Services Agreement; i. Medi-Cal Acute Psychiatric Inpatient Hospital Services; j. Grant Agreement for Family Strategy 1 – Welcome Baby Hospitals Initiative; k. Sexual Assault Response Team - Center for Assault Treatment Services (CATS); l. Data Use Agreement- Syndromic Surveillance Program (Infection Control); m. Agreement for Comprehensive Stroke System; and
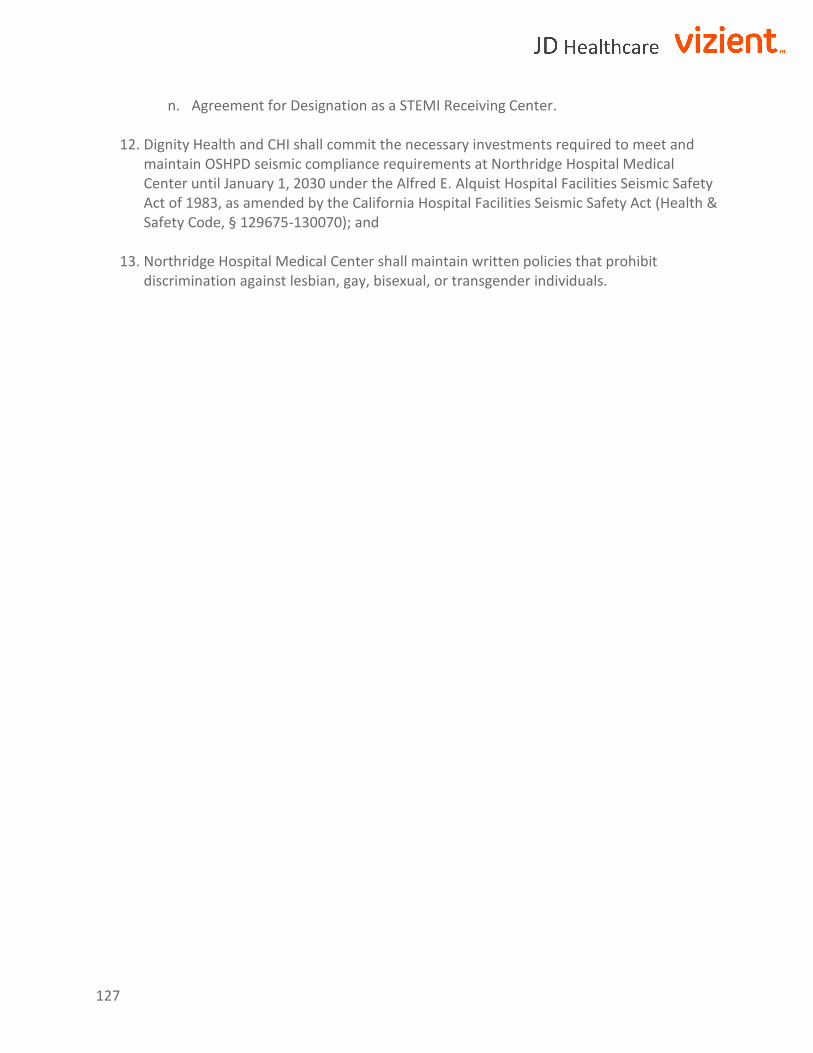
127
n. Agreement for Designation as a STEMI Receiving Center.
12. Dignity Health and CHI shall commit the necessary investments required to meet and maintain OSHPD seismic compliance requirements at Northridge Hospital Medical Center until January 1, 2030 under the Alfred E. Alquist Hospital Facilities Seismic Safety Act of 1983, as amended by the California Hospital Facilities Seismic Safety Act (Health & Safety Code, § 129675-130070); and
13. Northridge Hospital Medical Center shall maintain written policies that prohibit discrimination against lesbian, gay, bisexual, or transgender individuals.

128
Appendix
California Hospital Medical Center License

129
Glendale Memorial Hospital and Health Center License

130
St. Mary Medical Center License

131

132
Northridge Hospital Medical Center License