Embed Size (px)
Citation preview

Digitally-assisted surface survey Andrew Bevan Manuscript of a chapter accepted for an edited volume, Practical Archaeology, in 2002, but the book was never published for unknown reasons. Provided here for historical interest! 1. Introduction This chapter considers the methods by which archaeological surface survey and collection are conducted and explores how new technologies can assist in this endeavour. Digital equipment is becoming an increasingly essential element in the surveying process. To make best use of these new tools, it is important to have a good idea of the overall aims of a given survey. With these aims in mind, careful consideration can be given to the contexts in which specific tools may be helpful and also where they might be employed inappropriately. The following discussion is divided into three parts. The first briefly outlines modern survey methods, emphasising the range of scales at which such activities operate. The second introduces the current range of digital hardware and tools that can be deployed to improve or speed up survey work and describes in general terms how such tools work. The third part returns to the different scales of survey method and identifies where and how digital tools might be harnessed at each level.
2. Modern surface survey methodologies: an overview Over the last three decades, archaeological surface survey has moved from a relatively mundane position, as a necessary but insubstantial precursor to full-‐scale site excavation, to become an unparalleled tool with which to explore past socio-‐cultural dynamics at the regional scale. Survey and surface collection now incorporate practices that vary widely in the intensity with which they investigate and record the landscape. This reflects not only greater methodological maturity, but also the different environmental constraints and research agendas in regions as ecologically and culturally diverse as, for example, North America (Sullivan 1998), the Mediterranean (Keller and Rupp 1983; Barker and Mattingly 1999-‐2000), sub-‐Saharan Africa (Bower 1986) and temperate Europe (Shennan 1983; Haselgrove et al. 1985; Bintliff et al. 2000). Because of the relatively broad scale at which they operate, surveys have had to tackle the issue of effective and efficient regional sampling (Mueller 1979; Orton 2000). Modern survey methods can for convenience be broadly categorised by the relative degree of intensity with which they search and sample landscapes. Four basic types of increasingly intensive scope are explored below: extensive survey, ‘patch’ survey, intensive survey and site survey.
2.1 Extensive survey

Extensive survey covers a whole range of traditional means of exploring the landscape and its associated historic and prehistoric features. In this context, survey includes information gleaned from general travel in a given region, discussions with local inhabitants, visitation of known sites and organisation of archaeological information that has accumulated in museums, archives etc. over time. Such investigations usually do not involve particularly strict sampling procedures or collection routines, but they tend to cover very large areas of terrain. Sometimes they can be seen as a preliminary level of investigation preceding more targeted approaches.
2.2 Patch survey Surveying ‘patches’ is a strategy related to extensive survey, but more explicit in targeting specific parts of the landscape. These might be areas of high visibility, standing sections, or specific topographic, geological, and geomorphological features. This approach is therefore concerned with exploiting the most informative ‘windows’ on the landscape and is often conducted by specialists in certain disciplines such as geomorphology or archaeometallurgy. Search patterns used to identify these windows may not reflect strictly sampled populations but are still highly structured.
2.3 Intensive survey In many parts of the world, archaeological survey methods have become ever more intensive, covering less overall area but recording and/or collecting both more rigorously and in greater detail. The early appearance of this new agenda and a wave of new survey projects coincided roughly with the emergence of the New Archaeology: for example, we might link it with Binford’s insistence that archaeological research be both regional and systemic in design and scope (Binford 1964; Shennan 1983: 1). In general, increasing emphasis has been placed on generating comparable, quantifiable data. This refers not only to recording a range of environmental phenomena (e.g. survey conditions, vegetation and ground cover, soils, and all visible cultural remains) during survey but also to the precision with which such things as ceramic and lithic counts are recorded, the standardisation of collection procedures (for example, measured walker transects, gridded collections, vacuum samples) and the degree to which allied disciplines such as geoarchaeology are integrated into the heuristic framework of the project. Important differences in scale therefore exist between intensive and extensive survey. The former tends to cover much smaller areas but nonetheless to create datasets and corpora of archaeological material at least as large, or often much larger, than extensive methods. Indeed, the sheer density of material culture usually uncovered by intensive methods is proof in itself of their usefulness. For example, very gross calculations of site numbers per square kilometre for different surveys in the Mediterranean support the assertion that increased effort both in terms of data recording and actual surveyed land surface produce much larger site samples than extensive survey alone (Cherry 1983). In other words, intensive survey is the only means of getting an accurate impression of

the real size and numbers of sites in a given area. Again, a critical issue with intensive survey, given its scope and methods, is sampling. A good sampling procedure must balance three main concerns: a) a proportionate exploration and representation of different environmental niches (e.g. soils, vegetation, slopes) often called stratified sampling (though the term is sometimes misused, Orton 2000: 30), b) meaningful treatment of clustered areas of human activity where large blocks of continuous coverage may be necessary, and c) particular attention to areas where archaeological visibility is poor. Even if regions are explored in their entirety, in contiguously surveyed blocks, as advocated particularly by many North American survey archaeologists (Fish and Kowalewski 1990), sampling inevitably still occurs within survey units, in terms of the spacing between individual surveyors as they walk across the landscape. Many projects tackle these issues with sampling designs that include a combination of transect samples, judgment samples, continuous coverage and/or multi-‐stage revisitation and resampling. As we shall see, digital tools can be very useful in the design and implementation of such methods.
2.4 Site survey The preceding sections have used ‘site’ as a shorthand term to describe either short or long-‐term foci of human activity and/or settlement. Site definition has traditionally been of central importance for developing models of settlement systems and hierarchies. However, such sites are not the only places in the landscape where activities were taking place. There has been a strong move, especially in North America toward ‘non-‐site’ or ‘siteless’ survey in which the principal unit and level of analysis is supposed to be the artefact rather than the site (e.g. Dunnell and Dancey 1983). While such approaches emphasise how crucial it is to treat the cultural landscape as a continuous surface, in most cases it will still be necessary to treat certain clusters of activity with greater resolution. Collection and exploration routines have thus been developed that concentrate on the individual artefact scatter (whether this is called a site or not), studying in great detail standing architecture, subsurface geophysical signatures, its geomorphology and immediate environs or catchment. This is perhaps the most intensive form of surface survey practiced. Again, experience shows that greatly increased returns also accrue from adopting intensive survey techniques at the level of the site, in terms of discernible spatial patterning of surface phenomena, successful identification of material from different periods at multi-‐period sites, and understanding the geomorphological integrity of archaeological deposits.
3. Relevant modern digital tools Partly because of the sheer diversity of activity and research often contributing to a modern survey project, the range of new, often hi-‐tech equipment that might theoretically be deployed can be bewildering. However, digital equipment can contribute from two directions: a) by fast, accurate and/or cost-‐efficient recording of three-‐dimensional location (total stations and GPS), and b) by

extracting and/or recording a range of topographic and environmental variables (land use, vegetation cover, the location of particular resources or features) that can be fed back into the collection process. Furthermore, Geographic Information Systems (GIS) now provide a powerful environment in which to integrate and manipulate the digital outputs of these different tools. The review below concentrates on the basic operation of digital data, equipment and GIS, but rather than exploring the full range of their functionality or showcasing particular commercial products, it focuses on how each can make a contribution to the specific aims of surface survey. The articulation of subsurface features by geophysical prospection is not covered here, but relevant discussion can be found in Sarris and Jones (2000).
3.1 Background to digital data Digital data comes in two basic forms, raster and vector. Raster data is stored in a rectangular grid or lattice of pixels (also known as cells), each pixel with one or more numeric values assigned to it. Continuous data such as the changing colours in a photograph or the varying elevation of terrain can be given specific real number values. Alternatively, thematic landscape data, such as a patch of similar geology on a map, can be coded with integer values relating to specific categories (for example, 5 = marl limestone). Current computers allow up to 256 colours or levels of brightness to be associated with these numeric values for the purposes of human visualisation and there are general formats (for example, RGB, CMYK) designed to authentically display or print colours in the visible spectrum. Scanners are the principal tool used to capture information from paper records and turn them into raster grids. Most scanners are flat (‘flat-‐bed’) and only slightly larger than A4 or US Letter in size, but some are larger and can scan rolled paper (‘drum’ scanners). Vector data is different because it stores spatial information as discrete geometric entities (points, arcs or lines, and areas or polygons). A wide variety of information can be attached to these entities (also called primitives) and their geometry (length or area) and relationships with each other can be measured easily. Vector data is acquired: a) by using a total station or GPS, b) by manually tracing paper records using a digitising tablet, or c) from existing raster grids (images). The raster data can be automatically converted by various vectorization algorithms (which while attractive are not without problems) or can be manually digitised on-‐screen (called ‘heads-‐up’ digitising). It is beyond the scope of this chapter to describe all the advantages and disadvantages of these two types of format, though they relate to issues both of accurate representation and processing efficiency. Suffice to say that for archaeological survey, both are essential. A range of photographic and remote sensing information is best stored in raster form because the data is spatially continuous with no sharp boundaries between zones. Conversely, an irregular collection unit such as a field is much more satisfactorily expressed as a discrete vector polygon than as a patch of raster pixels. It is useful to have both a flat-‐bed scanner and a digitising tablet during

fieldwork. Sketch maps, incidental documentation, and even certain artefacts can be scanned on an ad hoc basis, which lends itself well to the often incidental accumulation of information that goes alongside more deliberate survey strategies. Digitising vector entities also involves a degree of interpretation – the clarification of points and lines, or the definition of areal units – often best done close to the time when the information was produced. For example, paper plans and sections are best digitised when the original creator is on hand to explain and clarify the depiction. Both scanners and small digitising tablets are now relatively cheap and sturdy pieces of equipment that can be run off portable computers.
3.2 Total Station In the past, topographic survey has been a relatively complicated business involving a variety of equipment, frequent trigonometric calculations, and a lot of paperwork (Bettess 1998). Many of these tools and tasks are now brought together and partially-‐automated by a modern total station (figure 1). The latter equipment combines an electromagnetic distance measurer (EDM) with a laser theodolite and a data logger of some kind. The system principally measures horizontal angle (for example, from true North), vertical angle (from horizontal) and distance between the total station and a hand-‐held prism/reflector. The data-‐logger records this information, can add simple attribute data (e.g. giving the measured point a unique id, identifying it as part of a ridge-‐top or as a specific type of find) and often automatically converts the original measures into standard x, y, z coordinates based either on local relative coordinates or absolute ones derived from known fixed points in the landscape. A total station usually requires a crew of at least two individuals and can be used for very accurate topographic survey.
Figure 1. Total station being used for contour survey on the Roman site of Noviodunum, Romania (courtesy of Kris Lockyear)
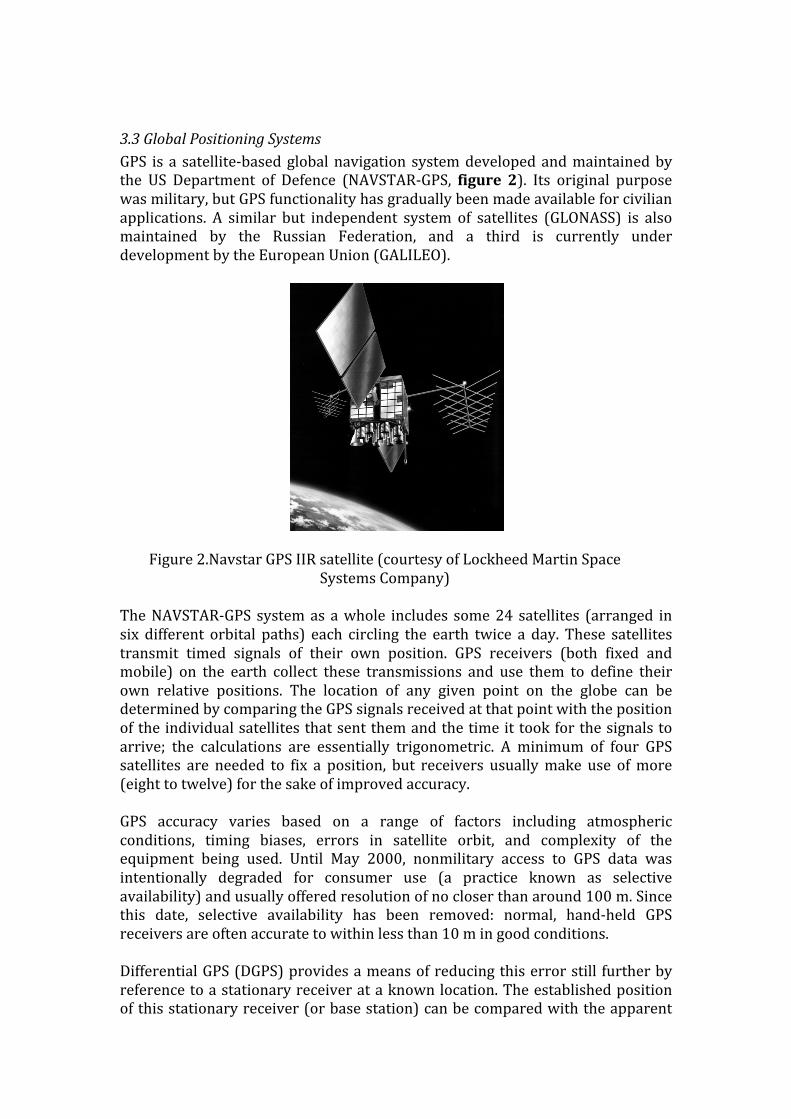
3.3 Global Positioning Systems GPS is a satellite-‐based global navigation system developed and maintained by the US Department of Defence (NAVSTAR-‐GPS, figure 2). Its original purpose was military, but GPS functionality has gradually been made available for civilian applications. A similar but independent system of satellites (GLONASS) is also maintained by the Russian Federation, and a third is currently under development by the European Union (GALILEO).
Figure 2.Navstar GPS IIR satellite (courtesy of Lockheed Martin Space Systems Company)
The NAVSTAR-‐GPS system as a whole includes some 24 satellites (arranged in six different orbital paths) each circling the earth twice a day. These satellites transmit timed signals of their own position. GPS receivers (both fixed and mobile) on the earth collect these transmissions and use them to define their own relative positions. The location of any given point on the globe can be determined by comparing the GPS signals received at that point with the position of the individual satellites that sent them and the time it took for the signals to arrive; the calculations are essentially trigonometric. A minimum of four GPS satellites are needed to fix a position, but receivers usually make use of more (eight to twelve) for the sake of improved accuracy. GPS accuracy varies based on a range of factors including atmospheric conditions, timing biases, errors in satellite orbit, and complexity of the equipment being used. Until May 2000, nonmilitary access to GPS data was intentionally degraded for consumer use (a practice known as selective availability) and usually offered resolution of no closer than around 100 m. Since this date, selective availability has been removed: normal, hand-‐held GPS receivers are often accurate to within less than 10 m in good conditions. Differential GPS (DGPS) provides a means of reducing this error still further by reference to a stationary receiver at a known location. The established position of this stationary receiver (or base station) can be compared with the apparent

location suggested by the GPS and any discrepancy can then be used more widely to correct the error between reported and actual satellite positions for other surveyed points (figure 3). These corrections can now often be accounted for in real time (during survey) and DGPS can achieve sub-‐centimetre accuracy over small areas (such as 30 km). Like total station data-‐loggers, some GPS units now include the ability to assign simple attribute information to recorded points.
Figure 3. Schematic diagram of a Differential Global Positioning System (after an original diagram
by P. Dana).
3.4 Digital photography and video Digital images can be acquired by digital cameras, some airborne systems, and most satellites or subsequently scanned from traditional film-‐based products. Simple digital photography is now cheap and very useful as a means of routinely storing numerous, achievable visual records. Such images can be transformed or processed in a vast number of ways: for example, values in the image can usually be given greater contrast by normalising the frequency distribution of different brightness values (known as contrast stretch) or parts of the image can be filtered to enhance or reduce differences at a localised level to bring out specific features or boundaries. Beyond simple still pictures, images taken on a photographic tripod in a full 360º sweep can also be stitched to create quick, immersive environments such as panoramic Quick-‐Time VR movies that help both in short-‐term documentation of a site and longer-‐term analysis and presentation. Similarly, digital video (figure 4) takes many raster images and run them together in timed sequence, often with audio accompaniment. Video can enhance in-‐the-‐field discussion and helps alleviate the often limiting constraints of recording data programmatically on pre-‐made forms or as discrete features. As such, it is potentially an excellent complement to field sketches and diaries as a fluid, discursive way of conveying the most important aspects of a given survey topic. Issues are talked through and salient landscape features specifically pointed out by an often-‐visible human narrator. Both still photography and video can be fully integrated into spatially

referenced datasets organized by a GIS, as standalone elements or spatially-‐linked to specific geographic features.
Figure 4. Example of a digital video record of pedestrian survey in Egypt (courtesy of Ian Shaw) Aerial photos are a well established set of data for archaeologists interested both in sites and the landscapes around them: for example, in temperate Europe, differential vegetation growth due to the presence of subsurface features produces ‘cropmarks’ that have long been an important means of locating settlements and activity areas (Crawford and Keiller 1928). Photos normally record the intensity (and often the colour) of light in the visible part of the spectrum although various combinations of film and filters can allow photographs to record near-‐infrared light as well. As a digital resource (usually scanned from original prints rather than acquired this way), aerial photos can be rectified to correspond to mapped terrain. This process can be done in two ways: if the image was captured under controlled conditions, knowledge about the height at which the photo was taken and the orientation of the camera can be used to produce a vertical ortho-‐photograph. This attempts to portrays correct spatial distances between features in the image, though, without further processing there will often still be distortion towards the edge of the image. If these conditions are not known precisely, the photo is known as oblique and must be transformed by correlating points on the image with the known coordinates of the same points on the ground (called ground control points). The latter process involves skewing and folding the original image by applying a polynomial transformation to the location of each pixel. In effect, the computer suggests and applies the best mathematical equation that will translate the coordinates of the image pixels to the coordinates of their actual location as determined by the ground control points. This process is by no means perfectly accurate; a useful measure of the average error is given by an rms (root mean square) value. Once an image has been rectified, its

geographic location is then either embedded in the image file or kept in an accompanying ‘world file’. Rectification of oblique photography can be carried out on most GIS platforms and several devoted software packages (ERDAS’ IMAGINE is one). Such images can also be cropped into exactly abutting tiles, producing a continuous mosaic of aerial coverage. Such digital data has uses at every stage of the survey process, from determining sampling locations to field orienteering/navigation to data analysis. Figure 5 is an example in which gridded collection units (shaded by surface ceramic density) are overlaid on an aerial photo of a large multi-‐period settlement.
Figure 5. Aerial photo of the Bronze Age-‐Late Roman site of Kastri (Kythera, Greece) with overlaid collection squares, shaded for ceramic density.
All digital photography should be recorded and stored with an appropriate range of metadata (e.g. Bewley et al. 1988: 28): a) the image source or photographer and copyright, b) the time and date taken, c) the weather and light conditions, and d) the camera settings if known. Any post-‐acquisition processing should also be recorded; for example, if the image has been rectified, an archive of the ground control points used should be kept along with the order of the polynomial transformation and the RMS error. Metadata is not only useful for archival purposes, but particularly on aerial photos, makes it possible to explore

in more detail the effects of different lighting and seasonal conditions on the visibility and clarity of archaeological features.
3.5 Satellite Remote sensing Remote sensing may refer to a very wide range of practices including ordinary photography but usually refers more precisely to measurements taken from aircraft or satellites of the degree to which the earth’s surface reflects electromagnetic energy. All physical objects radiate electromagnetic energy (radiation) at various wavelengths. This radiation can be arranged on a spectrum (from shorter to longer wavelength, and higher to lower frequency) and then grouped into larger categories such as gamma rays, x-‐rays, ultraviolet, blue, green and red visible light, infrared, microwaves and radio waves (figure 6).
Figure 6. Parts of the electromagnetic spectrum used in remote sensing (after Tso & Mather 2001: fig.1.2).
Electromagnetic radiation from the sun strikes objects on the earth surface and is absorbed, reflected, or transmitted at different rates. The differing way physical features reflect this energy can therefore be used to identify a host of phenomena including vegetation, soils, ocean currents, and man-‐made features such as irrigation systems. Remote sensing instruments can do one of two things: they can passively detect natural electromagnetic radiation or they can emit their own source of this energy to actively illuminate desired phenomena. For example, an active aircraft-‐mounted (synthetic aperture) radar was used to explore Late Classic Mayan cultivation systems in northern Belize (Adams et al. 1981) while passive remote sensing using infrared aerial photographs was employed to look at similar systems in the pre-‐Aztec Basin of Mexico (e.g. Nichols 1988). A total station or laser transit is another good example of an active remote sensing device (this time ground-‐based) because it uses its own laser pulse to acquire information about the corresponding location of the prism. However, most of the remote sensing images used for archaeological purposes are passively-‐acquired (but see RADARSAT below); ignoring the simpler techniques described above (such as aerial photographs), perhaps the most common are mounted on satellites.

Some satellites simultaneously record electromagnetic reflectance for a given point on the earth’s surface in a range of different wavelengths (multi-‐spectral imaging, as opposed to panchromatic), providing the reflectance signatures of objects at wavelengths outside the visible spectrum. Multispectral information can be used either in separate spectral bands or in combination and is highly quantifiable. For example, in a given image we can be quite precise not only about the specific reflectance signatures that represent a specific type of vegetation, but, as a result, also the proportion of the region covered by this vegetation (for example, figure 7 is a SPOT image from which Mediterranean vegetation patterns can be explored). Moreover, for certain commonly-‐used scanners (for example, the AVHRR), standardised vegetation indices are regularly produced (Jackson and Huete 1991), the most well known being the normalised difference vegetation index (NDVI). These indices provide some measure of comparability between images and hence rapid assessment of geographic variation over both time and space.
Figure 7. SPOT image of Kythera, Greece. The image is a ‘false color’ composite of three different spectral bands.
There are over 30 remote sensing satellites in orbit today and available for civilian use. The most commonly available and relevant to archaeological survey are described below.

Ikonos Ikonos is a commercial satellite launched in 1999 that provides 1 m resolution panchromatic data and 4 m resolution multispectral (four bands: blue, green red, near infrared) imaging. The level of resolution is impressive, but coverage is still limited (though the satellite can be specifically tasked to cover new areas) and the costs relatively high.
Landsat The first Landsat began transmission in 1972. Since then, five more have been put in orbit by the US government. Their combined data represent the longest available (continuous) record of the earth’s changing geography. They are crucial in certain fields such as global warming as a means of getting an impression of changing environmental patterns over time. Landsat multispectral scanners (MSS, TM or ETM, Enhanced Thematic Mapper) target the most useful windows in the electromagnetic spectrum: Landsats 1 to 4 provide a multi-‐spectral resolution of 80 m, while 5 and 7 provide 30 m resolution over a swathe of land 185km wide, taken at 09.45 am local time every 16 days (Landsat 6 was lost before reaching orbit). Images from this source are now relatively inexpensive and commonly used in archaeology (for example, Cox 1992).
NOAA AVHRR The National Oceanic and Atmospheric Administration’s Advanced Very High Resolution Radiometer (AVHRR) is a sensor carried on a range of U.S. satellites beginning in 1978 and produces multispectral imagery (in four or five bands: red, green blue, near-‐infrared, and infrared) over a 2400km wide swathe each day. While AVHRR images are now very cheap, the general resolution of these images is 1.1 km and hence useful only for the assessment of fairly large regions. Reflectance measures for the AVHRR instrument are often standardised (the NDVI mentioned above) for global scale comparisons.
Radarsat The images from this Canadian system are acquired by way of an active radar sensor which sends pulsed microwave signals and measures the received reflectance. RADARSAT-‐1 was launched in November 1995 (a second is scheduled for 2003) and provides a single-‐frequency image. The radar beam can be altered to explore landscapes at a range of resolutions from around 8 to 100 m, operates during both the day and night, and is far less restricted by atmospheric conditions (clouds, fog, smoke) than passive systems. It returns to cover the same ground every 24 days.
Spot In all, five SPOT satellites have been put into orbit (three still operational) with a chronological range from 1986 to the present. This is a French commercial venture which provides 10 m panchromatic and 20 m multispectral (blue, red, near-‐infrared and infrared). The SPOT sensor can be manipulated to cover the same ground 12 times during its 26 day orbit, which uniquely allows it to collect stereoscopic data that can be used to produce elevation models. There are countless ways of processing and querying remote sensing data to

produce accurate, usable results (see Tso and Mather 2001 for a more complete summary). Reflectance values from multispectral imaging can be classified by either computer-‐driven cluster analysis or with a combination of this and human-‐supervised classification of sample areas of the image resulting from field visits and on-‐the-‐spot identifications. For archaeological purposes some form of supervised classification and ground-‐truthing is desirable. Remote sensing images are useful for surface survey in a range of ways. They make it possible to develop very nuanced sampling strategies and methodologies. Thematic maps derived from reclassification of such images can be deployed to ensure that a survey covers proportionate parcels of different soil or vegetation types. Important information is also provided on the relationship between surface and subsurface remains: in areas of thick alluvial or colluvial soil cover, visible on the satellite image, different survey strategies such as the close inspection of exposed soil sections or targeted subsurface investigation may be necessary. They can also be used to pinpoint large human constructions, such as mounds or monumental buildings.
3.6 Geographic Information Systems (GIS) Geographic(al) Information Systems (commonly called GIS) refer to spatially-‐referenced databases and the software that runs them. Beyond that definition, GIS usually means bundles of software tools that help not just to acquire but more importantly to manage, query, and transform geographic information in various ways (for an extended introduction see Wheatley and Gillings 2002). Commonly used desktop platforms include ArcGis, GRASS, Idrisi, and MapInfo. The practical uses of GIS software are numerous and pervade almost every type of modern spatial analysis. GIS data is normally organised into thematic layers (for example, different layers relating to elevation, slope or geology) which can be independently queried and/or used in conjunction with each other. Information can be stored in both raster or vector format though specific commercial software often specialises in one of these while retaining some functionality in the other. GIS has been associated with the interpretation of regional-‐scale phenomena since its early concerted use in archaeology (Allen et al. 1990). Modern survey projects include many linked components relating to geomorphology, biodiversity, ethnography, historical geography, geophysical prospection, and often excavation. GIS is an ideal integrative tool to make these overlapping areas communicate with each other; where possible, it should be a part of any project from the onset. A survey project GIS will need to balance four main priorities: data management, in-‐the-‐field functionality, spatial data analysis, and appropriate graphical presentation. Digital data can be acquired in a variety of formats but should a) be brought together on one primary GIS software platform (though this does not exclude multi-‐platform research), b) be standardised in terms of spatial co-‐ordinate system, and c) be transparently clear as to its origins, digital history and likely data deficiencies so it can be usefully shared with as many other individuals and institutions as possible.

Choice of Platform The GIS package most suitable for a survey project will vary depending on funds and objectives. However, it is best to choose one that specialises in vector formats because survey data is frequently collected in discrete units – entities with hard edges and separate identities such as numbered collections squares – which are best handled by point, line and polygon structures. In addition, the GIS platform should be easy for non-‐specialists to learn as this encourages its use by as broad a community of people within the project as possible. A specialist will still be necessary however; the ‘point and click’ functionality of many modern GIS software is potentially dangerous because a range of analyses can be performed with no real understanding of the processes or data alterations involved.
Georeferencing and Coordinate Systems All geographical locations are recorded with respect to a specific georeferencing system. The system includes the adoption of: a) a reference ellipsoid and geodetic datum, and b) a cartographic projection. The former is a geometric approximation of the earth’s surface and the latter a set of references that describes the ellipsoid and its orientation to the landscape. There are many possible geodetic datums: most are local and meant for limited parts of the world only (for example, NAD27 and NAD83: North American Datum 1927 and 1983 versions respectively), while more recent ones are intended to be global (for instance, WGS84: World Geodetic System, 1984). Measurements on ellipsoidal surfaces are usually given in units of latitude and longitude (either decimal degrees or degrees, minutes, and seconds). However, for a variety of purposes including visual display (such as on maps), positions are often then projected into planar units. This transformation (resulting in a simple system of Cartesian XYZ coordinates) inevitably involves deliberate distortion, though cartographic projections are normally designed to constrain such distortion so aspects of the geometry of the original surface (especially angular measures) are maintained. Data can usually be stored in a GIS either in unprojected or projected units, but the latter are sometimes preferred, especially when raster data is involved. Like geodetic datums, there are also many different projections (for example, Transverse Mercator or Lambert Conformal Conic) and choosing an appropriate one is sometimes difficult. Thankfully, GIS is a hugely useful tool for transforming and keeping track of the geodetic and cartographic character of survey data-‐sets. Modern GPS units can be set to automatically collect and define information in a variety of georeferencing systems and projecting or reprojecting data from one cartographic system to another and back is now relatively straightforward. Ideally, survey projects should seek to use a projected system that is as global and as widely recognisable as possible (for example, UTM: Universal Trans-‐Mercator), but many countries have national grids which will be the preferred means of acquiring and publishing digital data in these regions. Occasionally, especially in areas where it is difficult to link project data to fixed topographic points, it will be necessary to define a local grid using coordinates

collected specifically for project use. In such cases, the area covered is likely to be relatively small and projection issues insubstantial: even so, careful use of GPS can often provide relatively accurate, global fixes on specific points in the grid so that reliable comparison with other areas is still possible. In fact, use of local grids should be kept to a minimum and national or global coordinate systems used wherever possible.
Data Formats, Storage, and Presentation GIS platforms usually use their own native file formats, both for raster and vector data, but also include import/export modules to make it easier to move between platforms. Moreover, certain formats are commonly used to store data for multi-‐platform use: for instance, vector data is often exchanged in DXF format and raster grids in XYZ ASCII. Problems most frequently occur with respect to the conversion of attribute (associated database) information linked to vector entities (for example, ceramic/lithic counts linked to collection units). It is good practice to keep the identifying codes associated with spatial objects short and simple. Elaborate non-‐spatial data is often best stored in a devoted database system (such as Microsoft Access or Filemaker) rather than in the GIS itself. These can be joined to the spatial objects via unique ID codes when necessary. This temporary separation of spatial entity and associated data has other advantages. The same surface phenomenon (for example, a site or lithic scatter) may sometimes need to be represented as a point and at other times, as a polygonal area. A separate database makes it easy to switch between these scales without duplicating vast amounts of associated information. Once integrated in a GIS, layers must still be managed and presented with appropriate metadata relating to source, extent, format, resolution, acquisition and processing methods (Gillings and Wise 1999: 41-‐47). For example, the nature of the georeferencing system used (ellipsoid, datum shift, projection if any, map units) is very important and should be clearly expressed particularly for publication. Many countries have now adopted national or international standards relating to this kind of documentation – perhaps the best known and most specific to georeferenced data is the U.S. Federal Geographic Data Committee’s Content Standard for Digital Geospatial Metadata (CSDGM), but another with a broader applicability to all forms of digital data is called Dublin Core Metadata. Such life-‐histories are not simply interesting background notes: the spatial scales and data manipulation they describe have inherent effects on the uses to which the GIS layers can be put. This becomes extremely important as survey data is archived and accessed by new users whose familiarity with the original project’s procedures and goals may be quite limited. Recent GIS software has also shown dramatic improvement in its ability to output clear, aesthetically-‐pleasing information or to export such information to appropriate illustration or desktop publishing packages. This suddenly makes it a highly effective PR tool, for funding applications and academic meetings, but also for local outreach in the survey area. Recent advances in displaying scalable vector graphics (SVG) on the web will mean that GIS results can also be made usefully available online. This means that it will soon become a very important
part of the survey publication process.
GIS and survey in the field This section is as much a plea as a discussion. GIS can and should be used for analysis while physically in the field (contra Gillings 2000: 114) as an easy way of digesting large amounts of information in time to be fed back into decision-‐making such as sampling strategy and the daily allocation of project resources. Modern portable computers have sufficient processing power to perform most common GIS tasks and are robust enough for all but the most challenging working environments. The mere presence of such systems in the field, when fieldwork is being carried out encourages surveyors and related specialists to think about gathering data and designing research with GIS in mind (for example, with respect to data gaps, recording structures and possible outputs). Maps can also be printed out at any given scale and with any necessary detail (intended collection units, directions and logistics, aerial photo coverage) on a contingent, daily basis. Whether basic survey information (artefact counts, collection units, spot observations, daily logs) are inputted digitally in the field or are first recorded on paper and subsequently transferred is a decision that depends on local environmental conditions, project funds, the availability of appropriately skilled operators, etc. A good compromise is often the creation of an initial hard copy record and subsequent data entry on the day after collection. This leaves field teams free of concern over equipment safety and technology but still allows for near immediate feedback of newly-‐discovered patterns and for data entry queries to be raised close to the time of collection. A good example of how GIS can be used analytically in the field relates to the definition of a ‘site’ and its consequences. Site definition is inherently subjective – usually the product of various human impressions rather than rigorously-‐defined categories. Indeed, some surface survey practitioners prefer to dispense with it altogether. However, in many regions the term retains some practical and heuristic advantages and there are frequently situations where the identification of such special loci of activity in the landscape is the precursor to more intensive information gathering (more detailed gridded collections, geophysics, etc.). Accepting the general subjectivity of the process, GIS allows us to be far more subtle and reflexive in the way we make such site definition decisions in the field when we can still let this interrogation feedback into our collection strategies. For example, we can correlate our definition of sites with any number of recorded survey variables (ceramic density, ground cover and visibility, human observation skills, weather). We can then use these correlations to return to areas that share the same quantitative character, but have for some reason not been characterised as sites. Conversely, a few known sites may appear anomalous to the vast majority when quantified in such ways and can be re-‐investigated. In all cases, such GIS-‐led interrogations are not meant to be the final word on the issue but simply add a refreshing new perspective.
4. Integrating technology and method

The digital tools described above can be enormously useful, but they can also be applied gratuitously in contexts where they are not necessary or where the results they generate are misleading. The following discussion returns to the different types of survey described above and suggests what digital tools are most appropriate to each one. For extensive survey, total stations and to some extent DGPS may often be of limited use given the emphasis on broad coverage. Moreover, total stations become particularly awkward across large swathes of broken terrain where lines of sight are short and necessitate frequent movement of the station itself. In contrast, handheld GPS units can be extremely useful, both for logging important archaeological locations and keeping track of reconnaissance routes. Indeed, in tracing tortuous reconnaissance routes, DGPS and/or GPS may be able to bring a more quantitative approach to extensive surveying methods by making irregular pedestrian survey paths (e.g. through jungle and forest or across mountains) much closer to quantifiable samples than has hitherto been possible. A schematic example in figure 8 suggests both the possibilities and the limitations. Intensive survey often calculates surface artefact density based on straight walked distances and artefact counts (A on the diagram). However, even an extremely irregular walk around such a field (B on the diagram) can be roughly quantified given route length and field area measures, which can be calculated from GPS and GIS data. From this information, we can measure not only surface artefact densities but also the character of the resulting landscape sample. Such a semi-‐quantifiable strategy is by no means perfect but would have obvious use in areas of high, thick vegetation cover where walking in straight lines is often impossible.
Figure 8. Diagram showing the semi-‐quantification of an irregular reconnaissance route aided by GPS/GIS (calculations assume, for this example, that a person consistently ‘sees’ 1m
to either side of them).
Given the often non-‐standardised nature of recording for extensive survey, digital video or photos are an extremely useful and rapid means of preserving an appropriate record. This is especially true of video where accompanying audio description can be included. GIS is useful as a navigation tool and recording system (for example, by associating a wide range of recorded data with spot locations). A user-‐friendly GIS with less analytical capability but more immediate point-‐and-‐click functionality is particularly appropriate. Remote sensing images may point to general sites worth visiting (such as large walled structures with higher local reflectance values) but are also likely to be helpful in a more specific sense for patch survey because they may be used to locate specific types of landscape feature (vegetation types, metal ores or slag heaps, geomorphological units). Such methods make patch survey more systematic because they can give an impression of the prevalence of certain informative windows in the landscape. Handheld GPS may be used to locate study areas more closely, but differential GPS and/or total station survey may also be needed to map the physical characteristics of the given area. Digital video is particularly useful for conveying certain types of specialist knowledge, while still digital photography, alongside very small amounts of DGPS or total station coverage, may also be a quick and dirty way to record vertical exposures and small planned areas. GIS can help in navigation and recording, but it can also build predictive models based on cultural and environmental variables to suggest patch survey strategies both before and during fieldwork. Predictive modelling of this kind can be very powerful but should be treated with caution; for example, preferentially targeting those areas that, according to a GIS model, have a high probability of archaeological activity can lead to circular reasoning, as subsequent results will be inadequate for the task of testing (or confirming) the reliability of the model itself. For more intensive survey programs, total stations or DGPS can be good for locating the edges of intensive survey areas but they will waste considerable time if used in the actual survey process. Most often, intensive survey operates at the sub-‐hectare sampling scale of field plots, local geomorphological units or vegetation patches and therefore navigation and the relatively accurate recording of location may be better done using human pacing, aerial photos and/or existing maps. In less differentiated terrain, GPS might still be necessary. Indeed, even if GPS is not being used routinely as part of the intensive survey structure, it is a useful tool to have with survey teams to record chance finds, specific features etc, in the same manner as extensive and patch survey. Total stations and DGPS may be useful for putting a skeleton grid onto a site, but this depends heavily on what the grid squares are going to be used for. Grids should always have some means of being reconstructed by subsequent visitors to the site, preferably one or more fixed global coordinates which link the local grid to a wider geographic system. Beyond this, if surface collection is a process to be repeated over numerous sites and the grid is a temporary sampling tool, rather than the basis for subsequent geophysics or excavation, it is often more

conveniently put out by hand (allowing the collection team itself to work on it rather than a few specialised operators). For example, collection grids can afford to be off by a certain amount as long as they are not being used to plot the 3-‐D coordinates of artefacts and simply represent broad collection units (e.g. 5, 10 or 20 m). The use of digital equipment at the site level is really a logistical issue to do with the number of sites being recorded, the availability of equipment and operators, and the intensity and long-‐term agenda with which a site is being explored. If close topographic survey is required, then this is perhaps best done by DGPS for larger sites or total station for smaller ones. The latter equipment has the advantage of being able to better establish a base network of fixed points or stations from which long-‐term on-‐site work can be structured.
5. Conclusions Electronic tools offer important savings of time and human resources for archaeological surface survey and collection. Modern GIS now provides the framework to allow these tools to feed back into survey strategy during the fieldwork phase. If possible, the use of electronic equipment should be carefully assessed at an early stage of research project design; otherwise there is a danger that it can be deployed unnecessarily (with resulting waste of time and money) or inappropriately with respect to project objectives (producing redundant or even occasionally inaccurate data). Understanding the relative contribution of various tools to different scales of survey is the key to avoiding such misuse.
References Adams, R.E.W., B.W. E. and T.P. Culbert 1981 Radar mapping, archaeology, and ancient Maya land use. Science 213:
1457-‐1463. Allen, K.M.S., S.W. Green and E.B.W. Zubrow eds. 1990 Interpreting Space: GIS and Archaeology, London: Taylor and Francis. Barker, G. and D. Mattingly 1999-‐2000 The Archaeology of Mediterranean Landscapes (5 Vols.), Oxford:
Oxbow. Bettess, F. 1998 Surveying for Archaeologists, Durham: Penshaw Press. Bewley, R., D. Donaghue, V. Gaffney, M. van Leusen and A. Wise 1988 Archiving Aerial Photography and Remote Sensing Data, Oxford:
Oxbow. Binford, L.

1964 A consideration of archaeological research design, American Antiquity 29: 425-‐41.
Bintliff, J.L., M. Kuna and N. Venclová (eds.) 2000 The Future of Surface Artifact Collection in Europe, Sheffield: Sheffield
Academic Press. Bower, J. 1986 A survey of surveys: aspects of surface archaeology in sub-‐Saharan
Africa, African Archaeological Review 4: 21-‐40. Cherry, J.F. 1983 Frogs round the pond: perspectives on current archaeological survey
projects in the Mediterranean region, in Keller, D.R. and D.W. Rupp (eds.), Archaeological Survey in the Mediterranean Region.
Cox, C. 1992 Satellite imagery, aerial photography and wetland archaeology, World
Archaeology 24.2: 249-‐67. Crawford, O.G.S. and A. Keiller 1928 Wessex from the Air, Oxford: Clarendon. Dunnell, R.C. and W.S. Dancey 1983 The Siteless Survey: A Regional Scale Data Collection Strategy,
Advances in Archaeological Method and Theory 6: 267-‐287. Fish, S.K. and S.A. Kowalewski (eds.) 1990 The Archaeology of Regions. A Case for Full-Coverage Survey,
Washington: Smithsonian Institution Press. Forman, R.T.T. 1995 Land Mosaics. The Ecology of Landscapes and Regions, Cambridge:
Cambridge University Press. Gillings, M. 2000 The utility of the GIS approach in the collection, management, storage
and analysis of surface survey data, in Bintliff, J.L., M. Kuna and N. Venclová (eds.), The Future of Surface Artifact Collection in Europe: 105-‐120.
Gillings, M. and A. Wise 1999 GIS Guide to Good Practice, Oxford: Oxbow and Arts and Humanities
Data Service. Jackson, R.D. and A.R. Huete 1991 Interpreting vegetation indices, Preventive Veterinary Medicine
11:185-‐200. Keller, D.R. and D.W. Rupp (eds.)

1983 Archaeological Survey in the Mediterranean Region, Oxford: British Archaeological Reports.
Mueller, J.W. (ed.) 1979 Sampling in Archaeology, Tucson: University of Arizona Press. Nichols, D.L. 1988 Infared photography and Prehispanic irrigation at Teotihuacan: the
Tjalinga canals, Journal of Field Archaeology 15: 17-‐27. Orton, C. 2000 Sampling in Archaeology, Cambridge: Cambridge University Press. Sarris, A. and R.E. Jones 2000 Geophysical and related techniques applied to archaeological survey
in the Mediterranean: a review, Journal of Mediterranean Archaeology 13.1: 3-‐75.
Shennan, S. 1983 Experiments in the Collection and Analysis of Archaeological Survey
Data: The East Hampshire Survey, Sheffield: John R. Collis. Sullivan, A.P. 1998 Surface Archaeology, Albuquerque: University of New Mexico Press. Tso, B. and P.M. Mather 2001 Classification Methods for Remotely Sensed Data, London: Routledge. Wheatley, D. and M. Gillings 2002 Spatial Technology and Archaeology. The Archaeological Applications
of GIS, London: Taylor and Francis.