Embed Size (px)
Citation preview
Cement production is a complex process from blending various natural and synthetic materials through a
high temperature process to clinker and cement. The cement industry took off into a digitized future probably
a decade ago. Today there are various tools to compile data from sources and detectors in the plant and
transfer numeric data to automated procedures for analyses and identification of factors to improve energy
TEXT Thomas Neumann1, Georg Sieber2, Mario Marton3 and Michael Enders3
1Schwenk GmbH & Co. KG, plant Karlstadt2thyssenkrupp Transrapid GmbH, TechCenter Control Technology – Analytics & AI3thyssenkrupp Industrial Solutions AG, Cement Technologies
management and maintaining quality of the final products. A new important tool will be automated
isothermal calorimetry (polabCal) to assess clinker and cement reactivity online.
For the first time Schwenk Cement, tkIS and Calmetrix linked reactivity data from polabCal data to QC data
from automated quality control (polab AMT) and process data. The results confirm, within the first hour
of a calorimetric measurement it is possible to characterize clinker reactivity accurately. The clustering and
correlation analyses identifies quality drivers and the interface of process data facilitates corrections during
production. The integration of isothermal calorimetry and digitalization in process control opens new ways
to maintain clinker and cement quality at desired targets.
DIGITALIZATION
The Schwenk Karlstadt plant A
ll au
thor
s
DIGITALIZATION
DIGITALIZATION
30 ZKG 3 2021 www.zkg.de
mate task of a digital optimization of economic and ecologic key parameters and the production of con-sistent quality with a sustainable process over time.
One target is a reduced clinker content of ce-ments while keeping the performance of the cements at a given level to fulfill market requirements. This requires a better understanding of clinker and ce-ment reactivity beyond chemistry and mineralogy and particle size. In the past reactivity has hardly been assessed due to the limitation of time consum-ing physical analyses. Reactivity of clinker and ce-ment has been anticipated from chemical and min-eralogical data and fineness data during production. Today the first actual available reactivity measure-ment is one-day compressive strength. This strength value is delayed from clinker and cement production in the order of > 48h (from daily composite sample). The intermediate storage of raw materials in the kiln feed silo and clinker in the clinker silo complicates tracking compressive strength and reactivity back to process conditions during clinker production.
A very recent development introduced iso-thermal calorimetry into lab automation systems. Automated isothermal calorimetry (polabCal) is able to serve with reactivity data on pace with process control data [1, 2]. Isothermal calorimetric data is well accepted to indicate early strength development of cements [3, 4]. The new approach to estimate compressive strength from isothermal calorimetry is fast – accurate and more focused to compressive strength development than any other indirect signal from a QC lab in cement plants (XRF, XRD). This does not reduce the importance of both XRF and XRD but polabCal closes the time-gap from process control to the physical lab.
In a pilot setup in the Karlstadt cement plant thyssenkrupp (BU cement, TCCT) and Calmetrix and Schwenk partnered for an industrial trial to understand the benefits of combining automated quality control (polab AMT), automated isothermal calorimetry (polabCal) and digitalization by merg-ing all data in a single data array for data analyses using AI and neural networks (Figure 1). The target of this study was the identification of key drivers for clinker reactivity by exploiting a unique data set. The results facilitate optimization of cement reactiv-ity during the ongoing clinker production process. Finally, AI software and their integration in cement
1 IntroductionThe cement industry faces complex challenges like greenhouse gas emissions reduction, to get access to limited natural resources and to manage a complex clinkering process with secondary raw materials and alternative fuels. This is overlain by the pressure to improve processes economically and ecologically simultaneously.
Automation and digitalization are ready to sup-port cement manufacturers on this road. Artificial intelligence has become a focus area in any industry to improve economic and operational performance of plants based on actual and historic data and expe-rience and knowledge. The complexity of signals and the huge amount of data exceeds human perception. Modern analytical tools for data analyses based on artificial intelligence (AI) are up to close the gap.
Neural networks and fast computing provide automated analyses of large data arrays in real time. Historical data is continuously updated with actual data to train and refine the models for future deci-sions. The direct link of those tools to process control is the first step to autonomous cement plant opera-tion. When actual observations from the process in-dicate conditions not known to the model the soft-ware will call for human support.
Data for artificial intelligence is collected from a vast number of detectors/sensors located in the plant. Quality control data in the plants QC lab can be considered one of those (Figure 1). The operation of machines and processes and other plant internal processes like procurement, spare parts and mainte-nance can be adjusted to current and future demand and conditions in real time. This all follows the ulti-
SCHWENK GMBH & CO. KG | THYSSENKRUPP TRANSRAPID GMBH | THYSSENKRUPP INDUSTRIAL SOLUTIONS
From process control to quality prediction: Artificial intelligence in clinkering process control
1 Schematic setup of an IQCnet AI control-ler. Data is collected from various sources and linked to historical data and experience. Decisions are returned to the process and veri-fied from the following analyses
DIGITALIZATION
ZKG 3 2021 31
plant automation contributes to complex tasks like prediction of clinker reactivity and process control.
2 Karlstadt plantThe Schwenk plant in Karlstadt produces cement since 1877 (lead picture). The plant operates a ro-tary kiln with a 4-stage cyclone preheater. Annual cement production capacity totals to 1 million t cement and special construction binders per year. The product portfolio includes 16 different cements ranging from CEM I to CEM III in various strength classes as well as 25 special binders for civil engi-neering. The Karlstadt plant runs an own port which is used to land raw materials such as granulated blast furnace slag by ship and to expedite cements on the waterway.
Since 2001, the plant undertook a lot of efforts to increase the proportion of secondary fuels in clinker production. The secondary fuel rate exceeds 90% (since 2014). This substitution rate is above the average fuel substitution rate of German cement plants. The main fuels are refuse derived fuel (RDF), scrap tires (entered at the kiln inlet), and mechani-cally dewatered sewage sludge. Animal meal and thermal dried sewage sludge are burned at the main burner. In 2004, a dedicated sewage sludge dryer with a drying capacity of approximately 100000 t/a was built at the plant site. A heat exchanger in the clinker cooler provides the necessary heat to oper-ate the dryer in a cost efficient manner. The sewage sludge is dried to a moisture content of <10% and pneumatically transported to the kiln burner [5].
Relative to fossil fuels, secondary fuels are of-ten characterized by increased ash content. Sewage sludge has a very high ash content, averaging 41% ash (based on dried sewage sludge) [6]. Compared to raw meal, fuel ashes contain less calcium. The lime
saturation factor (LSF) of the raw meal is corrected to compensate for fuel ash in order to maintain the clinker LSF at an appropriate target.
In addition, it must be noted that the fuel ash-es also cause a significant calcium deficiency on a microscale during clinkering. On this microscale, phase equilibria between melt phase and newly formed solid phases are considerably disturbed. As a result, the chemical composition of the melt and the chemical composition of aluminate and ferrite phases in clinker is modulated. Both effects modify set and hardening characteristics of corresponding clinkers and cements. By means of heat flow calo-rimetry, these changes can be detected and critical conditions can be avoided during production [7].
3 Data collection3.1 Sample collection and quality data collectionThe Karlstadt plant is equipped with a polab AMT system. The full scale lab automation system automatically collects all relevant materials from the plant and ships them by pneumatic transport to the laboratory. In the lab, samples are automatically prepared to pressed tablets for XRF and XRD analy-ses and ground powders for isothermal calorimetry. The lab automation software AQC collects all rel-evant chemical and mineralogical data and particle size data – usually based on an hourly schedule (this depends on the materials collected).
3.2 Sample preparation for isothermal calorimetryPolabCal was operated in Karlstadt in an at-line mode. polabCal is ready for fully automated opera-tion, however due to space constraints of the proto-type it was not possible to hook up polabCal directly to the polab AMT. In total polabCal has been oper-ated in Karlstadt for almost 24 months.
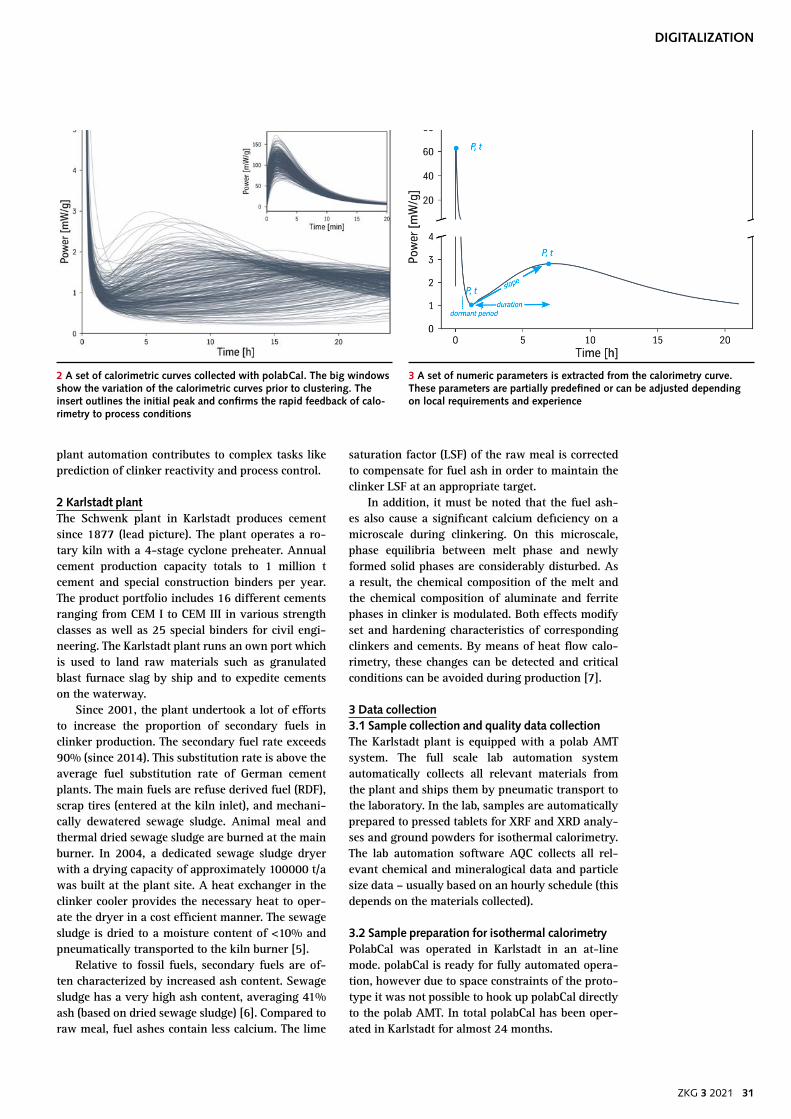
2 A set of calorimetric curves collected with polabCal. The big windows show the variation of the calorimetric curves prior to clustering. The insert outlines the initial peak and confirms the rapid feedback of calo-rimetry to process conditions
3 A set of numeric parameters is extracted from the calorimetry curve. These parameters are partially predefined or can be adjusted depending on local requirements and experience
DIGITALIZATION
32 ZKG 3 2021 www.zkg.de
3.3 Preparation of data setFor the analyses process and quality data including reactivity data from polabCal were compiled in a single data base. For convenience data was collected during distinct periods with varying QC targets. The evaluation of the data set was conducted offline at TCCT, Munich. In future a set of software packages is supplied to manage online training of neural net-works and to get decisions proposed instantaneous-ly. As the data processing is the key message of the current study this is described in a separate chapter and directly linked to the analyses.
4 Digital data analyses applying AI and neural networks4.1 Digital data evaluationThe current study exploited data from 6 month periods. The data consists of almost 400 calori-metric measurements and related process data and lab analyses results. To ensure comparability, time shifts between process parameters and the delayed analyses of the samples were corrected prior to data processing.
Figure 2 shows the thermal power curves of all measurements in the data set. The visual detectable spread from the graph indicates significant vari-ation in reactivity which ultimately can be tracked back to clinker properties and kiln operation. The curves include the so-called initial peak which is hardly recorded in standard isothermal calorimetry (insert in Figure 2). The initial peak appears very early after water addition to the sample. It is widely accepted, that the energy release at this point can be attributed to free lime hydration, early C3A hy-dration and early C3S hydration. The recording of the complete initial peak is possible as polabCal prepares the samples very fast in a temperature controlled environment. Therefore no thermal equi-libration period inside the calorimeter is needed. Af-ter roughly 30 minutes the approach of the dormant period is confirmed by the end of the initial heat release. After 5 hours, the main peak is seen – this is what is usually shown in isothermal calorimetry (Figure 2, main graph).
The current study focused on the initial peak within the first 60 minutes after water addition. If isothermal calorimetry is targeted to process con-trol, the timescales of process control and calorim-etry need to overlap. Information which can be ex-tracted after a couple of hours from the main peak may be time-wise closer to data of the physical lab, but the delay to production is considerable and any correlation to the process would be difficult even with only 5 hours offset. For this reason, long term data from the calorimetric curves were not investi-gated in detail.
Typical curves from isothermal calorimetry re-cord the heat release over time. The application of numeric analytical systems like AI either require (a)
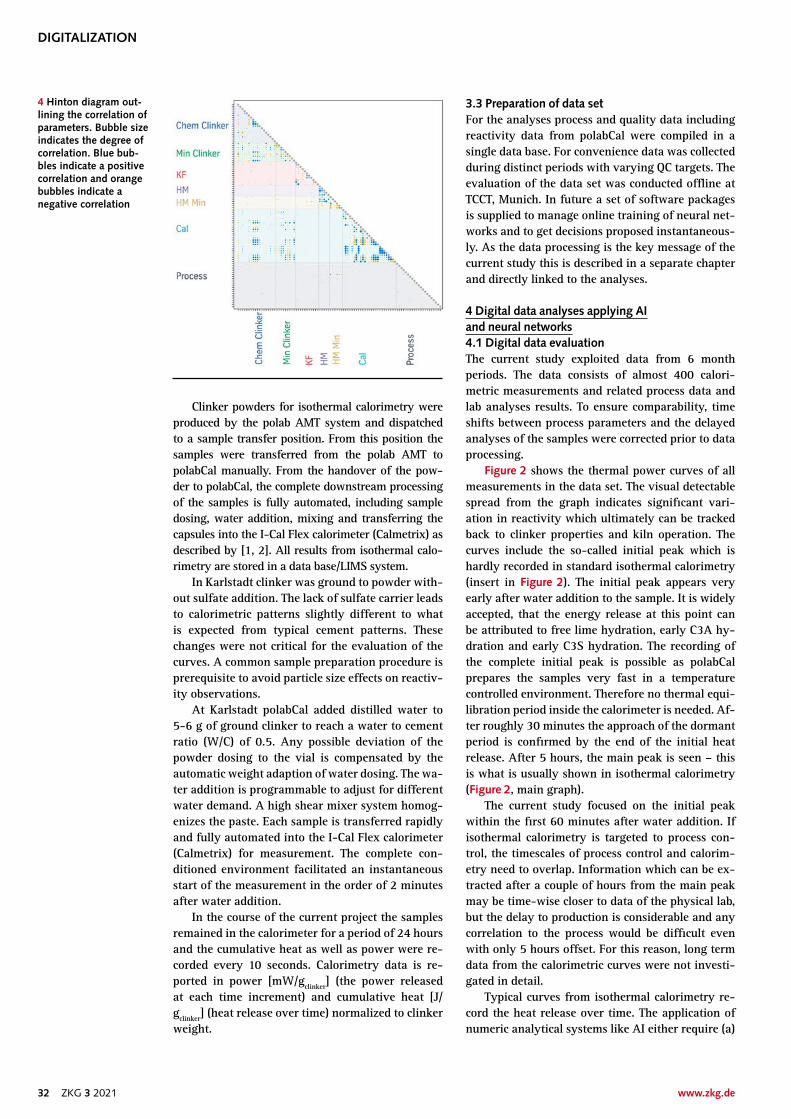
4 Hinton diagram out-lining the correlation of parameters. Bubble size indicates the degree of correlation. Blue bub-bles indicate a positive correlation and orange bubbles indicate a negative correlation
Clinker powders for isothermal calorimetry were produced by the polab AMT system and dispatched to a sample transfer position. From this position the samples were transferred from the polab AMT to polabCal manually. From the handover of the pow-der to polabCal, the complete downstream processing of the samples is fully automated, including sample dosing, water addition, mixing and transferring the capsules into the I-Cal Flex calorimeter (Calmetrix) as described by [1, 2]. All results from isothermal calo-rimetry are stored in a data base/LIMS system.
In Karlstadt clinker was ground to powder with-out sulfate addition. The lack of sulfate carrier leads to calorimetric patterns slightly different to what is expected from typical cement patterns. These changes were not critical for the evaluation of the curves. A common sample preparation procedure is prerequisite to avoid particle size effects on reactiv-ity observations.
At Karlstadt polabCal added distilled water to 5-6 g of ground clinker to reach a water to cement ratio (W/C) of 0.5. Any possible deviation of the powder dosing to the vial is compensated by the automatic weight adaption of water dosing. The wa-ter addition is programmable to adjust for different water demand. A high shear mixer system homog-enizes the paste. Each sample is transferred rapidly and fully automated into the I-Cal Flex calorimeter (Calmetrix) for measurement. The complete con-ditioned environment facilitated an instantaneous start of the measurement in the order of 2 minutes after water addition.
In the course of the current project the samples remained in the calorimeter for a period of 24 hours and the cumulative heat as well as power were re-corded every 10 seconds. Calorimetry data is re-ported in power [mW/gclinker] (the power released at each time increment) and cumulative heat [J/gclinker] (heat release over time) normalized to clinker weight.
DIGITALIZATION
ZKG 3 2021 33
characteristic numerical values extracted from the curves values for numerical analyses or (b) a ch-emometric analysis where properties of the sample are estimated by similarity relative to adjacent sam-ples with known characteristics. In the current study features from calorimetry were converted to numer-ical values (Figure 3). Figure 3 also confirms the high intensity and the sharp shape of the initial peak – all this is on a common time scale. The features ex-tracted include e.g. the power and released heat at the first and second maximum of the thermal power curve, the slope and duration between observed minimum and second maximum. The correlation of
those numbers to any other analytical result or pro-cess data is organized by the so-called time stamp given by the polab System automatically.
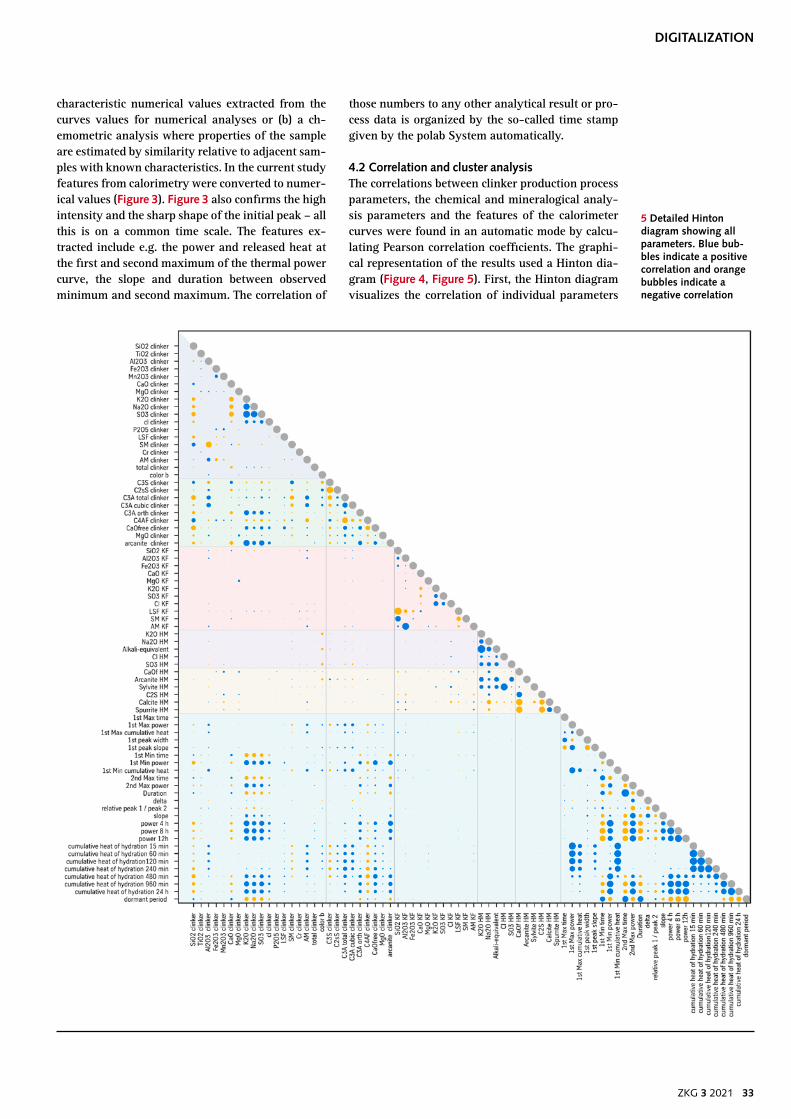
4.2 Correlation and cluster analysisThe correlations between clinker production process parameters, the chemical and mineralogical analy-sis parameters and the features of the calorimeter curves were found in an automatic mode by calcu-lating Pearson correlation coefficients. The graphi-cal representation of the results used a Hinton dia-gram (Figure 4, Figure 5). First, the Hinton diagram visualizes the correlation of individual parameters
5 Detailed Hinton diagram showing all parameters. Blue bub-bles indicate a positive correlation and orange bubbles indicate a negative correlation
DIGITALIZATION
34 ZKG 3 2021 www.zkg.de
by showing the degree of correlation by a bubble size and second the slope of the correlation by color (blue for positive, orange for negative). The analy-ses clearly indicate – this is following expectations – reactivity is highly correlated with chemical and mineralogical parameters.
The complex data set was further analyzed in a cluster analysis. In cluster analyses emerging pat-terns of the data are grouped according shape and characteristic properties. In the current study the foci of analyses were chemical and mineralogical composition and the results were later compared to the output from calorimetric analyses.
The heterogeneous data set requires preliminary processing to normalize numerical values for analy-ses. All numerical values are converted to a standard zero mean value and normalized variance. The next step is the identification of principal components (PCA – principal component analyses) and a projec-tion of the data to a lower dimensionality.
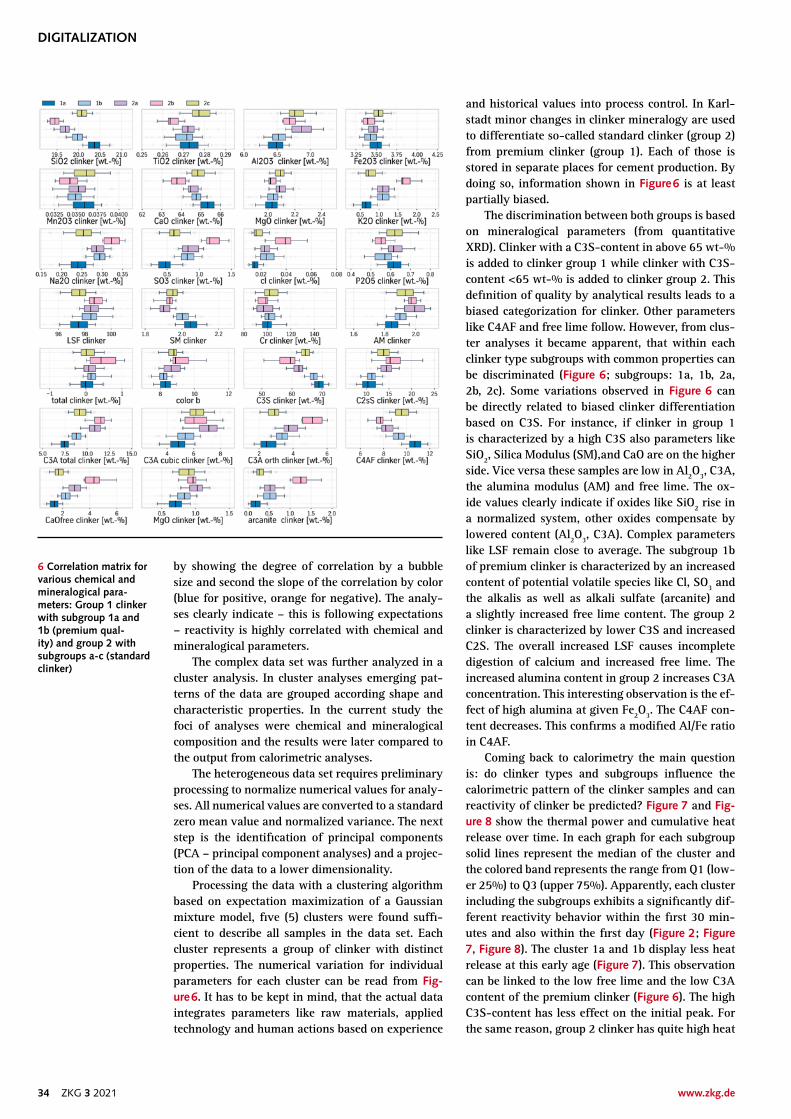
Processing the data with a clustering algorithm based on expectation maximization of a Gaussian mixture model, five (5) clusters were found suffi-cient to describe all samples in the data set. Each cluster represents a group of clinker with distinct properties. The numerical variation for individual parameters for each cluster can be read from Fig-ure 6. It has to be kept in mind, that the actual data integrates parameters like raw materials, applied technology and human actions based on experience
and historical values into process control. In Karl-stadt minor changes in clinker mineralogy are used to differentiate so-called standard clinker (group 2) from premium clinker (group 1). Each of those is stored in separate places for cement production. By doing so, information shown in Figure 6 is at least partially biased.
The discrimination between both groups is based on mineralogical parameters (from quantitative XRD). Clinker with a C3S-content in above 65 wt-% is added to clinker group 1 while clinker with C3S-content <65 wt-% is added to clinker group 2. This definition of quality by analytical results leads to a biased categorization for clinker. Other parameters like C4AF and free lime follow. However, from clus-ter analyses it became apparent, that within each clinker type subgroups with common properties can be discriminated (Figure 6; subgroups: 1a, 1b, 2a, 2b, 2c). Some variations observed in Figure 6 can be directly related to biased clinker differentiation based on C3S. For instance, if clinker in group 1 is characterized by a high C3S also parameters like SiO2, Silica Modulus (SM),and CaO are on the higher side. Vice versa these samples are low in Al2O3, C3A, the alumina modulus (AM) and free lime. The ox-ide values clearly indicate if oxides like SiO2 rise in a normalized system, other oxides compensate by lowered content (Al2O3, C3A). Complex parameters like LSF remain close to average. The subgroup 1b of premium clinker is characterized by an increased content of potential volatile species like Cl, SO3 and the alkalis as well as alkali sulfate (arcanite) and a slightly increased free lime content. The group 2 clinker is characterized by lower C3S and increased C2S. The overall increased LSF causes incomplete digestion of calcium and increased free lime. The increased alumina content in group 2 increases C3A concentration. This interesting observation is the ef-fect of high alumina at given Fe2O3. The C4AF con-tent decreases. This confirms a modified Al/Fe ratio in C4AF.
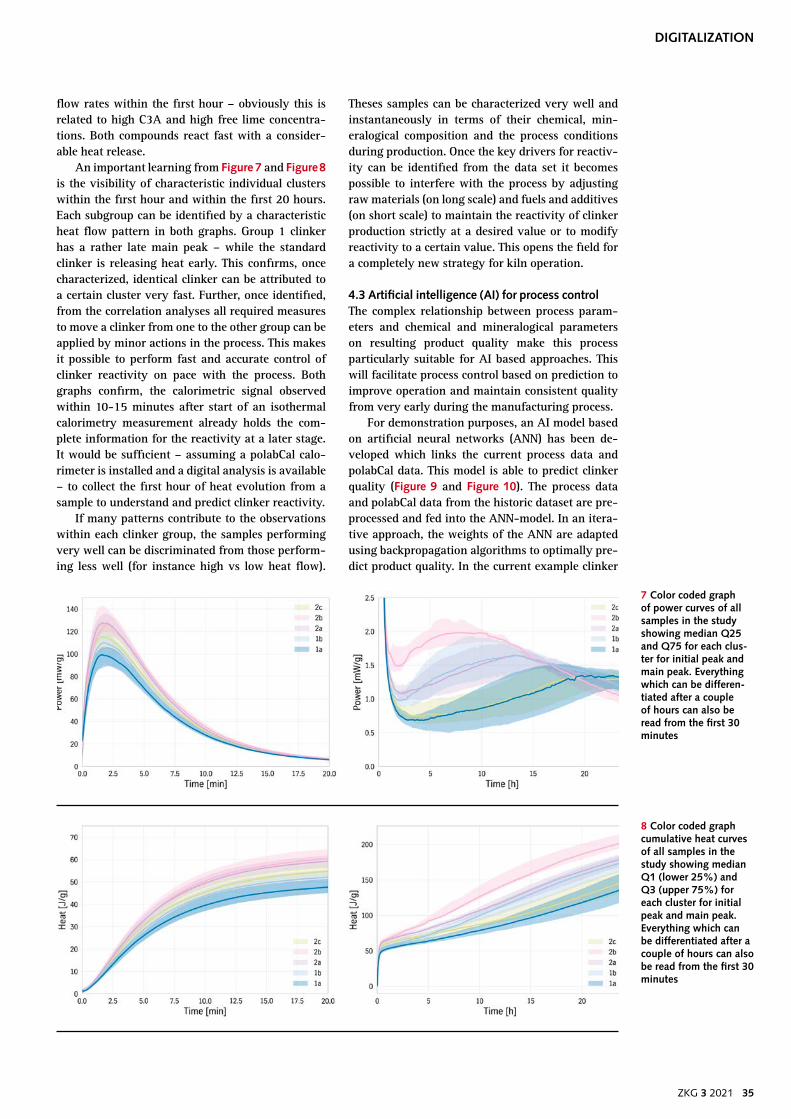
Coming back to calorimetry the main question is: do clinker types and subgroups influence the calorimetric pattern of the clinker samples and can reactivity of clinker be predicted? Figure 7 and Fig-ure 8 show the thermal power and cumulative heat release over time. In each graph for each subgroup solid lines represent the median of the cluster and the colored band represents the range from Q1 (low-er 25%) to Q3 (upper 75%). Apparently, each cluster including the subgroups exhibits a significantly dif-ferent reactivity behavior within the first 30 min-utes and also within the first day (Figure 2; Figure 7, Figure 8). The cluster 1a and 1b display less heat release at this early age (Figure 7). This observation can be linked to the low free lime and the low C3A content of the premium clinker (Figure 6). The high C3S-content has less effect on the initial peak. For the same reason, group 2 clinker has quite high heat
6 Correlation matrix for various chemical and mineralogical para-meters: Group 1 clinker with subgroup 1a and 1b (premium qual-ity) and group 2 with subgroups a-c (standard clinker)
DIGITALIZATION
ZKG 3 2021 35
7 Color coded graph of power curves of all samples in the study showing median Q25 and Q75 for each clus-ter for initial peak and main peak. Everything which can be differen-tiated after a couple of hours can also be read from the first 30 minutes
8 Color coded graph cumulative heat curves of all samples in the study showing median Q1 (lower 25%) and Q3 (upper 75%) for each cluster for initial peak and main peak. Everything which can be differentiated after a couple of hours can also be read from the first 30 minutes
flow rates within the first hour – obviously this is related to high C3A and high free lime concentra-tions. Both compounds react fast with a consider-able heat release.
An important learning from Figure 7 and Figure 8 is the visibility of characteristic individual clusters within the first hour and within the first 20 hours. Each subgroup can be identified by a characteristic heat flow pattern in both graphs. Group 1 clinker has a rather late main peak – while the standard clinker is releasing heat early. This confirms, once characterized, identical clinker can be attributed to a certain cluster very fast. Further, once identified, from the correlation analyses all required measures to move a clinker from one to the other group can be applied by minor actions in the process. This makes it possible to perform fast and accurate control of clinker reactivity on pace with the process. Both graphs confirm, the calorimetric signal observed within 10-15 minutes after start of an isothermal calorimetry measurement already holds the com-plete information for the reactivity at a later stage. It would be sufficient – assuming a polabCal calo-rimeter is installed and a digital analysis is available – to collect the first hour of heat evolution from a sample to understand and predict clinker reactivity.
If many patterns contribute to the observations within each clinker group, the samples performing very well can be discriminated from those perform-ing less well (for instance high vs low heat flow).
Theses samples can be characterized very well and instantaneously in terms of their chemical, min-eralogical composition and the process conditions during production. Once the key drivers for reactiv-ity can be identified from the data set it becomes possible to interfere with the process by adjusting raw materials (on long scale) and fuels and additives (on short scale) to maintain the reactivity of clinker production strictly at a desired value or to modify reactivity to a certain value. This opens the field for a completely new strategy for kiln operation.
4.3 Artificial intelligence (AI) for process controlThe complex relationship between process param-eters and chemical and mineralogical parameters on resulting product quality make this process particularly suitable for AI based approaches. This will facilitate process control based on prediction to improve operation and maintain consistent quality from very early during the manufacturing process.
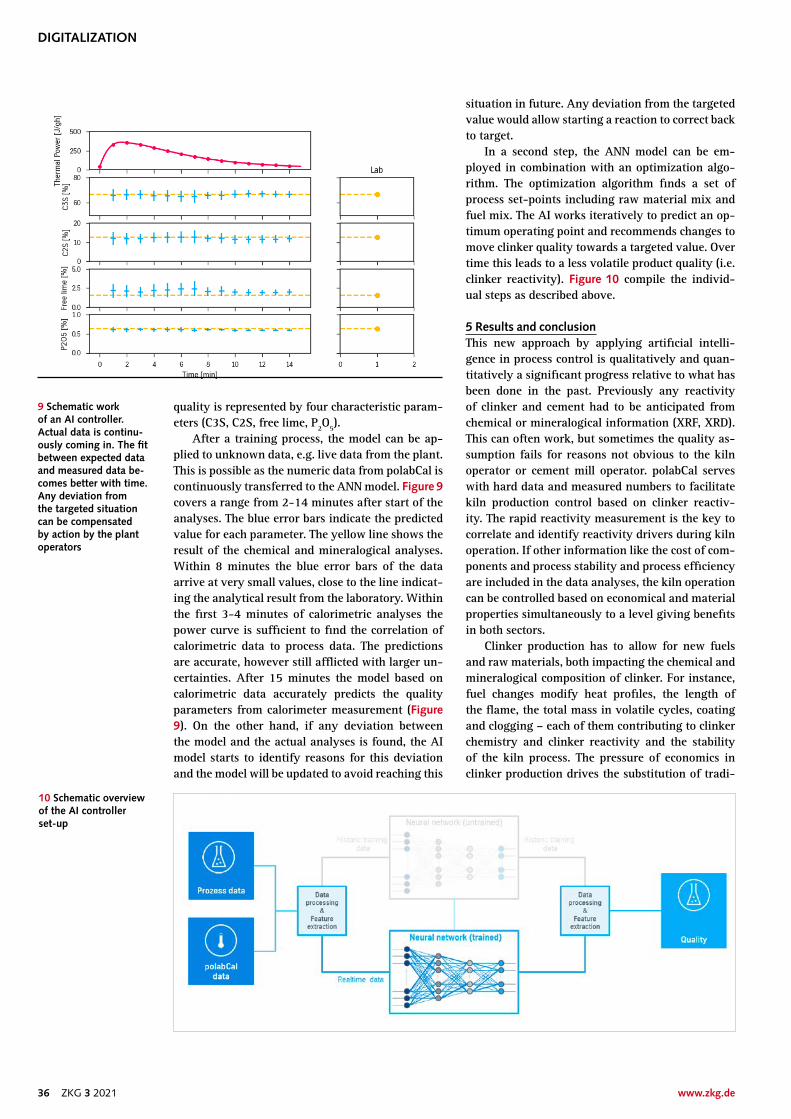
For demonstration purposes, an AI model based on artificial neural networks (ANN) has been de-veloped which links the current process data and polabCal data. This model is able to predict clinker quality (Figure 9 and Figure 10). The process data and polabCal data from the historic dataset are pre-processed and fed into the ANN-model. In an itera-tive approach, the weights of the ANN are adapted using backpropagation algorithms to optimally pre-dict product quality. In the current example clinker
DIGITALIZATION
36 ZKG 3 2021 www.zkg.de
quality is represented by four characteristic param-eters (C3S, C2S, free lime, P2O5).
After a training process, the model can be ap-plied to unknown data, e.g. live data from the plant. This is possible as the numeric data from polabCal is continuously transferred to the ANN model. Figure 9 covers a range from 2-14 minutes after start of the analyses. The blue error bars indicate the predicted value for each parameter. The yellow line shows the result of the chemical and mineralogical analyses. Within 8 minutes the blue error bars of the data arrive at very small values, close to the line indicat-ing the analytical result from the laboratory. Within the first 3-4 minutes of calorimetric analyses the power curve is sufficient to find the correlation of calorimetric data to process data. The predictions are accurate, however still afflicted with larger un-certainties. After 15 minutes the model based on calorimetric data accurately predicts the quality parameters from calorimeter measurement (Figure 9). On the other hand, if any deviation between the model and the actual analyses is found, the AI model starts to identify reasons for this deviation and the model will be updated to avoid reaching this
situation in future. Any deviation from the targeted value would allow starting a reaction to correct back to target.
In a second step, the ANN model can be em-ployed in combination with an optimization algo-rithm. The optimization algorithm finds a set of process set-points including raw material mix and fuel mix. The AI works iteratively to predict an op-timum operating point and recommends changes to move clinker quality towards a targeted value. Over time this leads to a less volatile product quality (i.e. clinker reactivity). Figure 10 compile the individ-ual steps as described above.
5 Results and conclusionThis new approach by applying artificial intelli-gence in process control is qualitatively and quan-titatively a significant progress relative to what has been done in the past. Previously any reactivity of clinker and cement had to be anticipated from chemical or mineralogical information (XRF, XRD). This can often work, but sometimes the quality as-sumption fails for reasons not obvious to the kiln operator or cement mill operator. polabCal serves with hard data and measured numbers to facilitate kiln production control based on clinker reactiv-ity. The rapid reactivity measurement is the key to correlate and identify reactivity drivers during kiln operation. If other information like the cost of com-ponents and process stability and process efficiency are included in the data analyses, the kiln operation can be controlled based on economical and material properties simultaneously to a level giving benefits in both sectors.
Clinker production has to allow for new fuels and raw materials, both impacting the chemical and mineralogical composition of clinker. For instance, fuel changes modify heat profiles, the length of the flame, the total mass in volatile cycles, coating and clogging – each of them contributing to clinker chemistry and clinker reactivity and the stability of the kiln process. The pressure of economics in clinker production drives the substitution of tradi-
9 Schematic work of an AI controller. Actual data is continu-ously coming in. The fit between expected data and measured data be-comes better with time. Any deviation from the targeted situation can be compensated by action by the plant operators
10 Schematic overview of the AI controller set-up
DIGITALIZATION
ZKG 3 2021 37
REFERENCES
[1] Enders, M.; Teutenberg, R.; Sandberg, P.: Automated calorimetry – the missing link in automated quality control. International Cement Review 6/2020, pp. 72-74[2] Sandberg, P.; Enders, M.; Teutenberg, R.: When dreams come true. Worldcement 11/2020, pp. 58-63[3] Frølich, L.; Wadsö; L.; Sandberg, P.: Using isothermal calorimetry to predict one day mortar strengths. Cement and Concrete Research 88 (2016), pp. 108-113[4] Enders, M.: The effect of limestone addition and limestone particle size on compressive strength and hydra-tion reactions in semi-industrial Portland limestone cement. Cement International 6/2020, pp. 50-62[5] Trenkwalder, J.: Waste heat recovery for the drying of sewage sludge. 6th Int. VDZ Congress. Düsseldorf. 09/2009[6] Krüger, O.; Adam, C.: Monitoring von Klärschlam-mmonoverbrennungsaschen hinsichtlich ihrer Zusammen-setzung zur Ermittlung ihrer Rohstoffrückgewinnungspo-tentiale und zur Erstellung von Referenzmaterial für die Überwachungsanalytik. Umweltbundesamt. 2014[7] Neumann, T.: Einfluss veränderter Brennbedingungen auf die Klinkerzwischenphase und die daraus resultierende Beeinflussung der Hydratation. PhD-Thesis. 2019. Martin-Luther-Universität Halle-Wittenberg
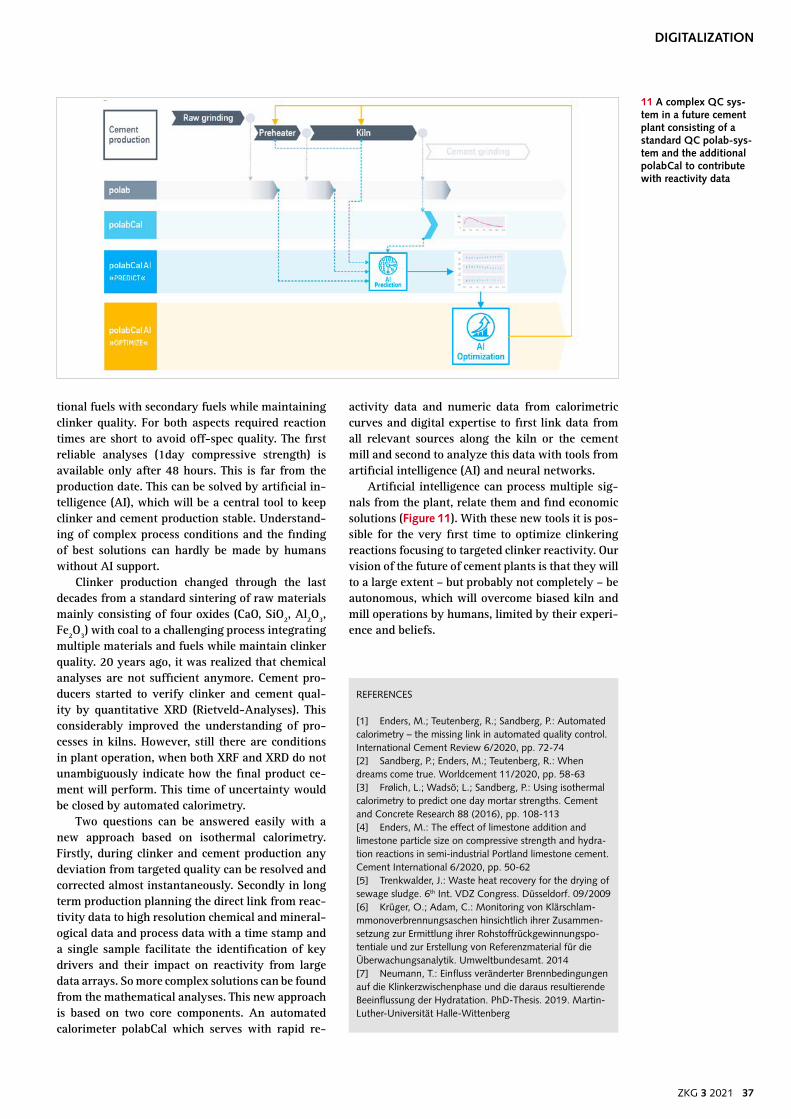
11 A complex QC sys-tem in a future cement plant consisting of a standard QC polab-sys-tem and the additional polabCal to contribute with reactivity data
tional fuels with secondary fuels while maintaining clinker quality. For both aspects required reaction times are short to avoid off-spec quality. The first reliable analyses (1day compressive strength) is available only after 48 hours. This is far from the production date. This can be solved by artificial in-telligence (AI), which will be a central tool to keep clinker and cement production stable. Understand-ing of complex process conditions and the finding of best solutions can hardly be made by humans without AI support.
Clinker production changed through the last decades from a standard sintering of raw materials mainly consisting of four oxides (CaO, SiO2, Al2O3, Fe2O3) with coal to a challenging process integrating multiple materials and fuels while maintain clinker quality. 20 years ago, it was realized that chemical analyses are not sufficient anymore. Cement pro-ducers started to verify clinker and cement qual-ity by quantitative XRD (Rietveld-Analyses). This considerably improved the understanding of pro-cesses in kilns. However, still there are conditions in plant operation, when both XRF and XRD do not unambiguously indicate how the final product ce-ment will perform. This time of uncertainty would be closed by automated calorimetry.
Two questions can be answered easily with a new approach based on isothermal calorimetry. Firstly, during clinker and cement production any deviation from targeted quality can be resolved and corrected almost instantaneously. Secondly in long term production planning the direct link from reac-tivity data to high resolution chemical and mineral-ogical data and process data with a time stamp and a single sample facilitate the identification of key drivers and their impact on reactivity from large data arrays. So more complex solutions can be found from the mathematical analyses. This new approach is based on two core components. An automated calorimeter polabCal which serves with rapid re-
activity data and numeric data from calorimetric curves and digital expertise to first link data from all relevant sources along the kiln or the cement mill and second to analyze this data with tools from artificial intelligence (AI) and neural networks.
Artificial intelligence can process multiple sig-nals from the plant, relate them and find economic solutions (Figure 11). With these new tools it is pos-sible for the very first time to optimize clinkering reactions focusing to targeted clinker reactivity. Our vision of the future of cement plants is that they will to a large extent – but probably not completely – be autonomous, which will overcome biased kiln and mill operations by humans, limited by their experi-ence and beliefs.