Embed Size (px)
Citation preview
DIGITAL WRITING AND DIVERSITY: THE EFFECTS
OF SCHOOL LAPTOP PROGRAMS ON LITERACY
PROCESSES AND OUTCOMES*
BINBIN ZHENG
MARK WARSCHAUER
GEORGE FARKAS
University of California, Irvine
ABSTRACT
Over the last decade, the number of one-to-one laptop programs in U.S.
schools has steadily increased. Though technology advocates believe that
such programs can assist student writing, there has been little systematic
evidence for this claim, and even less focused on technology use by at-risk
learners. This study examined the effect of daily access to laptops on the
writing outcomes and processes of 2,158 upper elementary students in
two school districts, and the effect among diverse students. In a California
district, students showed improved English language arts achievement
in both a partial laptop program year and a full laptop program year. In
a Colorado district, overall writing test score gains were not statistically
significant; however in both districts, at-risk student groups (i.e., Hispanics
and low-income learners) showed significant gains. In addition, survey
results, interviews, and observations indicate that at-risk learners used
the laptops more frequently than their counterparts at school for a variety
of learning purposes. This study suggests that well-planned use of laptops
and digital media can help diverse learners improve their literacy processes
and outcomes.
*Funding for this study was provided by the John Randolph Haynes and Dora Haynes
Foundation and a Google Research Award.
267
� 2013, Baywood Publishing Co., Inc.
doi: http://dx.doi.org/10.2190/EC.48.3.a
http://baywood.com
J. EDUCATIONAL COMPUTING RESEARCH, Vol. 48(3) 267-299, 2013
In recent years, a growing number of U.S. schools have adopted one-to-one laptop
programs, in which all the students in a class, grade level, school, or district
are provided individual laptop computers for use throughout the school day
(Warschauer, 2006). A key goal of many of these programs is to increase
educational and social equity by providing technology-intensive instruction to
students who may lack access to digital media outside of school. In addition, a
major use of laptops is for literacy activities, and there is the hope among some
educators that focused instruction with laptops can help learners improve their
writing (see discussion in Warschauer, 2011). The declining cost of laptops and
the increasing availability of free or low-cost open source software mean that the
appeal of one-to-one programs will likely continue to grow. Yet while many
educators have shown an interest in implementing such programs, they are often
reluctant to invest in them without better evidence of their benefits (see discussion
in Lei & Zhao, 2008). There has as yet been little systematic research on the impact
of laptop programs on the literacy achievement of diverse students, with most
prior studies of one-to-one programs either lacking rigor or involving very small
implementations (see discussion in Penuel, 2006).
This article analyzes the impact of upper elementary students’ individual use
of netbook computers on their writing processes and outcomes in two medium-
sized school districts that implemented technology-intensive writing curricula.
Our study examines the overall effects of the programs on writing and literacy
achievement as well as the particular impact on the major groups of at-risk learners
in the two districts, which include Hispanics, students from low-income families,
and English language learners.
Prior Research
To contextualize our study, we briefly review several strains of prior research
related to laptops and literacy. First, we examine the use of digital media for
writing, particularly in relationship to the ways that such media are used in these
districts. Next we review research on laptop programs and literacy processes
and outcomes. Finally, we summarize research on technology and learning
among at-risk students.
Digital Media and Writing
The development and diffusion of computers and the Internet have impacted
writing in different forms and genres and for different purposes both inside and
outside the classroom (Warschauer, 2007; Black, 2008). Studies of these changes
can be traced back to the 1980s. Kulik (2003) reviewed 12 controlled studies and
meta-analyses published since 1990 on the effects of technology use on student
writing, focusing on word processing (with and without the use of assigned
prompts) and what he describes as computer enrichment for writing (based on
games, simulations, tutorials, and online resources). Overall, he found a mixed but
268 / ZHENG, WARSCHAUER AND FARKAS
generally positive effect of word processing on writing, and suggested that the
use of writing prompts could amplify the benefits of ordinary word processing.
Examination of computer enrichment activities also suggested mixed effects,
with later studies tending towards more positive outcomes than earlier ones.
In the districts investigated in this study, the major uses of digital tools for
writing involved social media and automated writing evaluation (AWE). We
briefly summarize research in each of these areas.
Social Media and Writing
Many students are actively engaged in using social media to support writing
outside of school, such as blogs, wikis, and online communities; however, a
disconnect exists between students’ out-of-school and in-school literacy practices
(see, e.g., Harklau & Pinnow, 2009; Weinstein, 2002). Research conducted in
out-of-school settings suggests that the use of social media can be highly effec-
tive for developing young writers as they can take advantage of online tools to
sharpen their message in response to comments and feedback from others and
build their identity as authentic writers (Black, 2008; Lam, 2000). These benefits
of out-of-school online writing may be especially important for English language
learners (ELLs), who often disengage from classroom activities. An example
of this is provided by Lam (2000), who investigated a Chinese immigrant who,
while disaffected from school, honed his English writing skills through his
multilingual website and e-mail interactions. Similarly, Black (2008) explored
how young English learners’ participation in the online forum fanfiction.net
developed their online identity as popular, multi-literate writers. Both of these
studies illustrate that online environments provide an opportunity for writing in
diverse genres and make possible a process of meaning making and identity
development beyond the constraints of geography, language, and culture.
There has been little published research on the use of social media for writing
development among K-12 students in school settings. A few studies on the
topic have been carried out among adult learners. For example, Sun and Chang
(2012) examined seven graduate students’ writing on blogs in an academic
writing class. The study suggested that the interactive and collaborative features
of blogs provide a means for students to scaffold each other in their writing and
in building their academic identity. Bloch (2007) provides a case study of an
adult immigrant English learner who made use of blogs to transition from spoken
discourse to academic writing. Most generally, published studies on social media
use in K-12 settings have focused on the ways that such media may increase
students’ understanding of, and critical thinking about, written texts (e.g., Carico
& Logan, 2004; Grisham & Wolsey, 2006).
Despite these potential advantages, many educators are hesitant to use social
media in instruction. The impact of social media use on standardized writing out-
comes has not been investigated, and many teachers either lack sufficient hardware
DIGITAL WRITING AND DIVERSITY / 269
to engage students in online writing or fear that such writing will expose them to
distractions or even danger (see discussion in Alliance for Childhood, 2004).
Automated Writing Evaluation
A major disincentive to writing instruction in the K-12 classroom is the large
amount of time and effort required to provide feedback on papers. Automated
Writing Evaluation (AWE) programs promise to help ease this burden by off-
loading some of the assessment responsibility to software rather than teachers.
Such software can provide nearly instantaneous computer-based scoring and
feedback to students (for an overview, see Warschauer & Ware, 2006). Much of
the prior research on AWE investigates its psychometric properties (e.g., Cohen,
Ben-Simon, & Hovav, 2003; Wang & Brown, 2007) or its use with university
students. There have been relatively few studies of its use in K-12 classrooms.
One study conducted by Shermis, Burstein, and Bliss (2004) investigated the use
of Criterion, an AWE software, on students’ writing development, by randomly
assigning 1,000 high school students to either a treatment group using Criterion,
or a control group that did not use the software for writing assignments. This
study found no significant difference between these two groups on a state writing
exam, although treatment students did show a significant increase in average
essay length as well as a reduction in mechanical errors such as spelling, capital-
ization, punctuation, and grammar. Although some research suggests that auto-
mated scoring engines are flawed for evaluating classroom writing (Chen &
Cheng, 2008), studies by Grimes and Warschauer (2008, 2010) find that such
software may assist teachers to manage large classes by keeping learners posi-
tively engaged. However, with relatively little research on the use of AWE in K-12
classrooms, it is too early to draw firm conclusions as to its benefits or drawbacks.
Laptop Programs and Literacy
One-to-one laptop programs have been adopted in North American schools
since the development of Microsoft’s Anytime Anywhere Learning Program in
the mid-1990s (see discussion in Johnstone, 2003), and have grown steadily
over the years. The Maine Learning Technology Initiative (MLTI) launched a
one-to-one laptop initiative in fall 2002, which made Maine the first state to
use technology in an attempt to transform and improve teaching and learning in
classrooms statewide. The MLTI provided all seventh and eighth grade students
and teachers with laptops; technical support and professional development
were also provided for teachers to integrate the technology into curriculum and
instruction (Silvernail & Lane, 2004). Though no other state provides laptops
to all students in particular grades, other relevant statewide initiatives include
Michigan’s Freedom to Learn (FTL) program, Texas’s Technology Immersion
Pilot (TIP) program, Florida’s Enhancing Education through Technology (EETT)
program, and Pennsylvania’s Classroom for the Future (CFF) program. Individual
270 / ZHENG, WARSCHAUER AND FARKAS

school districts, including Birmingham, Alabama (see discussion in Warschauer,
2011), have also launched one-to-one programs. With the Birmingham program
as an important exception, most of these programs emphasize new forms of
curriculum and pedagogy, and a number are directly tied to writing-based cur-
ricular reform (for an example, see Jeroski, 2008).
A number of studies have looked at the relationship between one-to-one laptop
programs and writing processes. Several surveys suggest that writing and editing
is the principle use of laptops in one-to-one classrooms (see, e.g., Suhr,
Hernandez, Warschauer, & Grimes, 2010). Another consistent finding, demon-
strated by surveys (e.g., Bebell & Kay, 2009), interviews and observations (e.g.,
Russell, Bebell, & Higgins, 2004) is that students write more in classes where
all students have individual computers. For example, in an observation study
involving timed measurements, Russell, Bebell, and Higgins (2004) found that
students in one-to-one laptop programs composed text on either laptop or paper an
average of 1.99 instances per 10-minute observation, while students in shared
laptop classrooms composed texts in either medium an average of 0.26 instances
per observation. Surveys, interviews, and observations have also demonstrated
that in laptop classrooms students receive more feedback on their writing, edit
their papers more, draw on a wider range of resources to write, and publish or
share their work with others more often (e.g., Grimes & Warschauer, 2008; Bebell
& Kay, 2009; Hill, Reeves, Grant, & Wang, 2002; Lei & Zhao, 2008). For all these
reasons, both teachers and students have been found to have positive attitudes
about laptops in the writing class (e.g., Suhr et al., 2010; Bebell & Kay, 2009; Ross,
Lowther, Relyea, Wang, & Morrison, 2003), indicating that one-to-one laptop
programs provide a favorable environment for student writing processes.
In addition to examining writing processes, a few studies have also examined
the use of laptops on writing outcomes, but these are mostly unpublished evalu-
ation reports (e.g., Jeroski, 2008; Ross et al., 2003; Shapley, Sheehan, Maloney,
& Caranikas-Walker, 2008; Silvernail & Gritter, 2007) or studies of relatively
small interventions (e.g., Grimes & Warschauer, 2008; Suhr et al., 2010). Three of
these studies have found a small statistically significant positive impact on writing
or broader literacy outcomes, in each case after the second year of implementation
(Grimes & Warschauer, 2008; Shapley et al., 2008; Suhr et al., 2010). Other
studies offer only descriptive evidence of writing improvement (see, e.g., Jeroski,
2008), sometimes with weak evidence using uncertain methodology (see, e.g.,
Silvernail & Gritter, 2007). The limited number of rigorous studies and
peer-reviewed articles leaves the impact of one-to-one laptop programs on student
writing outcomes inconclusive.
Technology and Diverse Learners
One rationale for many educational technology programs is to reduce edu-
cational inequity by providing access to digital resources that is lacking in
DIGITAL WRITING AND DIVERSITY / 271

low-income homes (Culp, Honey, & Mandinach, 2005). However, research
suggests that these positive goals are not typically achieved. For example,
Wenglinsky (2005) analyzed 3 years of data from the National Assessment of
Educational Progress (NAEP), finding that students’ socio-economic status
(SES) was the strongest single factor predicting whether technology use would
be positively or negatively associated with increased test scores, with lower
SES students achieving the least benefit from technology use. Bebell and Kay
(2010) found that eighth grade students who reported more frequent use of
computers for recreation at home tend to have higher ELA achievement;
however, the positive effect diminishes greatly after controlling for students’
SES. Similarly, a range of studies on home access to computers conclude that
any benefits such access brings for academic achievement occur dispropor-
tionately among higher SES students (for a review, see Warschauer &
Matuchniak, 2010).
Few studies of school laptop use have examined the impact of this instructional
technology on at-risk learners. In a qualitative study of ten schools where laptops
had been introduced, Warschauer (2006) found that the implementation of a
laptop program was more challenging in low SES schools, although there were
no quantitative comparisons. Two studies of the One Laptop per Child program in
Latin America reported greater benefits for more cognitively advanced learners,
based on observations of children’s technology use in Paraguay (see discus-
sion in Warschauer & Ames, 2010) and on a quantitative analysis of pre-post
scores on a cognitive skill measure in Peru (Severin, Santiago, Cristia, Ibarraran,
Thompson, & Cueto, 2011). Laptop programs in Texas middle schools have
been found to raise the technology skills of economically disadvantaged learners,
but the skills of economically advantaged learners improved as well, with no
indication of which group of students improved more in technological proficiency
(Shapley et al., 2008).
In summary, there is little evidence that school technology or laptop programs
narrow the gap between at-risk students and their non-at-risk peers. Additionally,
none of the studies on technology and diversity have examined the use of laptops
in carefully tailored curricular interventions that are designed to improve literacy
outcomes among diverse learners. We undertook this study to investigate the
impact of two district-wide laptop programs that were specifically designed to
support the type of writing-intensive curriculum believed to be beneficial for
at-risk elementary school students.
METHODS
Drawing on a range of quantitative and qualitative data, this study investi-
gated the effect of one-to-one laptop programs that were implemented in each of
two school districts for fourth and fifth grade writing. Three research questions
were addressed:
272 / ZHENG, WARSCHAUER AND FARKAS
1. What is the effect of one-to-one laptop programs on student writing
outcomes?
2. How does the effect vary among students in different demographic groups?
3. What is the effect of one-to-one laptop programs on student writing
processes?
Sample and Context
This study was part of a broader national study of the use of netbooks and open
source software in K-12 schools. Two districts, in California and Colorado
respectively, were chosen for this analysis because in each district the focus of
technology implementation was on improving writing. The Colorado school
district also used netbooks in secondary schools; however, in this article we only
analyzed data for the elementary grades, both for consistency across the two
districts, and because elementary students had netbook access throughout the
day, while secondary students’ access was limited to 50 minutes per day.
Thus, fourth grade students in the California school district and fifth grade
students in the Colorado school district were selected for the purpose of this study,
as these were the upper elementary grade levels that implemented the program
in these two districts.
A federal grant for Enhancing Education Through Technology (EETT) was
used to introduce the laptop program in the California school district in
January 2008. This program, Student Writing Achievement Through Technology
Enhanced Collaboration (SWATTEC), focuses on writing as a mechanism to
improve academic achievement. The program emphasizes the six traits writing
approach that focuses on students’ ideas, organization, voice, word choice,
sentence fluency, and conventions (Spandel, 2009). Low-cost Asus netbooks were
provided for all fourth grade students during school time, and the district has
developed a customized installation of the Linux Ubuntu operating system, with
a total of 59 free software applications to support students’ creativity and learning.
Two district-wide online learning communities, created by using the open source
social networking engine ELGG, were implemented, one for teachers and one
for students. The resulting online communities provide a platform for sharing and
contributing blog postings, comments, files, podcasts, slide presentations, and
other media. In the first 18 months of the program, an AWE program, MY Access!
(Vantage Learning, 2011), was also provided for all students in the program.
Professional development was provided to teachers as part of the SWATTEC
program. This included about 40 hours per year for all teachers in the program,
with one teacher at each school selected to serve as a coach/mentor for the
other teachers, and provided an additional 40 hours of training per year.
We analyzed test score data in the district every school year from 2007-2008
to 2009-2010. During this period, netbooks were available to fourth grade
students for about half of the 2008-2009 school year and all of the 2009-2010
school year. Consequently we analyzed achievement data for:
DIGITAL WRITING AND DIVERSITY / 273

1. 1,328 fourth grade students with scores for spring of third and fourth
grade prior to the laptop program (2007-2008);
2. 1,228 fourth grade students with scores for spring of third and fourth
grade during the partial program year (2008-2009); and
3. 1,158 fourth grade students with scores for spring of third and fourth grade
during the full program year (2009-2010), for a total of 3,714 students.
The Colorado school district used Lucy Calkins’s (1994) Writer’s Workshop
model to implement a district-wide writing curriculum. This model focuses on
writing for an authentic purpose and audience. To support this curriculum, a
laptop initiative, called Inspired Writing, was implemented among all fifth grade
classes, sixth grade reading classes, and ninth grade language arts classes in
the 2009-2010 school year. Each student involved was provided with an Asus
Eee netbook for use throughout the school day, using the open source Linux
operating system and, for the most part, open source software. Netbooks and
social media such as blogs and wikis were substantively used in these schools
to support their authentic writing. Teachers involved in this laptop program
participated in a week-long training on the hardware, software, and especially
technology integration into the curriculum.
The test score achievement of 1,000 fifth grade students participating in
this program was statistically examined in this study. Additionally, two schools
in each district were selected for observations and interviews.
Sources of Data
Test Score Data
Statewide California Standard Test (CST) English Language Arts (ELA) scores
for all third and fourth graders were collected in the California district for
2007-2008, 2008-2009, and 2009-2010 school years. In the Colorado district,
we collected statewide Colorado Student Assessment Program (CSAP) writing
scores for third, fourth, and fifth grade students in 2007-2008, 2008-2009, and
2009-2010 school years.
Teacher and Student Surveys
Teachers and students in both school districts completed online surveys. These
queried basic demographic information, self-perceived computer skills, frequency
of student laptop use for particular tasks and activities (including specific use
of different technologies), how students’ study habits or attitudes changed since
receiving laptops, how teaching with laptops compared with previous teaching
without them, and overall evaluation of the laptop program. A total of 1,589
students, including 914 students in the California school district (a response rate
of 78.9%) and 675 students in the Colorado school district (a response rate of
67.5%), responded to the survey. In addition, 40 teachers in the California district
274 / ZHENG, WARSCHAUER AND FARKAS

and 33 teachers in the Colorado district (a response rate of 100% in each district),
responded to the teacher survey.
Observations
Observations were conducted in two focal schools in each district, chosen to
be demographically representative of the district, for a total of 50 hours. Obser-
vations focused on methods of writing instruction, use of digital media in
writing, and teacher and student experiences with the technology used.
Interviews
Semi-structured group and individual interviews were conducted with a total
of 60 teachers, staff, students, and district officials in the two school districts.
Individual and group interviews were carried out with the teachers and staff at
the four focal schools and with other teachers and staff who attended district-wide
training sessions. Group interviews with students took place at the four focal
schools, with participants selected by teachers to represent diverse student experi-
ences in demographic background, academic achievement, and attitudes toward
technology. Interviews focused on how teachers and students used the tools
involved and their perceptions of the contribution of technology to the learning
process. Interviews ranged from 15 to 45 minutes and were all digitally recorded
and transcribed.
Documents
Documents collected in this study included teacher-created lesson plans,
rubrics, online materials, and blog posts written by students.
Measurement
Writing Achievement
In the California school district, there is no test involving response to a writing
prompt given to students in all elementary grades every year. A writing prompt
test was given to fourth grade students only up until the 2009-2010 school year
and then discontinued. Though we could use this test to examine changes in
fourth grade writing achievement from the non-laptop year of the study to the
partial-laptop year of the study, we could not use this test to examine writing
changes from third to fourth grade during the full course of program imple-
mentation. As a proxy, we used the California Standards Test English Language
Arts (CST ELA) exam, which is given to all students from second grade on in
California every spring and includes a variety of questions related to reading,
writing, and language. CST ELA scores were collected for third and fourth
grade students in all years from 2007 to 2010.
DIGITAL WRITING AND DIVERSITY / 275
In the Colorado school district, the CSAP writing test scale score was used
for this study. CSAP is Colorado’s state standards-based assessment. The writing
test asks students to write essays on the basis of a given writing prompt. For
example, the fifth grade writing prompt in 2008 was the following: “Growing
up involves taking on added responsibilities. Write a paragraph to tell about
one responsibility that you have in your life.” According to the CSAP Technical
Report (Colorado Department of Education, 2010), Cronbach’s alpha of the
state level writing assessment is 0.91, indicating that the CSAP writing test
produces relatively stable scores.
The definitions of student characteristic variables used in this study draw
directly from the language provided by the Colorado Department of Education
(2011), as follows:
English Language Learner (ELL): ELL is defined as students who have a
language background other than English and are currently being served or moni-
tored by either a Bilingual or an English as Second Language (ESL) Program.
In this study, ELL is a dummy variable, in which “1” refers to ELL, and “0”
refers to non-ELL (i.e., English proficient student).
Ethnicity: Dummy variables are used to represent each ethnicity in this study.
Since the majority ethnicities in both districts are Whites and Hispanics,
two dummy variables (“Hispanics” and “Others”) were generated with the base
category being “Whites.”
Free or reduced price lunch recipients: This variable identifies students who
meet the eligibility criteria for free or reduced lunch pursuant to the provisions of
the Federal National School Lunch Act. In this study, free lunch is a dummy
variable, in which “1” refers to students who receive free/reduced lunch, and
“0” refers to non-free/reduced lunch recipients.
Gifted: Gifted is defined as students who are endowed with a high degree of
potential in mental ability, academics, creativity, or talents (visual, performing,
musical arts, or leadership). Gifted is a dummy variable in this study in which
“1” refers to students who are identified as gifted students and “0” refers to
students who are not identified as gifted students.
Individualized Education Program (IEP): IEP identifies students with dis-
abilities receiving an Individualized Education Program, including classroom
instruction, instruction in physical education, home instruction, and instruction in
hospitals and institutions. IEP is indicated by a dummy variable in this study
in which “1” refers to students who receive an IEP program, and “0” refers to
students who do not receive an IEP program.
Data Analysis
Quantitative data analysis was used to answer the first question about the
effect of the one-to-one laptop program on student writing outcomes as well as the
276 / ZHENG, WARSCHAUER AND FARKAS
second question regarding the variation of this effect across demographic sub-
groups. Separate analyses were conducted for each of the two districts, due to
the different implementation approaches carried out in the two districts, and the
corresponding data that was provided to us.
For the California school district, a gain score analysis compared the third
to fourth grade ELA gains of students who experienced one of three instruc-
tional conditions:
• 2007 (third grade) to 2008 (fourth grade) [no laptop program]
• 2008 (third grade) to 2009 (fourth grade) [partial laptop program]
• 2009 (third grade) to 2010 (fourth grade) [full laptop program]
The regression equation, which included school fixed effects, is:
Gaini = �0 + �1Year2009i + �2Year2010i + �3 Xi +
�4Xi*Year2009i + �5Xi*Year2010i + � (1)
In this regression, the dependent variable was student ELA achievement gains
from third to fourth grade. The dummy variable “Year2009” represented whether
student i was in the partial laptop program or not, and the dummy variable
“Year2010” was used to represent whether student i was in the full laptop program
or not. “X” represents all other control variables, including ethnicity, ELL status,
free lunch status, Gifted, IEP, and parent education. The interaction between
“Year2009” and “X” describes whether the effect of the partial laptop program
varies among different demographic groups, and the interaction between
“Year2010” and “X” represents whether the effect of the full laptop program
varies among different demographic groups.
Whereas in California, the laptop program was implemented within existing
programs, and over a 2-year period (with partial implementation the first year
and full implementation the second year), in Colorado, the implementation model
was different. The Writer’s Workshop model was implemented district-wide in
1 year, and the laptop program was implemented simultaneously but only in one
elementary grade level. To distinguish the separate effects of the writing reform
and the use of laptops, a difference-in-differences analysis was applied. Since
teachers in both fourth and fifth grade in the 2009-2010 school year participated
in the writing reform and professional development, the inclusion of fourth grade
students in this difference-in-differences analysis allowed us to control for the
effect of writing reform and the year effect. Specifically, we compared A and B:
A) Fourth to fifth grade writing growth from spring 2008 to spring 2009 (both
years without the writing reform or the laptop program for fifth graders)
as compared to fourth to fifth grade writing growth from spring 2009 to
spring 2010 (with the spring 2010 scores reflecting participation in the
writing reform with laptops).
DIGITAL WRITING AND DIVERSITY / 277
B) Third to fourth grade writing growth from spring 2008 to spring 2009
(both years without the writing reform or laptop program for fourth
graders) as compared to third to fourth grade writing growth from spring
2009 to spring 2010 (with the spring 2010 scores reflecting participation
in the writing reform but without laptops).
The regression equation is as follows:
Writing posti =b0 + �1Writing prei + �2Year2010i + �3Grade5i +
�4Year2010i*Grade5i + �5Xi + � (2)
In this regression, the dependent variable was student writing post-test achieve-
ment. Student writing pre-test was controlled. “Year2010” was a dummy variable
for the treatment year (Year2010 = 1 when it was 2009 to 2010), and “Grade5”
was a dummy variable for the treatment group (Grade5 = 1 when it was for
fourth to fifth grade growth). The interaction between “Year2010” and “Grade5”
identified the specific year and grade in which the program was implemented.
Thus, the coefficient on this interaction term estimated the program effect of how
much the average achievement for this year and grade was above that expected in
the absence of a treatment effect.
The third research question was addressed by using both quantitative and
qualitative data analysis. Both teacher and student survey responses were analyzed
using descriptive statistics. Field notes and interviews were coded using a
bottom-up approach (Bogdan & Biklen, 1982) to best capture the experiences of
teachers and students in using the netbooks for writing, literacy, and learning.
Student blog posts were also coded using a similar bottom-up approach to identify
common themes in students’ opinions about laptop use. Other documents such
as teacher lesson plans and rubrics were reviewed for triangulation purposes.
FINDINGS
The Effect of the One-to-One Laptop Program
on Writing Achievement Gains
Findings in the California School District
First we examined the effect of the one-to-one laptop program in the California
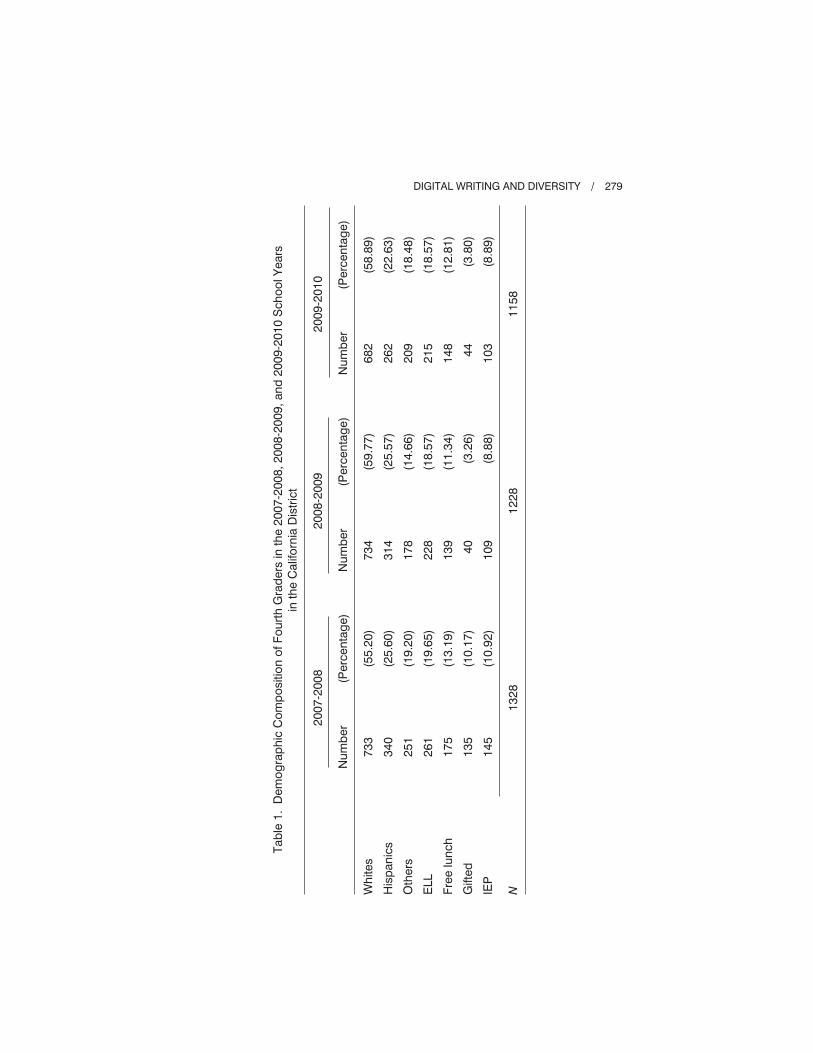
school district. The demographic composition of fourth grade students was
shown in Table 1. In the 2007-2008 school year, 55% of the students were Whites,
26% were Hispanics, and 19% were Asians, Blacks, and others. The district had
20% ELLs and 13% on free or reduced lunch. Both the 2008-2009 and the
2009-2010 school years had similar demographic compositions.
278 / ZHENG, WARSCHAUER AND FARKAS
Tab
le1
.D
em
og
rap
hic
Co
mp
ositio
no
fF
ou
rth
Gra
ders
inth
e2
00
7-2
00
8,2
00
8-2
00
9,an
d2
00
9-2
01
0S
ch
oo
lY
ears
inth
eC
alif
orn
iaD
istr
ict
20
07
-20
08
20
08
-20
09
20
09
-20
10
Nu
mb
er
(Perc
en
tag
e)
Nu
mb
er
(Perc
en
tag
e)
Nu
mb
er
(Perc
en
tag
e)
Wh
ites
His
pan
ics
Oth
ers
ELL
Fre
elu
nch
Gift
ed
IEP
73
3
34
0
25
1
26
1
17
5
13
5
14
5
(55
.20
)
(25
.60
)
(19
.20
)
(19
.65
)
(13
.19
)
(10
.17
)
(10
.92
)
73
4
31
4
17
8
22
8
13
9
40
10
9
(59
.77
)
(25
.57
)
(14
.66
)
(18
.57
)
(11
.34
)
(3.2
6)
(8.8
8)
68
2
26
2
20
9
21
5
14
8
44
10
3
(58
.89
)
(22
.63
)
(18
.48
)
(18
.57
)
(12
.81
)
(3.8
0)
(8.8
9)
N1
32
81
22
81
15
8
DIGITAL WRITING AND DIVERSITY / 279
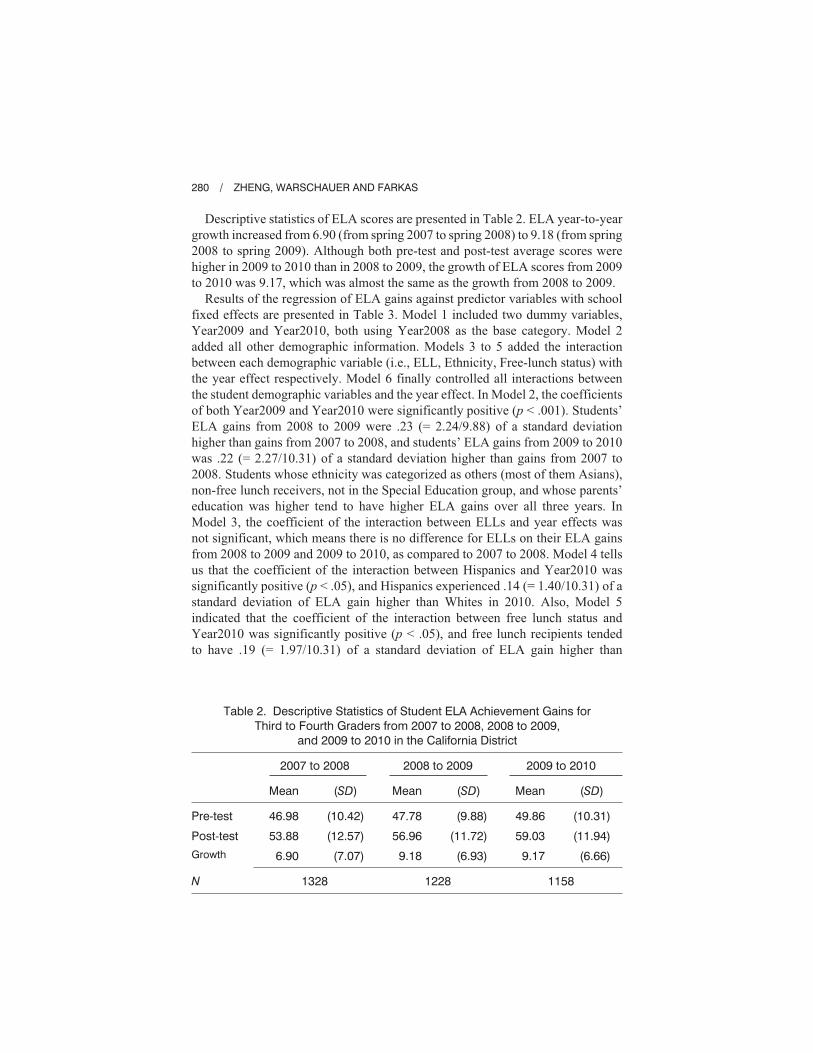
Descriptive statistics of ELA scores are presented in Table 2. ELA year-to-year
growth increased from 6.90 (from spring 2007 to spring 2008) to 9.18 (from spring
2008 to spring 2009). Although both pre-test and post-test average scores were
higher in 2009 to 2010 than in 2008 to 2009, the growth of ELA scores from 2009
to 2010 was 9.17, which was almost the same as the growth from 2008 to 2009.
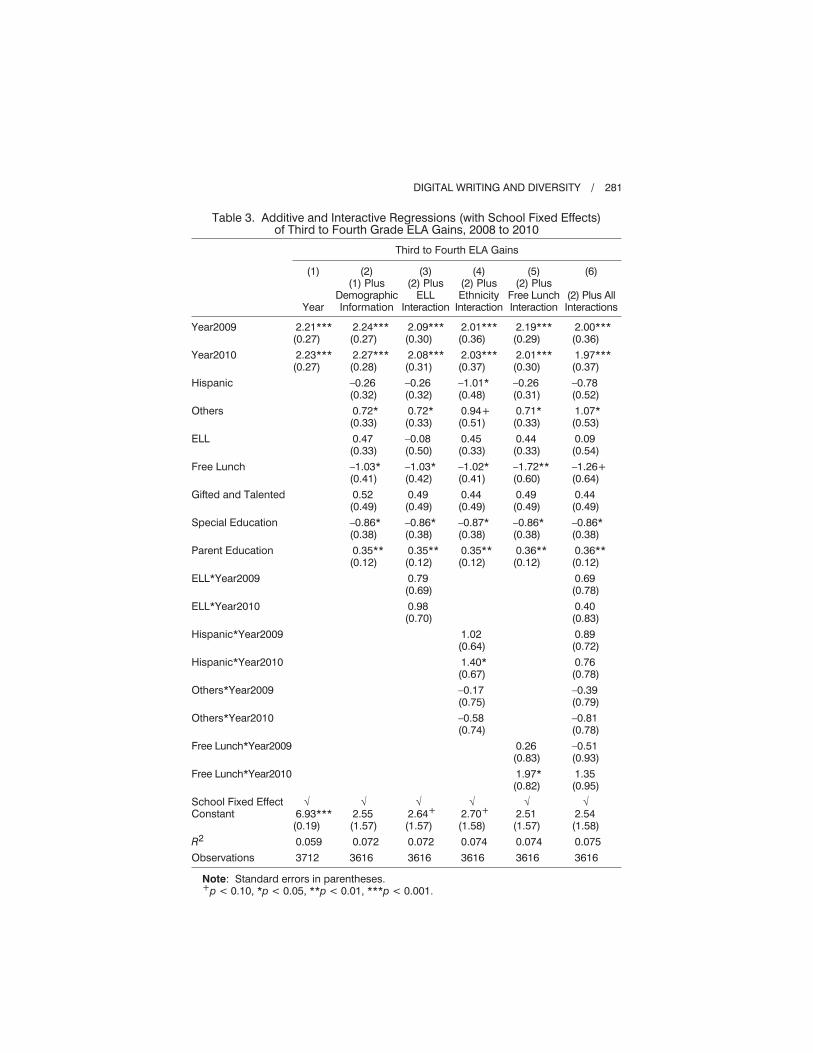
Results of the regression of ELA gains against predictor variables with school
fixed effects are presented in Table 3. Model 1 included two dummy variables,
Year2009 and Year2010, both using Year2008 as the base category. Model 2
added all other demographic information. Models 3 to 5 added the interaction
between each demographic variable (i.e., ELL, Ethnicity, Free-lunch status) with
the year effect respectively. Model 6 finally controlled all interactions between
the student demographic variables and the year effect. In Model 2, the coefficients
of both Year2009 and Year2010 were significantly positive (p < .001). Students’
ELA gains from 2008 to 2009 were .23 (= 2.24/9.88) of a standard deviation
higher than gains from 2007 to 2008, and students’ ELA gains from 2009 to 2010
was .22 (= 2.27/10.31) of a standard deviation higher than gains from 2007 to
2008. Students whose ethnicity was categorized as others (most of them Asians),
non-free lunch receivers, not in the Special Education group, and whose parents’
education was higher tend to have higher ELA gains over all three years. In
Model 3, the coefficient of the interaction between ELLs and year effects was
not significant, which means there is no difference for ELLs on their ELA gains
from 2008 to 2009 and 2009 to 2010, as compared to 2007 to 2008. Model 4 tells
us that the coefficient of the interaction between Hispanics and Year2010 was
significantly positive (p < .05), and Hispanics experienced .14 (= 1.40/10.31) of a
standard deviation of ELA gain higher than Whites in 2010. Also, Model 5
indicated that the coefficient of the interaction between free lunch status and
Year2010 was significantly positive (p < .05), and free lunch recipients tended
to have .19 (= 1.97/10.31) of a standard deviation of ELA gain higher than
280 / ZHENG, WARSCHAUER AND FARKAS
Table 2. Descriptive Statistics of Student ELA Achievement Gains for
Third to Fourth Graders from 2007 to 2008, 2008 to 2009,
and 2009 to 2010 in the California District
2007 to 2008 2008 to 2009 2009 to 2010
Mean (SD) Mean (SD) Mean (SD)
Pre-test
Post-test
Growth
46.98
53.88
6.90
(10.42)
(12.57)
(7.07)
47.78
56.96
9.18
(9.88)
(11.72)
(6.93)
49.86
59.03
9.17
(10.31)
(11.94)
(6.66)
N 1328 1228 1158
DIGITAL WRITING AND DIVERSITY / 281
Table 3. Additive and Interactive Regressions (with School Fixed Effects)of Third to Fourth Grade ELA Gains, 2008 to 2010
Third to Fourth ELA Gains
(1)
Year
(2)(1) Plus
DemographicInformation
(3)(2) Plus
ELLInteraction
(4)(2) PlusEthnicity
Interaction
(5)(2) Plus
Free LunchInteraction
(6)
(2) Plus AllInteractions
Year2009
Year2010
Hispanic
Others
ELL
Free Lunch
Gifted and Talented
Special Education
Parent Education
ELL*Year2009
ELL*Year2010
Hispanic*Year2009
Hispanic*Year2010
Others*Year2009
Others*Year2010
Free Lunch*Year2009
Free Lunch*Year2010
School Fixed EffectConstant
R2
Observations
2.21***(0.27)
2.23***(0.27)
�6.93***(0.19)
0.059
3712
2.24***(0.27)
2.27***(0.28)
–0.26(0.32)
0.72*(0.33)
0.47(0.33)
–1.03*(0.41)
0.52(0.49)
–0.86*(0.38)
0.35**(0.12)
�2.55(1.57)
0.072
3616
2.09***(0.30)
2.08***(0.31)
–0.26(0.32)
0.72*(0.33)
–0.08(0.50)
–1.03*(0.42)
0.49(0.49)
–0.86*(0.38)
0.35**(0.12)
0.79(0.69)
0.98(0.70)
�2.64+
(1.57)
0.072
3616
2.01***(0.36)
2.03***(0.37)
–1.01*(0.48)
0.94+(0.51)
0.45(0.33)
–1.02*(0.41)
0.44(0.49)
–0.87*(0.38)
0.35**(0.12)
1.02(0.64)
1.40*(0.67)
–0.17(0.75)
–0.58(0.74)
�2.70+
(1.58)
0.074
3616
2.19***(0.29)
2.01***(0.30)
–0.26(0.31)
0.71*(0.33)
0.44(0.33)
–1.72**(0.60)
0.49(0.49)
–0.86*(0.38)
0.36**(0.12)
0.26(0.83)
1.97*(0.82)
�2.51(1.57)
0.074
3616
2.00***(0.36)
1.97***(0.37)
–0.78(0.52)
1.07*(0.53)
0.09(0.54)
–1.26+(0.64)
0.44(0.49)
–0.86*(0.38)
0.36**(0.12)
0.69(0.78)
0.40(0.83)
0.89(0.72)
0.76(0.78)
–0.39(0.79)
–0.81(0.78)
–0.51(0.93)
1.35(0.95)
�2.54(1.58)
0.075
3616
Note: Standard errors in parentheses.+p < 0.10, *p < 0.05, **p < 0.01, ***p < 0.001.
non-free lunch recipients in 2010. Thus, all students experienced higher ELA
gains during both the partial laptop program and the full laptop program. In
addition, while different demographic groups experienced similar ELA gains
in the partial laptop program year with the gains in the no laptop program year,
Hispanics and free-lunch recipients experienced higher ELA gains in the full
laptop program year than in the no laptop program year.
Findings in the Colorado School District
In the Colorado school district we examined the effect of the laptop program on
fifth grade students. Here, the research design involved comparing writing growth
for fourth to fifth graders tested from spring 2008 to spring 2009 when the laptop
program was not implemented, to the growth experienced by fourth to fifth
graders from spring 2009 to spring 2010, during the time period when the laptop
program was received by all fifth grade students. Since this comparison could be
biased by year-specific effects, we also compared spring to spring writing growth
from third to fourth graders from 2008 to 2009, to the growth experienced by
third to fourth graders from 2009 to 2010. During these years the laptop program
was not in operation for these grade levels.
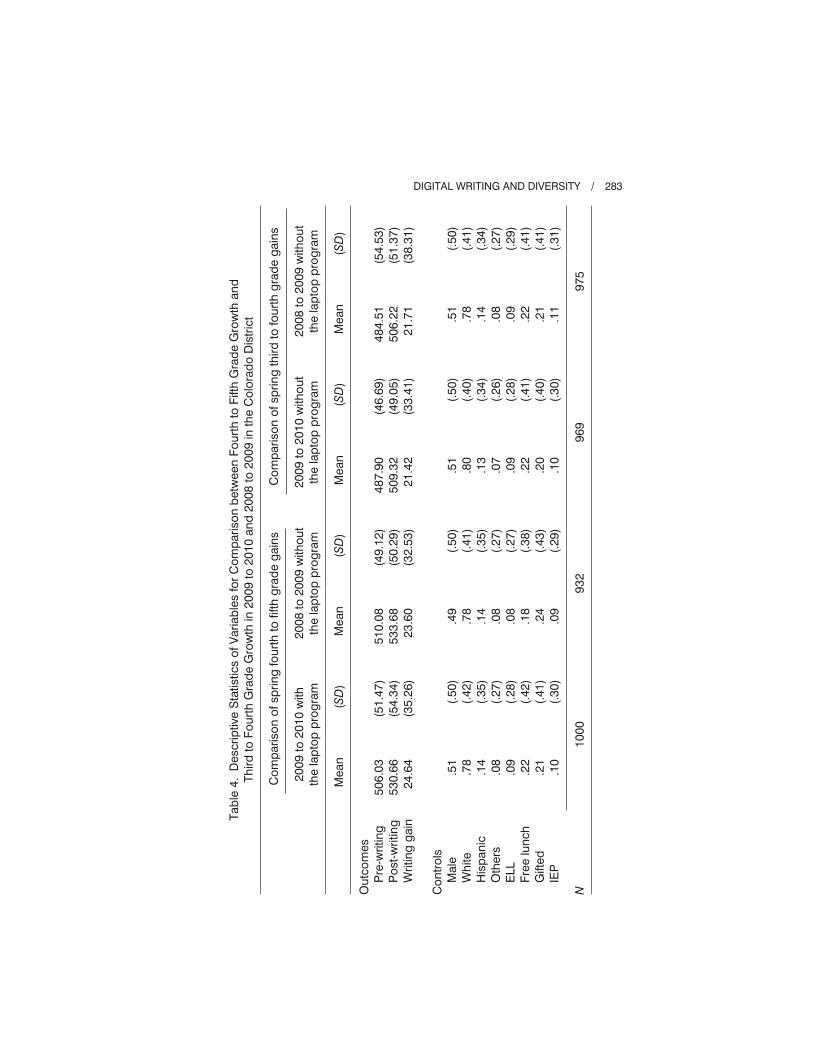
The demographic composition of all four student groups was shown in Table 4.
For fifth graders in the 2009-2010 school year, 78% of the students were Whites,
14% were Hispanics, and 8% were Asians, Blacks, and others. The district had 9%
ELLs and 22% free or reduced lunch receivers. All the other three groups had
similar demographic composition as fifth graders in the 2009-2010 school year.
Descriptive statistics of student writing scores in all four groups were also
presented in Table 4. The growth of fourth to fifth graders from 2009 to 2010 with
the laptop program implemented during the 2009-2010 school year was 24.64;
growth for 2008 to 2009 without the laptop program was 23.60. The difference
between these was 1.04 which was not statistically significant, according to a
t-test analysis. In an attempt to adjust for year-specific effects we also compared
growth from spring of third to spring of fourth grade from 2008 to 2009 with
such growth from 2009 to 2010, both years when the laptop program was not
implemented in fourth grade. The first growth was 21.71; the second was 21.42.
The difference between these was –.29 which was not statistically significant.
However, the difference between these two differences was 1.33 which was
statistically significant (p < .001). This suggested that the difference between the
growth of fourth to fifth graders from 2009 to 2010 (with the laptop program),
and the growth of fourth to fifth graders from 2008 to 2009, was significantly
higher than the difference between the growth of third to fourth graders from
2009 to 2010, and the growth of third to fourth graders from 2008 to 2009.
In order to investigate the effect of the laptop program on student writing
post-test scores when controlling for all other individual characteristics, a multiple
regression using residualized change model (which controls the lagged dependent
282 / ZHENG, WARSCHAUER AND FARKAS
Tab
le4
.D
escri
ptive
Sta
tistics
ofV
ari
ab
les
for
Co
mp
ari
so
nb
etw
een
Fo
urt
hto
Fift
hG
rad
eG
row
than
d
Th
ird
toF
ou
rth
Gra
de
Gro
wth
in2
00
9to
20
10
an
d2
00
8to
20
09
inth
eC
olo
rad
oD
istr
ict
Co
mp
ari
so
no
fsp
rin
gfo
urt
hto
fifth
gra
de
gain
sC
om
pari
so
no
fsp
rin
gth
ird
tofo
urt
hg
rad
eg
ain
s
20
09
to2
01
0w
ith
the
lap
top
pro
gra
m
20
08
to2
00
9w
ith
ou
t
the
lap
top
pro
gra
m
20
09
to2
01
0w
ith
ou
t
the
lap
top
pro
gra
m
20
08
to2
00
9w
ith
ou
t
the
lap
top
pro
gra
m
Mean
(SD
)M
ean
(SD
)M
ean
(SD
)M
ean
(SD
)
Ou
tco
mes
Pre
-wri
tin
g
Po
st-
wri
tin
g
Wri
tin
gg
ain
Co
ntr
ols
Male
Wh
ite
His
pan
ic
Oth
ers
ELL
Fre
elu
nch
Gift
ed
IEP
50
6.0
3
53
0.6
6
24
.64
.51
.78
.14
.08
.09
.22
.21
.10
(51.4
7)
(54.3
4)
(35.2
6)
(.5
0)
(.4
2)
(.3
5)
(.2
7)
(.2
8)
(.4
2)
(.4
1)
(.3
0)
51
0.0
8
53
3.6
8
23
.60
.49
.78
.14
.08
.08
.18
.24
.09
(49.1
2)
(50.2
9)
(32.5
3)
(.5
0)
(.4
1)
(.3
5)
(.2
7)
(.2
7)
(.3
8)
(.4
3)
(.2
9)
48
7.9
0
50
9.3
2
21
.42
.51
.80
.13
.07
.09
.22
.20
.10
(46.6
9)
(49.0
5)
(33.4
1)
(.5
0)
(.4
0)
(.3
4)
(.2
6)
(.2
8)
(.4
1)
(.4
0)
(.3
0)
48
4.5
1
50
6.2
2
21
.71
.51
.78
.14
.08
.09
.22
.21
.11
(54.5
3)
(51.3
7)
(38.3
1)
(.5
0)
(.4
1)
(.3
4)
(.2
7)
(.2
9)
(.4
1)
(.4
1)
(.3
1)
N1
00
09
32
96
99
75
DIGITAL WRITING AND DIVERSITY / 283
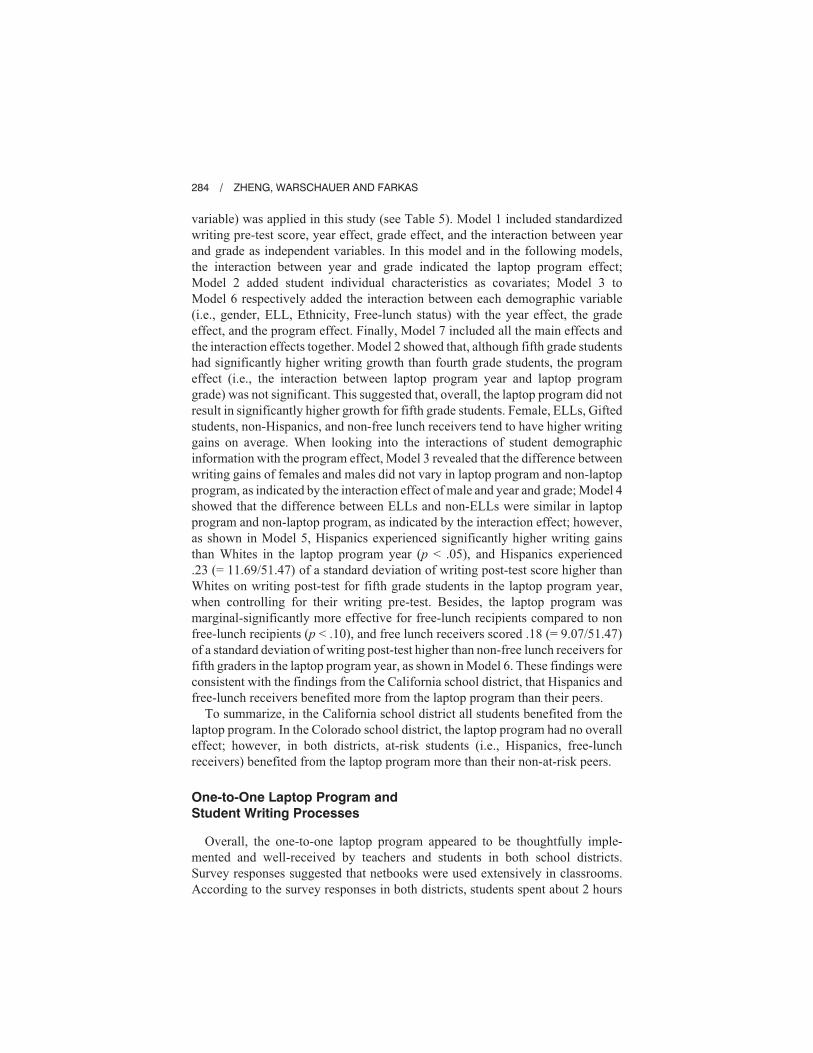
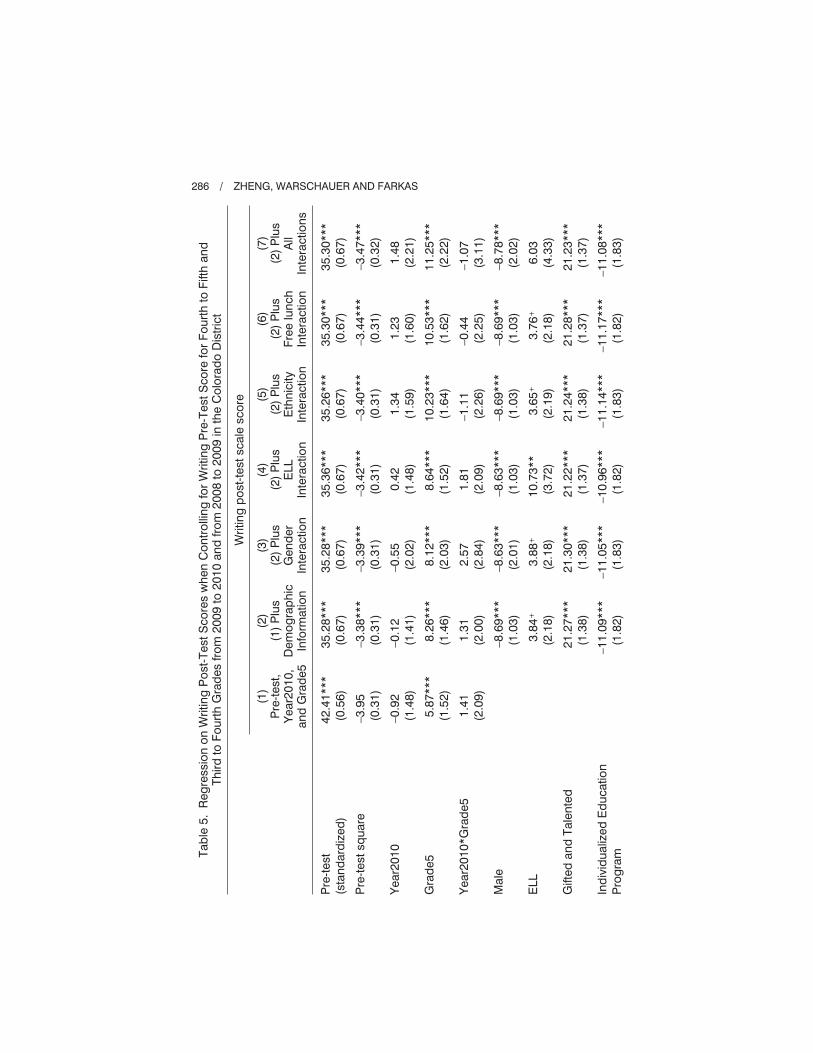
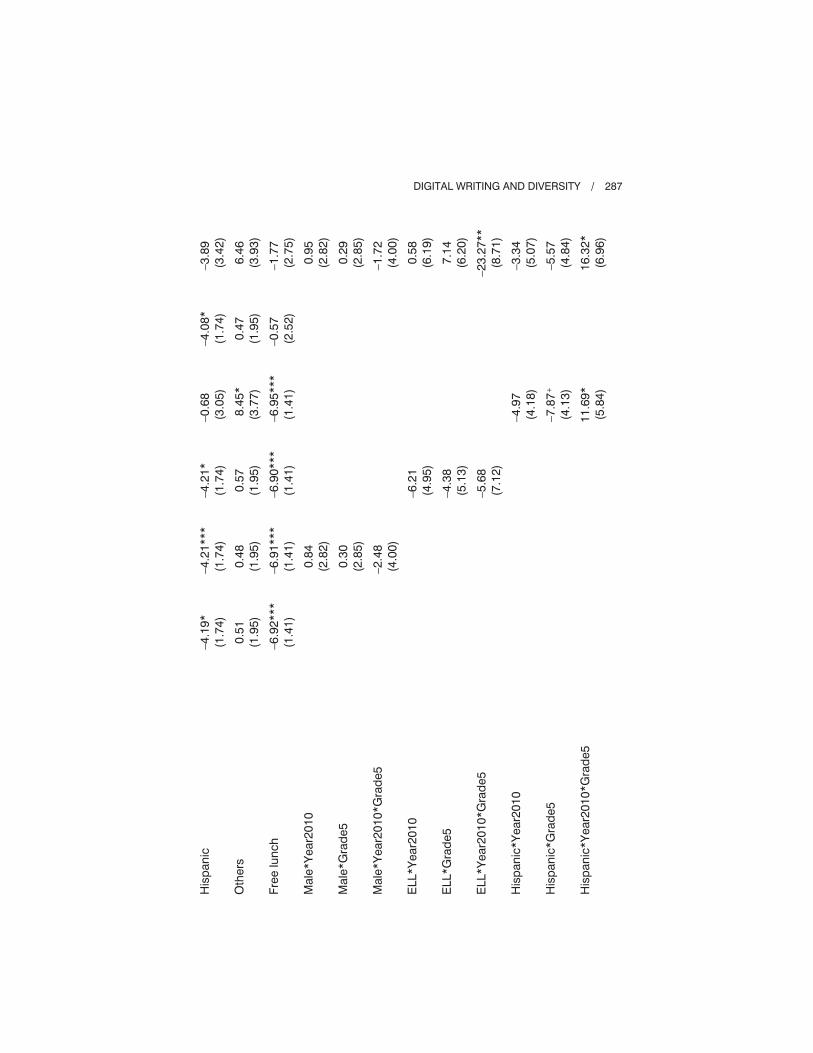
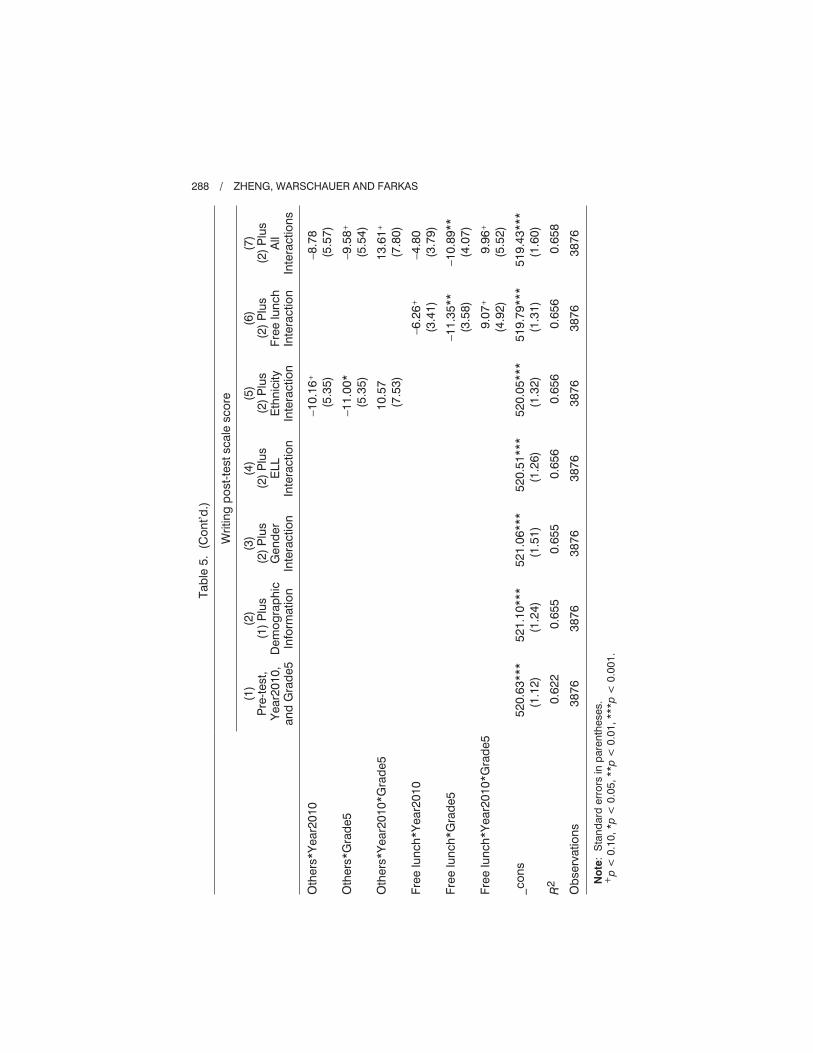
variable) was applied in this study (see Table 5). Model 1 included standardized
writing pre-test score, year effect, grade effect, and the interaction between year
and grade as independent variables. In this model and in the following models,
the interaction between year and grade indicated the laptop program effect;
Model 2 added student individual characteristics as covariates; Model 3 to
Model 6 respectively added the interaction between each demographic variable
(i.e., gender, ELL, Ethnicity, Free-lunch status) with the year effect, the grade
effect, and the program effect. Finally, Model 7 included all the main effects and
the interaction effects together. Model 2 showed that, although fifth grade students
had significantly higher writing growth than fourth grade students, the program
effect (i.e., the interaction between laptop program year and laptop program
grade) was not significant. This suggested that, overall, the laptop program did not
result in significantly higher growth for fifth grade students. Female, ELLs, Gifted
students, non-Hispanics, and non-free lunch receivers tend to have higher writing
gains on average. When looking into the interactions of student demographic
information with the program effect, Model 3 revealed that the difference between
writing gains of females and males did not vary in laptop program and non-laptop
program, as indicated by the interaction effect of male and year and grade; Model 4
showed that the difference between ELLs and non-ELLs were similar in laptop
program and non-laptop program, as indicated by the interaction effect; however,
as shown in Model 5, Hispanics experienced significantly higher writing gains
than Whites in the laptop program year (p < .05), and Hispanics experienced
.23 (= 11.69/51.47) of a standard deviation of writing post-test score higher than
Whites on writing post-test for fifth grade students in the laptop program year,
when controlling for their writing pre-test. Besides, the laptop program was
marginal-significantly more effective for free-lunch recipients compared to non
free-lunch recipients (p < .10), and free lunch receivers scored .18 (= 9.07/51.47)
of a standard deviation of writing post-test higher than non-free lunch receivers for
fifth graders in the laptop program year, as shown in Model 6. These findings were
consistent with the findings from the California school district, that Hispanics and
free-lunch receivers benefited more from the laptop program than their peers.
To summarize, in the California school district all students benefited from the
laptop program. In the Colorado school district, the laptop program had no overall
effect; however, in both districts, at-risk students (i.e., Hispanics, free-lunch
receivers) benefited from the laptop program more than their non-at-risk peers.
One-to-One Laptop Program and
Student Writing Processes
Overall, the one-to-one laptop program appeared to be thoughtfully imple-
mented and well-received by teachers and students in both school districts.
Survey responses suggested that netbooks were used extensively in classrooms.
According to the survey responses in both districts, students spent about 2 hours
284 / ZHENG, WARSCHAUER AND FARKAS
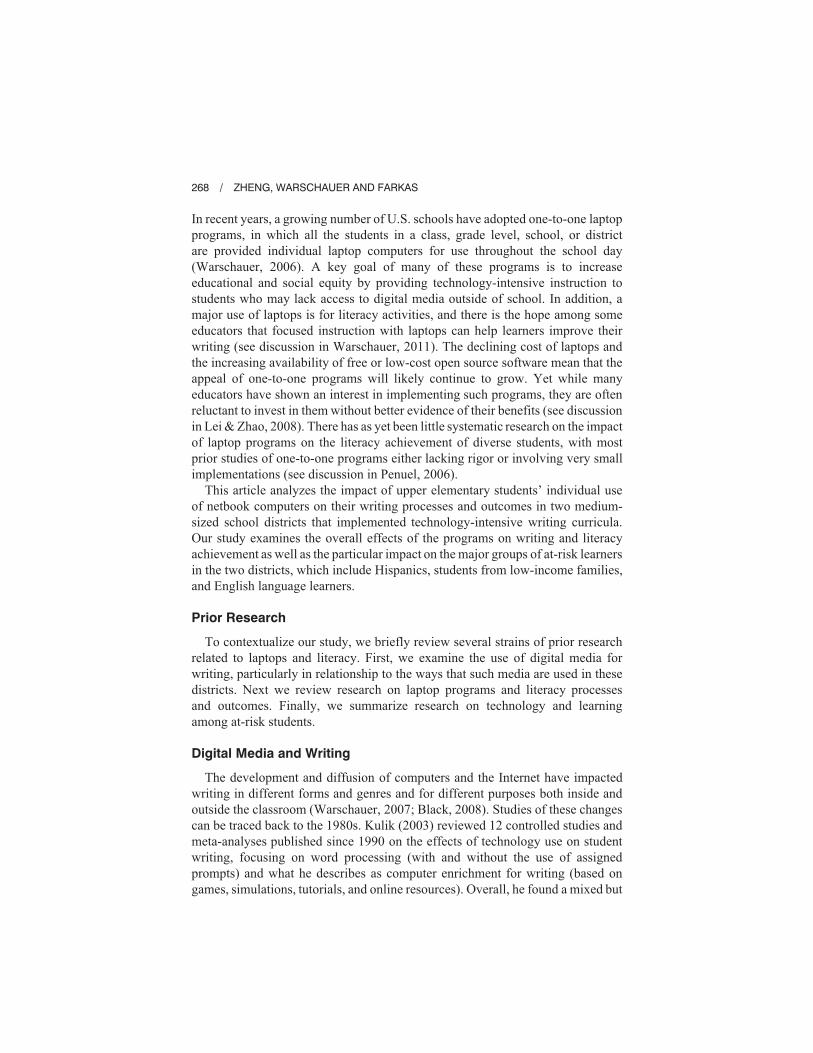
per day using their laptops. Student responses to the different usages of their
netbooks at school were shown in Figure 1. The usages of their netbooks were
measured by number of times per week. The most frequent self-reported use of
netbooks was for writing or editing papers. Following that, other frequent uses
included getting news or information online, doing drills or games for learning,
and learning basic use of the laptop or new software.
When asked about the benefits that the laptop program has brought to their
schoolwork and writing, more than 60% of all students agreed that they became
more organized, schoolwork has become more interesting for them, and the
quality of their schoolwork has improved since they received their laptops; more
than 70% of all students agreed that they wrote more, and revised or edited their
papers more when they used their laptops. Furthermore, about 64% of the students
agreed that the quality of their writing has improved since receiving their laptops.
Students believed that laptops helped them to draft, revise, and publish their
written work. They also told us how writing on laptops helped them to avoid
fatigue. As one fifth grade student, Tristan, mentioned in his blog,
I’ve actually enjoyed writing more, because personally, in the past, I
haven’t been able to write for very long without wrist starting to hurt. Having
a laptop, the pain has ended, and my writing has improved so very much
within just this year. . . . I’ve written my best essays, poems, summaries,
anything, you name it, this year.
Our interviews also suggested that the use of laptops at school helped students
increase their enthusiasm for writing. As a Colorado fifth grader, Lupita, wrote
on her blog,
I used to not like writing but now I keep looking at the time and inside I am
saying, “Is it time for writing yet?” If you don’t believe me come visit us. . . .
You have to see it to believe it because your eyes will pop out.
Additionally, students used different forms of technology for their writing
practices in the two school districts. In the California school district, students
used an AWE software, MY Access!, in their writing in the first 2 years of the
laptop program. This software provided students immediate feedback on student
writing, and not only provided a total writing score, but also subscales on focus,
development, organization, language use, and mechanics and writing conventions.
However, observations and interviews with teachers suggested that enthusiasm
for the software among teachers decreased during the year. This seemed to be
partly due to concerns about inaccuracy in scoring and subsequent negative
effects on student writing: teachers said that students would make small changes
in their writings simply to get a higher score, whether or not that contributed to
improved student writing, and that the program is not very helpful in detecting
and providing feedback on voice and creativity in student writing. The most
negative attitudes toward AWE were in low-SES classrooms, where teachers felt
DIGITAL WRITING AND DIVERSITY / 285
Tab
le5
.R
eg
ressio
no
nW
ritin
gP
ost-
Test
Sco
res
wh
en
Co
ntr
olli
ng
for
Wri
tin
gP
re-T
est
Sco
refo
rF
ou
rth
toF
ifth
an
dT
hir
dto
Fo
urt
hG
rad
es
fro
m2
00
9to
20
10
an
dfr
om
20
08
to2
00
9in
the
Co
lora
do
Dis
tric
t
Wri
tin
gp
ost-
test
scale
sco
re
(1)
Pre
-test,
Year2
01
0,
an
dG
rad
e5
(2)
(1)
Plu
sD
em
og
rap
hic
Info
rmatio
n
(3)
(2)
Plu
sG
en
der
Inte
ractio
n
(4)
(2)
Plu
sE
LL
Inte
ractio
n
(5)
(2)
Plu
sE
thn
icity
Inte
ractio
n
(6)
(2)
Plu
sF
ree
lun
ch
Inte
ractio
n
(7)
(2)
Plu
sA
llIn
tera
ctio
ns
Pre
-test
(sta
nd
ard
ized
)
Pre
-test
sq
uare
Year2
01
0
Gra
de5
Year2
01
0*G
rad
e5
Male
ELL
Gift
ed
an
dT
ale
nte
d
Ind
ivid
ualiz
ed
Ed
ucatio
n
Pro
gra
m
42
.41
***
(0.5
6)
–3
.95
(0.3
1)
–0
.92
(1.4
8)
5.8
7***
(1.5
2)
1.4
1
(2.0
9)
35
.28
***
(0.6
7)
–3
.38
***
(0.3
1)
–0
.12
(1.4
1)
8.2
6***
(1.4
6)
1.3
1
(2.0
0)
–8
.69
***
(1.0
3)
3.8
4+
(2.1
8)
21
.27
***
(1.3
8)
–1
1.0
9***
(1.8
2)
35
.28
***
(0.6
7)
–3
.39
***
(0.3
1)
–0
.55
(2.0
2)
8.1
2***
(2.0
3)
2.5
7
(2.8
4)
–8
.63
***
(2.0
1)
3.8
8+
(2.1
8)
21
.30
***
(1.3
8)
–1
1.0
5***
(1.8
3)
35
.36
***
(0.6
7)
–3
.42
***
(0.3
1)
0.4
2
(1.4
8)
8.6
4***
(1.5
2)
1.8
1
(2.0
9)
–8
.63
***
(1.0
3)
10
.73
**
(3.7
2)
21
.22
***
(1.3
7)
–1
0.9
6***
(1.8
2)
35
.26
***
(0.6
7)
–3
.40
***
(0.3
1)
1.3
4
(1.5
9)
10
.23
***
(1.6
4)
–1
.11
(2.2
6)
–8
.69
***
(1.0
3)
3.6
5+
(2.1
9)
21
.24
***
(1.3
8)
–1
1.1
4***
(1.8
3)
35
.30
***
(0.6
7)
–3
.44
***
(0.3
1)
1.2
3
(1.6
0)
10
.53
***
(1.6
2)
–0
.44
(2.2
5)
–8
.69
***
(1.0
3)
3.7
6+
(2.1
8)
21
.28
***
(1.3
7)
–1
1.1
7***
(1.8
2)
35
.30
***
(0.6
7)
–3
.47
***
(0.3
2)
1.4
8
(2.2
1)
11
.25
***
(2.2
2)
–1
.07
(3.1
1)
–8
.78
***
(2.0
2)
6.0
3
(4.3
3)
21
.23
***
(1.3
7)
–1
1.0
8***
(1.8
3)
286 / ZHENG, WARSCHAUER AND FARKAS
His
pan
ic
Oth
ers
Fre
elu
nch
Male
*Y
ear2
01
0
Male
*G
rad
e5
Male
*Y
ear2
01
0*G
rad
e5
ELL*Y
ear2
01
0
ELL*G
rad
e5
ELL*Y
ear2
01
0*G
rad
e5
His
pan
ic*Y
ear2
01
0
His
pan
ic*G
rad
e5
His
pan
ic*Y
ear2
01
0*G
rad
e5
–4
.19
*
(1.7
4)
0.5
1
(1.9
5)
–6
.92
***
(1.4
1)
–4
.21
***
(1.7
4)
0.4
8
(1.9
5)
–6
.91
***
(1.4
1)
0.8
4
(2.8
2)
0.3
0
(2.8
5)
–2
.48
(4.0
0)
–4
.21
*
(1.7
4)
0.5
7
(1.9
5)
–6
.90
***
(1.4
1)
–6
.21
(4.9
5)
–4
.38
(5.1
3)
–5
.68
(7.1
2)
–0
.68
(3.0
5)
8.4
5*
(3.7
7)
–6
.95
***
(1.4
1)
–4
.97
(4.1
8)
–7
.87
+
(4.1
3)
11
.69
*
(5.8
4)
–4
.08
*
(1.7
4)
0.4
7
(1.9
5)
–0
.57
(2.5
2)
–3
.89
(3.4
2)
6.4
6
(3.9
3)
–1
.77
(2.7
5)
0.9
5
(2.8
2)
0.2
9
(2.8
5)
–1
.72
(4.0
0)
0.5
8
(6.1
9)
7.1
4
(6.2
0)
–2
3.2
7**
(8.7
1)
–3
.34
(5.0
7)
–5
.57
(4.8
4)
16
.32
*
(6.9
6)
DIGITAL WRITING AND DIVERSITY / 287
Tab
le5
.(C
on
t’d
.)
Wri
tin
gp
ost-
test
scale
sco
re
(1)
Pre
-test,
Year2
01
0,
an
dG
rad
e5
(2)
(1)
Plu
sD
em
og
rap
hic
Info
rmatio
n
(3)
(2)
Plu
sG
en
der
Inte
ractio
n
(4)
(2)
Plu
sE
LL
Inte
ractio
n
(5)
(2)
Plu
sE
thn
icity
Inte
ractio
n
(6)
(2)
Plu
sF
ree
lun
ch
Inte
ractio
n
(7)
(2)
Plu
sA
llIn
tera
ctio
ns
Oth
ers
*Y
ear2
01
0
Oth
ers
*G
rad
e5
Oth
ers
*Y
ear2
01
0*G
rad
e5
Fre
elu
nch
*Y
ear2
01
0
Fre
elu
nch
*G
rad
e5
Fre
elu
nch
*Y
ear2
01
0*G
rad
e5
_co
ns
R2
Ob
serv
atio
ns
52
0.6
3***
(1.1
2)
0.6
22
38
76
52
1.1
0***
(1.2
4)
0.6
55
38
76
52
1.0
6***
(1.5
1)
0.6
55
38
76
52
0.5
1***
(1.2
6)
0.6
56
38
76
–1
0.1
6+
(5.3
5)
–1
1.0
0*
(5.3
5)
10
.57
(7.5
3)
52
0.0
5***
(1.3
2)
0.6
56
38
76
–6
.26
+
(3.4
1)
–1
1.3
5**
(3.5
8)
9.0
7+
(4.9
2)
51
9.7
9***
(1.3
1)
0.6
56
38
76
–8
.78
(5.5
7)
–9
.58
+
(5.5
4)
13
.61
+
(7.8
0)
–4
.80
(3.7
9)
–1
0.8
9**
(4.0
7)
9.9
6+
(5.5
2)
51
9.4
3***
(1.6
0)
0.6
58
38
76
No
te:
Sta
nd
ard
err
ors
inp
are
nth
eses.
+p
<0
.10
,*p
<0
.05
,**p
<0
.01
,***p
<0
.00
1.
288 / ZHENG, WARSCHAUER AND FARKAS

DIGITAL WRITING AND DIVERSITY / 289
Fig
ure
1.
Usag
e(n
um
ber
oftim
es/w
eek)
ofn
etb
oo
ks
at
sch
oo
lin
the
two
sch
oo
ld
istr
icts
.
that students were least able to benefit from the feedback the program provided.
However, teachers also mentioned that MY Access! lessened their burden by
helping evaluate student essays.
Students showed very positive attitudes toward the use of MY Access! for
writing, based on their survey responses. More than 50% of students responded
that they like writing with the tool, it is easy to use, they revise their writing
more, and their confidence in writing has increased when using MY Access!.
In representative comments, students reported that, when using MY Access!,
“you get a feedback in seconds,” “you can get your score right away,” “it shows
all of the problems in your writing and you keep improving with your writing,”
and “it is fun!” In summary, in the California school district, students tended
to have higher enthusiasm toward the use of MY Access! than their teachers
because of the instant scores and immediate feedback they received from the
program. Although teachers had concerns about the accuracy of MY Access!
scoring, many teachers continued using it in their classrooms to facilitate their
teaching and classroom management.
In the California school district, in addition to MY Access!, teachers also
mentioned their use of social media to motivate student writing. For example,
one teacher explained how she set up a Skype conversation with a relative
serving in Iraq to give students more of a firsthand view of the conflict there.
After that, students were asked to follow up by writing about the topic in their
blogs. It was mentioned that students tend to be more engaged and motivated
in their writing when they have an authentic audience for their writing.
In the Colorado school district, there was no district-wide use of AWE, but
students in many schools wrote with social media on a more frequent basis
than students in the California school district, according to our observations.
During our observations we witnessed students publishing their writing on blogs
and wikis, discussing readings and commenting on others’ writing through online
discussion tools, and writing collaboratively via real-time text tools. We also saw
how students interacted with people outside their classrooms or district in these
online forums. In interviews we were told that even having a single outside
interlocutor for a class could motivate better writing by letting students know
their blogs were being followed by an interested reader.
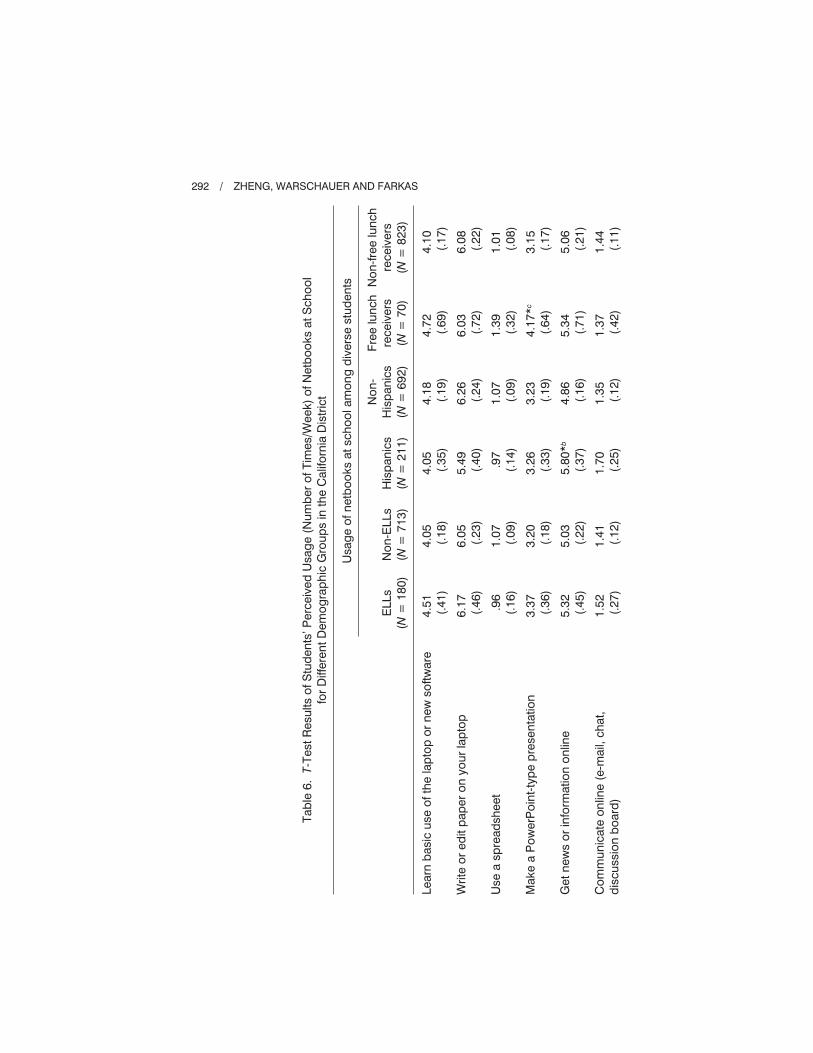
We also examined the use of laptops in writing processes among different
groups of students in the two districts, based on students’ self-reported survey
responses. T-tests were used to investigate students’ use of netbooks at school
between ELLs and non-ELLs, Hispanics and non-Hispanics, and free lunch
receivers and non-free lunch receivers, respectively in the California school
district (see Table 6) and the Colorado school district (see Table 7). The results
showed that, in the California school district, ELLs, Hispanics, and free-lunch
receivers in general used netbooks more than their non at-risk peers, although
most of the differences were not statistically significant; while in the Colorado
school district, ELLs, Hispanics, and free-lunch receivers used their netbooks
290 / ZHENG, WARSCHAUER AND FARKAS
significantly more than their peers. These at-risk learners spent more time at
school using their netbooks to write or edit their paper, use a spreadsheet, get
online information, communicate online, take tests or quizzes, write in blogs or
wikis, and comment on others’ writing on blogs or wikis. This finding suggests
that in the one-to-one laptop environment, at-risk students used their netbooks
for writing related tasks much more frequently than their peer students.
Interviews and observations showed similar findings for at-risk students.
Teachers we interviewed at several sites in the Colorado school district spoke to
the particular advantages of laptop use for language minority students, including
the effectiveness of laptops in offering multimodal input and in giving learners
opportunities to catch up in communication and language skills through
computer-mediated writing and interaction. For example, in one of the two focal
schools in Colorado, more than half the students were Hispanics and ELLs.
Students in that school made extensive use of social media throughout the
2009-2010 school year, including the regular use of an online discussion platform
to provide a written channel for discussing class readings. In a separate case
study (Zheng & Warschauer, 2011), we examined in more depth the development
of students’ participation, writing, and use of cognitive strategies during this
ongoing collaborative discussion, finding that the online writing was particularly
valuable in all these areas for at-risk learners. Our findings in this case study
suggested that, while all students increased their participation in online discussion
over time, ELLs increased at a higher rate. Students also demonstrated higher
language complexity, deeper thinking, and advanced cognitive skills as the online
discussion activity went on.
In summary, the surveys, interviews, and observations suggest that students
use the laptops for language arts activities extensively, that at-risk students use
them the most, and that teachers and students perceive many benefits for
writing and literacy development. There is widespread belief in the two districts
that use of laptops bring many benefits for writing that may not be well captured
by standardized tests, such as heightened student autonomy and engagement in
the writing process, better understanding of why and how to write for a specific
audience, and mastery of new writing tools. For example, student interviews
suggest that with individual laptops provided, they were able to learn and write
at their own pace, and they have learned to take responsibility of their own
learning. As they realized that a broader authentic audience will read their work,
they were more motivated and inspired to write in better quality.
DISCUSSION
Laptop programs are a complex intervention that introduces substantial
changes to the overall classroom environment. The potential benefits of
laptops may be difficult to assess with the tools currently available to us. Thus,
many of the benefits of writing with laptops may not be accurately measured by
DIGITAL WRITING AND DIVERSITY / 291
Tab
le6
.T-T
est
Resu
lts
ofS
tud
en
ts’P
erc
eiv
ed
Usag
e(N
um
ber
ofT
imes/W
eek)
ofN
etb
oo
ks
at
Sch
oo
l
for
Diff
ere
nt
Dem
og
rap
hic
Gro
up
sin
the
Calif
orn
iaD
istr
ict
Usag
eo
fn
etb
oo
ks
at
sch
oo
lam
on
gd
ivers
estu
den
ts
ELLs
(N=
18
0)
No
n-E
LLs
(N=
71
3)
His
pan
ics
(N=
21
1)
No
n-
His
pan
ics
(N=
69
2)
Fre
elu
nch
receiv
ers
(N=
70
)
No
n-f
ree
lun
ch
receiv
ers
(N=
82
3)
Learn
basic
use
ofth
ela
pto
po
rn
ew
so
ftw
are
Wri
teo
red
itp
ap
er
on
yo
ur
lap
top
Use
asp
read
sh
eet
Make
aP
ow
erP
oin
t-ty
pe
pre
sen
tatio
n
Get
new
so
rin
form
atio
no
nlin
e
Co
mm
un
icate
on
line
(e-m
ail,
ch
at,
dis
cu
ssio
nb
oard
)
4.5
1
(.4
1)
6.1
7
(.4
6)
.96
(.1
6)
3.3
7
(.3
6)
5.3
2
(.4
5)
1.5
2
(.2
7)
4.0
5
(.1
8)
6.0
5
(.2
3)
1.0
7
(.0
9)
3.2
0
(.1
8)
5.0
3
(.2
2)
1.4
1
(.1
2)
4.0
5
(.3
5)
5.4
9
(.4
0)
.97
(.1
4)
3.2
6
(.3
3)
5.8
0*
b
(.3
7)
1.7
0
(.2
5)
4.1
8
(.1
9)
6.2
6
(.2
4)
1.0
7
(.0
9)
3.2
3
(.1
9)
4.8
6
(.1
6)
1.3
5
(.1
2)
4.7
2
(.6
9)
6.0
3
(.7
2)
1.3
9
(.3
2)
4.1
7*
c
(.6
4)
5.3
4
(.7
1)
1.3
7
(.4
2)
4.1
0
(.1
7)
6.0
8
(.2
2)
1.0
1
(.0
8)
3.1
5
(.1
7)
5.0
6
(.2
1)
1.4
4
(.1
1)
292 / ZHENG, WARSCHAUER AND FARKAS

Use
ad
igitalte
xtb
oo
k
Do
dri
llso
rg
am
es
for
learn
ing
Take
tests
or
qu
izze
s
Po
st
my
wri
tin
gin
blo
gs
or
wik
is
Co
mm
en
to
no
thers
’w
ritin
go
nb
log
so
rw
ikis
Access
vid
eo
Ave
rag
esch
oo
lu
se
2.6
0
(.3
4)
6.0
8
(.4
4)
2.3
8
(.2
5)
1.9
5
(.3
0)
1.8
8
(.3
0)
3.2
5*
a
(.3
9)
3.3
3
(.2
0)
2.1
6
(.1
5)
5.5
7
(.2
2)
2.0
5
(.1
3)
1.9
7
(.1
4)
1.4
7
(.1
2)
2.2
7
(.1
5)
3.0
2
(.1
0)
2.4
1
(.3
0)
6.1
9
(.4
1)
2.4
8*
(.2
5)
2.2
0
(.2
9)
2.0
0*
(.2
7)
3.1
5**
(.3
5)
3.3
1
(.2
0)
2.2
0
(.1
6)
5.5
2
(.2
2)
2.0
1
(.1
2)
1.8
9
(.1
4)
1.4
2
(.1
2)
2.2
6
(.1
5)
3.0
2
(.1
0)
2.4
8
(.5
3)
6.5
0
(.7
2)
2.2
7
(.4
2)
1.7
2
(.4
3)
2.2
9
(.5
6)
3.2
0
(.6
0)
3.4
6
(.3
7)
2.2
3
(.1
4)
5.6
1
(.2
0)
2.1
1
(.1
2)
1.9
8
(.1
3)
1.4
9
(.1
1)
2.4
1
(.1
5)
3.0
6
(.0
9)
No
te:
Sta
nd
ard
err
ors
inp
are
nth
eses.
+p
<0
.10
,*p
<0
.05
,**p
<0
.01
,***p
<0
.00
1.
aS
ign
ifican
tly
diff
ere
nt
fro
mn
on
-ELLs.
bS
ign
ifican
tly
diff
ere
nt
fro
mn
on
-His
pan
ics.
cS
ign
ifican
tly
diff
ere
nt
fro
mn
on
-fre
elu
nch
receiv
ers
.
DIGITAL WRITING AND DIVERSITY / 293
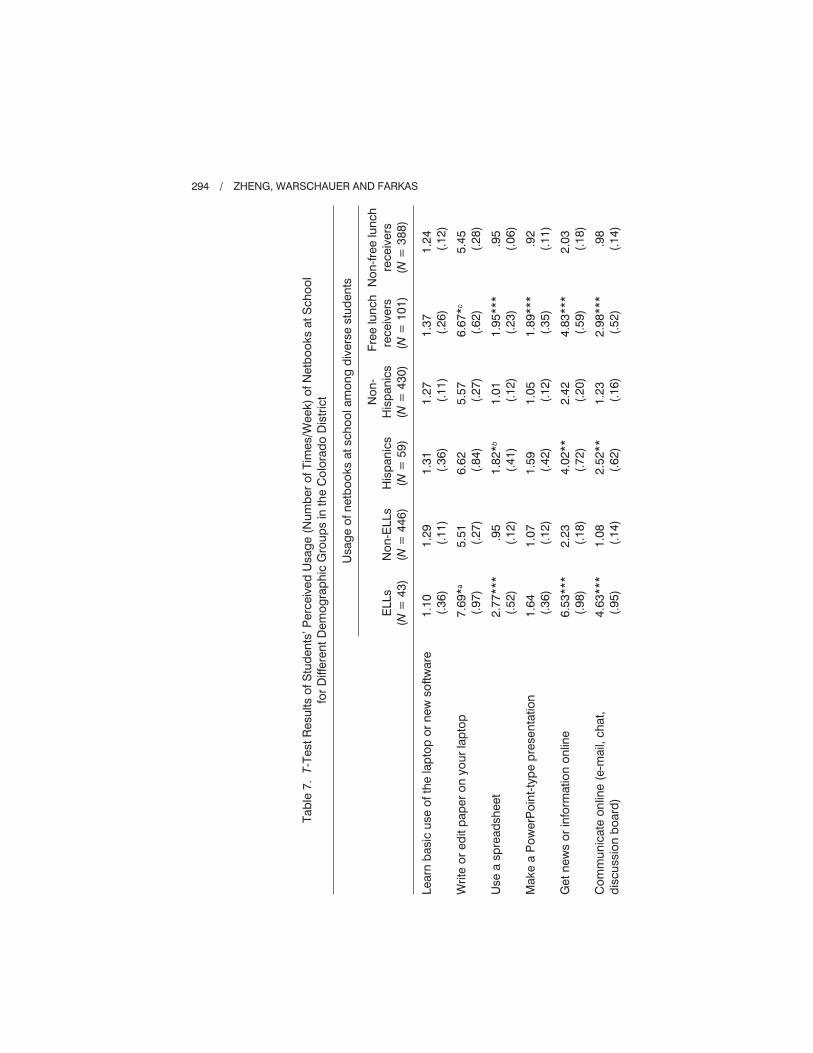
Tab
le7
.T-T
est
Resu
lts
ofS
tud
en
ts’P
erc
eiv
ed
Usag
e(N
um
ber
ofT
imes/W
eek)
ofN
etb
oo
ks
at
Sch
oo
l
for
Diff
ere
nt
Dem
og
rap
hic
Gro
up
sin
the
Co
lora
do
Dis
tric
t
Usag
eo
fn
etb
oo
ks
at
sch
oo
lam
on
gd
ivers
estu
den
ts
ELLs
(N=
43
)
No
n-E
LLs
(N=
44
6)
His
pan
ics
(N=
59
)
No
n-
His
pan
ics
(N=
43
0)
Fre
elu
nch
receiv
ers
(N=
10
1)
No
n-f
ree
lun
ch
receiv
ers
(N=
38
8)
Learn
basic
use
ofth
ela
pto
po
rn
ew
so
ftw
are
Wri
teo
red
itp
ap
er
on
yo
ur
lap
top
Use
asp
read
sh
eet
Make
aP
ow
erP
oin
t-ty
pe
pre
sen
tatio
n
Get
new
so
rin
form
atio
no
nlin
e
Co
mm
un
icate
on
line
(e-m
ail,
ch
at,
dis
cu
ssio
nb
oard
)
1.1
0
(.3
6)
7.6
9*
a
(.9
7)
2.7
7***
(.5
2)
1.6
4
(.3
6)
6.5
3***
(.9
8)
4.6
3***
(.9
5)
1.2
9
(.1
1)
5.5
1
(.2
7)
.95
(.1
2)
1.0
7
(.1
2)
2.2
3
(.1
8)
1.0
8
(.1
4)
1.3
1
(.3
6)
6.6
2
(.8
4)
1.8
2*
b
(.4
1)
1.5
9
(.4
2)
4.0
2**
(.7
2)
2.5
2**
(.6
2)
1.2
7
(.1
1)
5.5
7
(.2
7)
1.0
1
(.1
2)
1.0
5
(.1
2)
2.4
2
(.2
0)
1.2
3
(.1
6)
1.3
7
(.2
6)
6.6
7*
c
(.6
2)
1.9
5***
(.2
3)
1.8
9***
(.3
5)
4.8
3***
(.5
9)
2.9
8***
(.5
2)
1.2
4
(.1
2)
5.4
5
(.2
8)
.95
(.0
6)
.92
(.1
1)
2.0
3
(.1
8)
.98
(.1
4)
294 / ZHENG, WARSCHAUER AND FARKAS
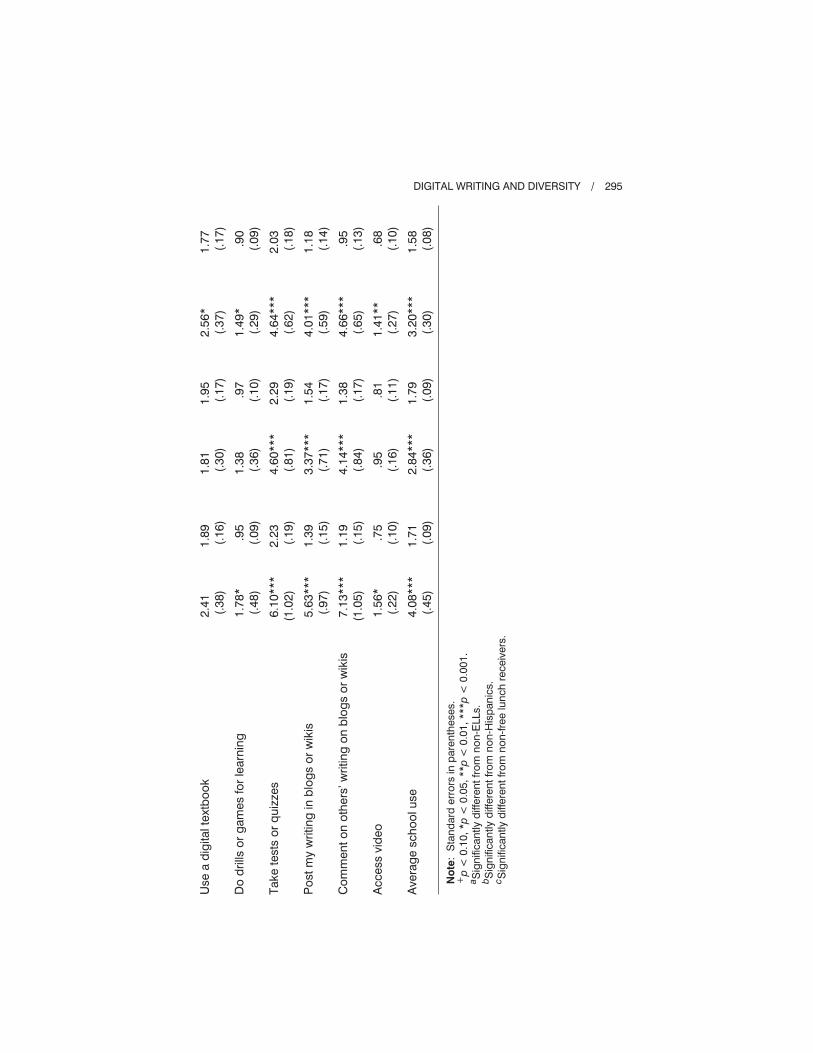
Use
ad
igitalte
xtb
oo
k
Do
dri
llso
rg
am
es
for
learn
ing
Take
tests
or
qu
izze
s
Po
st
my
wri
tin
gin
blo
gs
or
wik
is
Co
mm
en
to
no
thers
’w
ritin
go
nb
log
so
rw
ikis
Access
vid
eo
Ave
rag
esch
oo
lu
se
2.4
1
(.3
8)
1.7
8*
(.4
8)
6.1
0***
(1.0
2)
5.6
3***
(.9
7)
7.1
3***
(1.0
5)
1.5
6*
(.2
2)
4.0
8***
(.4
5)
1.8
9
(.1
6)
.95
(.0
9)
2.2
3
(.1
9)
1.3
9
(.1
5)
1.1
9
(.1
5)
.75
(.1
0)
1.7
1
(.0
9)
1.8
1
(.3
0)
1.3
8
(.3
6)
4.6
0***
(.8
1)
3.3
7***
(.7
1)
4.1
4***
(.8
4)
.95
(.1
6)
2.8
4***
(.3
6)
1.9
5
(.1
7)
.97
(.1
0)
2.2
9
(.1
9)
1.5
4
(.1
7)
1.3
8
(.1
7)
.81
(.1
1)
1.7
9
(.0
9)
2.5
6*
(.3
7)
1.4
9*
(.2
9)
4.6
4***
(.6
2)
4.0
1***
(.5
9)
4.6
6***
(.6
5)
1.4
1**
(.2
7)
3.2
0***
(.3
0)
1.7
7
(.1
7)
.90
(.0
9)
2.0
3
(.1
8)
1.1
8
(.1
4)
.95
(.1
3)
.68
(.1
0)
1.5
8
(.0
8)
No
te:
Sta
nd
ard
err
ors
inp
are
nth
eses.
+p
<0
.10
,*p
<0
.05
,**p
<0
.01
,***p
<0
.00
1.
aS
ign
ifican
tly
diff
ere
nt
fro
mn
on
-ELLs.
bS
ign
ifican
tly
diff
ere
nt
fro
mn
on
-His
pan
ics.
cS
ign
ifican
tly
diff
ere
nt
fro
mn
on
-fre
elu
nch
receiv
ers
.
DIGITAL WRITING AND DIVERSITY / 295
standardized tests, due to a mismatch between the conditions of those tests
(short essays written in a single setting) and the type of writing done on laptops
(involving gathering of information, drafting, getting feedback, revising, and
publishing in a variety of genres). A study by Russell and Plati (2002), for
example, found that mode of test administration (computer vs. paper) had a
significant effect on writing test scores of both fourth and eighth grade students,
with tests taken on computer rated higher, yet writing tests are frequently adminis-
tered on paper. The recent National Assessment of Educational Progress writing
test (see National Center for Education Statistics, 2012) was given on computer,
and found a positive correlation between test score outcomes and prior time
spent writing and revising with computers.
In addition, the steep learning curve associated with laptop use by both teachers
and students, and the disruptive impact of laptops on prior ways of teaching,
means that gains might not be fully realized in the first few years after their
introduction. Indeed, it is not unusual for test scores to drop following the first
year of a laptop program, only to rebound in subsequent years (see, e.g., Grimes &
Warschauer, 2008). Finally, both of these two districts were high-performing, so
a ceiling effect may have occurred, especially for the groups of students that are
already increasing the most in test scores year to year.
For all of these reasons, the fact that writing achievement growth in the
California school district improved in both the partial and full laptop program
years, and that the gains were strongest for Hispanic and low-income learners, is
encouraging. It is also encouraging that Hispanics and learners from low-income
families in the Colorado district experienced significant positive results. Addi-
tionally, survey results, interviews, and observations indicated that at-risk students
used the laptops as much or more frequently than their counterparts at school and
in ways that addressed their particular needs.
Also importantly, these interventions were carried out with low-cost open
source netbooks. Total hardware and software purchase cost was $250-$300 per
student, and the overall implementation cost averaged over a 4-year laptop cycle,
including professional development, replacement costs, and technical support,
was calculated by staff in the districts to be well under $150 per student per
year. Though we did not conduct a separate cost-benefit analysis, the expenses
involved, which roughly parallel the costs of decreasing class size by 0.5 students
per teacher, suggest that some benefits can be achieved through comparatively
low-cost technology programs. Furthermore, for the elementary school students
in the study, program costs provided laptops not only for literacy instruction, but
also for use throughout the school day in a wide variety of subjects and ways that
we did not investigate, including accessing science videos, doing individualized
math assignments, working on social studies research projects, and completing
formative and summative assessments.
In conclusion, this study provides evidence that school laptop programs focus-
ing on student writing can help improve literacy and educational equity for at-risk
296 / ZHENG, WARSCHAUER AND FARKAS
learners. Further research can help determine what approaches to teaching writing
with laptops are most effective, and whether 1-year gains lead to better long-term
outcomes, with or without continued access to laptops in subsequent grades.
REFERENCES
Alliance for Childhood. (2004). Tech tonic: Towards a new literacy of technology.
College Park, MD: Alliance for Childhood.
Bebell, D., & Kay, R. E. (2009). Berkshire wireless learning initiative: Final evaluation
report. Boston, MA: Technology and Assessment Study Collaborative.
Bebell, D., & Kay, R. E. (2010). One to one computing: A summary of the quantitative
results from the Berkshire wireless learning initiative. The Journal of Technology,
Learning, and Assessment, 9(2). Retrieved December 12, 2011 from www.jtla.org
Black, R. W. (2008). Adolescents and online fan fiction. New York, NY: Peter Lang.
Bloch, J. (2007). Abdullah’s blogging: A generation 1.5 student enters the blogosphere.
Language Learning & Technology, 11(2), 128-141.
Bogdan, R. C., & Biklen, S. K. (1982). Qualitative research for education: An introduc-
tion to theory and methods. Boston, MA: Allyn & Bacon.
Calkins, L. (1994). The art of teaching writing. Portsmouth, NH: Heinemann.
Carico, K. M., & Logan, D. (2004). A generation in cyberspace: Engaging readers through
online discussions. Language Arts, 81(4), 293-302.
Chen, C.-F. E., & Cheng, W.-Y. E. (2008). Beyond the design of automated writing
evaluation: Pedagogical practices and perceived learning effectiveness in EFL writing
classes. Language Learning & Technology, 12(3), 94-112.
Cohen, Y., Ben-Simon, A., & Hovav, M. (2003). The effect of specific language features
on the complexity of systems for automated essay scoring. Paper presented at the
International Association of Educational Assessment Annual Conference, Manchester.
Colorado Department of Education. (2010). Colorado Student Assessment Program Tech-
nical Report 2010. Retrieved June 5, 2011 from http://www.cde.state.co.us/cdeassess/
publications.html
Colorado Department of Education. (2011). Automated data exchange documentation:
Student data elements and definitions. Retrieved March 15, 2011 from https://
cdeapps.cde.state.co.us/appendix_sodefs.htm
Culp, K. M., Honey, M., & Mandinach, E. (2005). A retrospective on twenty years of
education technology policy. Journal of Educational Computing Research, 32(3),
279-307.
Grimes, D., & Warschauer, M. (2008). Learning with laptops: A multi-method case study.
Journal of Educational Computing Research, 38(3), 305-332. doi: 10.2190/EC.38.3d
Grimes, D., & Warschauer, M. (2010). Utility in a fallible tool: A multi-site case study of
automated writing evaluation. Journal of Technology, Learning, and Assessment, 8(6).
Retrieved January 5, 2012 from www.jtla.org
Grisham, D. L., & Wolsey, T. D. (2006). Recentering the middle school classroom as a
vibrant learning community: Students, literacy, and technology intersect. Journal of
Adolescent & Adult Literacy, 49, 648-660. doi: 10.1598/JAAL.49.8.2
Harklau, L., & Pinnow, R. (2009). Adolescent second-language writing. In L.
Christenbury, R. Bomer, & P. Smagorinsky (Eds.), Handbook of adolescent literacy
research (pp. 126-139). New York, NY: The Guilford Press.
DIGITAL WRITING AND DIVERSITY / 297
Hill, J. R., Reeves, T. C., Grant, M., & Wang, S.-K. (2002). The impact of portable
technologies on teaching and learning: Year two report. Athens, GA: Athens
Academy.
Jeroski, S. (2008). Wireless writing project (WWP): Peace River north summary report
on grade 6 achievement. Retrieved October 29, 2009 from http://www.prn.bc.ca/wp-
content/wwp2008grade6.pdf
Johnstone, B. (2003). Never mind the laptops: Kids, computers, and the transformation
of learning. Lincoln, NE: iUniverse.
Kulik, J. A. (2003). Effects of using instructional technology in elementary and
secondary schools: What controlled evaluation studies say. Arlington, VA: SRI
International
Lam, W. S. E. (2000). L2 Literacy and the design of the self: A case study of a teenager
writing on the internet. TESOL Quarterly, 34(3), 457-482.
Lei, J., & Zhao, Y. (2008). One-to-one computing: What does it bring to schools? Journal
of Educational Computing Research, 39(2), 97-122.
National Center for Education Statistics. (2012). The nation’s report card: Writing 2011
(NCES 2012-470). Washington, DC: Institute of Education Sciences, U.S. Department
of Education.
Penuel, W. R. (2006). Implementation and effects of one-to-one computing initia-
tives: A research synthesis. Journal of Research on Technology in Education, 38(3),
329-348.
Ross, S. M., Lowther, D. L., Relyea, B. W., Wang, W. P., & Morrison, G. R. (2003).
Anytime, anywhere learning. Final Evaluation Report of the Laptop Program: Year 3.
Retrieved December 5, 2009 from http://www.projectred.org/uploads/Walled_Lake_
Anywhere_Anytime_Laptop_Program.pdf
Russell, M., Bebell, D., & Higgins, J. (2004). Laptop learning: A comparison of
teaching and learning in upper elementary classrooms equipped with shared carts
of laptops and permanent 1:1 laptops. Journal of Educational Computing Research,
30(4), 313-330.
Russell, M., & Plati, T. (2002). Does it matter with what I write? Comparing performance
on paper, computer and portable writing devices. Current Issues in Education, 5(4).
Retrieved December 13, 2011 from http://cie.ed.asu.edu/volume5/number 4/
Severin, E., Santiago, A., Cristia, J., Ibarraran, P., Thompson, J., & Cueto, S. (2011).
Evaluation of the “Una Laptop por Niño” program in Peru: Results and perspectives.
Washington, DC: Banco Interamericano de Desarrollo.
Shapley, K., Sheehan, D., Maloney, C., & Caranikas-Walker, F. (2008). Evaluation of
the Texas Technology Immersion Pilot: Outcomes for the third year (2006-07). Austin,
TX: Texas Center for Educational Research.
Shermis, M. D., Burstein, J. C., & Bliss, L. (2004). The impact of automated essay scoring
on high stakes writing assessment. Paper presented at the Annual Meetings of the
National Council on Measurement in Education, San Diego, CA.
Silvernail, D. L., & Gritter, A. K. (2007). Maine’s middle school laptop program: Creating
better writers. Center for Educational Policy, Applied Research, and Evaluation.
Retrieved December 2, 2009 from http://usm.maine.edu/cepare/pdf/Writing_Brief.pdf
Silvernail, D. L., & Lane, D. M. M. (2004). The impact of Maine’s one-to-one laptop
program on middle school teachers and students. Portland, ME: Maine Education
Policy Research Institute, University of Southern Maine Office.
298 / ZHENG, WARSCHAUER AND FARKAS
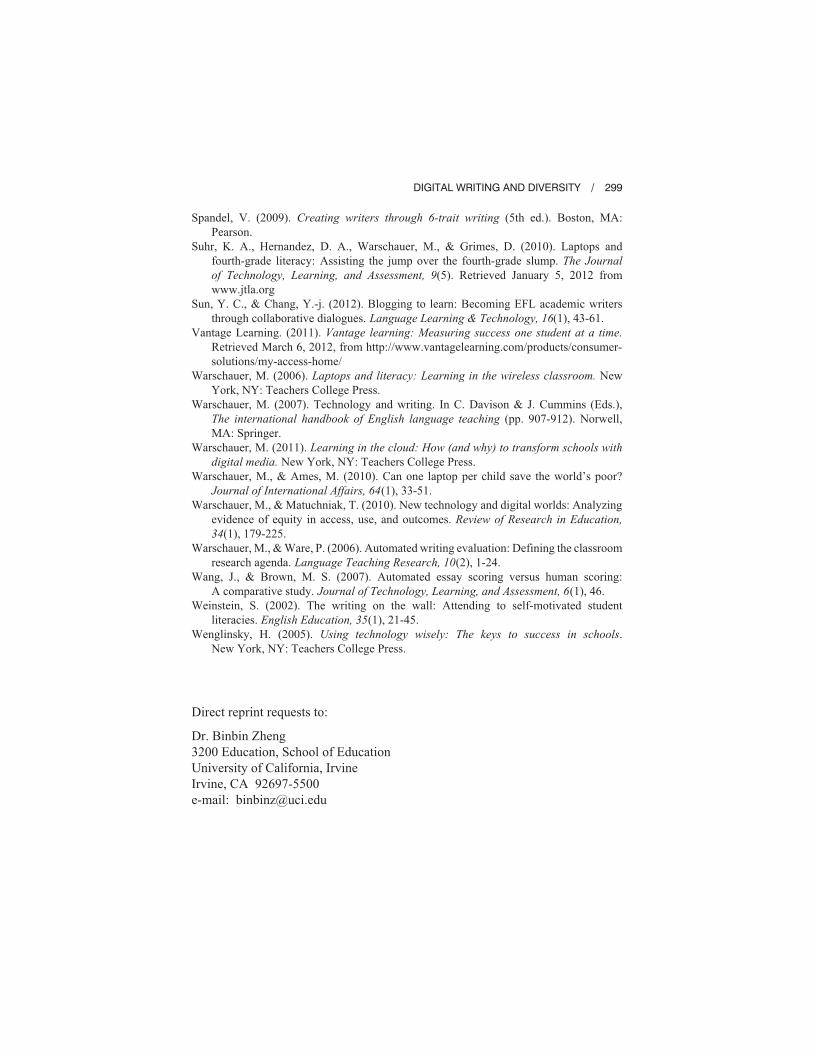
Spandel, V. (2009). Creating writers through 6-trait writing (5th ed.). Boston, MA:
Pearson.
Suhr, K. A., Hernandez, D. A., Warschauer, M., & Grimes, D. (2010). Laptops and
fourth-grade literacy: Assisting the jump over the fourth-grade slump. The Journal
of Technology, Learning, and Assessment, 9(5). Retrieved January 5, 2012 from
www.jtla.org
Sun, Y. C., & Chang, Y.-j. (2012). Blogging to learn: Becoming EFL academic writers
through collaborative dialogues. Language Learning & Technology, 16(1), 43-61.
Vantage Learning. (2011). Vantage learning: Measuring success one student at a time.
Retrieved March 6, 2012, from http://www.vantagelearning.com/products/consumer-
solutions/my-access-home/
Warschauer, M. (2006). Laptops and literacy: Learning in the wireless classroom. New
York, NY: Teachers College Press.
Warschauer, M. (2007). Technology and writing. In C. Davison & J. Cummins (Eds.),
The international handbook of English language teaching (pp. 907-912). Norwell,
MA: Springer.
Warschauer, M. (2011). Learning in the cloud: How (and why) to transform schools with
digital media. New York, NY: Teachers College Press.
Warschauer, M., & Ames, M. (2010). Can one laptop per child save the world’s poor?
Journal of International Affairs, 64(1), 33-51.
Warschauer, M., & Matuchniak, T. (2010). New technology and digital worlds: Analyzing
evidence of equity in access, use, and outcomes. Review of Research in Education,
34(1), 179-225.
Warschauer, M., & Ware, P. (2006). Automated writing evaluation: Defining the classroom
research agenda. Language Teaching Research, 10(2), 1-24.
Wang, J., & Brown, M. S. (2007). Automated essay scoring versus human scoring:
A comparative study. Journal of Technology, Learning, and Assessment, 6(1), 46.
Weinstein, S. (2002). The writing on the wall: Attending to self-motivated student
literacies. English Education, 35(1), 21-45.
Wenglinsky, H. (2005). Using technology wisely: The keys to success in schools.
New York, NY: Teachers College Press.
Direct reprint requests to:
Dr. Binbin Zheng
3200 Education, School of Education
University of California, Irvine
Irvine, CA 92697-5500
e-mail: [email protected]
DIGITAL WRITING AND DIVERSITY / 299

Copyright of Journal of Educational Computing Research is the property of BaywoodPublishing Company, Inc. and its content may not be copied or emailed to multiple sites orposted to a listserv without the copyright holder's express written permission. However, usersmay print, download, or email articles for individual use.