Embed Size (px)
Citation preview
UNCLASSIFIED: Distribution Statement A. Approved for public release; distribution is unlimited.
2017 NDIA GROUND VEHICLE SYSTEMS ENGINEERING AND TECHNOLOGY
SYMPOSIUM MODELING & SIMULATION, TESTING AND VALIDATION (MSTV) TECHNICAL SESSION
AUGUST 8-10, 2017 - NOVI, MICHIGAN
DIGITAL TWIN FOR TANK TRACK ELASTOMERS: PREDICTING SELF-HEATING AND DURABILITY
William V. Mars, PhD Endurica LLC Findlay, OH
Matthew Castanier, PhD
TARDEC Warren, MI
David Ostberg
William Bradford TARDEC
Warren, MI
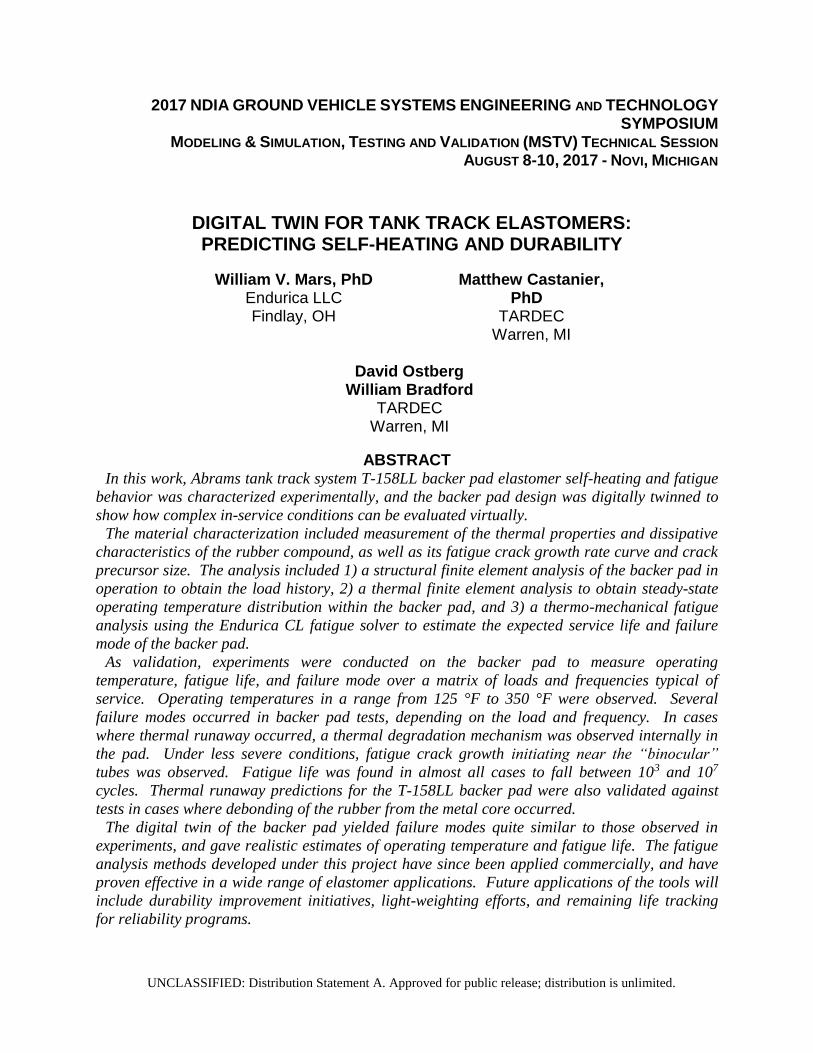
ABSTRACT In this work, Abrams tank track system T-158LL backer pad elastomer self-heating and fatigue
behavior was characterized experimentally, and the backer pad design was digitally twinned to
show how complex in-service conditions can be evaluated virtually.
The material characterization included measurement of the thermal properties and dissipative
characteristics of the rubber compound, as well as its fatigue crack growth rate curve and crack
precursor size. The analysis included 1) a structural finite element analysis of the backer pad in
operation to obtain the load history, 2) a thermal finite element analysis to obtain steady-state
operating temperature distribution within the backer pad, and 3) a thermo-mechanical fatigue
analysis using the Endurica CL fatigue solver to estimate the expected service life and failure
mode of the backer pad.
As validation, experiments were conducted on the backer pad to measure operating
temperature, fatigue life, and failure mode over a matrix of loads and frequencies typical of
service. Operating temperatures in a range from 125 °F to 350 °F were observed. Several
failure modes occurred in backer pad tests, depending on the load and frequency. In cases
where thermal runaway occurred, a thermal degradation mechanism was observed internally in
the pad. Under less severe conditions, fatigue crack growth initiating near the “binocular”
tubes was observed. Fatigue life was found in almost all cases to fall between 103 and 107
cycles. Thermal runaway predictions for the T-158LL backer pad were also validated against
tests in cases where debonding of the rubber from the metal core occurred.
The digital twin of the backer pad yielded failure modes quite similar to those observed in
experiments, and gave realistic estimates of operating temperature and fatigue life. The fatigue
analysis methods developed under this project have since been applied commercially, and have
proven effective in a wide range of elastomer applications. Future applications of the tools will
include durability improvement initiatives, light-weighting efforts, and remaining life tracking
for reliability programs.
Proceedings of the 2017 Ground Vehicle Systems Engineering and Technology Symposium (GVSETS)
UNCLASSIFIED: Distribution Statement A. Approved for public release; distribution is unlimited.
Digital twin for tank track elastomers: predicting self-heating and durability, Mars, et al.
UNCLASSIFIED: Distribution Statement A. Approved for public release; distribution is unlimited.
Page 2 of 10
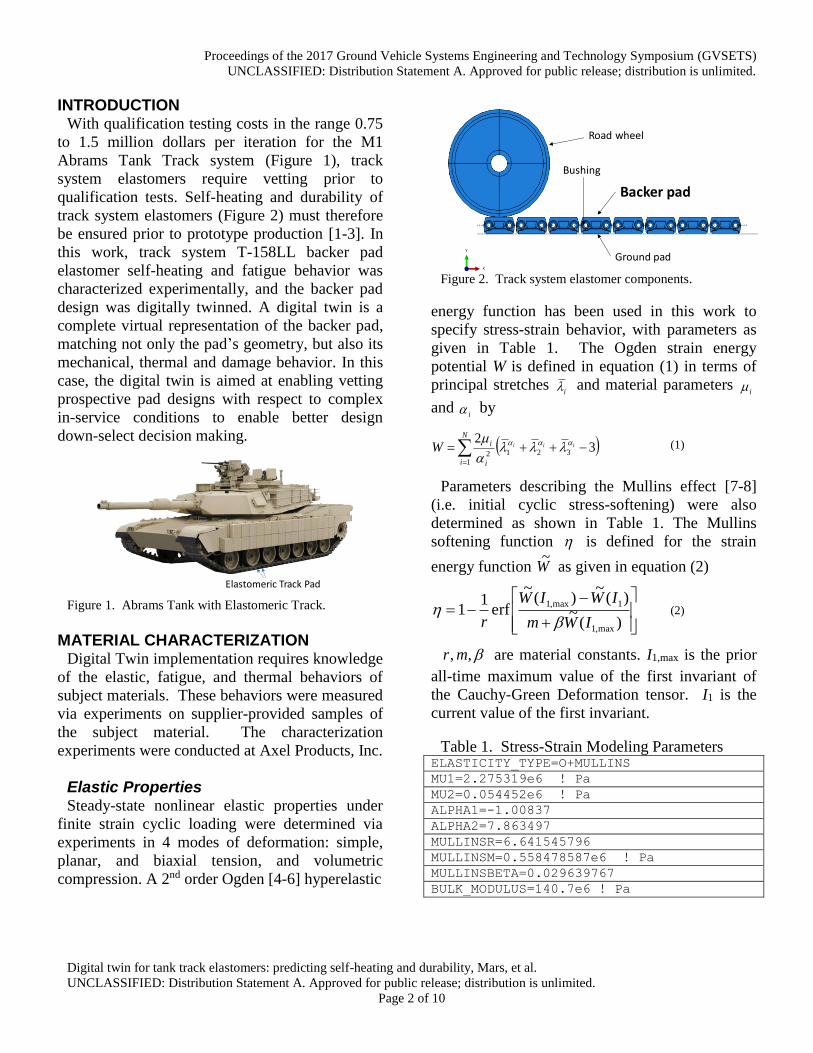
INTRODUCTION With qualification testing costs in the range 0.75
to 1.5 million dollars per iteration for the M1
Abrams Tank Track system (Figure 1), track
system elastomers require vetting prior to
qualification tests. Self-heating and durability of
track system elastomers (Figure 2) must therefore
be ensured prior to prototype production [1-3]. In
this work, track system T-158LL backer pad
elastomer self-heating and fatigue behavior was
characterized experimentally, and the backer pad
design was digitally twinned. A digital twin is a
complete virtual representation of the backer pad,
matching not only the pad’s geometry, but also its
mechanical, thermal and damage behavior. In this
case, the digital twin is aimed at enabling vetting
prospective pad designs with respect to complex
in-service conditions to enable better design
down-select decision making.
Elastomeric Track Pad
Figure 1. Abrams Tank with Elastomeric Track.
MATERIAL CHARACTERIZATION Digital Twin implementation requires knowledge
of the elastic, fatigue, and thermal behaviors of
subject materials. These behaviors were measured
via experiments on supplier-provided samples of
the subject material. The characterization
experiments were conducted at Axel Products, Inc.
Elastic Properties Steady-state nonlinear elastic properties under
finite strain cyclic loading were determined via
experiments in 4 modes of deformation: simple,
planar, and biaxial tension, and volumetric
compression. A 2nd order Ogden [4-6] hyperelastic
Road wheel
Ground pad
Backer pad
Bushing
Figure 2. Track system elastomer components.
energy function has been used in this work to
specify stress-strain behavior, with parameters as
given in Table 1. The Ogden strain energy
potential W is defined in equation (1) in terms of
principal stretches i and material parameters
i
and i by
N
i i
i iiiW1
32123
2
(1)
Parameters describing the Mullins effect [7-8]
(i.e. initial cyclic stress-softening) were also
determined as shown in Table 1. The Mullins
softening function is defined for the strain
energy function W~
as given in equation (2)
)(~
)(~
)(~
erf1
1max,1
1max,1
IWm
IWIW
r (2)
,, mr are material constants. I1,max is the prior
all-time maximum value of the first invariant of
the Cauchy-Green Deformation tensor. I1 is the
current value of the first invariant.
Table 1. Stress-Strain Modeling Parameters ELASTICITY_TYPE=O+MULLINS
MU1=2.275319e6 ! Pa
MU2=0.054452e6 ! Pa
ALPHA1=-1.00837
ALPHA2=7.863497
MULLINSR=6.641545796
MULLINSM=0.558478587e6 ! Pa
MULLINSBETA=0.029639767
BULK_MODULUS=140.7e6 ! Pa
Proceedings of the 2017 Ground Vehicle Systems Engineering and Technology Symposium (GVSETS)
UNCLASSIFIED: Distribution Statement A. Approved for public release; distribution is unlimited.
Digital twin for tank track elastomers: predicting self-heating and durability, Mars, et al.
UNCLASSIFIED: Distribution Statement A. Approved for public release; distribution is unlimited.
Page 3 of 10
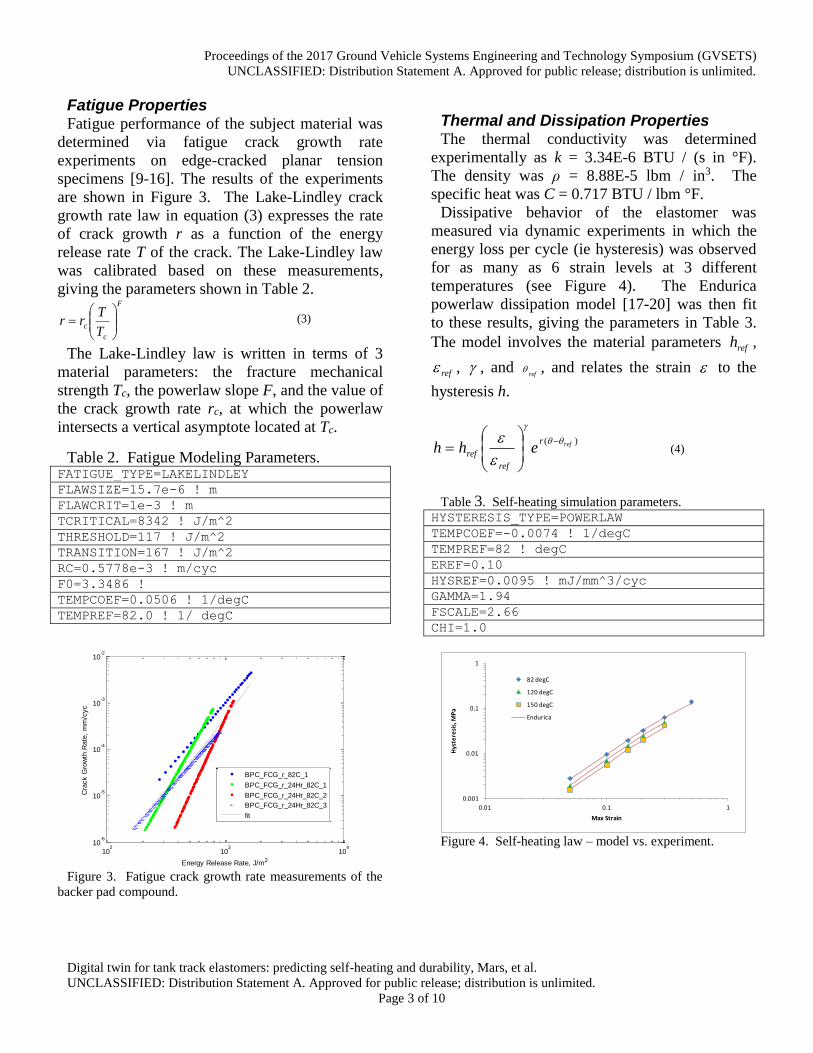
Fatigue Properties Fatigue performance of the subject material was
determined via fatigue crack growth rate
experiments on edge-cracked planar tension
specimens [9-16]. The results of the experiments
are shown in Figure 3. The Lake-Lindley crack
growth rate law in equation (3) expresses the rate
of crack growth r as a function of the energy
release rate T of the crack. The Lake-Lindley law
was calibrated based on these measurements,
giving the parameters shown in Table 2. F
c
cT
Trr
(3)
The Lake-Lindley law is written in terms of 3
material parameters: the fracture mechanical
strength Tc, the powerlaw slope F, and the value of
the crack growth rate rc, at which the powerlaw
intersects a vertical asymptote located at Tc.
Table 2. Fatigue Modeling Parameters. FATIGUE_TYPE=LAKELINDLEY
FLAWSIZE=15.7e-6 ! m
FLAWCRIT=1e-3 ! m
TCRITICAL=8342 ! J/m^2
THRESHOLD=117 ! J/m^2
TRANSITION=167 ! J/m^2
RC=0.5778e-3 ! m/cyc
F0=3.3486 !
TEMPCOEF=0.0506 ! 1/degC
TEMPREF=82.0 ! 1/ degC
102
103
104
10-6
10-5
10-4
10-3
10-2
Energy Release Rate, J/m2
Cra
ck G
row
th R
ate
, m
m/c
yc
BPC_FCG_r_82C_1
BPC_FCG_r_24Hr_82C_1
BPC_FCG_r_24Hr_82C_2
BPC_FCG_r_24Hr_82C_3
fit
Figure 3. Fatigue crack growth rate measurements of the
backer pad compound.
Thermal and Dissipation Properties The thermal conductivity was determined
experimentally as k = 3.34E-6 BTU / (s in °F).
The density was ρ = 8.88E-5 lbm / in3. The
specific heat was C = 0.717 BTU / lbm °F.
Dissipative behavior of the elastomer was
measured via dynamic experiments in which the
energy loss per cycle (ie hysteresis) was observed
for as many as 6 strain levels at 3 different
temperatures (see Figure 4). The Endurica
powerlaw dissipation model [17-20] was then fit
to these results, giving the parameters in Table 3.
The model involves the material parameters refh ,
ref , , and ref
, and relates the strain to the
hysteresis h.
)( refr
ref
ref ehh
(4)
Table 3. Self-heating simulation parameters.
HYSTERESIS_TYPE=POWERLAW
TEMPCOEF=-0.0074 ! 1/degC
TEMPREF=82 ! degC
EREF=0.10
HYSREF=0.0095 ! mJ/mm^3/cyc
GAMMA=1.94
FSCALE=2.66
CHI=1.0
0.001
0.01
0.1
1
0.01 0.1 1
Hys
tere
sis,
MP
a
Max Strain
82 degC
120 degC
150 degC
Endurica
Figure 4. Self-heating law – model vs. experiment.
Proceedings of the 2017 Ground Vehicle Systems Engineering and Technology Symposium (GVSETS)
UNCLASSIFIED: Distribution Statement A. Approved for public release; distribution is unlimited.
Digital twin for tank track elastomers: predicting self-heating and durability, Mars, et al.
UNCLASSIFIED: Distribution Statement A. Approved for public release; distribution is unlimited.
Page 4 of 10
DIGITAL TWIN IMPLEMENTATION The backer pad digital twin was implemented via
the Abaqus solver for structural and thermal
calculations, and the Endurica CL solver for
dissipation and fatigue calculations. The digital
twin was set to reflect the backer pad as it operates
in a component durability test. The component
test uses a single backer pad that is repeatedly
brought into rolling contact with a rigid road
wheel until the pad looses integrity. Note that in
the component test, the bushings and ground pad,
normally present when installed on the M1, are
not included. The bushings and ground pad were
also excluded from the digital twin.
As validation, fatigue experiments were
conducted on the backer pad to measure operating
temperature, fatigue life, and failure mode over a
matrix of loads and frequencies typical of service.
Two load levels were executed: 5400 lbf and 6700
lbf. These loads correspond approximately to
upper and lower bounds of the range of loads that
a ground pad sees under each of the M1 track
system 7 road wheel stations as the vehicle is
operated on pavement at high speeds [3], under
the assumption that the load inboard and outboard
are carried equally. Three frequency levels were
executed: 6, 7, and 8 Hz. These frequencies
correspond to vehicle operation at 30, 35, and 40
mph, where the loading caused by each of the 7
wheel stations is considered a single loading
event. The matrix of operating conditions shown
in Table 4 was executed via experiments and via
simulation.
Table 4. Operating conditions for analysis and testing.
C1
5400 lbf, 6 Hz
B2
6700 lbf, 6 Hz
B3
5400 lbf, 7 Hz
B4
6700 lbf, 7 Hz
C5
5400 lbf, 8 Hz
B6
6700 lbf, 8 Hz
The analysis included 1) a structural finite
element analysis of the pad in operation through
one wheel traversal to obtain the load history, 2) a
thermal analysis to obtain steady-state operating
temperatures within the pad, and 3) a thermo-
mechanical fatigue analysis using the Endurica CL
fatigue solver to estimate the expected service life
and failure model of the backer pad. The Endurica
CL fatigue solver uses a microkinematic self-
heating law [21] for estimating heat dissipation
rates in the finite element model, and critical plane
analysis for computing the fatigue life.
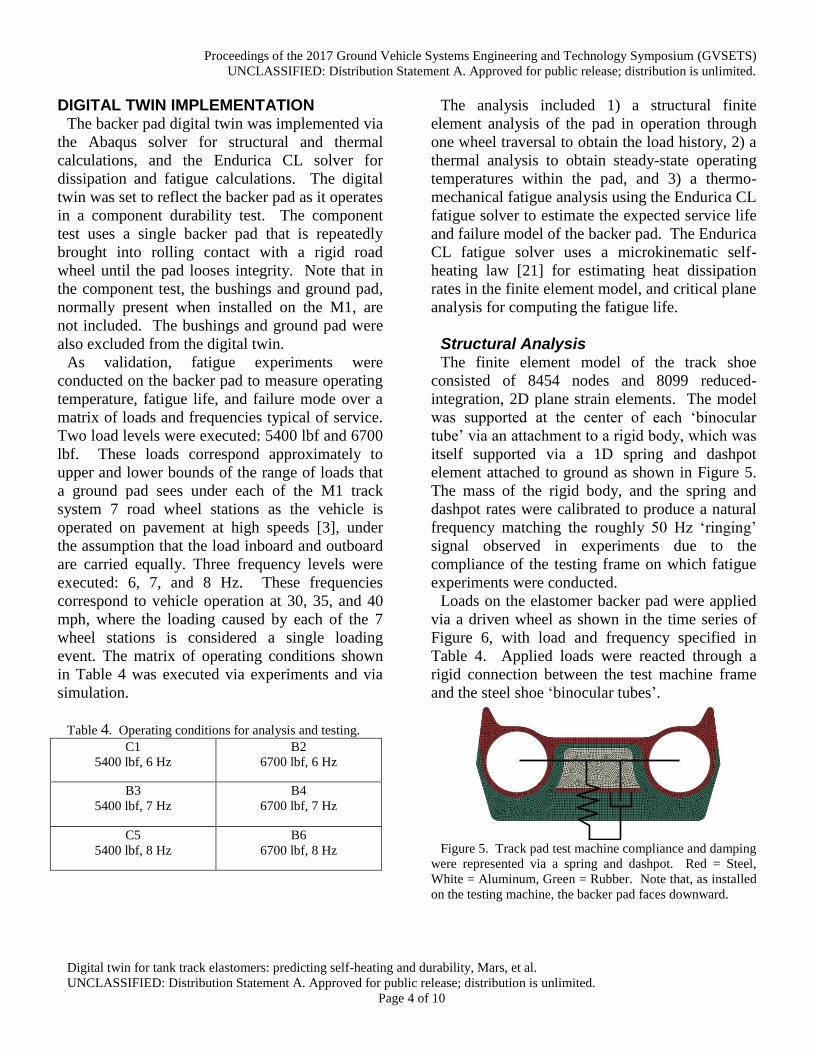
Structural Analysis The finite element model of the track shoe
consisted of 8454 nodes and 8099 reduced-
integration, 2D plane strain elements. The model
was supported at the center of each ‘binocular
tube’ via an attachment to a rigid body, which was
itself supported via a 1D spring and dashpot
element attached to ground as shown in Figure 5.
The mass of the rigid body, and the spring and
dashpot rates were calibrated to produce a natural
frequency matching the roughly 50 Hz ‘ringing’
signal observed in experiments due to the
compliance of the testing frame on which fatigue
experiments were conducted.
Loads on the elastomer backer pad were applied
via a driven wheel as shown in the time series of
Figure 6, with load and frequency specified in
Table 4. Applied loads were reacted through a
rigid connection between the test machine frame
and the steel shoe ‘binocular tubes’.
Figure 5. Track pad test machine compliance and damping
were represented via a spring and dashpot. Red = Steel,
White = Aluminum, Green = Rubber. Note that, as installed
on the testing machine, the backer pad faces downward.
Proceedings of the 2017 Ground Vehicle Systems Engineering and Technology Symposium (GVSETS)
UNCLASSIFIED: Distribution Statement A. Approved for public release; distribution is unlimited.
Digital twin for tank track elastomers: predicting self-heating and durability, Mars, et al.
UNCLASSIFIED: Distribution Statement A. Approved for public release; distribution is unlimited.
Page 5 of 10
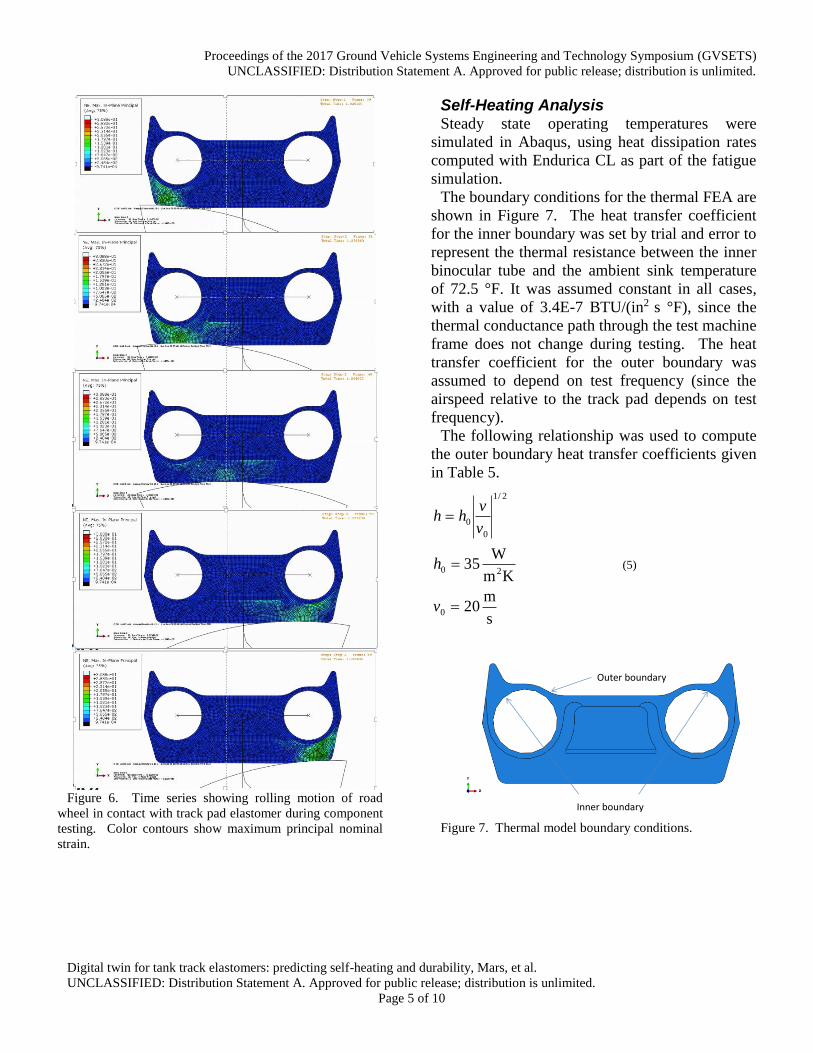
Figure 6. Time series showing rolling motion of road
wheel in contact with track pad elastomer during component
testing. Color contours show maximum principal nominal
strain.
Self-Heating Analysis Steady state operating temperatures were
simulated in Abaqus, using heat dissipation rates
computed with Endurica CL as part of the fatigue
simulation.
The boundary conditions for the thermal FEA are
shown in Figure 7. The heat transfer coefficient
for the inner boundary was set by trial and error to
represent the thermal resistance between the inner
binocular tube and the ambient sink temperature
of 72.5 °F. It was assumed constant in all cases,
with a value of 3.4E-7 BTU/(in2 s °F), since the
thermal conductance path through the test machine
frame does not change during testing. The heat
transfer coefficient for the outer boundary was
assumed to depend on test frequency (since the
airspeed relative to the track pad depends on test
frequency).
The following relationship was used to compute
the outer boundary heat transfer coefficients given
in Table 5.
s
m20
Km
W35
0
20
2/1
0
0
v
h
v
vhh
(5)
Outer boundary
Inner boundary
Figure 7. Thermal model boundary conditions.
Proceedings of the 2017 Ground Vehicle Systems Engineering and Technology Symposium (GVSETS)
UNCLASSIFIED: Distribution Statement A. Approved for public release; distribution is unlimited.
Digital twin for tank track elastomers: predicting self-heating and durability, Mars, et al.
UNCLASSIFIED: Distribution Statement A. Approved for public release; distribution is unlimited.
Page 6 of 10
Table 5. Outer boundary film coefficients.
Case Freq (Hz) Outer Boundary Film Coeff
(Btu/in^2-s-F)
C1 6 3.1478e-6
B2 6 3.1478e-6
B3 7 3.4e-06
B4 7 3.4e-06
C5 8 3.6348e-6
B6 8 3.6348e-6
Dissipation rates for each finite element in the
track pad were computed in Endurica CL, as part
of the fatigue analysis, based on the powerlaw
model shown in equation (4). Typical results are
shown in Figure 8. The dissipation rates were
computed via a directional model that considers
the deformation history and energy losses
produced by individual material lines and material
slip planes of all possible orientations [22].
Given the boundary conditions, and Endurica-
computed dissipations, the temperature
distribution for each load case was computed.
Since dissipation depends on temperature, an
iterative calculation procedure was required. In
general, convergence of the temperature field was
obtained within 5 or 6 iterations.
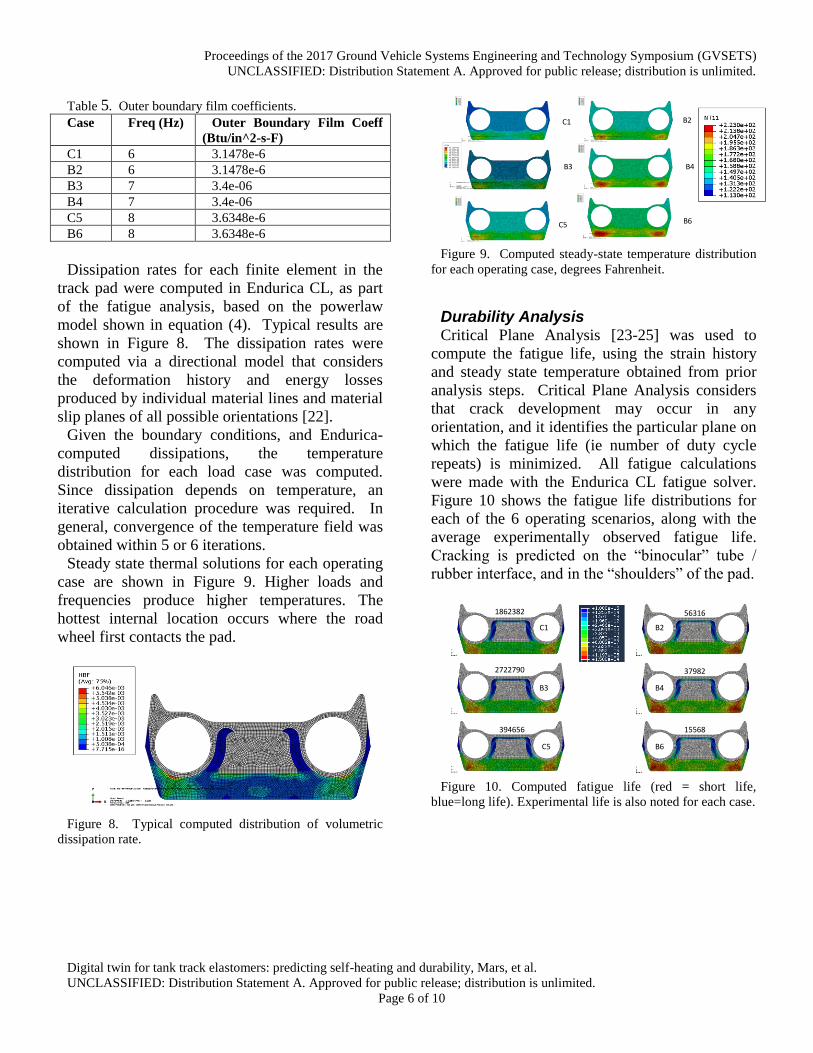
Steady state thermal solutions for each operating
case are shown in Figure 9. Higher loads and
frequencies produce higher temperatures. The
hottest internal location occurs where the road
wheel first contacts the pad.
Figure 8. Typical computed distribution of volumetric
dissipation rate.
C1 B2
B3
C5
B4
B6
Figure 9. Computed steady-state temperature distribution
for each operating case, degrees Fahrenheit.
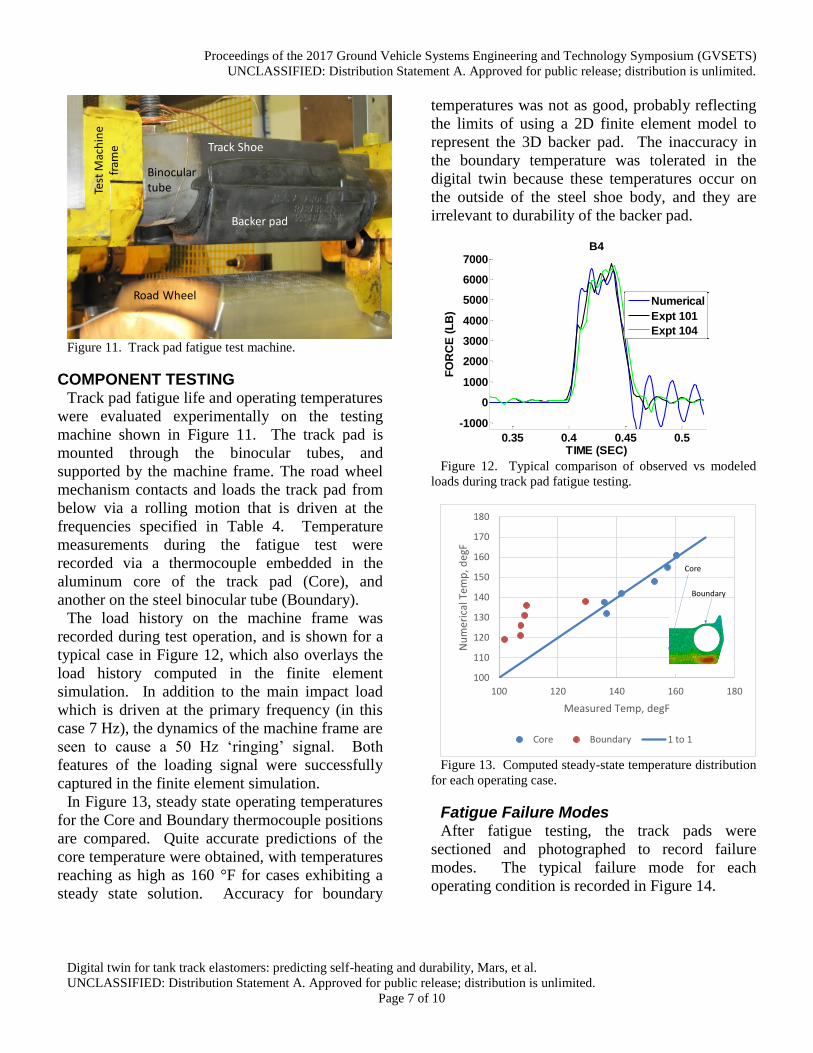
Durability Analysis Critical Plane Analysis [23-25] was used to
compute the fatigue life, using the strain history
and steady state temperature obtained from prior
analysis steps. Critical Plane Analysis considers
that crack development may occur in any
orientation, and it identifies the particular plane on
which the fatigue life (ie number of duty cycle
repeats) is minimized. All fatigue calculations
were made with the Endurica CL fatigue solver.
Figure 10 shows the fatigue life distributions for
each of the 6 operating scenarios, along with the
average experimentally observed fatigue life.
Cracking is predicted on the “binocular” tube /
rubber interface, and in the “shoulders” of the pad.
C1
B3
C5
B2
B4
B6
56316
37982
15568
1862382
2722790
394656
Figure 10. Computed fatigue life (red = short life,
blue=long life). Experimental life is also noted for each case.
Proceedings of the 2017 Ground Vehicle Systems Engineering and Technology Symposium (GVSETS)
UNCLASSIFIED: Distribution Statement A. Approved for public release; distribution is unlimited.
Digital twin for tank track elastomers: predicting self-heating and durability, Mars, et al.
UNCLASSIFIED: Distribution Statement A. Approved for public release; distribution is unlimited.
Page 7 of 10
Backer pad
Track Shoe
Binocular tube
Road Wheel
Test
Mac
hin
e fr
ame
Figure 11. Track pad fatigue test machine.
COMPONENT TESTING Track pad fatigue life and operating temperatures
were evaluated experimentally on the testing
machine shown in Figure 11. The track pad is
mounted through the binocular tubes, and
supported by the machine frame. The road wheel
mechanism contacts and loads the track pad from
below via a rolling motion that is driven at the
frequencies specified in Table 4. Temperature
measurements during the fatigue test were
recorded via a thermocouple embedded in the
aluminum core of the track pad (Core), and
another on the steel binocular tube (Boundary).
The load history on the machine frame was
recorded during test operation, and is shown for a
typical case in Figure 12, which also overlays the
load history computed in the finite element
simulation. In addition to the main impact load
which is driven at the primary frequency (in this
case 7 Hz), the dynamics of the machine frame are
seen to cause a 50 Hz ‘ringing’ signal. Both
features of the loading signal were successfully
captured in the finite element simulation.
In Figure 13, steady state operating temperatures
for the Core and Boundary thermocouple positions
are compared. Quite accurate predictions of the
core temperature were obtained, with temperatures
reaching as high as 160 °F for cases exhibiting a
steady state solution. Accuracy for boundary
temperatures was not as good, probably reflecting
the limits of using a 2D finite element model to
represent the 3D backer pad. The inaccuracy in
the boundary temperature was tolerated in the
digital twin because these temperatures occur on
the outside of the steel shoe body, and they are
irrelevant to durability of the backer pad.
0.35 0.4 0.45 0.5
-1000
0
1000
2000
3000
4000
5000
6000
7000
TIME (SEC)F
OR
CE
(L
B)
B4
Numerical
Expt 101
Expt 104
Figure 12. Typical comparison of observed vs modeled
loads during track pad fatigue testing.
100
110
120
130
140
150
160
170
180
100 120 140 160 180
Nu
mer
ical
Tem
p, d
egF
Measured Temp, degF
Core Boundary 1 to 1
Core
Boundary
Figure 13. Computed steady-state temperature distribution
for each operating case.
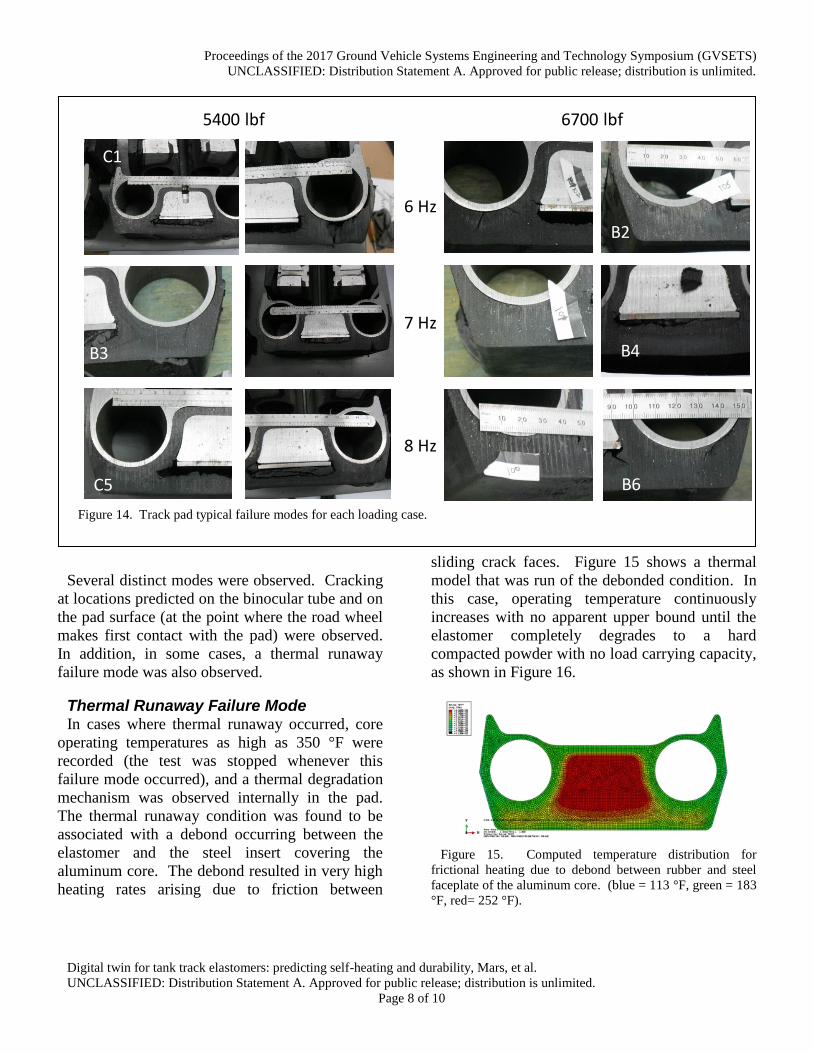
Fatigue Failure Modes After fatigue testing, the track pads were
sectioned and photographed to record failure
modes. The typical failure mode for each
operating condition is recorded in Figure 14.
Proceedings of the 2017 Ground Vehicle Systems Engineering and Technology Symposium (GVSETS)
UNCLASSIFIED: Distribution Statement A. Approved for public release; distribution is unlimited.
Digital twin for tank track elastomers: predicting self-heating and durability, Mars, et al.
UNCLASSIFIED: Distribution Statement A. Approved for public release; distribution is unlimited.
Page 8 of 10
Several distinct modes were observed. Cracking
at locations predicted on the binocular tube and on
the pad surface (at the point where the road wheel
makes first contact with the pad) were observed.
In addition, in some cases, a thermal runaway
failure mode was also observed.
Thermal Runaway Failure Mode In cases where thermal runaway occurred, core
operating temperatures as high as 350 °F were
recorded (the test was stopped whenever this
failure mode occurred), and a thermal degradation
mechanism was observed internally in the pad.
The thermal runaway condition was found to be
associated with a debond occurring between the
elastomer and the steel insert covering the
aluminum core. The debond resulted in very high
heating rates arising due to friction between
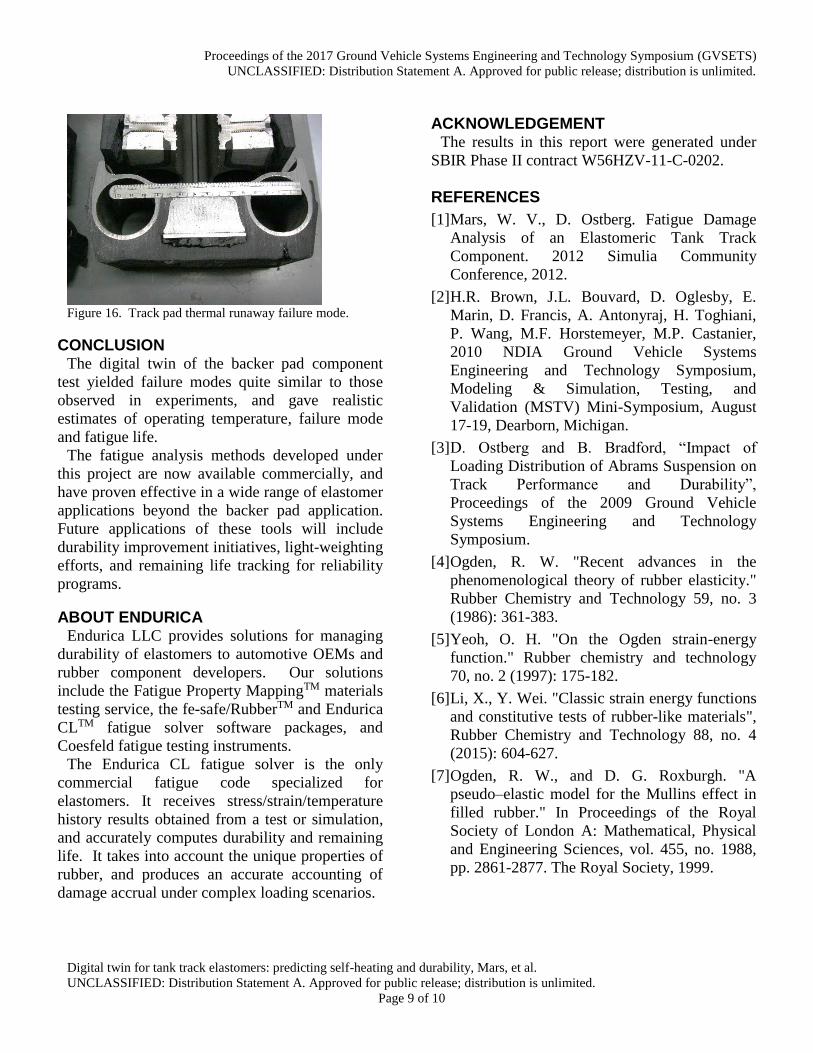
sliding crack faces. Figure 15 shows a thermal
model that was run of the debonded condition. In
this case, operating temperature continuously
increases with no apparent upper bound until the
elastomer completely degrades to a hard
compacted powder with no load carrying capacity,
as shown in Figure 16.
Figure 15. Computed temperature distribution for
frictional heating due to debond between rubber and steel
faceplate of the aluminum core. (blue = 113 °F, green = 183
°F, red= 252 °F).
6 Hz
7 Hz
8 Hz
5400 lbf 6700 lbf
C1
B3
C5
B2
B4
B6
Figure 14. Track pad typical failure modes for each loading case.
Proceedings of the 2017 Ground Vehicle Systems Engineering and Technology Symposium (GVSETS)
UNCLASSIFIED: Distribution Statement A. Approved for public release; distribution is unlimited.
Digital twin for tank track elastomers: predicting self-heating and durability, Mars, et al.
UNCLASSIFIED: Distribution Statement A. Approved for public release; distribution is unlimited.
Page 9 of 10
Figure 16. Track pad thermal runaway failure mode.
CONCLUSION The digital twin of the backer pad component
test yielded failure modes quite similar to those
observed in experiments, and gave realistic
estimates of operating temperature, failure mode
and fatigue life.
The fatigue analysis methods developed under
this project are now available commercially, and
have proven effective in a wide range of elastomer
applications beyond the backer pad application.
Future applications of these tools will include
durability improvement initiatives, light-weighting
efforts, and remaining life tracking for reliability
programs.
ABOUT ENDURICA Endurica LLC provides solutions for managing
durability of elastomers to automotive OEMs and
rubber component developers. Our solutions
include the Fatigue Property MappingTM materials
testing service, the fe-safe/RubberTM and Endurica
CLTM fatigue solver software packages, and
Coesfeld fatigue testing instruments.
The Endurica CL fatigue solver is the only
commercial fatigue code specialized for
elastomers. It receives stress/strain/temperature
history results obtained from a test or simulation,
and accurately computes durability and remaining
life. It takes into account the unique properties of
rubber, and produces an accurate accounting of
damage accrual under complex loading scenarios.
ACKNOWLEDGEMENT The results in this report were generated under
SBIR Phase II contract W56HZV-11-C-0202.
REFERENCES
[1] Mars, W. V., D. Ostberg. Fatigue Damage
Analysis of an Elastomeric Tank Track
Component. 2012 Simulia Community
Conference, 2012.
[2] H.R. Brown, J.L. Bouvard, D. Oglesby, E.
Marin, D. Francis, A. Antonyraj, H. Toghiani,
P. Wang, M.F. Horstemeyer, M.P. Castanier,
2010 NDIA Ground Vehicle Systems
Engineering and Technology Symposium,
Modeling & Simulation, Testing, and
Validation (MSTV) Mini-Symposium, August
17-19, Dearborn, Michigan.
[3] D. Ostberg and B. Bradford, “Impact of
Loading Distribution of Abrams Suspension on
Track Performance and Durability”,
Proceedings of the 2009 Ground Vehicle
Systems Engineering and Technology
Symposium.
[4] Ogden, R. W. "Recent advances in the
phenomenological theory of rubber elasticity."
Rubber Chemistry and Technology 59, no. 3
(1986): 361-383.
[5] Yeoh, O. H. "On the Ogden strain-energy
function." Rubber chemistry and technology
70, no. 2 (1997): 175-182.
[6] Li, X., Y. Wei. "Classic strain energy functions
and constitutive tests of rubber-like materials",
Rubber Chemistry and Technology 88, no. 4
(2015): 604-627.
[7] Ogden, R. W., and D. G. Roxburgh. "A
pseudo–elastic model for the Mullins effect in
filled rubber." In Proceedings of the Royal
Society of London A: Mathematical, Physical
and Engineering Sciences, vol. 455, no. 1988,
pp. 2861-2877. The Royal Society, 1999.
Proceedings of the 2017 Ground Vehicle Systems Engineering and Technology Symposium (GVSETS)
UNCLASSIFIED: Distribution Statement A. Approved for public release; distribution is unlimited.
Digital twin for tank track elastomers: predicting self-heating and durability, Mars, et al.
UNCLASSIFIED: Distribution Statement A. Approved for public release; distribution is unlimited.
Page 10 of 10
[8] Mars, W. V. "Evaluation of a pseudo-elastic
model for the Mullins effect." Tire Sci.
Technol. 32, no. 3 (2004): 120-145.
[9] Gent, A. N., & Mars, W. (2013). Strength of
elastomers. Science and technology of rubber,
419-454.
[10] Mars, W. V. 2007. "Fatigue life prediction
for elastomeric structures." Rubber Chemistry
and Technology 80, no. 3: 481-503.
[11] International Organization for
Standardization, 2008. Rubber, Vulcanized —
Measurement of Fatigue Crack Growth Rate.
ISO 27727: Geneva, Switzerland.
[12] Rivlin, R. S., and A. G. Thomas. 1953.
"Rupture of rubber. I. Characteristic energy for
tearing." Journal of Polymer Science 10, no. 3:
291-318.
[13] Thomas, A. G. 1958. "Rupture of rubber.
V. Cut growth in natural rubber vulcanizates."
J. Polymer Sci 31, no. 123: 467-480.
[14] Mars, WV, Ellul MD, 2017. Fatigue
Characterization of a Thermoplastic Elastomer,
Rubber Chemistry and Technology, 90, no. 2.
[15] Aït-Bachir, M., Mars, W. V., Verron E,
2012. "Energy release rate of small cracks in
hyperelastic materials." International Journal of
Non-Linear Mechanics 47, no. 4: 22-29.
[16] Li, F, J. Liu, W. V. Mars, T.W. Chan, Y.
Lu, H. Yang, L.Q. Zhang. "Crack precursor
size for natural rubber inferred from relaxing
and non-relaxing fatigue experiments." Int. J.
Fatigue 80 (2015): 50-57.
[17] Luchini, J. R., Peters, J. M., Arthur, R. H.,
"Tire Rolling Computation with the Finite
Element Method," Tire Sci. Technol., TSTCA,
Vol. 22, 1994, pp. 206-222.
[18] Ebbott, T. G., Hohman, R. L., Jeusette, J-
P., Kerchman, V., "Tire Temperature and
Rolling Resistance Prediction with Finite
Element Analysis," Tire Sci. Technol., TSTCA,
Vol. 27, No. 1, January-March 1999, pp. 2-21.
[19] Terziyski, J. Kennedy, R., ‘‘Accuracy,
Sensitivity, and Correlation of FEA-Computed
Coastdown Rolling Resistance,’’ Tire Sci.
Technol., TSTCA, Vol. 37, No. 1, January –
March 2009, pp. 4-31.
[20] Meng-Jiao Wang, The Role of Filler
Networking in Dynamic Properties of Filled
Rubber, Rubber Chem. Technol. 72, 430, 1999
[21] Endurica CL v2.50 User Manual, 2017.
Endurica LLC, Findlay, Ohio.
[22] Diani, J. "Directional constitutive laws for
rubbers." Rubber Chemistry and Technology
89, no. 1 (2016): 22-31.
[23] Barbash, K. P., W. V. Mars. Critical Plane
Analysis of Rubber Bushing Durability under
Road Loads. No. 2016-01-0393. SAE
Technical Paper, 2016.
[24] Goossens, J., Mars, W., Smith, G., Heil, P.
et al., "Durability Analysis of 3-Axis Input to
Elastomeric Front Lower Control Arm Vertical
Ride Bushing," SAE Technical Paper 2017-01-
1857, 2017.
[25] Mars, W. V. (2017). Computing Tire
Component Durability via Critical Plane
Analysis, Tire Science and Technology, 45 (in
press).