Embed Size (px)
Citation preview
Digital Transformationof Oil & Gas PipelineOperationsBeyond Compliance: Optimizing Safety,Reliability and Efficiency
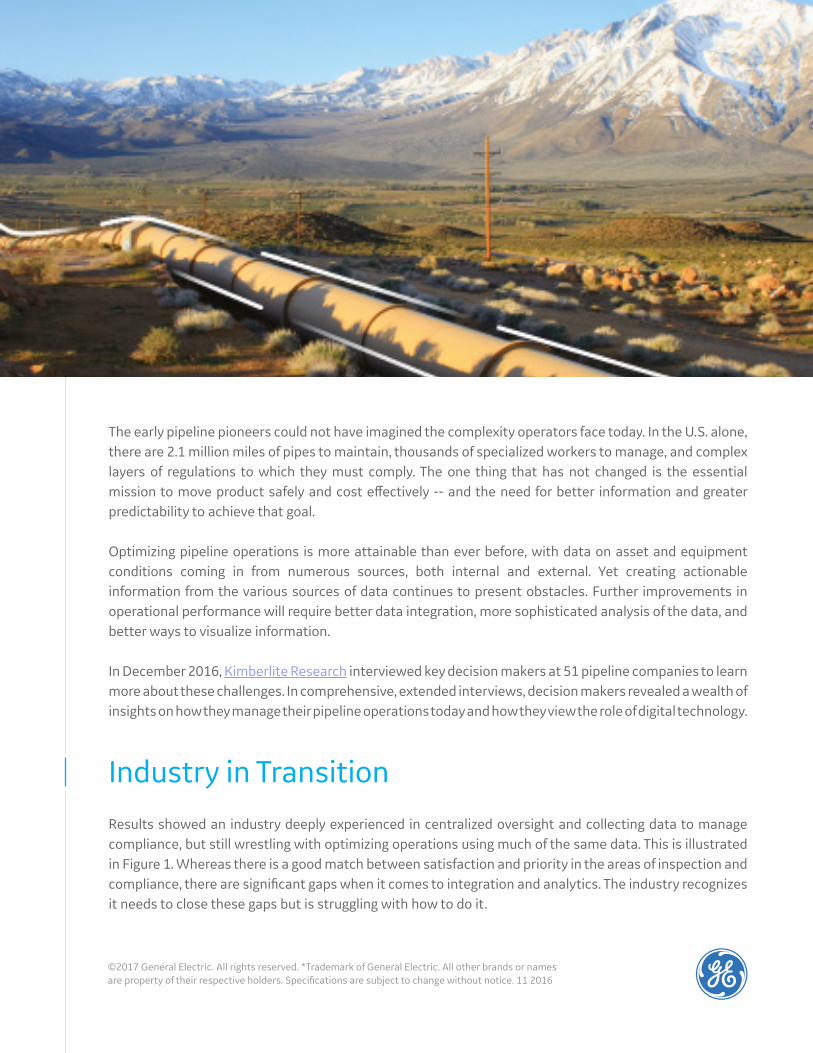
The early pipeline pioneers could not have imagined the complexity operators face today. In the U.S. alone, there are 2.1 million miles of pipes to maintain, thousands of specialized workers to manage, and complex layers of regulations to which they must comply. The one thing that has not changed is the essential mission to move product safely and cost effectively -- and the need for better information and greater predictability to achieve that goal.
Optimizing pipeline operations is more attainable than ever before, with data on asset and equipment conditions coming in from numerous sources, both internal and external. Yet creating actionable information from the various sources of data continues to present obstacles. Further improvements in operational performance will require better data integration, more sophisticated analysis of the data, and better ways to visualize information.
In December 2016, Kimberlite Research interviewed key decision makers at 51 pipeline companies to learn more about these challenges. In comprehensive, extended interviews, decision makers revealed a wealth of insights on how they manage their pipeline operations today and how they view the role of digital technology.
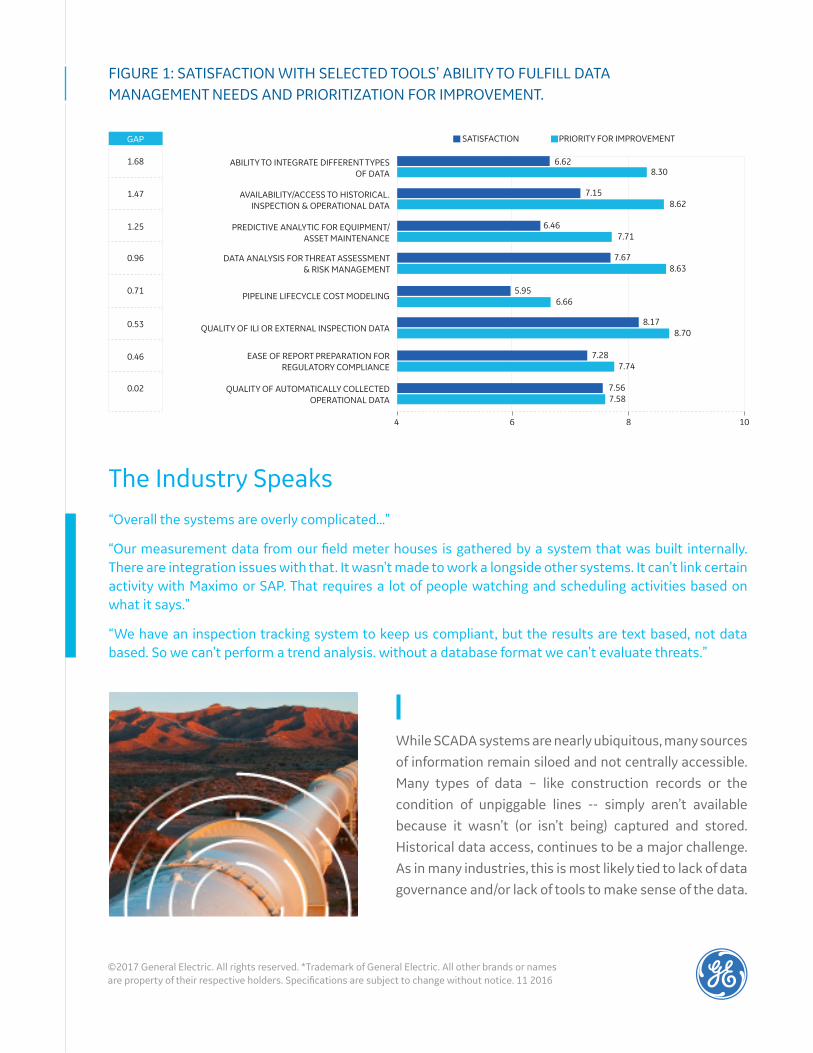
Industry in TransitionResults showed an industry deeply experienced in centralized oversight and collecting data to manage compliance, but still wrestling with optimizing operations using much of the same data. This is illustrated in Figure 1. Whereas there is a good match between satisfaction and priority in the areas of inspection and compliance, there are significant gaps when it comes to integration and analytics. The industry recognizes it needs to close these gaps but is struggling with how to do it.
©2017 General Electric. All rights reserved. *Trademark of General Electric. All other brands or names are property of their respective holders. Specifications are subject to change without notice. 11 2016
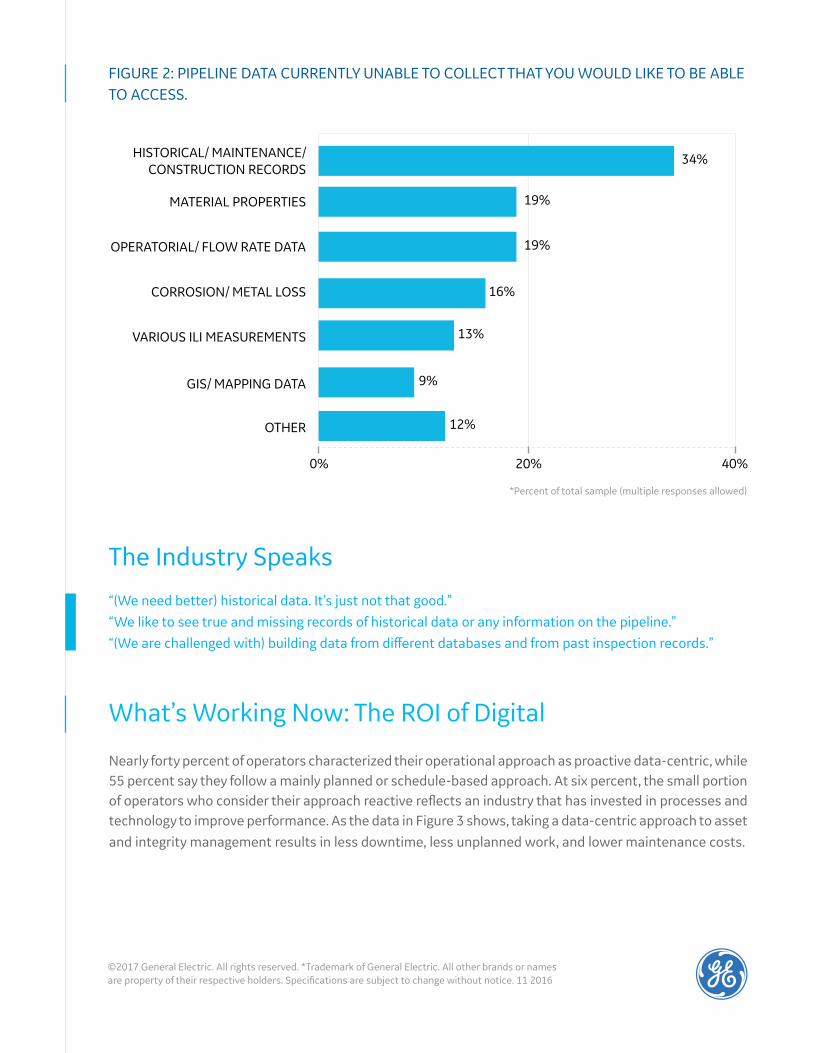
While SCADA systems are nearly ubiquitous, many sources of information remain siloed and not centrally accessible. Many types of data – like construction records or the condition of unpiggable lines -- simply aren’t available because it wasn’t (or isn’t being) captured and stored. Historical data access, continues to be a major challenge. As in many industries, this is most likely tied to lack of data governance and/or lack of tools to make sense of the data.
FIGURE 1: SATISFACTION WITH SELECTED TOOLS’ ABILITY TO FULFILL DATA MANAGEMENT NEEDS AND PRIORITIZATION FOR IMPROVEMENT.
The Industry Speaks “Overall the systems are overly complicated...”
“Our measurement data from our field meter houses is gathered by a system that was built internally. There are integration issues with that. It wasn’t made to work a longside other systems. It can’t link certain activity with Maximo or SAP. That requires a lot of people watching and scheduling activities based on what it says.”
“We have an inspection tracking system to keep us compliant, but the results are text based, not data based. So we can’t perform a trend analysis. without a database format we can’t evaluate threats.”
©2017 General Electric. All rights reserved. *Trademark of General Electric. All other brands or names are property of their respective holders. Specifications are subject to change without notice. 11 2016
The Industry Speaks
“(We need better) historical data. It’s just not that good.”“We like to see true and missing records of historical data or any information on the pipeline.”“(We are challenged with) building data from different databases and from past inspection records.”
What’s Working Now: The ROI of Digital
Nearly forty percent of operators characterized their operational approach as proactive data-centric, while 55 percent say they follow a mainly planned or schedule-based approach. At six percent, the small portion of operators who consider their approach reactive reflects an industry that has invested in processes and technology to improve performance. As the data in Figure 3 shows, taking a data-centric approach to asset and integrity management results in less downtime, less unplanned work, and lower maintenance costs.
FIGURE 2: PIPELINE DATA CURRENTLY UNABLE TO COLLECT THAT YOU WOULD LIKE TO BE ABLE TO ACCESS.
*Percent of total sample (multiple responses allowed)
©2017 General Electric. All rights reserved. *Trademark of General Electric. All other brands or names are property of their respective holders. Specifications are subject to change without notice. 11 2016
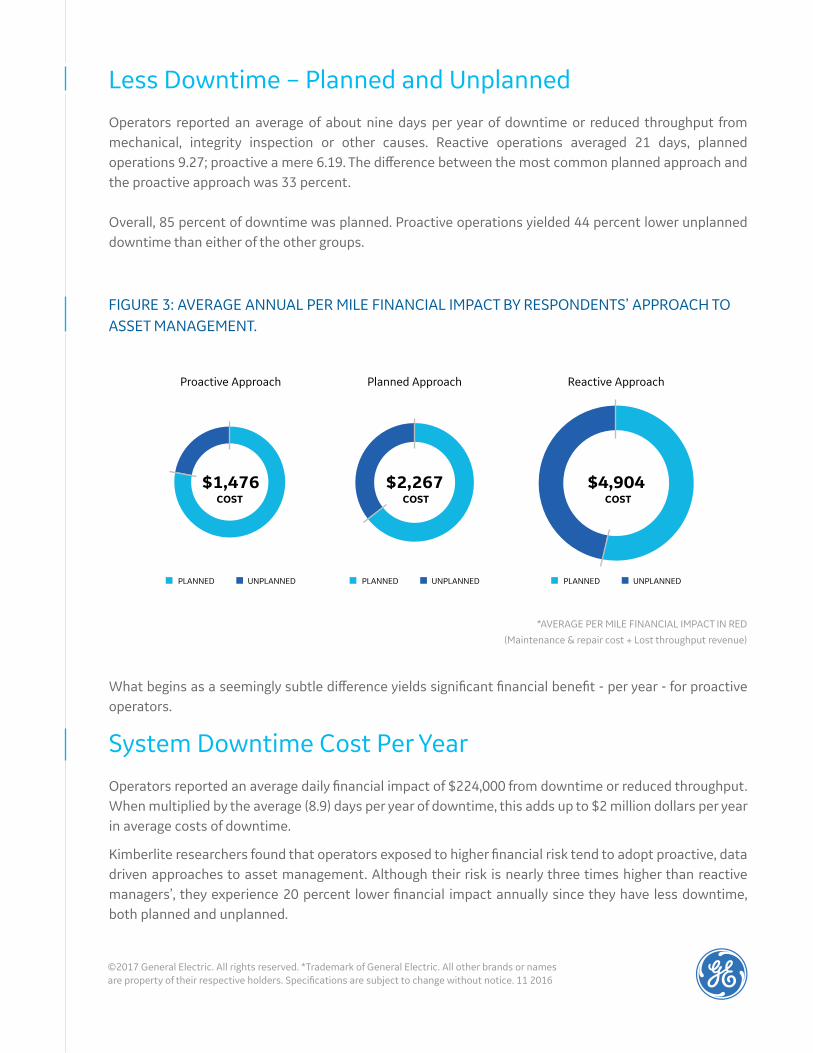
System Downtime Cost Per YearOperators reported an average daily financial impact of $224,000 from downtime or reduced throughput. When multiplied by the average (8.9) days per year of downtime, this adds up to $2 million dollars per year in average costs of downtime.
Kimberlite researchers found that operators exposed to higher financial risk tend to adopt proactive, data driven approaches to asset management. Although their risk is nearly three times higher than reactive managers’, they experience 20 percent lower financial impact annually since they have less downtime, both planned and unplanned.
What begins as a seemingly subtle difference yields significant financial benefit - per year - for proactive operators.
FIGURE 3: AVERAGE ANNUAL PER MILE FINANCIAL IMPACT BY RESPONDENTS’ APPROACH TO ASSET MANAGEMENT.
*AVERAGE PER MILE FINANCIAL IMPACT IN RED
(Maintenance & repair cost + Lost throughput revenue)
©2017 General Electric. All rights reserved. *Trademark of General Electric. All other brands or names are property of their respective holders. Specifications are subject to change without notice. 11 2016
Less Downtime – Planned and UnplannedOperators reported an average of about nine days per year of downtime or reduced throughput from mechanical, integrity inspection or other causes. Reactive operations averaged 21 days, planned operations 9.27; proactive a mere 6.19. The difference between the most common planned approach and the proactive approach was 33 percent.
Overall, 85 percent of downtime was planned. Proactive operations yielded 44 percent lower unplanned downtime than either of the other groups.
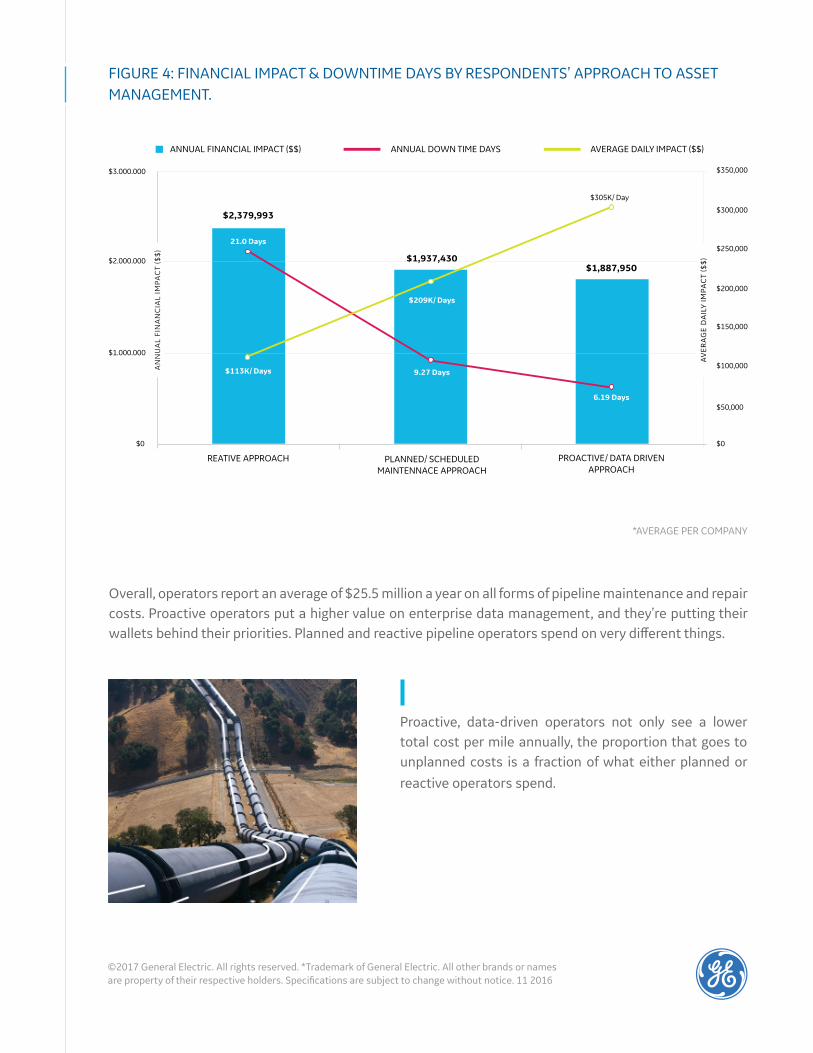
Overall, operators report an average of $25.5 million a year on all forms of pipeline maintenance and repair costs. Proactive operators put a higher value on enterprise data management, and they’re putting their wallets behind their priorities. Planned and reactive pipeline operators spend on very different things.
Proactive, data-driven operators not only see a lower total cost per mile annually, the proportion that goes to unplanned costs is a fraction of what either planned or reactive operators spend.
FIGURE 4: FINANCIAL IMPACT & DOWNTIME DAYS BY RESPONDENTS’ APPROACH TO ASSET MANAGEMENT.
*AVERAGE PER COMPANY
©2017 General Electric. All rights reserved. *Trademark of General Electric. All other brands or names are property of their respective holders. Specifications are subject to change without notice. 11 2016
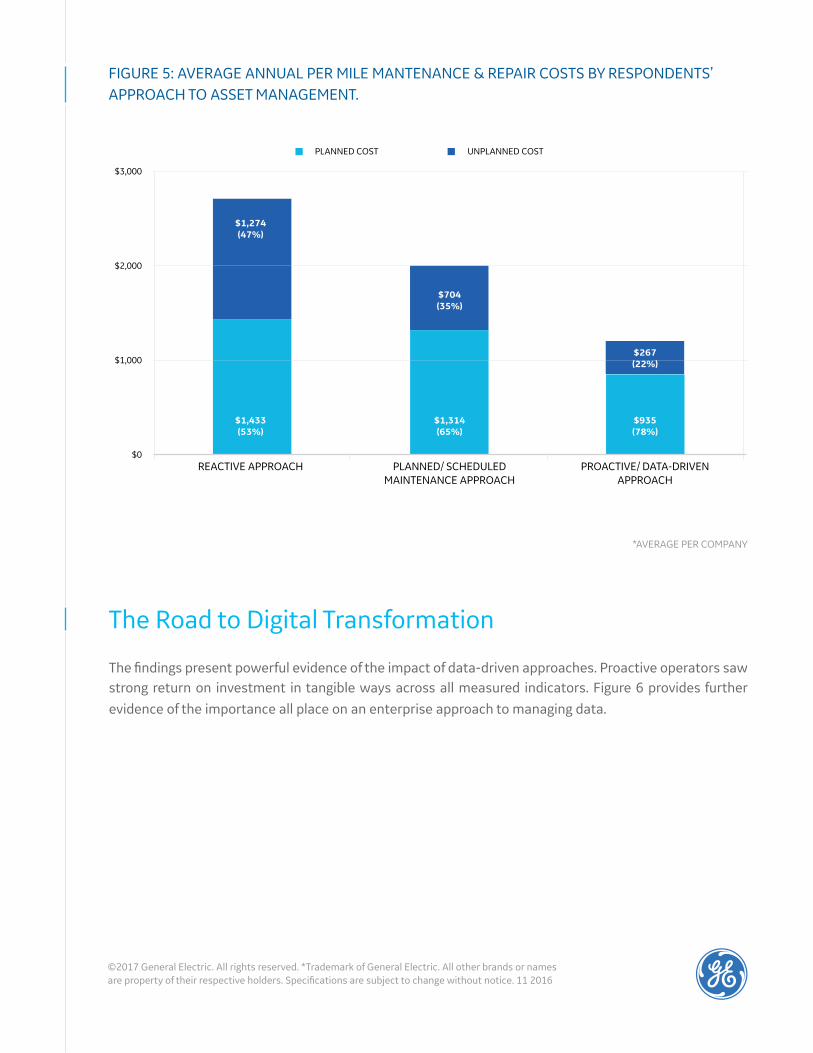
FIGURE 5: AVERAGE ANNUAL PER MILE MANTENANCE & REPAIR COSTS BY RESPONDENTS’ APPROACH TO ASSET MANAGEMENT.
*AVERAGE PER COMPANY
The Road to Digital Transformation
The findings present powerful evidence of the impact of data-driven approaches. Proactive operators saw strong return on investment in tangible ways across all measured indicators. Figure 6 provides further evidence of the importance all place on an enterprise approach to managing data.
©2017 General Electric. All rights reserved. *Trademark of General Electric. All other brands or names are property of their respective holders. Specifications are subject to change without notice. 11 2016
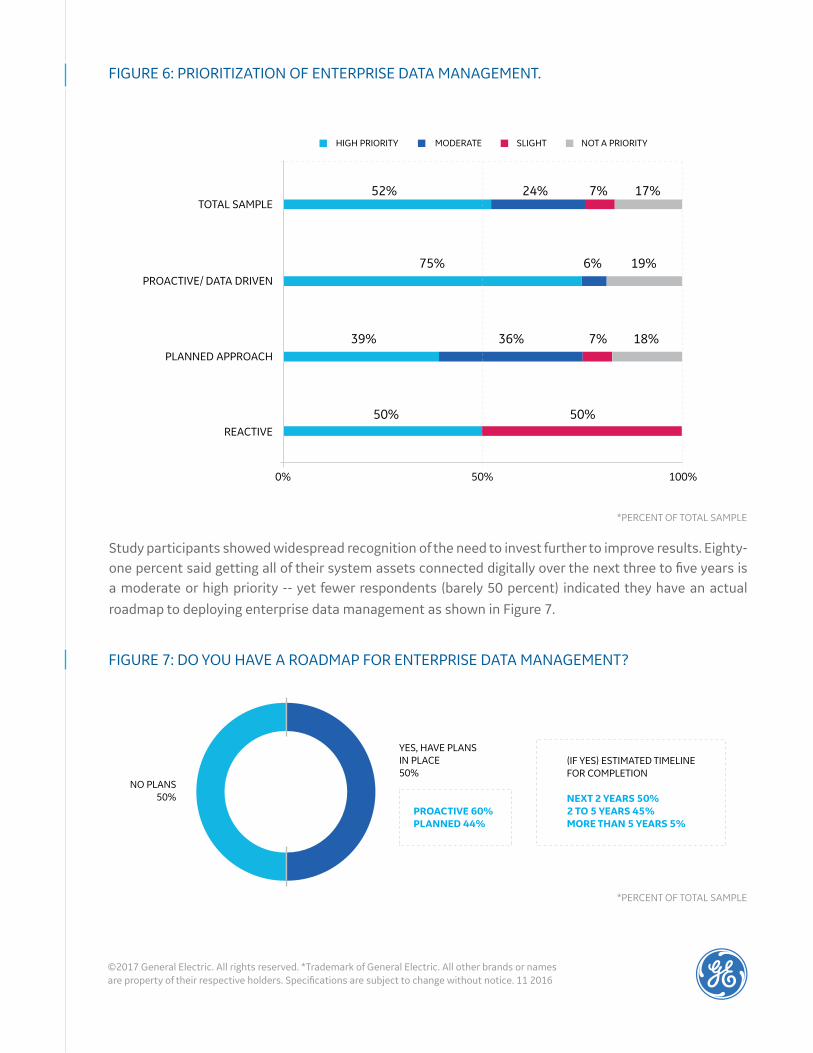
FIGURE 6: PRIORITIZATION OF ENTERPRISE DATA MANAGEMENT.
FIGURE 7: DO YOU HAVE A ROADMAP FOR ENTERPRISE DATA MANAGEMENT?
*PERCENT OF TOTAL SAMPLE
*PERCENT OF TOTAL SAMPLE
Study participants showed widespread recognition of the need to invest further to improve results. Eighty-one percent said getting all of their system assets connected digitally over the next three to five years is a moderate or high priority -- yet fewer respondents (barely 50 percent) indicated they have an actual roadmap to deploying enterprise data management as shown in Figure 7.
©2017 General Electric. All rights reserved. *Trademark of General Electric. All other brands or names are property of their respective holders. Specifications are subject to change without notice. 11 2016
As operators look to optimize performance, they see the possibilities to be gained by bringing data together from across the enterprise – and beyond. Most also report significant obstacles in getting data out of disconnected pockets and from disparate systems that can’t share data readily with each other and bringing it together to reveal insights and prescriptive actions to drive practical, timely and accurate decisions.
Many operators find themselves in a dilemma. On the one hand, there is vital data they need more of; on the other hand, many feel overwhelmed by the amount of information they already have. In its analysis of the research interviews, Kimberlite Research wrote “Many have more data than they are able to optimally leverage via analysis,” noting that as a result, “The operators expressed openness to having additional and improved risk management tools.”
It’s clear from the Kimberlite research that investments in a proactive, data-centric approach to pipeline operations delivers better results in key metrics such as less downtime/reduced throughput, lower maintenance costs, and greater operational control. Pipeline operators indicate a desire to improve through better access to data and the ability to analyze that data yet too few have an actual roadmap to change. Without a clearly defined and actionable plan for enterprise-wide data integration, analysis, and visualization, operators that collect ever more digital data will find themselves deluged and unable to act on the data.
Whether their current approach is reactive, planned, or proactive, pipeline operators can take steps to leverage the power of digital tools to improve safety, reliability and efficiency -- goals that remain the priority for pipeline operators today.
The Industry Speaks
What needs to be done better?
“Our process of collecting information for internal and external corrosion. It’s all done by individual hands-on. We’re trying to figure out a better way to get that data so to identify issues and make decisions quicker.”
“Moving paper files and records into digital system (GIS system) as one large data set that contains all historical data”
“(We would like) real-time stream data and inline inspections data integrated with other data under one common viewer application.”
©2017 General Electric. All rights reserved. *Trademark of General Electric. All other brands or names are property of their respective holders. Specifications are subject to change without notice. 11 2016
©2017 General Electric. All rights reserved. *Trademark of General Electric.All other brands or names are property of their respective holders. Specifications are subject to change without notice. 11 2016
1. Initiate a “What-if?” analysis to quantify potential areas for improvement in pipeline operations including advances in reliability and cost reduction.
2. Conduct a data management gap analysis to prioritize areas for investing in digital technology.
3. Explore the use of advanced analytics to become more predictive and improve accurate and timely decision making. Look both inside and outside the industry for examples of what works.
4. Evaluate options for deploying an Industrial Internet of Things (IIoT) platform that is agnostic of equipment vendors and supports real-time data management, complex data analysis, and enterprise-wide performance visibility.
Contact us to learn about our industry perspectives, customer successes,and innovative digital transformation solutions at [email protected]
Visit us on the webwww.geoilandgas.com
Recommended readinghttp://invent.ge/BuildingPublicTrusthttp://invent.ge/NothingtoReporthttp://invent.ge/TechnologyMagictoKeepPipelinesSafehttp://invent.ge/CorrosionManagementgoesDigital
Twitter: @ge_oilandgas
LinkedIn: https://www.linkedin.com/company/ge-oil-&-gas
Four Steps to Advancing Digital Transformation
Contact us