Embed Size (px)
Citation preview
Digital Representations of TopographicSurfacesJames R. CarterGeography Department, University of Tennessee, Knoxville, TN 37996
ABSTRACT: Although the topographic surface is generally considered to be a mathematically continuous surface, it differsfrom most other continuous surfaces in that it is visible in its details and relatively stable over time. Because we cansee these surfaces and thus compare the actual topographiC surface with the maps we create, we have high standardsfor our topographic maps. To create topographic maps, we subjectively select sample points from a surface we can seeand shape contours to fit the surface. By contrast, what we know about most mathematically continuous surfaces weobtain from samples positioned independently of the shape of the surface. From these sample points we have to infera complete surface. Large-scale topographiC maps are created by either field surveys or photogrammetric compilation.Digital representations of the topography may be in the form of gridded matrices of elevations, series of parallel profiles,digitized contours, or triangulated irregular networks (TINs). Gridded matrices of elevations may give adequate representations of the coarse surface form in areas of high relief, but often do a poor job of defining the details of the landsurface in areas of low relief. Digitized contours, profiles, and TINs, by contrast, can take into account the finer resolutionneeded to define small but important details, and, for this reason, digitized contours, profiles, and TINs are the preferredway to store large-scale topographic surfaces.
INTRODUCTION
A s MAPPING HAS BECOME AUTOMATED, many new processes,procedures, and packages have been developed. Each ap
proach is more appropriate for one type of map capture anddisplay than for another. There are no universal procedures orpackages that serve equally well for all forms of data capture,storage, transformation, and display, nor should we expect thereto be. Before automation many scales and types of maps wereconstructed using a wide range of procedures and techniques,built around various combinations of field survey, stereocompilation, photointerpretation, statistical analysis, and small-scalethematic compilation. For any given type of map, there werecertain expected procedures and practices that would be followed in making the map, and most experienced persons knewwhich procedures and practices were appropriate for each typeof map. With automation it has become less clear in many casesas to which procedures and practices are most appropriate forany given map type, in part because a contour-like map can beproduced with many of the mapping packages in existence.This paper looks at some of the procedures and practices employed in mapping topographic surfaces digitally.
The isoline or contour in its many names is the symbol commonly used to represent the form of a mathematically continuous surface. On such surfaces there is one and only one valueat any point and there are no discontinuities in the surface sothat a slope can be defined everywhere. In spite of the fact thatwe can all think of overhangs and caves in nature, and abutments and walls in the built-up area, where there are breaks inthe land surface, topography is generally considered to be acontinuous surface. Software packages for the processing anddisplay of mathematically continuous surfaces have been withus for many years. Programs to interpolate regular grids of Zvalues from an irregular array of Z-values and to construct isolinemaps were introduced early in the development of computermapping and graphics packages. By 1967 the SYMAP program fromthe Harvard Laboratory for Computer Graphics and Spatial Analysishad an interpolation procedure to permit the generation of isolinemaps. The part of the program that produced such maps wascalled the 'CONTOUR PACKAGE.' The SYMAP program was a verypopular package in academic circles, and many students cut theirteeth on this program (Carter, 1984).
Today, software packages for the interpolation and display
PHOTOGRAMMETRIC ENGINEERING AND REMOTE SENSING,
Vol. 54, No. 11, November 1988, pp. 1577-1580
of continuous surfaces are quite common. CalComp, for example, has long had an interpolation and contour drawing program to output to their vector plotters. SURFACE II is a similarpackage that has been available for more than a decade. RadianCorporation, Dynamic Graphics, Inc., and Zycor, Inc., producepackages of this type targeted largely at the geologic and petroleum communities. The atmospheric sciences have long employed interpolation and contour drawing programs. Most ofthe mainframe graphics packages such as CA-OISSPLA, 01-3000,SAS/GRAPH, and UNlRAS have interpolation functionality. Although the above represent a small sample of such packages,it is evident that there has been and still is a sizeable marketfor computer programs that will interpolate a surface from anirregular array of Z-values and produce contour maps and threedimensional perspective plots.
Many surveyors and topographic cartographers have beencritical of some of these programs because they do not thinkthe programs produce topographic surfaces that look like whatthey think such surfaces should look like. This dissatisfactionis perhaps best captured in the advertisement of the ContourMapping package of Houseman & Associates (n.d.): " ... thecomputer programmers somehow came up with a method calledthe grid cell method for contouring. After surveyors used theseprograms a couple times, they generally trashed the program."Houseman & Associates go on to give five problems with suchprograms including " ...maps with buildings, creeks, andhighways would rarely be contoured correctly..."
TWO DIFFERENT TYPES OF CONTINUOUS SURFACES
The problem is not with the quality of the programs or themathematics, but with the application of the programs to inappropriate data. It can be argued that there are two basic typesof mathematically continuous surfaces. The topographic surfaceis a surface that is visible and shows little change over a periodof days, weeks, months, or even years. All of us have had theexperience of hiking over topographic surfaces and walking alongcontours. We have observed the patterns that streams carve intothe topographic surface. Rules for describing the nature of thetopographic surface have been developed (e.g., 'contours pointupstream.') We take overlapping aerial photographs of the landsurface with which we can view the surface stereoscopically tosee an exaggerated portrayal of the relief. We know topographic
0099-1112/88/5411-1577$02.25/0©1988 American Society for Photogrammetry
and Remote Sensing
1578 PHOTOGRAMMETRIC ENGINEERING & REMOTE SENSING, 1988
surfaces very well and we expect topographic maps to showthese surfaces as we know them. This is particularly true oflarger-scale maps (1:25,000 scale and larger). These demandsare less applicable to the smaller-scale topographic maps wheresurfaces have to be generalized and are thus seen in a moreabstract form.
There are other types of mathematically continuous surfacesthat we choose to map with contours, however, that we cannotsee and that we only know something about by sampling. Theseinclude, for instance, the water table, topographic surfaces ofburied stratigraphy or of relict landscapes. What we know aboutsuch surfaces we know from well cores. Another set of surfacesof this type are meteorological and climatological surfaces. Atmospheric pressure is measured at a very limited number ofpoints around the world, both at the surface and at heightsthroughout the atmosphere. These surfaces, moveover, are dynamic. Even though it may take only an hour to assemble a setof synoptic observations at one site to make the contour mapof atmospheric pressure, the surface will have changed in somesignificant ways by the time the map is made. It would beimpossible to go back and collect a few more values to fill ingaps in the sample array used to interpolate the pressure surface. A monthly temperature map or an annual precipitationmap can only be generated by using values from the few samplesites where data were collected. Even more abstract are surfacesof population potential or income gradients, for these valuesare derived for a point rather than being observed at the point.
For surfaces of the second type there are not as many rulesdescribing what the surfaces should look like. None of us hasseen a 500 millibar pressure surface or a groundwater surface,so we are more willing to accept a mapped surface if it appearsto be reasonable. With surfaces that we cannot see, we cannottell precisely where the ridgelines are or where the valleys are.We have to assume our highest sample values appear along theridgelines and our lowest values define the valleys, but we cannot prove it without collecting much more data and that wecannot do. We hope to know enough about the phenomenathat we are mapping so that we can detect gross aberrations inmaps of these surfaces, but we have no basis to argue oversmall details. As Monmonier (1982) noted "Interpolation is ahighly subjective process, and an estimation procedure is notright or wrong, but merely plausible or absurd."
It is important to realize that the topographic surface standsapart from all of the other mathematically smooth map surfacesin terms of how we can collect data about these surfaces, whatwe know about these surfaces, and what we expect these surfaces to look like. Consequently, many of the computer programs that may serve well to interpolate surfaces and drawisoline maps from any irregular array of z-values are not appropriate for use with topographic data. The only programs thatwe should expect to do a good job of representing the topographic surface are those programs designed to produce digitalterrain models from a very large array of critical points subjectively selected in the field or from aerial photographs (e.g.,points defining breaks in slope, peaks, ridge lines, stream courses,and low points.) Today there are programs of this type, andsome even have the ability to incorporate breaklines where truediscontinuities exist (Thorpe, 1988)
DIGITAL TERRAIN / ELEVATION MODELS
Historically the term Digital Terrain Model (DTM) has beenthe generic term used to refer to any digital representation of atopographic surface (Miller and Leflamme, 1958). Burrough (1986)argues that the term Digital Elevation Model (DEM) is preferrable "for models containing only elevation data" because "'terrain' often implies attributes of a landscape other than the altitudeof the landsurface...." Evans (1980) used the term DigitalGround Model (DGM) for such data sets.
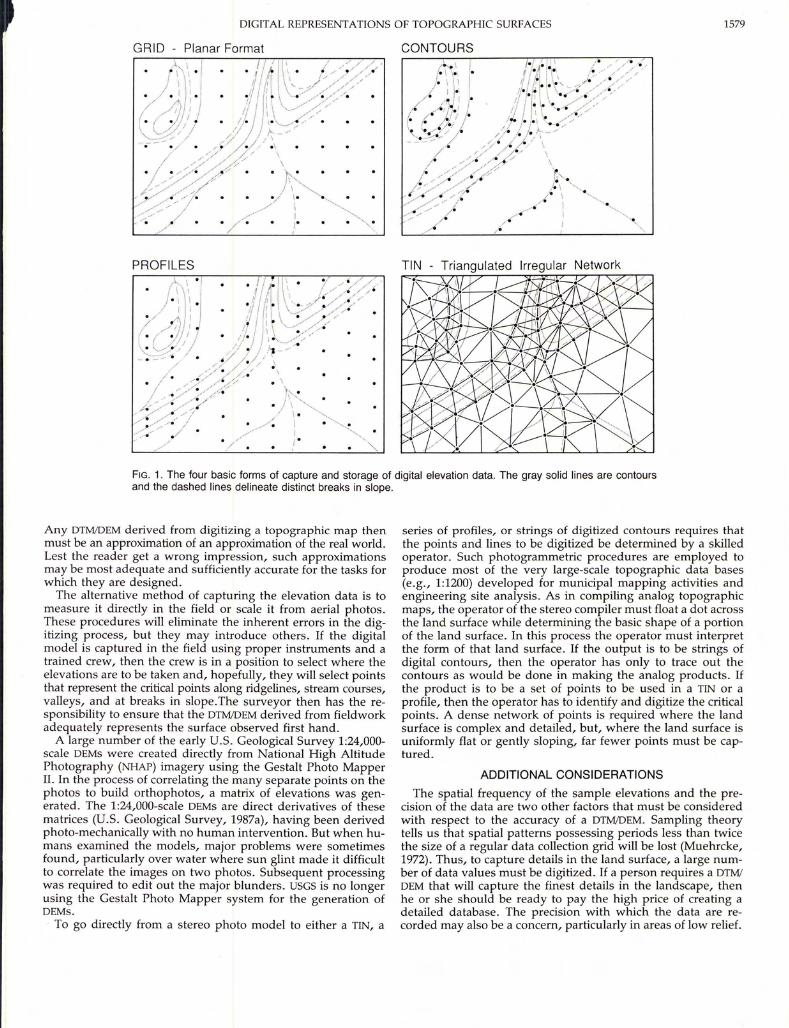
Whether called DEMs, DTMs, or DGMs, these data sets exist inmany forms (Burrough, 1986). Figure 1 illustrates the four generic forms of elevation data capture and storage. The U.s.Geological Survey (USGS, 1987a) produces and distributes gridded matrices of elevations formatted in the coverages of topographic maps. Elevations in the 1:24,000-scale series are spacedin a square grid 30 metres on a side (called the planar format).The 1:250,000-scale series of DEMs were produced by the Defense Mapping Agency and are distributed by USGS. The elevations in this series are in the so-called arc-second format becausethey are spaced 3 arc-seconds apart. The arc-second is nonsquare except at the equator where a unit of latitude and longitude are equal. USGS has chosen to call both series of filesDigital Elevation Models, or DEMs. Similar matrices have alsobeen called Altitude Matrices (Evans, 1980) and surface matrices(Strumbo, 1985).
Another form of elevation data capture is the TriangulatedIrregular Network, or TIN. The TIN is a set of triangular patchesfit to the topographic surface and is based on the principle thata flat plane can be fit to any three non-collinear points. TINs aremade up of irregular triangles connecting what should be critical points on the surface. In broad areas lacking distinct breaksin slope, mass points are collected to give the general form ofthe surface. The topographic surface may also be captured as aseries of profiles showing elevations along parallel strips. Whenbuilt from a stereo-photo model, the points along the profilestrips should be taken at all critical points as well as scatteredacross the surface. When built from an existing topographicmap, points along the profile can only be taken where the profile intersects a contour line. And finally, the surface may berepresented by the digital definition of contour lines with pointscaptured at bends and flexures in the contour lines. Programsexist to go from one form of data storage to another, but witheach transformation information is lost and the definition of thesurface becomes more generalized.
ACCURACY OF DIGITAL MODELS
It is fair to assume that the DTM/DEM in whatever form shouldprovide an accurate representation of the real world land surface. It is difficult, however, to test how accurately any digitalmodel actually captures the real world, for normally we do nothave an independent model of the real world to test our digitalmodel against. To evaluate the accuracy of a DTM/DEM requiresconsideration of how the DTM/DEM is made. One process is tocreate the DTM/DEM by digitizing from existing topographic maps.The other process is to create the DTM/DEM directly from fieldsurveys or from stereocompilation with aerial photography.
The DTM/DEM created directly from a topographic map can beno more accurate than the map from which it was derived. And,because a few errors will always occur in processing data, anyDTM/DEM derived from digitizing a topographic map will be lessaccurate than the source map. How accurate are the contourson topographic maps? The National Map Accuracy Standardsstate: "At least 90 percent of all elevations determined fromsolid-line contours shall be accurate within one-half the contourinterval, and the remaining 10 percent shall be accurate withinone contour interval. Any contour that could be brought withinthis accuracy tolerance by shifting its location l!40th inch (theallowable horizontal error) will be considered to be acceptable."(U.S. Geological Survey, 1987b). Obviously, it is quite difficultto test the accuracy of contours without extensive field surveys.
There are enough first-hand stories by topographic map compilers to confirm that most topographic maps have some humansubjectivity in them where the compiler could not get a goodreading from the stereo model or where the contours were shapedto "look like contours are suppose to look." This subjectivity,in addition to the inherent sources of error, means that ourtopographic maps are but an approximation of the real world.
DIGITAL REPRESENTATIONS OF TOPOGRAPHIC SURFACES 1579
GRID - Planar Format
PROFILES
CONTOURS
FIG. 1. The four basic forms of capture and storage of digital elevation data. The gray solid lines are contoursand the dashed lines delineate distinct breaks in slope.
Any OTM/DEM derived from digitizing a topographic map thenmust be an approximation of an approximation of the real world.Lest the reader get a wrong impression, such approximationsmay be most adequate and sufficiently accurate for the tasks forwhich they are designed.
The alternative method of capturing the elevation data is tomeasure it directly in the field or scale it from aerial photos.These procedures will eliminate the inherent errors in the digitizing process, but they may introduce others. If the digitalmodel is captured in the field using proper instruments and atrained crew, then the crew is in a position to select where theelevations are to be taken and, hopefully, they will select pointsthat represent the critical points along ridgelines, stream courses,valleys, and at breaks in slope.The surveyor then has the responsibility to ensure that the OTM/DEM derived from fieldworkadequately represents the surface observed first hand.
A large number of the early U.S. Geological Survey 1:24,000scale OEMs were created directly from National High AltitudePhotography (NHAP) imagery using the Gestalt Photo MapperII. In the process of correlating the many separate points on thephotos to build orthophotos, a matrix of elevations was generated. The 1:24,000-scale OEMs are direct derivatives of thesematrices (U.S. Geological Survey, 1987a), having been derivedphoto-mechanically with no human intervention. But when humans examined the models, major problems were sometimesfound, particularly over water where sun glint made it difficultto correlate the images on two photos. Subsequent processingwas required to edit out the major blunders. USGS is no longerusing the Gestalt Photo Mapper system for the generation ofOEMs.
To go directly from a stereo photo model to either a TIN, a
series of profiles, or strings of digitized contours requires thatthe points and lines to be digitized be determined by a skilledoperator. Such photogrammetric procedures are employed toproduce most of the very large-scale topographic data bases(e.g., 1:1200) developed for municipal mapping activities andengineering site analysis. As in compiling analog topographicmaps, the operator of the stereo compiler must float a dot acrossthe land surface while determining the basic shape of a portionof the land surface. In this process the operator must interpretthe form of that land surface. If the output is to be strings ofdigital contours, then the operator has only to trace out thecontours as would be done in making the analog products. Ifthe product is to be a set of points to be used in a TIN or aprofile, then the operator has to identify and digitize the criticalpoints. A dense network of points is required where the landsurface is complex and detailed, but, where the land surface isuniformly flat or gently sloping, far fewer points must be captured.
ADDITIONAL CONSIDERATIONS
The spatial frequency of the sample elevations and the precision of the data are two other factors that must be consideredwith respect to the accuracy of a OTM/DEM. Sampling theorytells us that spatial patterns possessing periods less than twicethe size of a regular data collection grid will be lost (Muehrcke,1972). Thus, to capture details in the land surface, a large number of data values must be digitized. If a person requires a OTM/OEM that will capture the finest details in the landscape, thenhe or she should be ready to pay the high price of creating adetailed database. The precision with which the data are recorded may also be a concern, particularly in areas of low relief.
1580 PHOTOGRAMMETRIC ENGINEERING & REMOTE SENSING, 1988
If elevations are specified only to the nearest metre, then thedetails of fairly gentle slopes may be lost or over emphasizedby rounding to a whole number. As with the spatial frequency,the greater the precision demanded the greater the cost.
Finally, the availability, cost, and friendliness of software required to convert the data from whatever form the DTM/DEM isin into useful products and to integrate the DTM/DEM in withother elements in a GIS must be considered. Whether the digitalmodel exists as a TIN, a series of profiles, strings of digitizedcontours, or matrices of elevations, users need to be able toderive indices and maps that can be used to address specificquestions. A variety of indices can be derived from a DTM/DEM,including measures of slope, aspect, and elevation in manycombinations. The DTM/DEM can also provide information onvisibility of one place from another (viewsheds), site and routeselection, cut and fill volumes, surface water routing, and areasof potential flooding if appropriate software is available.
CONCLUSION
Our ability to observe, photograph, and walk over the landsurface makes it different from all of the other mathematicallycontinuous surfaces we map. We know, or at least we think weknow, what topographic surfaces look like. For this reason computer programs written to interpolate a surface from an irregular array of sample points are generally not appropriate fordefining and representing the land surface.
Digital Terrain/Elevation Models may be created by eitherdigitizing existing topographic maps, collecting elevations withfield surveys, or as a product of photogrammetric stereocompilation. The elevations in a DTM/DEM may be stored as a rectangular matrix (elevation, altitude, or surface matrix), as aTriangulated Irregular Network (TIN), as a series of profiles, oras digitized strings of contour lines. TINs, profiles, and digitizedcontours reflect some of the subjectivity exercised by the persondoing the stereocompilation or the surveyor who captured pointsas he or she interpreted the land form in creating the digitalmodel. Regular grids of elevations, because they do not containthis subjectivity and because they cannot vary in spatial resolution, may poorly define the land form in areas of gentle slopeor complex relief.
The purpose to which the digital model will be applied shouldgovern the resolution, accuracy, and precision of the DTM/DEM.In the U.s., the Geological Survey has a program to make digitalelevation models available for the entire country at two scalesof resolution. For large-scale municipal mapping these modelswill generally have little utility. Therefore, designers of largescale geographic information systems will probably have to contract to have digital terrain/elevation models created. The software available to the user should be considered when decidingwhether to have the digital model delivered as a TIN, series ofprofiles, elevation matrix, or strings of contours.
REFERENCES
Burrough, P. A., 1986. Principles of Geographical Information Systems forLand Resources Assessment. Oxford: Clarendon Press.
Carter, Janes R., 1984. Computer Mapping: Progress in the '80s. Washington, D.C.: Association of American Geographers, Resource Paper.
Evans, Ian S., 1980. "An Integrated System of Terrain Analysis andSlope Mapping," Zeitschrift fur Geomorphology, N.F., Suppl. -Bd. 36,pp. 274-295.
Houseman & Associates, no date. flier for PC CAD-Contouring. Cypress, Texas: Houseman & Associates.
Miller, C. L., and R. A. Laflamme, 1958. The Digital Terrain ModelTheory and Application, Photogrammetric Engineering, pp. 433-422.
Monmonier, Mark S., 1982. Computer-Assisted Cartography: Principles andProspects. Englewood Cliffs, N.J.: Prentice-Hall, Inc.
Muehrcke, Phillip, 1972. Thematic Cartography. Washington, D.C.: Association of American Geographers, Resource Paper No. 19.
Strumbo, Cheryl, 1985. PACSOFT: Ideas into Reality. Professional Surveyor, Vol, 5, No.5, pp. 43-48.
Thorpe, John A., 1988. Contour Interpolation in Large Scale UrbanMapping Systems, Technical Papers, 1988 ACSM-ASPRS Annual Convention, pp. 61-68.
U.s. Geological Survey, 1987a. Digital Elevation Models, Data Users Guide5, National Mapping Program, Technical Instructions. Reston, Virginia: U.s. Geological Survey.
--, 1987b. Large-Scale Mapping Guidelines, USGS Open File Report86-005. Falls Church, Virginia: American Society for Photogrammetry and Remote Sensing and the American Congress on Surveying and Mapping.
FAST SPECTRAL SCANNERS
For real time analysisSE490
APPLICATIONS:• Reflectance of materials• Remote sensing• Agricultural• ForestryField·Portable Data-Logging
SE590
SPECTRON ENGINEERING offers you the solution
V' 180 thru 2S00nm rangeV' 40000:1 dynamic rangeV' .01 FL minimum sensitivityV' spectrum acquired in SOOus
ISPECTRDN ENGINEERINGI 800 West 9th Avenue Denver, Colorado 80204 (303) 623-8987