Embed Size (px)
Citation preview

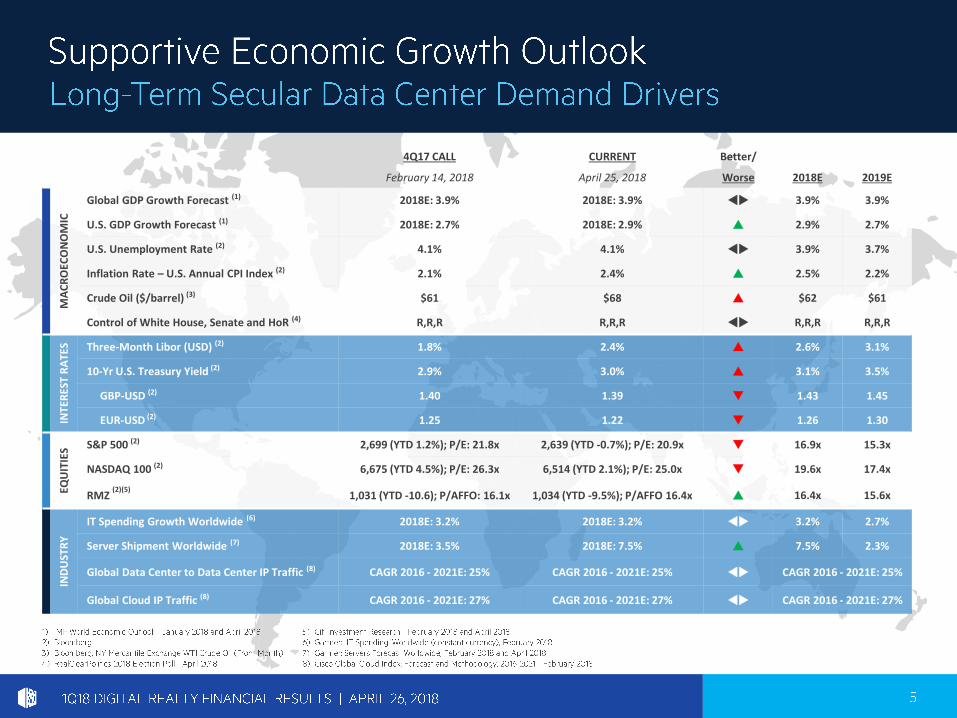
4Q17 CALL CURRENT Better/
February 14, 2018 April 25, 2018 Worse 2018E 2019E
MA
CR
OEC
ON
OM
IC
Global GDP Growth Forecast (1) 2018E: 3.9% 2018E: 3.9% tu 3.9% 3.9%
U.S. GDP Growth Forecast (1) 2018E: 2.7% 2018E: 2.9% p 2.9% 2.7%
U.S. Unemployment Rate (2) 4.1% 4.1% tu 3.9% 3.7%
Inflation Rate – U.S. Annual CPI Index (2) 2.1% 2.4% p 2.5% 2.2%
Crude Oil ($/barrel) (3) $61 $68 p $62 $61
Control of White House, Senate and HoR (4) R,R,R R,R,R tu R,R,R R,R,R
INTE
RES
TR
ATE
S Three-Month Libor (USD) (2) 1.8% 2.4% p 2.6% 3.1%
10-Yr U.S. Treasury Yield (2) 2.9% 3.0% p 3.1% 3.5%
GBP-USD (2) 1.40 1.39 q 1.43 1.45
EUR-USD (2) 1.25 1.22 q 1.26 1.30
EQU
ITIE
S S&P 500 (2) 2,699 (YTD 1.2%); P/E: 21.8x 2,639 (YTD -0.7%); P/E: 20.9x q 16.9x 15.3x
NASDAQ 100 (2) 6,675 (YTD 4.5%); P/E: 26.3x 6,514 (YTD 2.1%); P/E: 25.0x q 19.6x 17.4x
RMZ (2)(5)
1,031 (YTD -10.6); P/AFFO: 16.1x 1,034 (YTD -9.5%); P/AFFO 16.4x p 16.4x 15.6x
IND
UST
RY
IT Spending Growth Worldwide (6) 2018E: 3.2% 2018E: 3.2% tu 3.2% 2.7%
Server Shipment Worldwide (7) 2018E: 3.5% 2018E: 7.5% p 7.5% 2.3%
Global Data Center to Data Center IP Traffic (8) CAGR 2016 - 2021E: 25% CAGR 2016 - 2021E: 25% tu CAGR 2016 - 2021E: 25%
Global Cloud IP Traffic (8) CAGR 2016 - 2021E: 27% CAGR 2016 - 2021E: 27% tu CAGR 2016 - 2021E: 27%

▪ ▪ ▪ ▪
▪
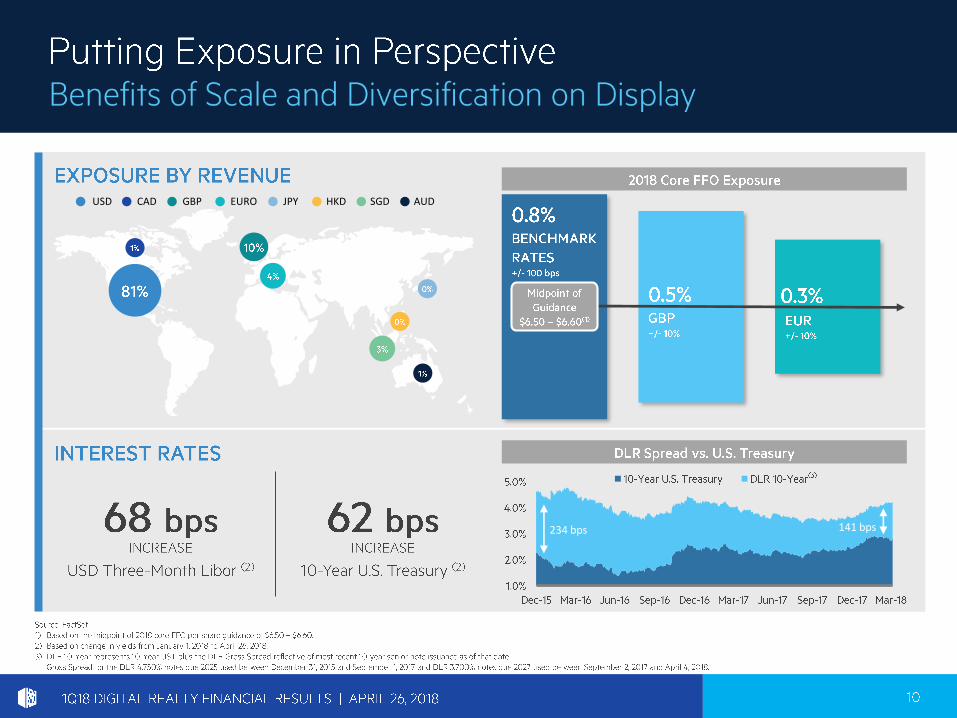
USD CAD GBP EURO JPY HKD SGD AUD
234 bps 141 bps
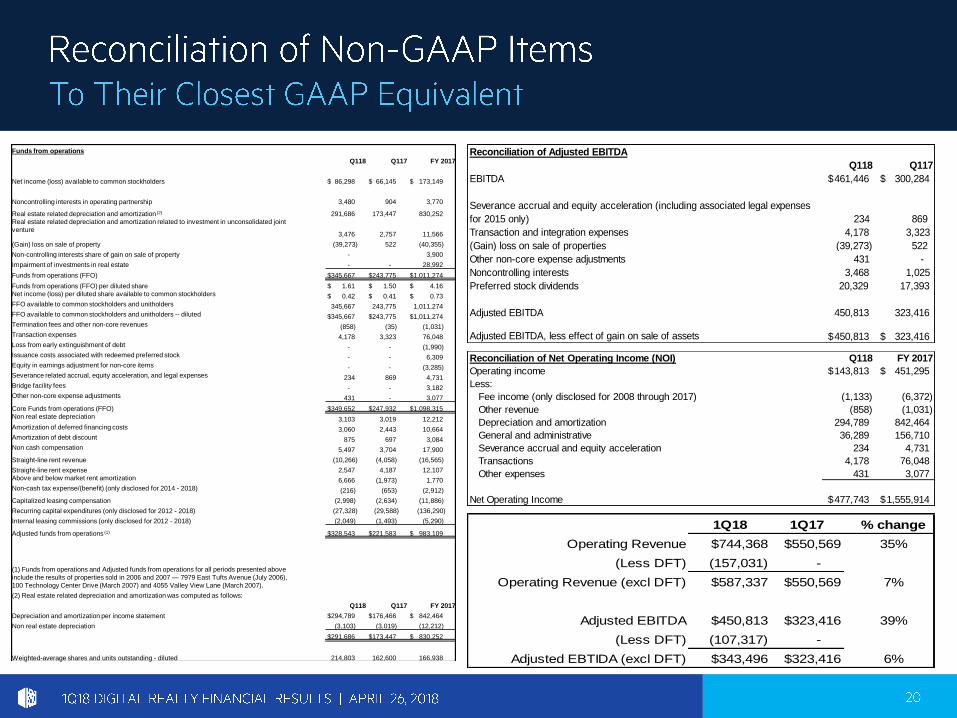
Funds from operations
Q118 Q117 FY 2017
Net income (loss) available to common stockholders $ 86,298 $ 66,145 $ 173,149
Noncontrolling interests in operating partnership 3,480 904 3,770
Real estate related depreciation and amortization (2) 291,686 173,447 830,252
Real estate related depreciation and amortization related to investment in unconsolidated joint
venture3,476 2,757 11,566
(Gain) loss on sale of property (39,273) 522 (40,355)
Non-controlling interests share of gain on sale of property - 3,900
Impairment of investments in real estate - - 28,992
Funds from operations (FFO) $345,667 $243,775 $1,011,274
Funds from operations (FFO) per diluted share $ 1.61 $ 1.50 $ 4.16
Net income (loss) per diluted share available to common stockholders $ 0.42 $ 0.41 $ 0.73
FFO available to common stockholders and unitholders 345,667 243,775 1,011,274
FFO available to common stockholders and unitholders -- diluted $345,667 $243,775 $1,011,274
Termination fees and other non-core revenues (858) (35) (1,031)
Transaction expenses 4,178 3,323 76,048
Loss from early extinguishment of debt - - (1,990)
Issuance costs associated with redeemed preferred stock - - 6,309
Equity in earnings adjustment for non-core items - - (3,285)
Severance related accrual, equity acceleration, and legal expenses 234 869 4,731
Bridge facility fees - - 3,182
Other non-core expense adjustments 431 - 3,077
Core Funds from operations (FFO) $349,652 $247,932 $1,098,315
Non real estate depreciation 3,103 3,019 12,212
Amortization of deferred financing costs 3,060 2,443 10,664
Amortization of debt discount 875 697 3,084
Non cash compensation 5,497 3,704 17,900
Straight-line rent revenue (10,266) (4,058) (16,565)
Straight-line rent expense 2,547 4,187 12,107
Above and below market rent amortization 6,666 (1,973) 1,770
Non-cash tax expense/(benefit) (only disclosed for 2014 - 2018) (216) (653) (2,912)
Capitalized leasing compensation (2,998) (2,634) (11,886)
Recurring capital expenditures (only disclosed for 2012 - 2018) (27,328) (29,588) (136,290)
Internal leasing commissions (only disclosed for 2012 - 2018) (2,049) (1,493) (5,290)
Adjusted funds from operations (1) $328,543 $221,583 $ 983,109
(1) Funds from operations and Adjusted funds from operations for all periods presented above
include the results of properties sold in 2006 and 2007 — 7979 East Tufts Avenue (July 2006),
100 Technology Center Drive (March 2007) and 4055 Valley View Lane (March 2007).
(2) Real estate related depreciation and amortization was computed as follows:
Q118 Q117 FY 2017
Depreciation and amortization per income statement $294,789 $176,466 $ 842,464
Non real estate depreciation (3,103) (3,019) (12,212)
$291,686 $173,447 $ 830,252
Weighted-average shares and units outstanding - diluted 214,803 162,600 166,938
Reconciliation of Adjusted EBITDA
Q118 Q117
EBITDA 461,446$ 300,284$
Severance accrual and equity acceleration (including associated legal expenses
for 2015 only) 234 869
Transaction and integration expenses 4,178 3,323
(Gain) loss on sale of properties (39,273) 522
Other non-core expense adjustments 431 -
Noncontrolling interests 3,468 1,025
Preferred stock dividends 20,329 17,393
Adjusted EBITDA 450,813 323,416
Adjusted EBITDA, less effect of gain on sale of assets 450,813$ 323,416$
Reconciliation of Net Operating Income (NOI) Q118 FY 2017
Operating income 143,813$ 451,295$
Less:
Fee income (only disclosed for 2008 through 2017) (1,133) (6,372)
Other revenue (858) (1,031)
Depreciation and amortization 294,789 842,464
General and administrative 36,289 156,710
Severance accrual and equity acceleration 234 4,731
Transactions 4,178 76,048
Other expenses 431 3,077
Net Operating Income 477,743$ 1,555,914$
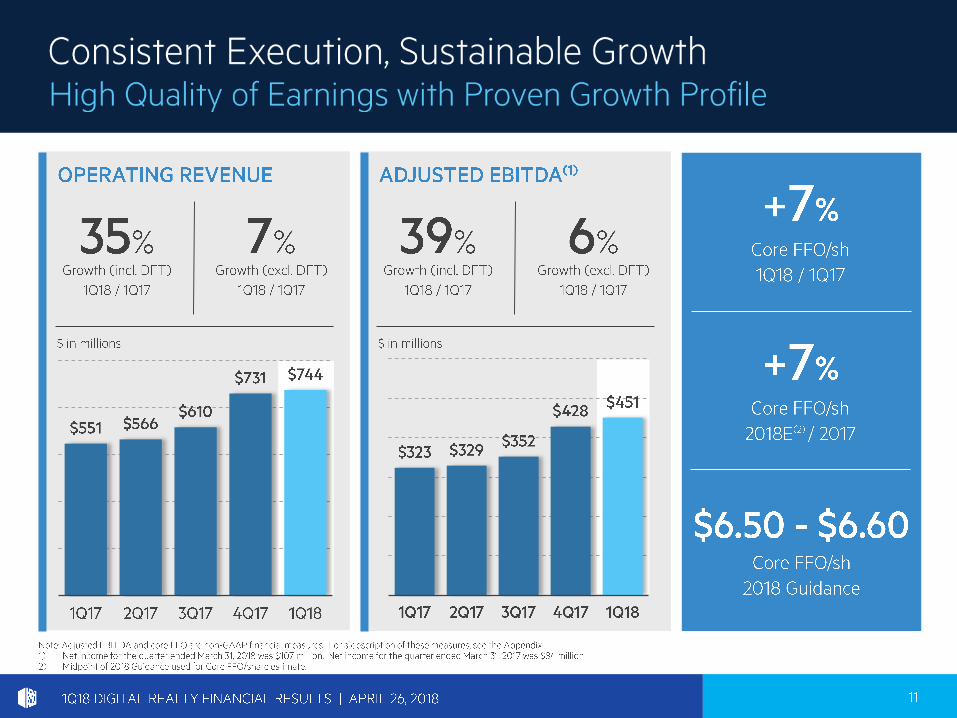
1Q18 1Q17 % change
Operating Revenue $744,368 $550,569 35%
(Less DFT) (157,031) -
Operating Revenue (excl DFT) $587,337 $550,569 7%
Adjusted EBITDA $450,813 $323,416 39%
(Less DFT) (107,317) -
Adjusted EBTIDA (excl DFT) $343,496 $323,416 6%