Embed Size (px)
Citation preview
1
White PAPeR GReAteR AReA of the City of LA PAz, BoLiviA
Digital photogrammetry project with very high-resolution stereo pairs acquired by DigitalGlobe, inc. satellite Worldview-2By: engineers Nelson Mattie, Alexis Piña, Ramón López, and Leonel Perozo
SummaryA digital photogrammetry study was conducted on an area of 750 Has in the city of La Paz, Bolivia. The project’s aim was to perform a survey with level curves equidistant at 1m and to render in 3D elements such as roads, hydrography, vegetation, and buildings. Also a digital terrain model (DTM) on a one (1) square meter resolution grid was produced. All of the foregoing is generated by means of photogrammetric processing of 50 cm resolution stereo pairs from the WorldView-2 satellite. Accuracy results of coordinates (X, Y) for all the area was less than 38 cm RMSE and elevation accuracy (Z) for all the area was 29 cm RMSE and determined by 5 main geodesic survey points for triangulation, 50 geodesic control points measured in the field by means of GPS and electronic level, and 35 checkpoints. These geodesic control points were used for aerial triangulation and altimetric leveling of stereo pairs. The difference between values (X, Y, Z) from the 50 points measured in the field and the points measured in the stereo block or model was 2.8 cm RMSE. By means of these state-of-the-art digital sensors, and by employing advanced mathematical models (software), the precision obtained by our satellite’s photogrammetric products is similar to that obtained through conventional topographic processes. The applications for our products range from highway planning to management of agricultural production, feasibility studies for hydroelectric stations, urban planning, environmental analysis, land registries, oil surveying, or road infrastructure projects among others.
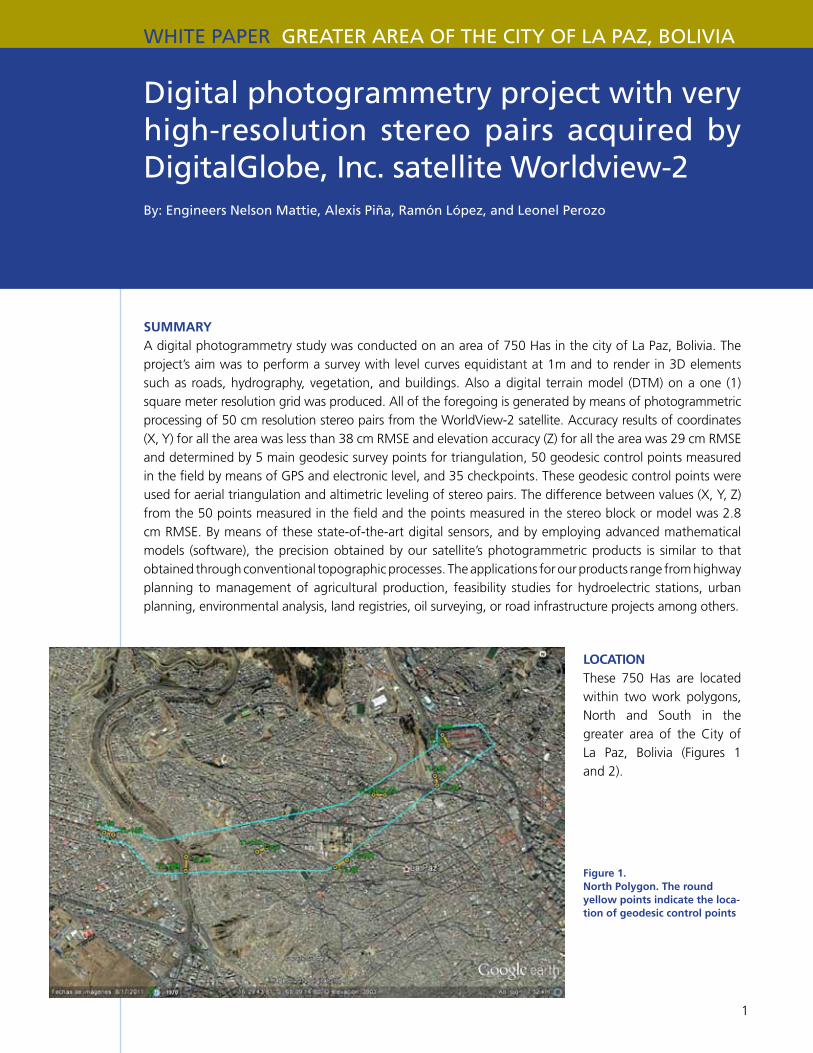
LocationThese 750 Has are located within two work polygons, North and South in the greater area of the City of La Paz, Bolivia (Figures 1 and 2).
Figure 1. north Polygon. the round yellow points indicate the loca-tion of geodesic control points
2
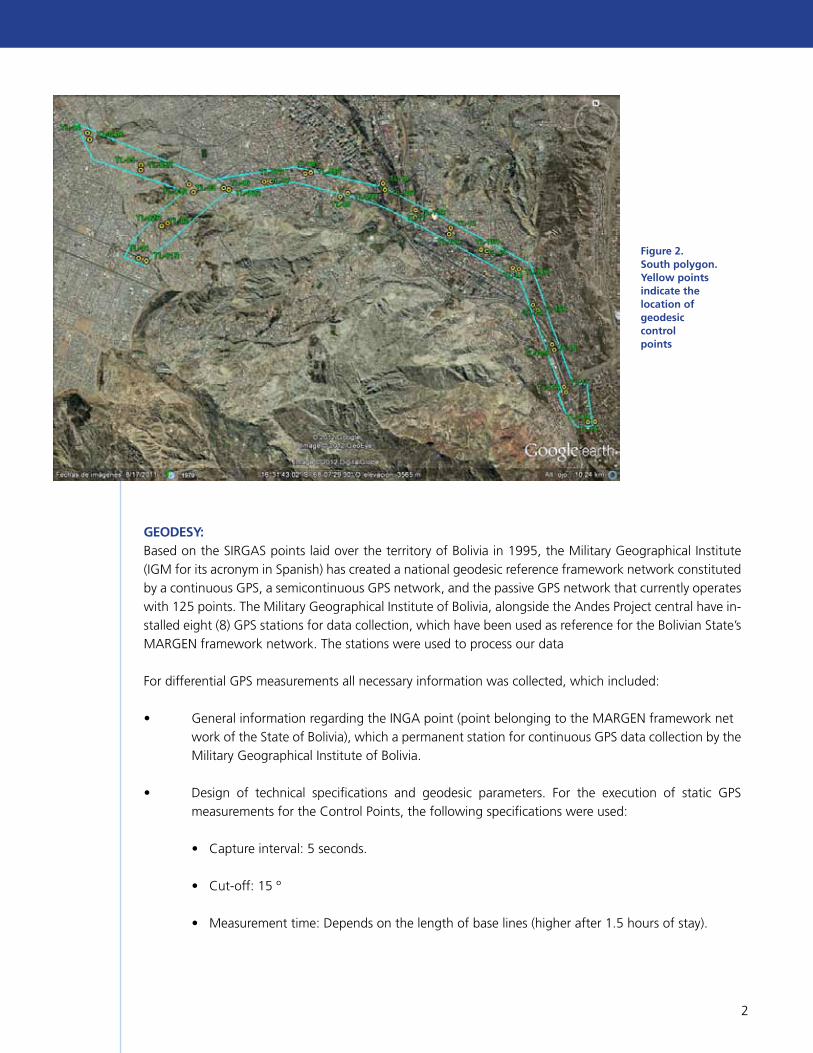
Figure 2. South polygon. yellow points indicate the location of geodesic control points
GeodeSy: Based on the SIRGAS points laid over the territory of Bolivia in 1995, the Military Geographical Institute (IGM for its acronym in Spanish) has created a national geodesic reference framework network constituted by a continuous GPS, a semicontinuous GPS network, and the passive GPS network that currently operates with 125 points. The Military Geographical Institute of Bolivia, alongside the Andes Project central have in-stalled eight (8) GPS stations for data collection, which have been used as reference for the Bolivian State’s MARGEN framework network. The stations were used to process our data
For differential GPS measurements all necessary information was collected, which included:
• GeneralinformationregardingtheINGApoint(pointbelongingtotheMARGENframeworknet work of the State of Bolivia), which a permanent station for continuous GPS data collection by the Military Geographical Institute of Bolivia.
• Design of technical specifications and geodesic parameters. For the execution of static GPS measurements for the Control Points, the following specifications were used:
•Captureinterval:5seconds.
•Cut-off:15º
•Measurementtime:Dependsonthelengthofbaselines(higherafter1.5hoursofstay).
3
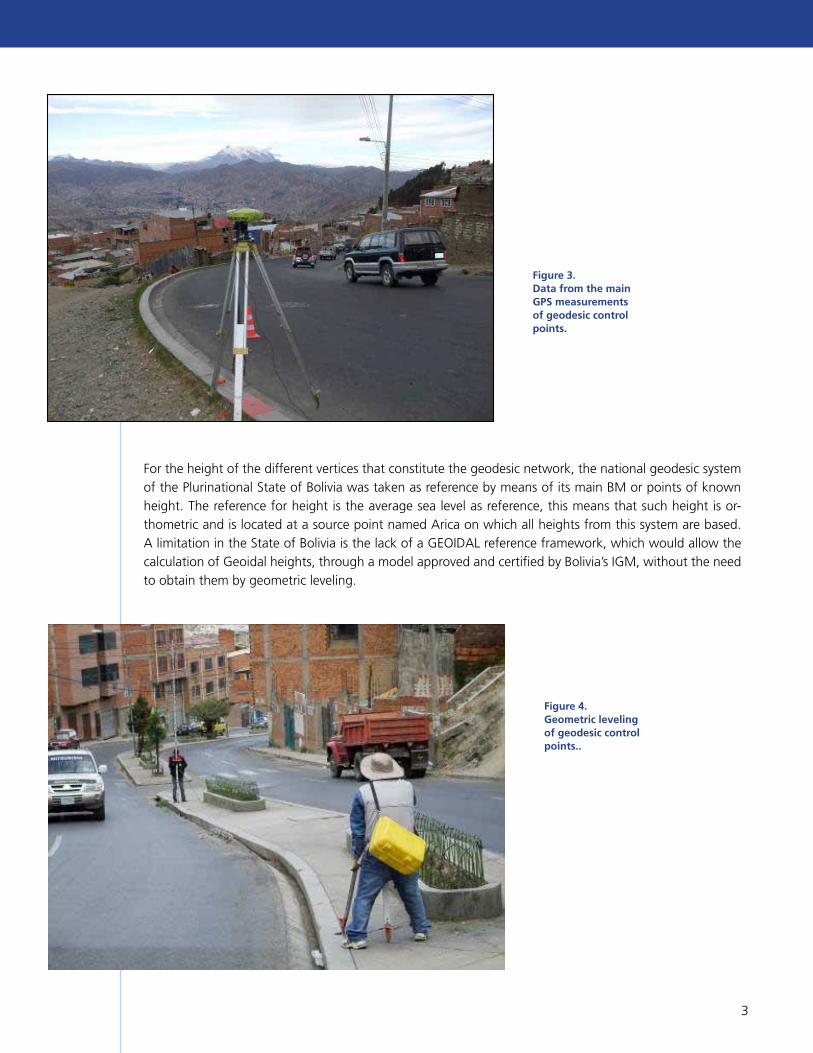
Figure 3. data from the main GPS measurements of geodesic control points.
For the height of the different vertices that constitute the geodesic network, the national geodesic system of the Plurinational State of Bolivia was taken as reference by means of its main BM or points of known height. The reference for height is the average sea level as reference, this means that such height is or-thometric and is located at a source point named Arica on which all heights from this system are based. A limitation in the State of Bolivia is the lack of a GEOIDAL reference framework, which would allow the calculation of Geoidal heights, through a model approved and certified by Bolivia’s IGM, without the need to obtain them by geometric leveling.
Figure 4. Geometric leveling of geodesic control points..
4
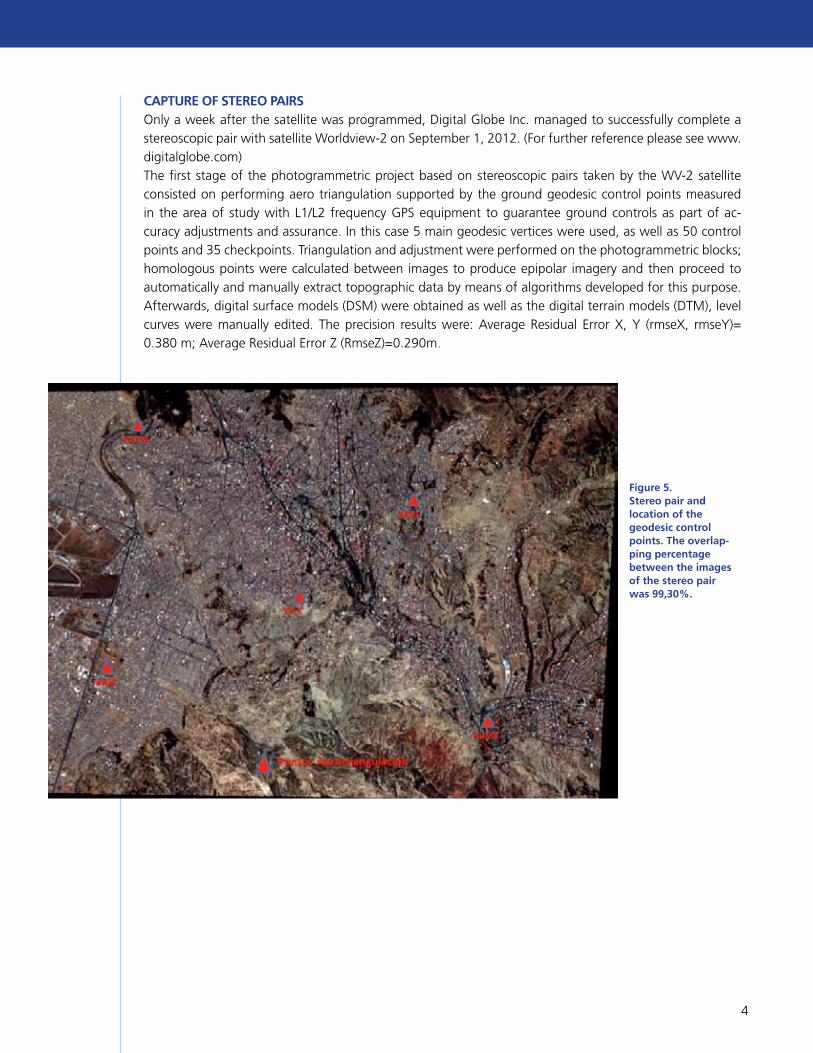
caPture oF Stereo PairSOnly a week after the satellite was programmed, Digital Globe Inc. managed to successfully complete a stereoscopic pair with satellite Worldview-2 on September 1, 2012. (For further reference please see www.digitalglobe.com)The first stage of the photogrammetric project based on stereoscopic pairs taken by the WV-2 satellite consisted on performing aero triangulation supported by the ground geodesic control points measured in the area of study with L1/L2 frequency GPS equipment to guarantee ground controls as part of ac-curacy adjustments and assurance. In this case 5 main geodesic vertices were used, as well as 50 control points and 35 checkpoints. Triangulation and adjustment were performed on the photogrammetric blocks; homologous points were calculated between images to produce epipolar imagery and then proceed to automaticallyandmanuallyextracttopographicdatabymeansofalgorithmsdevelopedforthispurpose.Afterwards, digital surface models (DSM) were obtained as well as the digital terrain models (DTM), level curves were manually edited. The precision results were: Average Residual Error X, Y (rmseX, rmseY)= 0.380 m; Average Residual Error Z (RmseZ)=0.290m.
Figure 5. Stereo pair and location of the geodesic control points. the overlap-ping percentage between the images of the stereo pair was 99,30%.
5
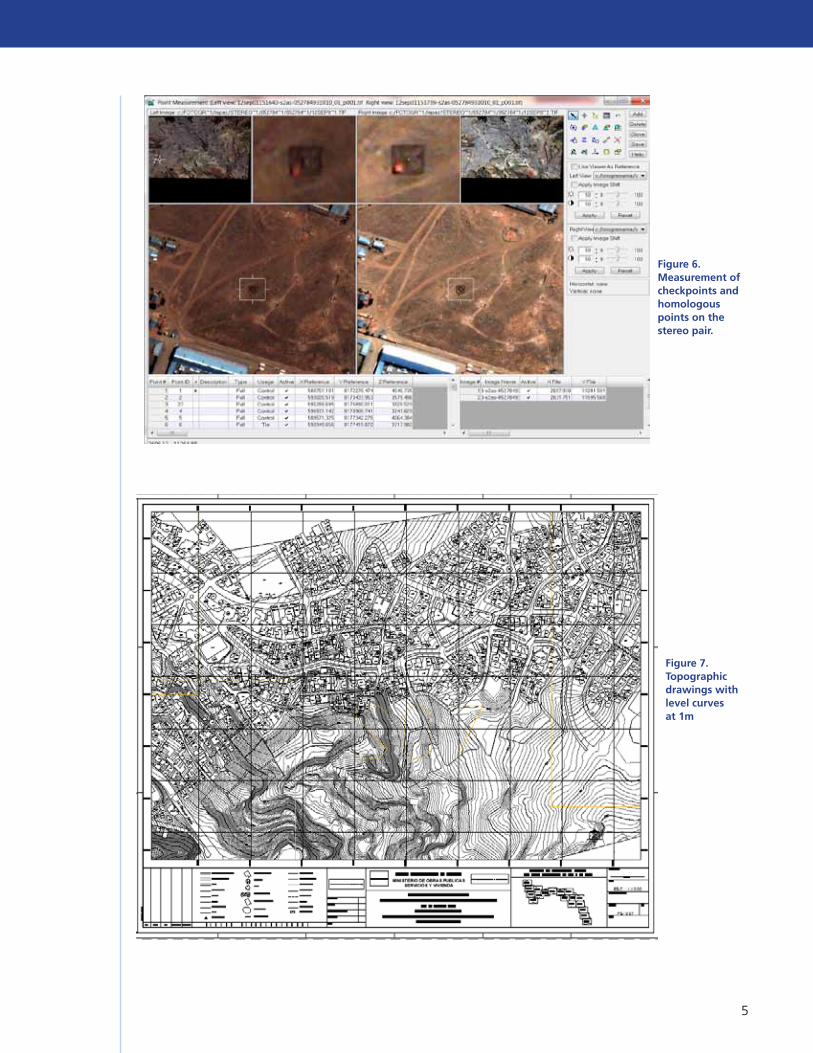
Figure 6. measurement of checkpoints and homologous points on the stereo pair.
Figure 7. topographic drawings with level curves at 1m
6
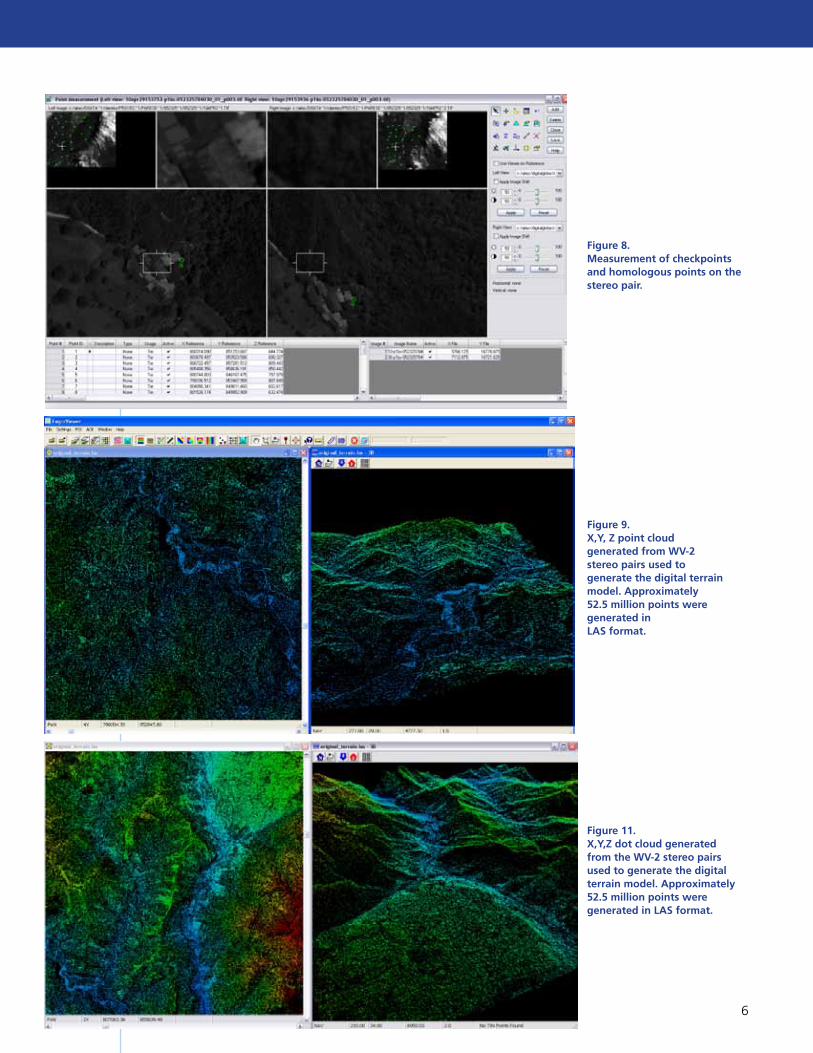
Figure 8. measurement of checkpoints and homologous points on the stereo pair.
Figure 9. X,y, Z point cloud generated from WV-2 stereo pairs used to generate the digital terrain model. approximately 52.5 million points were generated in LaS format.
Figure 11. X,y,Z dot cloud generated from the WV-2 stereo pairs used to generate the digital terrain model. approximately 52.5 million points were generated in LaS format.
7
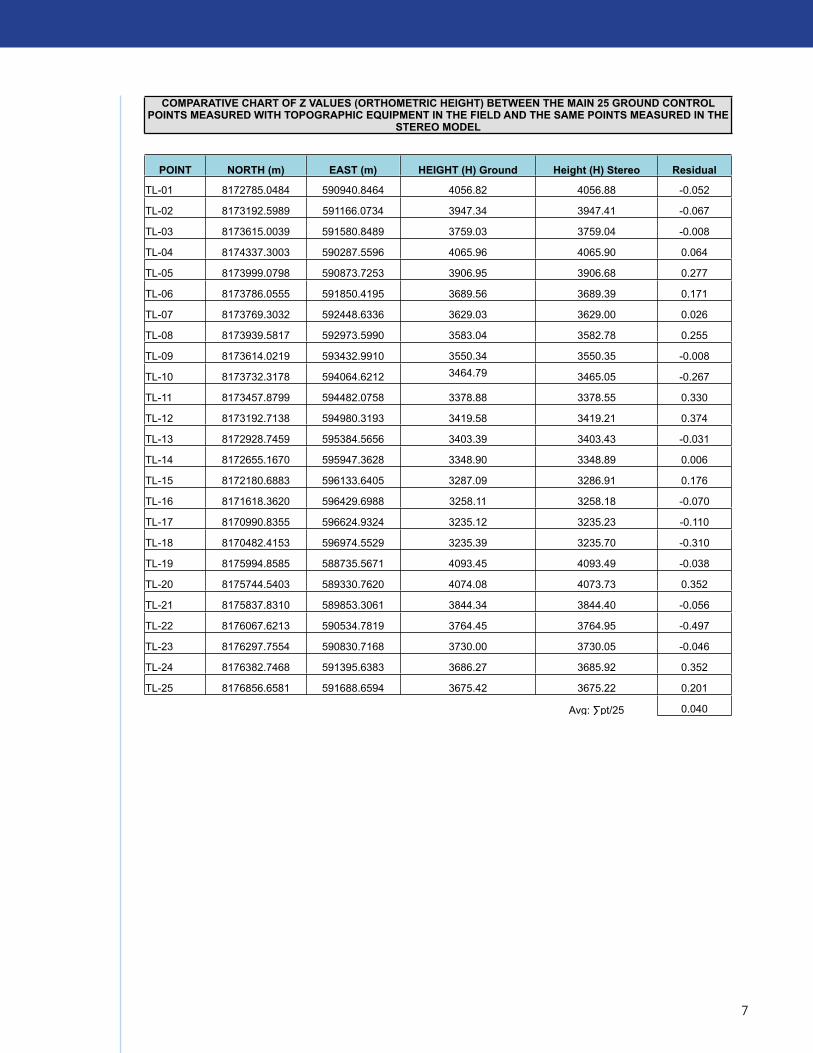
COMPARATIVE CHART OF Z VALUES (ORTHOMETRIC HEIGHT) BETWEEN THE MAIN 25 GROUND CONTROL POINTS MEASURED WITH TOPOGRAPHIC EQUIPMENT IN THE FIELD AND THE SAME POINTS MEASURED IN THE
STEREO MODEL
POINT NORTH (m) EAST (m) HEIGHT (H) Ground Height (H) Stereo Residual
TL-01 8172785.0484 590940.8464 4056.82 4056.88 -0.052
TL-02 8173192.5989 591166.0734 3947.34 3947.41 -0.067
TL-03 8173615.0039 591580.8489 3759.03 3759.04 -0.008
TL-04 8174337.3003 590287.5596 4065.96 4065.90 0.064
TL-05 8173999.0798 590873.7253 3906.95 3906.68 0.277
TL-06 8173786.0555 591850.4195 3689.56 3689.39 0.171
TL-07 8173769.3032 592448.6336 3629.03 3629.00 0.026
TL-08 8173939.5817 592973.5990 3583.04 3582.78 0.255
TL-09 8173614.0219 593432.9910 3550.34 3550.35 -0.008
TL-10 8173732.3178 594064.6212 3464.79 3465.05 -0.267
TL-11 8173457.8799 594482.0758 3378.88 3378.55 0.330
TL-12 8173192.7138 594980.3193 3419.58 3419.21 0.374
TL-13 8172928.7459 595384.5656 3403.39 3403.43 -0.031
TL-14 8172655.1670 595947.3628 3348.90 3348.89 0.006
TL-15 8172180.6883 596133.6405 3287.09 3286.91 0.176
TL-16 8171618.3620 596429.6988 3258.11 3258.18 -0.070
TL-17 8170990.8355 596624.9324 3235.12 3235.23 -0.110
TL-18 8170482.4153 596974.5529 3235.39 3235.70 -0.310
TL-19 8175994.8585 588735.5671 4093.45 4093.49 -0.038
TL-20 8175744.5403 589330.7620 4074.08 4073.73 0.352
TL-21 8175837.8310 589853.3061 3844.34 3844.40 -0.056
TL-22 8176067.6213 590534.7819 3764.45 3764.95 -0.497
TL-23 8176297.7554 590830.7168 3730.00 3730.05 -0.046
TL-24 8176382.7468 591395.6383 3686.27 3685.92 0.352
TL-25 8176856.6581 591688.6594 3675.42 3675.22 0.201
Avg: ∑pt/25 0.040
8
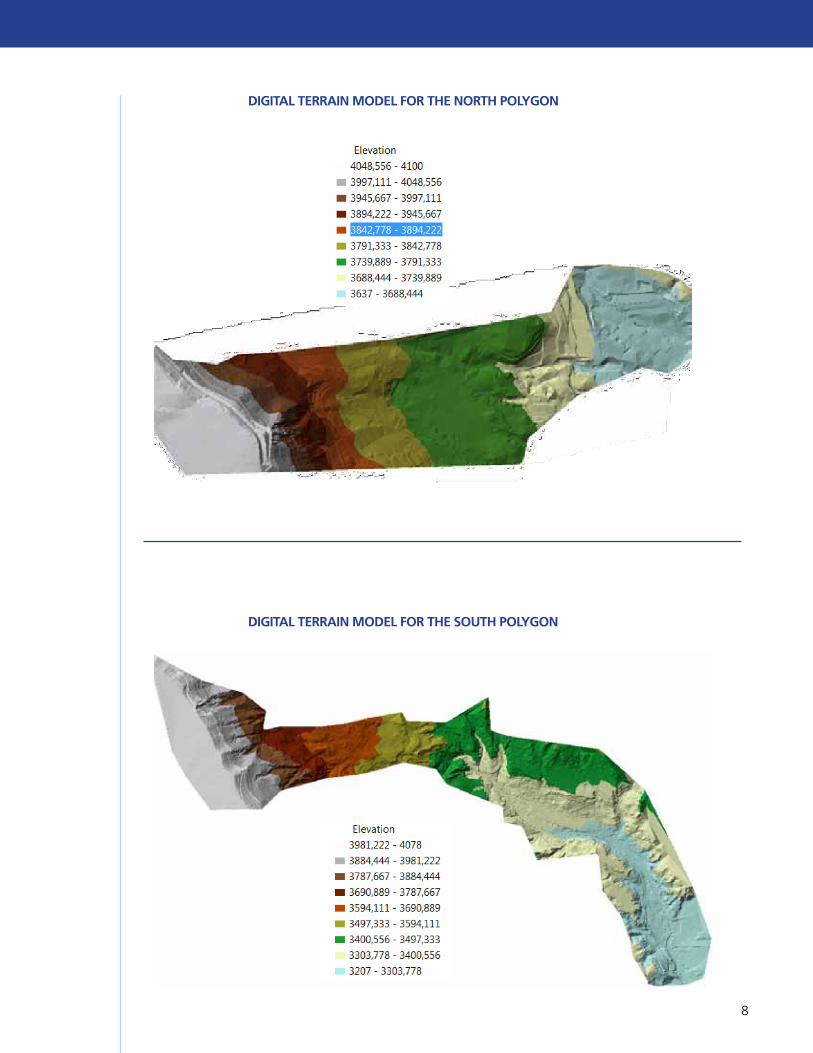
diGitaL terrain modeL For the South PoLyGon
diGitaL terrain modeL For the north PoLyGon
9
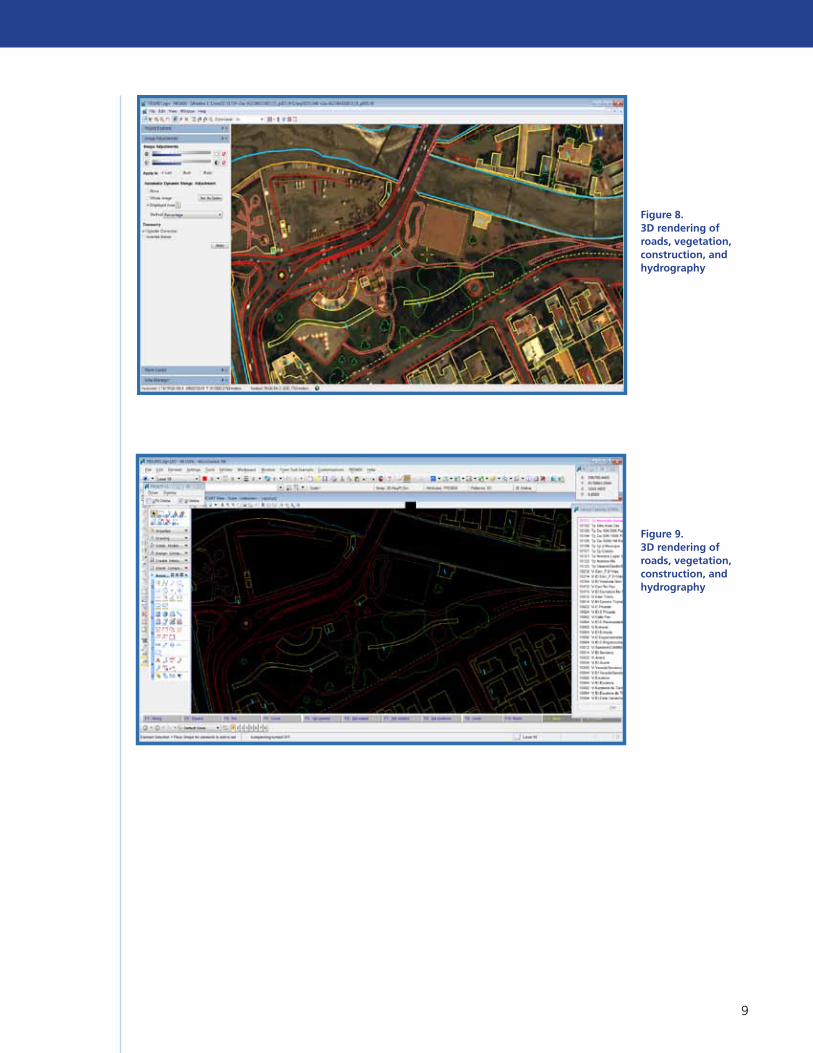
Figure 8. 3d rendering of roads, vegetation, construction, and hydrography
Figure 9. 3d rendering of roads, vegetation, construction, and hydrography