Embed Size (px)
Citation preview
Or ig ina l a r t i c le
Digital panoramic radiographs are useful for diagnosis ofosteoporosis in Korean postmenopausal women
Ok-Su Kim1,*, Min-Ho Shin2,*, In-Hwa Song1, Il-Gu Lim1, Suk-Ja Yoon3, Ok-Joon Kim4,Young-Hoon Lee5, Young-Joon Kim1 and Hyun-Ju Chung1
1Department of Periodontology, School of Dentistry, Dental Science Research Institute, Chonnam National University, Gwangju, Korea;2Department of Preventive Medicine, Chonnam National University, Medical School, Hak1dong, Donggu, Gwangju, Korea; 3Department of
Oral and Maxillofacial Radiology, School of Dentistry, Dental Science Research Institute, Chonnnam National University, Gwangju, Korea;4Department of Oral Pathology, School of Dentistry, Dental Science Research Institute, Chonnnam National University, Gwangju, Korea;5Department of Preventive Medicine and Institute of Wonkwang Medical Science, Wonkwang University College of Medicine, Iksan, Korea
Gerodontology 2014; doi: 10.1111/ger.12134
Digital panoramic radiographs are useful for diagnosis of osteoporosis in Korean post-menopausalwomen
Objective: The purpose of this study was to determine whether digital panoramic radiographs could be
used for the diagnosis of osteoporosis through evaluation of the radiographs based on the correlation
with bone mineral density (BMD).
Methods: One hundred and ninety-four post-menopausal women were selected from participants who
had participated in the Dong-gu study. Panoramic radiographic indices measured are mental index (MI),
mandibular cortical index (MCI) and simple visual estimation (SVE). BMD at the lumbar spine and
proximal femur was measured by dual-energy X-ray absorptiometry (DXA). The Pearson’s correlation
test was performed to analyse the correlation between MI and age and BMD at the lumbar spine, femo-
ral neck and total hip. Multiple linear regression analysis was performed to analyse the association of
MI, MCI and SVE with BMD after adjusting for age, height and weight. To determine the optimal cut-
off point of MI for the diagnosis of osteoporosis, the receiver operating characteristic analysis was per-
formed.
Results: The MI was positively correlated with BMDs: lumbar spine: r = 0.36, femoral neck: r = 0.59
and total hip: r = 0.58 (p < 0.001). As age increased, MI decreased (r = �0.46). BMD at the lumbar
spine and total hip were significantly lower in participants with reduction of mandibular width, thinning
and resorption of mandibular cortex by the MI, SVE and MCI, respectively. The optimal cut-off value of
MI for the diagnosis of spinal osteoporosis was 2.22 mm.
Conclusion: Thickness and morphological changes of mandibular inferior cortical bone are associated
with BMD, independent of age, height and weight. These results suggest that MI, MCI and SVE may be
useful indices for the diagnosis of osteoporosis in a Korean population.
Keywords: radiography, panoramic, bone density, osteoporosis, mandible.
Accepted 1 May 2014
Introduction
The increasing average lifespan of people in most
industrialised countries has led to increased preva-
lence of bone disorders and fractures in post-men-
opausal women1–3. Osteoporosis is a complex and
multifactorial chronic disease that can progress
silently for decades until characteristic fractures
result in life-threatening situations4. In general,
the risk of fractures in post-menopausal women
can be identified by osteoporosis prevention pro-
grammes. These programmes allow early detec-
tion of osteoporosis to maintain as much bone
mass and as good bone quality as possible to
reduce the risk of fractures5.
Osteoporosis is usually diagnosed by measure-
ment of bone mineral density (BMD). Dual-
energy X-ray absorptiometry (DXA) is a standard*These two authors contribute equally to this work.
© 2014 John Wiley & Sons A/S and The Gerodontology Association. Published by John Wiley & Sons Ltd 1
method for BMD evaluation and fracture risk
prediction6–10. However, DXA is not recom-
mended as a routine screening test for the gen-
eral population. Most guidelines limit the use of
DXA for post-menopausal women aged 65 years
or older and men aged 70 years or older, with
the exception of younger adults with known risk
factors6.
Although DXA is the most widely accepted
bone density measuring method, the cost is rela-
tively expensive with limitations for public
screening. Panoramic radiographs are routinely
taken in dental clinics for initial diagnosis and
treatment planning. Recently, several studies also
showed that panoramic X-ray examination is a
cost-effective method for identifying patients with
high risks of osteoporosis4–22. In general, intraoral
radiographs are taken more frequently than den-
tal panoramic radiographs. However, trabecular
bone shown in the intraoral film is easily remod-
elled by local inflammation, which makes it
inadequate for osteoporosis or skeletal triage
screening20. Horner et al.15 reported a valid corre-
lation between the mandibular cortex analysis of
panoramic radiographs and lumbar spine and hip
BMDs. Devlin et al.13 proposed panoramic radiog-
raphy examination as a method for identifying
osteoporosis as it is relatively inexpensive and
could be used on the elderly. In addition,
Taguchi suggested using panoramic radiographs
for dental triage screening for osteoporosis in
dental clinics20.
Until now, previous studies including OSTEO-
DENT projects were developed in the Japanese9,22
or Western population14–16,21, but the study for
panoramic radiographic indices and BMDs by
DXA in the Korean population has not been
reported. In this study of urban Korean post-men-
opausal women, the correlation between pano-
ramic radiographic indices and BMD score was
evaluated and investigated to determine whether
panoramic radiography would be helpful in the
diagnosis of osteoporosis.
Materials and methods
Study participants
The Dong-gu Study is an ongoing prospective
study designed to investigate the prevalence,
incidence and risk factors for chronic disease in
urban population23. A total of 9260 participants
aged 50 or older were enrolled from 2007 to
2010. Periodontal examination was carried out
for 5621 participants (2357 men; 3264 women)
among 7577 people who attended the study from
2008 to 2010. Of 3264 women aged 50 years or
older, 248 participants were excluded: no meno-
pausal (n = 115) and not taken panoramic radio-
graphs (n = 133). Panoramic radiographs from
2982 participants were used; of them, 200 partic-
ipants were randomly selected. Of 200 partici-
pants, participants whose panoramic radiograph
did not include the mandibular border com-
pletely or not clearly show the mental foramen
were excluded. Finally, data of 194 participants
were used. This study was approved by the Insti-
tutional Review Board of Chonnam National
University Hospital (IRB No: I-2008-05-056). All
participants provided written consent after
receiving a full and clear explanation of the
study in detail.
Panoramic radiographic indices
Digital panoramic radiographs (Planmeca ProOne,
Planmeca Oy, Helsinki, Finland) were taken at
the following exposure conditions 66 kV, 9 mA
and 18.0 s. For cortical thickness measurements,
the ‘Twice’ software (Osstem, Korea) was used.
Cortical width was measured by the length with
angle tool of the ‘Twice’ software.
In this study, three panoramic radiographic
indices, mental index (MI), mandibular cortical
index (MCI) and simple visual estimation (SVE),
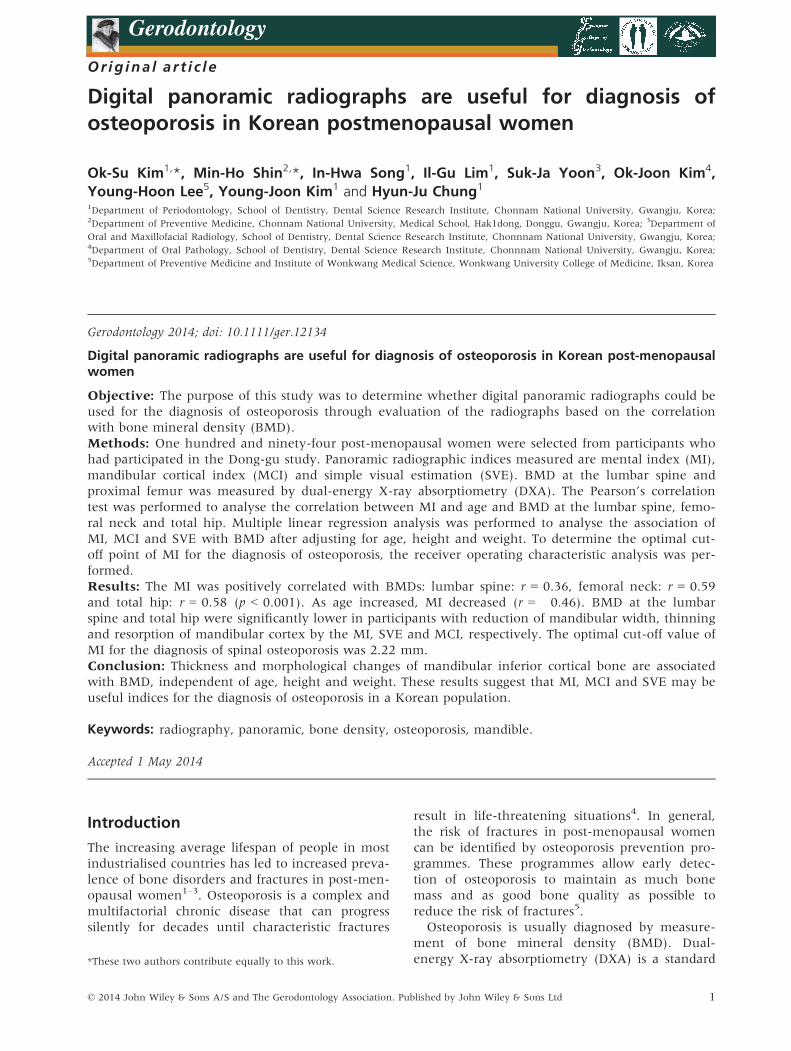
were measured. MI is a measurement of cortical
width at the mental foramen region. A line paral-
lel to the long axis of the mandible and tangential
to the inferior border of the mandible was drawn.
A line perpendicular to this tangent intersecting
the inferior border of the mental foramen was
constructed, along which mandibular cortical
width was measured (Fig. 1, Table 1)5,24. Pano-
ramic radiographs were measured by the ‘Twice’
software, and the values were rounded up to the
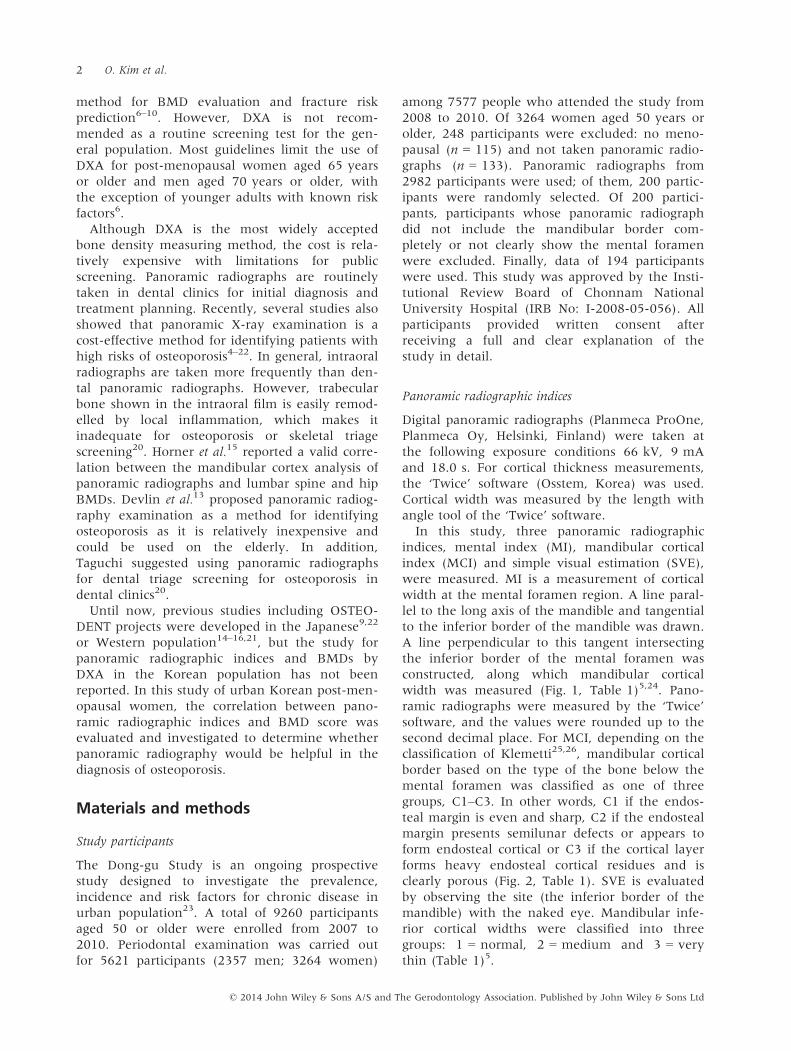
second decimal place. For MCI, depending on the
classification of Klemetti25,26, mandibular cortical
border based on the type of the bone below the
mental foramen was classified as one of three
groups, C1–C3. In other words, C1 if the endos-
teal margin is even and sharp, C2 if the endosteal
margin presents semilunar defects or appears to
form endosteal cortical or C3 if the cortical layer
forms heavy endosteal cortical residues and is
clearly porous (Fig. 2, Table 1). SVE is evaluated
by observing the site (the inferior border of the
mandible) with the naked eye. Mandibular infe-
rior cortical widths were classified into three
groups: 1 = normal, 2 = medium and 3 = very
thin (Table 1)5.
© 2014 John Wiley & Sons A/S and The Gerodontology Association. Published by John Wiley & Sons Ltd
2 O. Kim et al.
Intra- and interobserver agreement
To quantify intraobserver agreements, 30 pano-
ramic radiographs were randomly selected from
the sample and analysed twice by the main obser-
ver. There was a period of 2 weeks between read-
ings. Two observers also measured the same
radiographs to verify interobserver reliability.
Observers were not aware of the DXA results and
had no access to information about the partici-
pants, such as age. Each observer independently
measured MI, MCI and SVE on both sides. For
the qualitative indices, agreements were calcu-
lated as a Cohen’s kappa index. For a quantitative
index, agreements were calculated as ICC (intra-
class correlation coefficient).
Intraclass correlation coefficient values for in-
traobserver agreement were 0.83, 0.99 and 0.76
for MI, and the kappa values for intraobserver
agreement were 0.64, 0.92 and 0.56 for the MCI,
0.7, 0.95 and 0.59 for the SVE, respectively. ICC
value for interobserver agreement was 0.81, and
the kappa values for interobserver agreement
were 0.34 and 0.52 for the MCI and SVE, respec-
tively. Inter- and intra-agreements for MI were
very good but for MCI and SVE were moderate
level. As a result, only the measurements and
classifications of the main observer were used to
analyse parameters.
Measurement of bone mineral density
BMD of participants were measured using Lunar
Prodigy bone densitometer (GE, Madison, WI,
USA) at total hip, femoral neck and lumbar spine.
BMD of the lumbar spine represents the average
BMD of L1–L4. The device was calibrated daily
with a physical phantom. All BMD scans were
conducted by certified examiners using standar-
dised procedures, by following the protocols rec-
ommended by the manufacturer. Any scans with
metal or other attenuating materials in the region
of interest, as well as any scans of poor quality,
were excluded. T scores were calculated using
manufacturer’s normative data for the lumbar
spine.
Statistical analysis
Data are presented as mean � standard deviation
(SD) or number (%). Each measurement was
repeated twice on the left and the right side,
respectively, and the average value of the four
measurements was calculated.
Scatter plot and Pearson’s correlation analysis
were used to determine the relationship between
Figure 2 Classification of mandibular cortex index
(C1–C3)25 C1: even and sharp, C2: semilunar defects
and C3: clearly porous.
Figure 1 The measurement method of mental index.
Table 1 Panoramic radiographic indices (MI, MCI and SVE).
Index
1 2 3
Mental index MI Cortical width measurement – –Mandibular. cortical index MCI Even and sharp Semilunar defects Clearly porous
Simple visual estimation SVE Normal Intermediate Very thin
© 2014 John Wiley & Sons A/S and The Gerodontology Association. Published by John Wiley & Sons Ltd
Panoramic index and osteoporosis 3
MI and age and BMD at the lumbar spine, right
femoral neck and total hip. Multiple linear regres-
sion analysis was performed to analyse the associ-
ation between panoramic radiographic indices and
BMD at the lumbar spine, right femoral neck and
total hip. The receiver operating characteristic
(ROC) analysis was used to evaluate the ability of
the MI to classify lumbar spine osteoporosis,
defined as a lumbar spine BMD T score of �2.5 or
less, and area under curve (AUC) computed using
the method of Hanley and McNeil27. The optimal
MI cut-off value for the diagnosis of spinal osteo-
porosis was determined using Youden’s index. We
did not use data of femoral BMD for ROC analysis
because of low prevalence of osteoporosis in the
femoral neck and total hip and small sample size
of our study. All statistical analyses were
conducted with STATA 12 software (STATA
Corp, Texas, College Station, USA). The value of
p < 0.05 was considered significant.
Results
The demographic characteristics are summarised
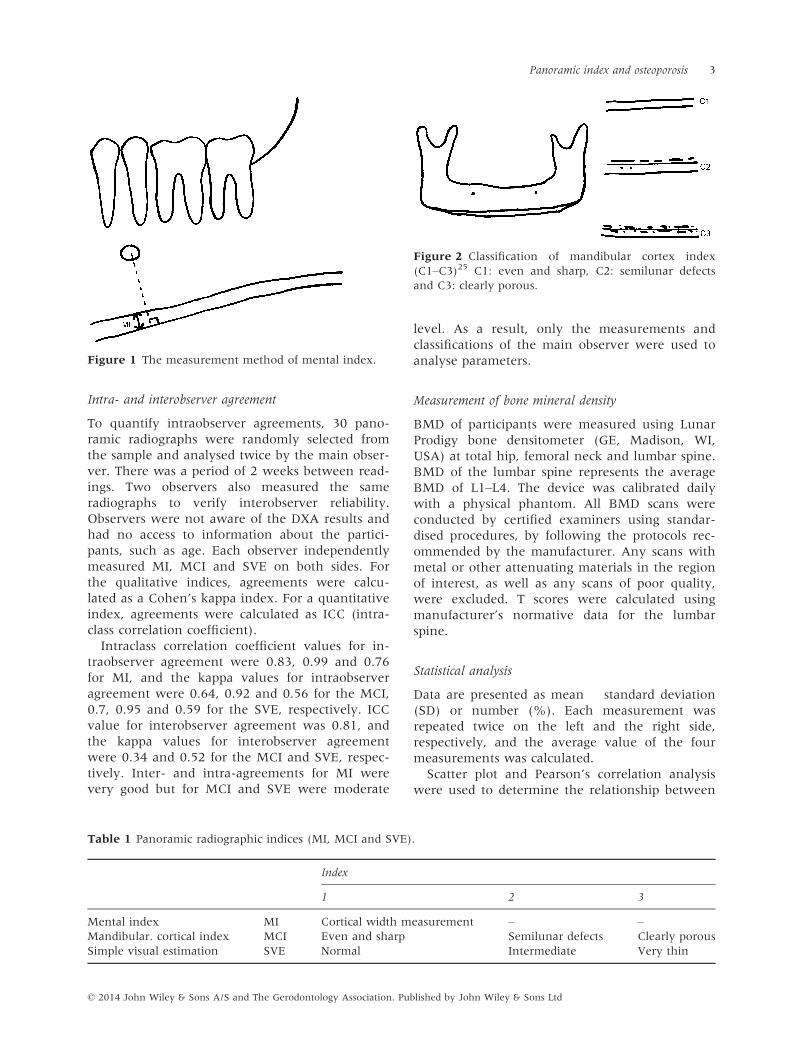
in Table 2.Scatter plot and Pearson’s correlation
analysis showed that the mental index was
positively correlated with BMDs: lumbar spine:
r = 0.36, femoral neck: r = 0.59 and total
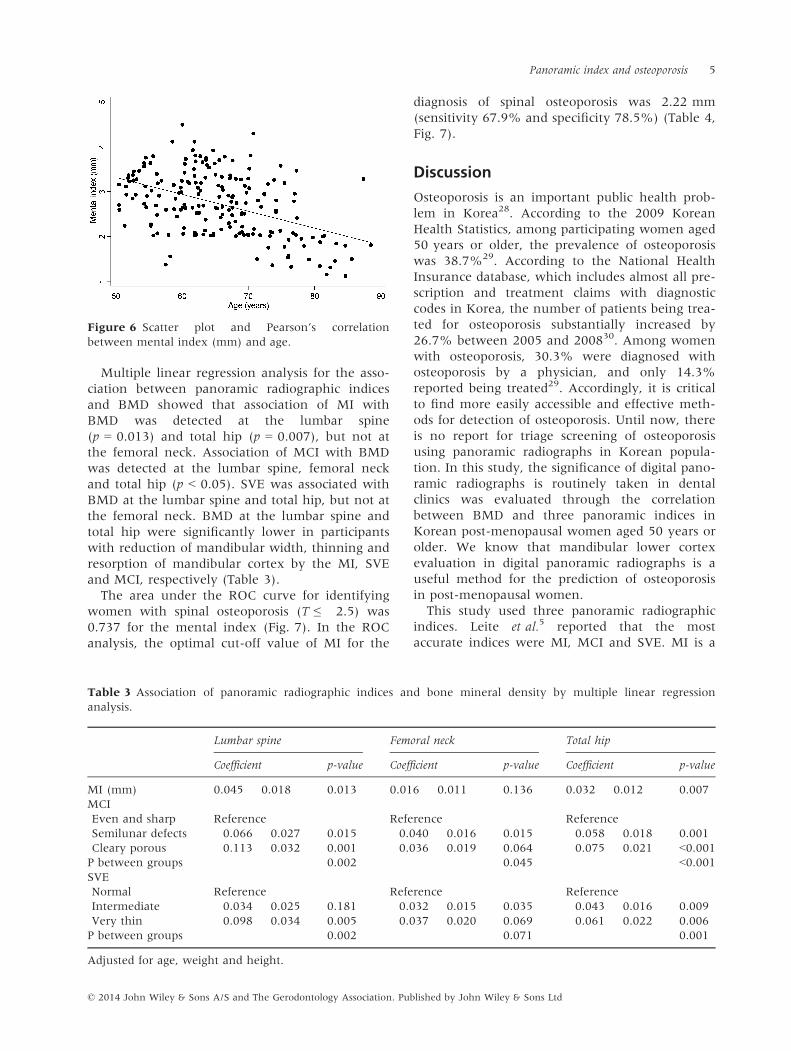
hip: r = 0.58 (Figs 3–5) (p < 0.001). Negative
correlations were observed in the analysis of cor-
relation between age and MI (r = �0.46,
p < 0.001, Fig. 6).
Table 2 Demographic characteristics of participants.
N = 194
Age, years 65.6 � 8.6
Weight, kg 57.3 � 8.4
Height, cm 152.1 � 6.2
Radiologic indices
MI 2.7 � 0.7
MCI
Even and sharp 46 (23.7)
Semilunar defects 89 (48.9)
Cleary porous 59 (30.4)
SVE
Normal 68 (35.0)
Intermediate 82 (42.3)
Very thin 44 (22.7)
Bone mineral density (g/cm2)a
Lumbar spine 0.973 � 0.171
Femoral neck 0.774 � 0.116
Total hip 0.848 � 0.132
Data are mean � SD or n (%).
MI, mental index; MCI, mandibular cortical index; and
SVE, simple visual estimation.aOf 194 participants, 186 had lumbar spine BMD and
193 had femoral neck and total hip BMD.
Figure 3 Scatter plot and Pearson’s correlation
between mental index (mm) and lumbar spine BMD.
Figure 4 Scatter plot and Pearson’s correlation
between mental index (mm) and femoral neck BMD.
Figure 5 Scatter plot and Pearson’s correlation
between mental index (mm) and total hip BMD.
© 2014 John Wiley & Sons A/S and The Gerodontology Association. Published by John Wiley & Sons Ltd
4 O. Kim et al.
Multiple linear regression analysis for the asso-
ciation between panoramic radiographic indices
and BMD showed that association of MI with
BMD was detected at the lumbar spine
(p = 0.013) and total hip (p = 0.007), but not at
the femoral neck. Association of MCI with BMD
was detected at the lumbar spine, femoral neck
and total hip (p < 0.05). SVE was associated with
BMD at the lumbar spine and total hip, but not at
the femoral neck. BMD at the lumbar spine and
total hip were significantly lower in participants
with reduction of mandibular width, thinning and
resorption of mandibular cortex by the MI, SVE
and MCI, respectively (Table 3).
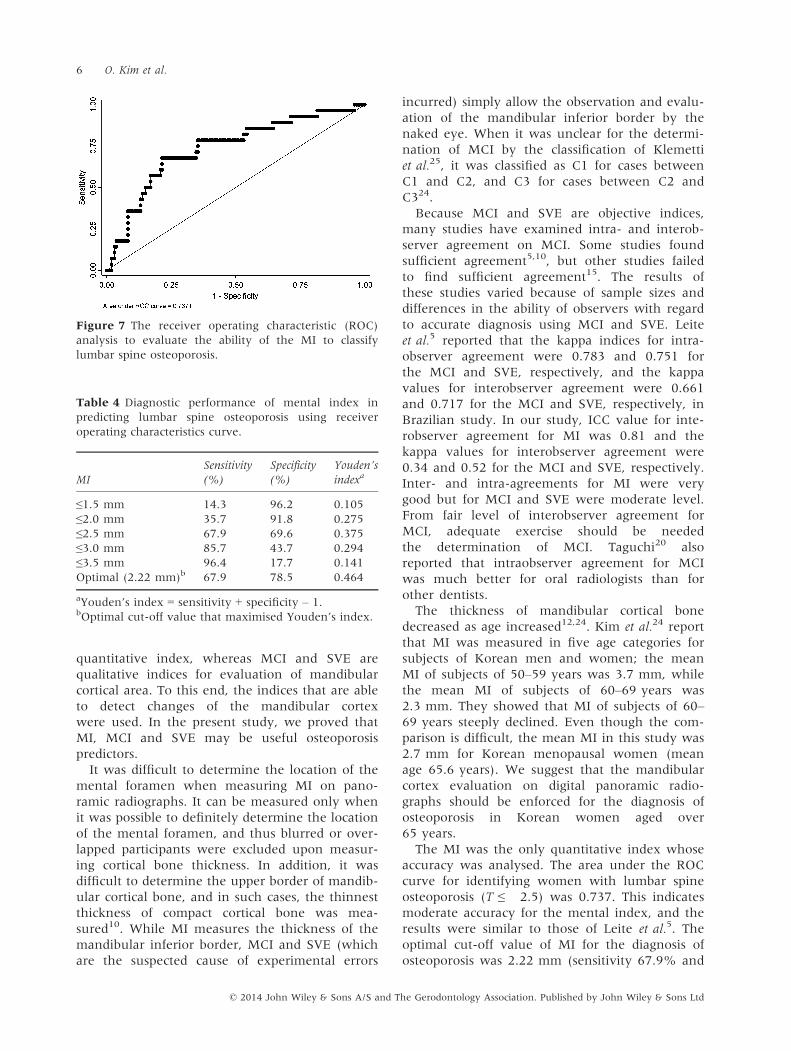
The area under the ROC curve for identifying
women with spinal osteoporosis (T ≤ �2.5) was
0.737 for the mental index (Fig. 7). In the ROC
analysis, the optimal cut-off value of MI for the
diagnosis of spinal osteoporosis was 2.22 mm
(sensitivity 67.9% and specificity 78.5%) (Table 4,
Fig. 7).
Discussion
Osteoporosis is an important public health prob-
lem in Korea28. According to the 2009 Korean
Health Statistics, among participating women aged
50 years or older, the prevalence of osteoporosis
was 38.7%29. According to the National Health
Insurance database, which includes almost all pre-
scription and treatment claims with diagnostic
codes in Korea, the number of patients being trea-
ted for osteoporosis substantially increased by
26.7% between 2005 and 200830. Among women
with osteoporosis, 30.3% were diagnosed with
osteoporosis by a physician, and only 14.3%
reported being treated29. Accordingly, it is critical
to find more easily accessible and effective meth-
ods for detection of osteoporosis. Until now, there
is no report for triage screening of osteoporosis
using panoramic radiographs in Korean popula-
tion. In this study, the significance of digital pano-
ramic radiographs is routinely taken in dental
clinics was evaluated through the correlation
between BMD and three panoramic indices in
Korean post-menopausal women aged 50 years or
older. We know that mandibular lower cortex
evaluation in digital panoramic radiographs is a
useful method for the prediction of osteoporosis
in post-menopausal women.
This study used three panoramic radiographic
indices. Leite et al.5 reported that the most
accurate indices were MI, MCI and SVE. MI is a
Figure 6 Scatter plot and Pearson’s correlation
between mental index (mm) and age.
Table 3 Association of panoramic radiographic indices and bone mineral density by multiple linear regression
analysis.
Lumbar spine Femoral neck Total hip
Coefficient p-value Coefficient p-value Coefficient p-value
MI (mm) 0.045 � 0.018 0.013 0.016 � 0.011 0.136 0.032 � 0.012 0.007
MCI
Even and sharp Reference Reference Reference
Semilunar defects �0.066 � 0.027 0.015 �0.040 � 0.016 0.015 �0.058 � 0.018 0.001
Cleary porous �0.113 � 0.032 0.001 �0.036 � 0.019 0.064 �0.075 � 0.021 <0.001P between groups 0.002 0.045 <0.001SVE
Normal Reference Reference Reference
Intermediate �0.034 � 0.025 0.181 �0.032 � 0.015 0.035 �0.043 � 0.016 0.009
Very thin �0.098 � 0.034 0.005 �0.037 � 0.020 0.069 �0.061 � 0.022 0.006
P between groups 0.002 0.071 0.001
Adjusted for age, weight and height.
© 2014 John Wiley & Sons A/S and The Gerodontology Association. Published by John Wiley & Sons Ltd
Panoramic index and osteoporosis 5
quantitative index, whereas MCI and SVE are
qualitative indices for evaluation of mandibular
cortical area. To this end, the indices that are able
to detect changes of the mandibular cortex
were used. In the present study, we proved that
MI, MCI and SVE may be useful osteoporosis
predictors.
It was difficult to determine the location of the
mental foramen when measuring MI on pano-
ramic radiographs. It can be measured only when
it was possible to definitely determine the location
of the mental foramen, and thus blurred or over-
lapped participants were excluded upon measur-
ing cortical bone thickness. In addition, it was
difficult to determine the upper border of mandib-
ular cortical bone, and in such cases, the thinnest
thickness of compact cortical bone was mea-
sured10. While MI measures the thickness of the
mandibular inferior border, MCI and SVE (which
are the suspected cause of experimental errors
incurred) simply allow the observation and evalu-
ation of the mandibular inferior border by the
naked eye. When it was unclear for the determi-
nation of MCI by the classification of Klemetti
et al.25, it was classified as C1 for cases between
C1 and C2, and C3 for cases between C2 and
C324.
Because MCI and SVE are objective indices,
many studies have examined intra- and interob-
server agreement on MCI. Some studies found
sufficient agreement5,10, but other studies failed
to find sufficient agreement15. The results of
these studies varied because of sample sizes and
differences in the ability of observers with regard
to accurate diagnosis using MCI and SVE. Leite
et al.5 reported that the kappa indices for intra-
observer agreement were 0.783 and 0.751 for
the MCI and SVE, respectively, and the kappa
values for interobserver agreement were 0.661
and 0.717 for the MCI and SVE, respectively, in
Brazilian study. In our study, ICC value for inte-
robserver agreement for MI was 0.81 and the
kappa values for interobserver agreement were
0.34 and 0.52 for the MCI and SVE, respectively.
Inter- and intra-agreements for MI were very
good but for MCI and SVE were moderate level.
From fair level of interobserver agreement for
MCI, adequate exercise should be needed
the determination of MCI. Taguchi20 also
reported that intraobserver agreement for MCI
was much better for oral radiologists than for
other dentists.
The thickness of mandibular cortical bone
decreased as age increased12,24. Kim et al.24 report
that MI was measured in five age categories for
subjects of Korean men and women; the mean
MI of subjects of 50–59 years was 3.7 mm, while
the mean MI of subjects of 60–69 years was
2.3 mm. They showed that MI of subjects of 60–69 years steeply declined. Even though the com-
parison is difficult, the mean MI in this study was
2.7 mm for Korean menopausal women (mean
age 65.6 years). We suggest that the mandibular
cortex evaluation on digital panoramic radio-
graphs should be enforced for the diagnosis of
osteoporosis in Korean women aged over
65 years.
The MI was the only quantitative index whose
accuracy was analysed. The area under the ROC
curve for identifying women with lumbar spine
osteoporosis (T ≤ �2.5) was 0.737. This indicates
moderate accuracy for the mental index, and the
results were similar to those of Leite et al.5. The
optimal cut-off value of MI for the diagnosis of
osteoporosis was 2.22 mm (sensitivity 67.9% and
Figure 7 The receiver operating characteristic (ROC)
analysis to evaluate the ability of the MI to classify
lumbar spine osteoporosis.
Table 4 Diagnostic performance of mental index in
predicting lumbar spine osteoporosis using receiver
operating characteristics curve.
MI
Sensitivity
(%)
Specificity
(%)
Youden’s
indexa
≤1.5 mm 14.3 96.2 0.105
≤2.0 mm 35.7 91.8 0.275
≤2.5 mm 67.9 69.6 0.375
≤3.0 mm 85.7 43.7 0.294
≤3.5 mm 96.4 17.7 0.141
Optimal (2.22 mm)b 67.9 78.5 0.464
aYouden’s index = sensitivity + specificity – 1.bOptimal cut-off value that maximised Youden’s index.
© 2014 John Wiley & Sons A/S and The Gerodontology Association. Published by John Wiley & Sons Ltd
6 O. Kim et al.
specificity 78.5%). From our results, Korean post-
menopausal women with mandibular cortical
thickness <2.5 mm should be referred for osteo-
porosis evaluation. These results for the diagnosis
of osteoporosis were lower than those found by
other authors. Compared with the osteoporosis
group, the group with MI of 3.15 mm or less and
the group with MI of 3 mm or less had the high-
est value of specificity and sensitivity in the study
by Leite et al.5 and by Ledgerton et al.10, respec-
tively. Taguchi et al.22 and Devlin31,32 suggested
that a follow-up evaluation is needed for the diag-
nosis of osteoporosis when the thickness of the
mandibular cortex is equal to or less than 2.8
(Taguchi22), following the criteria of T ≤ �1.0 or
MI is <3 mm (Devlin31,32). It is surmised that the
reasons for lower cut-off value in this study than
in other studies would be the use of digital pano-
ramic radiographs obtaining a good quality image,
the difference of statistical analysis for determin-
ing cut-off value, the difference of radiographic
magnifying ratio and ethnic/racial differences.
Nam et al.33 reported substantial race/ethnic dif-
ferences in BMD even within African or Asian
origin and illustrated the important role of body
size and oestrogen use to the geographic and
racial/ethnic variation in BMD in a cross-sectional
study, which compared BMD in older men across
seven race/ethnic groups in four countries. Fur-
ther, body composition, lifestyle and socio-eco-
nomic status would contribute differently to
BMD. In a Brazilian menopausal women study,
with a mean age of 63.5 � 4.7 years, the mean
values of MI were 3.32 � 1.02 mm5. In our study
for Korean menopausal women, with a mean age
of 65.6 � 8.6, the mean values of MI were
2.7 � 0.7 mm. Even if both groups had a similar
mean age, mandibular cortical width showed
racial differences. In addition, various definitions
of osteoporosis among the studies can lead to
some differences in the results. In this study, we
used the lumbar spine BMD in determining the
cut-off value of MI for the diagnosis of osteoporo-
sis. However, the OSTEODENT study by Horner
et al.21 used the femoral neck BMD for the hip
fracture risk assessment.
Our study has several limitations. First, our
study was cross-sectional in design, thus we could
not determine the temporal relationship. Longitu-
dinal studies may help clarify the mandibular cor-
tical resorption process due to osteoporosis over
time. Secondly, this study presented that pano-
ramic measurements may be useful in predicting
osteoporosis in post-menopausal women, but did
not include elderly men. Further studies with
above considerations are needed to know the
mechanism of resorption process and critical
index for diagnosing osteoporosis.
Clinicians should be aware of the risk of bone
density reduction when the thickness and mor-
phological changes of cortical bone of the man-
dibular lower border are detected on panoramic
radiographs. In such cases, more detailed investi-
gations to identify osteoporosis should be recom-
mended to the patients.
In conclusion, thickness and morphological
changes of mandibular inferior cortical bone on
digital panoramic radiographs are associated with
BMD in Korean post-menopausal women aged
50 years or older participants. In addition, the
thickness of the inferior mandibular cortex in
mental region is influenced by ageing. Finally,
MI, MCI and SVE are useful indices for the diag-
nosis of osteoporosis.
References
1. Assessment of fracture risk and its
application to screening for post-
menopausal osteoporosis. Report of
a WHO Study Group. World Health
Organ Tech Rep Ser 1994; 843: 121–9.
2. White SC, Pharoah MJ. Oral Radi-
ology: Principles and Interpretation, 4th
edn. St. Louis: The C.V. Mosby Co.,
2000; 59: 79–84.3. Riggs BL, Melton LJ. Evidence for
two distinct syndromes of involu-
tional osteoporosis. Am J Med 1983;
75: 899–901.4. Ardakani FE, Mirmohamadi SJ.
Osteoporosis and oral bone resorption:
a review. J Maxillofac Oral Surg 2009;
8: 121–6.5. Leite AF, Guia CM, Nilce SM.
Correlations between seven pano-
ramic radiomorphometric indices and
bone mineral density in postmeno-
pausal women. Oral Surg Oral Med
Oral Pathol Oral Radiol Endod 2010;
109: 449–56.6. Lim LS, Hoeksema LJ, Sherin
K. ACPM Prevention Practice Com-
mittee Screening for osteoporosis in
the adult US population: ACPM
position statement on preventive
practice. Am J Prev Med 2009; 36:
366–75.7. Bras J, Ooij CP, Wilmink JM, Ku-
sen GJ. Radiographic interpretation
of the mandibular angular cortex: a
diagnostic tool in metabolic bone
loss. Part II. Renal osteodystrophy.
Oral Surg Oral Med Oral Pathol 1982;
53: 647–50.8. Riggs BL, Melton LJ 3rd. Involu-
tional osteoporosis. N England J Med
1986; 26: 1676–86.9. Taguchi A, Tanimoto K, Suei Y,
Wada T. Tooth loss and mandibular
osteopenia. Oral Surg Oral Med Oral
Pathol Oral Radiol Endod 1995; 79:
127–32.10. Ledgerton D, Horner K, Devlin
H, Worthington H. Radiomorpho-
metric indices of the mandible in a
British female population. Dentomax-
illofac Radiol 1999; 28: 173–81.
© 2014 John Wiley & Sons A/S and The Gerodontology Association. Published by John Wiley & Sons Ltd
Panoramic index and osteoporosis 7
11. White SC. Related Oral radio-
graphic predictors of osteoporosis.
Dentomaxillofac Radiol 2002; 31: 84–92.
12. Dutra V, Yang J, Devlin H, Susin
C. Radiomorphometric indices and
their relation to gender, age, and
dental status. Oral Surg Oral Med Oral
Pathol Oral Radiol Endod 2005; 99:
479–84.13. Devlin H, Karayianni K, Mitsea
A, Jacobs R, Lindh C, Van der
Stelt P. Diagnosing osteoporosis by
using dental panoramic radiographs:
the OSTEODENT project. Oral Surg
Oral Med Oral Pathol Oral Radiol En-
dod 2007; 104: 821–8.14. Karayianni K, Horner K, Mitsea
A, Mastoris M. Accuracy in osteo-
porosis diagnosis of a combination of
mandibular cortical width measure-
ment on dental panoramic radio-
graphs and a clinical risk index
(OSIRIS): the OSTEODENT project.
Bone 2007; 40: 223–9.15. Horner K, Karayianni K, Mitsea
A, Berkas L, Mastoris M, Jacobs
R et al. The mandibular cortex on
radiographs as a tool for osteoporosis
risk assessment: the OSTEODENT
project. J Clin Densitom 2007; 10:
138–46.16. Devlin H, Allen P, Graham J,
Jacobs R, Nicopoulou-Karayianni
K, Lindh H et al. The role of the
dental surgeon in detecting osteopo-
rosis: the OSTEODENT study. Br Dent
J 2008; 204: 560–1.17. Cakur B, Sahin A, Dagistan S, Al-
tun O, Caglayan F, Harorli A.
Dental panoramic radiography in the
diagnosis of osteoporosis. J Int Med
Res 2008; 36: 792–9.18. Nicopoulou-Karayianni K, Tzout-
zoukos P, Mitsea A, Karayiannis
A, Tsiklakis K, Jacobs R et al.
Tooth loss and osteoporosis: the OS-
TEODENT Study. J Clin Periodontol
2009; 36: 190–7.19. Dagistan S, Bilge OM. Comparison
of antegonial index, mental index,
panoramic mandibular index and
mandibular cortical index values in
the panoramic radiographs of nor-
mal males and male patients with
osteoporosis. Dentomaxillofac Radiol
2010; 39: 290–4.20. Taguchi A. Triage screening for
osteoporosis in dental clinics using
panoramic radiographs. Oral Dis
2010; 16: 316–27.21. Horner K, Allen P, Graham J,
Jacobs R, Boonen S, Pavitt S
et al. The relationship between the
OSTEODENT index and hip fracture
risk assessment using FRAX. Oral
Surg Oral Med Oral Pathol Oral Radiol
Endod 2010; 110: 243–9.22. Taguchi A, Ohtsuka M, Tsuda M,
Nakamoto T, Kodama I, Inagaki
K et al. Risk of vertebral osteoporo-
sis in post-menopausal women with
alterations of the mandible. Dento-
maxillofac Radiol 2007; 36: 143–8.23. Shin MH, Kweon SS, Choi JS,
Rhee JA, Nam HS, Jeong SK
et al. Average volume of alcohol
consumed, drinking patterns, and
metabolic syndrome in older Korean
adults. J Epidemiol 2013; 23: 122–31.24. Kim YS, Kim KA, Koh KJ. The
relationship between age and the
mandibular cortical bone thickness
by using panoramic radiograph. Kor-
ean J Oral Maxillofac Radiol 2010; 40:
83–7.25. Klemetti E, Kolmakov S, Kroger
H. Pantomography in assessment of
the osteoporosis risk group. Scand J
Dent Res 1994; 102: 68–72.26. Klemetti E, Kolmakow S. Mor-
phology of the mandibular cortex on
panoramic radiographs as an indica-
tor of bone quality. Dentomaxillofac
Radiol 1997; 26: 22–5.27. Hanley JA, McNeil BJ. A method
of comparing the areas under recei-
ver operating characteristic curves
derived from the same cases. Radiol-
ogy 1983; 148: 839–43.28. Oh SM, Nam BH, Rhee Y, Moon
SH, Kim DY, Kang DR et al.
Development and validation of oste-
oporosis risk-assessment model for
Korean postmenopausal women. J
Bone Miner Metab 2013; 31: 423–32.doi: 10.1007/s00774-013-0426-0. Epub
2013 Feb 19
29. Ministry of Health and Social
Welfare and Korea Centers for
Disease Control & Prevention. Korea
Health Statistics 2009: Korean
National Health and Nutrition Exam-
ination Survey (KNHANES IV-3).
Republic of Korea, Osong, 2010.
Available at: https://knhanes.cdc.go.
kr/knhanes/index.do (last accessed
15 April 2014).
30. Choi HJ, Shin CS, Ha YC, Jang
SM, Jang SH, Park CM et al. Bur-
den of osteoporosis in adults in
Korea: a national health insurance
database study. J Bone Miner Metab
2012; 30: 54–8.31. Devlin H, Horner K. Mandibular
radiomorphometric indices in the
diagnosis of reduced skeletal bone
mineral density. Osteopros Int 2002;
13: 373–8.32. Devlin H, Allen PD, Graham J,
Jacobs R, Karayianni K, Lindh C
et al. Automated osteoporosis risk
assessment by dentists: a new path-
way to diagnosis. Bone 2007; 40:
835–42.33. Nam HS, Kweon SS, Choi JS,
Zmuda JM, Leung PC, Lui LY
et al. Race/ethnic differences in bone
mineral densities in older women. J
Bone Miner Metab 2013; 31: 190–8.
Correspondence to:
Ok-Su Kim, Department of
Periodontology, School of
Dentistry, Dental Science
Research Institute, Chonnam
National University, Gwangju,
South Korea.
Tel.: +82 62 530 5576
Fax: +82 62 530 5649
E-mail: [email protected].
kr
and
Min-Ho Shin, Department of
Preventive Medicine, Chonnam
National University, Medical
School, 5, Hak1dong, Donggu,
Gwangju, South Korea.
Tel.: +82 62 220 4166
Fax: +82 62 233 0305
E-mail: [email protected]
© 2014 John Wiley & Sons A/S and The Gerodontology Association. Published by John Wiley & Sons Ltd
8 O. Kim et al.

![Diagnosis of interproximal caries lesions with deep ......Bitewing radiography has higher sensitivity than the vis-ual-tactile method and panoramic radiographs [3 –5]. Addi-tionally,](https://img.pdfslide.us/doc/110x75/6133655cdfd10f4dd73b0f89/diagnosis-of-interproximal-caries-lesions-with-deep-bitewing-radiography.jpg)